review of meteorology in the newcastle inner city & port ... · review of meteorology in the...
TRANSCRIPT
A PEL Company
REPORT
REVIEW OF METEOROLOGY IN THE NEWCASTLE
INNER CITY & PORT NEIGHBOURHOOD
Office of Environment and Heritage
29 July 2011

DISCLAIMER
This report was prepared by PAEHolmes in good faith exercising all due care and attention, but no representation or warranty, express or implied, is made as to the relevance, accuracy, completeness or fitness for purpose of this document in respect of any particular user’s circumstances. Users of this document should satisfy themselves concerning its application to, and where necessary seek expert advice in respect of, their situation. The views expressed within are not necessarily the views of the Office of Environment and Heritage (OEH) and may not represent OEH policy.
© Copyright State of NSW and the Office of Environment and Heritage
5954_Review_of_Meteorology - Newcastle_ Inner_City_&_Port_FINAL.docx iii
Review of Meteorology In The Newcastle Inner City & Port Neighbourhood
Office of Environment and Heritage | PAEHolmes Job 5954
ES1 EXECUTIVE SUMMARY
OVERVIEW
A detailed review of the local meteorology for the Newcastle Inner City and Port Neighbourhood
was completed. On the basis of the review, recommendations were made for the preferred
locations of ambient air quality monitoring sites to monitor the cumulative impact of local industry
on current and future populations in the neighbourhoods of Fern Bay, Stockton, Carrington,
Islington, Wickham, Newcastle West, Mayfield and Warabrook.
EXISTING METEOROLOGY MONITORING
There are a number of existing meteorological monitoring stations located in the study area and
monitoring data obtained from these sites has been reviewed and analysed for a representative
period of 5 years from 2006 to 2010. Analysis of these data shows dominant onshore winds
prevailing from the east-northeast through to east-southeast and offshore winds from the west
and west-northwest. Overall wind patterns show similarities across all sites with clear seasonal
changes evident in summer and winter. There are common diurnal variations between offshore
breezes at night and the seabreezes that frequently occur during the afternoons in the warmer
months.
DISPERSION METEOROLOGY
Further analysis of the local meteorology was completed using a combination of the TAPM and
CALMET models. A 5-year representative meteorological dataset was compiled and snapshots of
the two dimensional meteorology were used to describe the prevailing wind conditions (and other
parameters such as mixing height, temperature and atmospheric stability) across the study area.
The locations chosen for analysis were selected to better understand how conditions may vary
across the study area, in particular at different distances from the coast and at the areas of
interest to this study.
The modelling shows prevailing winds have very similar patterns across all locations (onshore
winds prevailing from the east-northeast through to east-southeast and offshore winds from the
west and west-northwest). This pattern is reflected at all distances from the coast.
There is also a similar pattern across all the modelled years. Dispersion is favourable closer to
the coastal areas as a result of higher wind speeds, increased mechanical mixing and a lower
frequency of stable conditions.
POLLUTION SOURCES AND MODELLING PREDICTIONS
An important factor to be considered in the design of a monitoring network is the location of the
major emission sources. The study area is an urban airshed affected by emissions from large
industrial sources and commercial premises as well as the more conventional sources, such as
roadways and emissions from domestic and smaller scale commercial sources.
Emission input files for commercial and industrial point sources in the study area were provided
by OEH. In addition to these point sources, significant local fugitive emission sources (coal
terminals at Kooragang Island (global) and Carrington and the Newcastle Grain terminal) were
also included in the modelling.
5954_Review_of_Meteorology - Newcastle_ Inner_City_&_Port_FINAL.docx iv
Review of Meteorology In The Newcastle Inner City & Port Neighbourhood
Office of Environment and Heritage | PAEHolmes Job 5954
Pollutant dispersion modelling results for maximum 24-hour PM10 concentrations show similar
patterns for 2007 and 2008 and the magnitude of impact for the modelled years of 2009 and
2010 are also very similar. Maximum 24-hour PM10 concentrations are highest around the port
area and the residential areas of Warabrook, Mayfield, Carrington and Fern Bay.
The predicted annual average ground level concentrations (glcs) show similar patterns for all
years with contours aligned around dominant emission sources at the port. The highest annual
average predictions are across Warabrook, Mayfield, Carrington and Fern Bay.
RECOMMENDATIONS
There appears to the sufficient industry meteorological monitoring locations to adequately
describe the prevailing wind conditions for the Newcastle area. Additional stations would not add
significant value to the data currently being gathered.
The spatial distribution of predicted PM10 impacts clearly indicates that greater impacts are
anticipated to occur within the region of the port and the highest predicted PM10 impacts
associated with local industry are anticipated to occur within the suburbs of Warabrook, Mayfield,
Carrington and Fern Bay. It is therefore suggested that additional PM10 monitoring would be
most valuable within the above suburbs, with priority given to those that represent higher
population densities.
5954_Review_of_Meteorology - Newcastle_ Inner_City_&_Port_FINAL.docx v
Review of Meteorology In The Newcastle Inner City & Port Neighbourhood
Office of Environment and Heritage | PAEHolmes Job 5954
TABLE OF CONTENTS
1 INTRODUCTION 8 1.1 Project Background and Need for the Study 8 1.2 Study Objectives 8 1.3 Scope of Work 9 1.4 Pollutants Considered 9
2 LOCAL SETTING AND STUDY BOUNDARY 10 2.1 Study Bounds 10 2.2 Local and Regional Topography 10
3 OVERVIEW OF EXISTING METEOROLOGICAL MONITORING LOCATIONS 14
4 CLIMATE AND DISPERSION METEOROLOGY 17 4.1 Regional Weather Patterns 17 4.2 Local Climate 19 4.3 Analysis of Prevailing Winds at Meteorological Monitoring Sites 22
4.3.1 Newcastle (OEH site) 23 4.3.2 Kooragang Island (PWCS, NCIG, Orica sites) 23 4.3.3 Mayfield (CommSteel) 24 4.3.4 Beresfield (OEH) 24 4.3.5 Wallsend (OEH) 24 4.3.6 Williamstown RAAF (BoM) 24
4.4 Summary 24
5 AMBIENT AIR QUALITY 34
6 METEOROLOGICAL MODELLING OVERVIEW 39 6.1 TAPM 39 6.2 CALMET 39
7 ANALYSIS OF DISPERSION METEOROLOGY 41 7.1 CALMET Predicted Prevailing Wind Conditions 41 7.2 Atmospheric Stability 52 7.3 Mixing Height 52
8 EMISSIONS SOURCES AND INVENTORY 57 8.1 Introduction 57 8.2 Emissions Sources Considered 57
8.2.1 Emission Sources Not Included 58
9 ANALYSIS OF POLLUTANT DISPERSION 60 9.1 CALPUFF 60 9.2 Analysis of Pollutant Dispersion Patterns 60
9.2.1 Maximum 24-hour impacts 61 9.2.2 98.6th Percentile Predictions 67 9.2.3 Annual Average Predictions 73
9.3 Comparison against Monitoring Data 77
10 RECOMMENDATIONS FOR MONITORING LOCATIONS 79 10.1 Introduction 79 10.2 Recommendations 80
11 CONCLUSION 81
12 REFERENCES 83
APPENDIX A A-1
APPENDIX B B-1
APPENDIX C C-25
APPENDIX D D-1
5954_Review_of_Meteorology - Newcastle_ Inner_City_&_Port_FINAL.docx vi
Review of Meteorology In The Newcastle Inner City & Port Neighbourhood
Office of Environment and Heritage | PAEHolmes Job 5954
LIST OF TABLES
Table 1.1: Air quality standards / goals for particulate matter concentrations .......................... 9
Table 2.1: Australian Bureau of Statistics – Census Data ................................................... 12
Table 3.1: Overview of Existing Meteorological Monitoring Data .......................................... 16
Table 4.1: Climate Statistics ............................................................................................ 20
Table 4.2: Data availability for meteorological monitoring data ........................................... 23
Table 5.1: Number of Days over the 24-hour PM10 Criteria ................................................. 35
Table 5.2: 24-Hour Average PM10 Concentration (g/m3) Monitoring Results ........................ 38
LIST OF FIGURES
Figure 2.1: Local Setting and Study Boundary .................................................................. 11
Figure 2.2: Three-Dimensional Representation of Local Topography .................................... 13
Figure 3.1: Existing Meteorological Monitoring Locations .................................................... 15
Figure 4.1: Windrose for Newcastle - 2009 ........................................................................ 26
Figure 4.2: Wind Rose for PWCS KCT - 2010 .................................................................... 27
Figure 4.3: Wind Rose for NCIG - 2010 ............................................................................ 28
Figure 4.4: Windrose for Orica - 2008............................................................................... 29
Figure 4.5: Windrose For CommSteel - 2008 .................................................................... 30
Figure 4.6: Windrose for Beresfield - 2006 ........................................................................ 31
Figure 4.7: Windrose for Wallsend - 2006 ......................................................................... 32
Figure 4.8: Windrose for Williamtown - 2008 ..................................................................... 33
Figure 5.1: OEH PM10 Monitoring, 2006 to 2011 ................................................................. 36
Figure 5.3: PM10 Monitoring ............................................................................................. 37
Figure 6.1: Outer Modelling Domain and Surface Station and Upper Air (TAPM) Sites ............. 40
Figure 7.1: CALMET Generated Windroses for the region .................................................... 43
Figure 7.2: CALMET Generated Windroses for the region .................................................... 44
Figure 7.3: CALMET Generated Windroses for the region ..................................................... 45
Figure 7.4: Annual windrose variation across study area .................................................... 46
Figure 7.5: CALMET generated morning and afternoon windroses for Newcastle 2008............ 48
Figure 7.6: Wind Speed Frequency Chart – CALMET 2008 .................................................. 49
Figure 7.7: Wind Speed by hour of the day – CALMET 2008 ............................................... 50
Figure 7.8: Temperature by hour of the day – CALMET 2008 .............................................. 51
Figure 7.9: Stability Class Percentage Occurrence – CALMET 2008 ...................................... 53
Figure 7.10: Mixing Height by Time of Day – CALMET 2008 ................................................ 54
Figure 7.11: Stability Class by Time of Day – CALMET 2008 ............................................... 55
Figure 7.12: Stability Class by Time of Day – CALMET 2008 ............................................... 56
Figure 8.1: Source locations included in modelling ............................................................ 59
Figure 9.1: Predicted Maximum 24-hour PM10 Concentration -2006 ..................................... 62
Figure 9.2: Predicted Maximum 24-hour PM10 Concentration -2007 ..................................... 63
Figure 9.3: Predicted Maximum 24-hour PM10 Concentration -2008 ..................................... 64
Figure 9.4: Predicted Maximum 24-hour PM10 Concentration -2009 ..................................... 65
5954_Review_of_Meteorology - Newcastle_ Inner_City_&_Port_FINAL.docx vii
Review of Meteorology In The Newcastle Inner City & Port Neighbourhood
Office of Environment and Heritage | PAEHolmes Job 5954
Figure 9.5: Predicted Maximum 24-hour PM10 Concentration -2010 ..................................... 66
Figure 9.6: Predicted 98.6th Percentile 24-hour PM10 Concentration -2006 ............................ 68
Figure 9.7: Predicted 98.6th Percentile 24-hour PM10 Concentration -2007 ............................ 69
Figure 9.8: Predicted 98.6th Percentile 24-hour PM10 Concentration -2008 ............................ 70
Figure 9.9: Predicted 98.6th Percentile 24-hour PM10 Concentration -2009 ............................ 71
Figure 9.10: Predicted 98.6th Percentile 24-hour PM10 Concentration -2010 .......................... 72
Figure 9.11: Predicted Annual Average PM10 Concentrations - 2006 ..................................... 73
Figure 9.12: Predicted Annual Average PM10 Concentrations - 2007 ..................................... 74
Figure 9.13: Predicted Annual Average PM10 Concentrations - 2008 ..................................... 75
Figure 9.14: Predicted Annual Average PM10 Concentrations - 2009 ..................................... 76
Figure 9.15: Predicted Annual Average PM10 Concentrations - 2010 ..................................... 77
5954_Review_of_Meteorology - Newcastle_ Inner_City_&_Port_FINAL.docx 8
Review of Meteorology In The Newcastle Inner City & Port Neighbourhood
Office of Environment and Heritage | PAEHolmes Job 5954
1 INTRODUCTION
The NSW Office of Environment and Heritage (OEH)a is seeking to review the adequacy of
existing industry operated ambient air quality monitoring sites to monitor the cumulative
impacts of industry emissions (point and diffuse sources) on the Newcastle inner city and port
neighbourhood.
This report has been prepared by PAEHolmes, on behalf of the OEH. It provides an overview of
the local meteorology, including wind patterns and air flows, and their influence on dispersion of
existing industrial air emissions in the Newcastle inner city and port neighbourhood.
1.1 Project Background and Need for the Study
The Lower Hunter Regional Planning Strategy predicts changes in the patterns of urban
settlement towards a higher proportion of medium density development in areas close to
established industries in the Newcastle inner city and port neighbourhood. Increases in freight
handling activities, in particular coal export through the port of Newcastle is also projected to
increase.
There is also increasing community interest in accessing reliable information about industry
impacts on their local neighbourhood, particularly for dust and particulate matter (PM).
Under the Protection of Environment Operations (POEO) Act 1997 the OEH requires a number of
industries in the Lower Hunter region to operate meteorological and ambient air quality
monitoring stations for particles. The Protection of Environment Operations (Environmental
Monitoring) Act 2010 provides a mechanism for OEH to establish environmental monitoring
programs to monitor the impact of pollutants from licensed industries and for the industries to
contribute to the cost of the monitoring program.
OEH is considering the establishment of an industry based monitoring program for the
Newcastle inner city and port neighbourhood.
1.2 Study Objectives
The objectives of the study are:
Use existing meteorological data to identify the preferred locations and number of
meteorological monitoring stations necessary to assess the impacts of local meteorology on
neighbourhood air quality;
Provide recommendations on the preferred locations of ambient air quality monitoring sites
to monitor the cumulative impact of local industry emissions (point and diffuse sources of
fine particles) on current and future populations in the neighbourhoods of Fern Bay,
Stockton, Carrington, Islington, Wickham, Newcastle West, Mayfield and Warabrook;
a The NSW EPA exists as a legal entity operated within the Office of Environment and Heritage (OEH) which came into
existence in April 2011. The OEH was previously part of the Department of Environment, Climate Change and Water
(DECCW). The DECCW was also recently known as the Department of Environment and Climate Change (DECC), and prior
to that the Department of Environment and Conservation (DEC). The terms NSW EPA, OEH, DECCW, DECC and DEC are
interchangeable in this report.
5954_Review_of_Meteorology - Newcastle_ Inner_City_&_Port_FINAL.docx 9
Review of Meteorology In The Newcastle Inner City & Port Neighbourhood
Office of Environment and Heritage | PAEHolmes Job 5954
The review considers:
Seasonal patterns in local meteorology (wind direction and temperature inversions);
The locations of existing industry point and diffuse sources of air pollutants; and
The influence of land and built environment features on particle dispersion.
1.3 Scope of Work
The following outlines the scope of work to meet the project objectives:
Collate existing meteorological data from available monitoring stations including OEH
operated sites at Wallsend, Beresfield and Newcastle, Bureau of Meteorology (BoM)
operated sites at Williamtown and available and suitable industry data;
Review and analyse these data to describe air flows for the area and the stability of wind
patterns over time and how these vary seasonally;
Using these data, generate input files for the CALMET meteorological model and develop a
wind field model for the area of interest;
Review and analyse the wind field model to develop a detailed understanding of the air
flows that impact particle dispersion;
Using information from the OEH Greater Metropolitan Region (GMR) Air Emission Inventory,
generate emission files for industry point (stacks) and diffuse (fugitive) emissions sources
within the study area;
Using these emissions data as input into the CALPUFF dispersion model, assess the
cumulative impact of particles in the area based on predicted glcs of PM10. Compare
predicted glcs in terms of wind flow patterns and major sources of particle pollution;
Using a combination of information on wind flows, major particle sources and the predicted
glcs, identify preferred locations and number of air quality monitoring sites to provide a
reliable means of monitoring and reporting on the impact of industry emissions on the
neighbourhood of Fern Bay, Stockton, Carrington, Islington, Wickham, Newcastle West,
Mayfield and Warabrook; and
Prepare a report outlining the objectives, methodologies employed, limitations, results and
recommendations for monitoring locations.
1.4 Pollutants Considered
Although emissions of particulate matter are generally considered in three separate size
fractions, (total suspended particulate matter (TSP), coarse particulate matter (PM10) and fine
particulate matter (PM2.5)), the focus of the review is emissions of PM10.
The predicted glcs are assessed against impact assessment criteria used by NSW OEH (NSW
DEC, 2005) as outlined in Table 1.1.
Table 1.1: Air quality standards / goals for particulate matter concentrations
Pollutant Standard Averaging Period
PM10 50 g/m3 24-Hour
30 g/m3 Annual
5954_Review_of_Meteorology - Newcastle_ Inner_City_&_Port_FINAL.docx 10
Review of Meteorology In The Newcastle Inner City & Port Neighbourhood
Office of Environment and Heritage | PAEHolmes Job 5954
2 LOCAL SETTING AND STUDY BOUNDARY
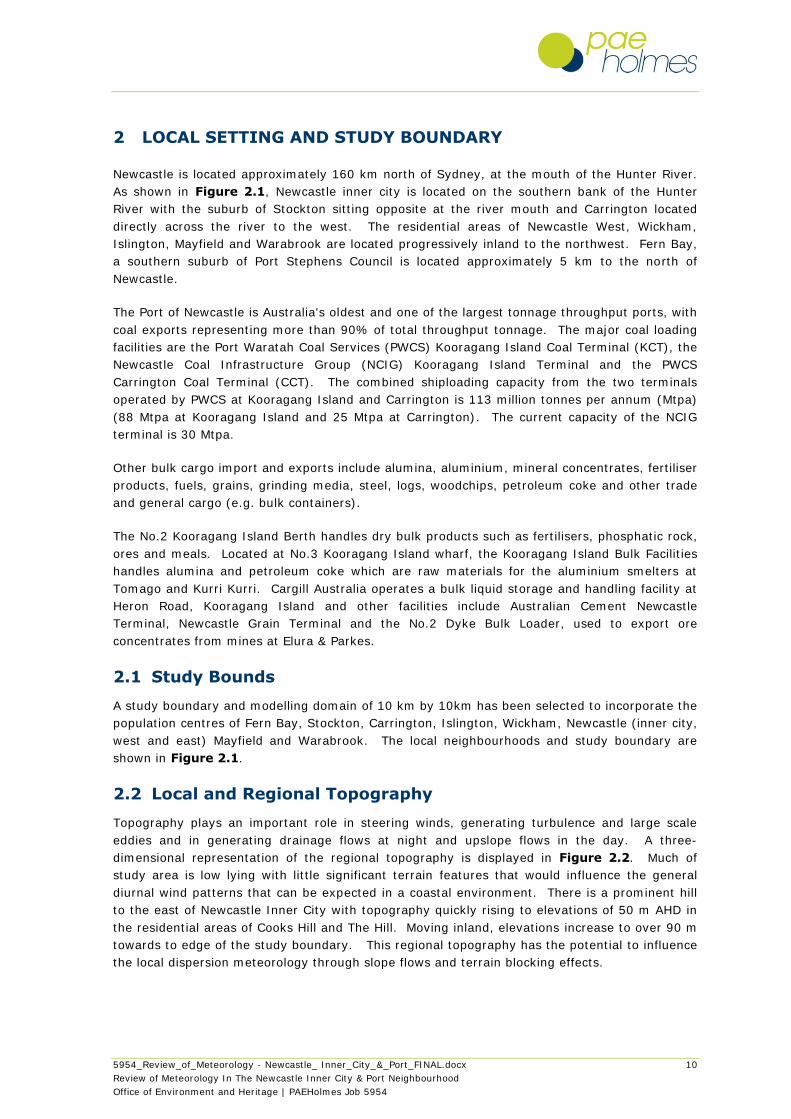
Newcastle is located approximately 160 km north of Sydney, at the mouth of the Hunter River.
As shown in Figure 2.1, Newcastle inner city is located on the southern bank of the Hunter
River with the suburb of Stockton sitting opposite at the river mouth and Carrington located
directly across the river to the west. The residential areas of Newcastle West, Wickham,
Islington, Mayfield and Warabrook are located progressively inland to the northwest. Fern Bay,
a southern suburb of Port Stephens Council is located approximately 5 km to the north of
Newcastle.
The Port of Newcastle is Australia's oldest and one of the largest tonnage throughput ports, with
coal exports representing more than 90% of total throughput tonnage. The major coal loading
facilities are the Port Waratah Coal Services (PWCS) Kooragang Island Coal Terminal (KCT), the
Newcastle Coal Infrastructure Group (NCIG) Kooragang Island Terminal and the PWCS
Carrington Coal Terminal (CCT). The combined shiploading capacity from the two terminals
operated by PWCS at Kooragang Island and Carrington is 113 million tonnes per annum (Mtpa)
(88 Mtpa at Kooragang Island and 25 Mtpa at Carrington). The current capacity of the NCIG
terminal is 30 Mtpa.
Other bulk cargo import and exports include alumina, aluminium, mineral concentrates, fertiliser
products, fuels, grains, grinding media, steel, logs, woodchips, petroleum coke and other trade
and general cargo (e.g. bulk containers).
The No.2 Kooragang Island Berth handles dry bulk products such as fertilisers, phosphatic rock,
ores and meals. Located at No.3 Kooragang Island wharf, the Kooragang Island Bulk Facilities
handles alumina and petroleum coke which are raw materials for the aluminium smelters at
Tomago and Kurri Kurri. Cargill Australia operates a bulk liquid storage and handling facility at
Heron Road, Kooragang Island and other facilities include Australian Cement Newcastle
Terminal, Newcastle Grain Terminal and the No.2 Dyke Bulk Loader, used to export ore
concentrates from mines at Elura & Parkes.
2.1 Study Bounds
A study boundary and modelling domain of 10 km by 10km has been selected to incorporate the
population centres of Fern Bay, Stockton, Carrington, Islington, Wickham, Newcastle (inner city,
west and east) Mayfield and Warabrook. The local neighbourhoods and study boundary are
shown in Figure 2.1.
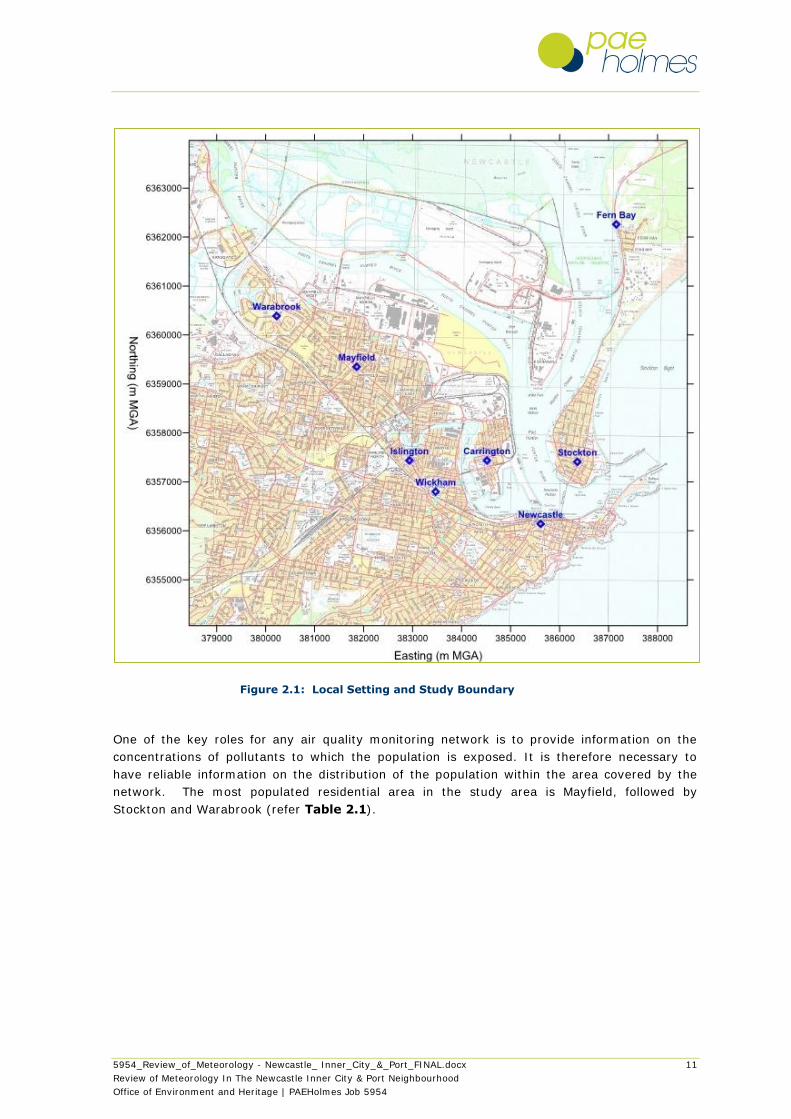
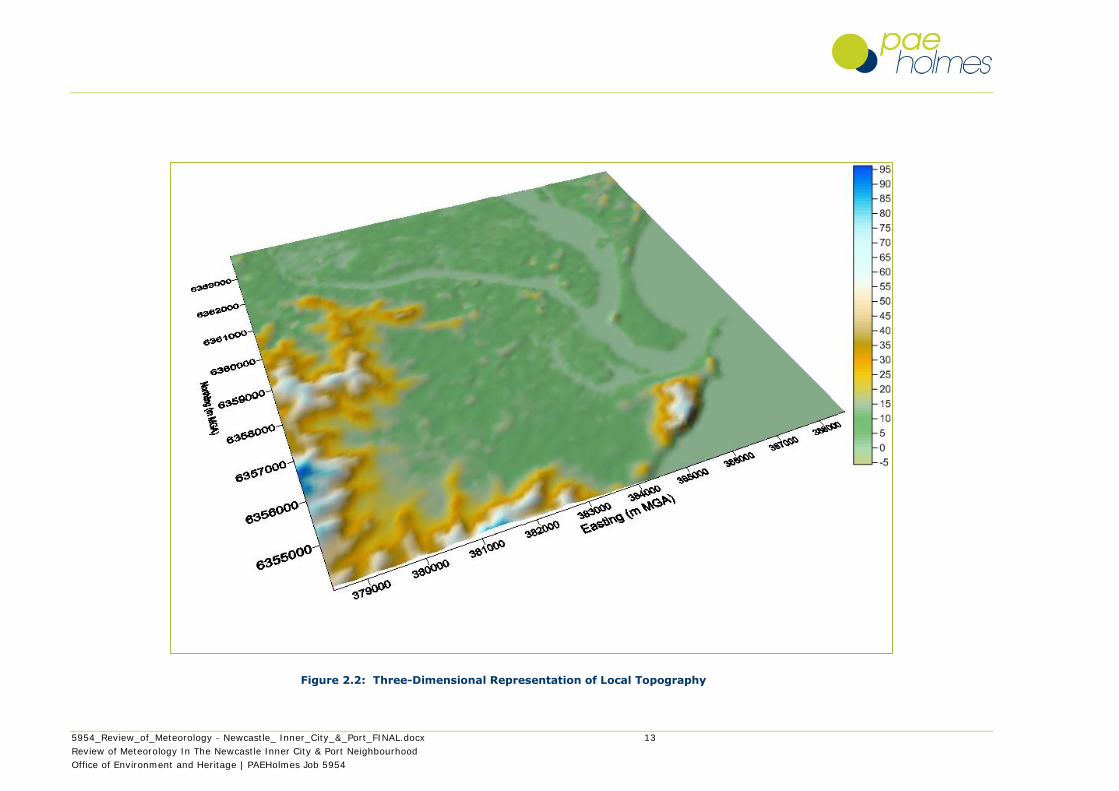
2.2 Local and Regional Topography
Topography plays an important role in steering winds, generating turbulence and large scale
eddies and in generating drainage flows at night and upslope flows in the day. A three-
dimensional representation of the regional topography is displayed in Figure 2.2. Much of
study area is low lying with little significant terrain features that would influence the general
diurnal wind patterns that can be expected in a coastal environment. There is a prominent hill
to the east of Newcastle Inner City with topography quickly rising to elevations of 50 m AHD in
the residential areas of Cooks Hill and The Hill. Moving inland, elevations increase to over 90 m
towards to edge of the study boundary. This regional topography has the potential to influence
the local dispersion meteorology through slope flows and terrain blocking effects.
5954_Review_of_Meteorology - Newcastle_ Inner_City_&_Port_FINAL.docx 11
Review of Meteorology In The Newcastle Inner City & Port Neighbourhood
Office of Environment and Heritage | PAEHolmes Job 5954
Figure 2.1: Local Setting and Study Boundary
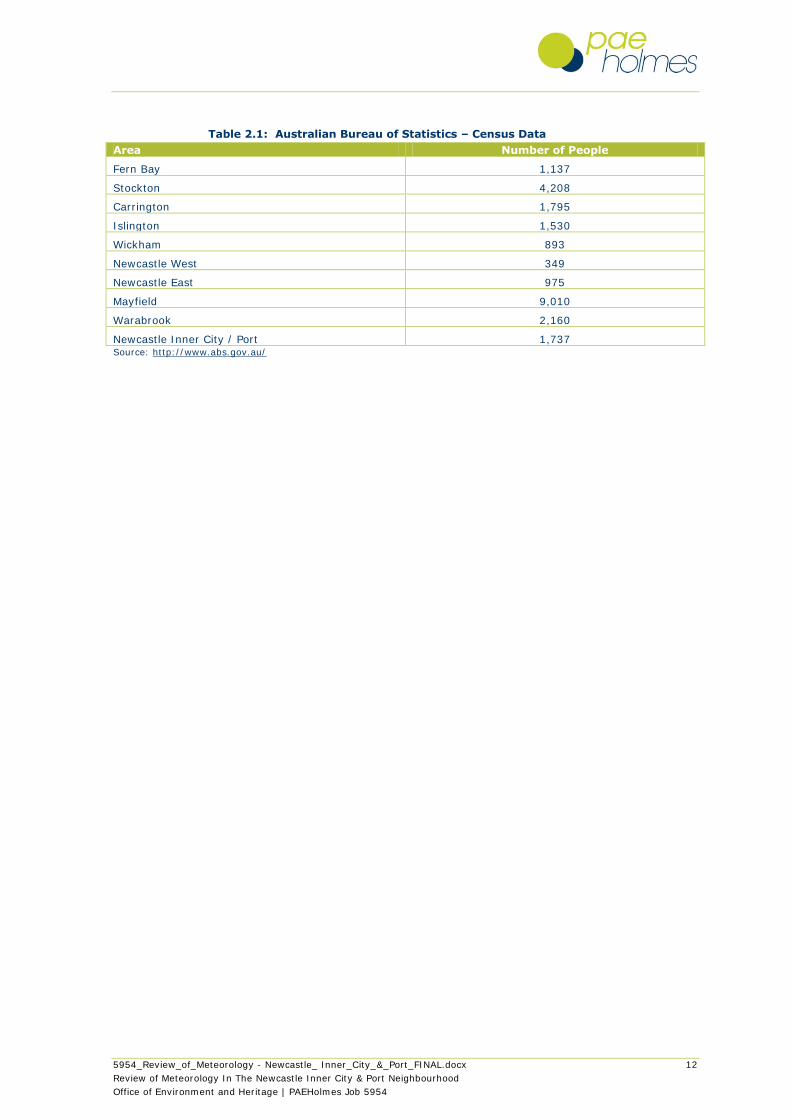
One of the key roles for any air quality monitoring network is to provide information on the
concentrations of pollutants to which the population is exposed. It is therefore necessary to
have reliable information on the distribution of the population within the area covered by the
network. The most populated residential area in the study area is Mayfield, followed by
Stockton and Warabrook (refer Table 2.1).
5954_Review_of_Meteorology - Newcastle_ Inner_City_&_Port_FINAL.docx 12
Review of Meteorology In The Newcastle Inner City & Port Neighbourhood
Office of Environment and Heritage | PAEHolmes Job 5954
Table 2.1: Australian Bureau of Statistics – Census Data
Area Number of People
Fern Bay 1,137
Stockton 4,208
Carrington 1,795
Islington 1,530
Wickham 893
Newcastle West 349
Newcastle East 975
Mayfield 9,010
Warabrook 2,160
Newcastle Inner City / Port 1,737 Source: http://www.abs.gov.au/
5954_Review_of_Meteorology - Newcastle_ Inner_City_&_Port_FINAL.docx 13
Review of Meteorology In The Newcastle Inner City & Port Neighbourhood
Office of Environment and Heritage | PAEHolmes Job 5954
Figure 2.2: Three-Dimensional Representation of Local Topography
5954_Review_of_Meteorology - Newcastle_ Inner_City_&_Port_FINAL.docx 14
Review of Meteorology In The Newcastle Inner City & Port Neighbourhood
Office of Environment and Heritage | PAEHolmes Job 5954
3 OVERVIEW OF EXISTING METEOROLOGICAL MONITORING
LOCATIONS
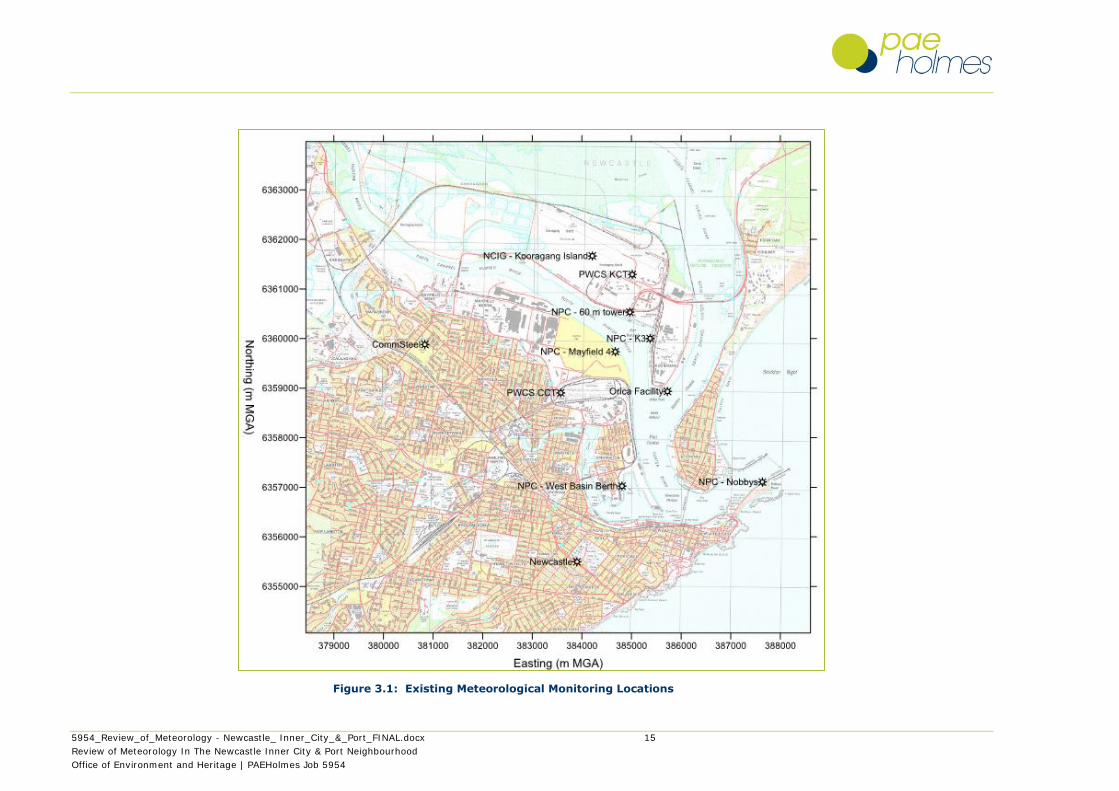
There are a number of existing meteorological monitoring stations located in the study area,
operated by industry, including:
Newcastle Coal Infrastructure Group (NCIG) – Kooragang Island;
Port Waratah Coal Services (PWCS);
o Kooragang Island Terminal: and
o Carrington Terminal;
Commsteel – Mayfield;
Orica – Kooragang Facility;
Koppers – Mayfield;
Newcastle Port Corporation (NPC);
o Mayfield No.4 Berth:
o West Basin Berth:
o K3 Berth:
o K4 60 m Tower:
o Nobbys Signal Station.
In addition, there are data available at a number of OEH monitoring stations (Newcastle,
Wallsend and Beresfield) that are also referenced in this assessment. An overview of the
existing meteorological monitoring stations is shown in Figure 3.1.
Only the OEH monitoring site at Newcastle is shown as the Beresfield and Wallsend sites are
located outside the study area. A description of the data availability, quality and how it was
used in this assessment is provided in Table 3.1.
5954_Review_of_Meteorology - Newcastle_ Inner_City_&_Port_FINAL.docx 15
Review of Meteorology In The Newcastle Inner City & Port Neighbourhood
Office of Environment and Heritage | PAEHolmes Job 5954
Figure 3.1: Existing Meteorological Monitoring Locations
5954_Review_of_Meteorology - Newcastle_ Inner_City_&_Port_FINAL.docx 16
Review of Meteorology In The Newcastle Inner City & Port Neighbourhood
Office of Environment and Heritage | PAEHolmes Job 5954
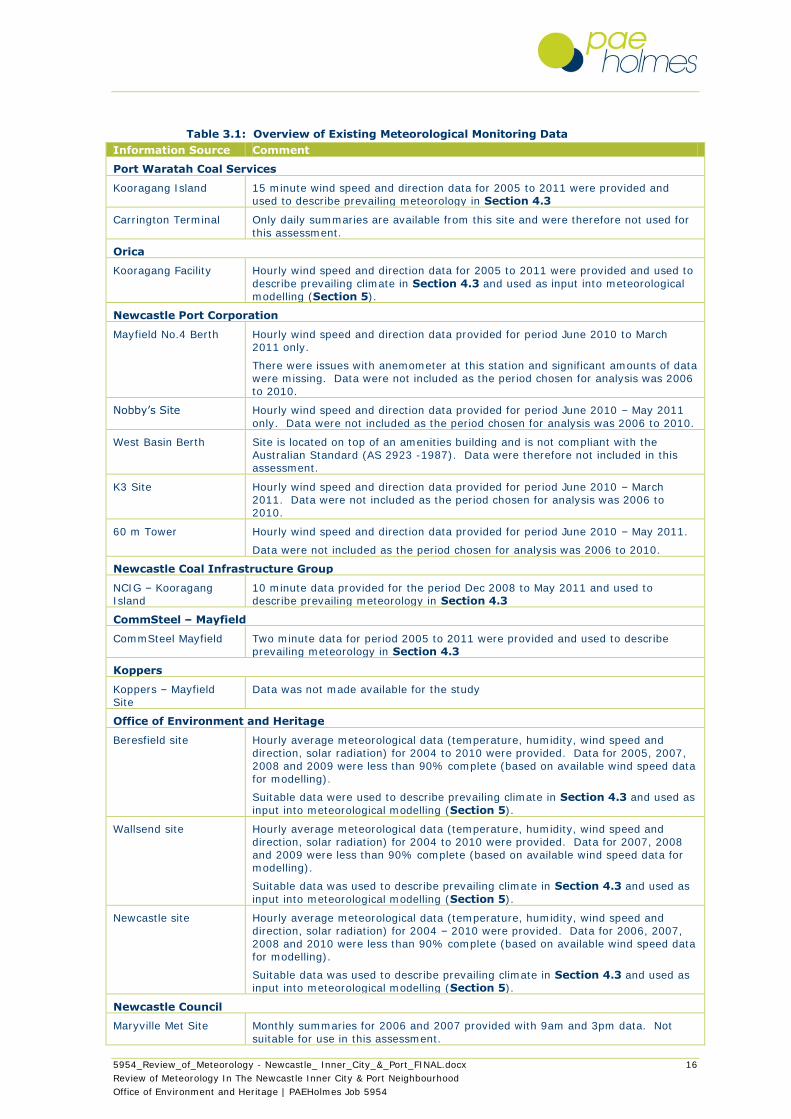
Table 3.1: Overview of Existing Meteorological Monitoring Data
Information Source Comment
Port Waratah Coal Services
Kooragang Island 15 minute wind speed and direction data for 2005 to 2011 were provided and used to describe prevailing meteorology in Section 4.3
Carrington Terminal Only daily summaries are available from this site and were therefore not used for
this assessment.
Orica
Kooragang Facility Hourly wind speed and direction data for 2005 to 2011 were provided and used to
describe prevailing climate in Section 4.3 and used as input into meteorological modelling (Section 5).
Newcastle Port Corporation
Mayfield No.4 Berth Hourly wind speed and direction data provided for period June 2010 to March 2011 only.
There were issues with anemometer at this station and significant amounts of data were missing. Data were not included as the period chosen for analysis was 2006 to 2010.
Nobby‟s Site Hourly wind speed and direction data provided for period June 2010 – May 2011
only. Data were not included as the period chosen for analysis was 2006 to 2010.
West Basin Berth Site is located on top of an amenities building and is not compliant with the Australian Standard (AS 2923 -1987). Data were therefore not included in this assessment.
K3 Site Hourly wind speed and direction data provided for period June 2010 – March 2011. Data were not included as the period chosen for analysis was 2006 to 2010.
60 m Tower Hourly wind speed and direction data provided for period June 2010 – May 2011.
Data were not included as the period chosen for analysis was 2006 to 2010.
Newcastle Coal Infrastructure Group
NCIG – Kooragang Island
10 minute data provided for the period Dec 2008 to May 2011 and used to describe prevailing meteorology in Section 4.3
CommSteel – Mayfield
CommSteel Mayfield Two minute data for period 2005 to 2011 were provided and used to describe prevailing meteorology in Section 4.3
Koppers
Koppers – Mayfield Site
Data was not made available for the study
Office of Environment and Heritage
Beresfield site Hourly average meteorological data (temperature, humidity, wind speed and direction, solar radiation) for 2004 to 2010 were provided. Data for 2005, 2007, 2008 and 2009 were less than 90% complete (based on available wind speed data for modelling).
Suitable data were used to describe prevailing climate in Section 4.3 and used as
input into meteorological modelling (Section 5).
Wallsend site Hourly average meteorological data (temperature, humidity, wind speed and direction, solar radiation) for 2004 to 2010 were provided. Data for 2007, 2008 and 2009 were less than 90% complete (based on available wind speed data for modelling).
Suitable data was used to describe prevailing climate in Section 4.3 and used as
input into meteorological modelling (Section 5).
Newcastle site Hourly average meteorological data (temperature, humidity, wind speed and direction, solar radiation) for 2004 – 2010 were provided. Data for 2006, 2007, 2008 and 2010 were less than 90% complete (based on available wind speed data for modelling).
Suitable data was used to describe prevailing climate in Section 4.3 and used as input into meteorological modelling (Section 5).
Newcastle Council
Maryville Met Site Monthly summaries for 2006 and 2007 provided with 9am and 3pm data. Not
suitable for use in this assessment.
5954_Review_of_Meteorology - Newcastle_ Inner_City_&_Port_FINAL.docx 17
Review of Meteorology In The Newcastle Inner City & Port Neighbourhood
Office of Environment and Heritage | PAEHolmes Job 5954
4 CLIMATE AND DISPERSION METEOROLOGY
Meteorological mechanisms govern the dispersion, transformation and eventual removal of
pollutants from the atmosphere. How pollution disperses in the atmosphere is dependent on
wind speed and direction as well as the degree and vertical extent of thermal and mechanical
turbulence within the boundary layer.
Dispersion of pollution occurs in both the horizontal and vertical directions. In the horizontal,
wind direction and the variability in wind direction determine the general path pollutants will
follow and the extent of crosswind spreading. Short-term variations in wind direction are caused
by turbulence and are related to thermal stability of the boundary layer. Wind speed determines
both the rate of downwind transport and the rate of dilution as a result of plume „stretching‟.
The vertical component is determined by stability, which influences the rate of turbulent mixing
and the depth of the mixing layer (mixing height) which is defined by the presence of a
thermally stable layer above the mixing layer that prevents turbulent mixing to higher levels.
Mechanical turbulence is a function of the wind speed and the surface roughness, and affects
mixing of plumes vertically and horizontally.
Pollution concentrations in the atmosphere are therefore dependent on changes in atmospheric
stability, mixing height and wind speed and direction, as well as rates of pollutant emissions.
4.1 Regional Weather Patterns
The broad driving force for weather patterns in NSW is the general circulation of the
atmosphere. Large-scale circulation patterns, smoothing out the short-term variations caused
by synoptic weather systems describe the basis for seasonal changes of climate in Australia.
(DPI, 2007).
The general circulation is driven by energy from the sun which in low latitudes heats the earth‟s
surface and drives evaporation, particularly from the tropical oceans. The heated air, plus water
vapour, rises to the top of the atmosphere in large storm systems, causing low pressure at the
surface, and moves slowly away from the equator in each hemisphere. On the way, the air
gradually loses heat and moisture and starts to sink back towards the surface, at about 30° of
latitude, causing a high pressure system in that region. This descending dry air gives the clear
skies of the subtropical high pressure systems so common in Australia (DPI, 2007).
One branch of the descending air moves at low levels back towards the equator, completing the
„Hadley‟ air cell circulation while another branch of warm air moves towards the poles. At the
same time, high pressure in the polar regions causes cold air to move towards the equator near
the surface. These two air masses, with markedly different temperatures, meet at the polar
front and, in combination with a general longitudinal flow, result in low pressure systems which
influence weather conditions in southern and eastern Australia. The Coriolis force cause the air
moving back towards the equator in the Hadley cell to be deflected towards the left, resulting in
south-easterly winds over the ocean („trade winds‟), with some further deflection over the land.
Air moving towards the poles from the subtropics is deflected into westerlies, becoming the
„roaring forties‟ (DPI, 2007).
One aspect of the general circulation is a typical eastward movement of subtropical high
pressure systems and mid-latitude cyclones. Typically, these systems take from five to seven
days to migrate across the continent. In general, regions of high pressure have a large
longitudinal spread, often several thousand kilometres. In high pressure regions, pressure
gradients near the centres are small, wind speeds are usually light and conditions stable. In
5954_Review_of_Meteorology - Newcastle_ Inner_City_&_Port_FINAL.docx 18
Review of Meteorology In The Newcastle Inner City & Port Neighbourhood
Office of Environment and Heritage | PAEHolmes Job 5954
contrast, regions of low pressure are often more concentrated and have larger pressure
gradients, resulting in stronger winds and more severe weather conditions. In the southern
hemisphere, under the influence of Coriolis forces, air rotates anticlockwise around regions of
high pressure, and clockwise around low pressure systems (DPI, 2007) - reference.
The apparent movement of the sun with the seasons of the year causes the atmospheric
circulation pattern to migrate north in winter (furthest north in June) and south in summer
(furthest south in December). Australia extends over a large range of latitudes, and changes in
the positions of high and low pressure systems as a result of seasonal changes in the general
circulation of the atmosphere have a distinct effect on weather in NSW.
Typical features of NSW summer synoptic patterns are:
cells of high pressure moving eastward into the Tasman Sea, typically between 35S and
45S with ridging to the northwest, resulting in hot north to north-westerly winds over
southern NSW generally increasing in strength before the arrival of a cold front.
low pressure troughs leading to the formation of thunderstorms;
thunderstorm activity may precede the cool change, with temperatures falling dramatically
in coastal regions. For the following few days conditions remain unsettled, especially near
the coast, as the wind slowly moves around to the east then north-east with the movement
of the high pressure system across eastern Australia;
Another feature typical of summer is a tropical cyclone which may not directly affect NSW
but result in low pressure systems off the coast of Queensland moving slowly down the
coast and causing strong winds and torrential rain in northern and central parts of eastern
NSW.
Typical features of NSW winter synoptic patterns are:
eastward movement of high pressure systems typically located over NSW and Queensland,
and the mid-latitude cyclones results in predominantly west to south-west synoptic winds
across most of NSW in winter;
low pressure systems over Tasmania, Victoria or NSW producing fine weather over eastern
New South Wales in the short term, followed by several cold fronts. There are a number of
possible developments, but the most likely result is for rain and strong west to south-
westerly winds over NSW. The rain will mainly occur on the western slopes and plains and
the highlands. Along the coast, although conditions are likely to be cloudy and windy, there
will be only a small chance of rain.
as the low pressure system moves east, conditions will be dominated by the high pressure
system west of Western Australia and because of the more northerly winter track, winds will
normally remain westerly over NSW, briefly turning north to north-westerly as this high slips
away into the Tasman Sea and is replaced by the next mid-latitude depression and high
pressure system.
While the synoptic patterns give an indication of the strength and direction of winds driven by
the circulation of the atmosphere, localised effects can produce quite different winds. This is
particularly true along the NSW coast, where sea breezes during the day and local offshore
winds at night are common. Sea breezes are more common in summer than winter because of
the stronger heating of the land. Hills and valleys can cause local variations to the general
direction and speed of winds, although usually the type of variations will be the same if the high
or low is at the same position and strength (DPI, 2007).
5954_Review_of_Meteorology - Newcastle_ Inner_City_&_Port_FINAL.docx 19
Review of Meteorology In The Newcastle Inner City & Port Neighbourhood
Office of Environment and Heritage | PAEHolmes Job 5954
4.2 Local Climate
Newcastle has a humid subtropical climate with warm summers and mild winters. Precipitation
is typically heaviest in the first half of the year when east coast lows can bring very heavy falls
and damaging winds. Owing to its coastal location, the region is influenced by the diurnal
alternation of land- and seabreeze flows, which have significant implications for air quality when
extended anticyclonic conditions occur.
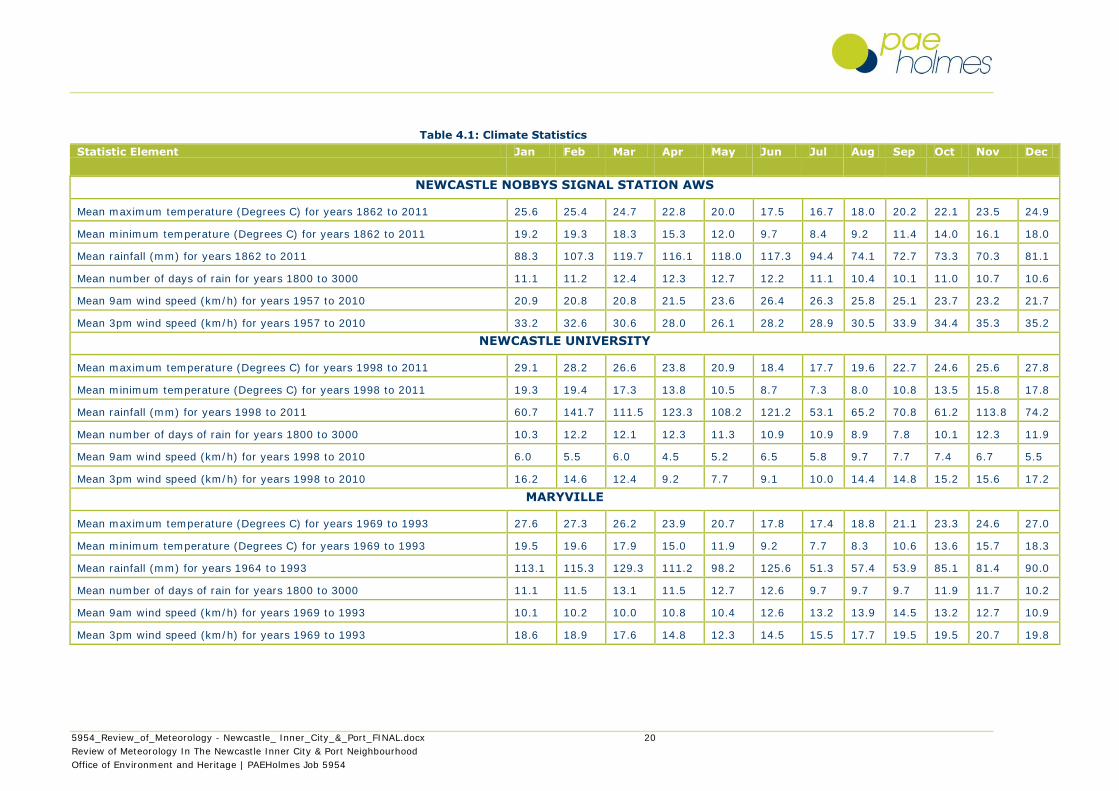
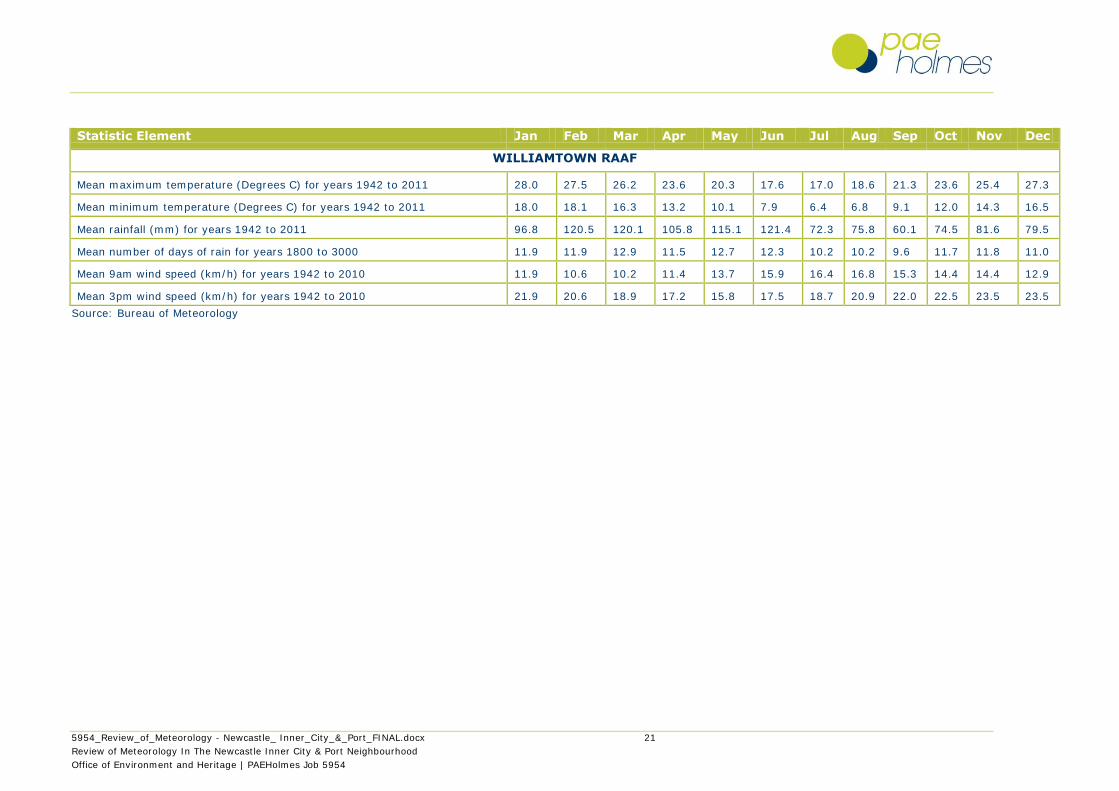
Climate averages for Newcastle Nobbys Signal Station, Newcastle University, Maryville and
Williamtown RAAF base are presented in Table 4.1.
January is the warmest month at all sites with an annual average maximum temperature
between 25.6 °C – 29.1°C. July is the coolest month at all sites with an average minimum
temperature of 6.4 °C to 8.4°C. Temperatures at coastal areas are generally cooler than inland
sites in summer and slightly warmer in winter.
Precipitation is important to air pollution studies since it represents an effective removal
mechanism of atmospheric pollutants. February and March produce the highest monthly rainfall
on average and the number of rain days is relatively consistent across all months of the year.
Mean 9am and 3pm wind speeds are highest at coastal sites (Nobby‟s Signal Station).
5954_Review_of_Meteorology - Newcastle_ Inner_City_&_Port_FINAL.docx 20
Review of Meteorology In The Newcastle Inner City & Port Neighbourhood
Office of Environment and Heritage | PAEHolmes Job 5954
Table 4.1: Climate Statistics
Statistic Element Jan Feb Mar Apr May Jun Jul Aug Sep Oct Nov Dec
NEWCASTLE NOBBYS SIGNAL STATION AWS
Mean maximum temperature (Degrees C) for years 1862 to 2011 25.6 25.4 24.7 22.8 20.0 17.5 16.7 18.0 20.2 22.1 23.5 24.9
Mean minimum temperature (Degrees C) for years 1862 to 2011 19.2 19.3 18.3 15.3 12.0 9.7 8.4 9.2 11.4 14.0 16.1 18.0
Mean rainfall (mm) for years 1862 to 2011 88.3 107.3 119.7 116.1 118.0 117.3 94.4 74.1 72.7 73.3 70.3 81.1
Mean number of days of rain for years 1800 to 3000 11.1 11.2 12.4 12.3 12.7 12.2 11.1 10.4 10.1 11.0 10.7 10.6
Mean 9am wind speed (km/h) for years 1957 to 2010 20.9 20.8 20.8 21.5 23.6 26.4 26.3 25.8 25.1 23.7 23.2 21.7
Mean 3pm wind speed (km/h) for years 1957 to 2010 33.2 32.6 30.6 28.0 26.1 28.2 28.9 30.5 33.9 34.4 35.3 35.2
NEWCASTLE UNIVERSITY
Mean maximum temperature (Degrees C) for years 1998 to 2011 29.1 28.2 26.6 23.8 20.9 18.4 17.7 19.6 22.7 24.6 25.6 27.8
Mean minimum temperature (Degrees C) for years 1998 to 2011 19.3 19.4 17.3 13.8 10.5 8.7 7.3 8.0 10.8 13.5 15.8 17.8
Mean rainfall (mm) for years 1998 to 2011 60.7 141.7 111.5 123.3 108.2 121.2 53.1 65.2 70.8 61.2 113.8 74.2
Mean number of days of rain for years 1800 to 3000 10.3 12.2 12.1 12.3 11.3 10.9 10.9 8.9 7.8 10.1 12.3 11.9
Mean 9am wind speed (km/h) for years 1998 to 2010 6.0 5.5 6.0 4.5 5.2 6.5 5.8 9.7 7.7 7.4 6.7 5.5
Mean 3pm wind speed (km/h) for years 1998 to 2010 16.2 14.6 12.4 9.2 7.7 9.1 10.0 14.4 14.8 15.2 15.6 17.2
MARYVILLE
Mean maximum temperature (Degrees C) for years 1969 to 1993 27.6 27.3 26.2 23.9 20.7 17.8 17.4 18.8 21.1 23.3 24.6 27.0
Mean minimum temperature (Degrees C) for years 1969 to 1993 19.5 19.6 17.9 15.0 11.9 9.2 7.7 8.3 10.6 13.6 15.7 18.3
Mean rainfall (mm) for years 1964 to 1993 113.1 115.3 129.3 111.2 98.2 125.6 51.3 57.4 53.9 85.1 81.4 90.0
Mean number of days of rain for years 1800 to 3000 11.1 11.5 13.1 11.5 12.7 12.6 9.7 9.7 9.7 11.9 11.7 10.2
Mean 9am wind speed (km/h) for years 1969 to 1993 10.1 10.2 10.0 10.8 10.4 12.6 13.2 13.9 14.5 13.2 12.7 10.9
Mean 3pm wind speed (km/h) for years 1969 to 1993 18.6 18.9 17.6 14.8 12.3 14.5 15.5 17.7 19.5 19.5 20.7 19.8
5954_Review_of_Meteorology - Newcastle_ Inner_City_&_Port_FINAL.docx 21
Review of Meteorology In The Newcastle Inner City & Port Neighbourhood
Office of Environment and Heritage | PAEHolmes Job 5954
Statistic Element Jan Feb Mar Apr May Jun Jul Aug Sep Oct Nov Dec
WILLIAMTOWN RAAF
Mean maximum temperature (Degrees C) for years 1942 to 2011 28.0 27.5 26.2 23.6 20.3 17.6 17.0 18.6 21.3 23.6 25.4 27.3
Mean minimum temperature (Degrees C) for years 1942 to 2011 18.0 18.1 16.3 13.2 10.1 7.9 6.4 6.8 9.1 12.0 14.3 16.5
Mean rainfall (mm) for years 1942 to 2011 96.8 120.5 120.1 105.8 115.1 121.4 72.3 75.8 60.1 74.5 81.6 79.5
Mean number of days of rain for years 1800 to 3000 11.9 11.9 12.9 11.5 12.7 12.3 10.2 10.2 9.6 11.7 11.8 11.0
Mean 9am wind speed (km/h) for years 1942 to 2010 11.9 10.6 10.2 11.4 13.7 15.9 16.4 16.8 15.3 14.4 14.4 12.9
Mean 3pm wind speed (km/h) for years 1942 to 2010 21.9 20.6 18.9 17.2 15.8 17.5 18.7 20.9 22.0 22.5 23.5 23.5
Source: Bureau of Meteorology
5954_Review_of_Meteorology - Newcastle_ Inner_City_&_Port_FINAL.docx 22
Review of Meteorology In The Newcastle Inner City & Port Neighbourhood
Office of Environment and Heritage | PAEHolmes Job 5954
4.3 Analysis of Prevailing Winds at Meteorological Monitoring
Sites
Guidelines specifying the way in which dispersion models should be used in air quality assessments
provide information on the length of meteorological record that is required to provide statistically
reliable predictions. These guidelines are of use for the current assessment as they indicate the
period of record required to provide a reliable estimate of a dispersion pattern. The minimum data
requirement specified in the NSW OEH “Approved Methods for the Modelling and Assessment of Air
Pollutants in NSW” (NSW DEC, 2005) is 12 months with at least 90% data recovery. This
requirement guarantees that all the four seasons are covered and no more than 37 days of data
(approximately five weeks) will be missing.
The US EPA provides similar advice in their document referred to as Appendix W (US EPA, 2003).
They require that the model user should acquire enough meteorological data to ensure that the
worst-case meteorological conditions are adequately represented in the model results. The report
then goes on to discuss the number of years of record needed to obtain a stable distribution in
model predictions. Their review notes that some studies have indicated that in excess of 10 years
may be required to achieve stability in the frequency distribution of some meteorological variables
however they note that such long periods are not reasonable for model input data. Further work
reviewed by the US EPA, looking at approximately a 17-year dataset ,and running model
predictions using sub sets of the 17-year set, indicates that meteorological data from one station
over a period of approximately five years would be sufficient to adequately represent dispersion
conditions in a particular area (HAS 2008).
A review of the local prevailing winds is made using the meteorological monitoring data provided
for the study and described in Section 3. A period of 5 years is chosen for analysis from 2006 to
2010. In addition to the data made available for this study, data from the Bureau of Meteorology
(BoM) sites at Williamtown RAAF Base have also been assessed and presented below. These
meteorological data were also used as input data to the TAPM and CALMET modelling. Further
details are provided in Section 6.
Seasonal windroses for each of the sites for the period 2006 to 2010 were generated and shown in
Appendix B where data availability are sufficient. Seasonal windroses for a representative year at
each site are provided below and used to describe prevailing winds for the study area.
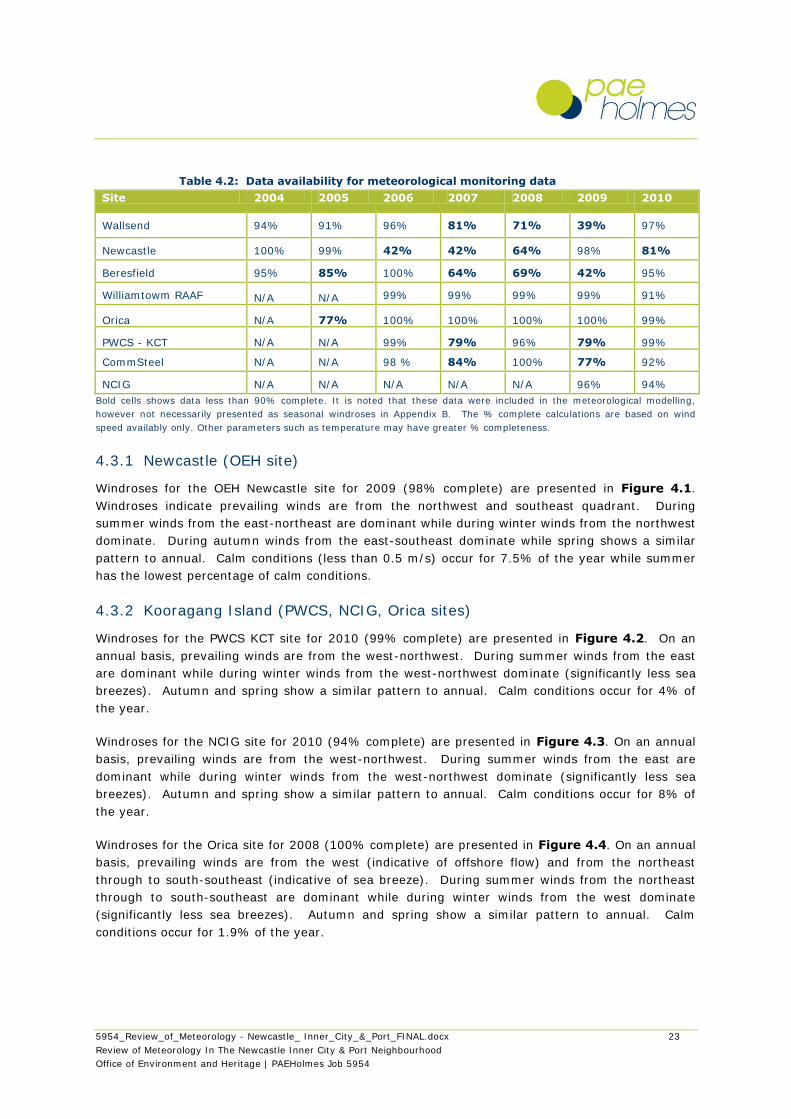
A summary of the data availability for each of the sites is shown in Table 4.2.
5954_Review_of_Meteorology - Newcastle_ Inner_City_&_Port_FINAL.docx 23
Review of Meteorology In The Newcastle Inner City & Port Neighbourhood
Office of Environment and Heritage | PAEHolmes Job 5954
Table 4.2: Data availability for meteorological monitoring data
Site 2004 2005 2006 2007 2008 2009 2010
Wallsend 94% 91% 96% 81% 71% 39% 97%
Newcastle 100% 99% 42% 42% 64% 98% 81%
Beresfield 95% 85% 100% 64% 69% 42% 95%
Williamtowm RAAF N/A N/A 99% 99% 99% 99% 91%
Orica N/A 77% 100% 100% 100% 100% 99%
PWCS - KCT N/A N/A 99% 79% 96% 79% 99%
CommSteel N/A N/A 98 % 84% 100% 77% 92%
NCIG N/A N/A N/A N/A N/A 96% 94%
Bold cells shows data less than 90% complete. It is noted that these data were included in the meteorological modelling,
however not necessarily presented as seasonal windroses in Appendix B. The % complete calculations are based on wind
speed availably only. Other parameters such as temperature may have greater % completeness.
4.3.1 Newcastle (OEH site)
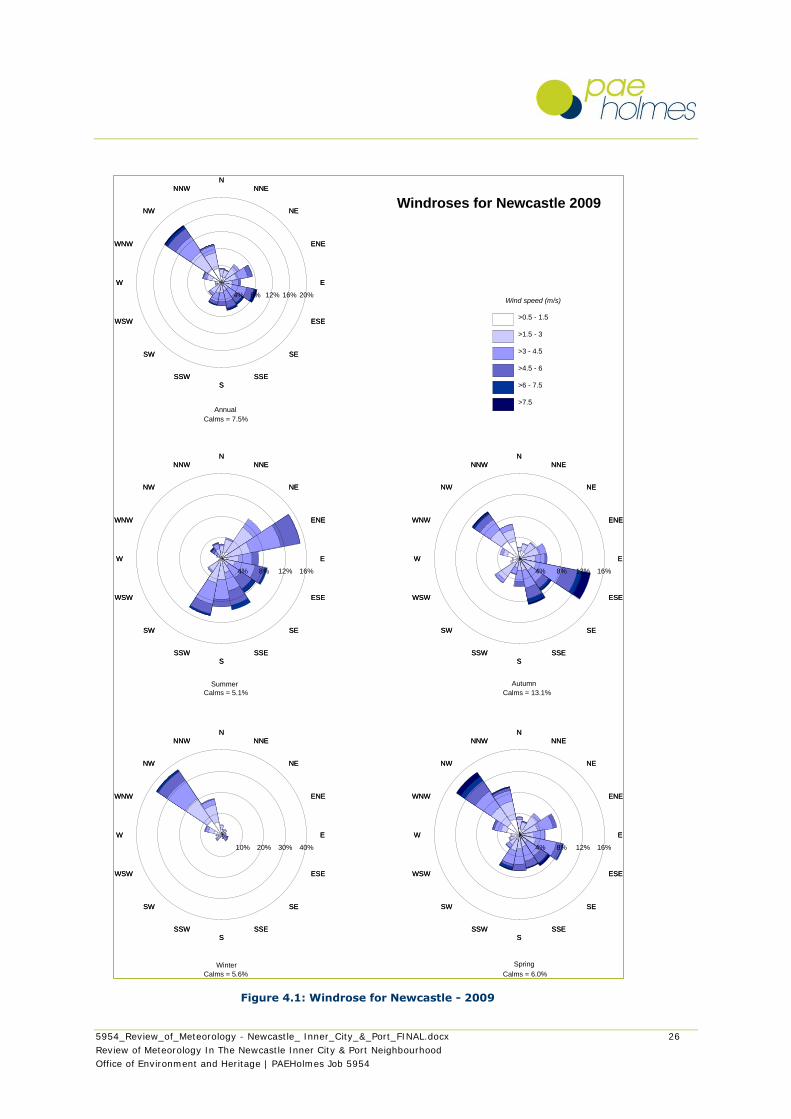
Windroses for the OEH Newcastle site for 2009 (98% complete) are presented in Figure 4.1.
Windroses indicate prevailing winds are from the northwest and southeast quadrant. During
summer winds from the east-northeast are dominant while during winter winds from the northwest
dominate. During autumn winds from the east-southeast dominate while spring shows a similar
pattern to annual. Calm conditions (less than 0.5 m/s) occur for 7.5% of the year while summer
has the lowest percentage of calm conditions.
4.3.2 Kooragang Island (PWCS, NCIG, Orica sites)
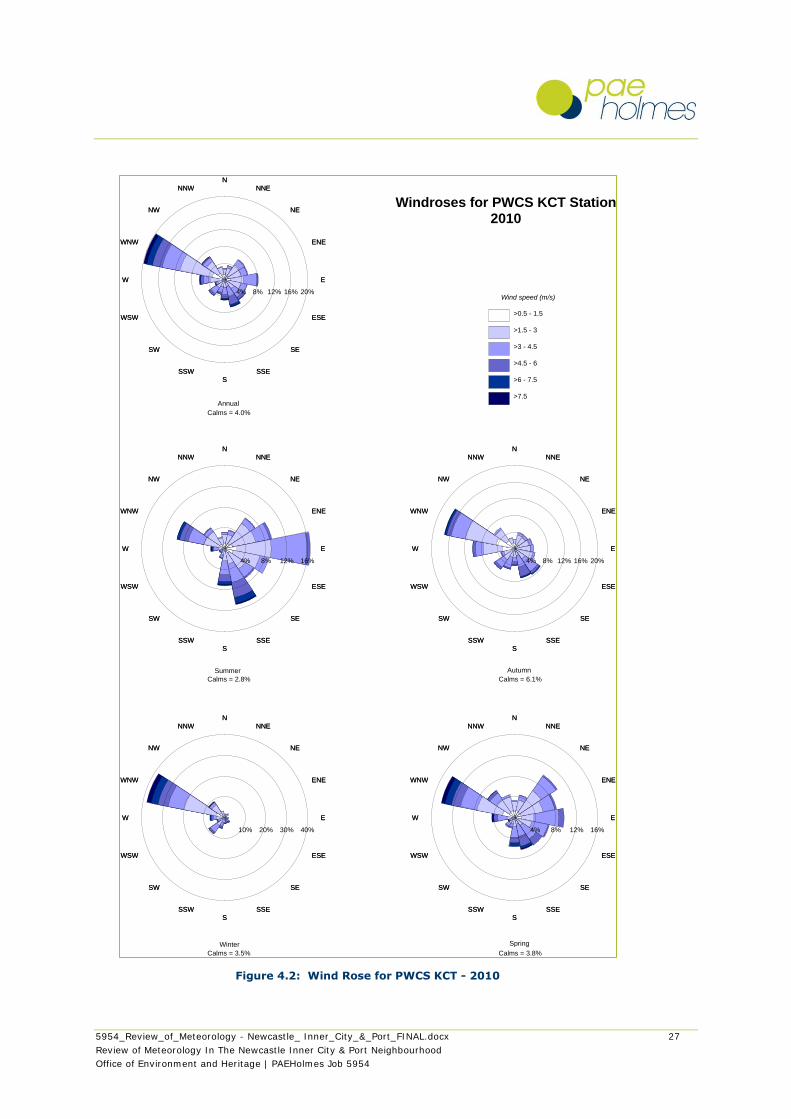
Windroses for the PWCS KCT site for 2010 (99% complete) are presented in Figure 4.2. On an
annual basis, prevailing winds are from the west-northwest. During summer winds from the east
are dominant while during winter winds from the west-northwest dominate (significantly less sea
breezes). Autumn and spring show a similar pattern to annual. Calm conditions occur for 4% of
the year.
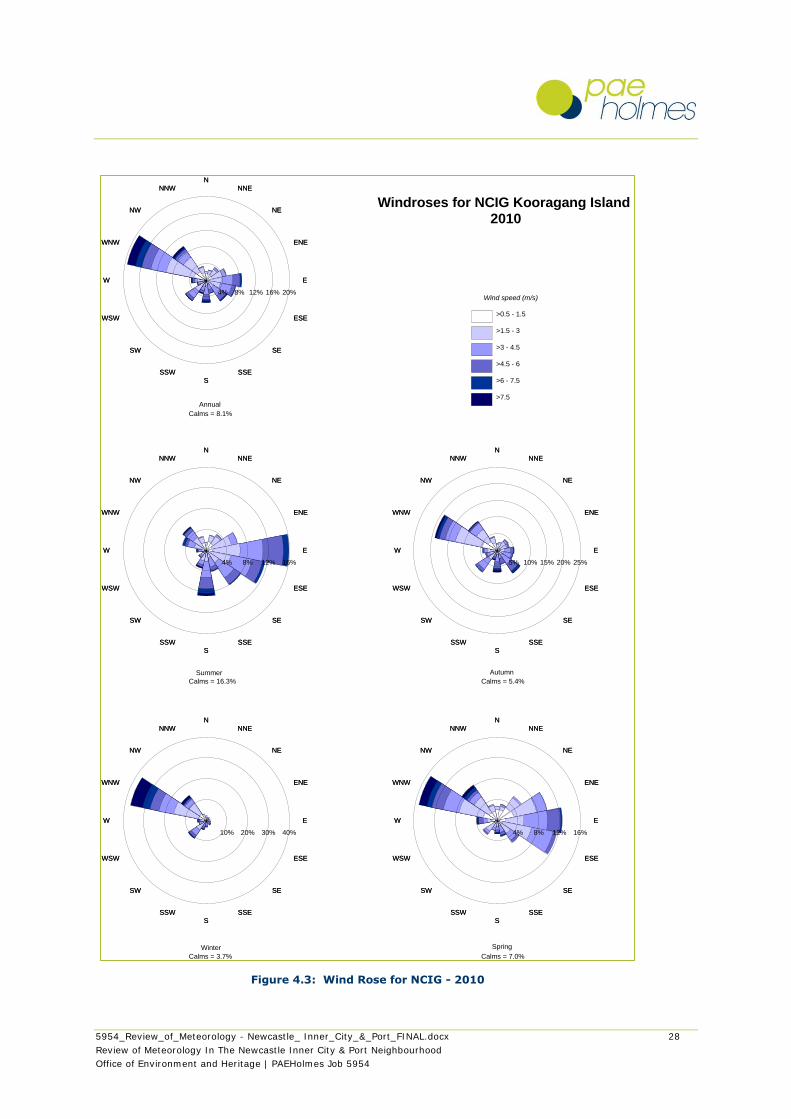
Windroses for the NCIG site for 2010 (94% complete) are presented in Figure 4.3. On an annual
basis, prevailing winds are from the west-northwest. During summer winds from the east are
dominant while during winter winds from the west-northwest dominate (significantly less sea
breezes). Autumn and spring show a similar pattern to annual. Calm conditions occur for 8% of
the year.
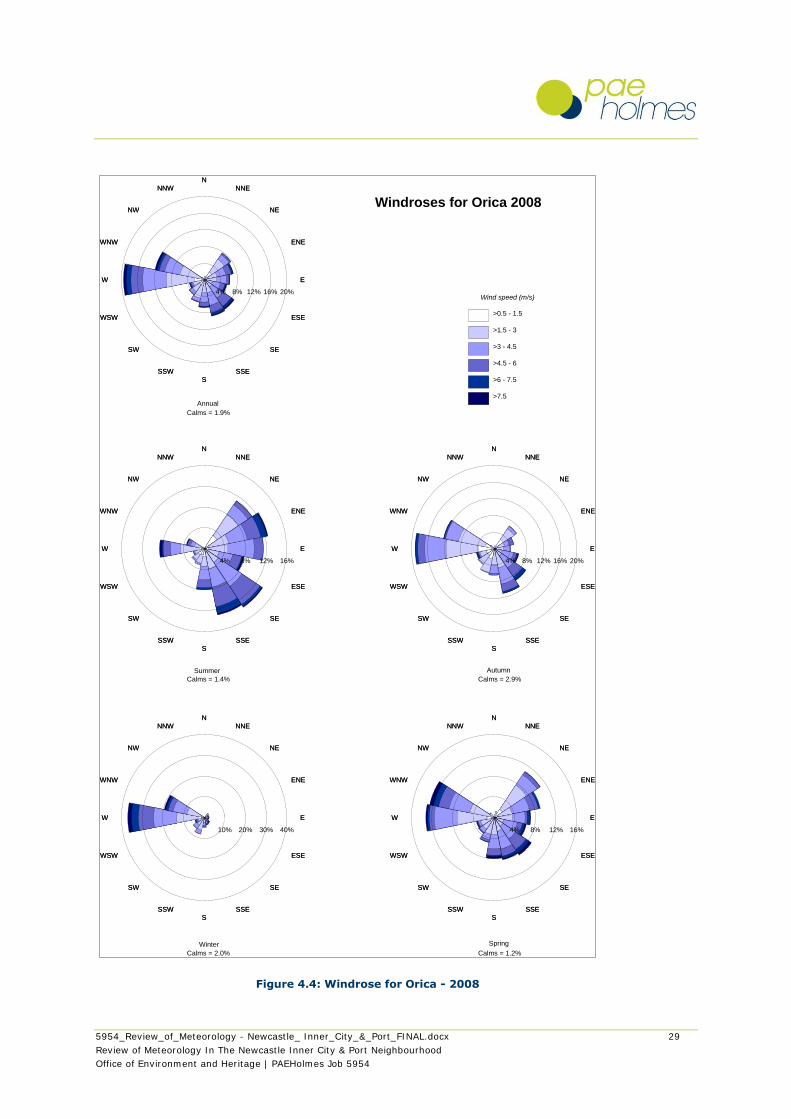
Windroses for the Orica site for 2008 (100% complete) are presented in Figure 4.4. On an annual
basis, prevailing winds are from the west (indicative of offshore flow) and from the northeast
through to south-southeast (indicative of sea breeze). During summer winds from the northeast
through to south-southeast are dominant while during winter winds from the west dominate
(significantly less sea breezes). Autumn and spring show a similar pattern to annual. Calm
conditions occur for 1.9% of the year.
5954_Review_of_Meteorology - Newcastle_ Inner_City_&_Port_FINAL.docx 24
Review of Meteorology In The Newcastle Inner City & Port Neighbourhood
Office of Environment and Heritage | PAEHolmes Job 5954
4.3.3 Mayfield (CommSteel)
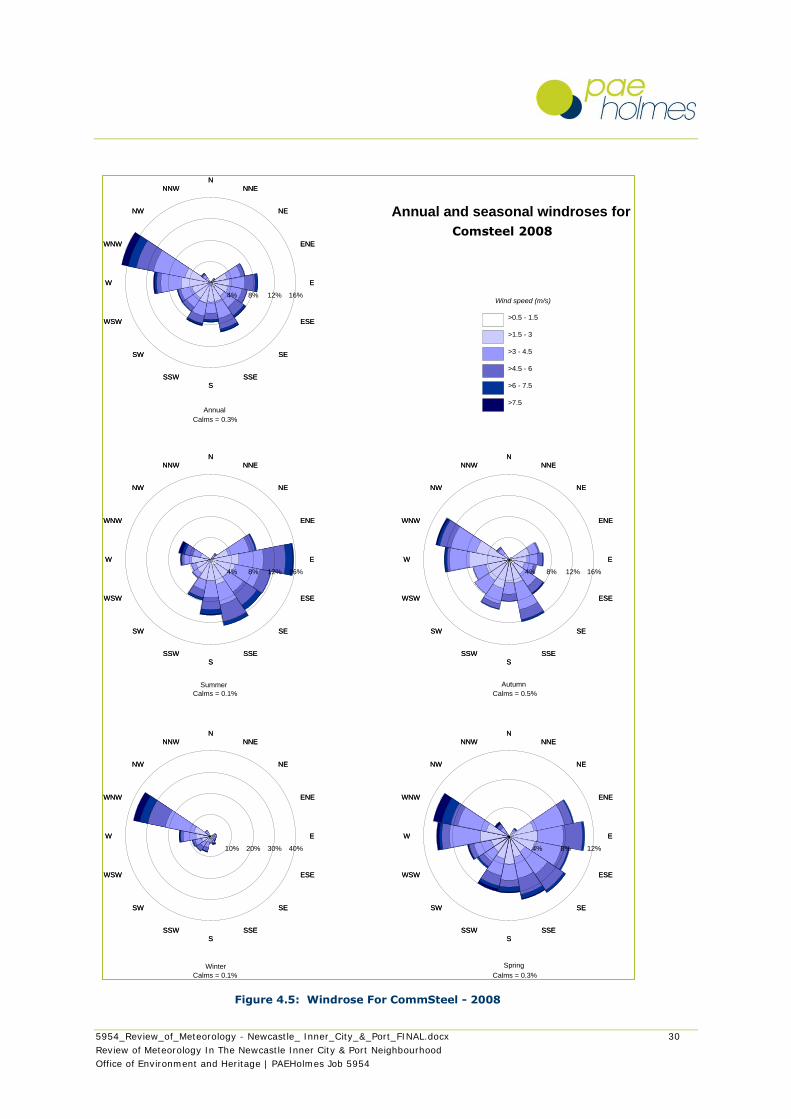
Windroses for the CommSteel site for 2008 (100% complete) are presented in Figure 4.5. On an
annual basis, prevailing winds are from the west-northwest. During summer winds from the east
through south-southeast are dominant while during winter winds from the west-northwest
dominate (significantly less sea breezes). Autumn and spring show a similar pattern to annual.
Calm are infrequent at 0.3% of the year.
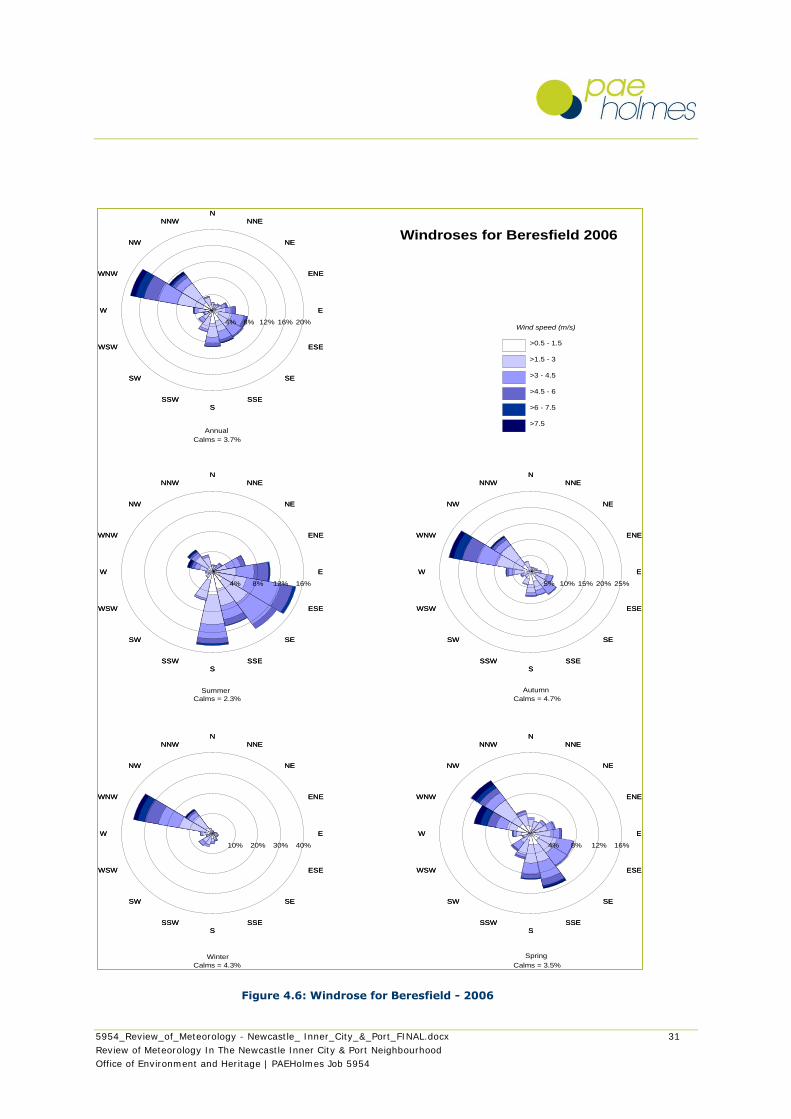
4.3.4 Beresfield (OEH)
Windroses for data collected at Beresfield during 2006 (100% complete) are presented in Figure
4.6. On an annual basis, prevailing winds are from the west-northwest. During summer winds
from the east through to south dominate while during winter winds from the west-northwest
dominate. Autumn and spring shows a similar pattern to annual. Calm conditions occur for 3.7%
of the year.
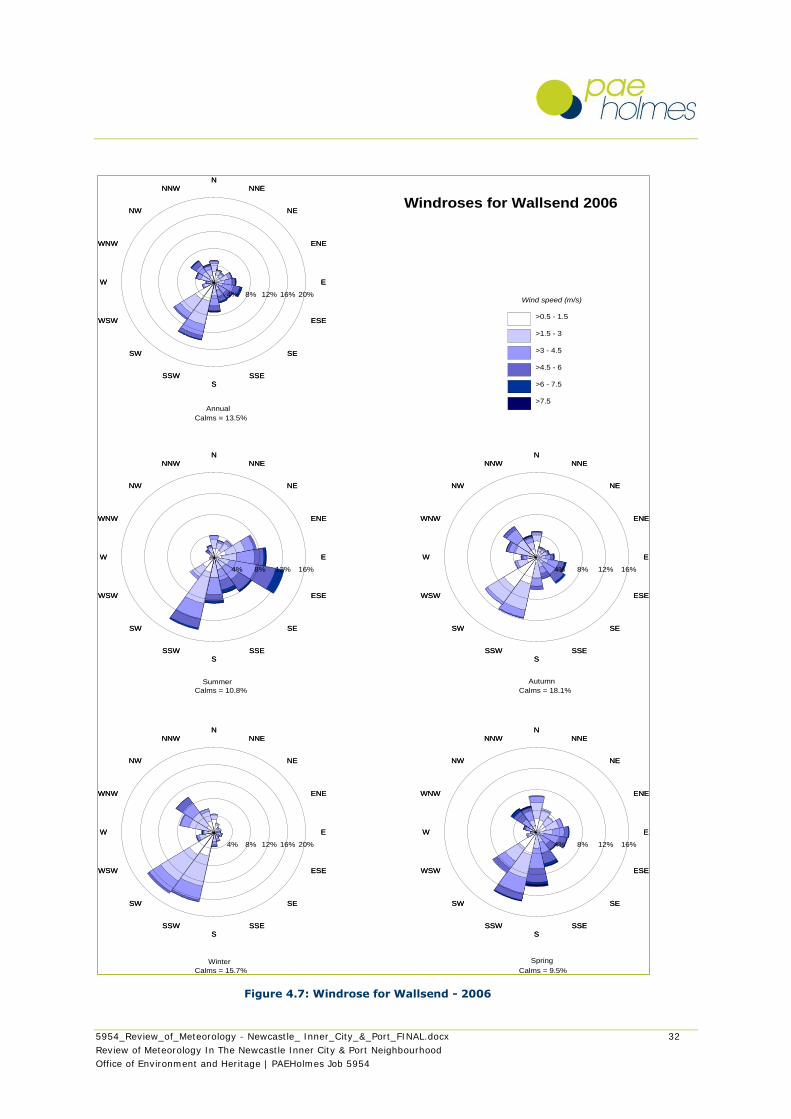
4.3.5 Wallsend (OEH)
Windroses for data collected at Wallsend during 2006 (96% complete) are presented in Figure
4.7. On an annual basis, prevailing winds are from the southwest and south-southwest. During
summer winds from the south-southwest and east-southeast dominate while during winter winds
are from the southwest and south-southwest. Autumn and spring shows a similar pattern to
annual. Calm conditions are more frequent occurring for 13.5% of the year. This is consistent
with a reduced influence of the land-sea interface on meteorology.
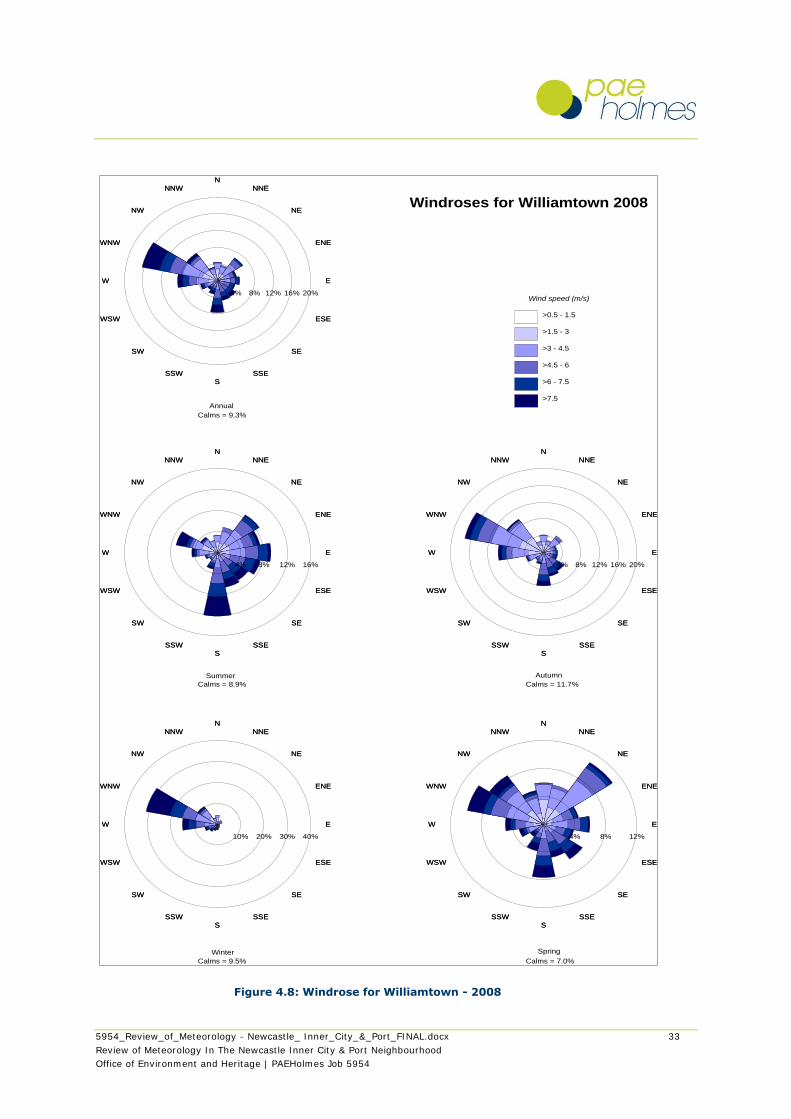
4.3.6 Williamstown RAAF (BoM)
Windroses for data collected at Williamtown RAAF for 2008 (99% complete) are presented in
Figure 4.8. On an annual basis, prevailing winds are from the west-northwest and winds are
stronger than at other sites. During summer winds from the northeast through to south dominate
while during winter winds from the west-northwest dominate. Autumn shows a similar pattern to
annual and spring displays winds from all directions. Calm conditions occur for 9.3% of the year.
4.4 Summary
In coastal areas meteorological conditions such as coastal fumigation and sea/land breeze re-
circulation can significantly affect the dispersion of pollutants. These meteorological conditions can
vary quickly in both time and space.
Analysis of meteorological data in Section 4 shows dominant onshore winds prevailing from the
east-northeast through to east-southeast. Offshore winds typically occur from the west and west-
northwest (further analysis provided in Section 7). Overall wind patterns show similarities across
all sites with clear seasonal changes evident in summer and winter.
Not directly evident in the wind roses are the common diurnal variations between offshore breezes
at night and the seabreezes that frequently occur during the afternoons in the warmer months.
Typically in coastal areas a sea breeze develops during the day as the air over the land warms
more quickly than the air over the sea. The development of lower pressure over land due to
warming results in an onshore breeze, with a return flow aloft. At night the opposite occurs and a
5954_Review_of_Meteorology - Newcastle_ Inner_City_&_Port_FINAL.docx 25
Review of Meteorology In The Newcastle Inner City & Port Neighbourhood
Office of Environment and Heritage | PAEHolmes Job 5954
land breeze develops, flowing towards the sea under an area of subsidence. Sea breezes are
generally strongest during the day in summer and land breezes strongest during winter nights.
This pattern is also reflected in the windroses presented in Section 4.
Coastal recirculation can have significant effect on air quality over urban areas, as it can return
pollutants (instead of removing them) to an area from which they were released earlier in the day,
increasing the background levels into which new emissions are released.
Further discussion on prevailing wind patterns across the study area, based on the outputs of
meteorological modelling, is provided in Section 7.
5954_Review_of_Meteorology - Newcastle_ Inner_City_&_Port_FINAL.docx 26
Review of Meteorology In The Newcastle Inner City & Port Neighbourhood
Office of Environment and Heritage | PAEHolmes Job 5954
Figure 4.1: Windrose for Newcastle - 2009
NN
NNENNE
NENE
ENEENE
EE
ESEESE
SESE
SSESSE
SS
SSWSSW
SWSW
WSWWSW
WW
WNWWNW
NWNW
NNWNNW
4% 8% 12% 16%
NN
NNENNE
NENE
ENEENE
EE
ESEESE
SESE
SSESSE
SS
SSWSSW
SWSW
WSWWSW
WW
WNWWNW
NWNW
NNWNNW
10% 20% 30% 40%
NN
NNENNE
NENE
ENEENE
EE
ESEESE
SESE
SSESSE
SS
SSWSSW
SWSW
WSWWSW
WW
WNWWNW
NWNW
NNWNNW
4% 8% 12% 16%
NN
NNENNE
NENE
ENEENE
EE
ESEESE
SESE
SSESSE
SS
SSWSSW
SWSW
WSWWSW
WW
WNWWNW
NWNW
NNWNNW
4% 8% 12% 16%
NN
NNENNE
NENE
ENEENE
EE
ESEESE
SESE
SSESSE
SS
SSWSSW
SWSW
WSWWSW
WW
WNWWNW
NWNW
NNWNNW
4% 8% 12% 16% 20%Wind speed (m/s)
>0.5 - 1.5
>1.5 - 3
>3 - 4.5
>4.5 - 6
>6 - 7.5
>7.5
Windroses for Newcastle 2009
SpringWinter
AutumnSummer
Annual
Calms = 7.5%
Calms = 5.1% Calms = 13.1%
Calms = 5.6% Calms = 6.0%
5954_Review_of_Meteorology - Newcastle_ Inner_City_&_Port_FINAL.docx 27
Review of Meteorology In The Newcastle Inner City & Port Neighbourhood
Office of Environment and Heritage | PAEHolmes Job 5954
Figure 4.2: Wind Rose for PWCS KCT - 2010
NN
NNENNE
NENE
ENEENE
EE
ESEESE
SESE
SSESSE
SS
SSWSSW
SWSW
WSWWSW
WW
WNWWNW
NWNW
NNWNNW
4% 8% 12% 16%
NN
NNENNE
NENE
ENEENE
EE
ESEESE
SESE
SSESSE
SS
SSWSSW
SWSW
WSWWSW
WW
WNWWNW
NWNW
NNWNNW
10% 20% 30% 40%
NN
NNENNE
NENE
ENEENE
EE
ESEESE
SESE
SSESSE
SS
SSWSSW
SWSW
WSWWSW
WW
WNWWNW
NWNW
NNWNNW
4% 8% 12% 16% 20%
NN
NNENNE
NENE
ENEENE
EE
ESEESE
SESE
SSESSE
SS
SSWSSW
SWSW
WSWWSW
WW
WNWWNW
NWNW
NNWNNW
4% 8% 12% 16%
NN
NNENNE
NENE
ENEENE
EE
ESEESE
SESE
SSESSE
SS
SSWSSW
SWSW
WSWWSW
WW
WNWWNW
NWNW
NNWNNW
4% 8% 12% 16% 20%Wind speed (m/s)
>0.5 - 1.5
>1.5 - 3
>3 - 4.5
>4.5 - 6
>6 - 7.5
>7.5
Windroses for PWCS KCT Station2010
SpringWinter
AutumnSummer
Annual
Calms = 4.0%
Calms = 2.8% Calms = 6.1%
Calms = 3.5% Calms = 3.8%
5954_Review_of_Meteorology - Newcastle_ Inner_City_&_Port_FINAL.docx 28
Review of Meteorology In The Newcastle Inner City & Port Neighbourhood
Office of Environment and Heritage | PAEHolmes Job 5954
Figure 4.3: Wind Rose for NCIG - 2010
NN
NNENNE
NENE
ENEENE
EE
ESEESE
SESE
SSESSE
SS
SSWSSW
SWSW
WSWWSW
WW
WNWWNW
NWNW
NNWNNW
4% 8% 12% 16%
NN
NNENNE
NENE
ENEENE
EE
ESEESE
SESE
SSESSE
SS
SSWSSW
SWSW
WSWWSW
WW
WNWWNW
NWNW
NNWNNW
10% 20% 30% 40%
NN
NNENNE
NENE
ENEENE
EE
ESEESE
SESE
SSESSE
SS
SSWSSW
SWSW
WSWWSW
WW
WNWWNW
NWNW
NNWNNW
5% 10% 15% 20% 25%
NN
NNENNE
NENE
ENEENE
EE
ESEESE
SESE
SSESSE
SS
SSWSSW
SWSW
WSWWSW
WW
WNWWNW
NWNW
NNWNNW
4% 8% 12% 16%
NN
NNENNE
NENE
ENEENE
EE
ESEESE
SESE
SSESSE
SS
SSWSSW
SWSW
WSWWSW
WW
WNWWNW
NWNW
NNWNNW
4% 8% 12% 16% 20%Wind speed (m/s)
>0.5 - 1.5
>1.5 - 3
>3 - 4.5
>4.5 - 6
>6 - 7.5
>7.5
Windroses for NCIG Kooragang Island 2010
SpringWinter
AutumnSummer
Annual
Calms = 8.1%
Calms = 16.3% Calms = 5.4%
Calms = 3.7% Calms = 7.0%
5954_Review_of_Meteorology - Newcastle_ Inner_City_&_Port_FINAL.docx 29
Review of Meteorology In The Newcastle Inner City & Port Neighbourhood
Office of Environment and Heritage | PAEHolmes Job 5954
Figure 4.4: Windrose for Orica - 2008
NN
NNENNE
NENE
ENEENE
EE
ESEESE
SESE
SSESSE
SS
SSWSSW
SWSW
WSWWSW
WW
WNWWNW
NWNW
NNWNNW
4% 8% 12% 16%
NN
NNENNE
NENE
ENEENE
EE
ESEESE
SESE
SSESSE
SS
SSWSSW
SWSW
WSWWSW
WW
WNWWNW
NWNW
NNWNNW
10% 20% 30% 40%
NN
NNENNE
NENE
ENEENE
EE
ESEESE
SESE
SSESSE
SS
SSWSSW
SWSW
WSWWSW
WW
WNWWNW
NWNW
NNWNNW
4% 8% 12% 16% 20%
NN
NNENNE
NENE
ENEENE
EE
ESEESE
SESE
SSESSE
SS
SSWSSW
SWSW
WSWWSW
WW
WNWWNW
NWNW
NNWNNW
4% 8% 12% 16%
NN
NNENNE
NENE
ENEENE
EE
ESEESE
SESE
SSESSE
SS
SSWSSW
SWSW
WSWWSW
WW
WNWWNW
NWNW
NNWNNW
4% 8% 12% 16% 20%Wind speed (m/s)
>0.5 - 1.5
>1.5 - 3
>3 - 4.5
>4.5 - 6
>6 - 7.5
>7.5
Windroses for Orica 2008
SpringWinter
AutumnSummer
Annual
Calms = 1.9%
Calms = 1.4% Calms = 2.9%
Calms = 2.0% Calms = 1.2%
5954_Review_of_Meteorology - Newcastle_ Inner_City_&_Port_FINAL.docx 30
Review of Meteorology In The Newcastle Inner City & Port Neighbourhood
Office of Environment and Heritage | PAEHolmes Job 5954
Figure 4.5: Windrose For CommSteel - 2008
NN
NNENNE
NENE
ENEENE
EE
ESEESE
SESE
SSESSE
SS
SSWSSW
SWSW
WSWWSW
WW
WNWWNW
NWNW
NNWNNW
4% 8% 12%
NN
NNENNE
NENE
ENEENE
EE
ESEESE
SESE
SSESSE
SS
SSWSSW
SWSW
WSWWSW
WW
WNWWNW
NWNW
NNWNNW
10% 20% 30% 40%
NN
NNENNE
NENE
ENEENE
EE
ESEESE
SESE
SSESSE
SS
SSWSSW
SWSW
WSWWSW
WW
WNWWNW
NWNW
NNWNNW
4% 8% 12% 16%
NN
NNENNE
NENE
ENEENE
EE
ESEESE
SESE
SSESSE
SS
SSWSSW
SWSW
WSWWSW
WW
WNWWNW
NWNW
NNWNNW
4% 8% 12% 16%
NN
NNENNE
NENE
ENEENE
EE
ESEESE
SESE
SSESSE
SS
SSWSSW
SWSW
WSWWSW
WW
WNWWNW
NWNW
NNWNNW
4% 8% 12% 16%Wind speed (m/s)
>0.5 - 1.5
>1.5 - 3
>3 - 4.5
>4.5 - 6
>6 - 7.5
>7.5
Annual and seasonal windroses for
Comsteel (2008)
SpringWinter
AutumnSummer
Annual
Calms = 0.3%
Calms = 0.1% Calms = 0.5%
Calms = 0.1% Calms = 0.3%
Comsteel 2008
5954_Review_of_Meteorology - Newcastle_ Inner_City_&_Port_FINAL.docx 31
Review of Meteorology In The Newcastle Inner City & Port Neighbourhood
Office of Environment and Heritage | PAEHolmes Job 5954
Figure 4.6: Windrose for Beresfield - 2006
NN
NNENNE
NENE
ENEENE
EE
ESEESE
SESE
SSESSE
SS
SSWSSW
SWSW
WSWWSW
WW
WNWWNW
NWNW
NNWNNW
4% 8% 12% 16%
NN
NNENNE
NENE
ENEENE
EE
ESEESE
SESE
SSESSE
SS
SSWSSW
SWSW
WSWWSW
WW
WNWWNW
NWNW
NNWNNW
10% 20% 30% 40%
NN
NNENNE
NENE
ENEENE
EE
ESEESE
SESE
SSESSE
SS
SSWSSW
SWSW
WSWWSW
WW
WNWWNW
NWNW
NNWNNW
5% 10% 15% 20% 25%
NN
NNENNE
NENE
ENEENE
EE
ESEESE
SESE
SSESSE
SS
SSWSSW
SWSW
WSWWSW
WW
WNWWNW
NWNW
NNWNNW
4% 8% 12% 16%
NN
NNENNE
NENE
ENEENE
EE
ESEESE
SESE
SSESSE
SS
SSWSSW
SWSW
WSWWSW
WW
WNWWNW
NWNW
NNWNNW
4% 8% 12% 16% 20%Wind speed (m/s)
>0.5 - 1.5
>1.5 - 3
>3 - 4.5
>4.5 - 6
>6 - 7.5
>7.5
Windroses for Beresfield 2006
SpringWinter
AutumnSummer
Annual
Calms = 3.7%
Calms = 2.3% Calms = 4.7%
Calms = 4.3% Calms = 3.5%
5954_Review_of_Meteorology - Newcastle_ Inner_City_&_Port_FINAL.docx 32
Review of Meteorology In The Newcastle Inner City & Port Neighbourhood
Office of Environment and Heritage | PAEHolmes Job 5954
Figure 4.7: Windrose for Wallsend - 2006
NN
NNENNE
NENE
ENEENE
EE
ESEESE
SESE
SSESSE
SS
SSWSSW
SWSW
WSWWSW
WW
WNWWNW
NWNW
NNWNNW
4% 8% 12% 16%
NN
NNENNE
NENE
ENEENE
EE
ESEESE
SESE
SSESSE
SS
SSWSSW
SWSW
WSWWSW
WW
WNWWNW
NWNW
NNWNNW
4% 8% 12% 16% 20%
NN
NNENNE
NENE
ENEENE
EE
ESEESE
SESE
SSESSE
SS
SSWSSW
SWSW
WSWWSW
WW
WNWWNW
NWNW
NNWNNW
4% 8% 12% 16%
NN
NNENNE
NENE
ENEENE
EE
ESEESE
SESE
SSESSE
SS
SSWSSW
SWSW
WSWWSW
WW
WNWWNW
NWNW
NNWNNW
4% 8% 12% 16%
NN
NNENNE
NENE
ENEENE
EE
ESEESE
SESE
SSESSE
SS
SSWSSW
SWSW
WSWWSW
WW
WNWWNW
NWNW
NNWNNW
4% 8% 12% 16% 20%Wind speed (m/s)
>0.5 - 1.5
>1.5 - 3
>3 - 4.5
>4.5 - 6
>6 - 7.5
>7.5
Windroses for Wallsend 2006
SpringWinter
AutumnSummer
Annual
Calms = 13.5%
Calms = 10.8% Calms = 18.1%
Calms = 15.7% Calms = 9.5%
5954_Review_of_Meteorology - Newcastle_ Inner_City_&_Port_FINAL.docx 33
Review of Meteorology In The Newcastle Inner City & Port Neighbourhood
Office of Environment and Heritage | PAEHolmes Job 5954
Figure 4.8: Windrose for Williamtown - 2008
NN
NNENNE
NENE
ENEENE
EE
ESEESE
SESE
SSESSE
SS
SSWSSW
SWSW
WSWWSW
WW
WNWWNW
NWNW
NNWNNW
4% 8% 12%
NN
NNENNE
NENE
ENEENE
EE
ESEESE
SESE
SSESSE
SS
SSWSSW
SWSW
WSWWSW
WW
WNWWNW
NWNW
NNWNNW
10% 20% 30% 40%
NN
NNENNE
NENE
ENEENE
EE
ESEESE
SESE
SSESSE
SS
SSWSSW
SWSW
WSWWSW
WW
WNWWNW
NWNW
NNWNNW
4% 8% 12% 16% 20%
NN
NNENNE
NENE
ENEENE
EE
ESEESE
SESE
SSESSE
SS
SSWSSW
SWSW
WSWWSW
WW
WNWWNW
NWNW
NNWNNW
4% 8% 12% 16%
NN
NNENNE
NENE
ENEENE
EE
ESEESE
SESE
SSESSE
SS
SSWSSW
SWSW
WSWWSW
WW
WNWWNW
NWNW
NNWNNW
4% 8% 12% 16% 20%Wind speed (m/s)
>0.5 - 1.5
>1.5 - 3
>3 - 4.5
>4.5 - 6
>6 - 7.5
>7.5
Windroses for Williamtown 2008
SpringWinter
AutumnSummer
Annual
Calms = 9.3%
Calms = 8.9% Calms = 11.7%
Calms = 9.5% Calms = 7.0%
5954_Review_of_Meteorology - Newcastle_ Inner_City_&_Port_FINAL.docx 34
Review of Meteorology In The Newcastle Inner City & Port Neighbourhood
Office of Environment and Heritage | PAEHolmes Job 5954
5 AMBIENT AIR QUALITY
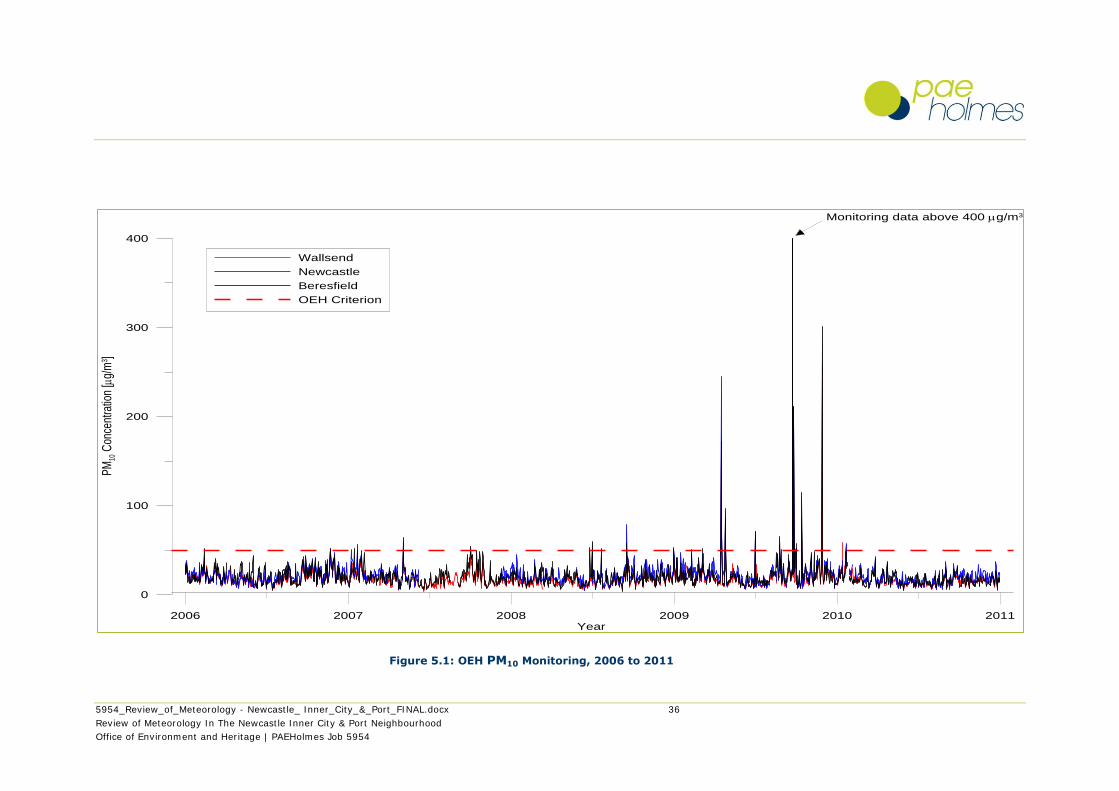
The OEH collects continuous ambient PM10 monitoring data at Newcastle, Wallsend and Beresfield,
using a Tapered Element Oscillating Microbalance (TEOM). 24-hour PM10 concentrations from the
OEH sites from 2006 to 2010 are presented in Figure 5.1.
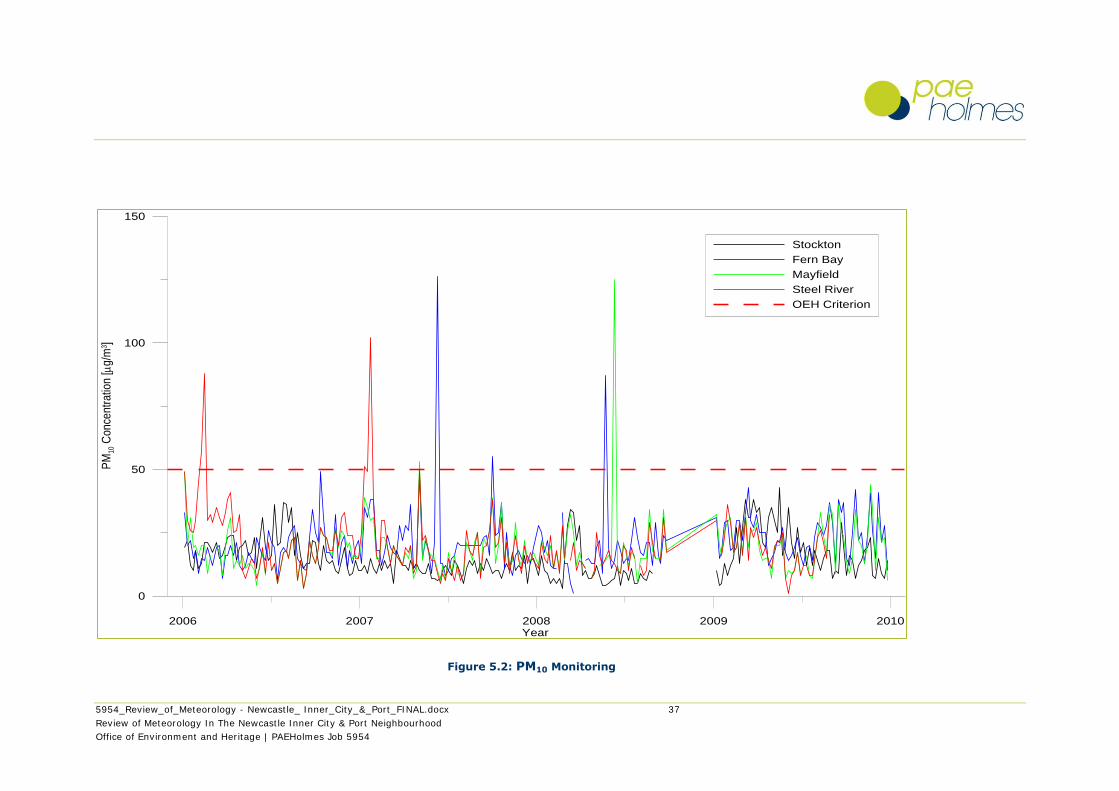
Newcastle Council operates four High Volume Air Samplers (HVAS) which collect 24-hour PM10 data
at Stockton, Mayfield, Steel River and Fern Bay every sixth day. Council data from 2006 to 2009
are presented in Figure 5.2.
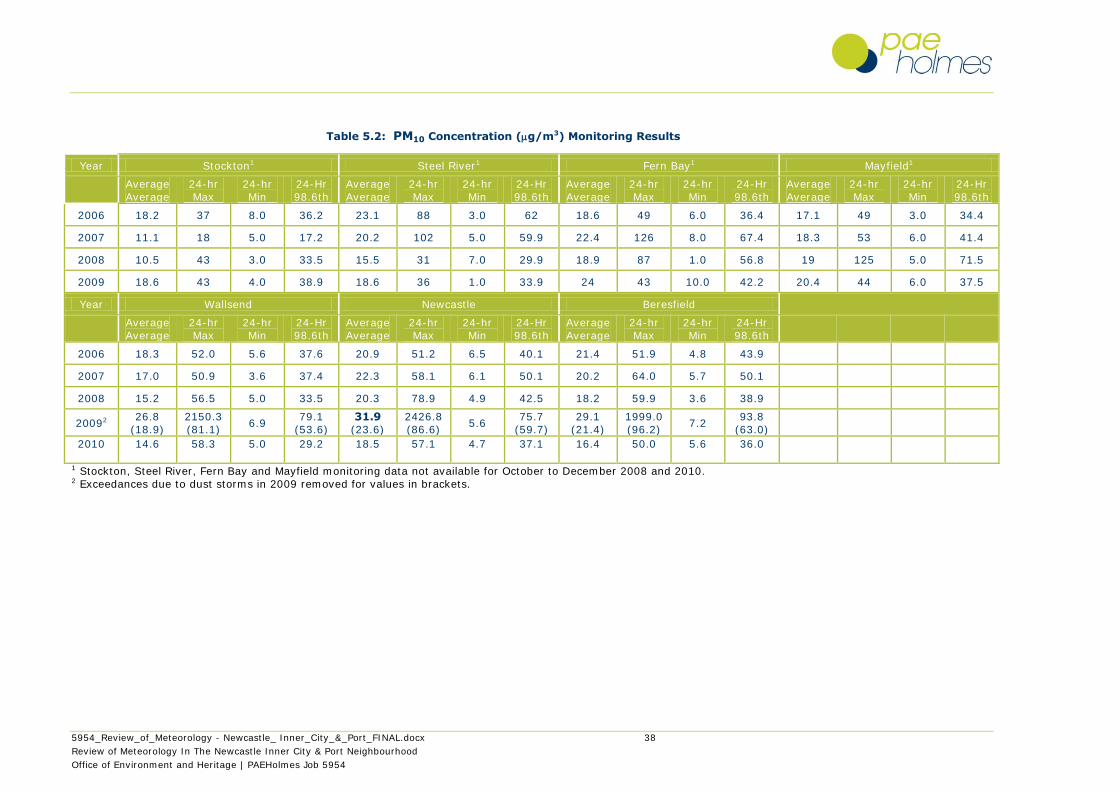
Statistical measures for all the data are presented in Table 5.2 and summarised below.
Annual average PM10 concentrations across all sites are consistently below the ambient air
impact assessment criteria of 30 µg/m3. Overall, annual average PM10 concentrations for the
region are of the order of 19 µg/m3 (with data recorded during significant regional dust storms
in 2009 excluded), which represents just over 60% of the ambient air quality criteria;
The highest annual average PM10 concentration recorded during 2006 was at Steel River
(23.1 µg/m3), followed by Beresfield (21.4 µg/m3) and Newcastle (20.9 µg/m3).
The highest annual average PM10 concentrations recorded during 2007 were at Fern Bay
(22.4 µg/m3) and Newcastle (22.3 µg/m3).
The highest annual average PM10 concentration recorded during 2008 was at Newcastle
(20.3 µg/m3).
The highest annual average PM10 concentration recorded during 2009 was at Fern Bay
(24 µg/m3) and Newcastle (24 µg/m3 – excludes dust storm peaks).
The highest annual average PM10 concentration recorded during 2010 was at Newcastle
(18.5 µg/m3).
It is noted that, due to differences in monitoring technique, a direct comparison between
continuous TEOM data and one-day-in-six HVAS cannot be made.
There are significant daily variations in 24-hour PM10 concentrations across each year and across
each monitoring site and the number of days when the 24-hour PM10 concentration is above the
impact assessment criteria of 50 µg/m3 is presented in Table 5.1. The highest PM10
concentrations are recorded during 2009 and the number of days above the criteria is also
significantly higher in 2009. Experience shows that the worst-case 24-hour PM10 concentrations
are strongly influenced by regional events such as bushfires and dust storms. These events
dominate the worst-case PM10 concentrations, particularly those recorded during 2009.
The most significant of these occurred on 23 September 2009 when 24-hour PM10 concentrations
were some of the highest ever recorded in NSW, with concentrations over 1000 µg/m3 recorded
across much of NSW. The dates of other regional dust storms that are known to have impacted
dust concentrations in NSW include the 15 and 16 April 2009, 26 September 2009 and 28 and 29
November 2009.
For all years other than 2009, the 24-hour PM10 concentrations satisfy with the allowable 5 days
over the criteria specified by the Ambient Air National Environment Protection Measure (NEPM) for
24-hour PM10.

5954_Review_of_Meteorology - Newcastle_ Inner_City_&_Port_FINAL.docx 35
Review of Meteorology In The Newcastle Inner City & Port Neighbourhood
Office of Environment and Heritage | PAEHolmes Job 5954
Table 5.1: Number of Days over the 24-hour PM10 Criteria
Year Wallsend Newcastle Beresfield Stockton Steel River Fern Bay Mayfield
2006 1 1 2 0 2 0 0
2007 2 3 5 0 2 2 1
2008 1 3 5 0 0 1 1
2009 10 13 15 0 0 0 0
2010 1 1 0 n/a n/a n/a n/a
5954_Review_of_Meteorology - Newcastle_ Inner_City_&_Port_FINAL.docx 36
Review of Meteorology In The Newcastle Inner City & Port Neighbourhood
Office of Environment and Heritage | PAEHolmes Job 5954
Figure 5.1: OEH PM10 Monitoring, 2006 to 2011
2006 2007 2008 2009 2010 2011Year
0
100
200
300
400
PM
10 C
once
ntra
tion
[g/
m3 ]
Wallsend
Newcastle
Beresfield
OEH Criterion
Monitoring data above 400 g/m3
5954_Review_of_Meteorology - Newcastle_ Inner_City_&_Port_FINAL.docx 37
Review of Meteorology In The Newcastle Inner City & Port Neighbourhood
Office of Environment and Heritage | PAEHolmes Job 5954
Figure 5.2: PM10 Monitoring
2006 2007 2008 2009 2010Year
0
50
100
150
PM
10 C
once
ntra
tion
[
g/m
3]
Stockton
Fern Bay
Mayfield
Steel River
OEH Criterion
5954_Review_of_Meteorology - Newcastle_ Inner_City_&_Port_FINAL.docx 38
Review of Meteorology In The Newcastle Inner City & Port Neighbourhood
Office of Environment and Heritage | PAEHolmes Job 5954
Table 5.2: PM10 Concentration (g/m3) Monitoring Results
Year Stockton1 Steel River1 Fern Bay1 Mayfield1
Average Average
24-hr Max
24-hr Min
24-Hr 98.6th
Average Average
24-hr Max
24-hr Min
24-Hr 98.6th
Average Average
24-hr Max
24-hr Min
24-Hr 98.6th
Average Average
24-hr Max
24-hr Min
24-Hr 98.6th
2006 18.2 37 8.0 36.2 23.1 88 3.0 62 18.6 49 6.0 36.4 17.1 49 3.0 34.4
2007 11.1 18 5.0 17.2 20.2 102 5.0 59.9 22.4 126 8.0 67.4 18.3 53 6.0 41.4
2008 10.5 43 3.0 33.5 15.5 31 7.0 29.9 18.9 87 1.0 56.8 19 125 5.0 71.5
2009 18.6 43 4.0 38.9 18.6 36 1.0 33.9 24 43 10.0 42.2 20.4 44 6.0 37.5
Year Wallsend Newcastle Beresfield
Average Average
24-hr Max
24-hr Min
24-Hr 98.6th
Average Average
24-hr Max
24-hr Min
24-Hr 98.6th
Average Average
24-hr Max
24-hr Min
24-Hr 98.6th
2006 18.3 52.0 5.6 37.6 20.9 51.2 6.5 40.1 21.4 51.9 4.8 43.9
2007 17.0 50.9 3.6 37.4 22.3 58.1 6.1 50.1 20.2 64.0 5.7 50.1
2008 15.2 56.5 5.0 33.5 20.3 78.9 4.9 42.5 18.2 59.9 3.6 38.9
20092 26.8
(18.9) 2150.3 (81.1)
6.9 79.1
(53.6) 31.9 (23.6)
2426.8 (86.6)
5.6 75.7
(59.7) 29.1
(21.4) 1999.0 (96.2)
7.2 93.8
(63.0)
2010 14.6 58.3 5.0 29.2 18.5 57.1 4.7 37.1 16.4 50.0 5.6 36.0
1 Stockton, Steel River, Fern Bay and Mayfield monitoring data not available for October to December 2008 and 2010. 2 Exceedances due to dust storms in 2009 removed for values in brackets.
5954_Review_of_Meteorology - Newcastle_ Inner_City_&_Port_FINAL.docx 39
Review of Meteorology In The Newcastle Inner City & Port Neighbourhood
Office of Environment and Heritage | PAEHolmes Job 5954
6 METEOROLOGICAL MODELLING OVERVIEW
The local meteorology was modelled using a combination of the TAPM and CALMET models.
Prognostic output from TAPM, plus observational weather station data was entered into CALMET,
a meteorological pre-processor endorsed by the US EPA and recommended by the NSW OEH for
use in non-steady state conditions.
From this, a 5-year representative meteorological dataset suitable for use in the 3-dimensional
plume dispersion model, CALPUFF, was compiled. Details on the model configuration and data
inputs are provided in the following sections.
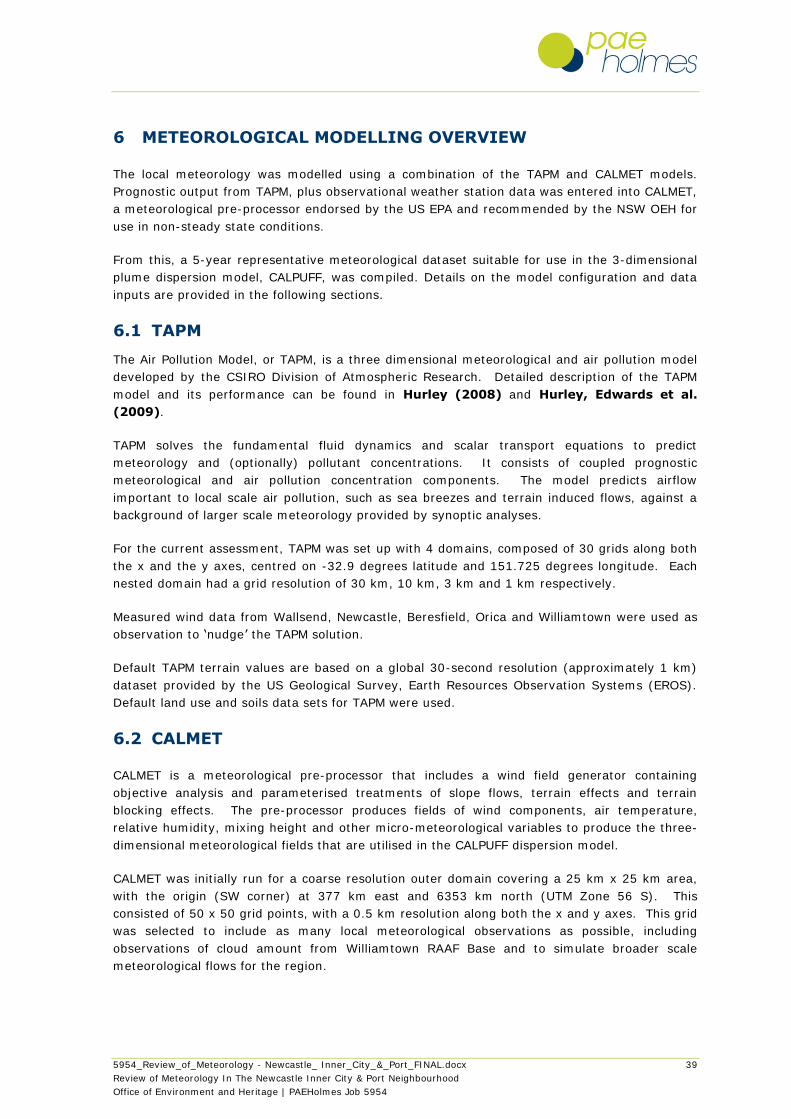
6.1 TAPM
The Air Pollution Model, or TAPM, is a three dimensional meteorological and air pollution model
developed by the CSIRO Division of Atmospheric Research. Detailed description of the TAPM
model and its performance can be found in Hurley (2008) and Hurley, Edwards et al.
(2009).
TAPM solves the fundamental fluid dynamics and scalar transport equations to predict
meteorology and (optionally) pollutant concentrations. It consists of coupled prognostic
meteorological and air pollution concentration components. The model predicts airflow
important to local scale air pollution, such as sea breezes and terrain induced flows, against a
background of larger scale meteorology provided by synoptic analyses.
For the current assessment, TAPM was set up with 4 domains, composed of 30 grids along both
the x and the y axes, centred on -32.9 degrees latitude and 151.725 degrees longitude. Each
nested domain had a grid resolution of 30 km, 10 km, 3 km and 1 km respectively.
Measured wind data from Wallsend, Newcastle, Beresfield, Orica and Williamtown were used as
observation to „nudge‟ the TAPM solution.
Default TAPM terrain values are based on a global 30-second resolution (approximately 1 km)
dataset provided by the US Geological Survey, Earth Resources Observation Systems (EROS).
Default land use and soils data sets for TAPM were used.
6.2 CALMET
CALMET is a meteorological pre-processor that includes a wind field generator containing
objective analysis and parameterised treatments of slope flows, terrain effects and terrain
blocking effects. The pre-processor produces fields of wind components, air temperature,
relative humidity, mixing height and other micro-meteorological variables to produce the three-
dimensional meteorological fields that are utilised in the CALPUFF dispersion model.
CALMET was initially run for a coarse resolution outer domain covering a 25 km x 25 km area,
with the origin (SW corner) at 377 km east and 6353 km north (UTM Zone 56 S). This
consisted of 50 x 50 grid points, with a 0.5 km resolution along both the x and y axes. This grid
was selected to include as many local meteorological observations as possible, including
observations of cloud amount from Williamtown RAAF Base and to simulate broader scale
meteorological flows for the region.
5954_Review_of_Meteorology - Newcastle_ Inner_City_&_Port_FINAL.docx 40
Review of Meteorology In The Newcastle Inner City & Port Neighbourhood
Office of Environment and Heritage | PAEHolmes Job 5954
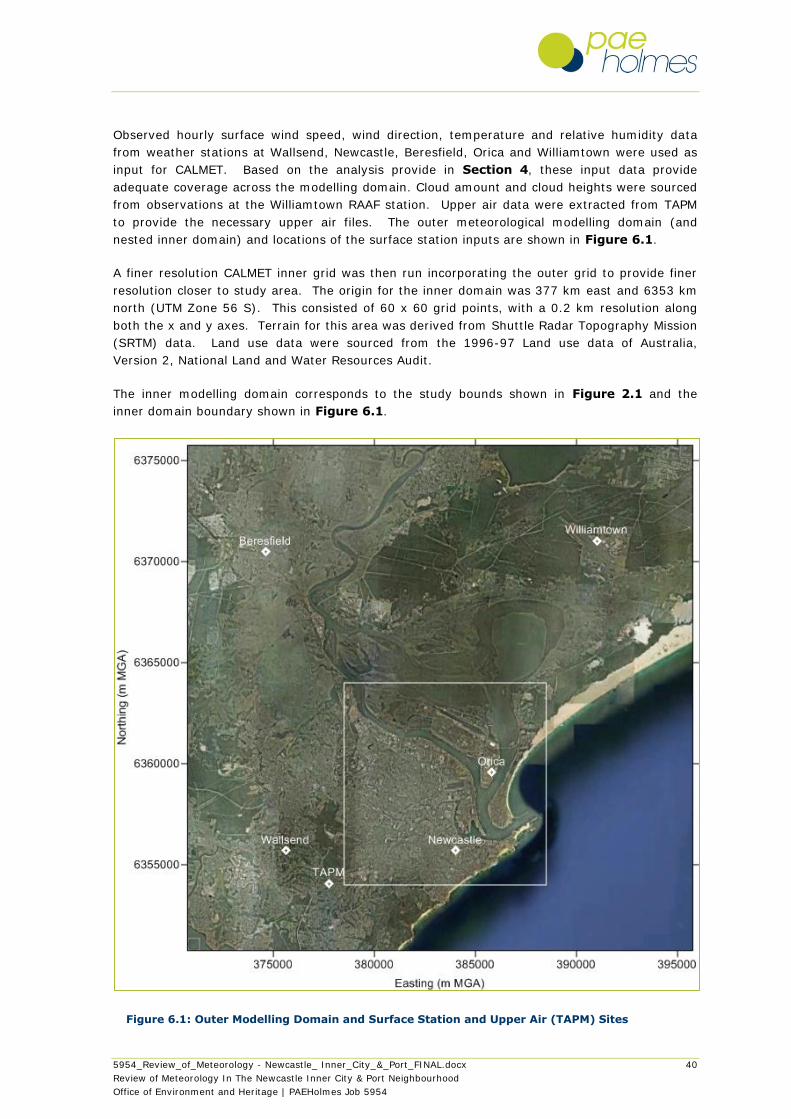
Observed hourly surface wind speed, wind direction, temperature and relative humidity data
from weather stations at Wallsend, Newcastle, Beresfield, Orica and Williamtown were used as
input for CALMET. Based on the analysis provide in Section 4, these input data provide
adequate coverage across the modelling domain. Cloud amount and cloud heights were sourced
from observations at the Williamtown RAAF station. Upper air data were extracted from TAPM
to provide the necessary upper air files. The outer meteorological modelling domain (and
nested inner domain) and locations of the surface station inputs are shown in Figure 6.1.
A finer resolution CALMET inner grid was then run incorporating the outer grid to provide finer
resolution closer to study area. The origin for the inner domain was 377 km east and 6353 km
north (UTM Zone 56 S). This consisted of 60 x 60 grid points, with a 0.2 km resolution along
both the x and y axes. Terrain for this area was derived from Shuttle Radar Topography Mission
(SRTM) data. Land use data were sourced from the 1996-97 Land use data of Australia,
Version 2, National Land and Water Resources Audit.
The inner modelling domain corresponds to the study bounds shown in Figure 2.1 and the
inner domain boundary shown in Figure 6.1.
Figure 6.1: Outer Modelling Domain and Surface Station and Upper Air (TAPM) Sites
5954_Review_of_Meteorology - Newcastle_ Inner_City_&_Port_FINAL.docx 41
Review of Meteorology In The Newcastle Inner City & Port Neighbourhood
Office of Environment and Heritage | PAEHolmes Job 5954
7 ANALYSIS OF DISPERSION METEOROLOGY
7.1 CALMET Predicted Prevailing Wind Conditions
Snapshots of the 2-dimensional meteorology can be extracted from CALMET at any point across
the modelling domain and can be used to describe the prevailing wind conditions (and other
parameters such as mixing height, temperature and atmospheric stability) for any point on the
grid.
The locations chosen for further analysis of meteorological conditions were selected to better
understand how conditions may vary across the study area, in particular at different distances
from the coast and at the areas of interest to this study. To allow a comparison with the actual
measured parameters (described in Section 4.3), some of the CALMET extract points also
correspond to areas where there is an existing meteorological monitoring station.
Data was extracted from CALMET at the following locations:
Newcastle (at the location of the OEH monitoring site) located at 2 km from the coast;
Islington located approximately 4 km from the coast and corresponding to one of the areas
of interest. Can be broadly compared to the PWCS monitoring site at Carrington;
Warabrook located 7 km from the coast and corresponding to one of the areas of interest.
Can be broadly compared to the Commsteel monitoring site;
Fern Bay located to the northeast of the study area approximately 2 km from the coast; and
Overwater site located approximately 2 km off the coast of Newcastle.
CALMET data has not been extracted for the Mayfield area, however these data are comparable
to the data extracted for Islington. A summary of the annual wind behaviour predicted from
CALMET is presented in Figure 7.1 to Figure 7.3. Seasonal windroses are presented in
Appendix C.
The windroses show similar general patterns across all locations with onshore winds prevailing
from the east-northeast through to east-southeast and offshore winds from the west and west-
northwest. This pattern is reflected at all distances from the coast.
There is also a similar pattern across all the modelled years, with the exception of 2006 which
shows a slightly different pattern across all sites; however the same general dominant flows are
evident.
There is also a slight shift in the dominant flows predicted for Newcastle in 2009 and 2010. This
is as a result of the measured data from the OEH monitoring site being incorporated into the
modelling for these years. In CALMET, observations from surface station inputs are used twice,
in the generation of the initial guess field and then in a more formal way within the Step 1 wind
field to produce the final wind field. The radius of influence for these observations depends on
the settings given in CALMET, in this case 200m. Therefore, the measured data at Newcastle
will have greater influence on the final wind field within this radius of influence for the years
2009 and 2010.

5954_Review_of_Meteorology - Newcastle_ Inner_City_&_Port_FINAL.docx 42
Review of Meteorology In The Newcastle Inner City & Port Neighbourhood
Office of Environment and Heritage | PAEHolmes Job 5954
It is clear from the windrose plots presented in Figure 7.1 to Figure 7.3 that without
observational input, CALMET predicts flows from the west and west-northwest. When
observational data is introduced (2009 and 2010) these flows shift to the northwest. Due to the
gaps in data available for the Newcastle OEH sites it is not clear if this slight shift in wind
direction is reflected across all years. It is noted however that the wind flow patterns predicted
by CALMET for other years is similar to the observational data for other sites (PWCS, Orica,
CommSteel).
Based on the similarities across each modelled year and the dominant prevailing flows, further
analysis is limited to two of the sites (Newcastle and Warabrook) and for just one of the
modelled years (2008).
Figure 7.4 presents annual windroses for each CALMET extract site overlain on a map of the
study area.
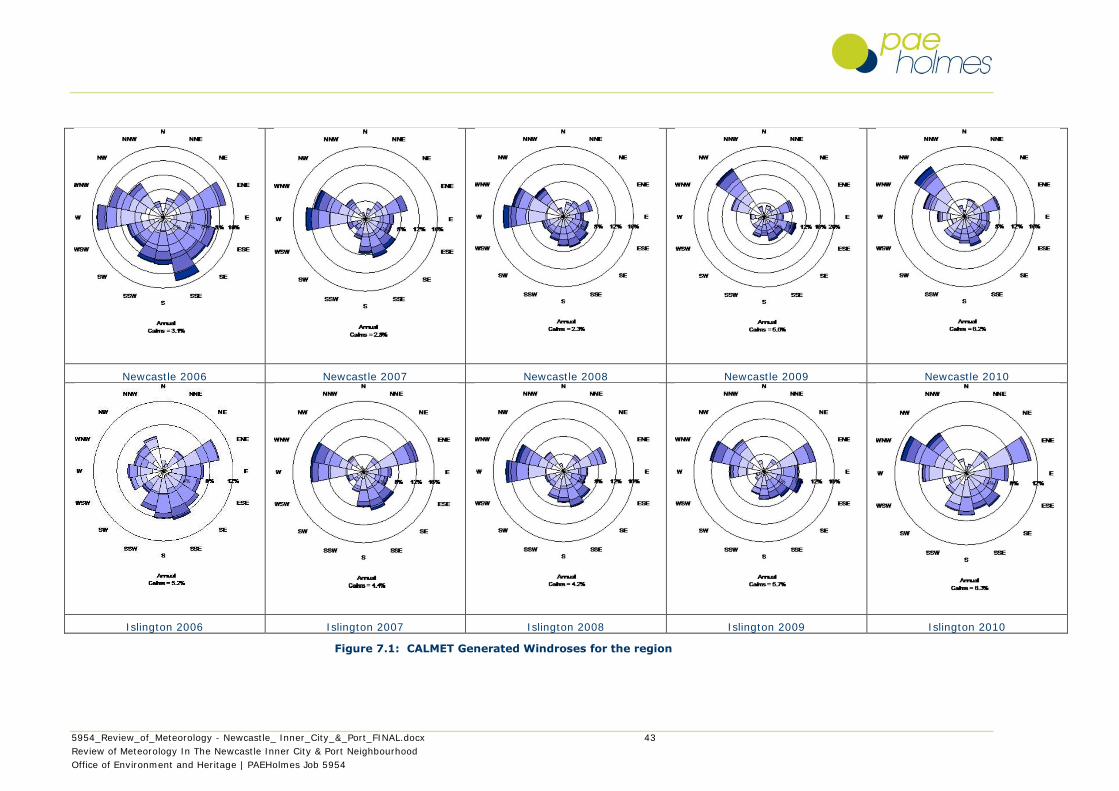
5954_Review_of_Meteorology - Newcastle_ Inner_City_&_Port_FINAL.docx 43
Review of Meteorology In The Newcastle Inner City & Port Neighbourhood
Office of Environment and Heritage | PAEHolmes Job 5954
Newcastle 2006 Newcastle 2007 Newcastle 2008 Newcastle 2009 Newcastle 2010
Islington 2006 Islington 2007 Islington 2008 Islington 2009 Islington 2010
Figure 7.1: CALMET Generated Windroses for the region
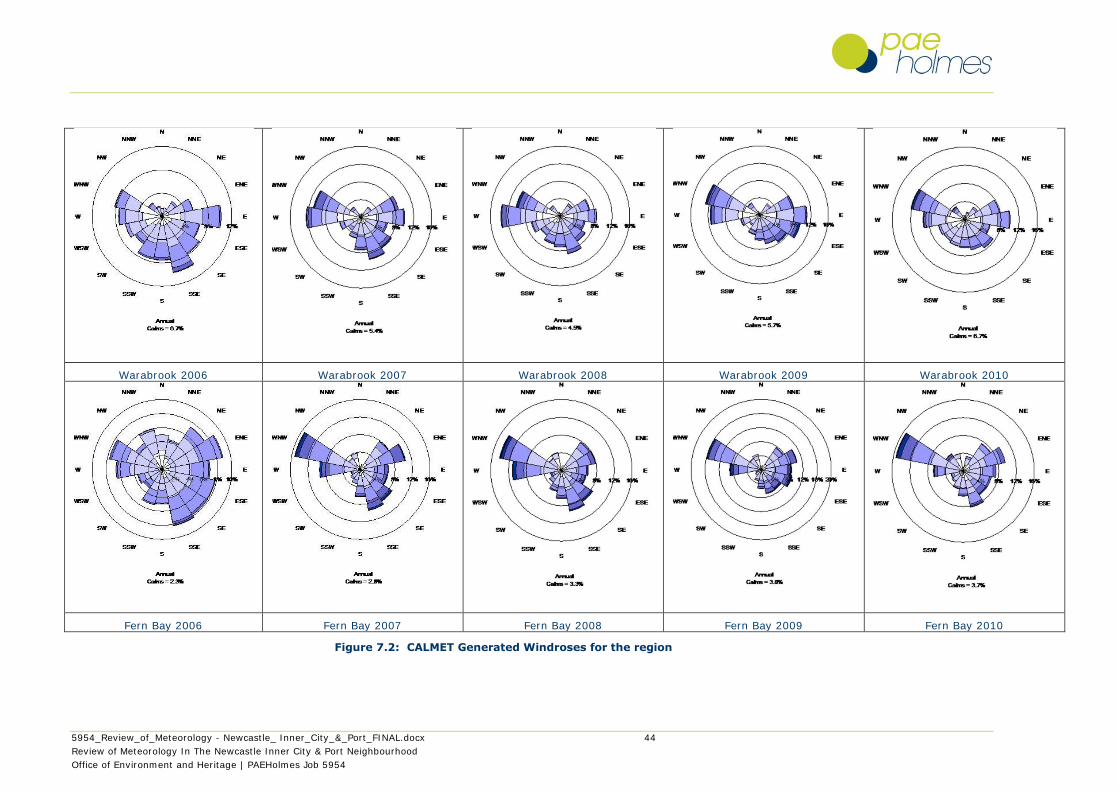
5954_Review_of_Meteorology - Newcastle_ Inner_City_&_Port_FINAL.docx 44
Review of Meteorology In The Newcastle Inner City & Port Neighbourhood
Office of Environment and Heritage | PAEHolmes Job 5954
Warabrook 2006 Warabrook 2007 Warabrook 2008 Warabrook 2009 Warabrook 2010
Fern Bay 2006 Fern Bay 2007 Fern Bay 2008 Fern Bay 2009 Fern Bay 2010
Figure 7.2: CALMET Generated Windroses for the region
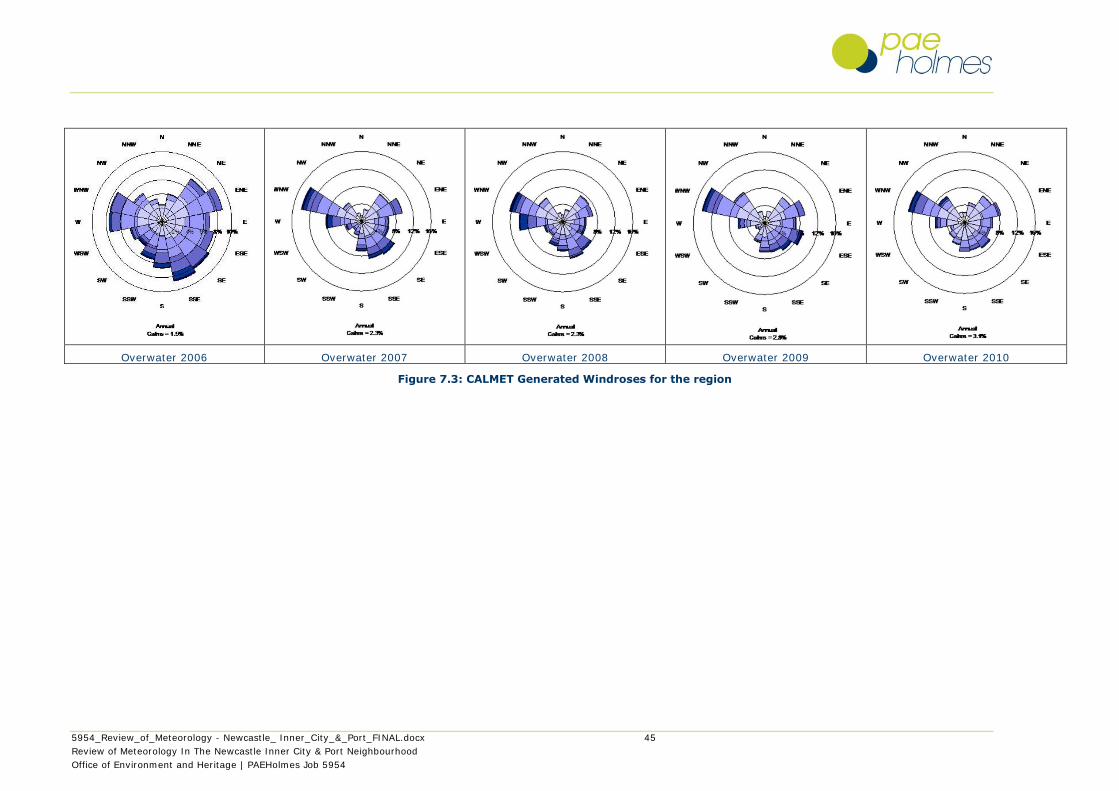
5954_Review_of_Meteorology - Newcastle_ Inner_City_&_Port_FINAL.docx 45
Review of Meteorology In The Newcastle Inner City & Port Neighbourhood
Office of Environment and Heritage | PAEHolmes Job 5954
Overwater 2006 Overwater 2007 Overwater 2008 Overwater 2009 Overwater 2010
Figure 7.3: CALMET Generated Windroses for the region
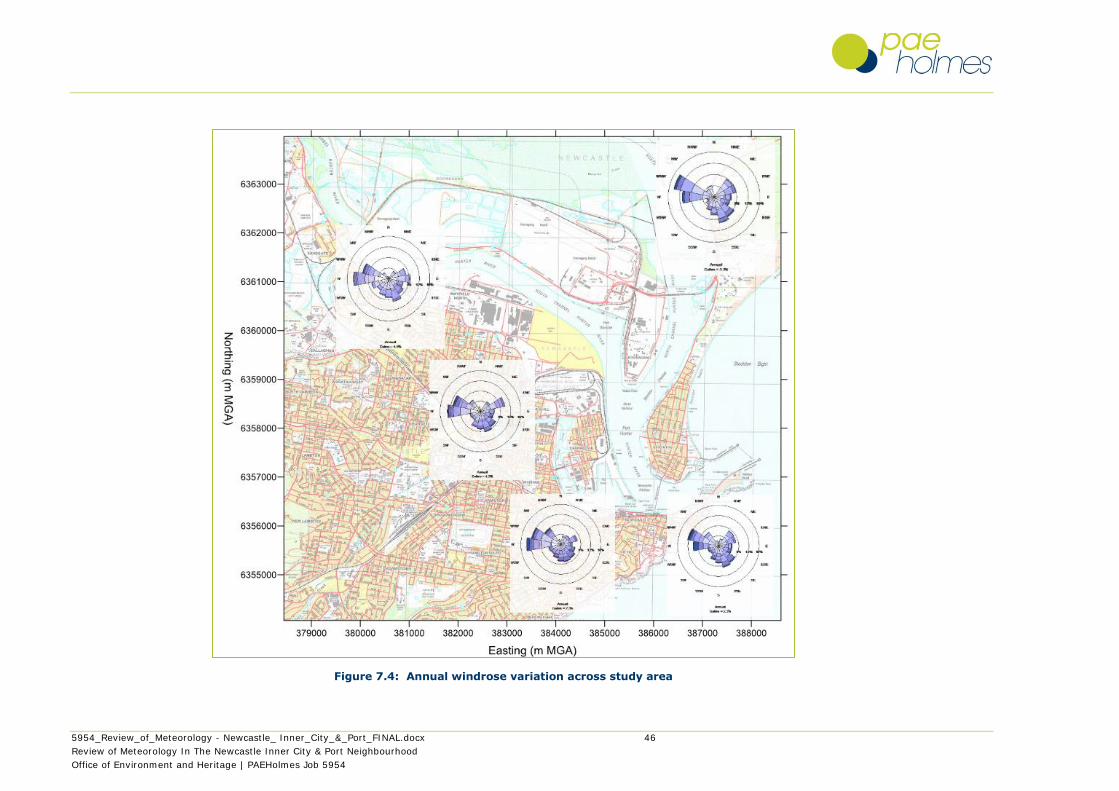
5954_Review_of_Meteorology - Newcastle_ Inner_City_&_Port_FINAL.docx 46
Review of Meteorology In The Newcastle Inner City & Port Neighbourhood
Office of Environment and Heritage | PAEHolmes Job 5954
Figure 7.4: Annual windrose variation across study area
5954_Review_of_Meteorology - Newcastle_ Inner_City_&_Port_FINAL.docx 47
Review of Meteorology In The Newcastle Inner City & Port Neighbourhood
Office of Environment and Heritage | PAEHolmes Job 5954
An analysis of the morning and afternoon land and sea breezes for 2008 extracted from CALMET
at the Newcastle site is shown in Figure 7.5. The annual windrose for morning shows a clear
land breeze whereas in the afternoon there is a shift to a sea breeze with stronger winds and
less calm conditions.
Figure 7.6 shows the frequency of wind speeds at Newcastle and Warabrook for CALMET 2008.
As expected there is a greater proportion of higher wind speeds at Newcastle, nearer the coast.
Figure 7.7 shows wind speed by hour of the day at Newcastle and Warabrook for CALMET
2008. Similar patterns are noted at both sites with an increase in wind speeds during the
afternoon periods
Figure 7.8 shows temperature by hour of the day at Newcastle and Warabrook for CALMET
2008. Both sites show similar trends with an increase in temperatures during the day, as
expected.
Overall meteorological conditions are predicted by CALMET to be similar at the two sites with
some subtle differences in wind speed, stability class and mixing heights suggesting improved
dispersion potential closer to the coastline.
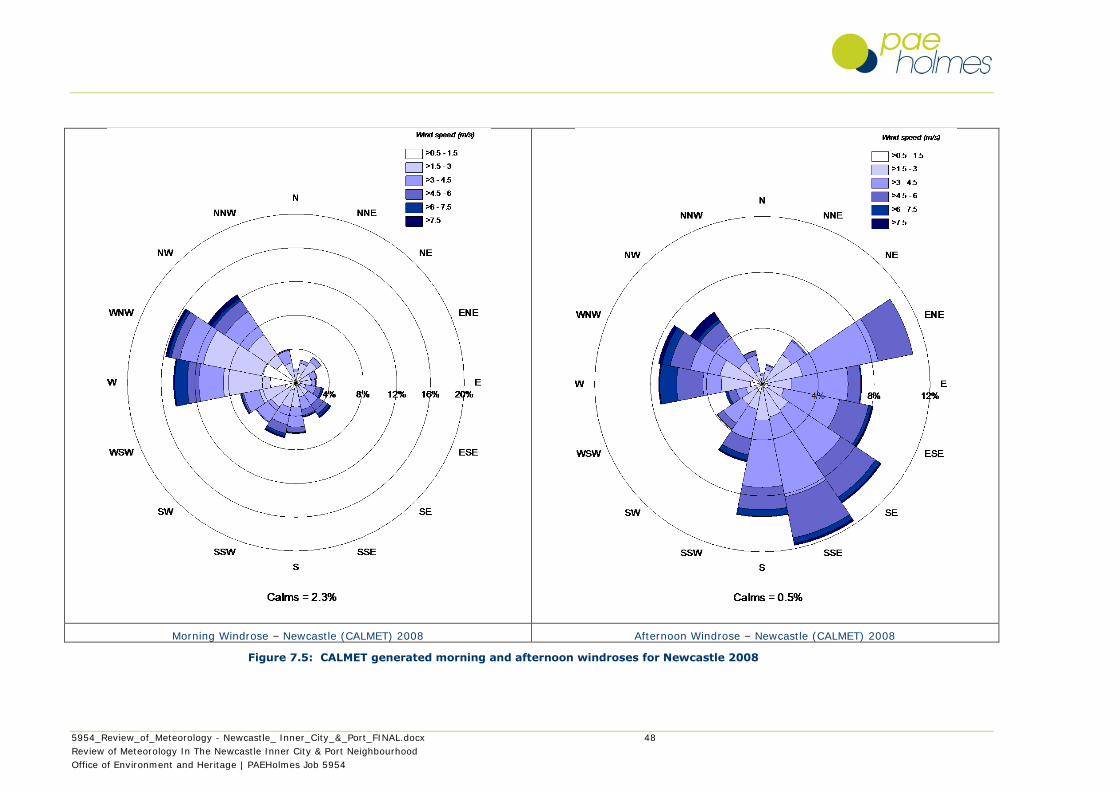
5954_Review_of_Meteorology - Newcastle_ Inner_City_&_Port_FINAL.docx 48
Review of Meteorology In The Newcastle Inner City & Port Neighbourhood
Office of Environment and Heritage | PAEHolmes Job 5954
Morning Windrose – Newcastle (CALMET) 2008 Afternoon Windrose – Newcastle (CALMET) 2008
Figure 7.5: CALMET generated morning and afternoon windroses for Newcastle 2008
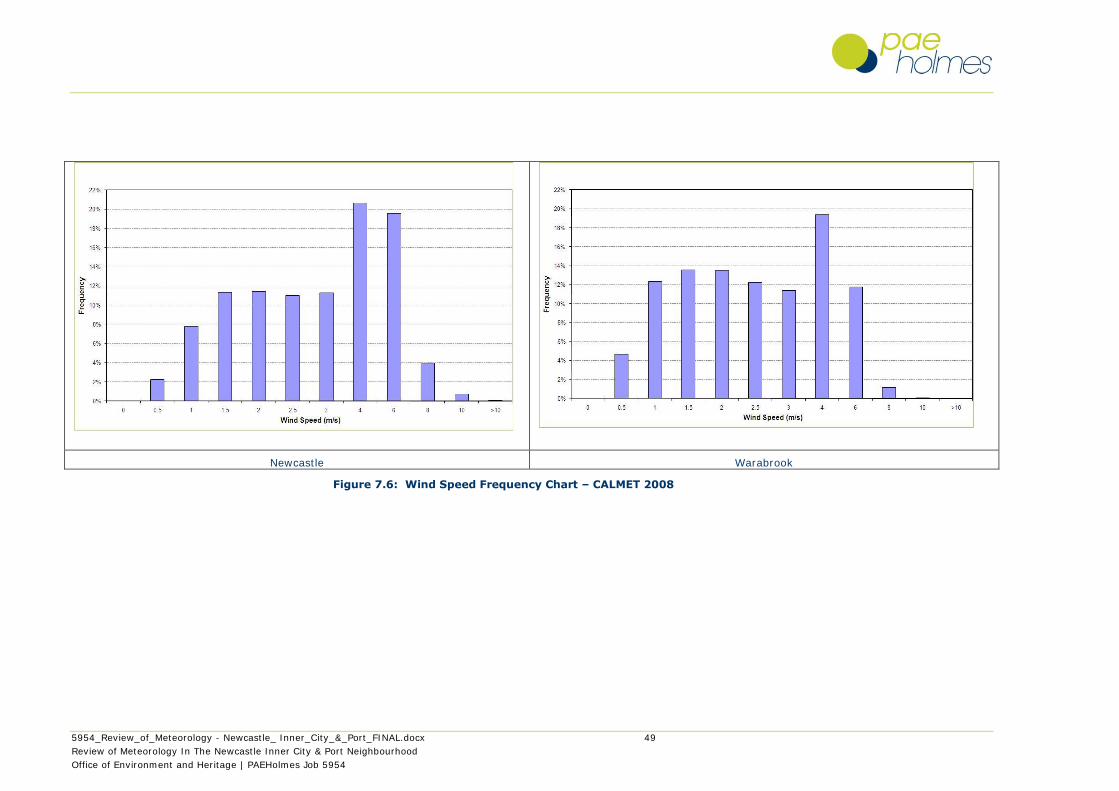
5954_Review_of_Meteorology - Newcastle_ Inner_City_&_Port_FINAL.docx 49
Review of Meteorology In The Newcastle Inner City & Port Neighbourhood
Office of Environment and Heritage | PAEHolmes Job 5954
Newcastle Warabrook
Figure 7.6: Wind Speed Frequency Chart – CALMET 2008
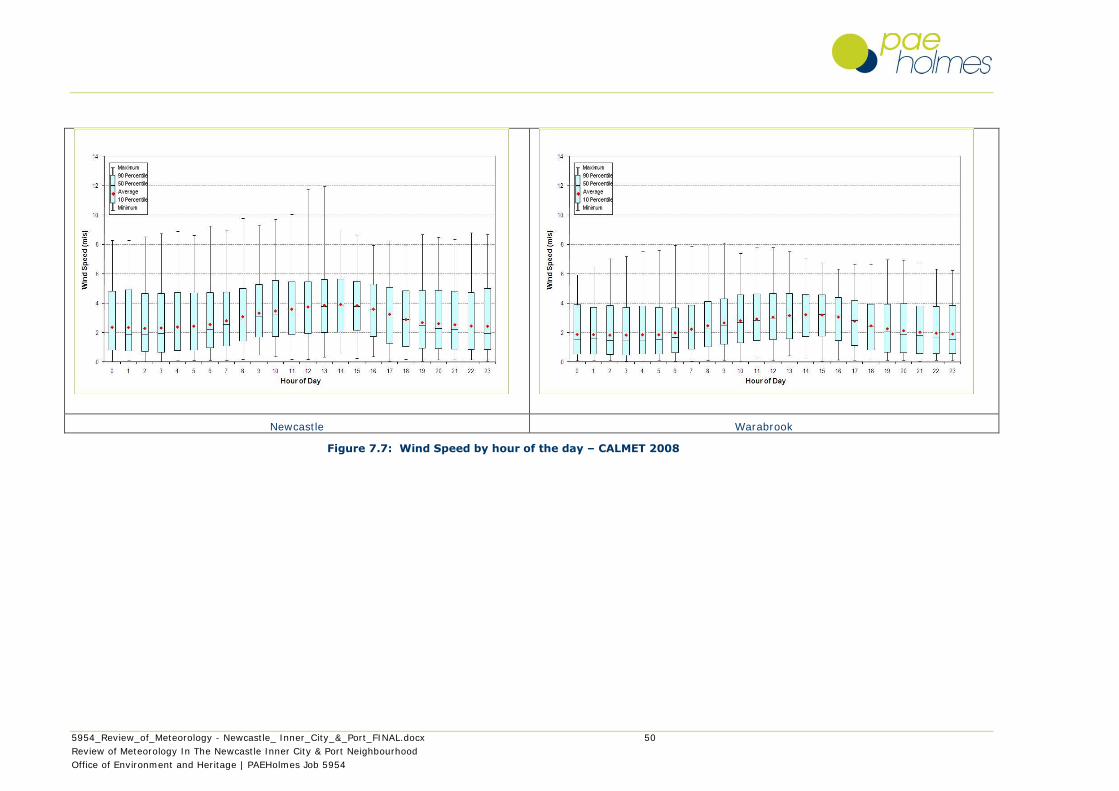
5954_Review_of_Meteorology - Newcastle_ Inner_City_&_Port_FINAL.docx 50
Review of Meteorology In The Newcastle Inner City & Port Neighbourhood
Office of Environment and Heritage | PAEHolmes Job 5954
Newcastle Warabrook
Figure 7.7: Wind Speed by hour of the day – CALMET 2008
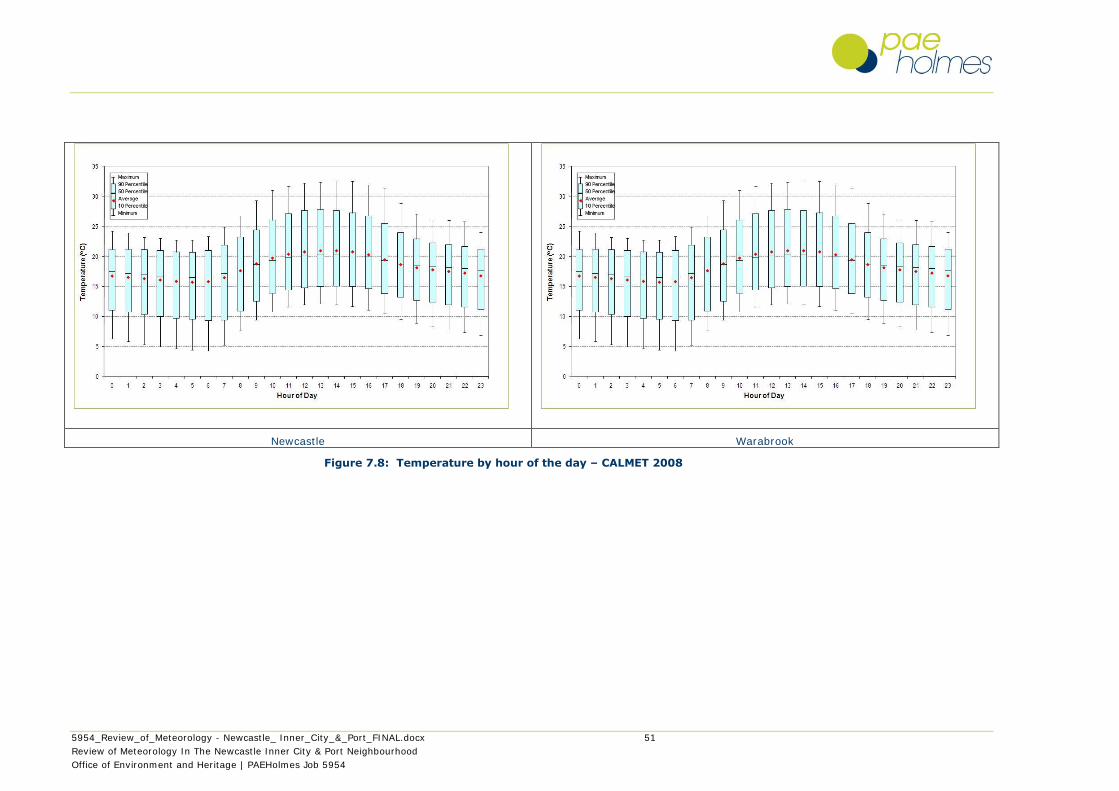
5954_Review_of_Meteorology - Newcastle_ Inner_City_&_Port_FINAL.docx 51
Review of Meteorology In The Newcastle Inner City & Port Neighbourhood
Office of Environment and Heritage | PAEHolmes Job 5954
Newcastle Warabrook
Figure 7.8: Temperature by hour of the day – CALMET 2008
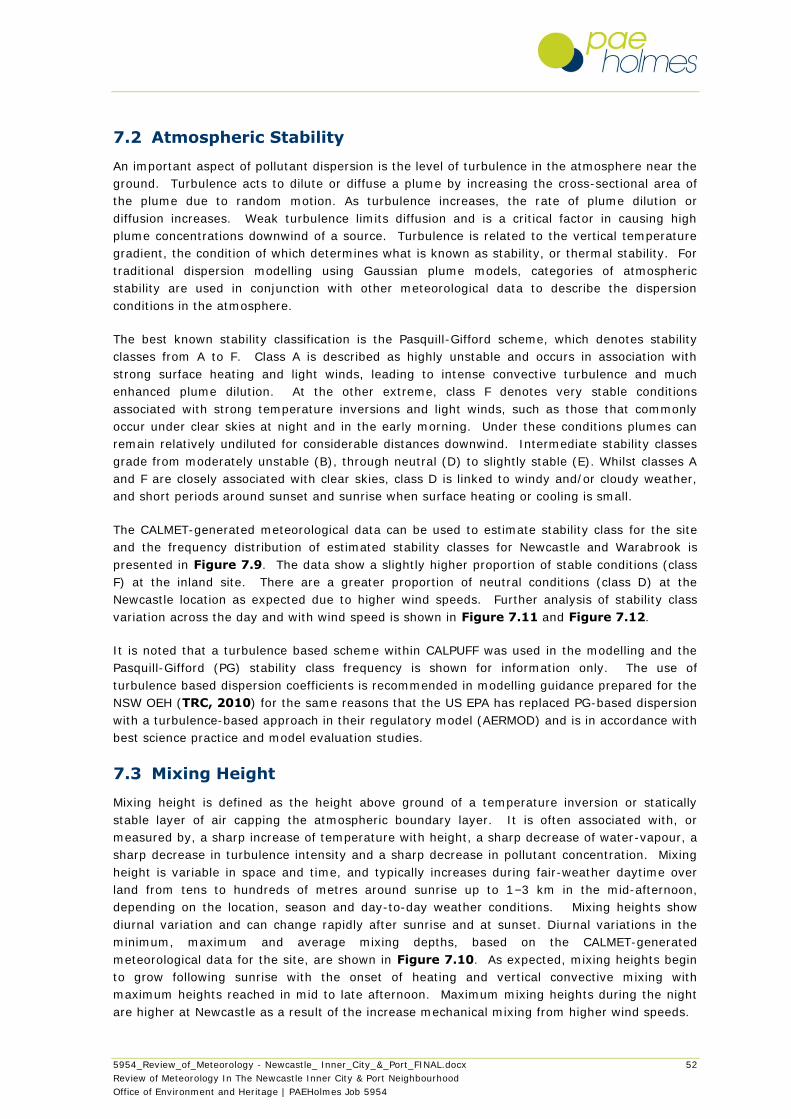
5954_Review_of_Meteorology - Newcastle_ Inner_City_&_Port_FINAL.docx 52
Review of Meteorology In The Newcastle Inner City & Port Neighbourhood
Office of Environment and Heritage | PAEHolmes Job 5954
7.2 Atmospheric Stability
An important aspect of pollutant dispersion is the level of turbulence in the atmosphere near the
ground. Turbulence acts to dilute or diffuse a plume by increasing the cross-sectional area of
the plume due to random motion. As turbulence increases, the rate of plume dilution or
diffusion increases. Weak turbulence limits diffusion and is a critical factor in causing high
plume concentrations downwind of a source. Turbulence is related to the vertical temperature
gradient, the condition of which determines what is known as stability, or thermal stability. For
traditional dispersion modelling using Gaussian plume models, categories of atmospheric
stability are used in conjunction with other meteorological data to describe the dispersion
conditions in the atmosphere.
The best known stability classification is the Pasquill-Gifford scheme, which denotes stability
classes from A to F. Class A is described as highly unstable and occurs in association with
strong surface heating and light winds, leading to intense convective turbulence and much
enhanced plume dilution. At the other extreme, class F denotes very stable conditions
associated with strong temperature inversions and light winds, such as those that commonly
occur under clear skies at night and in the early morning. Under these conditions plumes can
remain relatively undiluted for considerable distances downwind. Intermediate stability classes
grade from moderately unstable (B), through neutral (D) to slightly stable (E). Whilst classes A
and F are closely associated with clear skies, class D is linked to windy and/or cloudy weather,
and short periods around sunset and sunrise when surface heating or cooling is small.
The CALMET-generated meteorological data can be used to estimate stability class for the site
and the frequency distribution of estimated stability classes for Newcastle and Warabrook is
presented in Figure 7.9. The data show a slightly higher proportion of stable conditions (class
F) at the inland site. There are a greater proportion of neutral conditions (class D) at the
Newcastle location as expected due to higher wind speeds. Further analysis of stability class
variation across the day and with wind speed is shown in Figure 7.11 and Figure 7.12.
It is noted that a turbulence based scheme within CALPUFF was used in the modelling and the
Pasquill-Gifford (PG) stability class frequency is shown for information only. The use of
turbulence based dispersion coefficients is recommended in modelling guidance prepared for the
NSW OEH (TRC, 2010) for the same reasons that the US EPA has replaced PG-based dispersion
with a turbulence-based approach in their regulatory model (AERMOD) and is in accordance with
best science practice and model evaluation studies.
7.3 Mixing Height
Mixing height is defined as the height above ground of a temperature inversion or statically
stable layer of air capping the atmospheric boundary layer. It is often associated with, or
measured by, a sharp increase of temperature with height, a sharp decrease of water-vapour, a
sharp decrease in turbulence intensity and a sharp decrease in pollutant concentration. Mixing
height is variable in space and time, and typically increases during fair-weather daytime over
land from tens to hundreds of metres around sunrise up to 1–3 km in the mid-afternoon,
depending on the location, season and day-to-day weather conditions. Mixing heights show
diurnal variation and can change rapidly after sunrise and at sunset. Diurnal variations in the
minimum, maximum and average mixing depths, based on the CALMET-generated
meteorological data for the site, are shown in Figure 7.10. As expected, mixing heights begin
to grow following sunrise with the onset of heating and vertical convective mixing with
maximum heights reached in mid to late afternoon. Maximum mixing heights during the night
are higher at Newcastle as a result of the increase mechanical mixing from higher wind speeds.
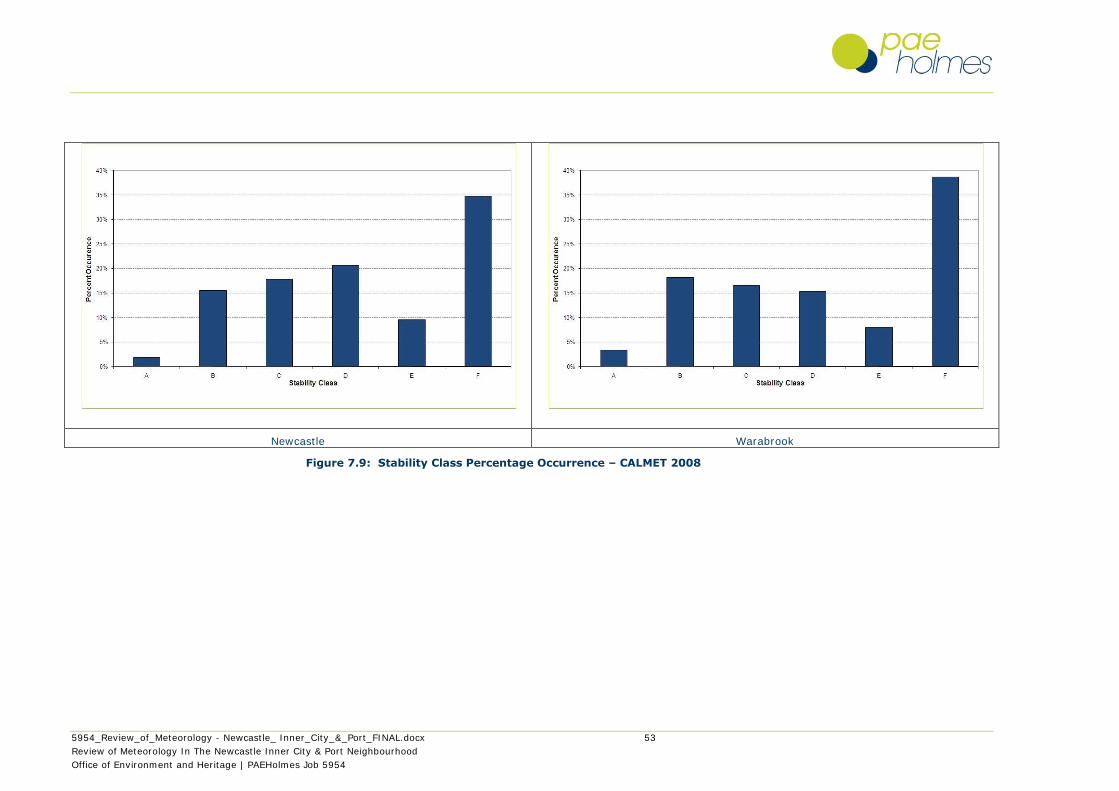
5954_Review_of_Meteorology - Newcastle_ Inner_City_&_Port_FINAL.docx 53
Review of Meteorology In The Newcastle Inner City & Port Neighbourhood
Office of Environment and Heritage | PAEHolmes Job 5954
Newcastle Warabrook
Figure 7.9: Stability Class Percentage Occurrence – CALMET 2008
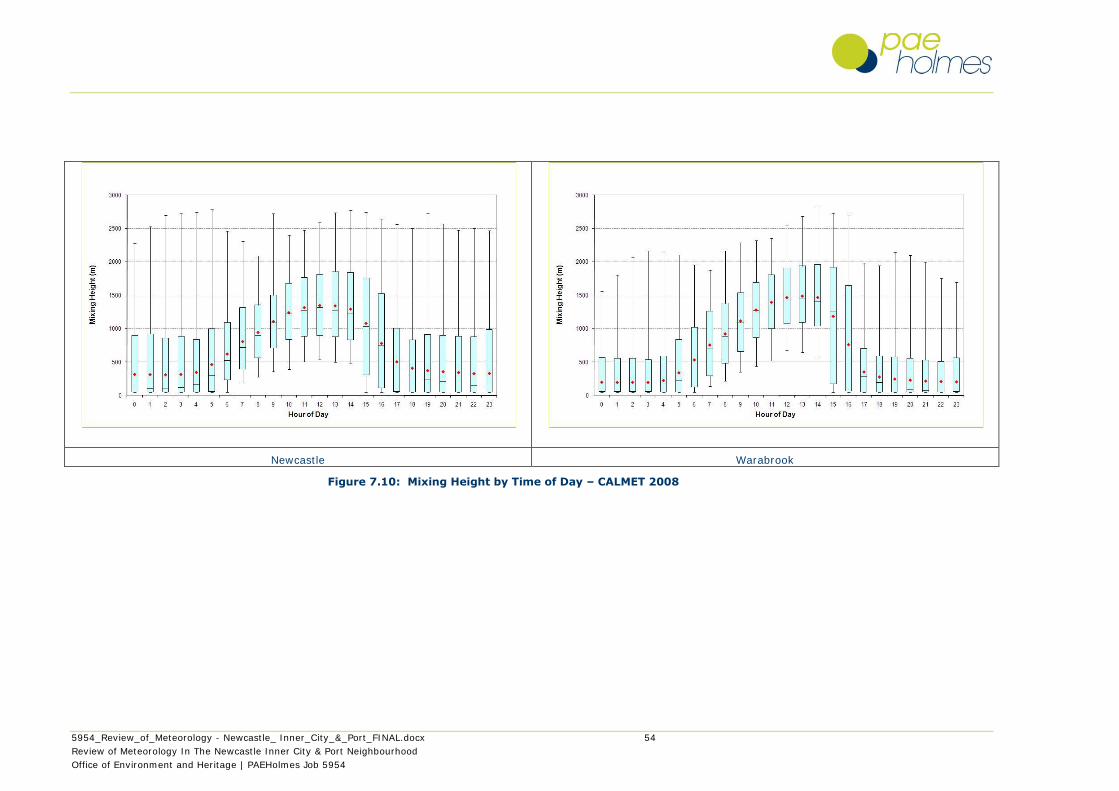
5954_Review_of_Meteorology - Newcastle_ Inner_City_&_Port_FINAL.docx 54
Review of Meteorology In The Newcastle Inner City & Port Neighbourhood
Office of Environment and Heritage | PAEHolmes Job 5954
Newcastle Warabrook
Figure 7.10: Mixing Height by Time of Day – CALMET 2008
5954_Review_of_Meteorology - Newcastle_ Inner_City_&_Port_FINAL.docx 55
Review of Meteorology In The Newcastle Inner City & Port Neighbourhood
Office of Environment and Heritage | PAEHolmes Job 5954
Newcastle Warabrook Note: Stability Class 1 – 6 equivalent to Class A - F
Figure 7.11: Stability Class by Time of Day – CALMET 2008
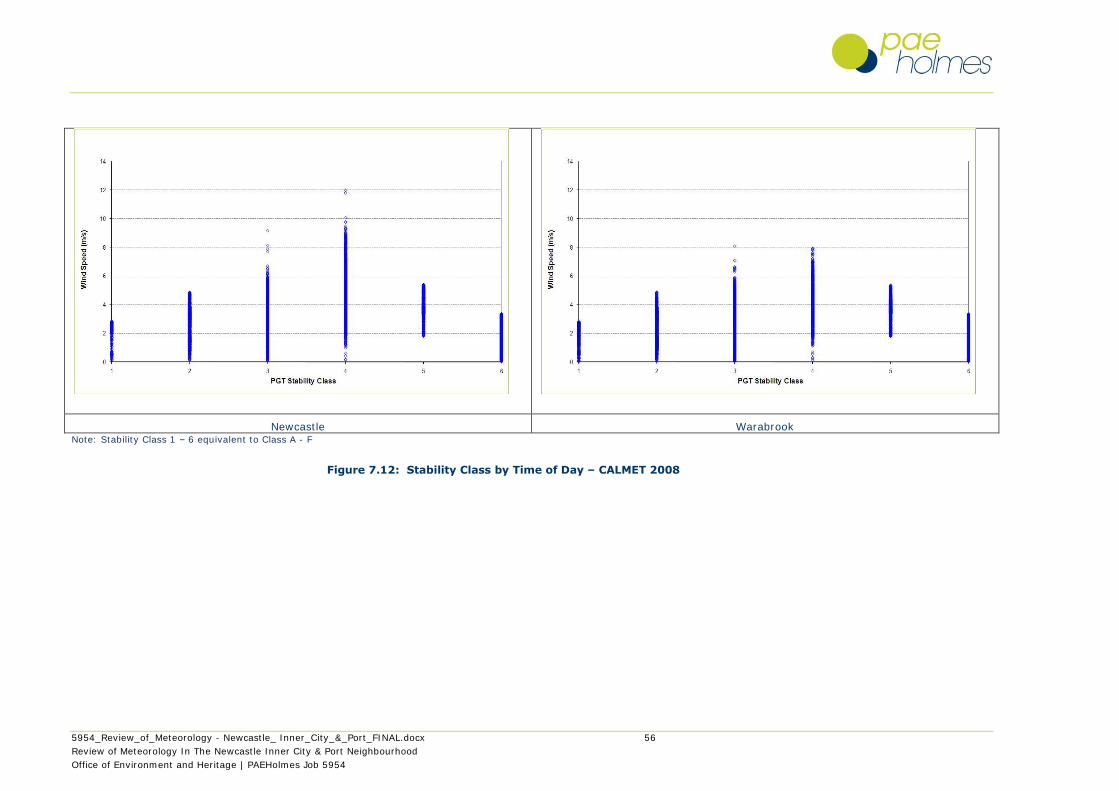
5954_Review_of_Meteorology - Newcastle_ Inner_City_&_Port_FINAL.docx 56
Review of Meteorology In The Newcastle Inner City & Port Neighbourhood
Office of Environment and Heritage | PAEHolmes Job 5954
Newcastle Warabrook Note: Stability Class 1 – 6 equivalent to Class A - F
Figure 7.12: Stability Class by Time of Day – CALMET 2008
5954_Review_of_Meteorology - Newcastle_ Inner_City_&_Port_FINAL.docx 57
Review of Meteorology In The Newcastle Inner City & Port Neighbourhood
Office of Environment and Heritage | PAEHolmes Job 5954
8 EMISSIONS SOURCES AND INVENTORY
8.1 Introduction
An important factor to be considered in the design of a monitoring network is the location of the
major emission sources. The study area is an urban airshed affected by emissions from large
industrial sources and commercial premises as well as the more conventional sources, such as
roadways and emissions from domestic and smaller scale commercial sources.
In addition to industrial and commercial sources within the study area there will be an influx of
emissions from the boundaries of the airshed. Southeasterly winds will transport sea salt inland
which will contribute to ambient PM10 concentrations and the mines in the upper and lower
Hunter Valley will contribute to regional levels of ambient PM10. There will occasionally be a
significant influx of particulate matter from regional dust storms and bushfires, which although
rare, can result in high concentrations of PM10.
8.2 Emissions Sources Considered
The OEH has completed a three year air emissions inventory for the regions of greater Sydney,
Newcastle and Wollongong, known collectively as the Greater Metropolitan Region (GMR).
THE GMR air emissions inventory references emission estimates for the baseline year 2003 and
includes emissions from biogenic (i.e. natural) and anthropogenic (i.e. human derived) sources,
including:
Industrial premises (i.e. EPA-licensed);
Commercial businesses (i.e. non-EPA-licensed);
Domestic-commercial activities;
Off-road mobile (i.e. non-registered off-road vehicles and equipment); and
On-road mobile (i.e. registered on-road vehicles).
Emissions input files were provided by OEH for commercial and industrial point and fugitive
sources in a format suitable for the TAPM modelling software. The point source emission files
were converted to a format suitable for use in this assessment (i.e. dispersion modelling using
CALPUFF). Details of the specific point source releases at each of the premises are provided in
Appendix A.
In addition to the industrial and commercial point sources, significant local fugitive emissions
sources were also included in the modelling. These included the following facilities:
PWCS Kooragang Island Coal Terminal;
NCIG Kooragang Island Coal Terminal;
PWCS Carrington Coal Terminal;
Newcastle Grain Terminal;
The fugitive emission rates for the PWCS and NCIG coal export facilities at Koorangang were
taken from previous air quality impact assessments conducted by PAEHolmes (HAS, 2006 &
PAEHolmes, 2009).
The fugitive emission rates for the PWCS coal export facilities Carrington were taken from the
GMR air emissions inventory. Similarly, the emission rates for the Newcastle Grain Terminal

5954_Review_of_Meteorology - Newcastle_ Inner_City_&_Port_FINAL.docx 58
Review of Meteorology In The Newcastle Inner City & Port Neighbourhood
Office of Environment and Heritage | PAEHolmes Job 5954
were taken from the GMR air emissions inventory. As the GMR air emissions inventory does not
extract fugitive emissions for CALPUFF down to the facility level, the total emissions rates for
the entire grid cell (where the PWCS Carrington Coal Terminal and the Newcastle Grain Terminal
are located) were used in the modelling. The total emissions for each cell therefore include
emissions from other industry within these grid cells, including:
Newcastle Port Corporation – material transfers;
ADI – surface coating, blasting, metal cutting;
Forgacs Dockyard – abrasive blasting, stockpiles; and
Newcastle Cruising Yacht Club – abrasive blasting, surface coating.
Fugitive emissions have been treated as a number of volume sources at the approximate or
apparent location of major emission; i.e. the locations of shiploading, stockpiles and facilities.
8.2.1 Emission Sources Not Included
Emissions sources which were not incorporated in the modelling assessment include:
Fugitive emissions sources from bulk loading facilities other than the Kooragang Island and
Carrington Coal Terminals;
Emissions from Shipping;
Emissions from biogenic sources;
Emissions from on-road mobile sources;
The location of the sources (point and fugitive) included in the modelling are shown in Figure
8.1.
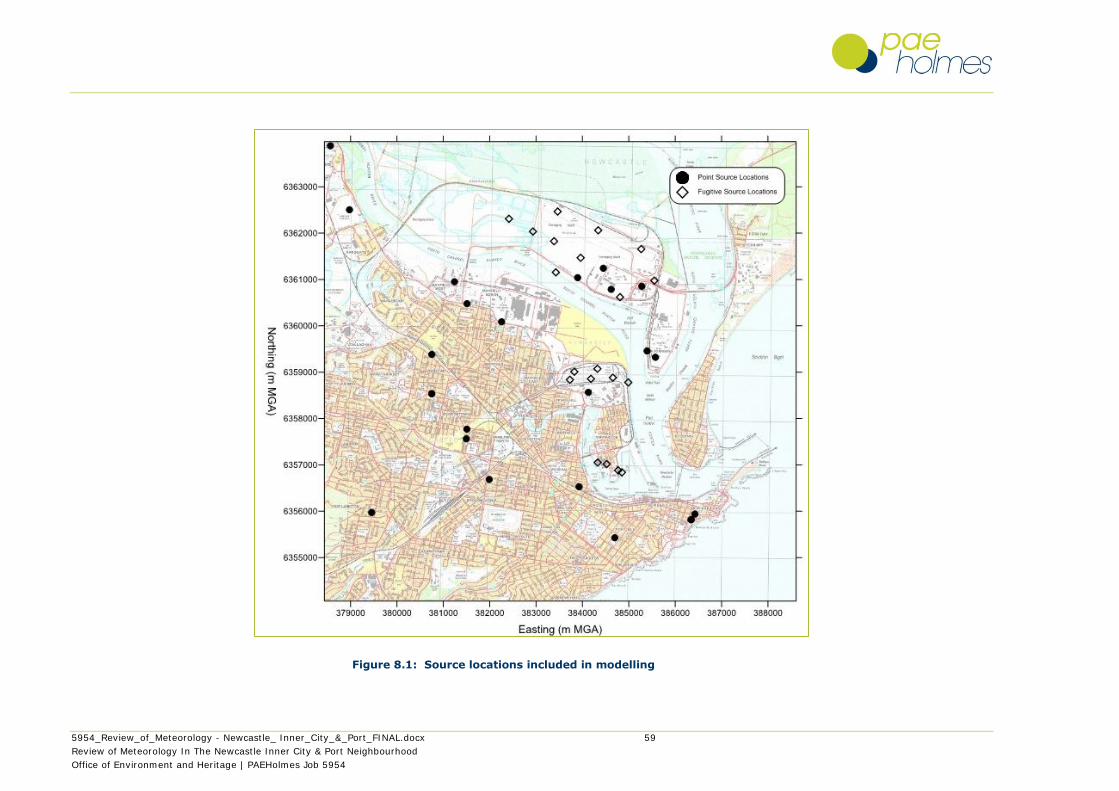
5954_Review_of_Meteorology - Newcastle_ Inner_City_&_Port_FINAL.docx 59
Review of Meteorology In The Newcastle Inner City & Port Neighbourhood
Office of Environment and Heritage | PAEHolmes Job 5954
Figure 8.1: Source locations included in modelling
5954_Review_of_Meteorology - Newcastle_ Inner_City_&_Port_FINAL.docx 60
Review of Meteorology In The Newcastle Inner City & Port Neighbourhood
Office of Environment and Heritage | PAEHolmes Job 5954
9 ANALYSIS OF POLLUTANT DISPERSION
9.1 CALPUFF
CALPUFF is a multi-layer, multi-species non-steady state puff dispersion model that can
simulate the effects of time and space varying meteorological conditions on pollutant transport,
transformation and removal (Scire et al., 2000). The model contains algorithms for near-
source effects such as building downwash, partial plume penetration, sub-grid scale interactions
as well as longer-range effects such as pollutant removal, chemical transformation, vertical wind
shear and coastal interaction effects. The model employs dispersion equations based on a
Gaussian distribution of pollutants across the puff and takes into account the complex
arrangement of emissions from point, area, volume, and line sources. CALPUFF is endorsed by
the US EPA, and has been extensively used in Australia.
The choice of the CALMET/CALPUFF modelling system for this study is based on the fact that in
complex flow situations, such as coastal environments, the meteorological conditions may be
more accurately simulated using a wind field model such as CALMET.
9.2 Analysis of Pollutant Dispersion Patterns
Dispersion modelling predictions include emissions from all industry point sources in the model
domain identified within OEH GMR Inventory as well as the major fugitive dust sources at the
port (Kooragang Island and Carrington Coal loading facilities) (refer Section 8).
Dispersion modelling results are presented for each modelled year for annual average PM10
concentration, maximum 24-hour PM10 concentrations and 98.6th percentile 24-hour PM10
concentrations.
The 98.6th percentile measure is equivalent to the sixth highest 24-hour average prediction. It
is a commonly accepted approach to present 24-hour PM10 data in this manner to overcome
inherent uncertainty in dispersion modelling predictions. This approach is consistent with the
National Environmental Protection Measure (NEPM) for Ambient Air Quality (NEPC, 1998) which
account for high PM10 events such as bushfires in their air quality standards.
Regulatory air dispersion models are designed to over predict potential impacts. The over
prediction in dispersion modelling is also more pronounced for short term averages such as 24-
hours than for annual averages. There is also inherent uncertainty involved in any dispersion
modelling exercise. This is a combination of uncertainties in model chemistry/physics, input
data (meteorological and emissions data) and atmospheric reactions.
There is also uncertainty in the behaviour of the atmosphere, especially on shorter time scales
due to the effects of random turbulence. Model accuracy can be improved with improved input
data, an increase in the number of spatial wind field data sites available, the averaging time of
the data sets (e.g. 10 minutes versus 1 hour) and the closer the location of the data sites to the
facility being modelled. However, for any specific hour the predicted glcs will never exactly
match the actual ground level concentrations, due to the effects of random turbulent motions
and spatial fluctuations in other factors such as wind and temperature.
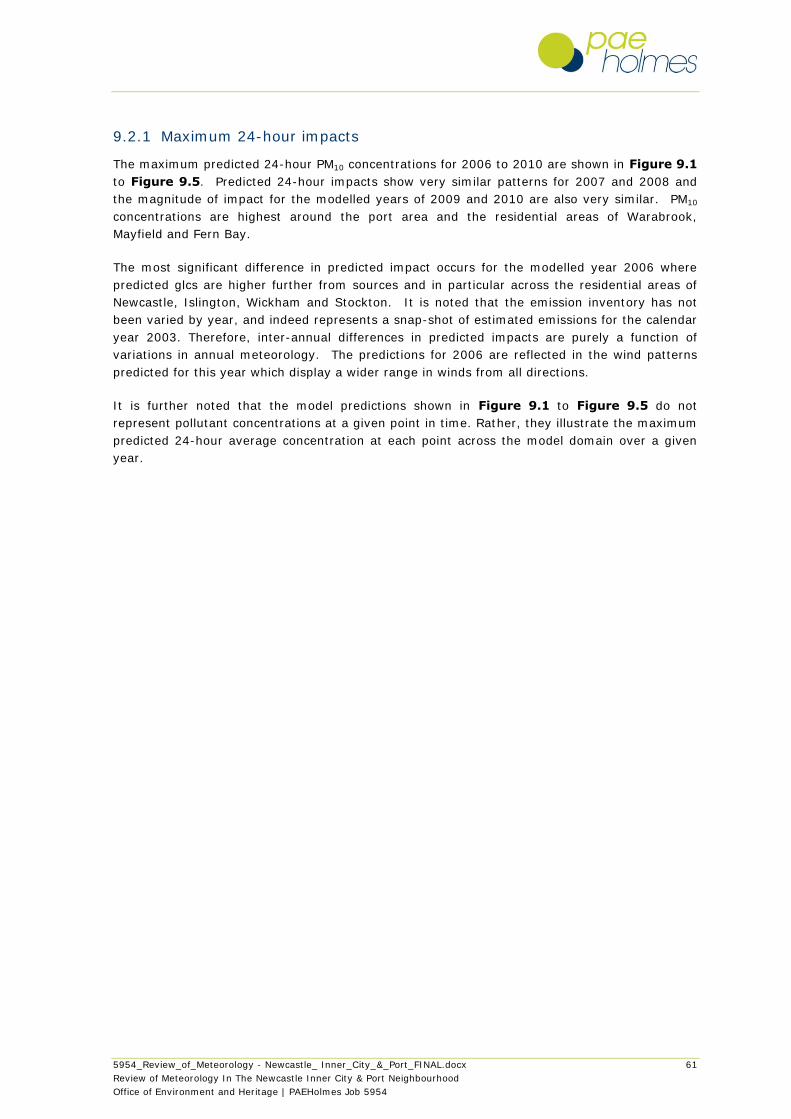
5954_Review_of_Meteorology - Newcastle_ Inner_City_&_Port_FINAL.docx 61
Review of Meteorology In The Newcastle Inner City & Port Neighbourhood
Office of Environment and Heritage | PAEHolmes Job 5954
9.2.1 Maximum 24-hour impacts
The maximum predicted 24-hour PM10 concentrations for 2006 to 2010 are shown in Figure 9.1
to Figure 9.5. Predicted 24-hour impacts show very similar patterns for 2007 and 2008 and
the magnitude of impact for the modelled years of 2009 and 2010 are also very similar. PM10
concentrations are highest around the port area and the residential areas of Warabrook,
Mayfield and Fern Bay.
The most significant difference in predicted impact occurs for the modelled year 2006 where
predicted glcs are higher further from sources and in particular across the residential areas of
Newcastle, Islington, Wickham and Stockton. It is noted that the emission inventory has not
been varied by year, and indeed represents a snap-shot of estimated emissions for the calendar
year 2003. Therefore, inter-annual differences in predicted impacts are purely a function of
variations in annual meteorology. The predictions for 2006 are reflected in the wind patterns
predicted for this year which display a wider range in winds from all directions.
It is further noted that the model predictions shown in Figure 9.1 to Figure 9.5 do not
represent pollutant concentrations at a given point in time. Rather, they illustrate the maximum
predicted 24-hour average concentration at each point across the model domain over a given
year.

5954_Review_of_Meteorology - Newcastle_ Inner_City_&_Port_FINAL.docx 62
Review of Meteorology In The Newcastle Inner City & Port Neighbourhood
Office of Environment and Heritage | PAEHolmes Job 5954
Species:
PM10
Location:
Newcastle
Scenario:
2006
Percentile:
Maximum
Averaging Time:
24-Hour
Model Used:
CALPUFF
v6.262
Units:
µg/m3
Guideline:
50 µg/m3
Met Data:
CALMET 2006
Plot:
R Kellaghan
Figure 9.1: Predicted Maximum 24-hour PM10 Concentration -2006
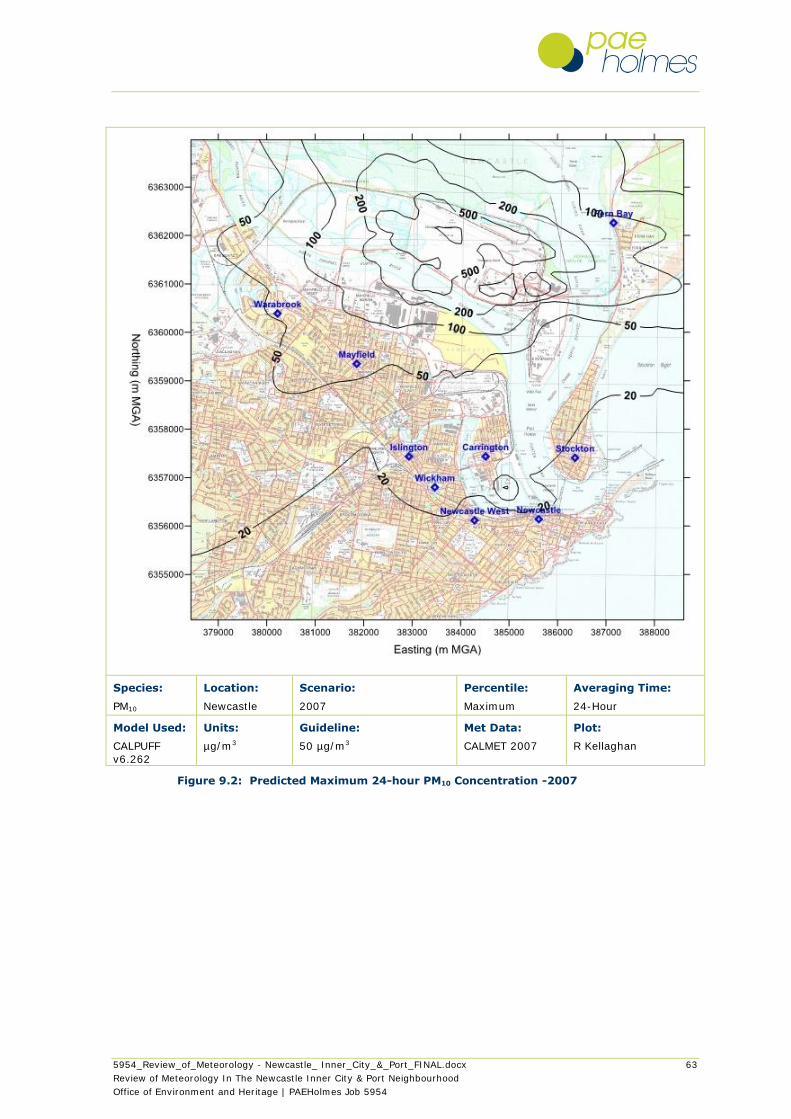
5954_Review_of_Meteorology - Newcastle_ Inner_City_&_Port_FINAL.docx 63
Review of Meteorology In The Newcastle Inner City & Port Neighbourhood
Office of Environment and Heritage | PAEHolmes Job 5954
Species:
PM10
Location:
Newcastle
Scenario:
2007
Percentile:
Maximum
Averaging Time:
24-Hour
Model Used:
CALPUFF
v6.262
Units:
µg/m3
Guideline:
50 µg/m3
Met Data:
CALMET 2007
Plot:
R Kellaghan
Figure 9.2: Predicted Maximum 24-hour PM10 Concentration -2007
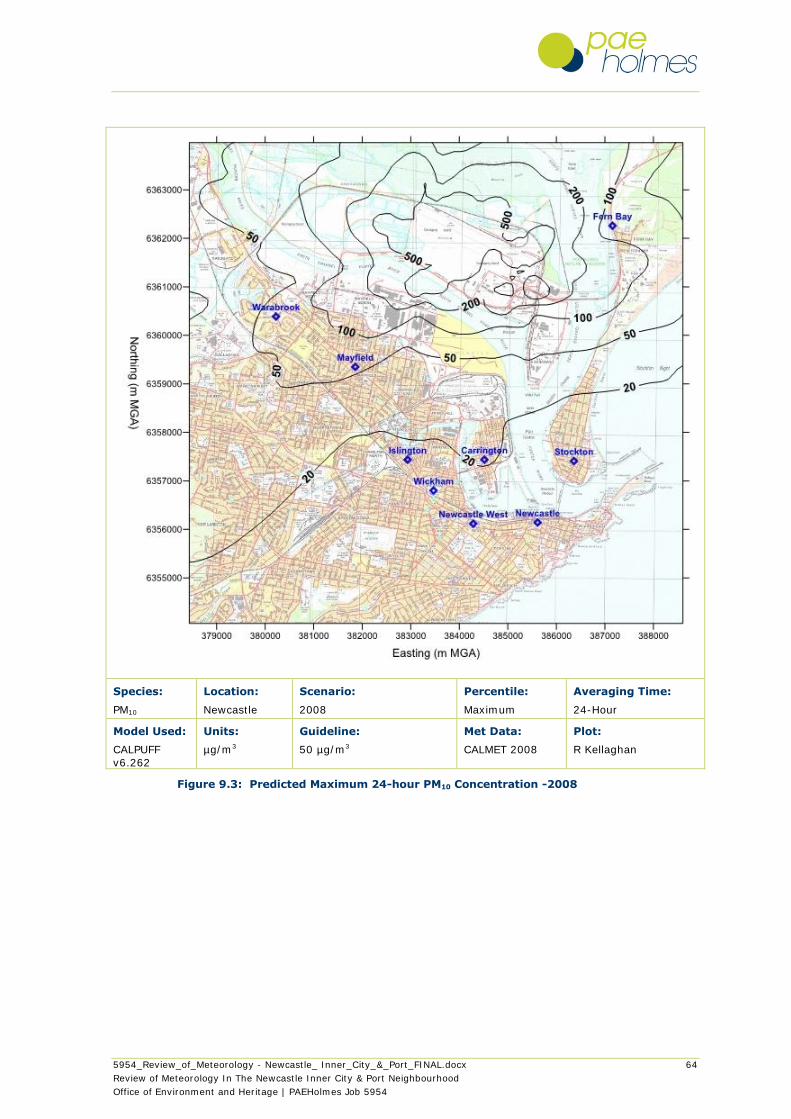
5954_Review_of_Meteorology - Newcastle_ Inner_City_&_Port_FINAL.docx 64
Review of Meteorology In The Newcastle Inner City & Port Neighbourhood
Office of Environment and Heritage | PAEHolmes Job 5954
Species:
PM10
Location:
Newcastle
Scenario:
2008
Percentile:
Maximum
Averaging Time:
24-Hour
Model Used:
CALPUFF
v6.262
Units:
µg/m3
Guideline:
50 µg/m3
Met Data:
CALMET 2008
Plot:
R Kellaghan
Figure 9.3: Predicted Maximum 24-hour PM10 Concentration -2008

5954_Review_of_Meteorology - Newcastle_ Inner_City_&_Port_FINAL.docx 65
Review of Meteorology In The Newcastle Inner City & Port Neighbourhood
Office of Environment and Heritage | PAEHolmes Job 5954
Species:
PM10
Location:
Newcastle
Scenario:
2009
Percentile:
Maximum
Averaging Time:
24-Hour
Model Used:
CALPUFF
v6.262
Units:
µg/m3
Guideline:
50 µg/m3
Met Data:
CALMET 2009
Plot:
R Kellaghan
Figure 9.4: Predicted Maximum 24-hour PM10 Concentration -2009
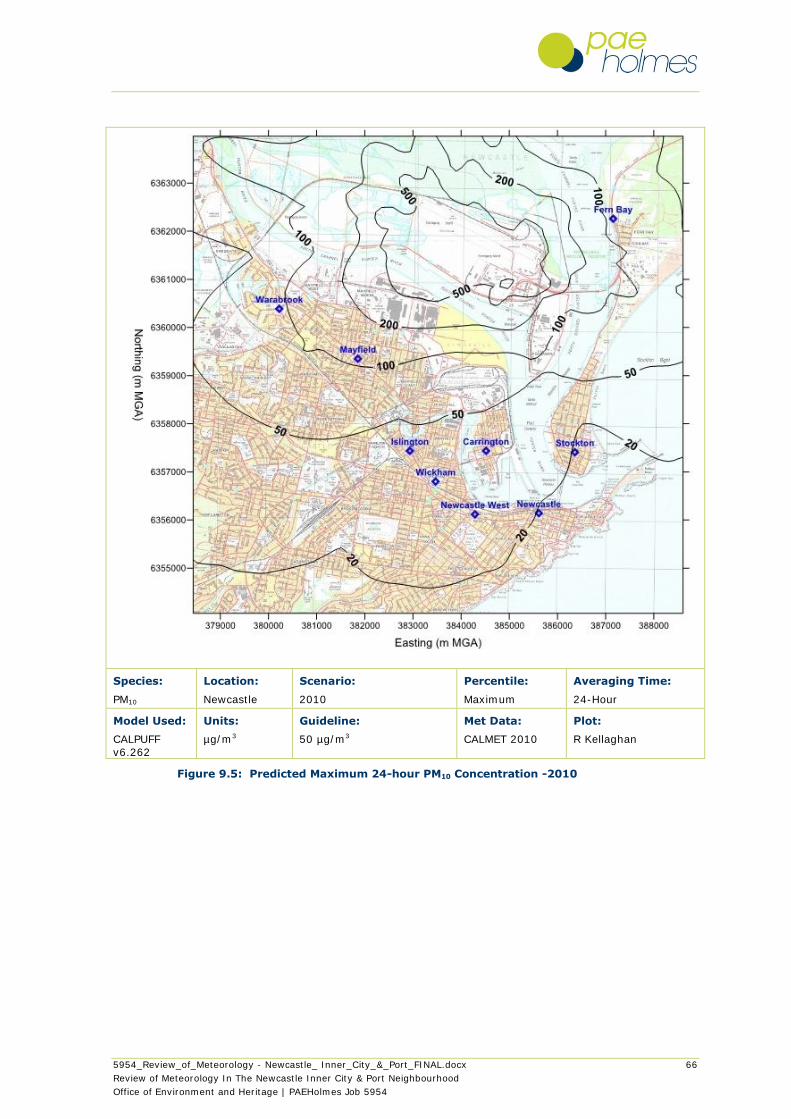
5954_Review_of_Meteorology - Newcastle_ Inner_City_&_Port_FINAL.docx 66
Review of Meteorology In The Newcastle Inner City & Port Neighbourhood
Office of Environment and Heritage | PAEHolmes Job 5954
Species:
PM10
Location:
Newcastle
Scenario:
2010
Percentile:
Maximum
Averaging Time:
24-Hour
Model Used:
CALPUFF
v6.262
Units:
µg/m3
Guideline:
50 µg/m3
Met Data:
CALMET 2010
Plot:
R Kellaghan
Figure 9.5: Predicted Maximum 24-hour PM10 Concentration -2010

5954_Review_of_Meteorology - Newcastle_ Inner_City_&_Port_FINAL.docx 67
Review of Meteorology In The Newcastle Inner City & Port Neighbourhood
Office of Environment and Heritage | PAEHolmes Job 5954
9.2.2 98.6th Percentile Predictions
The presentation of the 98.6th percentile results shows the 6th highest 24-hr average result at all
locations across the modelled year. The predicted 98.6th percentile 24-hour PM10 concentrations
for 2006 to 2010 are shown in Figure 9.6 to Figure 9.10.
Predicted 24-hour glcs show similar patterns for all years and the magnitude of impact ranges
from 30 µg/m3 across Warabrook, Mayfield, Carrington and Fern Bay compared to 10 µg/m3
across the suburbs of Islington, Wickham and Newcastle. There is less variation than for
maximum 24-hour predictions across all of the modelled years.
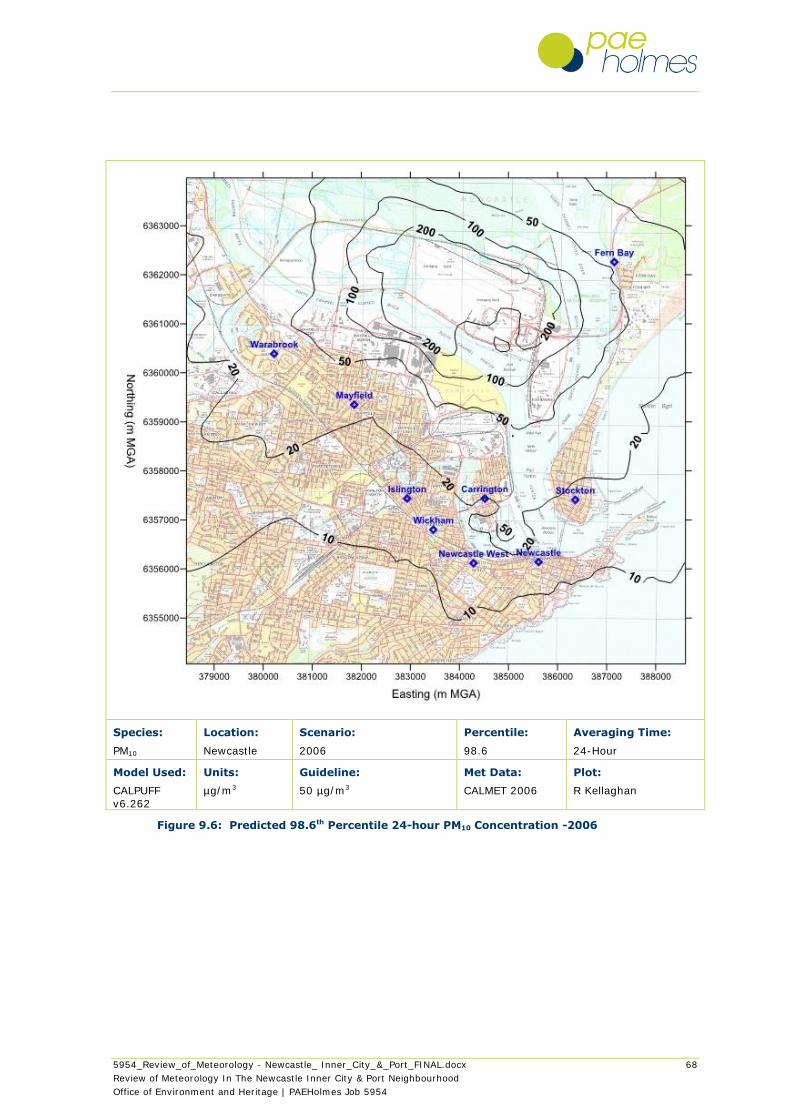
5954_Review_of_Meteorology - Newcastle_ Inner_City_&_Port_FINAL.docx 68
Review of Meteorology In The Newcastle Inner City & Port Neighbourhood
Office of Environment and Heritage | PAEHolmes Job 5954
Species:
PM10
Location:
Newcastle
Scenario:
2006
Percentile:
98.6
Averaging Time:
24-Hour
Model Used:
CALPUFF
v6.262
Units:
µg/m3
Guideline:
50 µg/m3
Met Data:
CALMET 2006
Plot:
R Kellaghan
Figure 9.6: Predicted 98.6th Percentile 24-hour PM10 Concentration -2006

5954_Review_of_Meteorology - Newcastle_ Inner_City_&_Port_FINAL.docx 69
Review of Meteorology In The Newcastle Inner City & Port Neighbourhood
Office of Environment and Heritage | PAEHolmes Job 5954
Species:
PM10
Location:
Newcastle
Scenario:
2007
Percentile:
98.6
Averaging Time:
24-Hour
Model Used:
CALPUFF
v6.262
Units:
µg/m3
Guideline:
50 µg/m3
Met Data:
CALMET 2007
Plot:
R Kellaghan
Figure 9.7: Predicted 98.6th Percentile 24-hour PM10 Concentration -2007
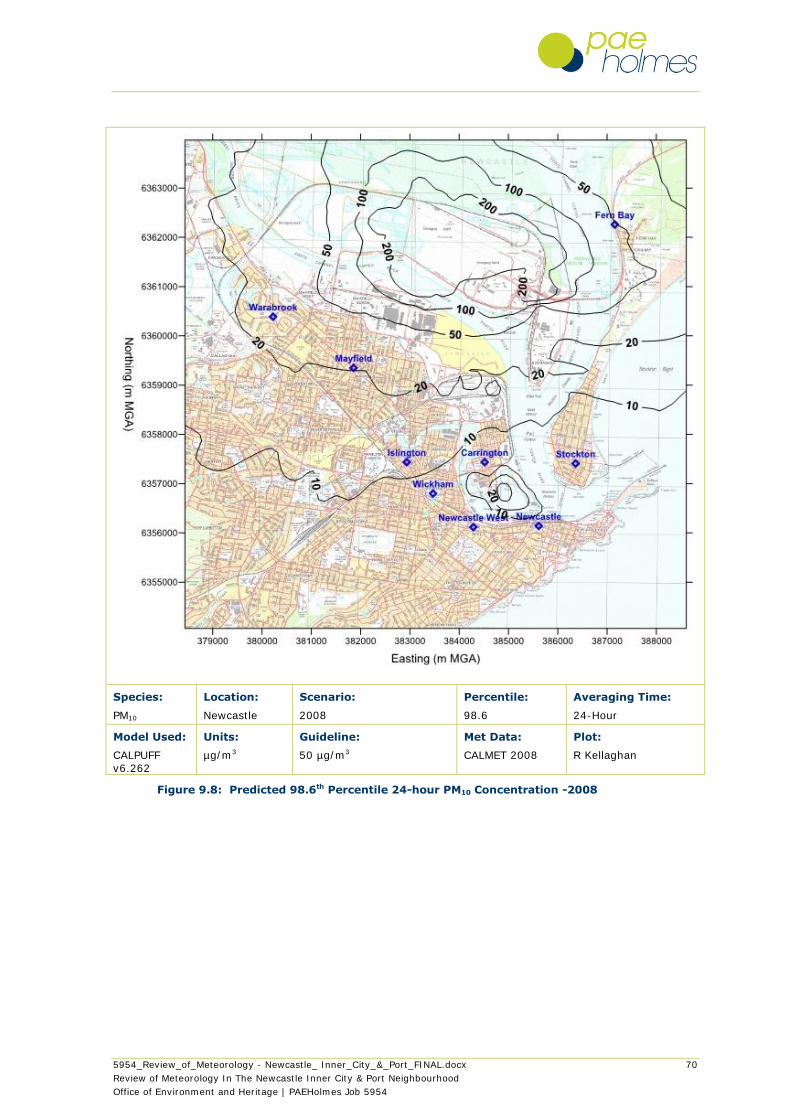
5954_Review_of_Meteorology - Newcastle_ Inner_City_&_Port_FINAL.docx 70
Review of Meteorology In The Newcastle Inner City & Port Neighbourhood
Office of Environment and Heritage | PAEHolmes Job 5954
Species:
PM10
Location:
Newcastle
Scenario:
2008
Percentile:
98.6
Averaging Time:
24-Hour
Model Used:
CALPUFF
v6.262
Units:
µg/m3
Guideline:
50 µg/m3
Met Data:
CALMET 2008
Plot:
R Kellaghan
Figure 9.8: Predicted 98.6th Percentile 24-hour PM10 Concentration -2008
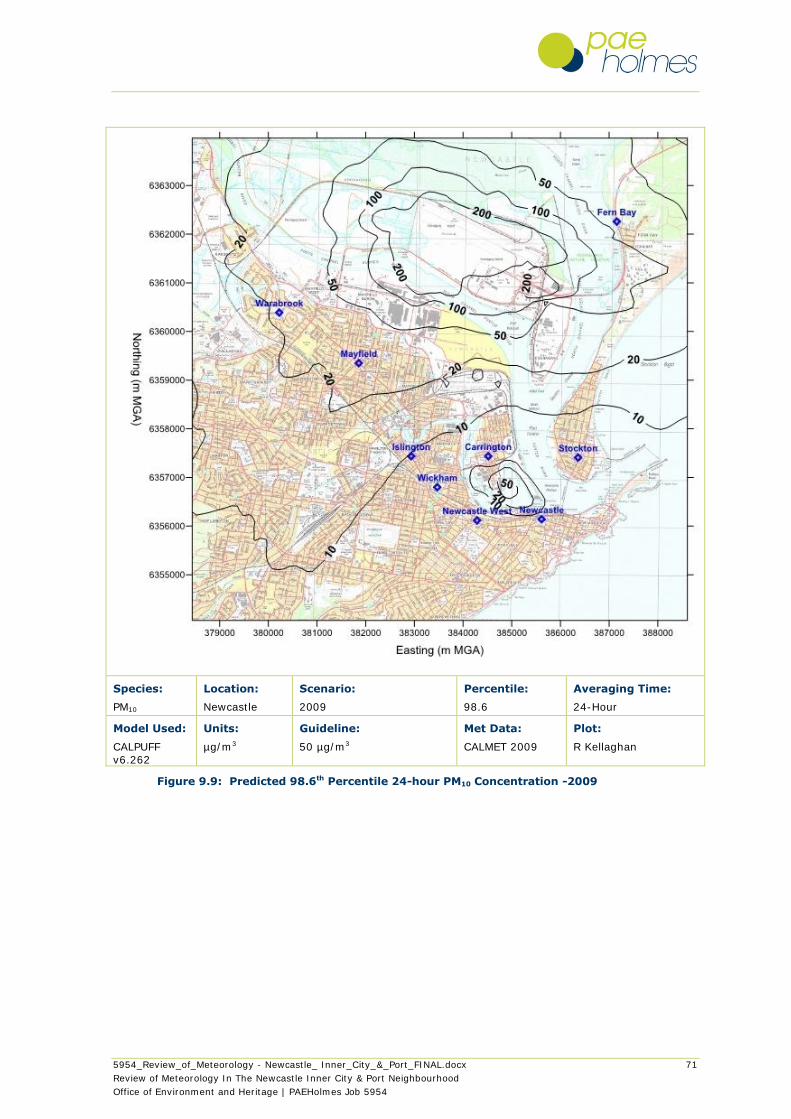
5954_Review_of_Meteorology - Newcastle_ Inner_City_&_Port_FINAL.docx 71
Review of Meteorology In The Newcastle Inner City & Port Neighbourhood
Office of Environment and Heritage | PAEHolmes Job 5954
Species:
PM10
Location:
Newcastle
Scenario:
2009
Percentile:
98.6
Averaging Time:
24-Hour
Model Used:
CALPUFF v6.262
Units:
µg/m3
Guideline:
50 µg/m3
Met Data:
CALMET 2009
Plot:
R Kellaghan
Figure 9.9: Predicted 98.6th Percentile 24-hour PM10 Concentration -2009
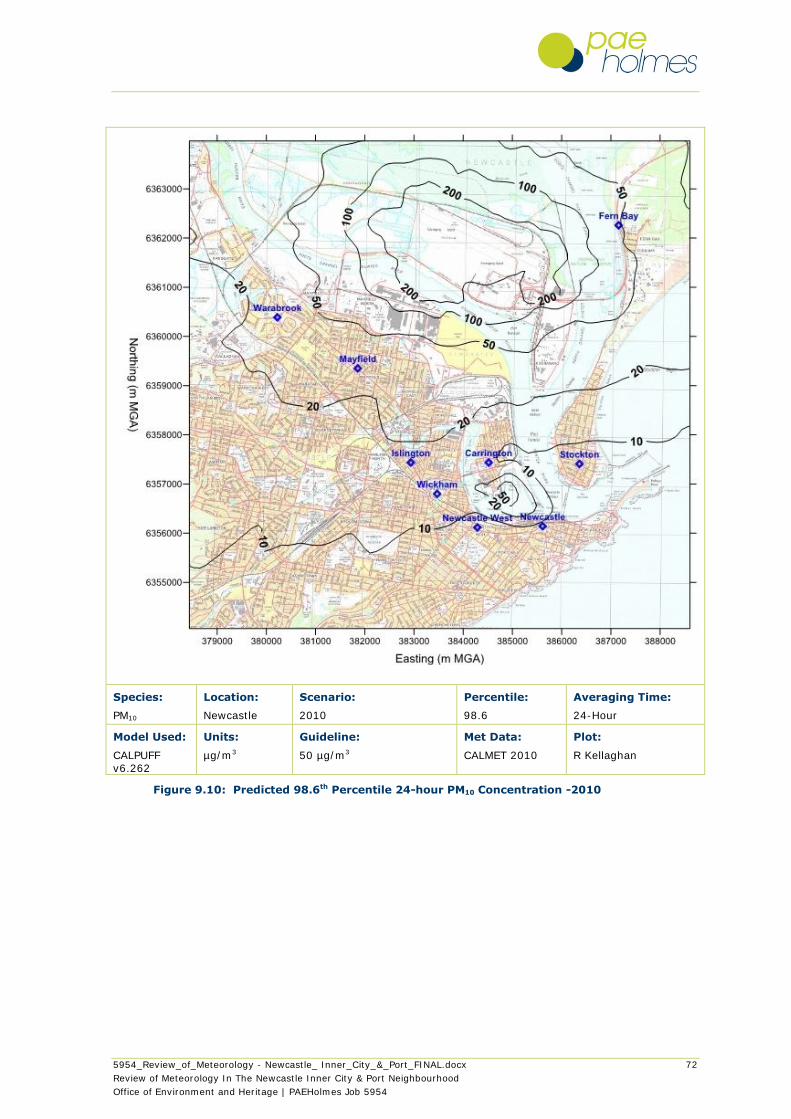
5954_Review_of_Meteorology - Newcastle_ Inner_City_&_Port_FINAL.docx 72
Review of Meteorology In The Newcastle Inner City & Port Neighbourhood
Office of Environment and Heritage | PAEHolmes Job 5954
Species:
PM10
Location:
Newcastle
Scenario:
2010
Percentile:
98.6
Averaging Time:
24-Hour
Model Used:
CALPUFF v6.262
Units:
µg/m3
Guideline:
50 µg/m3
Met Data:
CALMET 2010
Plot:
R Kellaghan
Figure 9.10: Predicted 98.6th Percentile 24-hour PM10 Concentration -2010
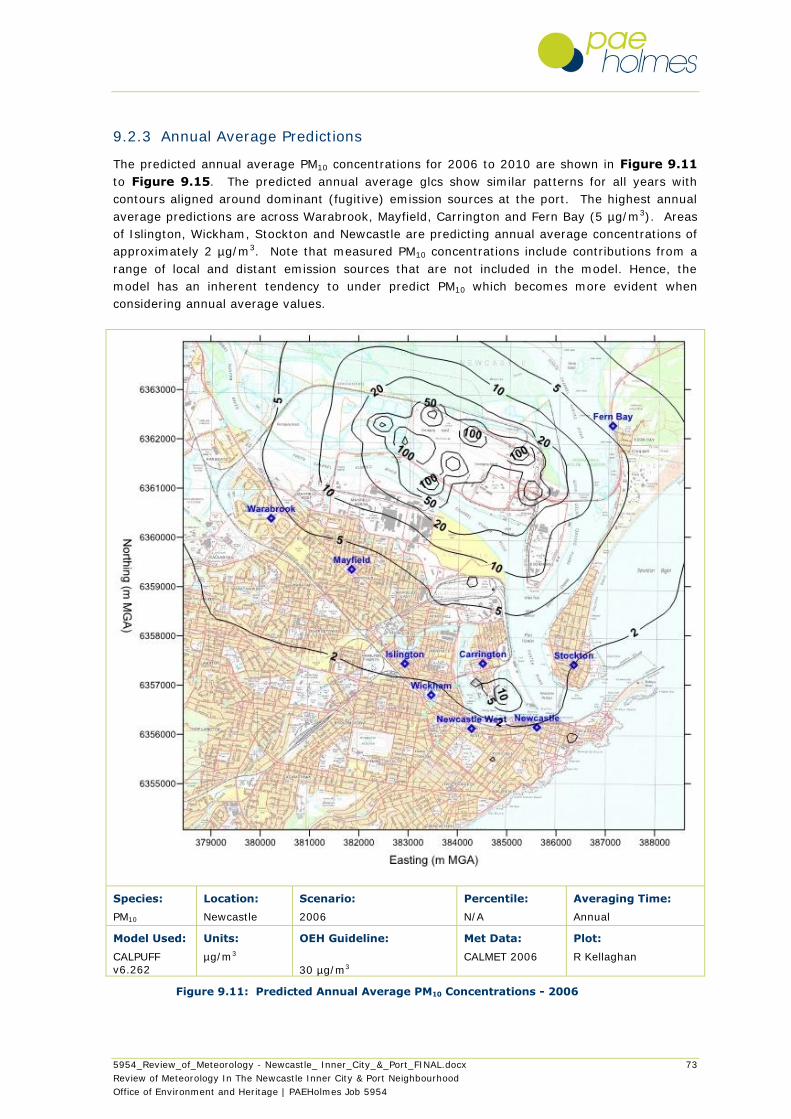
5954_Review_of_Meteorology - Newcastle_ Inner_City_&_Port_FINAL.docx 73
Review of Meteorology In The Newcastle Inner City & Port Neighbourhood
Office of Environment and Heritage | PAEHolmes Job 5954
9.2.3 Annual Average Predictions
The predicted annual average PM10 concentrations for 2006 to 2010 are shown in Figure 9.11
to Figure 9.15. The predicted annual average glcs show similar patterns for all years with
contours aligned around dominant (fugitive) emission sources at the port. The highest annual
average predictions are across Warabrook, Mayfield, Carrington and Fern Bay (5 µg/m3). Areas
of Islington, Wickham, Stockton and Newcastle are predicting annual average concentrations of
approximately 2 µg/m3. Note that measured PM10 concentrations include contributions from a
range of local and distant emission sources that are not included in the model. Hence, the
model has an inherent tendency to under predict PM10 which becomes more evident when
considering annual average values.
Species:
PM10
Location:
Newcastle
Scenario:
2006
Percentile:
N/A
Averaging Time:
Annual
Model Used:
CALPUFF v6.262
Units:
µg/m3
OEH Guideline:
30 µg/m3
Met Data:
CALMET 2006
Plot:
R Kellaghan
Figure 9.11: Predicted Annual Average PM10 Concentrations - 2006
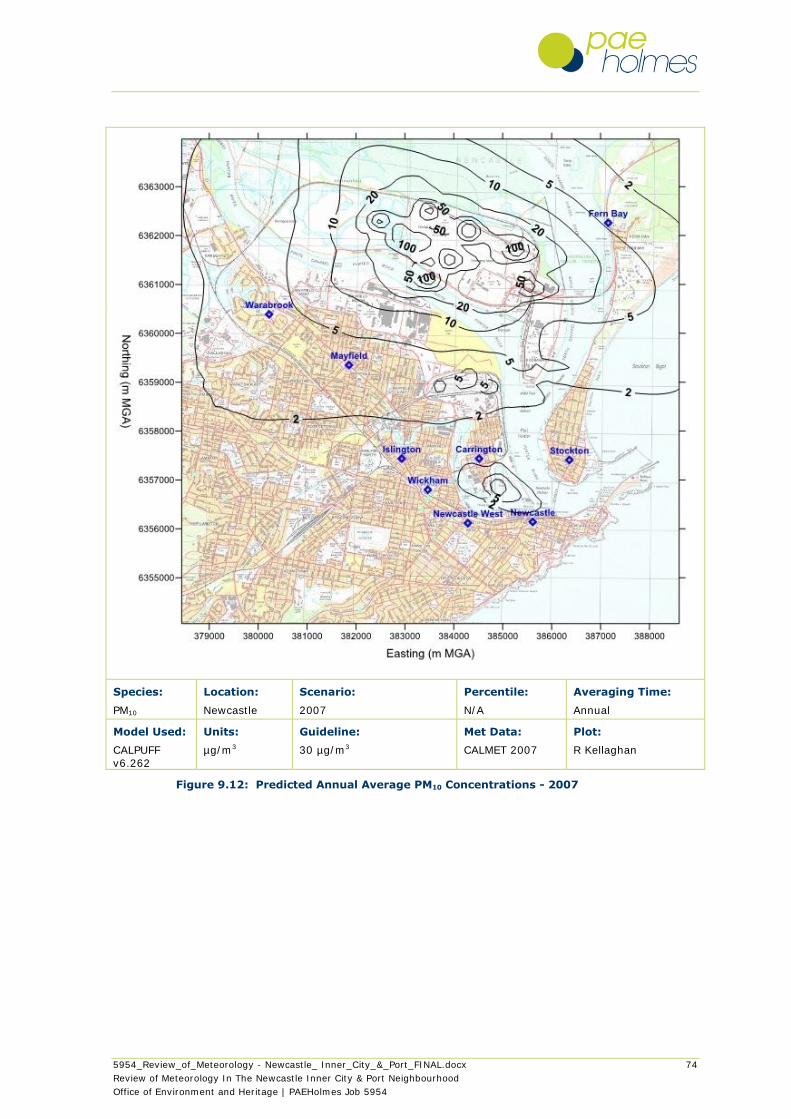
5954_Review_of_Meteorology - Newcastle_ Inner_City_&_Port_FINAL.docx 74
Review of Meteorology In The Newcastle Inner City & Port Neighbourhood
Office of Environment and Heritage | PAEHolmes Job 5954
Species:
PM10
Location:
Newcastle
Scenario:
2007
Percentile:
N/A
Averaging Time:
Annual
Model Used:
CALPUFF
v6.262
Units:
µg/m3
Guideline:
30 µg/m3
Met Data:
CALMET 2007
Plot:
R Kellaghan
Figure 9.12: Predicted Annual Average PM10 Concentrations - 2007
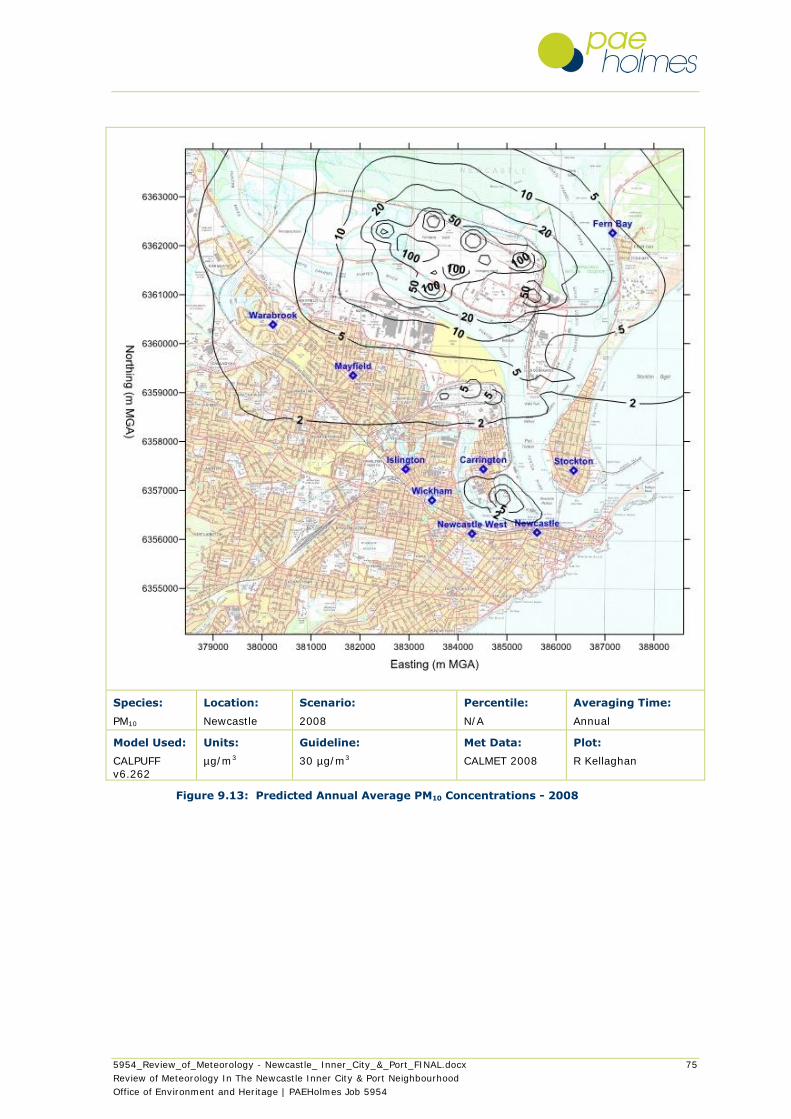
5954_Review_of_Meteorology - Newcastle_ Inner_City_&_Port_FINAL.docx 75
Review of Meteorology In The Newcastle Inner City & Port Neighbourhood
Office of Environment and Heritage | PAEHolmes Job 5954
Species:
PM10
Location:
Newcastle
Scenario:
2008
Percentile:
N/A
Averaging Time:
Annual
Model Used:
CALPUFF
v6.262
Units:
µg/m3
Guideline:
30 µg/m3
Met Data:
CALMET 2008
Plot:
R Kellaghan
Figure 9.13: Predicted Annual Average PM10 Concentrations - 2008
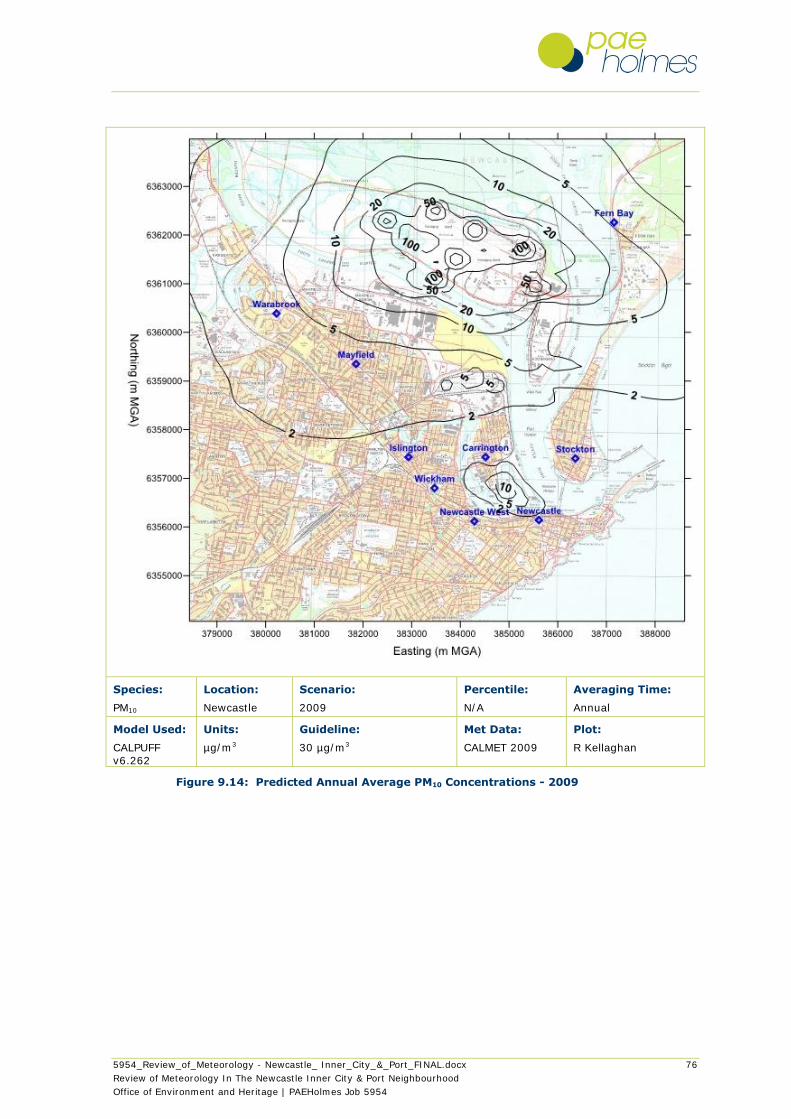
5954_Review_of_Meteorology - Newcastle_ Inner_City_&_Port_FINAL.docx 76
Review of Meteorology In The Newcastle Inner City & Port Neighbourhood
Office of Environment and Heritage | PAEHolmes Job 5954
Species:
PM10
Location:
Newcastle
Scenario:
2009
Percentile:
N/A
Averaging Time:
Annual
Model Used:
CALPUFF v6.262
Units:
µg/m3
Guideline:
30 µg/m3
Met Data:
CALMET 2009
Plot:
R Kellaghan
Figure 9.14: Predicted Annual Average PM10 Concentrations - 2009
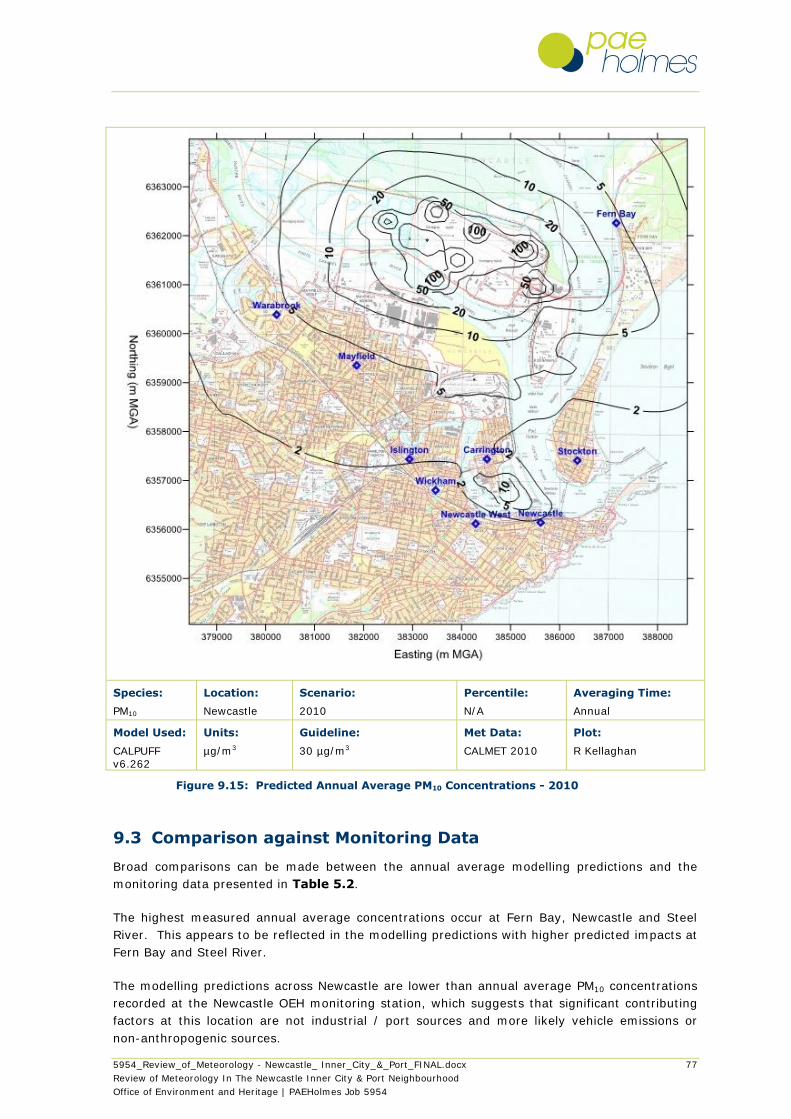
5954_Review_of_Meteorology - Newcastle_ Inner_City_&_Port_FINAL.docx 77
Review of Meteorology In The Newcastle Inner City & Port Neighbourhood
Office of Environment and Heritage | PAEHolmes Job 5954
Species:
PM10
Location:
Newcastle
Scenario:
2010
Percentile:
N/A
Averaging Time:
Annual
Model Used:
CALPUFF v6.262
Units:
µg/m3
Guideline:
30 µg/m3
Met Data:
CALMET 2010
Plot:
R Kellaghan
Figure 9.15: Predicted Annual Average PM10 Concentrations - 2010
9.3 Comparison against Monitoring Data
Broad comparisons can be made between the annual average modelling predictions and the
monitoring data presented in Table 5.2.
The highest measured annual average concentrations occur at Fern Bay, Newcastle and Steel
River. This appears to be reflected in the modelling predictions with higher predicted impacts at
Fern Bay and Steel River.
The modelling predictions across Newcastle are lower than annual average PM10 concentrations
recorded at the Newcastle OEH monitoring station, which suggests that significant contributing
factors at this location are not industrial / port sources and more likely vehicle emissions or
non-anthropogenic sources.

5954_Review_of_Meteorology - Newcastle_ Inner_City_&_Port_FINAL.docx 78
Review of Meteorology In The Newcastle Inner City & Port Neighbourhood
Office of Environment and Heritage | PAEHolmes Job 5954
The modelling results validate the choice of model in terms of the objectives of this assessment;
that is to characterise dispersion meteorology for the Newcastle area and provide
recommendations for industry monitoring sites based on the modelling predictions of industry
sources of particulate matter.
5954_Review_of_Meteorology - Newcastle_ Inner_City_&_Port_FINAL.docx 79
Review of Meteorology In The Newcastle Inner City & Port Neighbourhood
Office of Environment and Heritage | PAEHolmes Job 5954
10 RECOMMENDATIONS FOR MONITORING LOCATIONS
10.1 Introduction
The basic principles that need to be considered in the design of air quality monitoring networks
are described in the literature (WHO 1976 & Stern et al. 1984). The main principles that
need to be considered are:
the needs of the data users including the quantity, quality, location and sampling times;
the available resources (in particular funds and labour availability);
legal requirements;
available technology for monitoring; and
operational criterion including economic, social, legal and cost effectiveness;
The information that a monitoring program should be able to provide includes:
the geographical distribution of pollutants;
air pollution trends;
the origin of air pollutants at any given locality;
the effects of air pollution;
level of air quality relative to air quality standards;
information to allow the assessment and control of air pollution; and
information for air pollution warning systems.
The Peer Review Committee (PRC) for the National Environment Protection Measures (NEPM)
has also developed guidelines for various aspects associated with the design and operation of
monitoring networks in the Australian context. These are set out in the NEPM (Ambient Air) and
a series of technical papers which relate specifically to air monitoring networks used for the
NEPM, but which provide useful guidance for the design of any air monitoring network. In
particular, Technical Paper 3, Monitoring Strategy, discusses the siting requirements for
monitors to demonstrate compliance or non-compliance with ambient air quality standards,
when there are limited resources.
The basic principle is to identify populated areas where the highest concentrations of pollutants
are expected to occur. Monitors sited in such areas can be used to identify the highest levels
that the community is expected to be exposed to. If this is done reliably, and if the monitored
concentrations are at or below acceptable levels, then it can be inferred that all other populated
areas will also experience concentrations at or below acceptable levels. However, if the
monitoring does not demonstrate that levels are acceptable then further monitoring is needed
to delineate the areas where the levels are acceptable and where they are not acceptable.
The National Environment Protection Measure for Ambient Air Quality (NEPC, 1998) provides
guidelines as to the minimum number of monitoring sites required based on population size.
The formula for regions with populations greater than 25,000 is 1.5P + 0.5, where P is the
population of the region in millions. There is additional guidance as to the number of additional
monitoring sites required where the pollutant levels may be influenced by local characteristics
such as topography, weather and emissions sources.
5954_Review_of_Meteorology - Newcastle_ Inner_City_&_Port_FINAL.docx 80
Review of Meteorology In The Newcastle Inner City & Port Neighbourhood
Office of Environment and Heritage | PAEHolmes Job 5954
10.2 Recommendations
The study area, and in particular the Inner City and Port area, contains a significant
concentration of industrial and commercial activities which means that more monitoring sites
may be required than is the case under the National Environment Protection Measure based
simply on population.
Based on a review of the existing industry meteorological monitoring network and an analysis of
the meteorological modelling, there appear to be sufficient locations to adequately describe the
prevailing wind conditions for the Newcastle area. Additional stations would not add significant
value to the data currently being gathered.
The spatial distribution of predicted PM10 glcs clearly indicates that greater impacts are
anticipated to occur within the region of the port. Predicted PM10 concentrations generally
decrease with distance from this area. This outcome is largely unsurprising, given that potential
PM10 emissions from this area largely represent non-buoyant, fugitive, near ground level
releases. This is opposed to the industrial and commercial point sources incorporated within the
modelling, which are generally buoyant and elevated, thus aiding their dispersion prior to their
transport to ground level.
The highest predicted PM10 impacts associated with local industry are thus anticipated to occur
(across all relevant averaging periods) within the suburbs of:
Warabrook;
Mayfield;
Carrington; and
Fern Bay.
It is therefore suggested that PM10 monitoring would be most valuable within the above
suburbs, with priority to those that represent higher population densities. Reference to Table
2.1 indicates that Mayfield has a population significantly higher than Warabrook, Fern Bay and
Carrington.
It is also noted that it is beneficial to have co-located meteorological monitoring at the PM10
monitoring locations to allow analysis of the wind conditions associated with the highest
concentrations.
Guidance is not provided on the instrumentation used for PM10 monitoring, however the
monitoring method should be continuous and should be consistent with the NSW OEH
“Approved methods for the sampling and analysis of air pollutants in NSW” (NSW DEC 2005a),
the appropriate Australian Standard methods for the sampling and analysis of ambient air and
the US EPA list of designated reference and equivalence methods.
5954_Review_of_Meteorology - Newcastle_ Inner_City_&_Port_FINAL.docx 81
Review of Meteorology In The Newcastle Inner City & Port Neighbourhood
Office of Environment and Heritage | PAEHolmes Job 5954
11 CONCLUSION
Analysis of local meteorological data for the Newcastle area shows dominant onshore winds
prevailing from the east-northeast through to east-southeast and offshore winds from the west
and west-northwest. Coastal recirculation can have significant effect on air quality over urban
areas, as it can return pollutants (instead of removing them) to an area from which they were
released earlier in the day, increasing the background levels into which new emissions are
released.
The local dispersion meteorology was modelled using a combination of the TAPM and CALMET
models. The modelling shows prevailing winds with very similar general patterns across all
locations (onshore winds prevailing from the east-northeast through to east-southeast and
offshore winds from the west and west-northwest). This pattern is reflected at all distances
from the coast.
There is also a similar pattern across all the modelled years, with the exception of 2006 which
shows a slightly different pattern across all sites; however the same general dominant flows are
evident. Based on the similarities across each modelled year and the dominant prevailing flows,
further analysis is limited to two of the sites (Newcastle and Warabrook). The year 2008 is
chosen for further analysis as it appears representative of the overall dispersion conditions for
the period modelled across all the sites.
Overall meteorological conditions are predicted by CALMET to be similar at the two sites with
some subtle differences in wind speed, stability class and mixing heights suggesting improved
dispersion potential closer to the coastline. Dispersion is generally more favourable closer to
the coastal area as a result of higher wind speeds and increased mechanical mixing.
The analysis shows a slightly higher proportion of stable conditions (class F) at the inland site
and a greater proportion of neutral conditions (class D) at the Newcastle location as expected
due to higher wind speeds observed nearer the coast. Maximum mixing heights during the
night are higher at Newcastle as a result of the increased mechanical mixing from higher wind
speeds.
Pollutant dispersion modelling results for maximum 24-hour PM10 concentrations show similar
patterns for 2007 and 2008 and the magnitude of impact for the modelled years of 2009 and
2010 are also very similar. Maximum 24-hour PM10 concentrations are highest around the port
area and the residential areas of Warabrook, Mayfield, Carrington and Fern Bay. The most
significant difference in predicted impact occurs for the modelled year 2006 where predicted
glcs are higher further from sources and in particular across the residential areas of Newcastle,
Islington, Wickham and Stockton.
The predicted 98.6th percentile 24-hour glcs show similar patterns for all years. The magnitude
of impact ranges from 30 µg/m3 across Warabrook, Mayfield, Carrington and Fern Bay
compared to 10 µg/m3 across the suburbs of Islington, Wickham and Newcastle. There is less
variation than for maximum 24-hour predictions across all of the modelled years.
The predicted annual average glcs show similar patterns for all years with contours aligned
around dominant emission sources at the port. The highest annual average predictions are
across Warabrook, Mayfield, Carrington and Fern Bay (5 µg/m3).
It should be noted that the annual average and 24-hour average (98.6 percentile) modelling
predictions are below the OEH impact assessment criteria at all residential areas.
5954_Review_of_Meteorology - Newcastle_ Inner_City_&_Port_FINAL.docx 82
Review of Meteorology In The Newcastle Inner City & Port Neighbourhood
Office of Environment and Heritage | PAEHolmes Job 5954
There appears to the sufficient industry meteorological monitoring locations to adequately
describe the prevailing wind conditions for the Newcastle area.
The spatial distribution of predicted PM10 impacts clearly indicates that greater impacts are
anticipated to occur within the region of the port. Predicted PM10 concentrations generally
decrease with distance from this area. The highest predicted PM10 impacts associated with local
industry are thus anticipated to occur (across all relevant averaging periods) within the suburbs
of:
Warabrook;
Mayfield;
Carrington; and
Fern Bay.
It is therefore suggested that additional PM10 monitoring would be most valuable within the
above suburbs, with priority to those that represent higher population densities.
5954_Review_of_Meteorology - Newcastle_ Inner_City_&_Port_FINAL.docx 83
Review of Meteorology In The Newcastle Inner City & Port Neighbourhood
Office of Environment and Heritage | PAEHolmes Job 5954
12 REFERENCES
DPI (2007) “What Drives NSW Weather” NSW Department of Primary Industries, May 2007.
HAS (2006) “Air Quality Impact Assessment Newcastle Coal Export Terminal”, prepared for
Newcastle Coal Infrastructure Group, Holmes Air Science, June 2006.
HAS (2008) “Upper Hunter Valley Monitoring Network Design”, prepared for the NSW
Department of Environment and Climate Change, Holmes Air Sciences, February 2008.
Hurley, P. (2008). TAPM V4. Part 1: Technical Description, CSIRO Marine and Atmospheric
Research Paper.
Hurley, P., M. Edwards, et al. (2009). "Evaluation of TAPM V4 for Several Meteorological and Air
Pollution Datasets." Air Quality and Climate Change 43(3): 19.
NEPC (1998). “National Environment Protection Measure for Ambient Air Quality” & “Final
Impact Statement for the Ambient Air Quality National Environment Protection Measure”, Level
5, 81 Flinders Street, Adelaide, SA 5000 : National Environment Protection Council, 1998.
NSW DEC (2005) “Approved Methods for the Modelling and Assessment of Air Pollutants in
NSW”, August 2005.
NSW DEC (2005a) “Approved methods for the sampling and analysis of air pollutants in NSW”
New South Wales EPA 59-61 Goulburn Street, Sydney, NSW August 2005.
NSW DECCW (2009) NSW Department of Environment, Climate Change and Water, “Action for
Air, 2009 Update”.
PAEHolmes (2009) “Air Quality Impact Assessment Kooragang Island Coal Terminal Stage 4
Project Fourth Dump Station and Fourth Ship Loader”, 6 October 2009.
POEO (2010), Protection of the Environment Operations (Clean Air) Regulations 2010
Scire, J.S., D.G. Strimaitis and R.J. Yamartino (2000). A User‟s Guide for the CALPUFF
Dispersion Model (Version 5), Earth Tech, Inc., Concord, MA.
Stern, A C, Boubel R W, Turner D B and Fox D L. (1984). Fundamentals of Air Pollution (Second
Edition). London, 24/28 Oval Road, London NW1 7DX : Acadmic Press, Inc., 1984. ISBN 0-12-
666580-X.
TRC (2010) “Generic Guidance and Optimum Model Settings for the CALPUFF Modelling System
for Inclusion into the “Approved Methods for Modelling and Assessment of Air Pollutants in NSW,
Australia”, prepared for NSW DECCW, Sydney Australia.
US EPA (2003) “Revisions to the Guideline on Air Quality Models: Adoption of a Preferred Long
Range Transport Model and other Revisions”. s.l. : Federal Register, 2003. 40 CFR Part 51.
WHO (1976) “Manual on Urban Air Quality Management”. Copenhagen: World Health
Organisation, 1976.
5954_Review_of_Meteorology - Newcastle_ Inner_City_&_Port_FINAL.docx
A-1
Review of Meteorology In The Newcastle Inner City & Port Neighbourhood
Office of Environment and Heritage | PAEHolmes Job 5954
APPENDIX A
GMR Inventory Point Sources included in Modelling
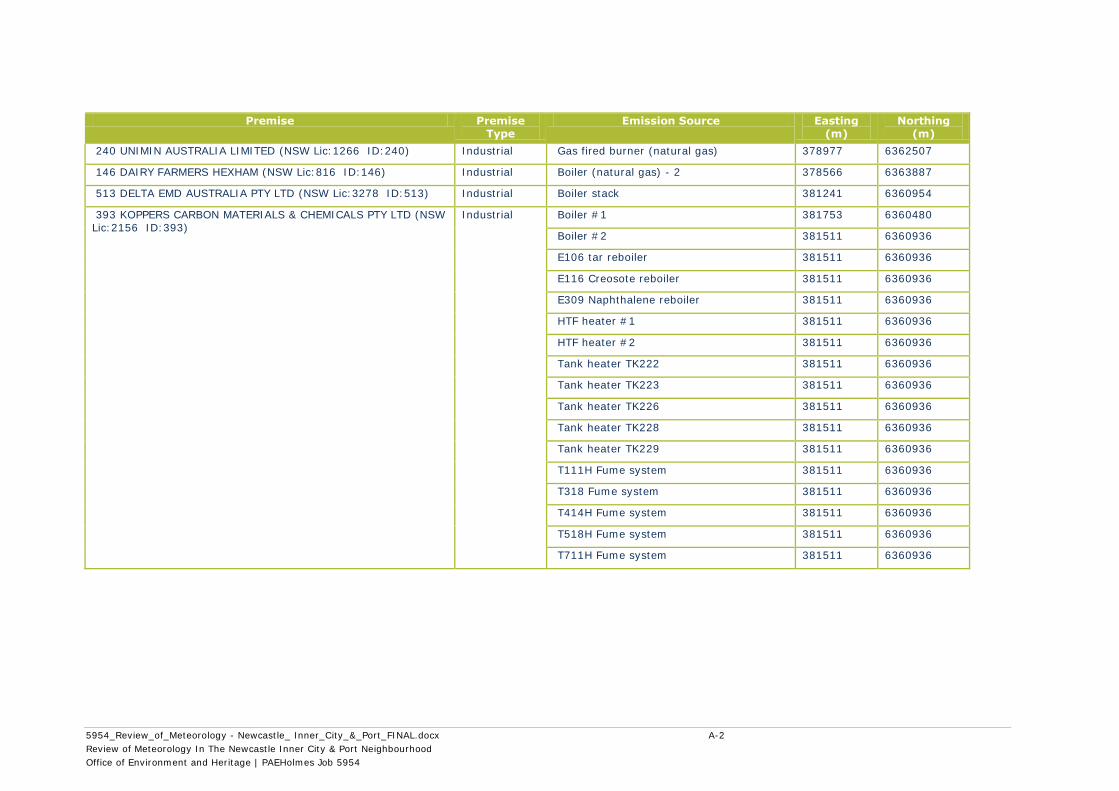
5954_Review_of_Meteorology - Newcastle_ Inner_City_&_Port_FINAL.docx A-2
Review of Meteorology In The Newcastle Inner City & Port Neighbourhood
Office of Environment and Heritage | PAEHolmes Job 5954
Premise Premise Type
Emission Source Easting (m)
Northing (m)
240 UNIMIN AUSTRALIA LIMITED (NSW Lic:1266 ID:240) Industrial Gas fired burner (natural gas) 378977 6362507
146 DAIRY FARMERS HEXHAM (NSW Lic:816 ID:146) Industrial Boiler (natural gas) - 2 378566 6363887
513 DELTA EMD AUSTRALIA PTY LTD (NSW Lic:3278 ID:513) Industrial Boiler stack 381241 6360954
393 KOPPERS CARBON MATERIALS & CHEMICALS PTY LTD (NSW Lic:2156 ID:393)
Industrial Boiler #1 381753 6360480
Boiler #2 381511 6360936
E106 tar reboiler 381511 6360936
E116 Creosote reboiler 381511 6360936
E309 Naphthalene reboiler 381511 6360936
HTF heater #1 381511 6360936
HTF heater #2 381511 6360936
Tank heater TK222 381511 6360936
Tank heater TK223 381511 6360936
Tank heater TK226 381511 6360936
Tank heater TK228 381511 6360936
Tank heater TK229 381511 6360936
T111H Fume system 381511 6360936
T318 Fume system 381511 6360936
T414H Fume system 381511 6360936
T518H Fume system 381511 6360936
T711H Fume system 381511 6360936
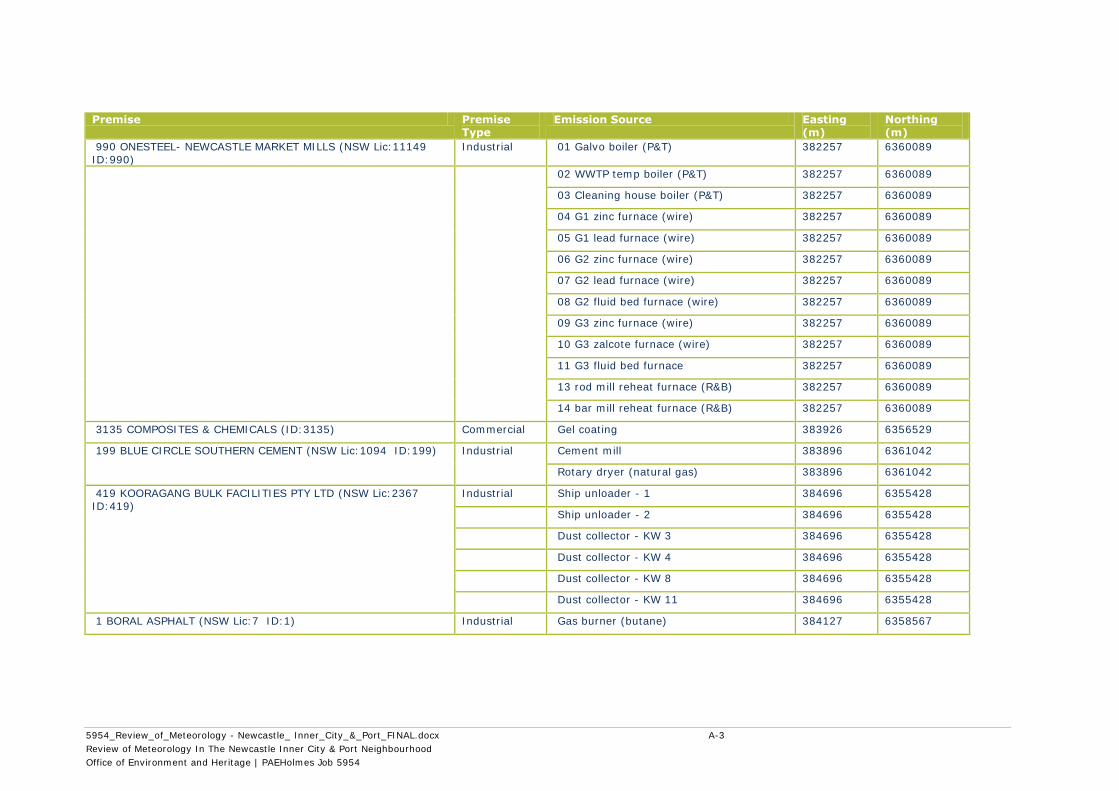
5954_Review_of_Meteorology - Newcastle_ Inner_City_&_Port_FINAL.docx A-3
Review of Meteorology In The Newcastle Inner City & Port Neighbourhood
Office of Environment and Heritage | PAEHolmes Job 5954
Premise Premise Type
Emission Source Easting (m)
Northing (m)
990 ONESTEEL- NEWCASTLE MARKET MILLS (NSW Lic:11149 ID:990)
Industrial 01 Galvo boiler (P&T) 382257 6360089
02 WWTP temp boiler (P&T) 382257 6360089
03 Cleaning house boiler (P&T) 382257 6360089
04 G1 zinc furnace (wire) 382257 6360089
05 G1 lead furnace (wire) 382257 6360089
06 G2 zinc furnace (wire) 382257 6360089
07 G2 lead furnace (wire) 382257 6360089
08 G2 fluid bed furnace (wire) 382257 6360089
09 G3 zinc furnace (wire) 382257 6360089
10 G3 zalcote furnace (wire) 382257 6360089
11 G3 fluid bed furnace 382257 6360089
13 rod mill reheat furnace (R&B) 382257 6360089
14 bar mill reheat furnace (R&B) 382257 6360089
3135 COMPOSITES & CHEMICALS (ID:3135) Commercial Gel coating 383926 6356529
199 BLUE CIRCLE SOUTHERN CEMENT (NSW Lic:1094 ID:199) Industrial Cement mill 383896 6361042
Rotary dryer (natural gas) 383896 6361042
419 KOORAGANG BULK FACILITIES PTY LTD (NSW Lic:2367 ID:419)
Industrial Ship unloader - 1 384696 6355428
Ship unloader - 2 384696 6355428
Dust collector - KW 3 384696 6355428
Dust collector - KW 4 384696 6355428
Dust collector - KW 8 384696 6355428
Dust collector - KW 11 384696 6355428
1 BORAL ASPHALT (NSW Lic:7 ID:1) Industrial Gas burner (butane) 384127 6358567
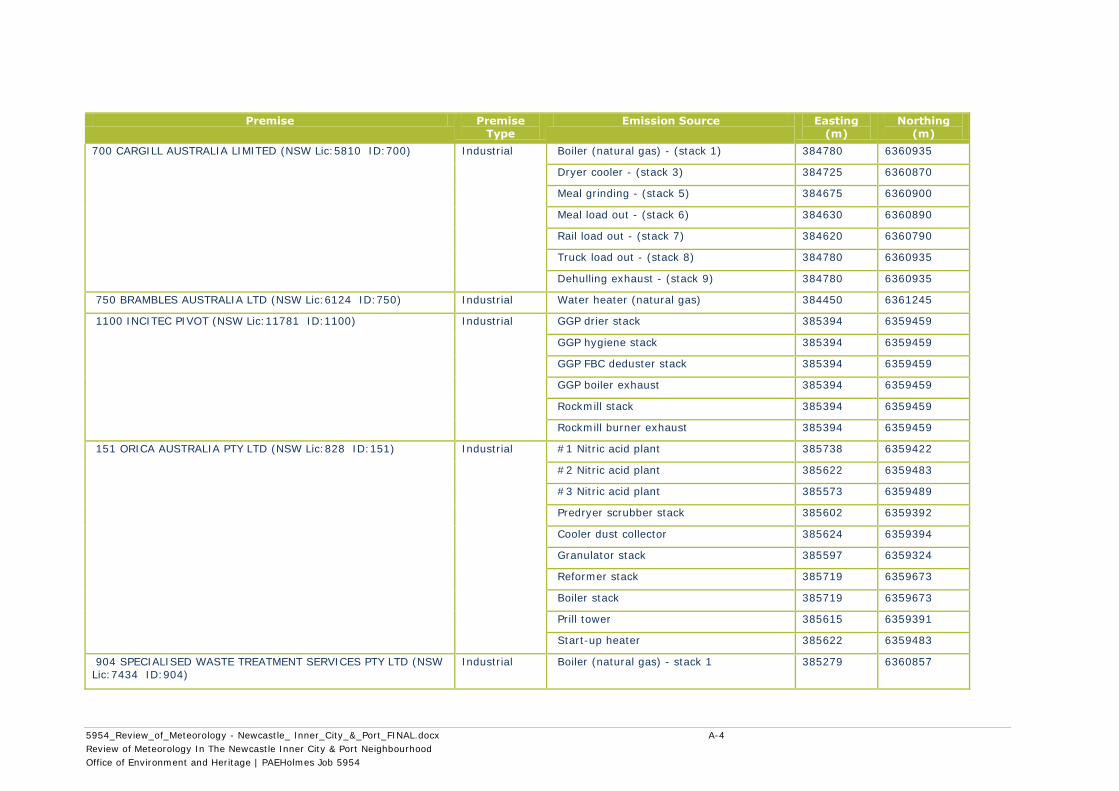
5954_Review_of_Meteorology - Newcastle_ Inner_City_&_Port_FINAL.docx A-4
Review of Meteorology In The Newcastle Inner City & Port Neighbourhood
Office of Environment and Heritage | PAEHolmes Job 5954
Premise Premise Type
Emission Source Easting (m)
Northing (m)
700 CARGILL AUSTRALIA LIMITED (NSW Lic:5810 ID:700) Industrial Boiler (natural gas) - (stack 1) 384780 6360935
Dryer cooler - (stack 3) 384725 6360870
Meal grinding - (stack 5) 384675 6360900
Meal load out - (stack 6) 384630 6360890
Rail load out - (stack 7) 384620 6360790
Truck load out - (stack 8) 384780 6360935
Dehulling exhaust - (stack 9) 384780 6360935
750 BRAMBLES AUSTRALIA LTD (NSW Lic:6124 ID:750) Industrial Water heater (natural gas) 384450 6361245
1100 INCITEC PIVOT (NSW Lic:11781 ID:1100) Industrial GGP drier stack 385394 6359459
GGP hygiene stack 385394 6359459
GGP FBC deduster stack 385394 6359459
GGP boiler exhaust 385394 6359459
Rockmill stack 385394 6359459
Rockmill burner exhaust 385394 6359459
151 ORICA AUSTRALIA PTY LTD (NSW Lic:828 ID:151) Industrial #1 Nitric acid plant 385738 6359422
#2 Nitric acid plant 385622 6359483
#3 Nitric acid plant 385573 6359489
Predryer scrubber stack 385602 6359392
Cooler dust collector 385624 6359394
Granulator stack 385597 6359324
Reformer stack 385719 6359673
Boiler stack 385719 6359673
Prill tower 385615 6359391
Start-up heater 385622 6359483
904 SPECIALISED WASTE TREATMENT SERVICES PTY LTD (NSW Lic:7434 ID:904)
Industrial Boiler (natural gas) - stack 1 385279 6360857
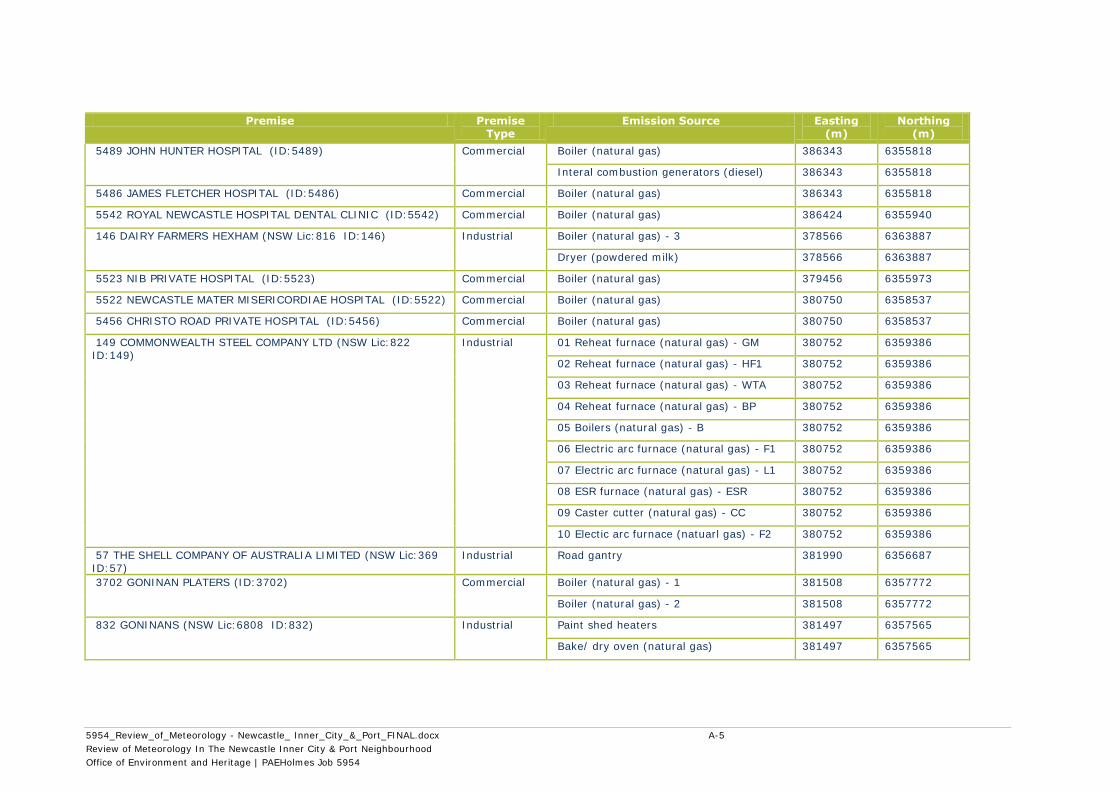
5954_Review_of_Meteorology - Newcastle_ Inner_City_&_Port_FINAL.docx A-5
Review of Meteorology In The Newcastle Inner City & Port Neighbourhood
Office of Environment and Heritage | PAEHolmes Job 5954
Premise Premise Type
Emission Source Easting (m)
Northing (m)
5489 JOHN HUNTER HOSPITAL (ID:5489) Commercial Boiler (natural gas) 386343 6355818
Interal combustion generators (diesel) 386343 6355818
5486 JAMES FLETCHER HOSPITAL (ID:5486) Commercial Boiler (natural gas) 386343 6355818
5542 ROYAL NEWCASTLE HOSPITAL DENTAL CLINIC (ID:5542) Commercial Boiler (natural gas) 386424 6355940
146 DAIRY FARMERS HEXHAM (NSW Lic:816 ID:146) Industrial Boiler (natural gas) - 3 378566 6363887
Dryer (powdered milk) 378566 6363887
5523 NIB PRIVATE HOSPITAL (ID:5523) Commercial Boiler (natural gas) 379456 6355973
5522 NEWCASTLE MATER MISERICORDIAE HOSPITAL (ID:5522) Commercial Boiler (natural gas) 380750 6358537
5456 CHRISTO ROAD PRIVATE HOSPITAL (ID:5456) Commercial Boiler (natural gas) 380750 6358537
149 COMMONWEALTH STEEL COMPANY LTD (NSW Lic:822 ID:149)
Industrial 01 Reheat furnace (natural gas) - GM 380752 6359386
02 Reheat furnace (natural gas) - HF1 380752 6359386
03 Reheat furnace (natural gas) - WTA 380752 6359386
04 Reheat furnace (natural gas) - BP 380752 6359386
05 Boilers (natural gas) - B 380752 6359386
06 Electric arc furnace (natural gas) - F1 380752 6359386
07 Electric arc furnace (natural gas) - L1 380752 6359386
08 ESR furnace (natural gas) - ESR 380752 6359386
09 Caster cutter (natural gas) - CC 380752 6359386
10 Electic arc furnace (natuarl gas) - F2 380752 6359386
57 THE SHELL COMPANY OF AUSTRALIA LIMITED (NSW Lic:369 ID:57)
Industrial Road gantry 381990 6356687
3702 GONINAN PLATERS (ID:3702) Commercial Boiler (natural gas) - 1 381508 6357772
Boiler (natural gas) - 2 381508 6357772
832 GONINANS (NSW Lic:6808 ID:832) Industrial Paint shed heaters 381497 6357565
Bake/ dry oven (natural gas) 381497 6357565
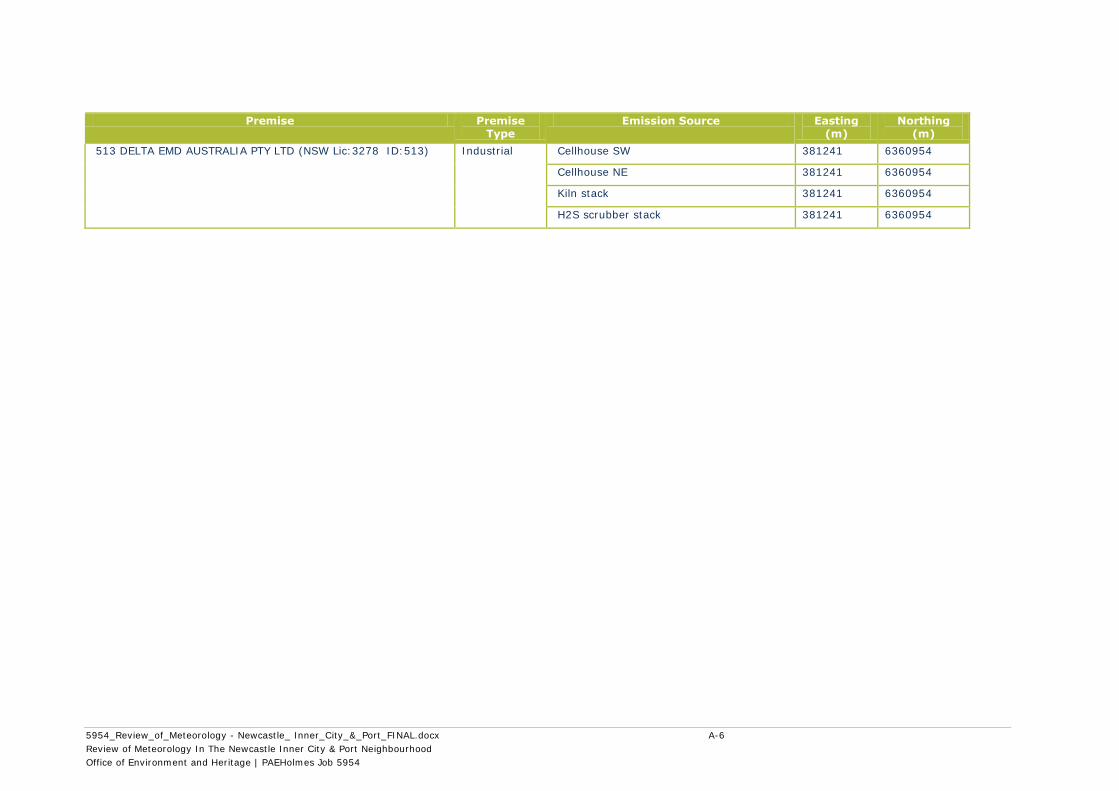
5954_Review_of_Meteorology - Newcastle_ Inner_City_&_Port_FINAL.docx A-6
Review of Meteorology In The Newcastle Inner City & Port Neighbourhood
Office of Environment and Heritage | PAEHolmes Job 5954
Premise Premise Type
Emission Source Easting (m)
Northing (m)
513 DELTA EMD AUSTRALIA PTY LTD (NSW Lic:3278 ID:513) Industrial Cellhouse SW 381241 6360954
Cellhouse NE 381241 6360954
Kiln stack 381241 6360954
H2S scrubber stack 381241 6360954
5954_Review_of_Meteorology - Newcastle_ Inner_City_&_Port_FINAL.docx B-1
Review of Meteorology In The Newcastle Inner City & Port Neighbourhood
Office of Environment and Heritage | PAEHolmes Job 5954
APPENDIX B
Seasonal Windroses for Meteorological Stations
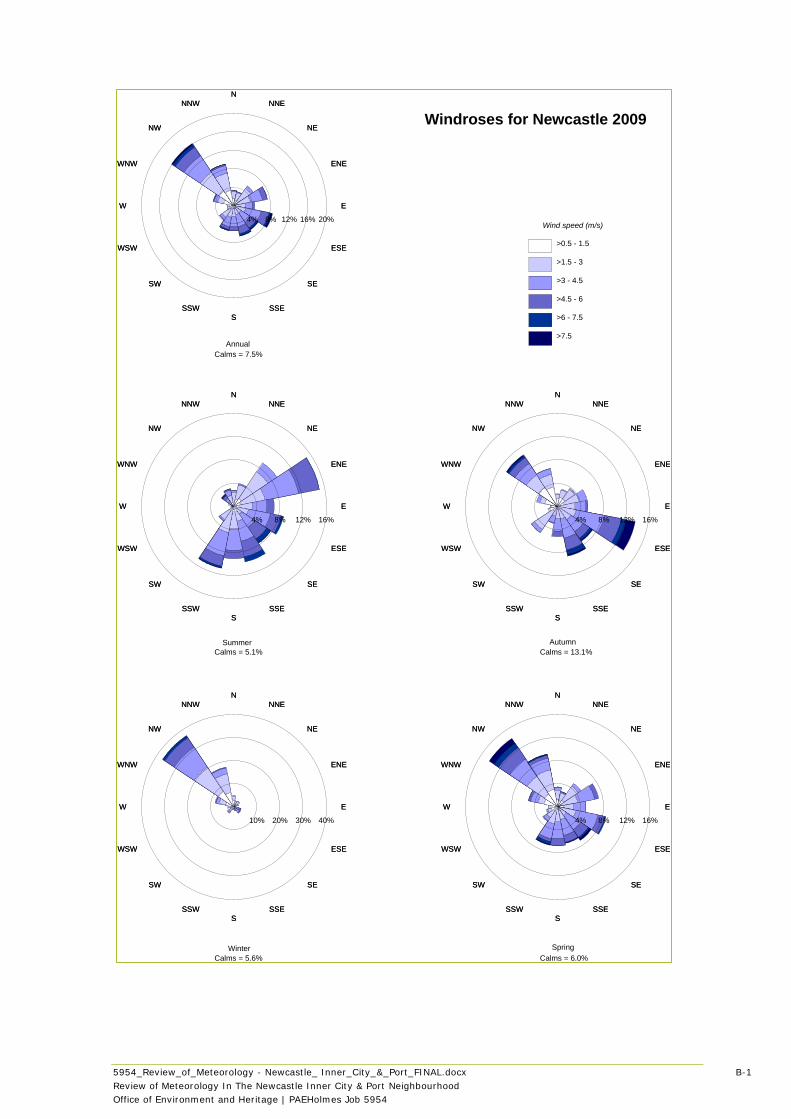
5954_Review_of_Meteorology - Newcastle_ Inner_City_&_Port_FINAL.docx B-1
Review of Meteorology In The Newcastle Inner City & Port Neighbourhood
Office of Environment and Heritage | PAEHolmes Job 5954
NN
NNENNE
NENE
ENEENE
EE
ESEESE
SESE
SSESSE
SS
SSWSSW
SWSW
WSWWSW
WW
WNWWNW
NWNW
NNWNNW
4% 8% 12% 16%
NN
NNENNE
NENE
ENEENE
EE
ESEESE
SESE
SSESSE
SS
SSWSSW
SWSW
WSWWSW
WW
WNWWNW
NWNW
NNWNNW
10% 20% 30% 40%
NN
NNENNE
NENE
ENEENE
EE
ESEESE
SESE
SSESSE
SS
SSWSSW
SWSW
WSWWSW
WW
WNWWNW
NWNW
NNWNNW
4% 8% 12% 16%
NN
NNENNE
NENE
ENEENE
EE
ESEESE
SESE
SSESSE
SS
SSWSSW
SWSW
WSWWSW
WW
WNWWNW
NWNW
NNWNNW
4% 8% 12% 16%
NN
NNENNE
NENE
ENEENE
EE
ESEESE
SESE
SSESSE
SS
SSWSSW
SWSW
WSWWSW
WW
WNWWNW
NWNW
NNWNNW
4% 8% 12% 16% 20%Wind speed (m/s)
>0.5 - 1.5
>1.5 - 3
>3 - 4.5
>4.5 - 6
>6 - 7.5
>7.5
Windroses for Newcastle 2009
SpringWinter
AutumnSummer
Annual
Calms = 7.5%
Calms = 5.1% Calms = 13.1%
Calms = 5.6% Calms = 6.0%
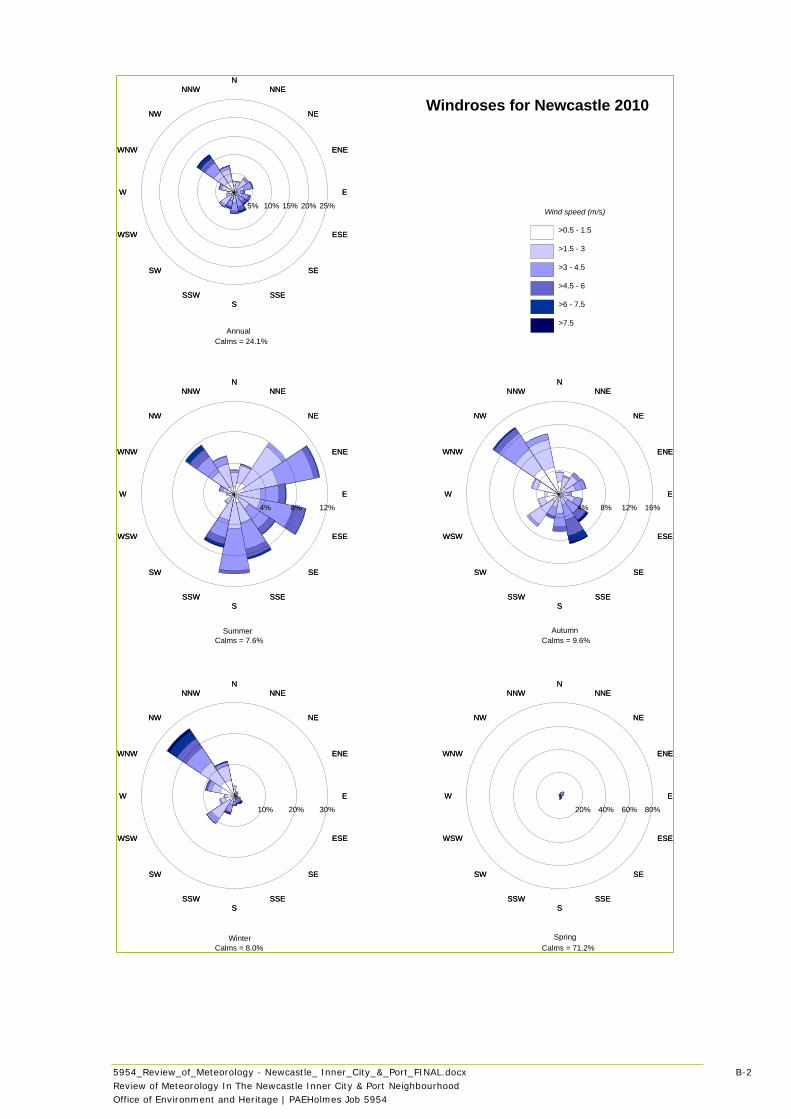
5954_Review_of_Meteorology - Newcastle_ Inner_City_&_Port_FINAL.docx B-2
Review of Meteorology In The Newcastle Inner City & Port Neighbourhood
Office of Environment and Heritage | PAEHolmes Job 5954
NN
NNENNE
NENE
ENEENE
EE
ESEESE
SESE
SSESSE
SS
SSWSSW
SWSW
WSWWSW
WW
WNWWNW
NWNW
NNWNNW
20% 40% 60% 80%
NN
NNENNE
NENE
ENEENE
EE
ESEESE
SESE
SSESSE
SS
SSWSSW
SWSW
WSWWSW
WW
WNWWNW
NWNW
NNWNNW
10% 20% 30%
NN
NNENNE
NENE
ENEENE
EE
ESEESE
SESE
SSESSE
SS
SSWSSW
SWSW
WSWWSW
WW
WNWWNW
NWNW
NNWNNW
4% 8% 12% 16%
NN
NNENNE
NENE
ENEENE
EE
ESEESE
SESE
SSESSE
SS
SSWSSW
SWSW
WSWWSW
WW
WNWWNW
NWNW
NNWNNW
4% 8% 12%
NN
NNENNE
NENE
ENEENE
EE
ESEESE
SESE
SSESSE
SS
SSWSSW
SWSW
WSWWSW
WW
WNWWNW
NWNW
NNWNNW
5% 10% 15% 20% 25%Wind speed (m/s)
>0.5 - 1.5
>1.5 - 3
>3 - 4.5
>4.5 - 6
>6 - 7.5
>7.5
Windroses for Newcastle 2010
SpringWinter
AutumnSummer
Annual
Calms = 24.1%
Calms = 7.6% Calms = 9.6%
Calms = 8.0% Calms = 71.2%
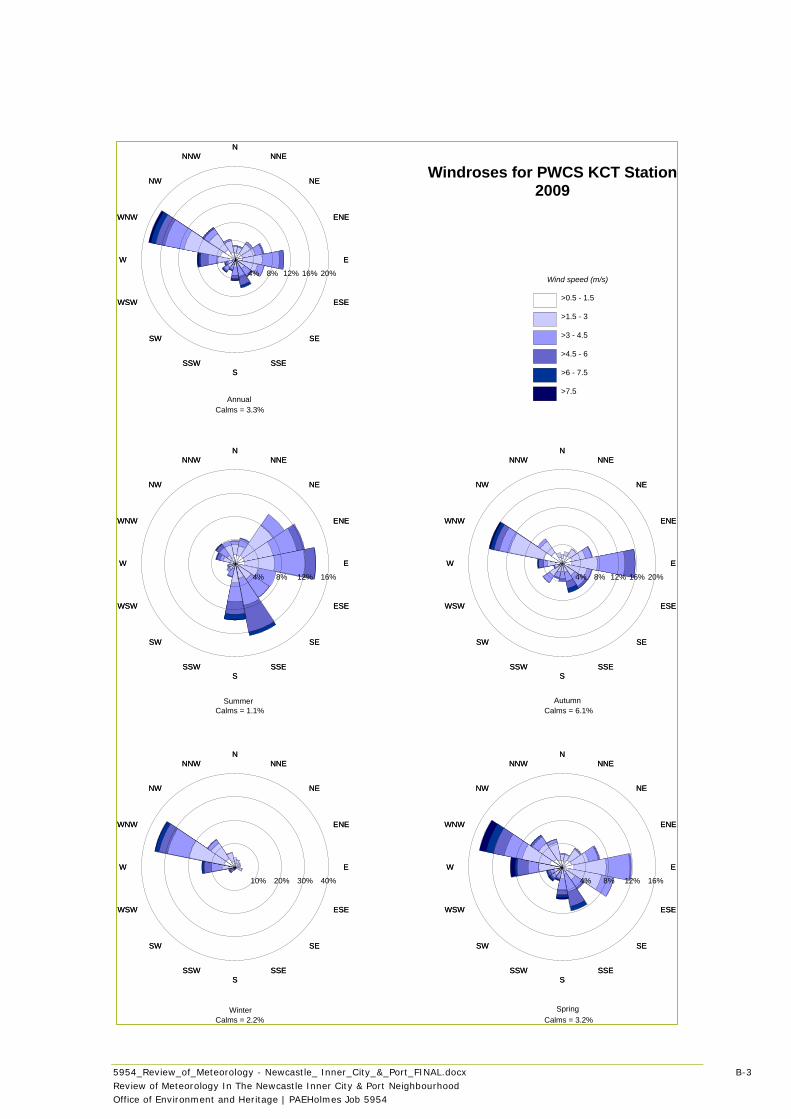
5954_Review_of_Meteorology - Newcastle_ Inner_City_&_Port_FINAL.docx B-3
Review of Meteorology In The Newcastle Inner City & Port Neighbourhood
Office of Environment and Heritage | PAEHolmes Job 5954
NN
NNENNE
NENE
ENEENE
EE
ESEESE
SESE
SSESSE
SS
SSWSSW
SWSW
WSWWSW
WW
WNWWNW
NWNW
NNWNNW
4% 8% 12% 16%
NN
NNENNE
NENE
ENEENE
EE
ESEESE
SESE
SSESSE
SS
SSWSSW
SWSW
WSWWSW
WW
WNWWNW
NWNW
NNWNNW
10% 20% 30% 40%
NN
NNENNE
NENE
ENEENE
EE
ESEESE
SESE
SSESSE
SS
SSWSSW
SWSW
WSWWSW
WW
WNWWNW
NWNW
NNWNNW
4% 8% 12% 16% 20%
NN
NNENNE
NENE
ENEENE
EE
ESEESE
SESE
SSESSE
SS
SSWSSW
SWSW
WSWWSW
WW
WNWWNW
NWNW
NNWNNW
4% 8% 12% 16%
NN
NNENNE
NENE
ENEENE
EE
ESEESE
SESE
SSESSE
SS
SSWSSW
SWSW
WSWWSW
WW
WNWWNW
NWNW
NNWNNW
4% 8% 12% 16% 20%Wind speed (m/s)
>0.5 - 1.5
>1.5 - 3
>3 - 4.5
>4.5 - 6
>6 - 7.5
>7.5
Windroses for PWCS KCT Station2009
SpringWinter
AutumnSummer
Annual
Calms = 3.3%
Calms = 1.1% Calms = 6.1%
Calms = 2.2% Calms = 3.2%
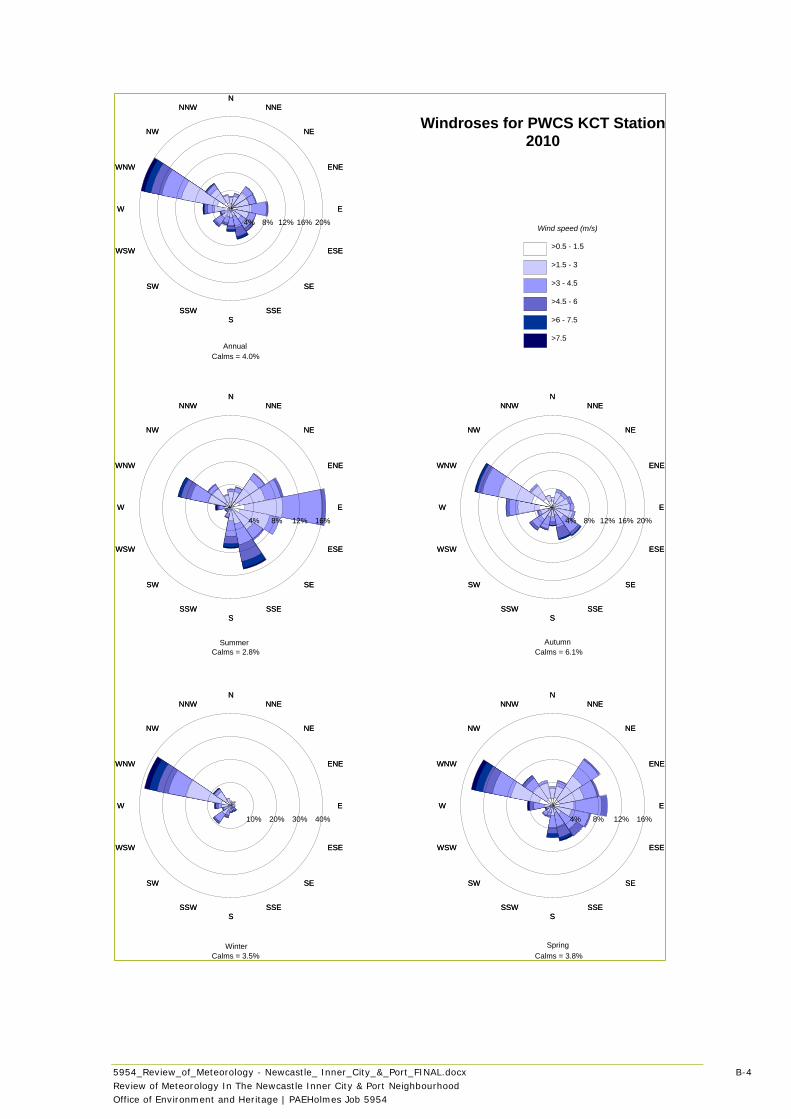
5954_Review_of_Meteorology - Newcastle_ Inner_City_&_Port_FINAL.docx B-4
Review of Meteorology In The Newcastle Inner City & Port Neighbourhood
Office of Environment and Heritage | PAEHolmes Job 5954
NN
NNENNE
NENE
ENEENE
EE
ESEESE
SESE
SSESSE
SS
SSWSSW
SWSW
WSWWSW
WW
WNWWNW
NWNW
NNWNNW
4% 8% 12% 16%
NN
NNENNE
NENE
ENEENE
EE
ESEESE
SESE
SSESSE
SS
SSWSSW
SWSW
WSWWSW
WW
WNWWNW
NWNW
NNWNNW
10% 20% 30% 40%
NN
NNENNE
NENE
ENEENE
EE
ESEESE
SESE
SSESSE
SS
SSWSSW
SWSW
WSWWSW
WW
WNWWNW
NWNW
NNWNNW
4% 8% 12% 16% 20%
NN
NNENNE
NENE
ENEENE
EE
ESEESE
SESE
SSESSE
SS
SSWSSW
SWSW
WSWWSW
WW
WNWWNW
NWNW
NNWNNW
4% 8% 12% 16%
NN
NNENNE
NENE
ENEENE
EE
ESEESE
SESE
SSESSE
SS
SSWSSW
SWSW
WSWWSW
WW
WNWWNW
NWNW
NNWNNW
4% 8% 12% 16% 20%Wind speed (m/s)
>0.5 - 1.5
>1.5 - 3
>3 - 4.5
>4.5 - 6
>6 - 7.5
>7.5
Windroses for PWCS KCT Station2010
SpringWinter
AutumnSummer
Annual
Calms = 4.0%
Calms = 2.8% Calms = 6.1%
Calms = 3.5% Calms = 3.8%
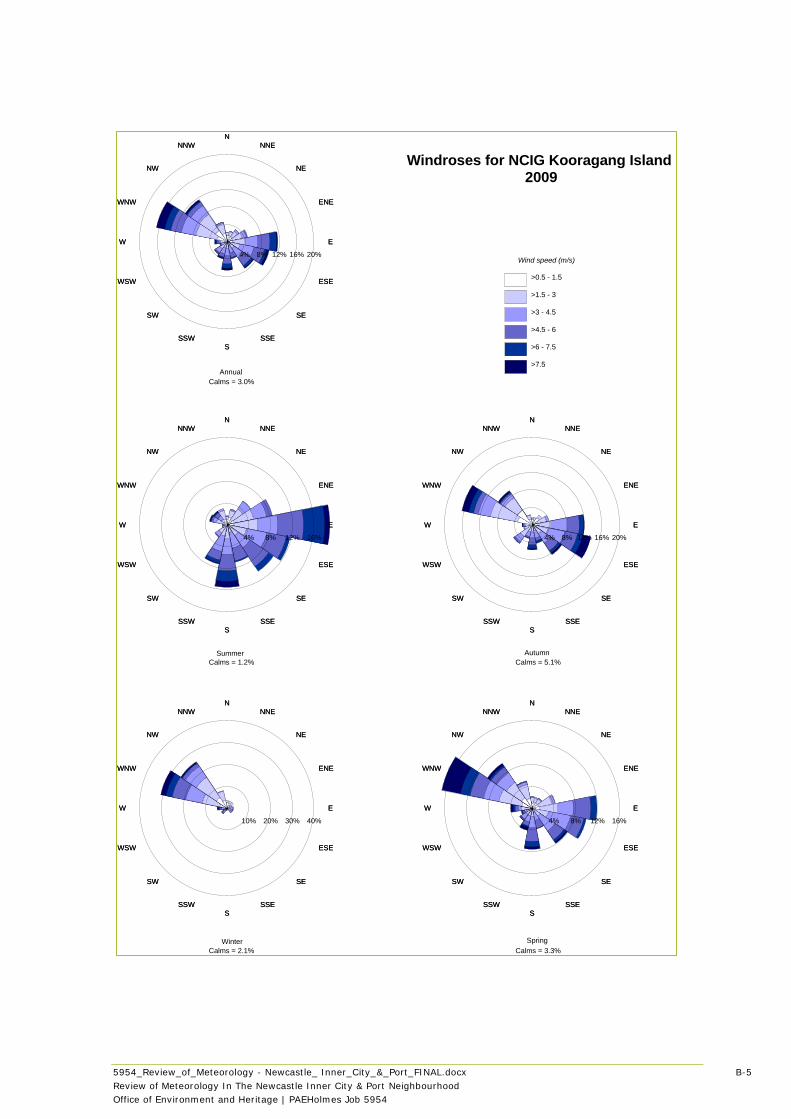
5954_Review_of_Meteorology - Newcastle_ Inner_City_&_Port_FINAL.docx B-5
Review of Meteorology In The Newcastle Inner City & Port Neighbourhood
Office of Environment and Heritage | PAEHolmes Job 5954
NN
NNENNE
NENE
ENEENE
EE
ESEESE
SESE
SSESSE
SS
SSWSSW
SWSW
WSWWSW
WW
WNWWNW
NWNW
NNWNNW
4% 8% 12% 16%
NN
NNENNE
NENE
ENEENE
EE
ESEESE
SESE
SSESSE
SS
SSWSSW
SWSW
WSWWSW
WW
WNWWNW
NWNW
NNWNNW
10% 20% 30% 40%
NN
NNENNE
NENE
ENEENE
EE
ESEESE
SESE
SSESSE
SS
SSWSSW
SWSW
WSWWSW
WW
WNWWNW
NWNW
NNWNNW
4% 8% 12% 16% 20%
NN
NNENNE
NENE
ENEENE
EE
ESEESE
SESE
SSESSE
SS
SSWSSW
SWSW
WSWWSW
WW
WNWWNW
NWNW
NNWNNW
4% 8% 12% 16%
NN
NNENNE
NENE
ENEENE
EE
ESEESE
SESE
SSESSE
SS
SSWSSW
SWSW
WSWWSW
WW
WNWWNW
NWNW
NNWNNW
4% 8% 12% 16% 20%Wind speed (m/s)
>0.5 - 1.5
>1.5 - 3
>3 - 4.5
>4.5 - 6
>6 - 7.5
>7.5
Windroses for NCIG Kooragang Island 2009
SpringWinter
AutumnSummer
Annual
Calms = 3.0%
Calms = 1.2% Calms = 5.1%
Calms = 2.1% Calms = 3.3%
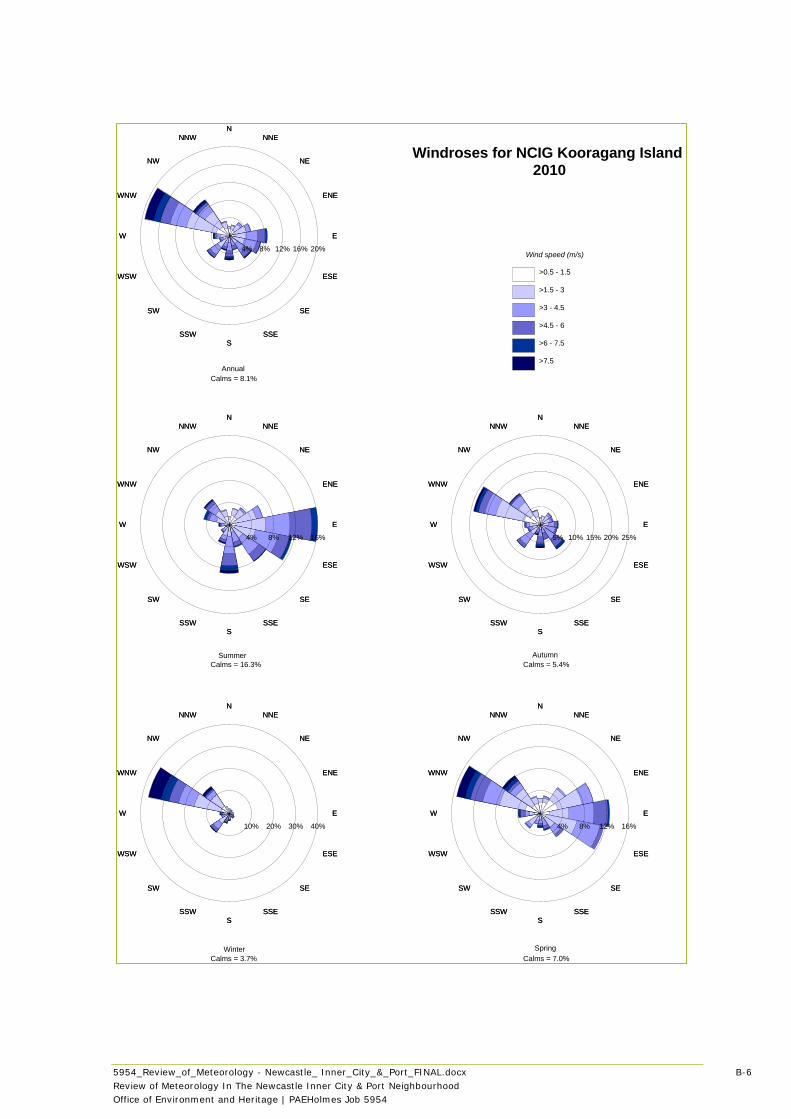
5954_Review_of_Meteorology - Newcastle_ Inner_City_&_Port_FINAL.docx B-6
Review of Meteorology In The Newcastle Inner City & Port Neighbourhood
Office of Environment and Heritage | PAEHolmes Job 5954
NN
NNENNE
NENE
ENEENE
EE
ESEESE
SESE
SSESSE
SS
SSWSSW
SWSW
WSWWSW
WW
WNWWNW
NWNW
NNWNNW
4% 8% 12% 16%
NN
NNENNE
NENE
ENEENE
EE
ESEESE
SESE
SSESSE
SS
SSWSSW
SWSW
WSWWSW
WW
WNWWNW
NWNW
NNWNNW
10% 20% 30% 40%
NN
NNENNE
NENE
ENEENE
EE
ESEESE
SESE
SSESSE
SS
SSWSSW
SWSW
WSWWSW
WW
WNWWNW
NWNW
NNWNNW
5% 10% 15% 20% 25%
NN
NNENNE
NENE
ENEENE
EE
ESEESE
SESE
SSESSE
SS
SSWSSW
SWSW
WSWWSW
WW
WNWWNW
NWNW
NNWNNW
4% 8% 12% 16%
NN
NNENNE
NENE
ENEENE
EE
ESEESE
SESE
SSESSE
SS
SSWSSW
SWSW
WSWWSW
WW
WNWWNW
NWNW
NNWNNW
4% 8% 12% 16% 20%Wind speed (m/s)
>0.5 - 1.5
>1.5 - 3
>3 - 4.5
>4.5 - 6
>6 - 7.5
>7.5
Windroses for NCIG Kooragang Island 2010
SpringWinter
AutumnSummer
Annual
Calms = 8.1%
Calms = 16.3% Calms = 5.4%
Calms = 3.7% Calms = 7.0%
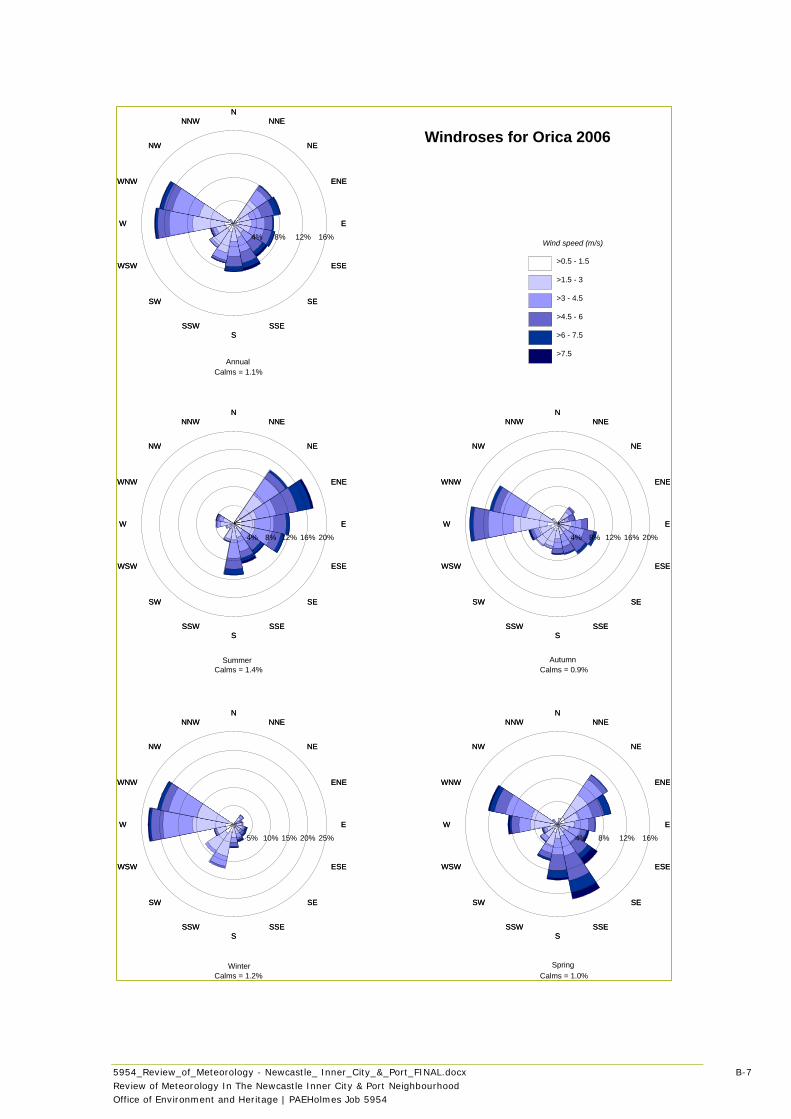
5954_Review_of_Meteorology - Newcastle_ Inner_City_&_Port_FINAL.docx B-7
Review of Meteorology In The Newcastle Inner City & Port Neighbourhood
Office of Environment and Heritage | PAEHolmes Job 5954
NN
NNENNE
NENE
ENEENE
EE
ESEESE
SESE
SSESSE
SS
SSWSSW
SWSW
WSWWSW
WW
WNWWNW
NWNW
NNWNNW
4% 8% 12% 16%
NN
NNENNE
NENE
ENEENE
EE
ESEESE
SESE
SSESSE
SS
SSWSSW
SWSW
WSWWSW
WW
WNWWNW
NWNW
NNWNNW
5% 10% 15% 20% 25%
NN
NNENNE
NENE
ENEENE
EE
ESEESE
SESE
SSESSE
SS
SSWSSW
SWSW
WSWWSW
WW
WNWWNW
NWNW
NNWNNW
4% 8% 12% 16% 20%
NN
NNENNE
NENE
ENEENE
EE
ESEESE
SESE
SSESSE
SS
SSWSSW
SWSW
WSWWSW
WW
WNWWNW
NWNW
NNWNNW
4% 8% 12% 16% 20%
NN
NNENNE
NENE
ENEENE
EE
ESEESE
SESE
SSESSE
SS
SSWSSW
SWSW
WSWWSW
WW
WNWWNW
NWNW
NNWNNW
4% 8% 12% 16%Wind speed (m/s)
>0.5 - 1.5
>1.5 - 3
>3 - 4.5
>4.5 - 6
>6 - 7.5
>7.5
Windroses for Orica 2006
SpringWinter
AutumnSummer
Annual
Calms = 1.1%
Calms = 1.4% Calms = 0.9%
Calms = 1.2% Calms = 1.0%
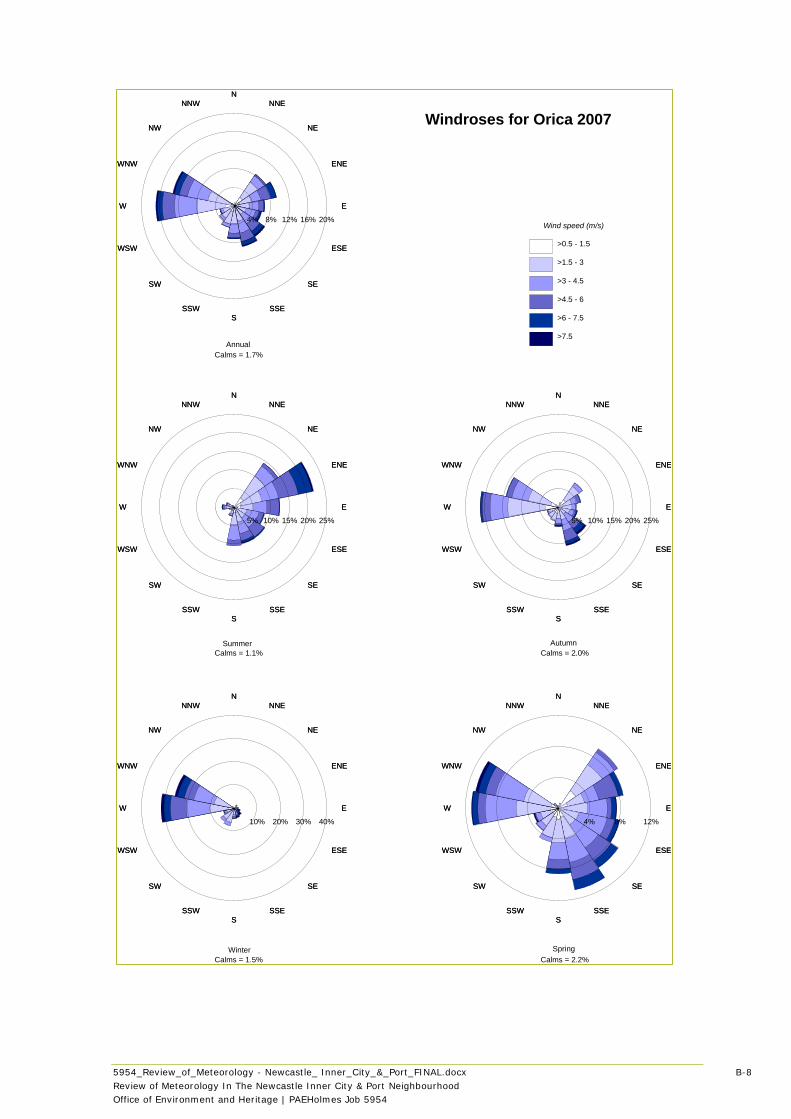
5954_Review_of_Meteorology - Newcastle_ Inner_City_&_Port_FINAL.docx B-8
Review of Meteorology In The Newcastle Inner City & Port Neighbourhood
Office of Environment and Heritage | PAEHolmes Job 5954
NN
NNENNE
NENE
ENEENE
EE
ESEESE
SESE
SSESSE
SS
SSWSSW
SWSW
WSWWSW
WW
WNWWNW
NWNW
NNWNNW
4% 8% 12%
NN
NNENNE
NENE
ENEENE
EE
ESEESE
SESE
SSESSE
SS
SSWSSW
SWSW
WSWWSW
WW
WNWWNW
NWNW
NNWNNW
10% 20% 30% 40%
NN
NNENNE
NENE
ENEENE
EE
ESEESE
SESE
SSESSE
SS
SSWSSW
SWSW
WSWWSW
WW
WNWWNW
NWNW
NNWNNW
5% 10% 15% 20% 25%
NN
NNENNE
NENE
ENEENE
EE
ESEESE
SESE
SSESSE
SS
SSWSSW
SWSW
WSWWSW
WW
WNWWNW
NWNW
NNWNNW
5% 10% 15% 20% 25%
NN
NNENNE
NENE
ENEENE
EE
ESEESE
SESE
SSESSE
SS
SSWSSW
SWSW
WSWWSW
WW
WNWWNW
NWNW
NNWNNW
4% 8% 12% 16% 20%Wind speed (m/s)
>0.5 - 1.5
>1.5 - 3
>3 - 4.5
>4.5 - 6
>6 - 7.5
>7.5
Windroses for Orica 2007
SpringWinter
AutumnSummer
Annual
Calms = 1.7%
Calms = 1.1% Calms = 2.0%
Calms = 1.5% Calms = 2.2%
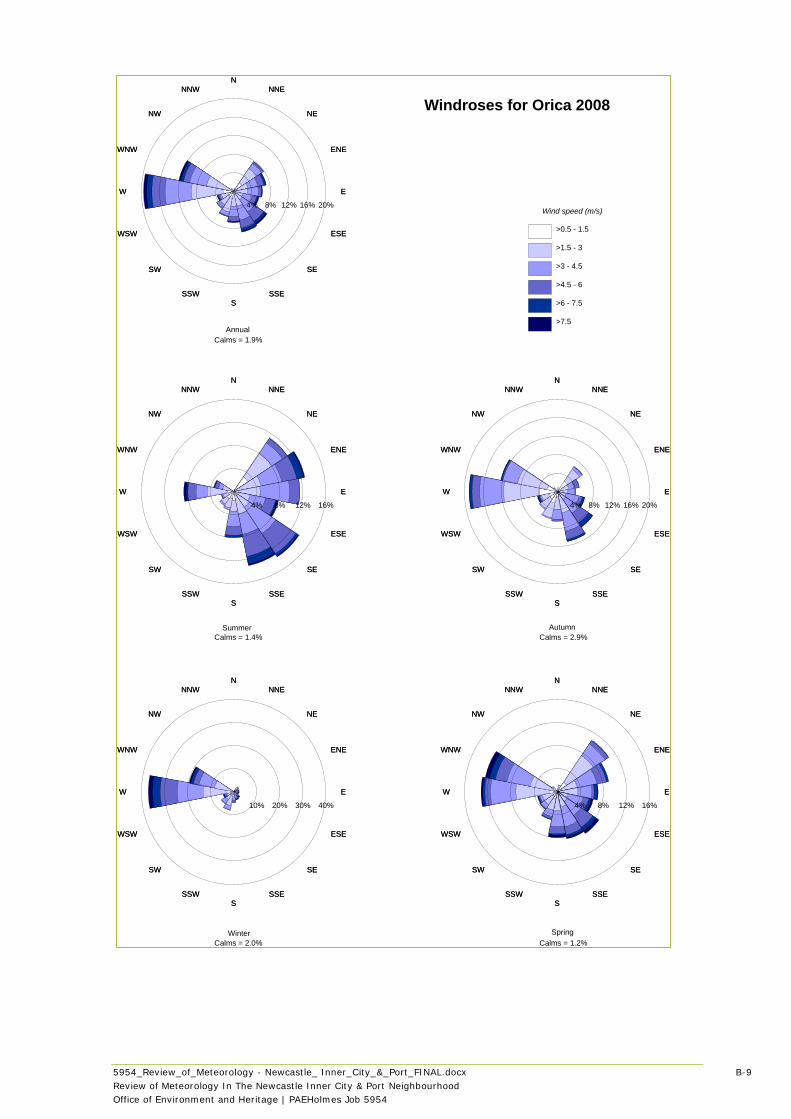
5954_Review_of_Meteorology - Newcastle_ Inner_City_&_Port_FINAL.docx B-9
Review of Meteorology In The Newcastle Inner City & Port Neighbourhood
Office of Environment and Heritage | PAEHolmes Job 5954
NN
NNENNE
NENE
ENEENE
EE
ESEESE
SESE
SSESSE
SS
SSWSSW
SWSW
WSWWSW
WW
WNWWNW
NWNW
NNWNNW
4% 8% 12% 16%
NN
NNENNE
NENE
ENEENE
EE
ESEESE
SESE
SSESSE
SS
SSWSSW
SWSW
WSWWSW
WW
WNWWNW
NWNW
NNWNNW
10% 20% 30% 40%
NN
NNENNE
NENE
ENEENE
EE
ESEESE
SESE
SSESSE
SS
SSWSSW
SWSW
WSWWSW
WW
WNWWNW
NWNW
NNWNNW
4% 8% 12% 16% 20%
NN
NNENNE
NENE
ENEENE
EE
ESEESE
SESE
SSESSE
SS
SSWSSW
SWSW
WSWWSW
WW
WNWWNW
NWNW
NNWNNW
4% 8% 12% 16%
NN
NNENNE
NENE
ENEENE
EE
ESEESE
SESE
SSESSE
SS
SSWSSW
SWSW
WSWWSW
WW
WNWWNW
NWNW
NNWNNW
4% 8% 12% 16% 20%Wind speed (m/s)
>0.5 - 1.5
>1.5 - 3
>3 - 4.5
>4.5 - 6
>6 - 7.5
>7.5
Windroses for Orica 2008
SpringWinter
AutumnSummer
Annual
Calms = 1.9%
Calms = 1.4% Calms = 2.9%
Calms = 2.0% Calms = 1.2%
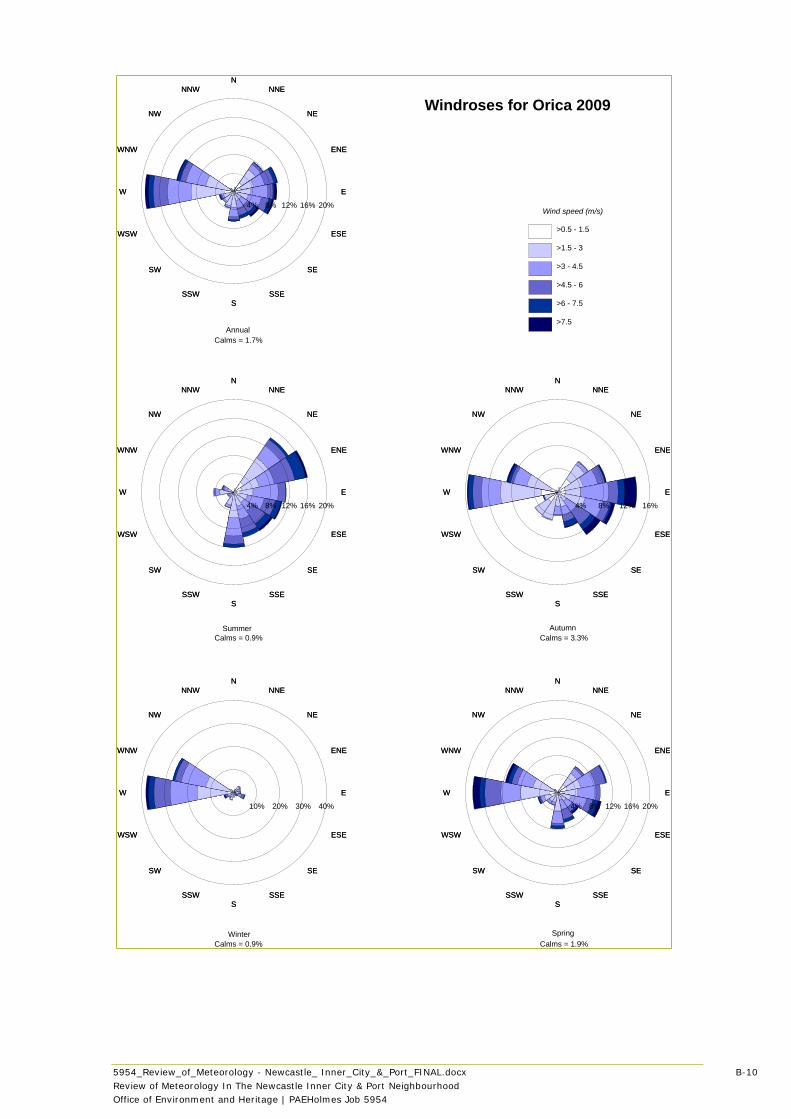
5954_Review_of_Meteorology - Newcastle_ Inner_City_&_Port_FINAL.docx B-10
Review of Meteorology In The Newcastle Inner City & Port Neighbourhood
Office of Environment and Heritage | PAEHolmes Job 5954
NN
NNENNE
NENE
ENEENE
EE
ESEESE
SESE
SSESSE
SS
SSWSSW
SWSW
WSWWSW
WW
WNWWNW
NWNW
NNWNNW
4% 8% 12% 16% 20%
NN
NNENNE
NENE
ENEENE
EE
ESEESE
SESE
SSESSE
SS
SSWSSW
SWSW
WSWWSW
WW
WNWWNW
NWNW
NNWNNW
10% 20% 30% 40%
NN
NNENNE
NENE
ENEENE
EE
ESEESE
SESE
SSESSE
SS
SSWSSW
SWSW
WSWWSW
WW
WNWWNW
NWNW
NNWNNW
4% 8% 12% 16%
NN
NNENNE
NENE
ENEENE
EE
ESEESE
SESE
SSESSE
SS
SSWSSW
SWSW
WSWWSW
WW
WNWWNW
NWNW
NNWNNW
4% 8% 12% 16% 20%
NN
NNENNE
NENE
ENEENE
EE
ESEESE
SESE
SSESSE
SS
SSWSSW
SWSW
WSWWSW
WW
WNWWNW
NWNW
NNWNNW
4% 8% 12% 16% 20%Wind speed (m/s)
>0.5 - 1.5
>1.5 - 3
>3 - 4.5
>4.5 - 6
>6 - 7.5
>7.5
Windroses for Orica 2009
SpringWinter
AutumnSummer
Annual
Calms = 1.7%
Calms = 0.9% Calms = 3.3%
Calms = 0.9% Calms = 1.9%
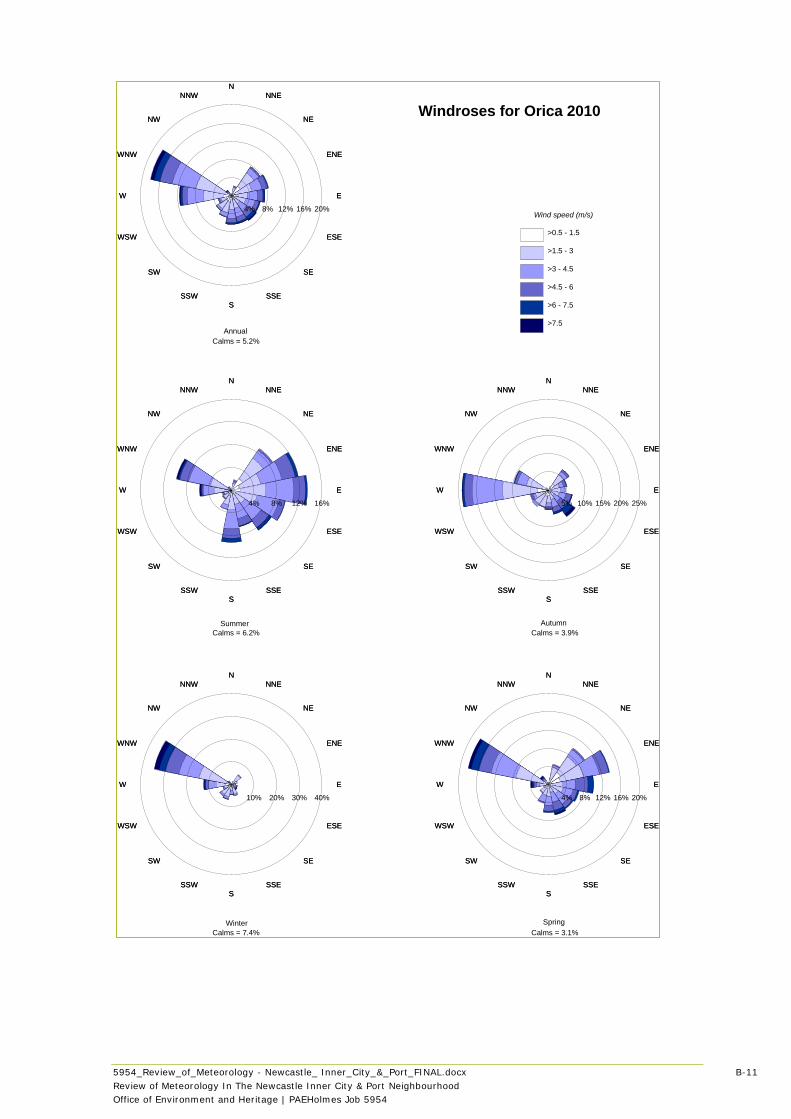
5954_Review_of_Meteorology - Newcastle_ Inner_City_&_Port_FINAL.docx B-11
Review of Meteorology In The Newcastle Inner City & Port Neighbourhood
Office of Environment and Heritage | PAEHolmes Job 5954
NN
NNENNE
NENE
ENEENE
EE
ESEESE
SESE
SSESSE
SS
SSWSSW
SWSW
WSWWSW
WW
WNWWNW
NWNW
NNWNNW
4% 8% 12% 16% 20%
NN
NNENNE
NENE
ENEENE
EE
ESEESE
SESE
SSESSE
SS
SSWSSW
SWSW
WSWWSW
WW
WNWWNW
NWNW
NNWNNW
10% 20% 30% 40%
NN
NNENNE
NENE
ENEENE
EE
ESEESE
SESE
SSESSE
SS
SSWSSW
SWSW
WSWWSW
WW
WNWWNW
NWNW
NNWNNW
5% 10% 15% 20% 25%
NN
NNENNE
NENE
ENEENE
EE
ESEESE
SESE
SSESSE
SS
SSWSSW
SWSW
WSWWSW
WW
WNWWNW
NWNW
NNWNNW
4% 8% 12% 16%
NN
NNENNE
NENE
ENEENE
EE
ESEESE
SESE
SSESSE
SS
SSWSSW
SWSW
WSWWSW
WW
WNWWNW
NWNW
NNWNNW
4% 8% 12% 16% 20%Wind speed (m/s)
>0.5 - 1.5
>1.5 - 3
>3 - 4.5
>4.5 - 6
>6 - 7.5
>7.5
Windroses for Orica 2010
SpringWinter
AutumnSummer
Annual
Calms = 5.2%
Calms = 6.2% Calms = 3.9%
Calms = 7.4% Calms = 3.1%
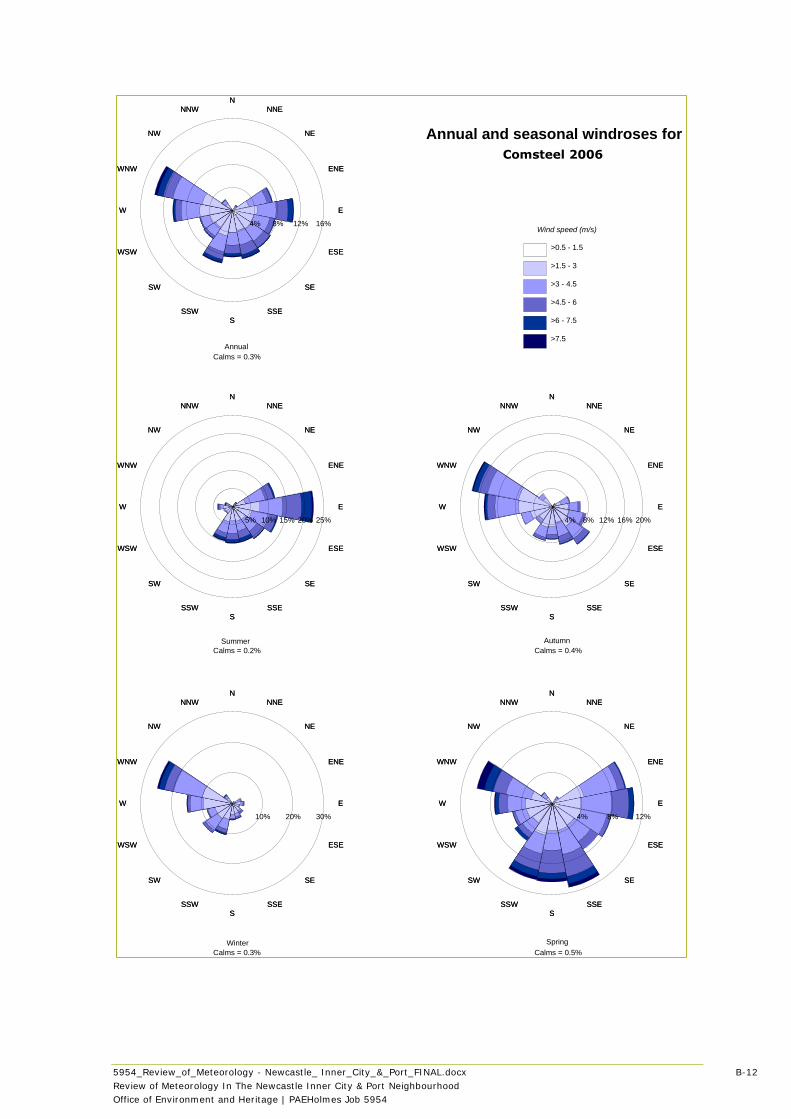
5954_Review_of_Meteorology - Newcastle_ Inner_City_&_Port_FINAL.docx B-12
Review of Meteorology In The Newcastle Inner City & Port Neighbourhood
Office of Environment and Heritage | PAEHolmes Job 5954
NN
NNENNE
NENE
ENEENE
EE
ESEESE
SESE
SSESSE
SS
SSWSSW
SWSW
WSWWSW
WW
WNWWNW
NWNW
NNWNNW
4% 8% 12%
NN
NNENNE
NENE
ENEENE
EE
ESEESE
SESE
SSESSE
SS
SSWSSW
SWSW
WSWWSW
WW
WNWWNW
NWNW
NNWNNW
10% 20% 30%
NN
NNENNE
NENE
ENEENE
EE
ESEESE
SESE
SSESSE
SS
SSWSSW
SWSW
WSWWSW
WW
WNWWNW
NWNW
NNWNNW
4% 8% 12% 16% 20%
NN
NNENNE
NENE
ENEENE
EE
ESEESE
SESE
SSESSE
SS
SSWSSW
SWSW
WSWWSW
WW
WNWWNW
NWNW
NNWNNW
5% 10% 15% 20% 25%
NN
NNENNE
NENE
ENEENE
EE
ESEESE
SESE
SSESSE
SS
SSWSSW
SWSW
WSWWSW
WW
WNWWNW
NWNW
NNWNNW
4% 8% 12% 16%Wind speed (m/s)
>0.5 - 1.5
>1.5 - 3
>3 - 4.5
>4.5 - 6
>6 - 7.5
>7.5
Annual and seasonal windroses for
Comsteel (2006)
SpringWinter
AutumnSummer
Annual
Calms = 0.3%
Calms = 0.2% Calms = 0.4%
Calms = 0.3% Calms = 0.5%
Comsteel 2006
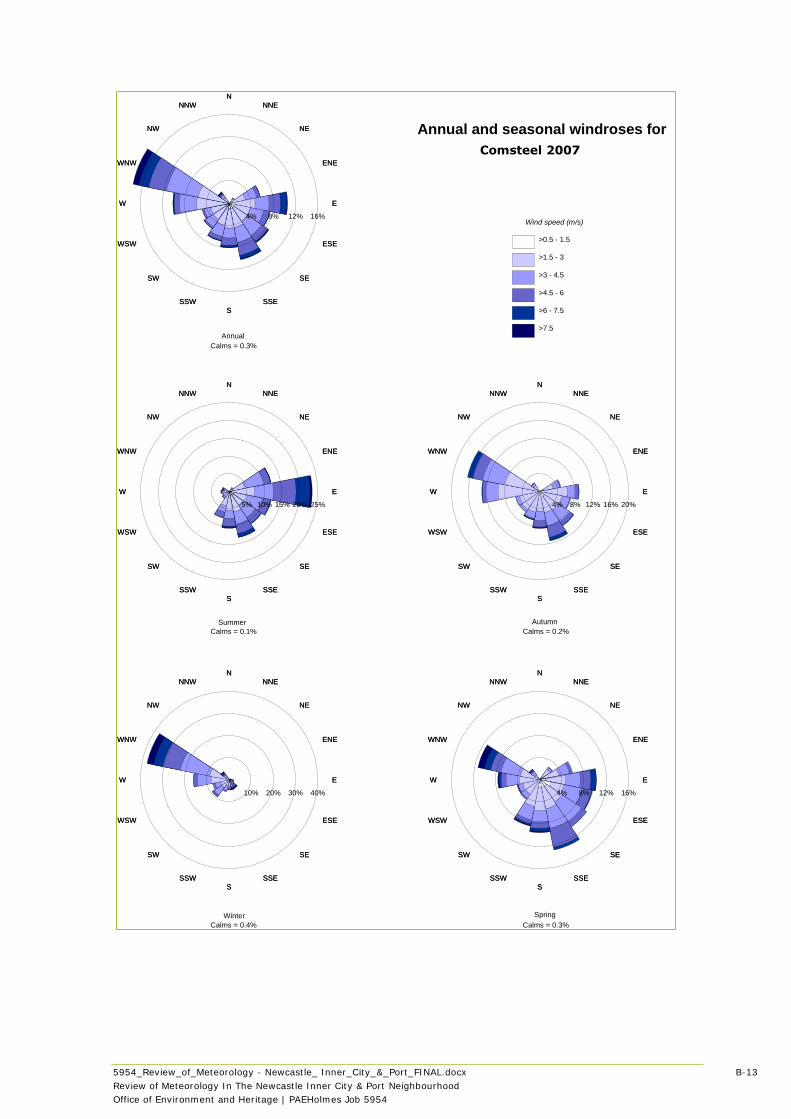
5954_Review_of_Meteorology - Newcastle_ Inner_City_&_Port_FINAL.docx B-13
Review of Meteorology In The Newcastle Inner City & Port Neighbourhood
Office of Environment and Heritage | PAEHolmes Job 5954
NN
NNENNE
NENE
ENEENE
EE
ESEESE
SESE
SSESSE
SS
SSWSSW
SWSW
WSWWSW
WW
WNWWNW
NWNW
NNWNNW
4% 8% 12% 16%
NN
NNENNE
NENE
ENEENE
EE
ESEESE
SESE
SSESSE
SS
SSWSSW
SWSW
WSWWSW
WW
WNWWNW
NWNW
NNWNNW
10% 20% 30% 40%
NN
NNENNE
NENE
ENEENE
EE
ESEESE
SESE
SSESSE
SS
SSWSSW
SWSW
WSWWSW
WW
WNWWNW
NWNW
NNWNNW
4% 8% 12% 16% 20%
NN
NNENNE
NENE
ENEENE
EE
ESEESE
SESE
SSESSE
SS
SSWSSW
SWSW
WSWWSW
WW
WNWWNW
NWNW
NNWNNW
5% 10% 15% 20% 25%
NN
NNENNE
NENE
ENEENE
EE
ESEESE
SESE
SSESSE
SS
SSWSSW
SWSW
WSWWSW
WW
WNWWNW
NWNW
NNWNNW
4% 8% 12% 16%Wind speed (m/s)
>0.5 - 1.5
>1.5 - 3
>3 - 4.5
>4.5 - 6
>6 - 7.5
>7.5
Annual and seasonal windroses for
Comsteel (2007)
SpringWinter
AutumnSummer
Annual
Calms = 0.3%
Calms = 0.1% Calms = 0.2%
Calms = 0.4% Calms = 0.3%
Comsteel 2007
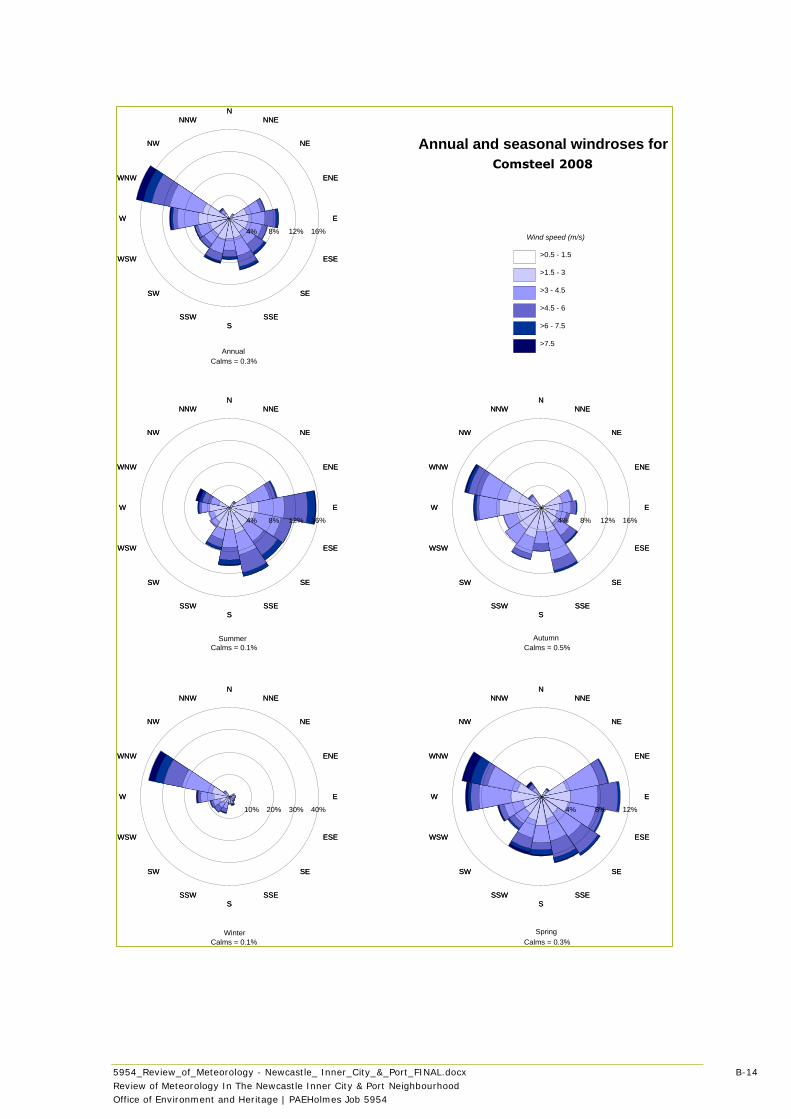
5954_Review_of_Meteorology - Newcastle_ Inner_City_&_Port_FINAL.docx B-14
Review of Meteorology In The Newcastle Inner City & Port Neighbourhood
Office of Environment and Heritage | PAEHolmes Job 5954
NN
NNENNE
NENE
ENEENE
EE
ESEESE
SESE
SSESSE
SS
SSWSSW
SWSW
WSWWSW
WW
WNWWNW
NWNW
NNWNNW
4% 8% 12%
NN
NNENNE
NENE
ENEENE
EE
ESEESE
SESE
SSESSE
SS
SSWSSW
SWSW
WSWWSW
WW
WNWWNW
NWNW
NNWNNW
10% 20% 30% 40%
NN
NNENNE
NENE
ENEENE
EE
ESEESE
SESE
SSESSE
SS
SSWSSW
SWSW
WSWWSW
WW
WNWWNW
NWNW
NNWNNW
4% 8% 12% 16%
NN
NNENNE
NENE
ENEENE
EE
ESEESE
SESE
SSESSE
SS
SSWSSW
SWSW
WSWWSW
WW
WNWWNW
NWNW
NNWNNW
4% 8% 12% 16%
NN
NNENNE
NENE
ENEENE
EE
ESEESE
SESE
SSESSE
SS
SSWSSW
SWSW
WSWWSW
WW
WNWWNW
NWNW
NNWNNW
4% 8% 12% 16%Wind speed (m/s)
>0.5 - 1.5
>1.5 - 3
>3 - 4.5
>4.5 - 6
>6 - 7.5
>7.5
Annual and seasonal windroses for
Comsteel (2008)
SpringWinter
AutumnSummer
Annual
Calms = 0.3%
Calms = 0.1% Calms = 0.5%
Calms = 0.1% Calms = 0.3%
Comsteel 2008
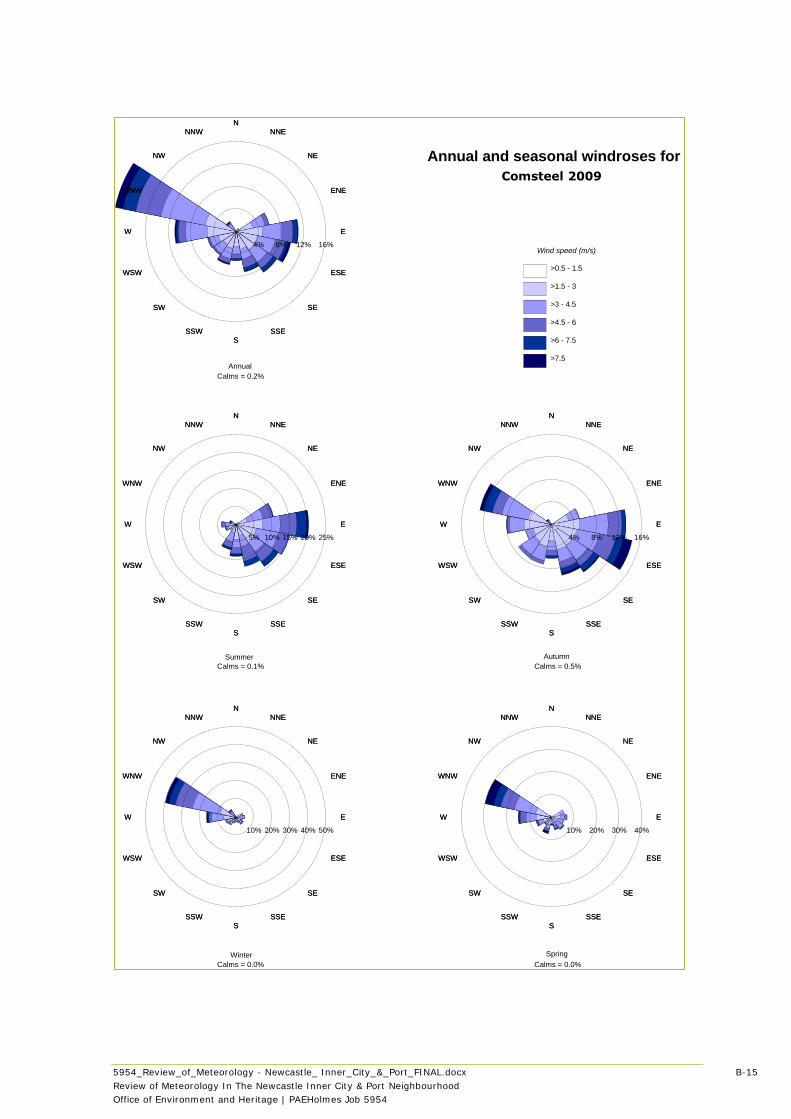
5954_Review_of_Meteorology - Newcastle_ Inner_City_&_Port_FINAL.docx B-15
Review of Meteorology In The Newcastle Inner City & Port Neighbourhood
Office of Environment and Heritage | PAEHolmes Job 5954
NN
NNENNE
NENE
ENEENE
EE
ESEESE
SESE
SSESSE
SS
SSWSSW
SWSW
WSWWSW
WW
WNWWNW
NWNW
NNWNNW
10% 20% 30% 40%
NN
NNENNE
NENE
ENEENE
EE
ESEESE
SESE
SSESSE
SS
SSWSSW
SWSW
WSWWSW
WW
WNWWNW
NWNW
NNWNNW
10% 20% 30% 40% 50%
NN
NNENNE
NENE
ENEENE
EE
ESEESE
SESE
SSESSE
SS
SSWSSW
SWSW
WSWWSW
WW
WNWWNW
NWNW
NNWNNW
4% 8% 12% 16%
NN
NNENNE
NENE
ENEENE
EE
ESEESE
SESE
SSESSE
SS
SSWSSW
SWSW
WSWWSW
WW
WNWWNW
NWNW
NNWNNW
5% 10% 15% 20% 25%
NN
NNENNE
NENE
ENEENE
EE
ESEESE
SESE
SSESSE
SS
SSWSSW
SWSW
WSWWSW
WW
WNWWNW
NWNW
NNWNNW
4% 8% 12% 16%Wind speed (m/s)
>0.5 - 1.5
>1.5 - 3
>3 - 4.5
>4.5 - 6
>6 - 7.5
>7.5
Annual and seasonal windroses for
Comsteel (2009)
SpringWinter
AutumnSummer
Annual
Calms = 0.2%
Calms = 0.1% Calms = 0.5%
Calms = 0.0% Calms = 0.0%
Comsteel 2009
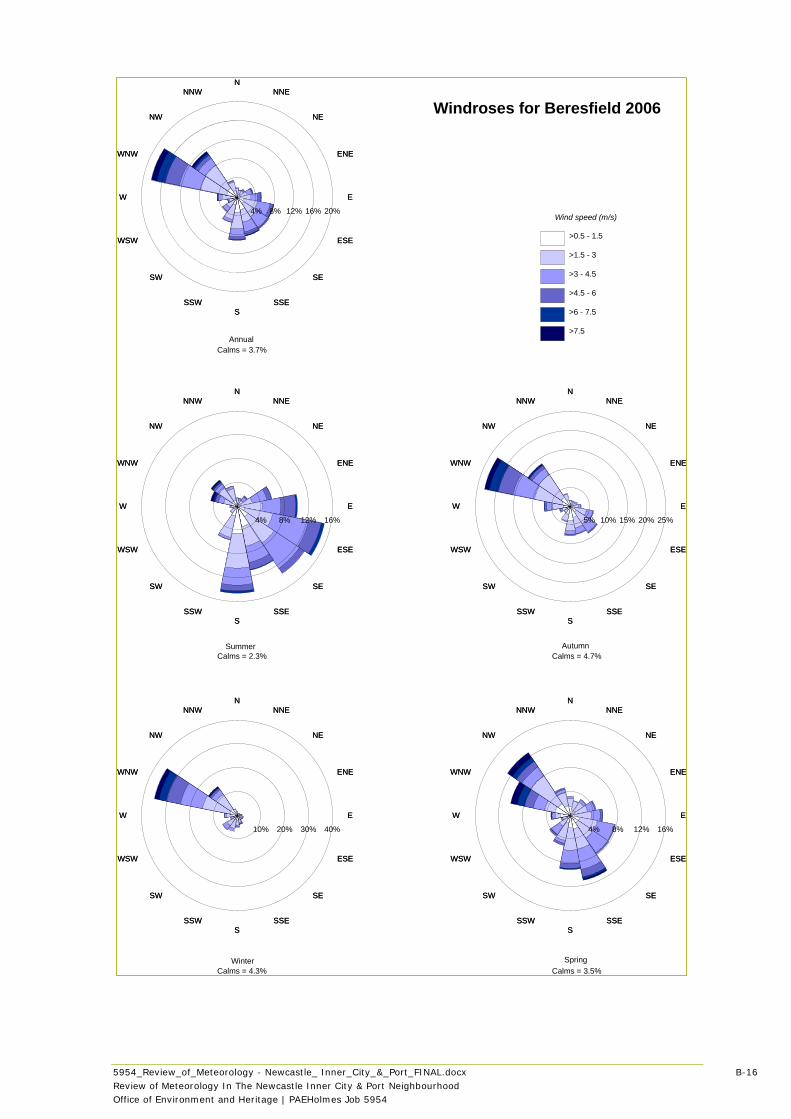
5954_Review_of_Meteorology - Newcastle_ Inner_City_&_Port_FINAL.docx B-16
Review of Meteorology In The Newcastle Inner City & Port Neighbourhood
Office of Environment and Heritage | PAEHolmes Job 5954
NN
NNENNE
NENE
ENEENE
EE
ESEESE
SESE
SSESSE
SS
SSWSSW
SWSW
WSWWSW
WW
WNWWNW
NWNW
NNWNNW
4% 8% 12% 16%
NN
NNENNE
NENE
ENEENE
EE
ESEESE
SESE
SSESSE
SS
SSWSSW
SWSW
WSWWSW
WW
WNWWNW
NWNW
NNWNNW
10% 20% 30% 40%
NN
NNENNE
NENE
ENEENE
EE
ESEESE
SESE
SSESSE
SS
SSWSSW
SWSW
WSWWSW
WW
WNWWNW
NWNW
NNWNNW
5% 10% 15% 20% 25%
NN
NNENNE
NENE
ENEENE
EE
ESEESE
SESE
SSESSE
SS
SSWSSW
SWSW
WSWWSW
WW
WNWWNW
NWNW
NNWNNW
4% 8% 12% 16%
NN
NNENNE
NENE
ENEENE
EE
ESEESE
SESE
SSESSE
SS
SSWSSW
SWSW
WSWWSW
WW
WNWWNW
NWNW
NNWNNW
4% 8% 12% 16% 20%Wind speed (m/s)
>0.5 - 1.5
>1.5 - 3
>3 - 4.5
>4.5 - 6
>6 - 7.5
>7.5
Windroses for Beresfield 2006
SpringWinter
AutumnSummer
Annual
Calms = 3.7%
Calms = 2.3% Calms = 4.7%
Calms = 4.3% Calms = 3.5%
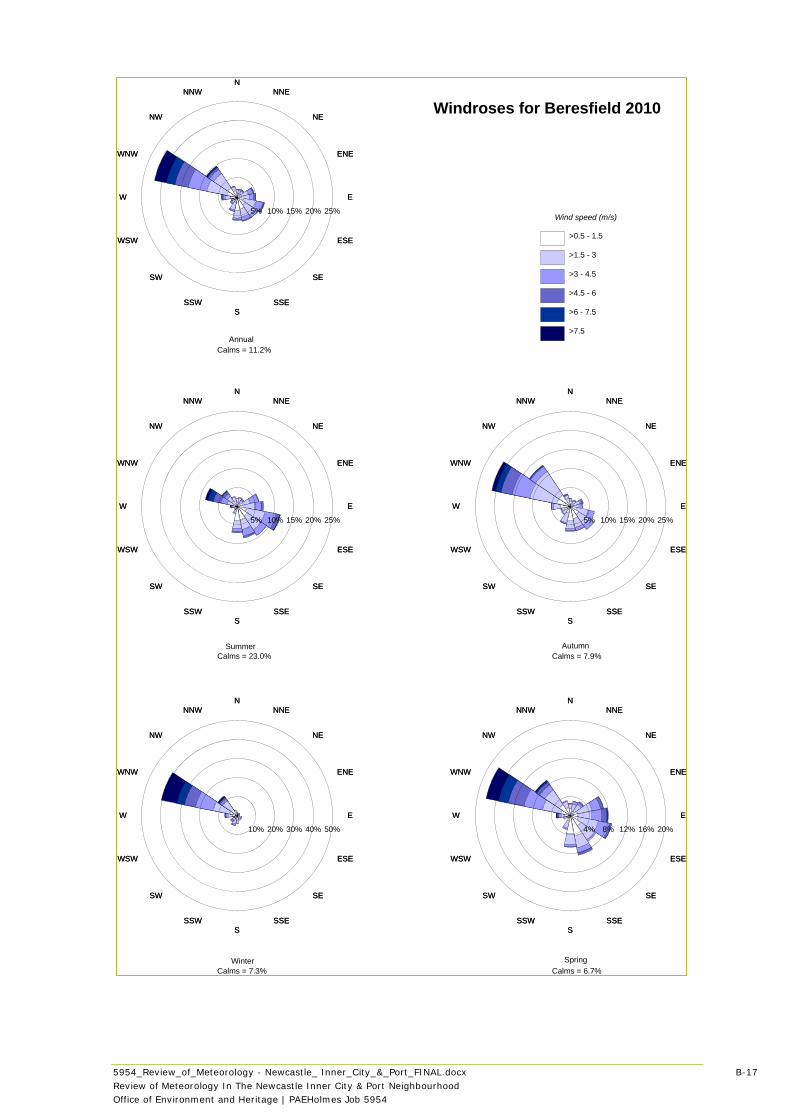
5954_Review_of_Meteorology - Newcastle_ Inner_City_&_Port_FINAL.docx B-17
Review of Meteorology In The Newcastle Inner City & Port Neighbourhood
Office of Environment and Heritage | PAEHolmes Job 5954
NN
NNENNE
NENE
ENEENE
EE
ESEESE
SESE
SSESSE
SS
SSWSSW
SWSW
WSWWSW
WW
WNWWNW
NWNW
NNWNNW
4% 8% 12% 16% 20%
NN
NNENNE
NENE
ENEENE
EE
ESEESE
SESE
SSESSE
SS
SSWSSW
SWSW
WSWWSW
WW
WNWWNW
NWNW
NNWNNW
10% 20% 30% 40% 50%
NN
NNENNE
NENE
ENEENE
EE
ESEESE
SESE
SSESSE
SS
SSWSSW
SWSW
WSWWSW
WW
WNWWNW
NWNW
NNWNNW
5% 10% 15% 20% 25%
NN
NNENNE
NENE
ENEENE
EE
ESEESE
SESE
SSESSE
SS
SSWSSW
SWSW
WSWWSW
WW
WNWWNW
NWNW
NNWNNW
5% 10% 15% 20% 25%
NN
NNENNE
NENE
ENEENE
EE
ESEESE
SESE
SSESSE
SS
SSWSSW
SWSW
WSWWSW
WW
WNWWNW
NWNW
NNWNNW
5% 10% 15% 20% 25%Wind speed (m/s)
>0.5 - 1.5
>1.5 - 3
>3 - 4.5
>4.5 - 6
>6 - 7.5
>7.5
Windroses for Beresfield 2010
SpringWinter
AutumnSummer
Annual
Calms = 11.2%
Calms = 23.0% Calms = 7.9%
Calms = 7.3% Calms = 6.7%
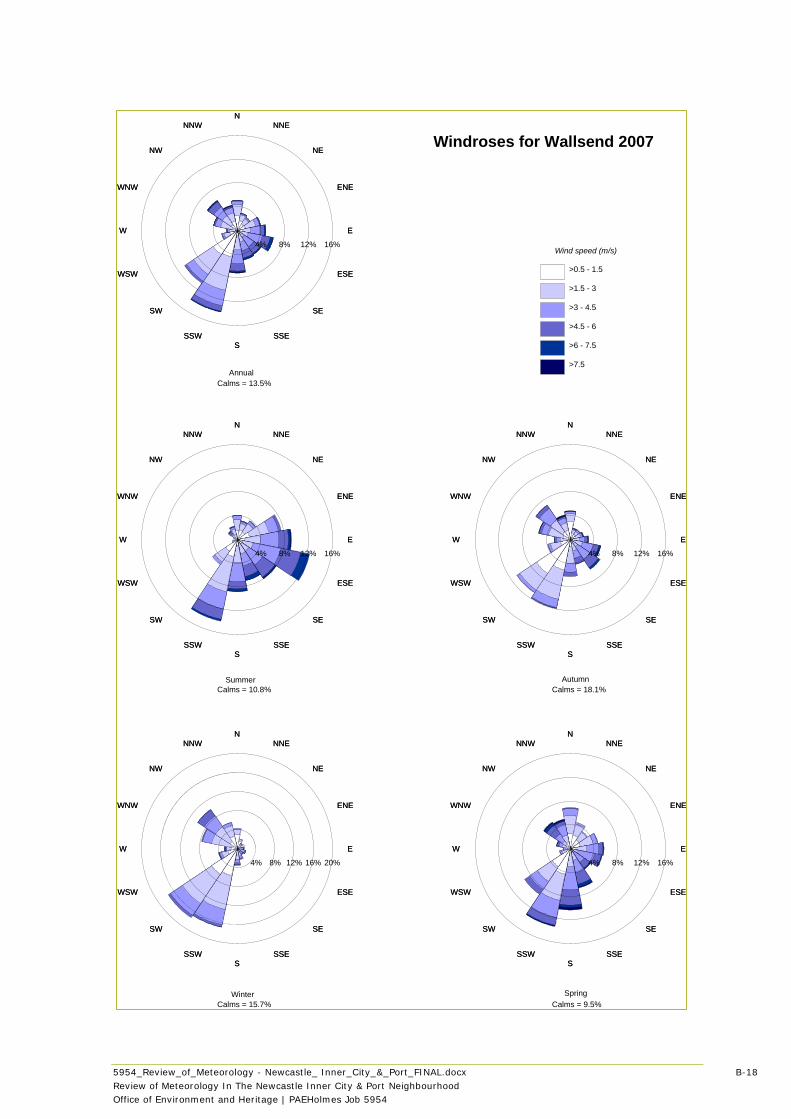
5954_Review_of_Meteorology - Newcastle_ Inner_City_&_Port_FINAL.docx B-18
Review of Meteorology In The Newcastle Inner City & Port Neighbourhood
Office of Environment and Heritage | PAEHolmes Job 5954
NN
NNENNE
NENE
ENEENE
EE
ESEESE
SESE
SSESSE
SS
SSWSSW
SWSW
WSWWSW
WW
WNWWNW
NWNW
NNWNNW
4% 8% 12% 16%
NN
NNENNE
NENE
ENEENE
EE
ESEESE
SESE
SSESSE
SS
SSWSSW
SWSW
WSWWSW
WW
WNWWNW
NWNW
NNWNNW
4% 8% 12% 16% 20%
NN
NNENNE
NENE
ENEENE
EE
ESEESE
SESE
SSESSE
SS
SSWSSW
SWSW
WSWWSW
WW
WNWWNW
NWNW
NNWNNW
4% 8% 12% 16%
NN
NNENNE
NENE
ENEENE
EE
ESEESE
SESE
SSESSE
SS
SSWSSW
SWSW
WSWWSW
WW
WNWWNW
NWNW
NNWNNW
4% 8% 12% 16%
NN
NNENNE
NENE
ENEENE
EE
ESEESE
SESE
SSESSE
SS
SSWSSW
SWSW
WSWWSW
WW
WNWWNW
NWNW
NNWNNW
4% 8% 12% 16%Wind speed (m/s)
>0.5 - 1.5
>1.5 - 3
>3 - 4.5
>4.5 - 6
>6 - 7.5
>7.5
Windroses for Wallsend 2007
SpringWinter
AutumnSummer
Annual
Calms = 13.5%
Calms = 10.8% Calms = 18.1%
Calms = 15.7% Calms = 9.5%
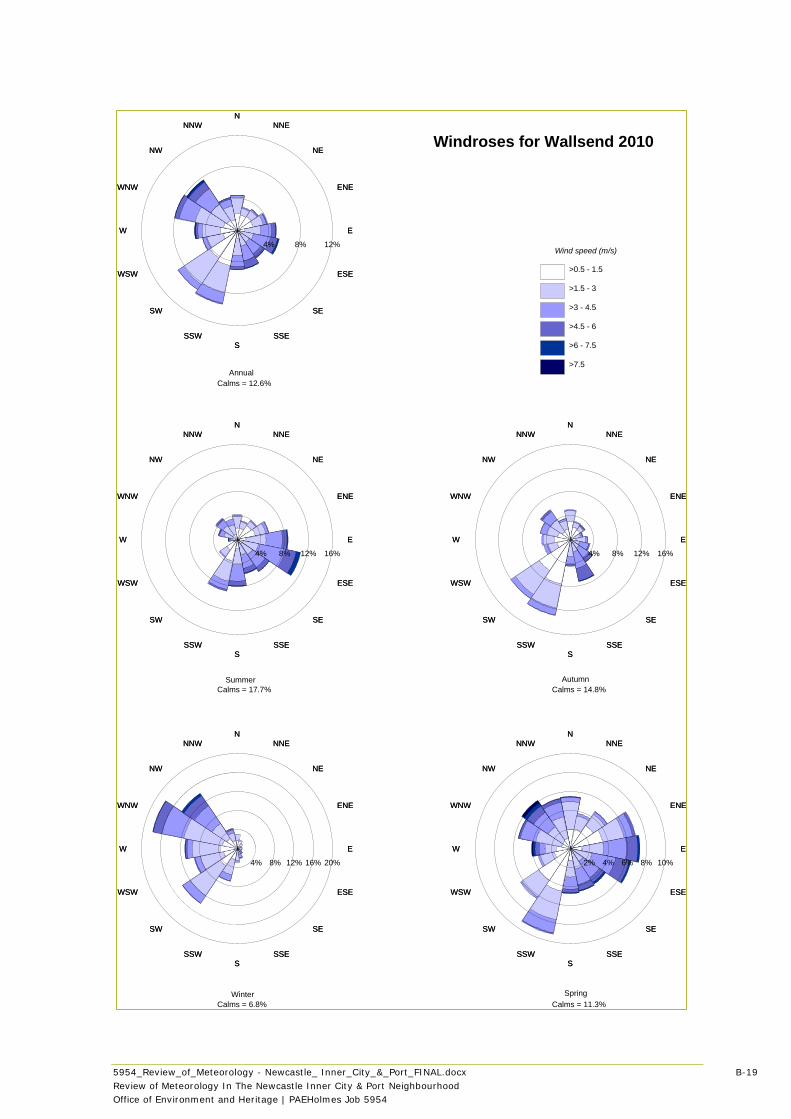
5954_Review_of_Meteorology - Newcastle_ Inner_City_&_Port_FINAL.docx B-19
Review of Meteorology In The Newcastle Inner City & Port Neighbourhood
Office of Environment and Heritage | PAEHolmes Job 5954
NN
NNENNE
NENE
ENEENE
EE
ESEESE
SESE
SSESSE
SS
SSWSSW
SWSW
WSWWSW
WW
WNWWNW
NWNW
NNWNNW
2% 4% 6% 8% 10%
NN
NNENNE
NENE
ENEENE
EE
ESEESE
SESE
SSESSE
SS
SSWSSW
SWSW
WSWWSW
WW
WNWWNW
NWNW
NNWNNW
4% 8% 12% 16% 20%
NN
NNENNE
NENE
ENEENE
EE
ESEESE
SESE
SSESSE
SS
SSWSSW
SWSW
WSWWSW
WW
WNWWNW
NWNW
NNWNNW
4% 8% 12% 16%
NN
NNENNE
NENE
ENEENE
EE
ESEESE
SESE
SSESSE
SS
SSWSSW
SWSW
WSWWSW
WW
WNWWNW
NWNW
NNWNNW
4% 8% 12% 16%
NN
NNENNE
NENE
ENEENE
EE
ESEESE
SESE
SSESSE
SS
SSWSSW
SWSW
WSWWSW
WW
WNWWNW
NWNW
NNWNNW
4% 8% 12%Wind speed (m/s)
>0.5 - 1.5
>1.5 - 3
>3 - 4.5
>4.5 - 6
>6 - 7.5
>7.5
Windroses for Wallsend 2010
SpringWinter
AutumnSummer
Annual
Calms = 12.6%
Calms = 17.7% Calms = 14.8%
Calms = 6.8% Calms = 11.3%
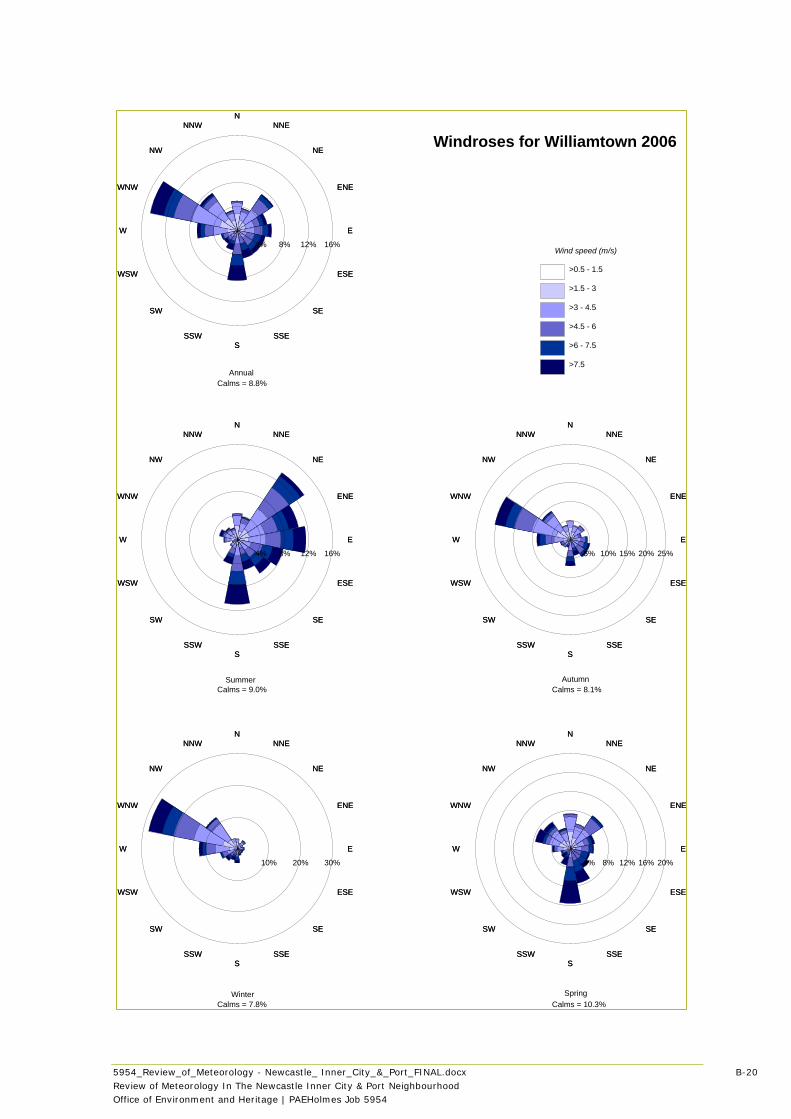
5954_Review_of_Meteorology - Newcastle_ Inner_City_&_Port_FINAL.docx B-20
Review of Meteorology In The Newcastle Inner City & Port Neighbourhood
Office of Environment and Heritage | PAEHolmes Job 5954
NN
NNENNE
NENE
ENEENE
EE
ESEESE
SESE
SSESSE
SS
SSWSSW
SWSW
WSWWSW
WW
WNWWNW
NWNW
NNWNNW
4% 8% 12% 16% 20%
NN
NNENNE
NENE
ENEENE
EE
ESEESE
SESE
SSESSE
SS
SSWSSW
SWSW
WSWWSW
WW
WNWWNW
NWNW
NNWNNW
10% 20% 30%
NN
NNENNE
NENE
ENEENE
EE
ESEESE
SESE
SSESSE
SS
SSWSSW
SWSW
WSWWSW
WW
WNWWNW
NWNW
NNWNNW
5% 10% 15% 20% 25%
NN
NNENNE
NENE
ENEENE
EE
ESEESE
SESE
SSESSE
SS
SSWSSW
SWSW
WSWWSW
WW
WNWWNW
NWNW
NNWNNW
4% 8% 12% 16%
NN
NNENNE
NENE
ENEENE
EE
ESEESE
SESE
SSESSE
SS
SSWSSW
SWSW
WSWWSW
WW
WNWWNW
NWNW
NNWNNW
4% 8% 12% 16%Wind speed (m/s)
>0.5 - 1.5
>1.5 - 3
>3 - 4.5
>4.5 - 6
>6 - 7.5
>7.5
Windroses for Williamtown 2006
SpringWinter
AutumnSummer
Annual
Calms = 8.8%
Calms = 9.0% Calms = 8.1%
Calms = 7.8% Calms = 10.3%
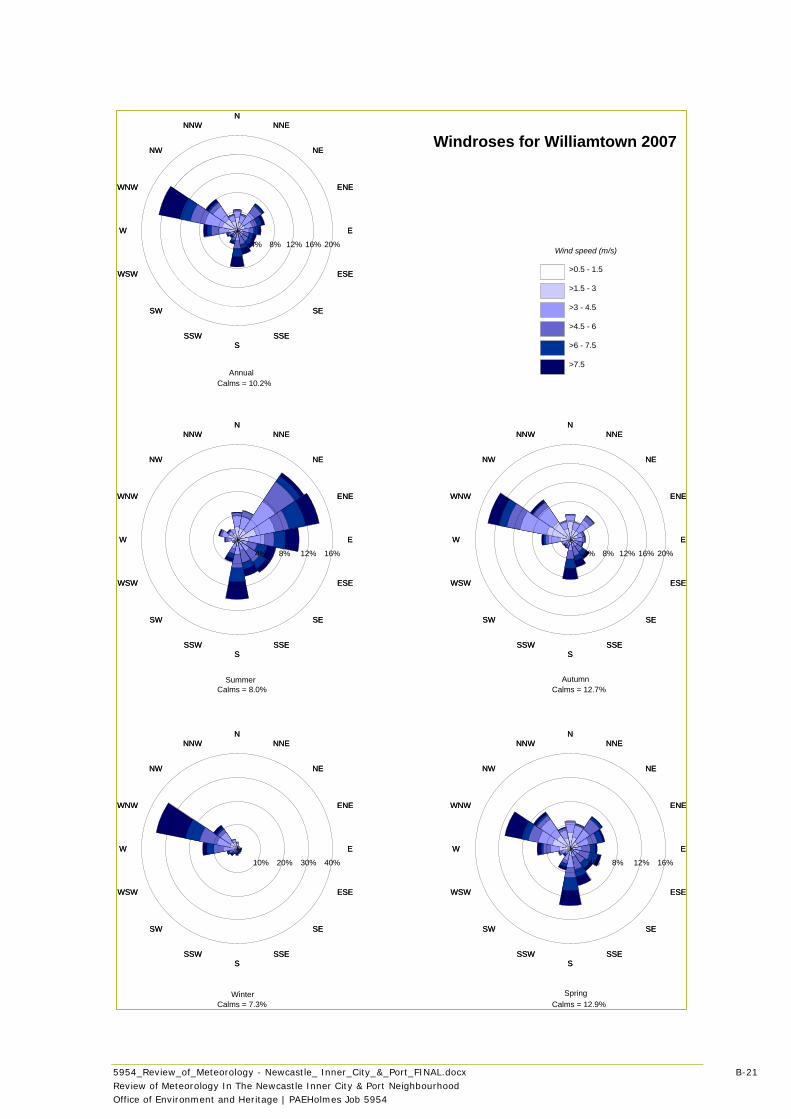
5954_Review_of_Meteorology - Newcastle_ Inner_City_&_Port_FINAL.docx B-21
Review of Meteorology In The Newcastle Inner City & Port Neighbourhood
Office of Environment and Heritage | PAEHolmes Job 5954
NN
NNENNE
NENE
ENEENE
EE
ESEESE
SESE
SSESSE
SS
SSWSSW
SWSW
WSWWSW
WW
WNWWNW
NWNW
NNWNNW
4% 8% 12% 16%
NN
NNENNE
NENE
ENEENE
EE
ESEESE
SESE
SSESSE
SS
SSWSSW
SWSW
WSWWSW
WW
WNWWNW
NWNW
NNWNNW
10% 20% 30% 40%
NN
NNENNE
NENE
ENEENE
EE
ESEESE
SESE
SSESSE
SS
SSWSSW
SWSW
WSWWSW
WW
WNWWNW
NWNW
NNWNNW
4% 8% 12% 16% 20%
NN
NNENNE
NENE
ENEENE
EE
ESEESE
SESE
SSESSE
SS
SSWSSW
SWSW
WSWWSW
WW
WNWWNW
NWNW
NNWNNW
4% 8% 12% 16%
NN
NNENNE
NENE
ENEENE
EE
ESEESE
SESE
SSESSE
SS
SSWSSW
SWSW
WSWWSW
WW
WNWWNW
NWNW
NNWNNW
4% 8% 12% 16% 20%Wind speed (m/s)
>0.5 - 1.5
>1.5 - 3
>3 - 4.5
>4.5 - 6
>6 - 7.5
>7.5
Windroses for Williamtown 2007
SpringWinter
AutumnSummer
Annual
Calms = 10.2%
Calms = 8.0% Calms = 12.7%
Calms = 7.3% Calms = 12.9%
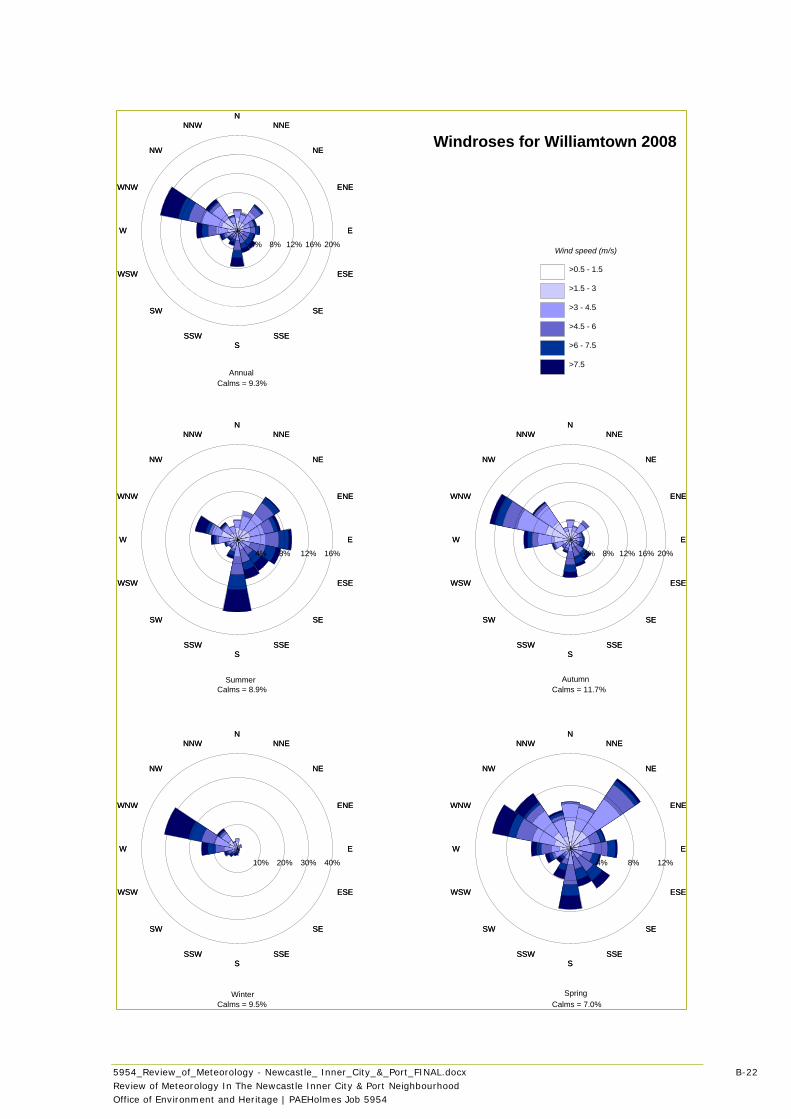
5954_Review_of_Meteorology - Newcastle_ Inner_City_&_Port_FINAL.docx B-22
Review of Meteorology In The Newcastle Inner City & Port Neighbourhood
Office of Environment and Heritage | PAEHolmes Job 5954
NN
NNENNE
NENE
ENEENE
EE
ESEESE
SESE
SSESSE
SS
SSWSSW
SWSW
WSWWSW
WW
WNWWNW
NWNW
NNWNNW
4% 8% 12%
NN
NNENNE
NENE
ENEENE
EE
ESEESE
SESE
SSESSE
SS
SSWSSW
SWSW
WSWWSW
WW
WNWWNW
NWNW
NNWNNW
10% 20% 30% 40%
NN
NNENNE
NENE
ENEENE
EE
ESEESE
SESE
SSESSE
SS
SSWSSW
SWSW
WSWWSW
WW
WNWWNW
NWNW
NNWNNW
4% 8% 12% 16% 20%
NN
NNENNE
NENE
ENEENE
EE
ESEESE
SESE
SSESSE
SS
SSWSSW
SWSW
WSWWSW
WW
WNWWNW
NWNW
NNWNNW
4% 8% 12% 16%
NN
NNENNE
NENE
ENEENE
EE
ESEESE
SESE
SSESSE
SS
SSWSSW
SWSW
WSWWSW
WW
WNWWNW
NWNW
NNWNNW
4% 8% 12% 16% 20%Wind speed (m/s)
>0.5 - 1.5
>1.5 - 3
>3 - 4.5
>4.5 - 6
>6 - 7.5
>7.5
Windroses for Williamtown 2008
SpringWinter
AutumnSummer
Annual
Calms = 9.3%
Calms = 8.9% Calms = 11.7%
Calms = 9.5% Calms = 7.0%
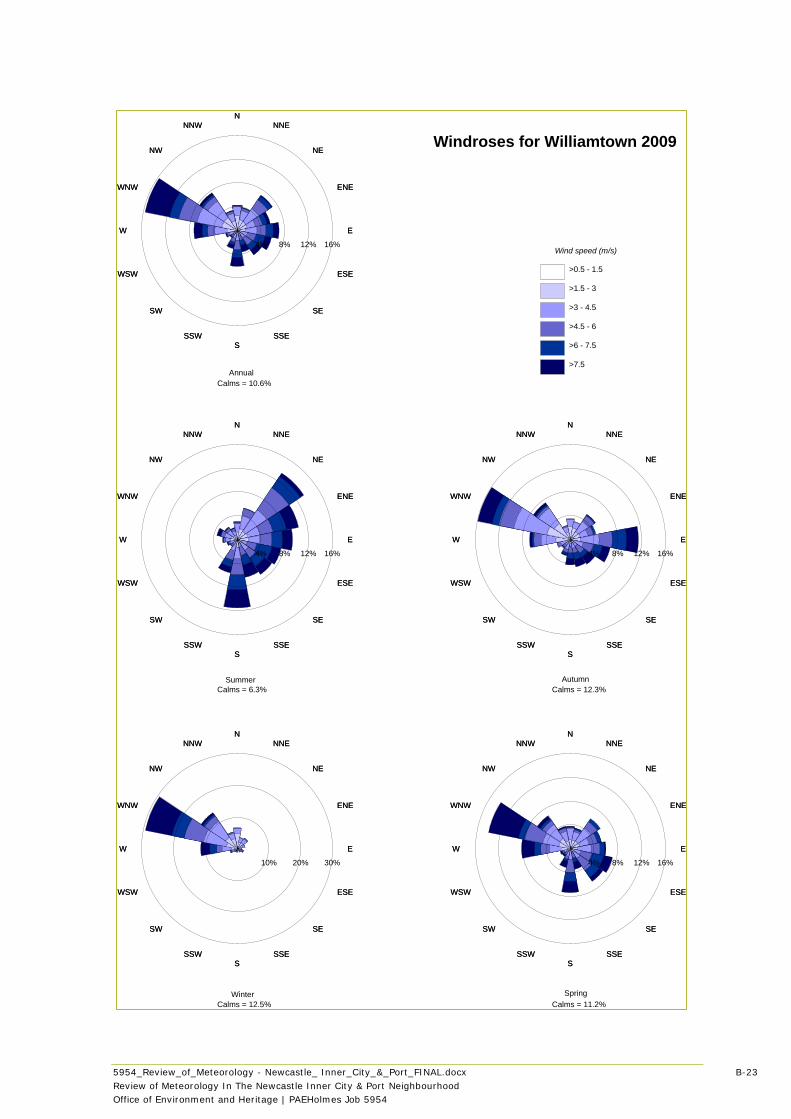
5954_Review_of_Meteorology - Newcastle_ Inner_City_&_Port_FINAL.docx B-23
Review of Meteorology In The Newcastle Inner City & Port Neighbourhood
Office of Environment and Heritage | PAEHolmes Job 5954
NN
NNENNE
NENE
ENEENE
EE
ESEESE
SESE
SSESSE
SS
SSWSSW
SWSW
WSWWSW
WW
WNWWNW
NWNW
NNWNNW
4% 8% 12% 16%
NN
NNENNE
NENE
ENEENE
EE
ESEESE
SESE
SSESSE
SS
SSWSSW
SWSW
WSWWSW
WW
WNWWNW
NWNW
NNWNNW
10% 20% 30%
NN
NNENNE
NENE
ENEENE
EE
ESEESE
SESE
SSESSE
SS
SSWSSW
SWSW
WSWWSW
WW
WNWWNW
NWNW
NNWNNW
4% 8% 12% 16%
NN
NNENNE
NENE
ENEENE
EE
ESEESE
SESE
SSESSE
SS
SSWSSW
SWSW
WSWWSW
WW
WNWWNW
NWNW
NNWNNW
4% 8% 12% 16%
NN
NNENNE
NENE
ENEENE
EE
ESEESE
SESE
SSESSE
SS
SSWSSW
SWSW
WSWWSW
WW
WNWWNW
NWNW
NNWNNW
4% 8% 12% 16%Wind speed (m/s)
>0.5 - 1.5
>1.5 - 3
>3 - 4.5
>4.5 - 6
>6 - 7.5
>7.5
Windroses for Williamtown 2009
SpringWinter
AutumnSummer
Annual
Calms = 10.6%
Calms = 6.3% Calms = 12.3%
Calms = 12.5% Calms = 11.2%
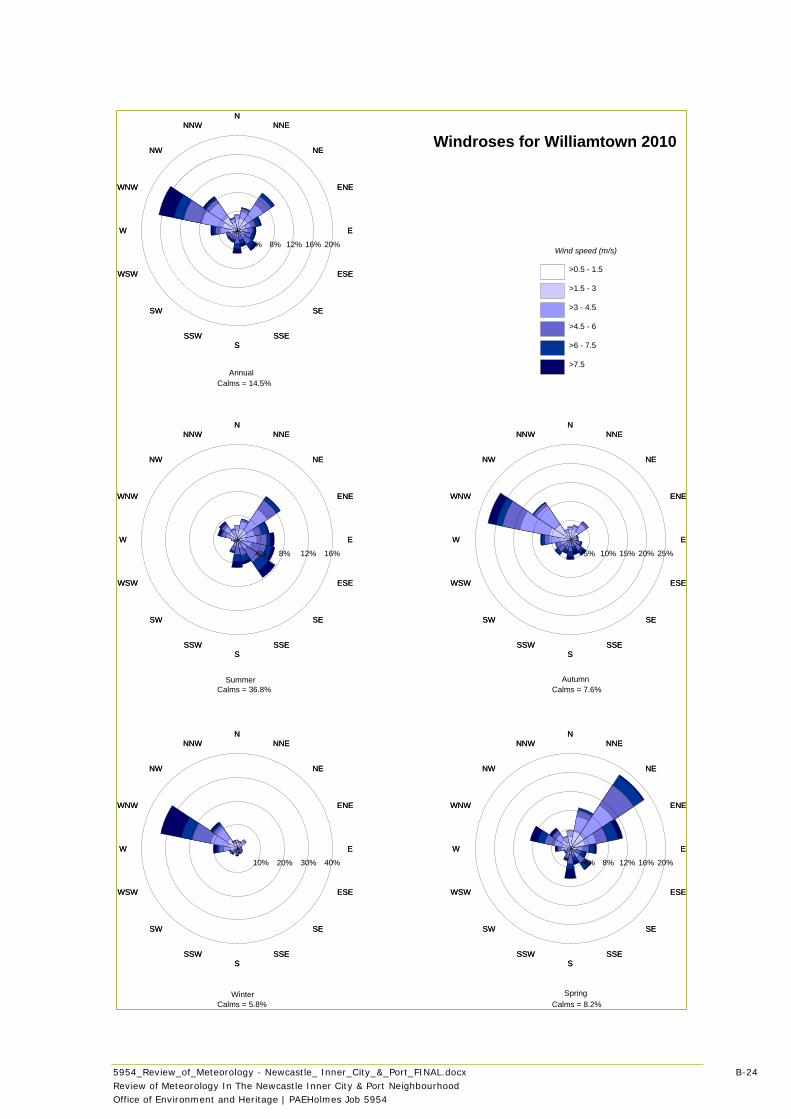
5954_Review_of_Meteorology - Newcastle_ Inner_City_&_Port_FINAL.docx B-24
Review of Meteorology In The Newcastle Inner City & Port Neighbourhood
Office of Environment and Heritage | PAEHolmes Job 5954
NN
NNENNE
NENE
ENEENE
EE
ESEESE
SESE
SSESSE
SS
SSWSSW
SWSW
WSWWSW
WW
WNWWNW
NWNW
NNWNNW
4% 8% 12% 16% 20%
NN
NNENNE
NENE
ENEENE
EE
ESEESE
SESE
SSESSE
SS
SSWSSW
SWSW
WSWWSW
WW
WNWWNW
NWNW
NNWNNW
10% 20% 30% 40%
NN
NNENNE
NENE
ENEENE
EE
ESEESE
SESE
SSESSE
SS
SSWSSW
SWSW
WSWWSW
WW
WNWWNW
NWNW
NNWNNW
5% 10% 15% 20% 25%
NN
NNENNE
NENE
ENEENE
EE
ESEESE
SESE
SSESSE
SS
SSWSSW
SWSW
WSWWSW
WW
WNWWNW
NWNW
NNWNNW
4% 8% 12% 16%
NN
NNENNE
NENE
ENEENE
EE
ESEESE
SESE
SSESSE
SS
SSWSSW
SWSW
WSWWSW
WW
WNWWNW
NWNW
NNWNNW
4% 8% 12% 16% 20%Wind speed (m/s)
>0.5 - 1.5
>1.5 - 3
>3 - 4.5
>4.5 - 6
>6 - 7.5
>7.5
Windroses for Williamtown 2010
SpringWinter
AutumnSummer
Annual
Calms = 14.5%
Calms = 36.8% Calms = 7.6%
Calms = 5.8% Calms = 8.2%
5954_Review_of_Meteorology - Newcastle_ Inner_City_&_Port_FINAL.docx C-25
Review of Meteorology In The Newcastle Inner City & Port Neighbourhood
Office of Environment and Heritage | PAEHolmes Job 5954
APPENDIX C
CALMET and CALPUFF Model Settings
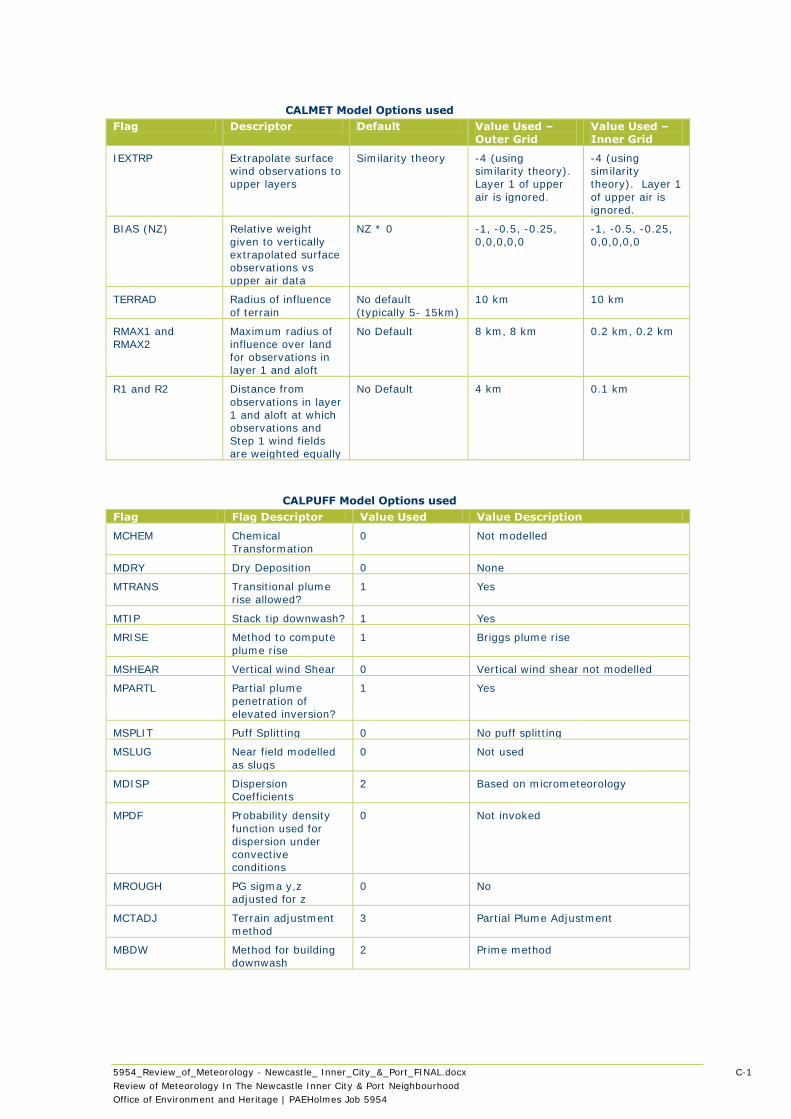
5954_Review_of_Meteorology - Newcastle_ Inner_City_&_Port_FINAL.docx C-1
Review of Meteorology In The Newcastle Inner City & Port Neighbourhood
Office of Environment and Heritage | PAEHolmes Job 5954
CALMET Model Options used
Flag Descriptor Default Value Used – Outer Grid
Value Used – Inner Grid
IEXTRP Extrapolate surface wind observations to upper layers
Similarity theory -4 (using similarity theory). Layer 1 of upper
air is ignored.
-4 (using similarity theory). Layer 1
of upper air is ignored.
BIAS (NZ) Relative weight given to vertically extrapolated surface observations vs upper air data
NZ * 0 -1, -0.5, -0.25, 0,0,0,0,0
-1, -0.5, -0.25, 0,0,0,0,0
TERRAD Radius of influence
of terrain
No default
(typically 5- 15km)
10 km 10 km
RMAX1 and RMAX2
Maximum radius of influence over land for observations in layer 1 and aloft
No Default 8 km, 8 km 0.2 km, 0.2 km
R1 and R2 Distance from
observations in layer 1 and aloft at which observations and Step 1 wind fields are weighted equally
No Default 4 km 0.1 km
CALPUFF Model Options used
Flag Flag Descriptor Value Used Value Description
MCHEM Chemical Transformation
0 Not modelled
MDRY Dry Deposition 0 None
MTRANS Transitional plume rise allowed?
1 Yes
MTIP Stack tip downwash? 1 Yes
MRISE Method to compute
plume rise
1 Briggs plume rise
MSHEAR Vertical wind Shear 0 Vertical wind shear not modelled
MPARTL Partial plume
penetration of elevated inversion?
1 Yes
MSPLIT Puff Splitting 0 No puff splitting
MSLUG Near field modelled
as slugs
0 Not used
MDISP Dispersion Coefficients
2 Based on micrometeorology
MPDF Probability density
function used for dispersion under convective conditions
0 Not invoked
MROUGH PG sigma y,z adjusted for z
0 No
MCTADJ Terrain adjustment method
3 Partial Plume Adjustment
MBDW Method for building downwash
2 Prime method
5954_Review_of_Meteorology - Newcastle_ Inner_City_&_Port_FINAL.docx D-1
Review of Meteorology In The Newcastle Inner City & Port Neighbourhood
Office of Environment and Heritage | PAEHolmes Job 5954
APPENDIX D
Seasonal Windroses - CALMET
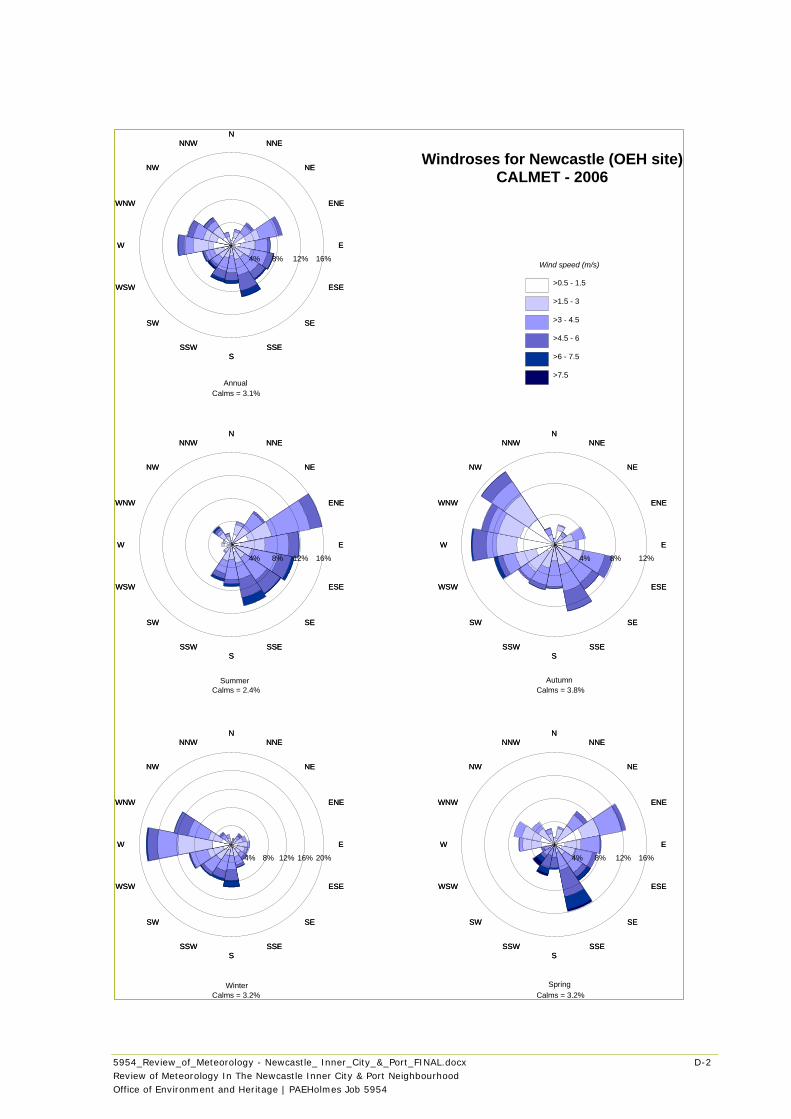
5954_Review_of_Meteorology - Newcastle_ Inner_City_&_Port_FINAL.docx D-2
Review of Meteorology In The Newcastle Inner City & Port Neighbourhood
Office of Environment and Heritage | PAEHolmes Job 5954
NN
NNENNE
NENE
ENEENE
EE
ESEESE
SESE
SSESSE
SS
SSWSSW
SWSW
WSWWSW
WW
WNWWNW
NWNW
NNWNNW
4% 8% 12% 16%
NN
NNENNE
NENE
ENEENE
EE
ESEESE
SESE
SSESSE
SS
SSWSSW
SWSW
WSWWSW
WW
WNWWNW
NWNW
NNWNNW
4% 8% 12% 16% 20%
NN
NNENNE
NENE
ENEENE
EE
ESEESE
SESE
SSESSE
SS
SSWSSW
SWSW
WSWWSW
WW
WNWWNW
NWNW
NNWNNW
4% 8% 12%
NN
NNENNE
NENE
ENEENE
EE
ESEESE
SESE
SSESSE
SS
SSWSSW
SWSW
WSWWSW
WW
WNWWNW
NWNW
NNWNNW
4% 8% 12% 16%
NN
NNENNE
NENE
ENEENE
EE
ESEESE
SESE
SSESSE
SS
SSWSSW
SWSW
WSWWSW
WW
WNWWNW
NWNW
NNWNNW
4% 8% 12% 16%Wind speed (m/s)
>0.5 - 1.5
>1.5 - 3
>3 - 4.5
>4.5 - 6
>6 - 7.5
>7.5
Windroses for Newcastle (OEH site)CALMET - 2006
SpringWinter
AutumnSummer
Annual
Calms = 3.1%
Calms = 2.4% Calms = 3.8%
Calms = 3.2% Calms = 3.2%
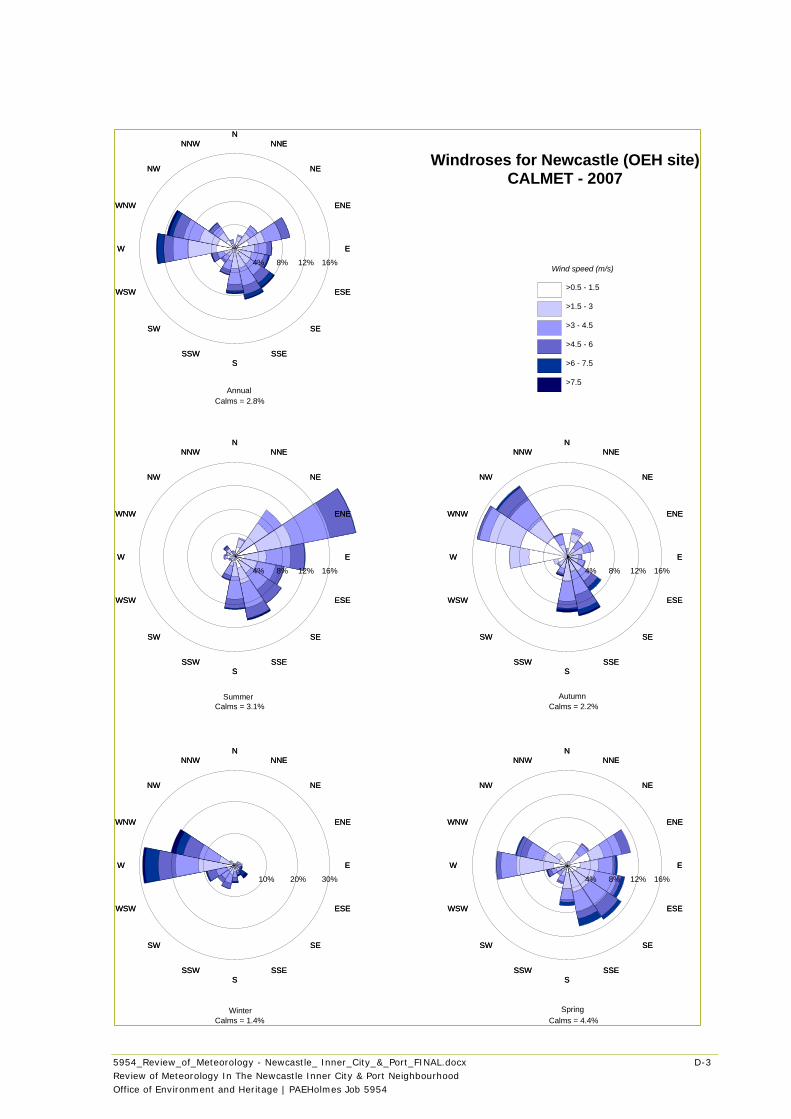
5954_Review_of_Meteorology - Newcastle_ Inner_City_&_Port_FINAL.docx D-3
Review of Meteorology In The Newcastle Inner City & Port Neighbourhood
Office of Environment and Heritage | PAEHolmes Job 5954
NN
NNENNE
NENE
ENEENE
EE
ESEESE
SESE
SSESSE
SS
SSWSSW
SWSW
WSWWSW
WW
WNWWNW
NWNW
NNWNNW
4% 8% 12% 16%
NN
NNENNE
NENE
ENEENE
EE
ESEESE
SESE
SSESSE
SS
SSWSSW
SWSW
WSWWSW
WW
WNWWNW
NWNW
NNWNNW
10% 20% 30%
NN
NNENNE
NENE
ENEENE
EE
ESEESE
SESE
SSESSE
SS
SSWSSW
SWSW
WSWWSW
WW
WNWWNW
NWNW
NNWNNW
4% 8% 12% 16%
NN
NNENNE
NENE
ENEENE
EE
ESEESE
SESE
SSESSE
SS
SSWSSW
SWSW
WSWWSW
WW
WNWWNW
NWNW
NNWNNW
4% 8% 12% 16%
NN
NNENNE
NENE
ENEENE
EE
ESEESE
SESE
SSESSE
SS
SSWSSW
SWSW
WSWWSW
WW
WNWWNW
NWNW
NNWNNW
4% 8% 12% 16%Wind speed (m/s)
>0.5 - 1.5
>1.5 - 3
>3 - 4.5
>4.5 - 6
>6 - 7.5
>7.5
Windroses for Newcastle (OEH site)CALMET - 2007
SpringWinter
AutumnSummer
Annual
Calms = 2.8%
Calms = 3.1% Calms = 2.2%
Calms = 1.4% Calms = 4.4%
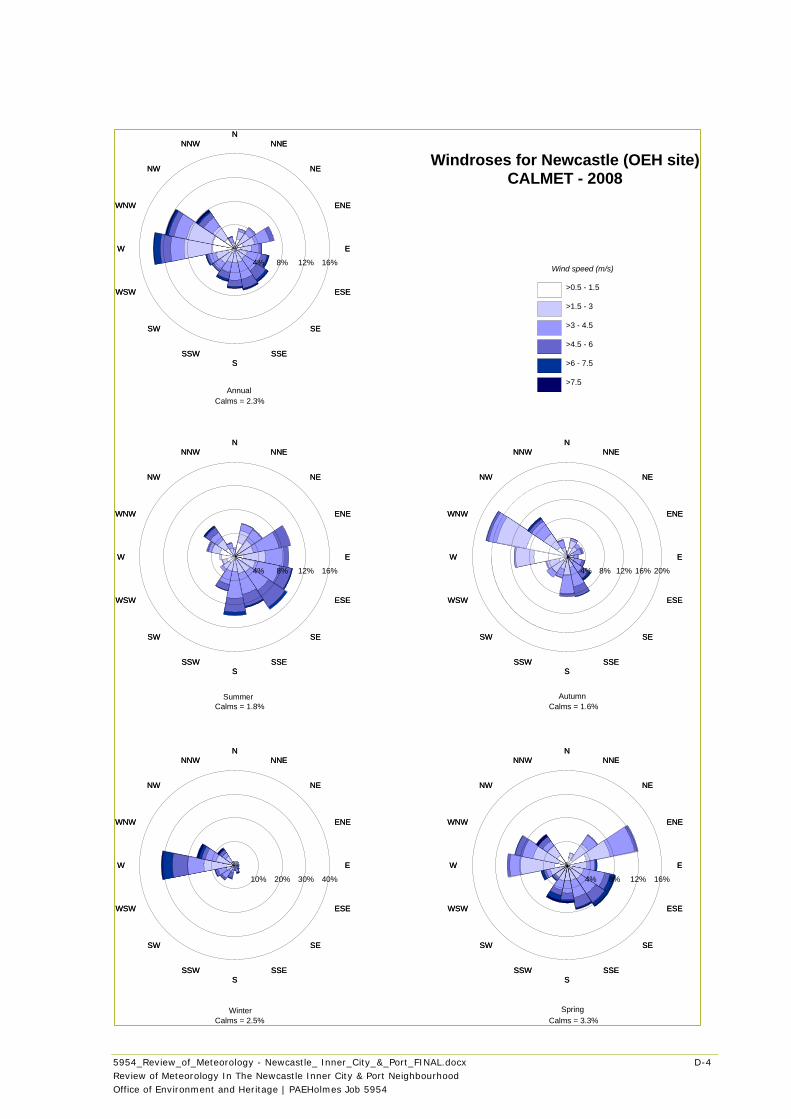
5954_Review_of_Meteorology - Newcastle_ Inner_City_&_Port_FINAL.docx D-4
Review of Meteorology In The Newcastle Inner City & Port Neighbourhood
Office of Environment and Heritage | PAEHolmes Job 5954
NN
NNENNE
NENE
ENEENE
EE
ESEESE
SESE
SSESSE
SS
SSWSSW
SWSW
WSWWSW
WW
WNWWNW
NWNW
NNWNNW
4% 8% 12% 16%
NN
NNENNE
NENE
ENEENE
EE
ESEESE
SESE
SSESSE
SS
SSWSSW
SWSW
WSWWSW
WW
WNWWNW
NWNW
NNWNNW
10% 20% 30% 40%
NN
NNENNE
NENE
ENEENE
EE
ESEESE
SESE
SSESSE
SS
SSWSSW
SWSW
WSWWSW
WW
WNWWNW
NWNW
NNWNNW
4% 8% 12% 16% 20%
NN
NNENNE
NENE
ENEENE
EE
ESEESE
SESE
SSESSE
SS
SSWSSW
SWSW
WSWWSW
WW
WNWWNW
NWNW
NNWNNW
4% 8% 12% 16%
NN
NNENNE
NENE
ENEENE
EE
ESEESE
SESE
SSESSE
SS
SSWSSW
SWSW
WSWWSW
WW
WNWWNW
NWNW
NNWNNW
4% 8% 12% 16%Wind speed (m/s)
>0.5 - 1.5
>1.5 - 3
>3 - 4.5
>4.5 - 6
>6 - 7.5
>7.5
Windroses for Newcastle (OEH site)CALMET - 2008
SpringWinter
AutumnSummer
Annual
Calms = 2.3%
Calms = 1.8% Calms = 1.6%
Calms = 2.5% Calms = 3.3%
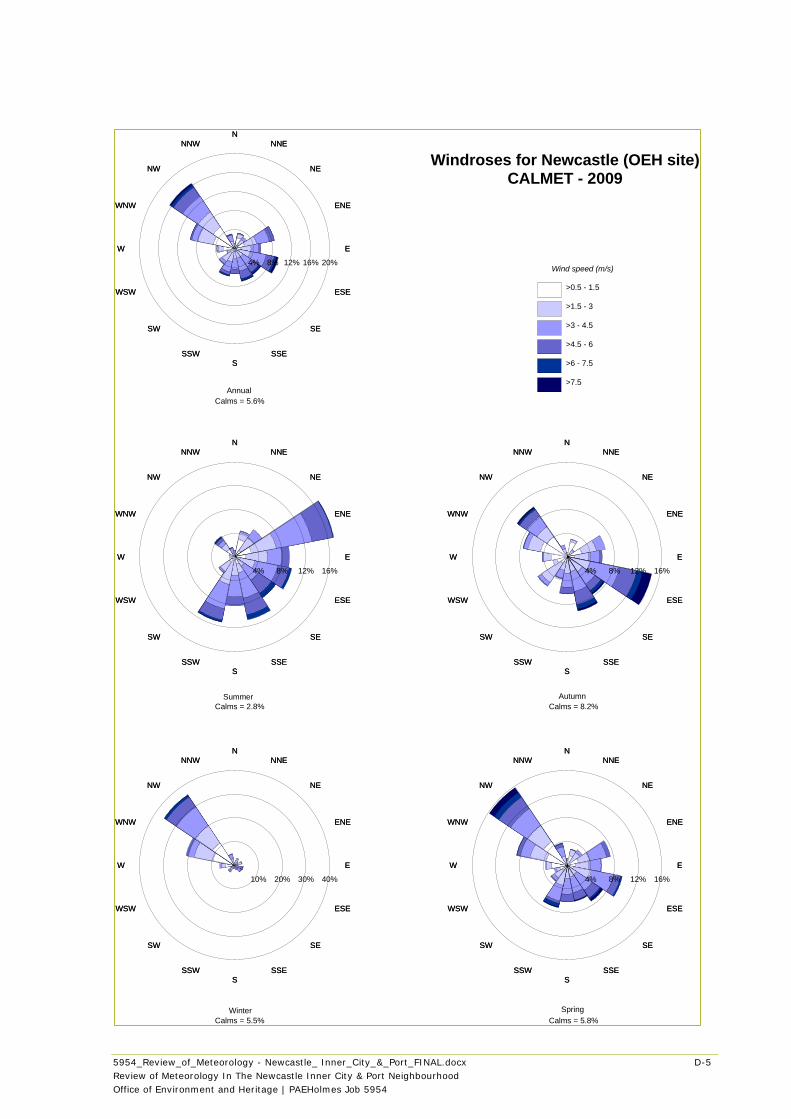
5954_Review_of_Meteorology - Newcastle_ Inner_City_&_Port_FINAL.docx D-5
Review of Meteorology In The Newcastle Inner City & Port Neighbourhood
Office of Environment and Heritage | PAEHolmes Job 5954
NN
NNENNE
NENE
ENEENE
EE
ESEESE
SESE
SSESSE
SS
SSWSSW
SWSW
WSWWSW
WW
WNWWNW
NWNW
NNWNNW
4% 8% 12% 16%
NN
NNENNE
NENE
ENEENE
EE
ESEESE
SESE
SSESSE
SS
SSWSSW
SWSW
WSWWSW
WW
WNWWNW
NWNW
NNWNNW
10% 20% 30% 40%
NN
NNENNE
NENE
ENEENE
EE
ESEESE
SESE
SSESSE
SS
SSWSSW
SWSW
WSWWSW
WW
WNWWNW
NWNW
NNWNNW
4% 8% 12% 16%
NN
NNENNE
NENE
ENEENE
EE
ESEESE
SESE
SSESSE
SS
SSWSSW
SWSW
WSWWSW
WW
WNWWNW
NWNW
NNWNNW
4% 8% 12% 16%
NN
NNENNE
NENE
ENEENE
EE
ESEESE
SESE
SSESSE
SS
SSWSSW
SWSW
WSWWSW
WW
WNWWNW
NWNW
NNWNNW
4% 8% 12% 16% 20%Wind speed (m/s)
>0.5 - 1.5
>1.5 - 3
>3 - 4.5
>4.5 - 6
>6 - 7.5
>7.5
Windroses for Newcastle (OEH site)CALMET - 2009
SpringWinter
AutumnSummer
Annual
Calms = 5.6%
Calms = 2.8% Calms = 8.2%
Calms = 5.5% Calms = 5.8%
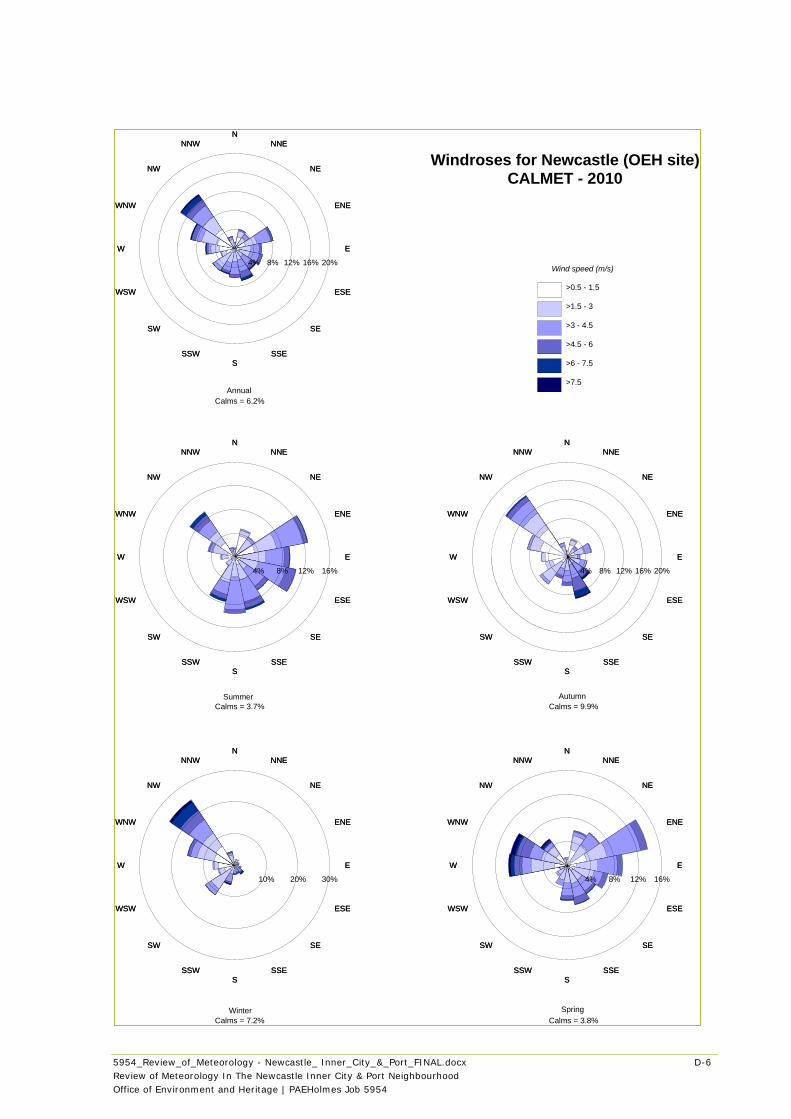
5954_Review_of_Meteorology - Newcastle_ Inner_City_&_Port_FINAL.docx D-6
Review of Meteorology In The Newcastle Inner City & Port Neighbourhood
Office of Environment and Heritage | PAEHolmes Job 5954
NN
NNENNE
NENE
ENEENE
EE
ESEESE
SESE
SSESSE
SS
SSWSSW
SWSW
WSWWSW
WW
WNWWNW
NWNW
NNWNNW
4% 8% 12% 16%
NN
NNENNE
NENE
ENEENE
EE
ESEESE
SESE
SSESSE
SS
SSWSSW
SWSW
WSWWSW
WW
WNWWNW
NWNW
NNWNNW
10% 20% 30%
NN
NNENNE
NENE
ENEENE
EE
ESEESE
SESE
SSESSE
SS
SSWSSW
SWSW
WSWWSW
WW
WNWWNW
NWNW
NNWNNW
4% 8% 12% 16% 20%
NN
NNENNE
NENE
ENEENE
EE
ESEESE
SESE
SSESSE
SS
SSWSSW
SWSW
WSWWSW
WW
WNWWNW
NWNW
NNWNNW
4% 8% 12% 16%
NN
NNENNE
NENE
ENEENE
EE
ESEESE
SESE
SSESSE
SS
SSWSSW
SWSW
WSWWSW
WW
WNWWNW
NWNW
NNWNNW
4% 8% 12% 16% 20%Wind speed (m/s)
>0.5 - 1.5
>1.5 - 3
>3 - 4.5
>4.5 - 6
>6 - 7.5
>7.5
Windroses for Newcastle (OEH site)CALMET - 2010
SpringWinter
AutumnSummer
Annual
Calms = 6.2%
Calms = 3.7% Calms = 9.9%
Calms = 7.2% Calms = 3.8%
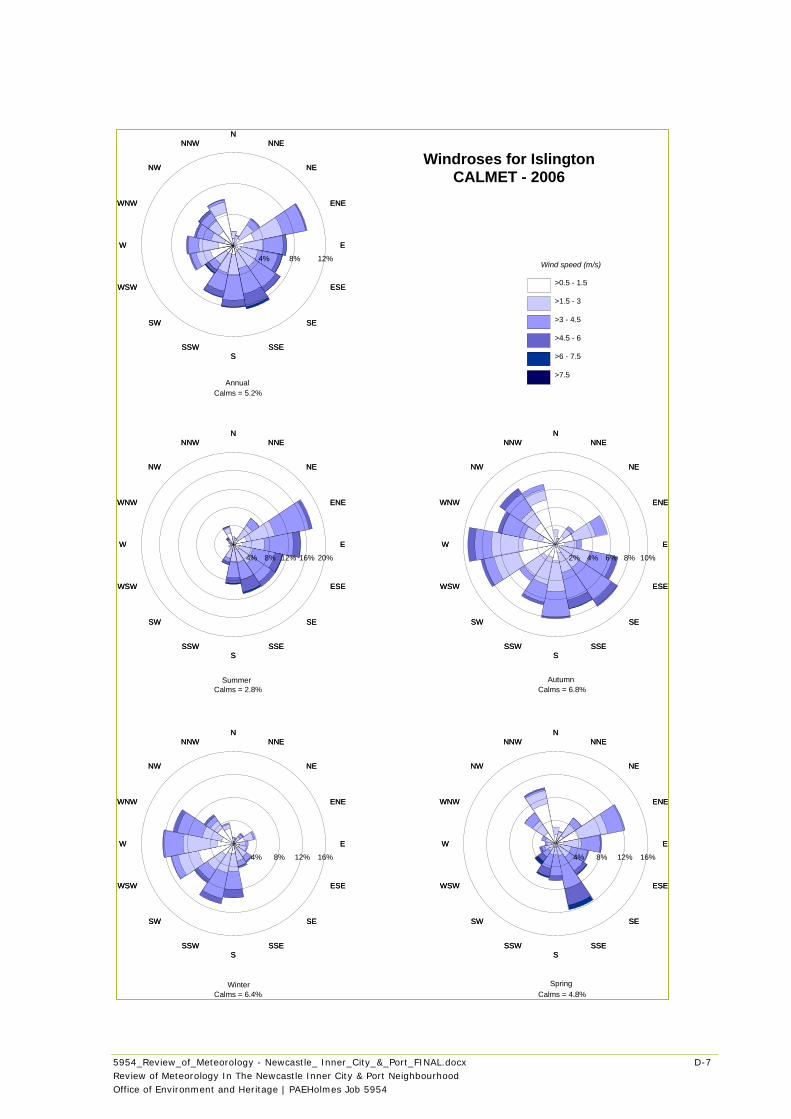
5954_Review_of_Meteorology - Newcastle_ Inner_City_&_Port_FINAL.docx D-7
Review of Meteorology In The Newcastle Inner City & Port Neighbourhood
Office of Environment and Heritage | PAEHolmes Job 5954
NN
NNENNE
NENE
ENEENE
EE
ESEESE
SESE
SSESSE
SS
SSWSSW
SWSW
WSWWSW
WW
WNWWNW
NWNW
NNWNNW
4% 8% 12% 16%
NN
NNENNE
NENE
ENEENE
EE
ESEESE
SESE
SSESSE
SS
SSWSSW
SWSW
WSWWSW
WW
WNWWNW
NWNW
NNWNNW
4% 8% 12% 16%
NN
NNENNE
NENE
ENEENE
EE
ESEESE
SESE
SSESSE
SS
SSWSSW
SWSW
WSWWSW
WW
WNWWNW
NWNW
NNWNNW
2% 4% 6% 8% 10%
NN
NNENNE
NENE
ENEENE
EE
ESEESE
SESE
SSESSE
SS
SSWSSW
SWSW
WSWWSW
WW
WNWWNW
NWNW
NNWNNW
4% 8% 12% 16% 20%
NN
NNENNE
NENE
ENEENE
EE
ESEESE
SESE
SSESSE
SS
SSWSSW
SWSW
WSWWSW
WW
WNWWNW
NWNW
NNWNNW
4% 8% 12%Wind speed (m/s)
>0.5 - 1.5
>1.5 - 3
>3 - 4.5
>4.5 - 6
>6 - 7.5
>7.5
Windroses for IslingtonCALMET - 2006
SpringWinter
AutumnSummer
Annual
Calms = 5.2%
Calms = 2.8% Calms = 6.8%
Calms = 6.4% Calms = 4.8%
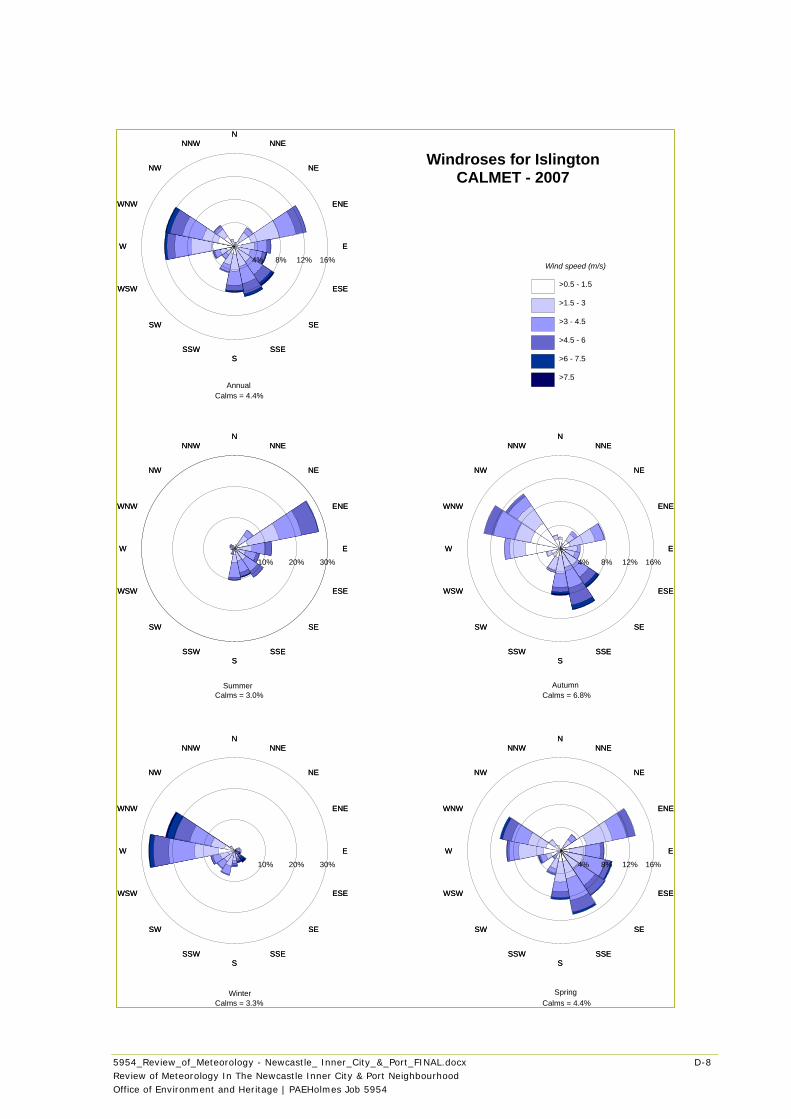
5954_Review_of_Meteorology - Newcastle_ Inner_City_&_Port_FINAL.docx D-8
Review of Meteorology In The Newcastle Inner City & Port Neighbourhood
Office of Environment and Heritage | PAEHolmes Job 5954
NN
NNENNE
NENE
ENEENE
EE
ESEESE
SESE
SSESSE
SS
SSWSSW
SWSW
WSWWSW
WW
WNWWNW
NWNW
NNWNNW
4% 8% 12% 16%
NN
NNENNE
NENE
ENEENE
EE
ESEESE
SESE
SSESSE
SS
SSWSSW
SWSW
WSWWSW
WW
WNWWNW
NWNW
NNWNNW
10% 20% 30%
NN
NNENNE
NENE
ENEENE
EE
ESEESE
SESE
SSESSE
SS
SSWSSW
SWSW
WSWWSW
WW
WNWWNW
NWNW
NNWNNW
4% 8% 12% 16%
NN
NNENNE
NENE
ENEENE
EE
ESEESE
SESE
SSESSE
SS
SSWSSW
SWSW
WSWWSW
WW
WNWWNW
NWNW
NNWNNW
10% 20% 30%
NN
NNENNE
NENE
ENEENE
EE
ESEESE
SESE
SSESSE
SS
SSWSSW
SWSW
WSWWSW
WW
WNWWNW
NWNW
NNWNNW
4% 8% 12% 16%Wind speed (m/s)
>0.5 - 1.5
>1.5 - 3
>3 - 4.5
>4.5 - 6
>6 - 7.5
>7.5
Windroses for IslingtonCALMET - 2007
SpringWinter
AutumnSummer
Annual
Calms = 4.4%
Calms = 3.0% Calms = 6.8%
Calms = 3.3% Calms = 4.4%
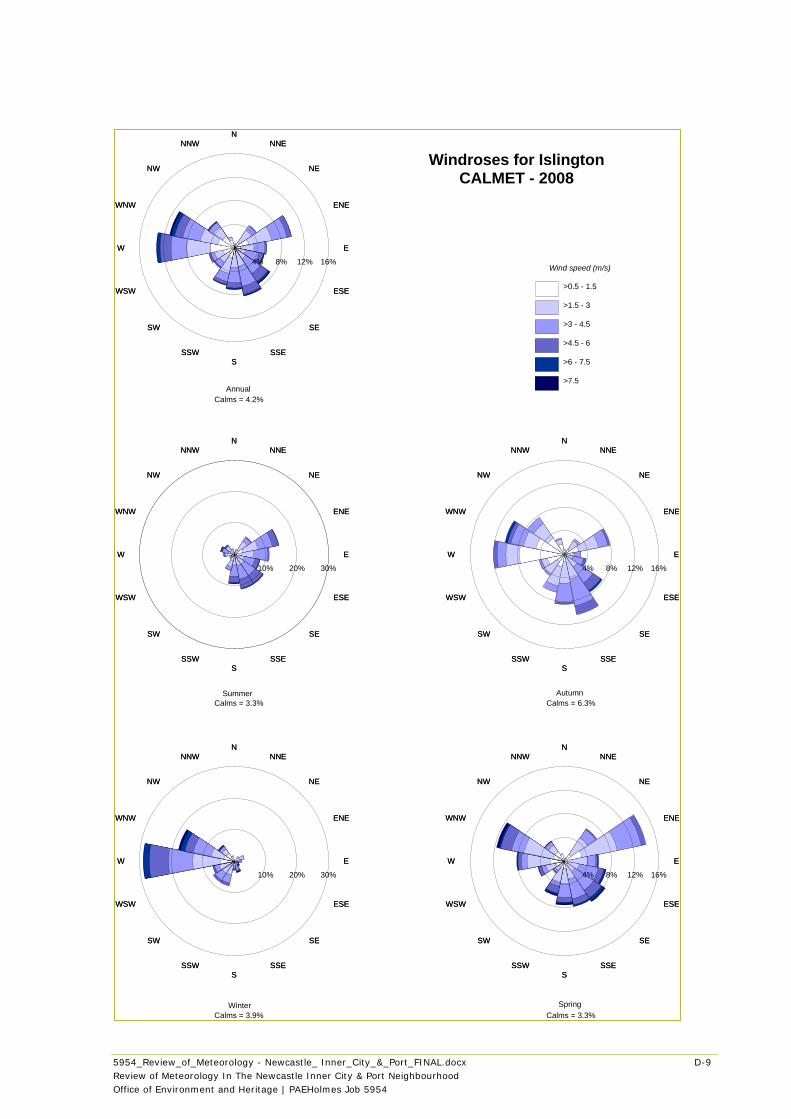
5954_Review_of_Meteorology - Newcastle_ Inner_City_&_Port_FINAL.docx D-9
Review of Meteorology In The Newcastle Inner City & Port Neighbourhood
Office of Environment and Heritage | PAEHolmes Job 5954
NN
NNENNE
NENE
ENEENE
EE
ESEESE
SESE
SSESSE
SS
SSWSSW
SWSW
WSWWSW
WW
WNWWNW
NWNW
NNWNNW
4% 8% 12% 16%
NN
NNENNE
NENE
ENEENE
EE
ESEESE
SESE
SSESSE
SS
SSWSSW
SWSW
WSWWSW
WW
WNWWNW
NWNW
NNWNNW
10% 20% 30%
NN
NNENNE
NENE
ENEENE
EE
ESEESE
SESE
SSESSE
SS
SSWSSW
SWSW
WSWWSW
WW
WNWWNW
NWNW
NNWNNW
4% 8% 12% 16%
NN
NNENNE
NENE
ENEENE
EE
ESEESE
SESE
SSESSE
SS
SSWSSW
SWSW
WSWWSW
WW
WNWWNW
NWNW
NNWNNW
10% 20% 30%
NN
NNENNE
NENE
ENEENE
EE
ESEESE
SESE
SSESSE
SS
SSWSSW
SWSW
WSWWSW
WW
WNWWNW
NWNW
NNWNNW
4% 8% 12% 16%Wind speed (m/s)
>0.5 - 1.5
>1.5 - 3
>3 - 4.5
>4.5 - 6
>6 - 7.5
>7.5
Windroses for IslingtonCALMET - 2008
SpringWinter
AutumnSummer
Annual
Calms = 4.2%
Calms = 3.3% Calms = 6.3%
Calms = 3.9% Calms = 3.3%
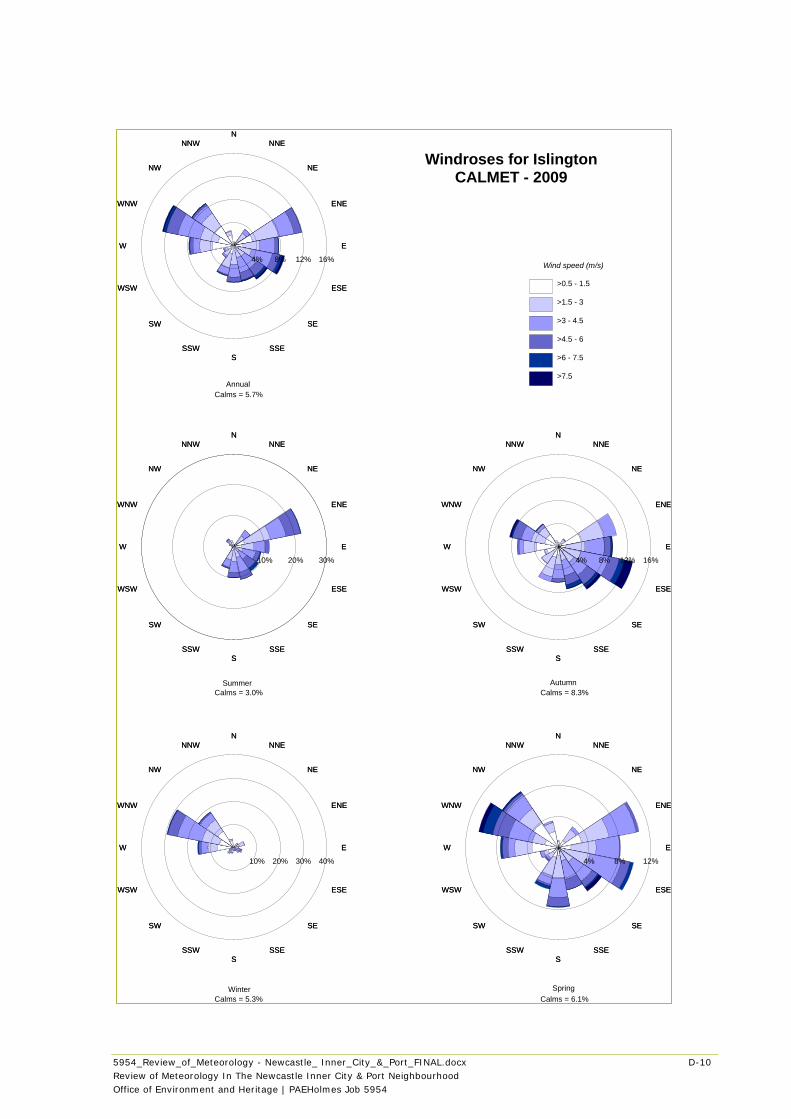
5954_Review_of_Meteorology - Newcastle_ Inner_City_&_Port_FINAL.docx D-10
Review of Meteorology In The Newcastle Inner City & Port Neighbourhood
Office of Environment and Heritage | PAEHolmes Job 5954
NN
NNENNE
NENE
ENEENE
EE
ESEESE
SESE
SSESSE
SS
SSWSSW
SWSW
WSWWSW
WW
WNWWNW
NWNW
NNWNNW
4% 8% 12%
NN
NNENNE
NENE
ENEENE
EE
ESEESE
SESE
SSESSE
SS
SSWSSW
SWSW
WSWWSW
WW
WNWWNW
NWNW
NNWNNW
10% 20% 30% 40%
NN
NNENNE
NENE
ENEENE
EE
ESEESE
SESE
SSESSE
SS
SSWSSW
SWSW
WSWWSW
WW
WNWWNW
NWNW
NNWNNW
4% 8% 12% 16%
NN
NNENNE
NENE
ENEENE
EE
ESEESE
SESE
SSESSE
SS
SSWSSW
SWSW
WSWWSW
WW
WNWWNW
NWNW
NNWNNW
10% 20% 30%
NN
NNENNE
NENE
ENEENE
EE
ESEESE
SESE
SSESSE
SS
SSWSSW
SWSW
WSWWSW
WW
WNWWNW
NWNW
NNWNNW
4% 8% 12% 16%Wind speed (m/s)
>0.5 - 1.5
>1.5 - 3
>3 - 4.5
>4.5 - 6
>6 - 7.5
>7.5
Windroses for IslingtonCALMET - 2009
SpringWinter
AutumnSummer
Annual
Calms = 5.7%
Calms = 3.0% Calms = 8.3%
Calms = 5.3% Calms = 6.1%
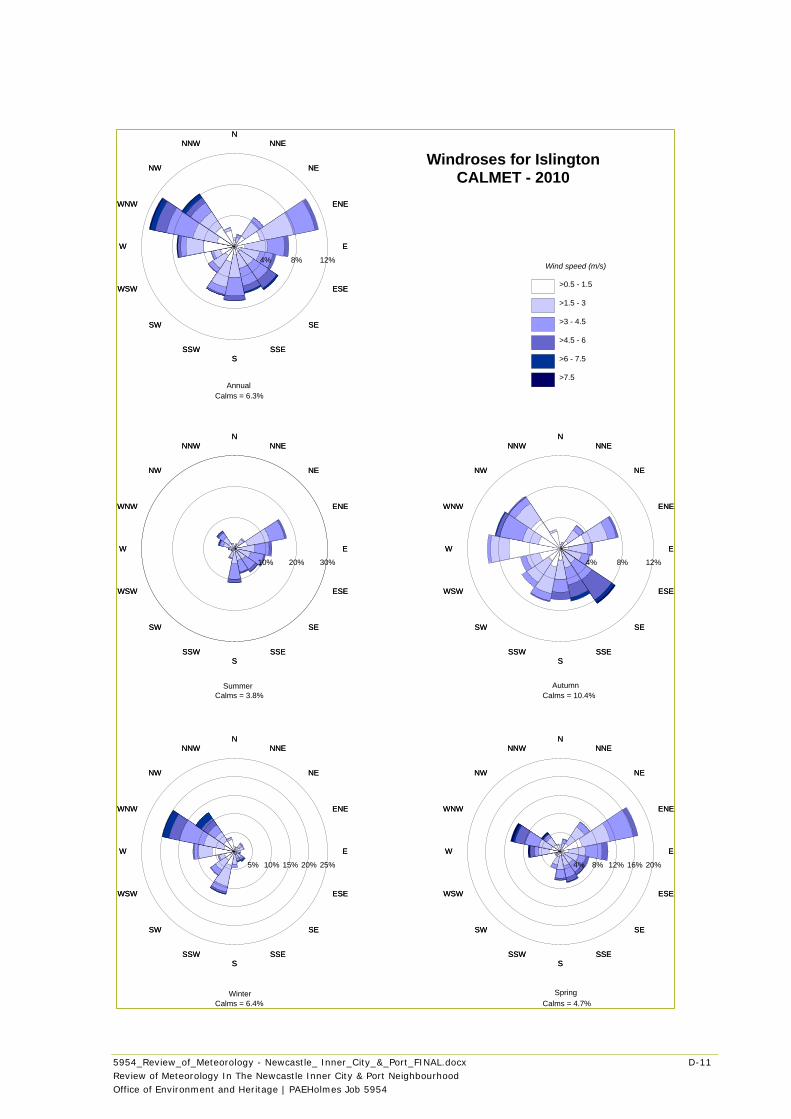
5954_Review_of_Meteorology - Newcastle_ Inner_City_&_Port_FINAL.docx D-11
Review of Meteorology In The Newcastle Inner City & Port Neighbourhood
Office of Environment and Heritage | PAEHolmes Job 5954
NN
NNENNE
NENE
ENEENE
EE
ESEESE
SESE
SSESSE
SS
SSWSSW
SWSW
WSWWSW
WW
WNWWNW
NWNW
NNWNNW
4% 8% 12% 16% 20%
NN
NNENNE
NENE
ENEENE
EE
ESEESE
SESE
SSESSE
SS
SSWSSW
SWSW
WSWWSW
WW
WNWWNW
NWNW
NNWNNW
5% 10% 15% 20% 25%
NN
NNENNE
NENE
ENEENE
EE
ESEESE
SESE
SSESSE
SS
SSWSSW
SWSW
WSWWSW
WW
WNWWNW
NWNW
NNWNNW
4% 8% 12%
NN
NNENNE
NENE
ENEENE
EE
ESEESE
SESE
SSESSE
SS
SSWSSW
SWSW
WSWWSW
WW
WNWWNW
NWNW
NNWNNW
10% 20% 30%
NN
NNENNE
NENE
ENEENE
EE
ESEESE
SESE
SSESSE
SS
SSWSSW
SWSW
WSWWSW
WW
WNWWNW
NWNW
NNWNNW
4% 8% 12%Wind speed (m/s)
>0.5 - 1.5
>1.5 - 3
>3 - 4.5
>4.5 - 6
>6 - 7.5
>7.5
Windroses for IslingtonCALMET - 2010
SpringWinter
AutumnSummer
Annual
Calms = 6.3%
Calms = 3.8% Calms = 10.4%
Calms = 6.4% Calms = 4.7%
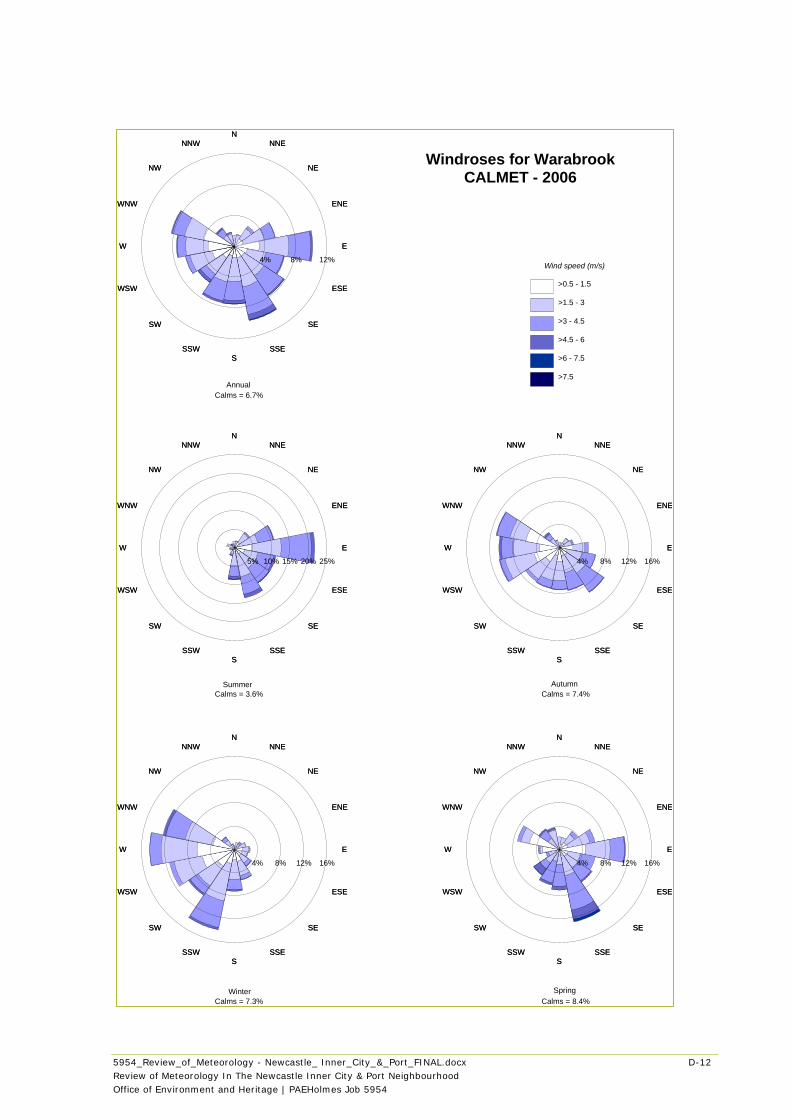
5954_Review_of_Meteorology - Newcastle_ Inner_City_&_Port_FINAL.docx D-12
Review of Meteorology In The Newcastle Inner City & Port Neighbourhood
Office of Environment and Heritage | PAEHolmes Job 5954
NN
NNENNE
NENE
ENEENE
EE
ESEESE
SESE
SSESSE
SS
SSWSSW
SWSW
WSWWSW
WW
WNWWNW
NWNW
NNWNNW
4% 8% 12% 16%
NN
NNENNE
NENE
ENEENE
EE
ESEESE
SESE
SSESSE
SS
SSWSSW
SWSW
WSWWSW
WW
WNWWNW
NWNW
NNWNNW
4% 8% 12% 16%
NN
NNENNE
NENE
ENEENE
EE
ESEESE
SESE
SSESSE
SS
SSWSSW
SWSW
WSWWSW
WW
WNWWNW
NWNW
NNWNNW
4% 8% 12% 16%
NN
NNENNE
NENE
ENEENE
EE
ESEESE
SESE
SSESSE
SS
SSWSSW
SWSW
WSWWSW
WW
WNWWNW
NWNW
NNWNNW
5% 10% 15% 20% 25%
NN
NNENNE
NENE
ENEENE
EE
ESEESE
SESE
SSESSE
SS
SSWSSW
SWSW
WSWWSW
WW
WNWWNW
NWNW
NNWNNW
4% 8% 12%Wind speed (m/s)
>0.5 - 1.5
>1.5 - 3
>3 - 4.5
>4.5 - 6
>6 - 7.5
>7.5
Windroses for WarabrookCALMET - 2006
SpringWinter
AutumnSummer
Annual
Calms = 6.7%
Calms = 3.6% Calms = 7.4%
Calms = 7.3% Calms = 8.4%
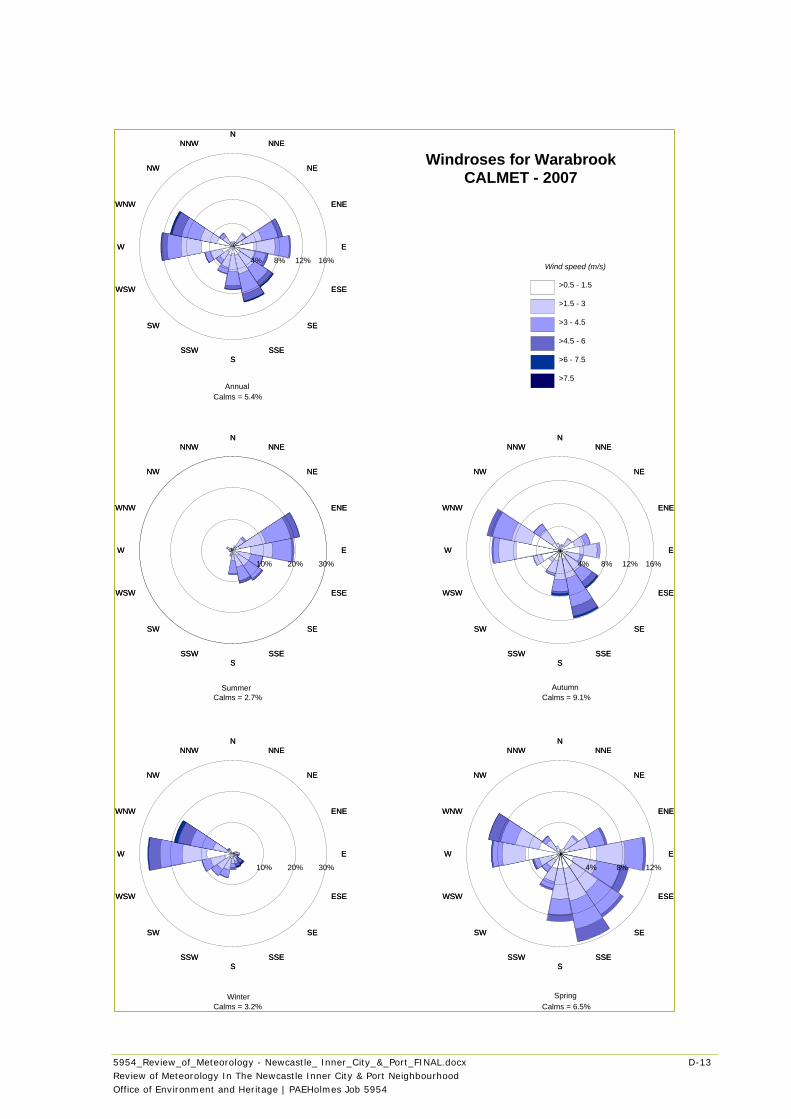
5954_Review_of_Meteorology - Newcastle_ Inner_City_&_Port_FINAL.docx D-13
Review of Meteorology In The Newcastle Inner City & Port Neighbourhood
Office of Environment and Heritage | PAEHolmes Job 5954
NN
NNENNE
NENE
ENEENE
EE
ESEESE
SESE
SSESSE
SS
SSWSSW
SWSW
WSWWSW
WW
WNWWNW
NWNW
NNWNNW
4% 8% 12%
NN
NNENNE
NENE
ENEENE
EE
ESEESE
SESE
SSESSE
SS
SSWSSW
SWSW
WSWWSW
WW
WNWWNW
NWNW
NNWNNW
10% 20% 30%
NN
NNENNE
NENE
ENEENE
EE
ESEESE
SESE
SSESSE
SS
SSWSSW
SWSW
WSWWSW
WW
WNWWNW
NWNW
NNWNNW
4% 8% 12% 16%
NN
NNENNE
NENE
ENEENE
EE
ESEESE
SESE
SSESSE
SS
SSWSSW
SWSW
WSWWSW
WW
WNWWNW
NWNW
NNWNNW
10% 20% 30%
NN
NNENNE
NENE
ENEENE
EE
ESEESE
SESE
SSESSE
SS
SSWSSW
SWSW
WSWWSW
WW
WNWWNW
NWNW
NNWNNW
4% 8% 12% 16%Wind speed (m/s)
>0.5 - 1.5
>1.5 - 3
>3 - 4.5
>4.5 - 6
>6 - 7.5
>7.5
Windroses for WarabrookCALMET - 2007
SpringWinter
AutumnSummer
Annual
Calms = 5.4%
Calms = 2.7% Calms = 9.1%
Calms = 3.2% Calms = 6.5%
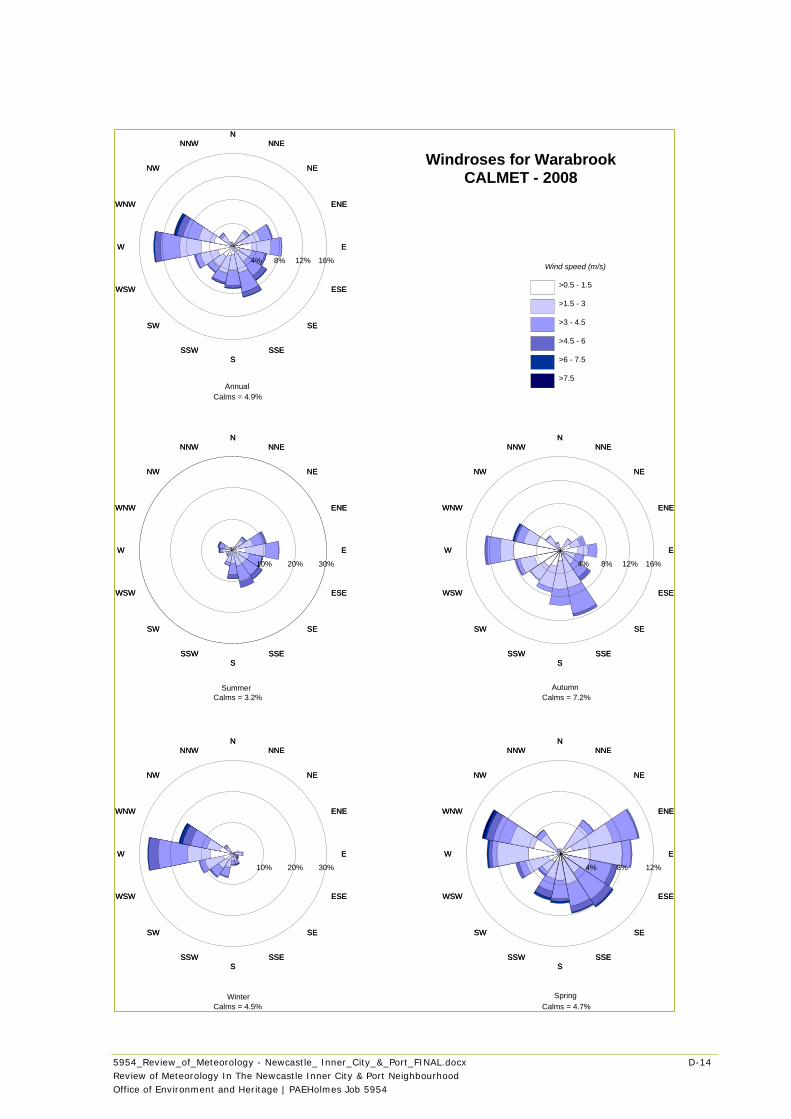
5954_Review_of_Meteorology - Newcastle_ Inner_City_&_Port_FINAL.docx D-14
Review of Meteorology In The Newcastle Inner City & Port Neighbourhood
Office of Environment and Heritage | PAEHolmes Job 5954
NN
NNENNE
NENE
ENEENE
EE
ESEESE
SESE
SSESSE
SS
SSWSSW
SWSW
WSWWSW
WW
WNWWNW
NWNW
NNWNNW
4% 8% 12%
NN
NNENNE
NENE
ENEENE
EE
ESEESE
SESE
SSESSE
SS
SSWSSW
SWSW
WSWWSW
WW
WNWWNW
NWNW
NNWNNW
10% 20% 30%
NN
NNENNE
NENE
ENEENE
EE
ESEESE
SESE
SSESSE
SS
SSWSSW
SWSW
WSWWSW
WW
WNWWNW
NWNW
NNWNNW
4% 8% 12% 16%
NN
NNENNE
NENE
ENEENE
EE
ESEESE
SESE
SSESSE
SS
SSWSSW
SWSW
WSWWSW
WW
WNWWNW
NWNW
NNWNNW
10% 20% 30%
NN
NNENNE
NENE
ENEENE
EE
ESEESE
SESE
SSESSE
SS
SSWSSW
SWSW
WSWWSW
WW
WNWWNW
NWNW
NNWNNW
4% 8% 12% 16%Wind speed (m/s)
>0.5 - 1.5
>1.5 - 3
>3 - 4.5
>4.5 - 6
>6 - 7.5
>7.5
Windroses for WarabrookCALMET - 2008
SpringWinter
AutumnSummer
Annual
Calms = 4.9%
Calms = 3.2% Calms = 7.2%
Calms = 4.5% Calms = 4.7%
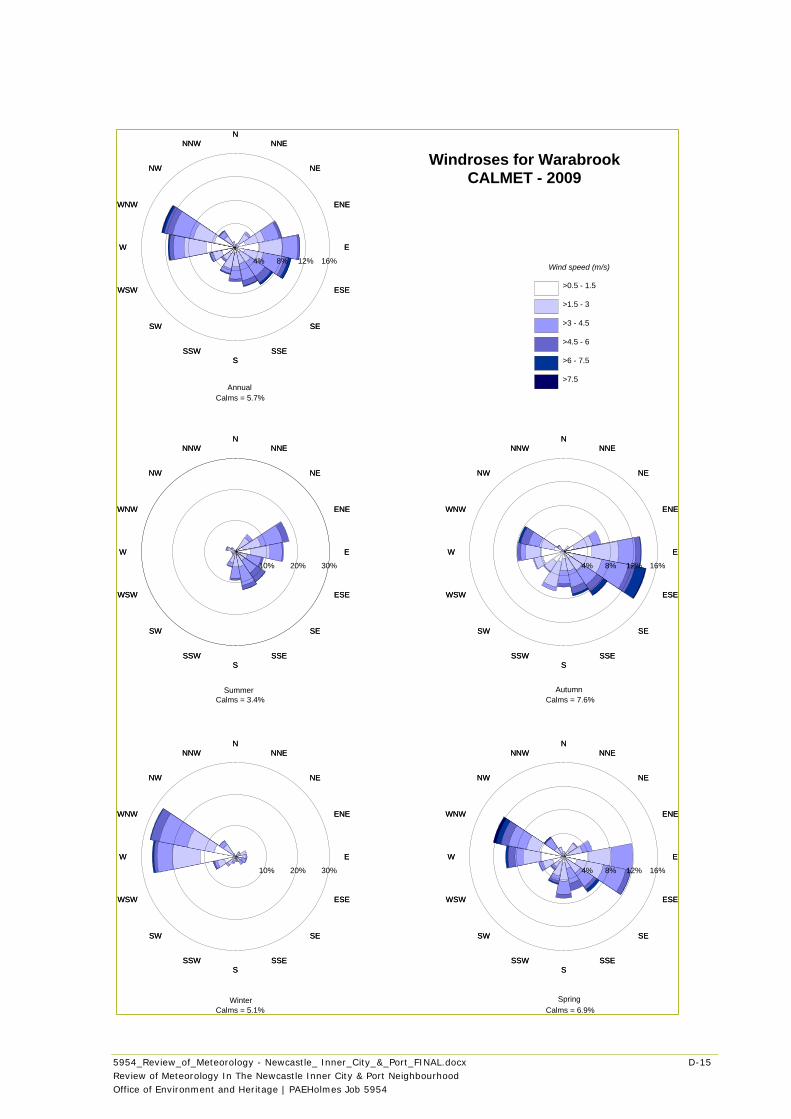
5954_Review_of_Meteorology - Newcastle_ Inner_City_&_Port_FINAL.docx D-15
Review of Meteorology In The Newcastle Inner City & Port Neighbourhood
Office of Environment and Heritage | PAEHolmes Job 5954
NN
NNENNE
NENE
ENEENE
EE
ESEESE
SESE
SSESSE
SS
SSWSSW
SWSW
WSWWSW
WW
WNWWNW
NWNW
NNWNNW
4% 8% 12% 16%
NN
NNENNE
NENE
ENEENE
EE
ESEESE
SESE
SSESSE
SS
SSWSSW
SWSW
WSWWSW
WW
WNWWNW
NWNW
NNWNNW
10% 20% 30%
NN
NNENNE
NENE
ENEENE
EE
ESEESE
SESE
SSESSE
SS
SSWSSW
SWSW
WSWWSW
WW
WNWWNW
NWNW
NNWNNW
4% 8% 12% 16%
NN
NNENNE
NENE
ENEENE
EE
ESEESE
SESE
SSESSE
SS
SSWSSW
SWSW
WSWWSW
WW
WNWWNW
NWNW
NNWNNW
10% 20% 30%
NN
NNENNE
NENE
ENEENE
EE
ESEESE
SESE
SSESSE
SS
SSWSSW
SWSW
WSWWSW
WW
WNWWNW
NWNW
NNWNNW
4% 8% 12% 16%Wind speed (m/s)
>0.5 - 1.5
>1.5 - 3
>3 - 4.5
>4.5 - 6
>6 - 7.5
>7.5
Windroses for WarabrookCALMET - 2009
SpringWinter
AutumnSummer
Annual
Calms = 5.7%
Calms = 3.4% Calms = 7.6%
Calms = 5.1% Calms = 6.9%
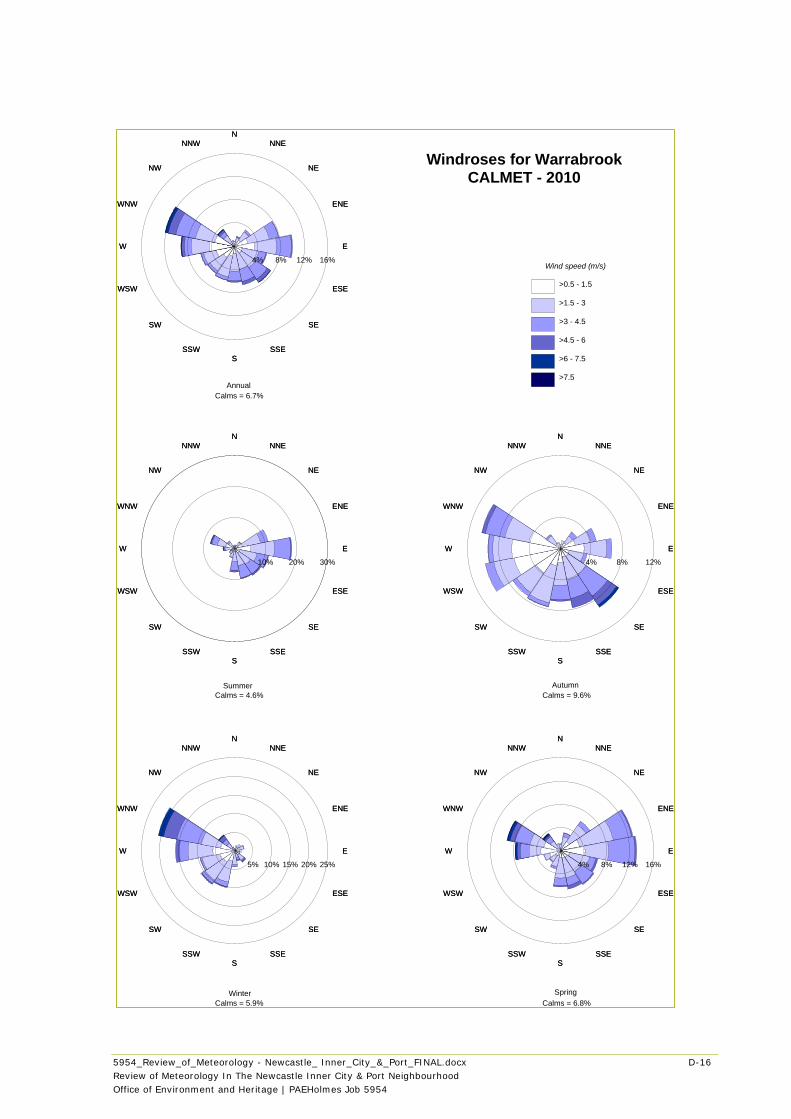
5954_Review_of_Meteorology - Newcastle_ Inner_City_&_Port_FINAL.docx D-16
Review of Meteorology In The Newcastle Inner City & Port Neighbourhood
Office of Environment and Heritage | PAEHolmes Job 5954
NN
NNENNE
NENE
ENEENE
EE
ESEESE
SESE
SSESSE
SS
SSWSSW
SWSW
WSWWSW
WW
WNWWNW
NWNW
NNWNNW
4% 8% 12% 16%
NN
NNENNE
NENE
ENEENE
EE
ESEESE
SESE
SSESSE
SS
SSWSSW
SWSW
WSWWSW
WW
WNWWNW
NWNW
NNWNNW
5% 10% 15% 20% 25%
NN
NNENNE
NENE
ENEENE
EE
ESEESE
SESE
SSESSE
SS
SSWSSW
SWSW
WSWWSW
WW
WNWWNW
NWNW
NNWNNW
4% 8% 12%
NN
NNENNE
NENE
ENEENE
EE
ESEESE
SESE
SSESSE
SS
SSWSSW
SWSW
WSWWSW
WW
WNWWNW
NWNW
NNWNNW
10% 20% 30%
NN
NNENNE
NENE
ENEENE
EE
ESEESE
SESE
SSESSE
SS
SSWSSW
SWSW
WSWWSW
WW
WNWWNW
NWNW
NNWNNW
4% 8% 12% 16%Wind speed (m/s)
>0.5 - 1.5
>1.5 - 3
>3 - 4.5
>4.5 - 6
>6 - 7.5
>7.5
Windroses for WarrabrookCALMET - 2010
SpringWinter
AutumnSummer
Annual
Calms = 6.7%
Calms = 4.6% Calms = 9.6%
Calms = 5.9% Calms = 6.8%
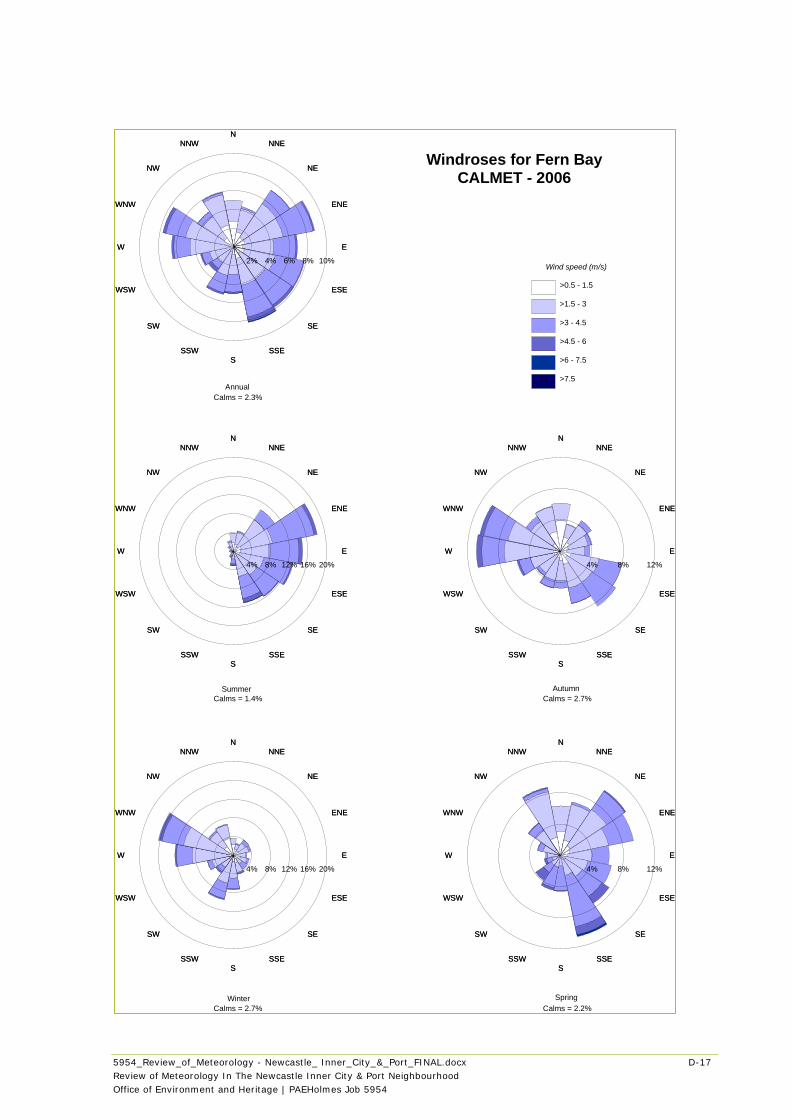
5954_Review_of_Meteorology - Newcastle_ Inner_City_&_Port_FINAL.docx D-17
Review of Meteorology In The Newcastle Inner City & Port Neighbourhood
Office of Environment and Heritage | PAEHolmes Job 5954
NN
NNENNE
NENE
ENEENE
EE
ESEESE
SESE
SSESSE
SS
SSWSSW
SWSW
WSWWSW
WW
WNWWNW
NWNW
NNWNNW
4% 8% 12%
NN
NNENNE
NENE
ENEENE
EE
ESEESE
SESE
SSESSE
SS
SSWSSW
SWSW
WSWWSW
WW
WNWWNW
NWNW
NNWNNW
4% 8% 12% 16% 20%
NN
NNENNE
NENE
ENEENE
EE
ESEESE
SESE
SSESSE
SS
SSWSSW
SWSW
WSWWSW
WW
WNWWNW
NWNW
NNWNNW
4% 8% 12%
NN
NNENNE
NENE
ENEENE
EE
ESEESE
SESE
SSESSE
SS
SSWSSW
SWSW
WSWWSW
WW
WNWWNW
NWNW
NNWNNW
4% 8% 12% 16% 20%
NN
NNENNE
NENE
ENEENE
EE
ESEESE
SESE
SSESSE
SS
SSWSSW
SWSW
WSWWSW
WW
WNWWNW
NWNW
NNWNNW
2% 4% 6% 8% 10%Wind speed (m/s)
>0.5 - 1.5
>1.5 - 3
>3 - 4.5
>4.5 - 6
>6 - 7.5
>7.5
Windroses for Fern BayCALMET - 2006
SpringWinter
AutumnSummer
Annual
Calms = 2.3%
Calms = 1.4% Calms = 2.7%
Calms = 2.7% Calms = 2.2%
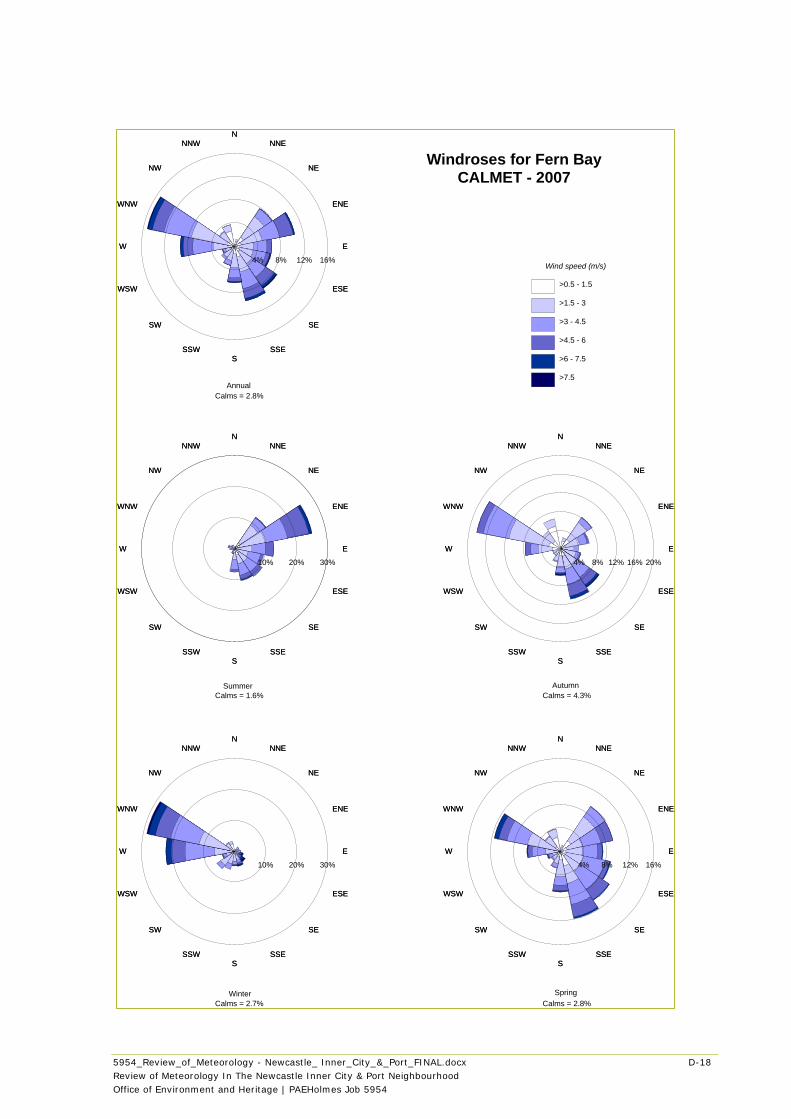
5954_Review_of_Meteorology - Newcastle_ Inner_City_&_Port_FINAL.docx D-18
Review of Meteorology In The Newcastle Inner City & Port Neighbourhood
Office of Environment and Heritage | PAEHolmes Job 5954
NN
NNENNE
NENE
ENEENE
EE
ESEESE
SESE
SSESSE
SS
SSWSSW
SWSW
WSWWSW
WW
WNWWNW
NWNW
NNWNNW
4% 8% 12% 16%
NN
NNENNE
NENE
ENEENE
EE
ESEESE
SESE
SSESSE
SS
SSWSSW
SWSW
WSWWSW
WW
WNWWNW
NWNW
NNWNNW
10% 20% 30%
NN
NNENNE
NENE
ENEENE
EE
ESEESE
SESE
SSESSE
SS
SSWSSW
SWSW
WSWWSW
WW
WNWWNW
NWNW
NNWNNW
4% 8% 12% 16% 20%
NN
NNENNE
NENE
ENEENE
EE
ESEESE
SESE
SSESSE
SS
SSWSSW
SWSW
WSWWSW
WW
WNWWNW
NWNW
NNWNNW
10% 20% 30%
NN
NNENNE
NENE
ENEENE
EE
ESEESE
SESE
SSESSE
SS
SSWSSW
SWSW
WSWWSW
WW
WNWWNW
NWNW
NNWNNW
4% 8% 12% 16%Wind speed (m/s)
>0.5 - 1.5
>1.5 - 3
>3 - 4.5
>4.5 - 6
>6 - 7.5
>7.5
Windroses for Fern BayCALMET - 2007
SpringWinter
AutumnSummer
Annual
Calms = 2.8%
Calms = 1.6% Calms = 4.3%
Calms = 2.7% Calms = 2.8%
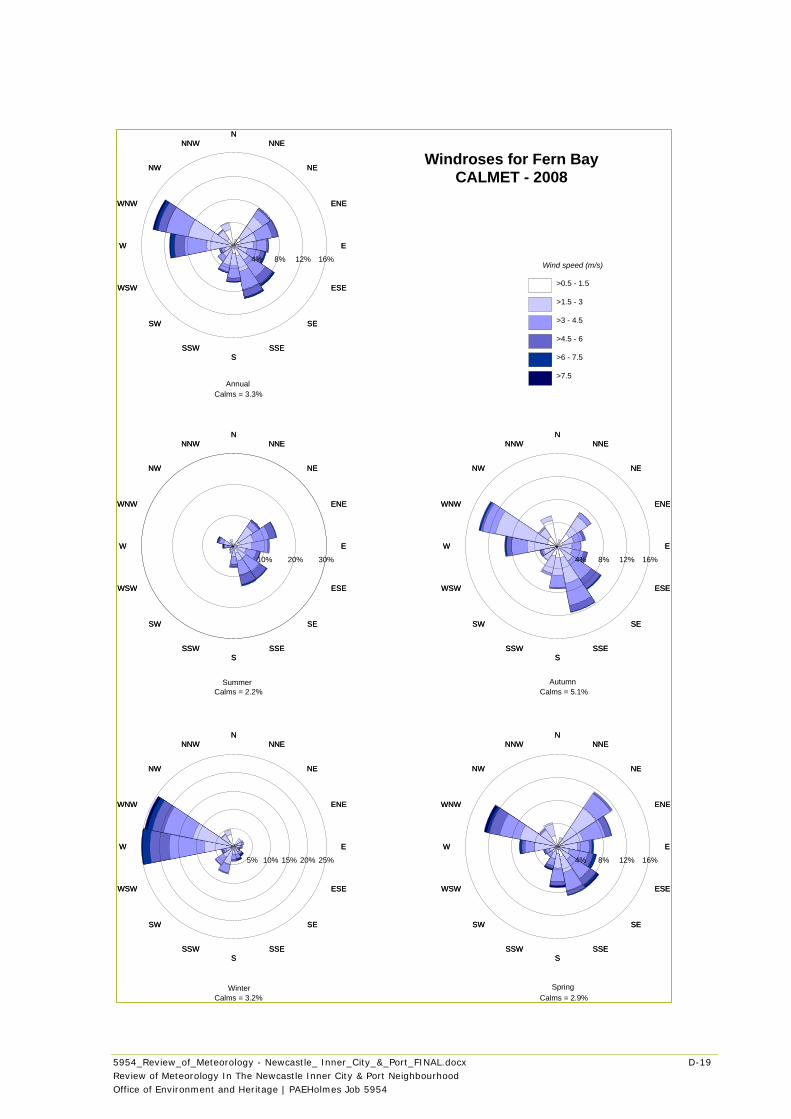
5954_Review_of_Meteorology - Newcastle_ Inner_City_&_Port_FINAL.docx D-19
Review of Meteorology In The Newcastle Inner City & Port Neighbourhood
Office of Environment and Heritage | PAEHolmes Job 5954
NN
NNENNE
NENE
ENEENE
EE
ESEESE
SESE
SSESSE
SS
SSWSSW
SWSW
WSWWSW
WW
WNWWNW
NWNW
NNWNNW
4% 8% 12% 16%
NN
NNENNE
NENE
ENEENE
EE
ESEESE
SESE
SSESSE
SS
SSWSSW
SWSW
WSWWSW
WW
WNWWNW
NWNW
NNWNNW
5% 10% 15% 20% 25%
NN
NNENNE
NENE
ENEENE
EE
ESEESE
SESE
SSESSE
SS
SSWSSW
SWSW
WSWWSW
WW
WNWWNW
NWNW
NNWNNW
4% 8% 12% 16%
NN
NNENNE
NENE
ENEENE
EE
ESEESE
SESE
SSESSE
SS
SSWSSW
SWSW
WSWWSW
WW
WNWWNW
NWNW
NNWNNW
10% 20% 30%
NN
NNENNE
NENE
ENEENE
EE
ESEESE
SESE
SSESSE
SS
SSWSSW
SWSW
WSWWSW
WW
WNWWNW
NWNW
NNWNNW
4% 8% 12% 16%Wind speed (m/s)
>0.5 - 1.5
>1.5 - 3
>3 - 4.5
>4.5 - 6
>6 - 7.5
>7.5
Windroses for Fern BayCALMET - 2008
SpringWinter
AutumnSummer
Annual
Calms = 3.3%
Calms = 2.2% Calms = 5.1%
Calms = 3.2% Calms = 2.9%
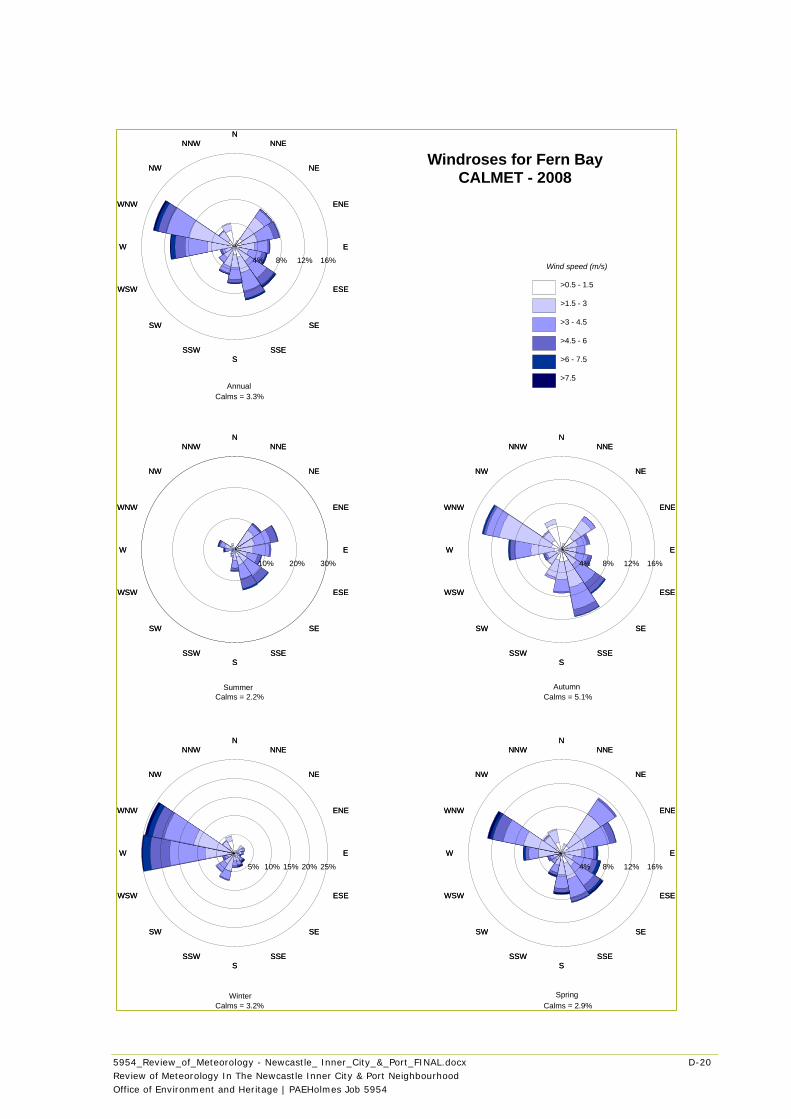
5954_Review_of_Meteorology - Newcastle_ Inner_City_&_Port_FINAL.docx D-20
Review of Meteorology In The Newcastle Inner City & Port Neighbourhood
Office of Environment and Heritage | PAEHolmes Job 5954
NN
NNENNE
NENE
ENEENE
EE
ESEESE
SESE
SSESSE
SS
SSWSSW
SWSW
WSWWSW
WW
WNWWNW
NWNW
NNWNNW
4% 8% 12% 16%
NN
NNENNE
NENE
ENEENE
EE
ESEESE
SESE
SSESSE
SS
SSWSSW
SWSW
WSWWSW
WW
WNWWNW
NWNW
NNWNNW
5% 10% 15% 20% 25%
NN
NNENNE
NENE
ENEENE
EE
ESEESE
SESE
SSESSE
SS
SSWSSW
SWSW
WSWWSW
WW
WNWWNW
NWNW
NNWNNW
4% 8% 12% 16%
NN
NNENNE
NENE
ENEENE
EE
ESEESE
SESE
SSESSE
SS
SSWSSW
SWSW
WSWWSW
WW
WNWWNW
NWNW
NNWNNW
10% 20% 30%
NN
NNENNE
NENE
ENEENE
EE
ESEESE
SESE
SSESSE
SS
SSWSSW
SWSW
WSWWSW
WW
WNWWNW
NWNW
NNWNNW
4% 8% 12% 16%Wind speed (m/s)
>0.5 - 1.5
>1.5 - 3
>3 - 4.5
>4.5 - 6
>6 - 7.5
>7.5
Windroses for Fern BayCALMET - 2008
SpringWinter
AutumnSummer
Annual
Calms = 3.3%
Calms = 2.2% Calms = 5.1%
Calms = 3.2% Calms = 2.9%
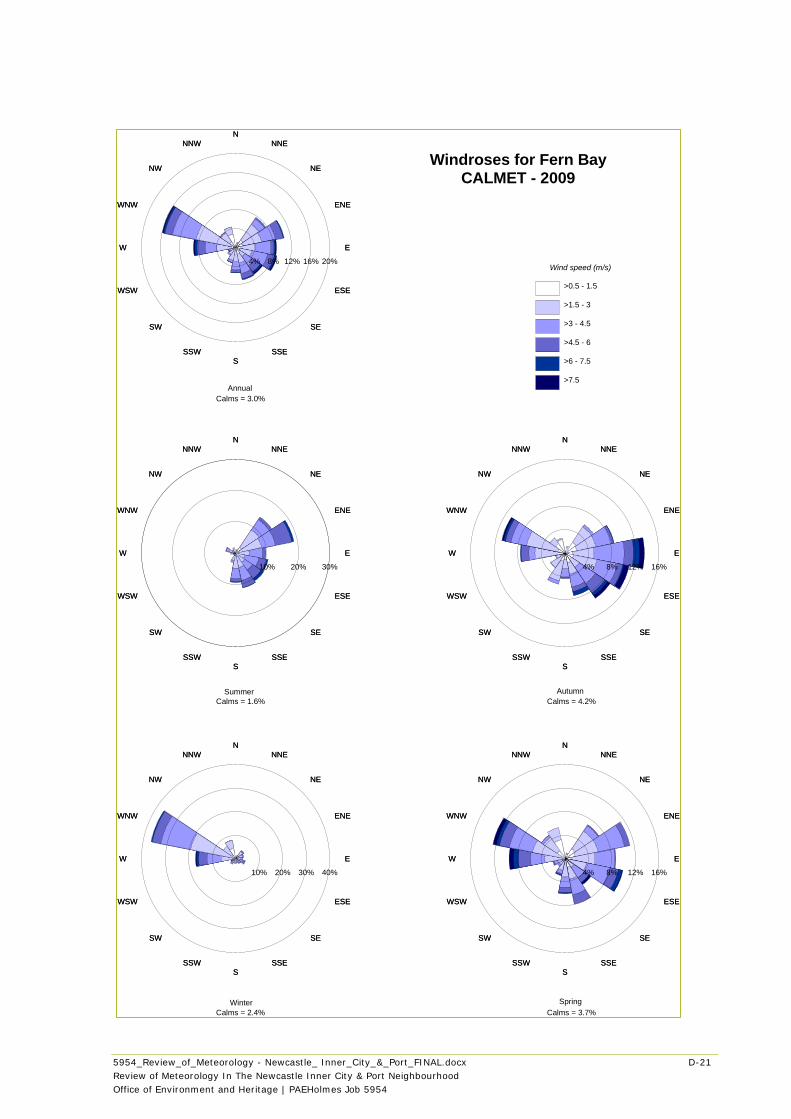
5954_Review_of_Meteorology - Newcastle_ Inner_City_&_Port_FINAL.docx D-21
Review of Meteorology In The Newcastle Inner City & Port Neighbourhood
Office of Environment and Heritage | PAEHolmes Job 5954
NN
NNENNE
NENE
ENEENE
EE
ESEESE
SESE
SSESSE
SS
SSWSSW
SWSW
WSWWSW
WW
WNWWNW
NWNW
NNWNNW
4% 8% 12% 16%
NN
NNENNE
NENE
ENEENE
EE
ESEESE
SESE
SSESSE
SS
SSWSSW
SWSW
WSWWSW
WW
WNWWNW
NWNW
NNWNNW
10% 20% 30% 40%
NN
NNENNE
NENE
ENEENE
EE
ESEESE
SESE
SSESSE
SS
SSWSSW
SWSW
WSWWSW
WW
WNWWNW
NWNW
NNWNNW
4% 8% 12% 16%
NN
NNENNE
NENE
ENEENE
EE
ESEESE
SESE
SSESSE
SS
SSWSSW
SWSW
WSWWSW
WW
WNWWNW
NWNW
NNWNNW
10% 20% 30%
NN
NNENNE
NENE
ENEENE
EE
ESEESE
SESE
SSESSE
SS
SSWSSW
SWSW
WSWWSW
WW
WNWWNW
NWNW
NNWNNW
4% 8% 12% 16% 20%Wind speed (m/s)
>0.5 - 1.5
>1.5 - 3
>3 - 4.5
>4.5 - 6
>6 - 7.5
>7.5
Windroses for Fern BayCALMET - 2009
SpringWinter
AutumnSummer
Annual
Calms = 3.0%
Calms = 1.6% Calms = 4.2%
Calms = 2.4% Calms = 3.7%
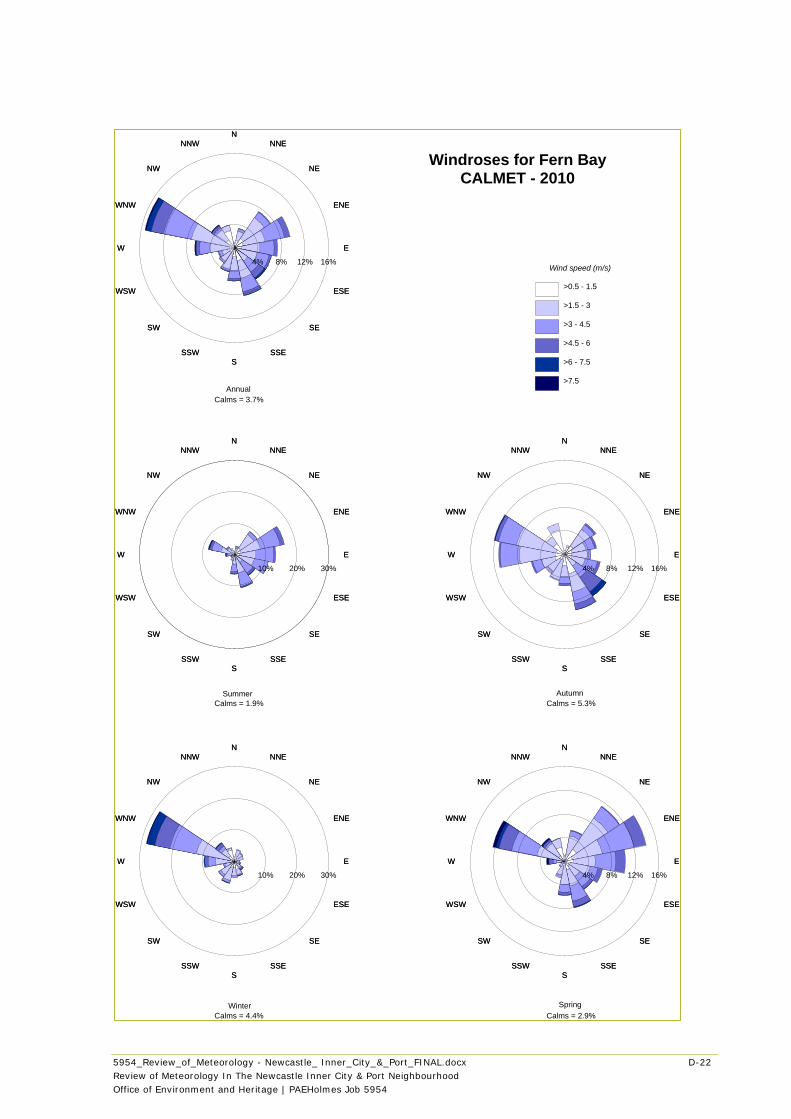
5954_Review_of_Meteorology - Newcastle_ Inner_City_&_Port_FINAL.docx D-22
Review of Meteorology In The Newcastle Inner City & Port Neighbourhood
Office of Environment and Heritage | PAEHolmes Job 5954
NN
NNENNE
NENE
ENEENE
EE
ESEESE
SESE
SSESSE
SS
SSWSSW
SWSW
WSWWSW
WW
WNWWNW
NWNW
NNWNNW
4% 8% 12% 16%
NN
NNENNE
NENE
ENEENE
EE
ESEESE
SESE
SSESSE
SS
SSWSSW
SWSW
WSWWSW
WW
WNWWNW
NWNW
NNWNNW
10% 20% 30%
NN
NNENNE
NENE
ENEENE
EE
ESEESE
SESE
SSESSE
SS
SSWSSW
SWSW
WSWWSW
WW
WNWWNW
NWNW
NNWNNW
4% 8% 12% 16%
NN
NNENNE
NENE
ENEENE
EE
ESEESE
SESE
SSESSE
SS
SSWSSW
SWSW
WSWWSW
WW
WNWWNW
NWNW
NNWNNW
10% 20% 30%
NN
NNENNE
NENE
ENEENE
EE
ESEESE
SESE
SSESSE
SS
SSWSSW
SWSW
WSWWSW
WW
WNWWNW
NWNW
NNWNNW
4% 8% 12% 16%Wind speed (m/s)
>0.5 - 1.5
>1.5 - 3
>3 - 4.5
>4.5 - 6
>6 - 7.5
>7.5
Windroses for Fern BayCALMET - 2010
SpringWinter
AutumnSummer
Annual
Calms = 3.7%
Calms = 1.9% Calms = 5.3%
Calms = 4.4% Calms = 2.9%
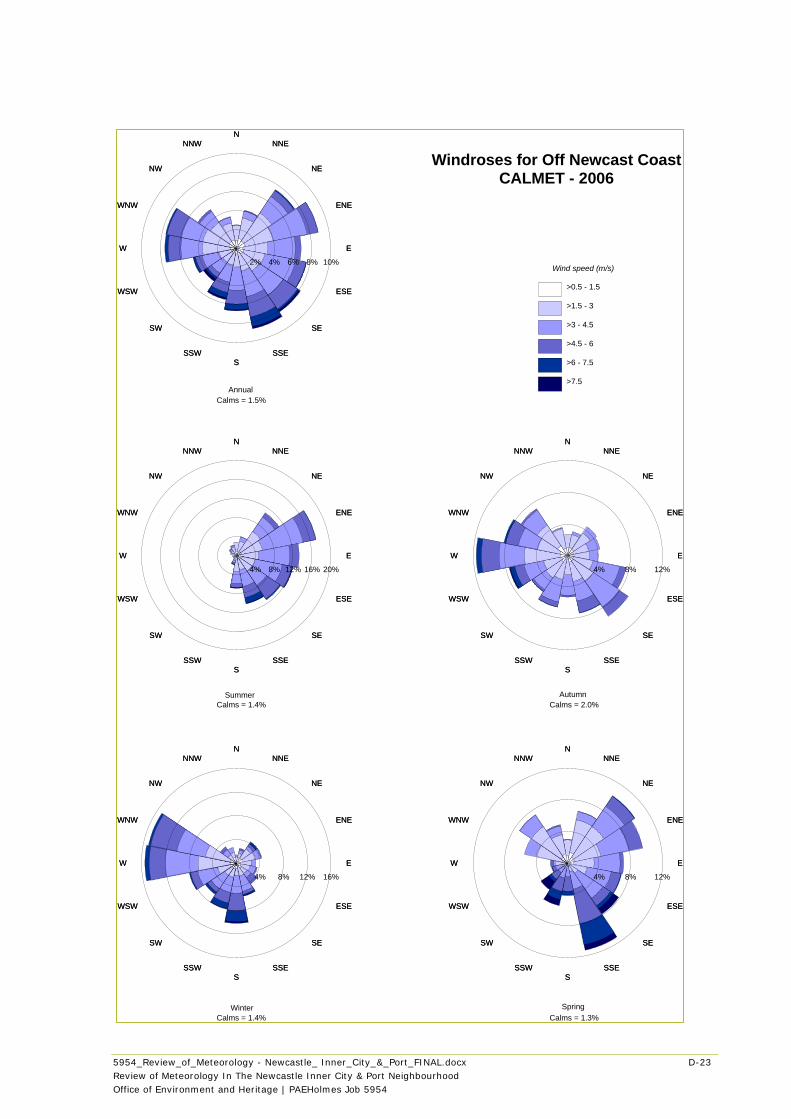
5954_Review_of_Meteorology - Newcastle_ Inner_City_&_Port_FINAL.docx D-23
Review of Meteorology In The Newcastle Inner City & Port Neighbourhood
Office of Environment and Heritage | PAEHolmes Job 5954
NN
NNENNE
NENE
ENEENE
EE
ESEESE
SESE
SSESSE
SS
SSWSSW
SWSW
WSWWSW
WW
WNWWNW
NWNW
NNWNNW
4% 8% 12%
NN
NNENNE
NENE
ENEENE
EE
ESEESE
SESE
SSESSE
SS
SSWSSW
SWSW
WSWWSW
WW
WNWWNW
NWNW
NNWNNW
4% 8% 12% 16%
NN
NNENNE
NENE
ENEENE
EE
ESEESE
SESE
SSESSE
SS
SSWSSW
SWSW
WSWWSW
WW
WNWWNW
NWNW
NNWNNW
4% 8% 12%
NN
NNENNE
NENE
ENEENE
EE
ESEESE
SESE
SSESSE
SS
SSWSSW
SWSW
WSWWSW
WW
WNWWNW
NWNW
NNWNNW
4% 8% 12% 16% 20%
NN
NNENNE
NENE
ENEENE
EE
ESEESE
SESE
SSESSE
SS
SSWSSW
SWSW
WSWWSW
WW
WNWWNW
NWNW
NNWNNW
2% 4% 6% 8% 10%Wind speed (m/s)
>0.5 - 1.5
>1.5 - 3
>3 - 4.5
>4.5 - 6
>6 - 7.5
>7.5
Windroses for Off Newcast CoastCALMET - 2006
SpringWinter
AutumnSummer
Annual
Calms = 1.5%
Calms = 1.4% Calms = 2.0%
Calms = 1.4% Calms = 1.3%
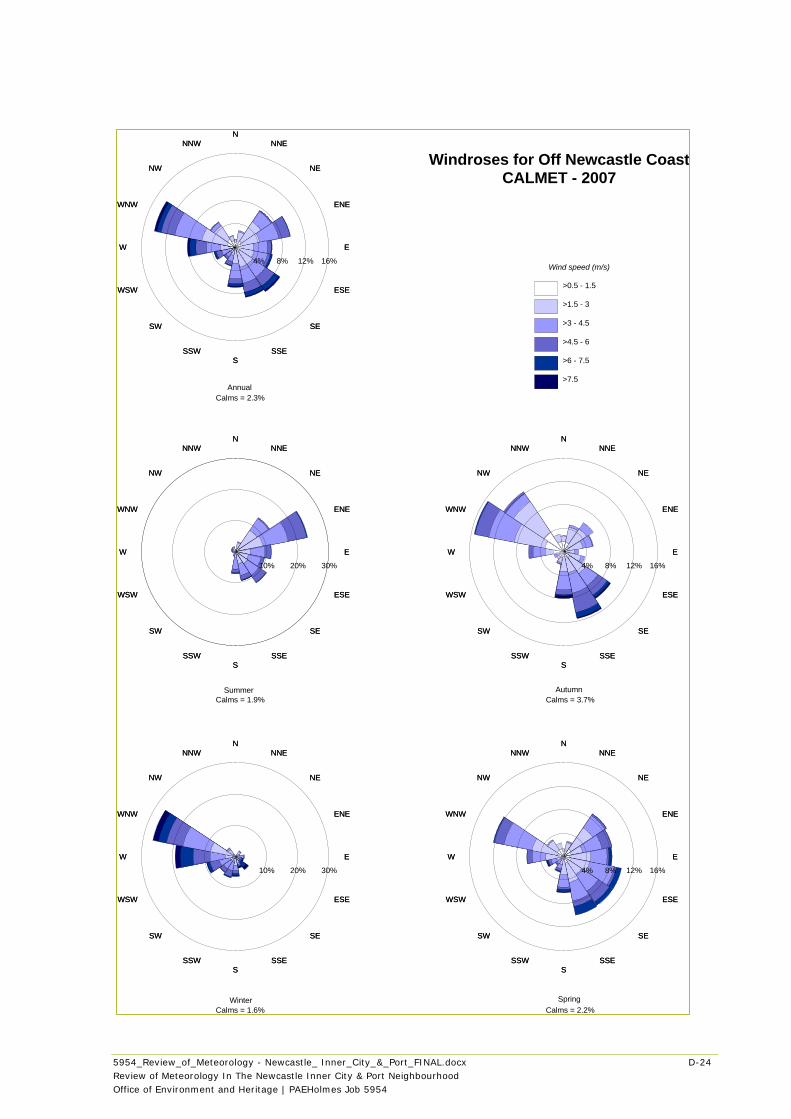
5954_Review_of_Meteorology - Newcastle_ Inner_City_&_Port_FINAL.docx D-24
Review of Meteorology In The Newcastle Inner City & Port Neighbourhood
Office of Environment and Heritage | PAEHolmes Job 5954
NN
NNENNE
NENE
ENEENE
EE
ESEESE
SESE
SSESSE
SS
SSWSSW
SWSW
WSWWSW
WW
WNWWNW
NWNW
NNWNNW
4% 8% 12% 16%
NN
NNENNE
NENE
ENEENE
EE
ESEESE
SESE
SSESSE
SS
SSWSSW
SWSW
WSWWSW
WW
WNWWNW
NWNW
NNWNNW
10% 20% 30%
NN
NNENNE
NENE
ENEENE
EE
ESEESE
SESE
SSESSE
SS
SSWSSW
SWSW
WSWWSW
WW
WNWWNW
NWNW
NNWNNW
4% 8% 12% 16%
NN
NNENNE
NENE
ENEENE
EE
ESEESE
SESE
SSESSE
SS
SSWSSW
SWSW
WSWWSW
WW
WNWWNW
NWNW
NNWNNW
10% 20% 30%
NN
NNENNE
NENE
ENEENE
EE
ESEESE
SESE
SSESSE
SS
SSWSSW
SWSW
WSWWSW
WW
WNWWNW
NWNW
NNWNNW
4% 8% 12% 16%Wind speed (m/s)
>0.5 - 1.5
>1.5 - 3
>3 - 4.5
>4.5 - 6
>6 - 7.5
>7.5
Windroses for Off Newcastle CoastCALMET - 2007
SpringWinter
AutumnSummer
Annual
Calms = 2.3%
Calms = 1.9% Calms = 3.7%
Calms = 1.6% Calms = 2.2%
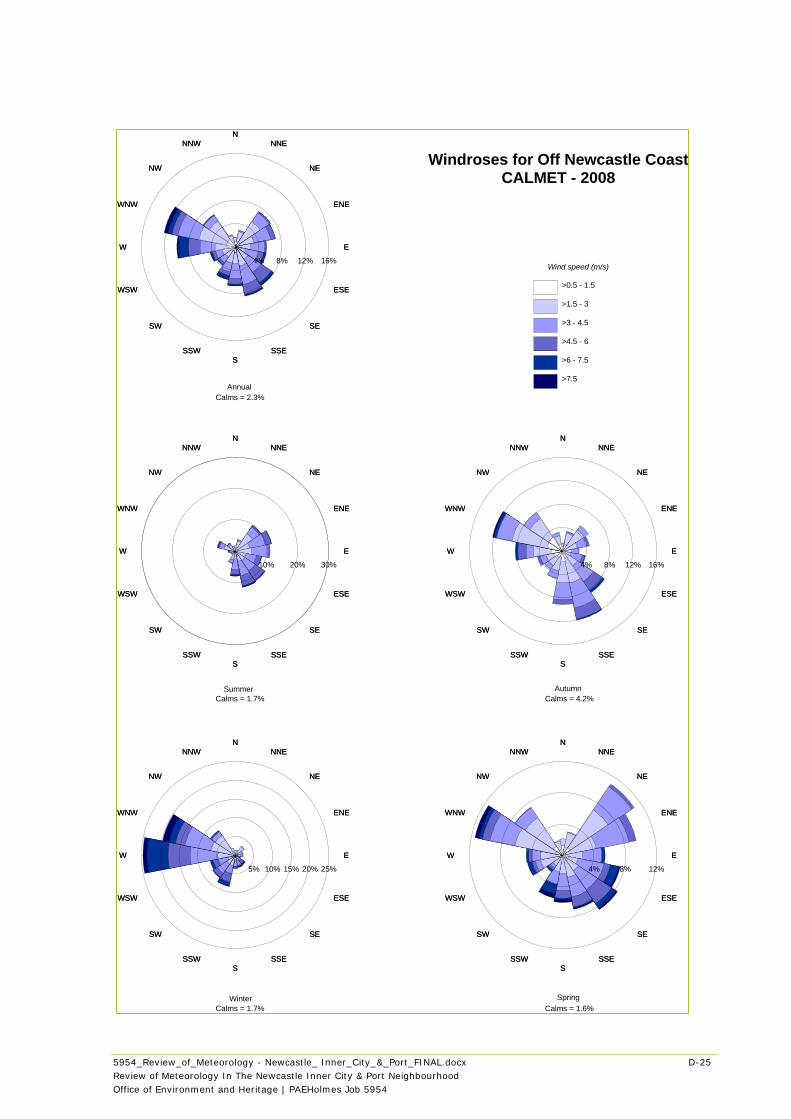
5954_Review_of_Meteorology - Newcastle_ Inner_City_&_Port_FINAL.docx D-25
Review of Meteorology In The Newcastle Inner City & Port Neighbourhood
Office of Environment and Heritage | PAEHolmes Job 5954
NN
NNENNE
NENE
ENEENE
EE
ESEESE
SESE
SSESSE
SS
SSWSSW
SWSW
WSWWSW
WW
WNWWNW
NWNW
NNWNNW
4% 8% 12%
NN
NNENNE
NENE
ENEENE
EE
ESEESE
SESE
SSESSE
SS
SSWSSW
SWSW
WSWWSW
WW
WNWWNW
NWNW
NNWNNW
5% 10% 15% 20% 25%
NN
NNENNE
NENE
ENEENE
EE
ESEESE
SESE
SSESSE
SS
SSWSSW
SWSW
WSWWSW
WW
WNWWNW
NWNW
NNWNNW
4% 8% 12% 16%
NN
NNENNE
NENE
ENEENE
EE
ESEESE
SESE
SSESSE
SS
SSWSSW
SWSW
WSWWSW
WW
WNWWNW
NWNW
NNWNNW
10% 20% 30%
NN
NNENNE
NENE
ENEENE
EE
ESEESE
SESE
SSESSE
SS
SSWSSW
SWSW
WSWWSW
WW
WNWWNW
NWNW
NNWNNW
4% 8% 12% 16%Wind speed (m/s)
>0.5 - 1.5
>1.5 - 3
>3 - 4.5
>4.5 - 6
>6 - 7.5
>7.5
Windroses for Off Newcastle CoastCALMET - 2008
SpringWinter
AutumnSummer
Annual
Calms = 2.3%
Calms = 1.7% Calms = 4.2%
Calms = 1.7% Calms = 1.6%
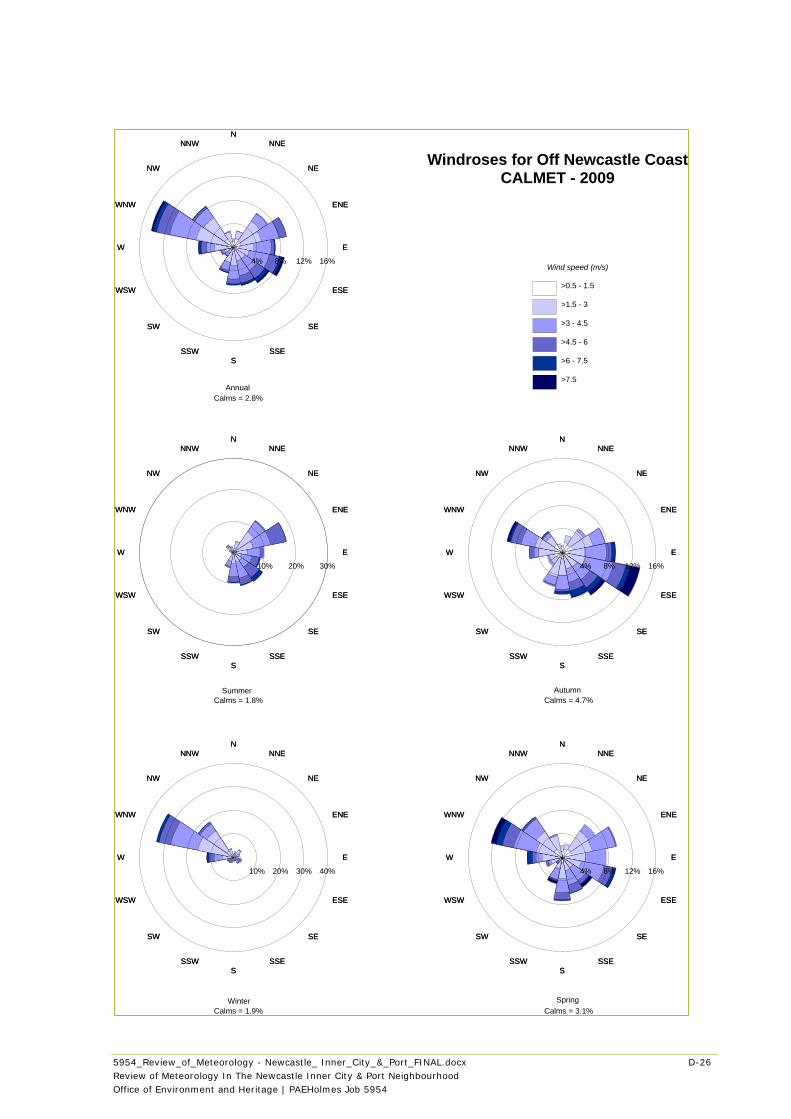
5954_Review_of_Meteorology - Newcastle_ Inner_City_&_Port_FINAL.docx D-26
Review of Meteorology In The Newcastle Inner City & Port Neighbourhood
Office of Environment and Heritage | PAEHolmes Job 5954
NN
NNENNE
NENE
ENEENE
EE
ESEESE
SESE
SSESSE
SS
SSWSSW
SWSW
WSWWSW
WW
WNWWNW
NWNW
NNWNNW
4% 8% 12% 16%
NN
NNENNE
NENE
ENEENE
EE
ESEESE
SESE
SSESSE
SS
SSWSSW
SWSW
WSWWSW
WW
WNWWNW
NWNW
NNWNNW
10% 20% 30% 40%
NN
NNENNE
NENE
ENEENE
EE
ESEESE
SESE
SSESSE
SS
SSWSSW
SWSW
WSWWSW
WW
WNWWNW
NWNW
NNWNNW
4% 8% 12% 16%
NN
NNENNE
NENE
ENEENE
EE
ESEESE
SESE
SSESSE
SS
SSWSSW
SWSW
WSWWSW
WW
WNWWNW
NWNW
NNWNNW
10% 20% 30%
NN
NNENNE
NENE
ENEENE
EE
ESEESE
SESE
SSESSE
SS
SSWSSW
SWSW
WSWWSW
WW
WNWWNW
NWNW
NNWNNW
4% 8% 12% 16%Wind speed (m/s)
>0.5 - 1.5
>1.5 - 3
>3 - 4.5
>4.5 - 6
>6 - 7.5
>7.5
Windroses for Off Newcastle CoastCALMET - 2009
SpringWinter
AutumnSummer
Annual
Calms = 2.8%
Calms = 1.8% Calms = 4.7%
Calms = 1.9% Calms = 3.1%
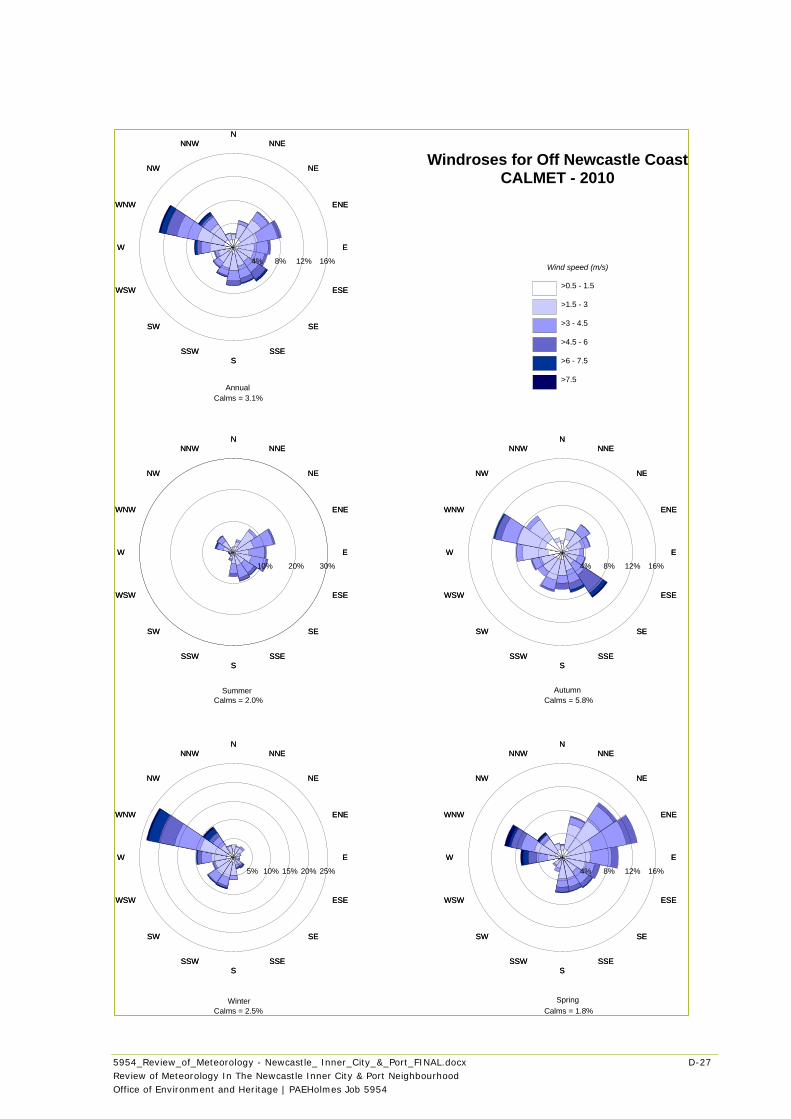
5954_Review_of_Meteorology - Newcastle_ Inner_City_&_Port_FINAL.docx D-27
Review of Meteorology In The Newcastle Inner City & Port Neighbourhood
Office of Environment and Heritage | PAEHolmes Job 5954
NN
NNENNE
NENE
ENEENE
EE
ESEESE
SESE
SSESSE
SS
SSWSSW
SWSW
WSWWSW
WW
WNWWNW
NWNW
NNWNNW
4% 8% 12% 16%
NN
NNENNE
NENE
ENEENE
EE
ESEESE
SESE
SSESSE
SS
SSWSSW
SWSW
WSWWSW
WW
WNWWNW
NWNW
NNWNNW
5% 10% 15% 20% 25%
NN
NNENNE
NENE
ENEENE
EE
ESEESE
SESE
SSESSE
SS
SSWSSW
SWSW
WSWWSW
WW
WNWWNW
NWNW
NNWNNW
4% 8% 12% 16%
NN
NNENNE
NENE
ENEENE
EE
ESEESE
SESE
SSESSE
SS
SSWSSW
SWSW
WSWWSW
WW
WNWWNW
NWNW
NNWNNW
10% 20% 30%
NN
NNENNE
NENE
ENEENE
EE
ESEESE
SESE
SSESSE
SS
SSWSSW
SWSW
WSWWSW
WW
WNWWNW
NWNW
NNWNNW
4% 8% 12% 16%Wind speed (m/s)
>0.5 - 1.5
>1.5 - 3
>3 - 4.5
>4.5 - 6
>6 - 7.5
>7.5
Windroses for Off Newcastle CoastCALMET - 2010
SpringWinter
AutumnSummer
Annual
Calms = 3.1%
Calms = 2.0% Calms = 5.8%
Calms = 2.5% Calms = 1.8%