review of automobile insurance rates ... of automobile insurance rates 40 canadian cities 10...
TRANSCRIPT
REVIEW OF AUTOMOBILE INSURANCE RATES
40 Canadian Cities 10 Provinces
September 2003
Regina, SKWinnipeg, MB
Victoria, BCQuebec City, PQ
Charlottetown, PEFredericton, NB
St. Johns, NFEdmonton, AB
Halifax, NSToronto, ON
$-$2,000$4,000$6,000$8,000
$10,000$12,000
$14,000$16,000
$18,000
$20,000
Provincial Capitals: Auto Insurance Rates (Highest)

Consumers’ Association of Canada Auto Insurance Rates Study – September 2003
2003 Consumers Association of Canada 2
This Consumers’ Association of Canada study on auto insurance rates answers the following question:
How much would the same driver pay for auto insurance if they had the same vehicle, same
driving record and same claims history, and lived in each of the 40 cities surveyed in this study?

Consumers’ Association of Canada Auto Insurance Rates Study – September 2003
2003 Consumers Association of Canada 3
TABLE OF CONTENTSExecutive Summary ......................................................................................................................... 5
1.0 OVERVIEW ....................................................................................................................... 7
1.1 Study Focus..................................................................................................................... 7
1.2 Study Methodology......................................................................................................... 7
1.3 Study Assumptions ......................................................................................................... 8
2.0 AUTO INSURANCE RATES & SYSTEMS..................................................................... 9
2.1 Common Factors That Affect Rates ............................................................................... 9
2.2 Different Types of Auto Insurance Systems ................................................................... 9
3.0 KEY FINDINGS............................................................................................................... 10

Consumers’ Association of Canada Auto Insurance Rates Study – September 2003
2003 Consumers Association of Canada 4
SERVICE TO CANADIAN CONSUMERS The Consumers’ Association of Canada is a national non-profit organization that has served the interests of consumers for over 50 years. A network of volunteer members supports the Association across Canada. In addition to its national office in Ottawa, Ontario branches of the Association are active from Nova Scotia to British Columbia and focus their work on local or regional issues. The Association provides an independent consumer voice when government and industry make decisions about products, policies or programs. The Association has worked with thousands of individual consumers in resolving disputes with product and service providers. The Association also advocates solutions to issues that are clearly in the consumer’s interest even when these solutions are in conflict with Government or industry positions. Auto insurance is one of these issues.
All comments, analysis, findings and conclusions in this Study are the sole responsibility of the Association.
NOTE This Study and earlier releases of portions of this study may also be found at the following web site www.CACBC.com.
COPYRIGHT 2003 The Consumers’ Association of Canada copyrights this study and all its contents. Material from this study may be used for research purposes and the media may freely quote from any part of the study. This study may not be used for any commercial or other purpose without the express authorization of the Consumer’s Association of Canada.

Consumers’ Association of Canada Auto Insurance Rates Study – September 2003
2003 Consumers Association of Canada 5
EXECUTIVE SUMMARY
Auto insurance has historically been a contentious issue across Canada. For most of 2003 consumers have expressed their displeasure with skyrocketing auto insurance rates in all provinces that have private auto insurance systems. Governments in Newfoundland, Nova Scotia, New Brunswick, Prince Edward Island, Ontario and Alberta have promised or taken initiatives to mitigate rates. At the same time, while Statistics Canada reported that rates had escalated by up to 70% in those six provinces other consumers in a province like Manitoba, with a public auto system, experienced rate increases of only 7.2%. The purpose of this study is to inform consumers about the auto insurance issue by providing an independent source of information about auto insurance rates across Canada. This study examines and compares rates in 40 cities in 10 provinces. The same 34 different driver profiles, reflecting a cross-section of vehicle types, driver history, driver ages and gender, claims and marital status, were used in each city to illustrate how much consumers’ pay for auto insurance. This study answers the following important question:
How much would the same driver pay for auto insurance if they had the same vehicle, same driving record and same claims history but lived in each of the 40 cities surveyed in this study?
The key findings and conclusions of this study are: Finding #1 – Public Auto Insurance Systems Offer The Lowest Rates For Consumers Finding #2 – Toronto Consumers Pay The Highest Rates In Canada Finding #3 – Winnipeg Has Lowest Rates Of Canada’s Capital Cities Finding #4 – Canada’s Largest Cities - Toronto and Calgary Have The Highest Rates Finding #5 - Western Provinces Have Much Lower Rates Than The Maritimes Finding #6 – Alberta Consumers Pay Much Higher Rates Than In Neighbouring Provinces Finding #7 - Ontario’s Rates Are Much Higher Than In Western Public Auto Provinces Finding #8 - Quebec’s Rates Are Much Lower Than Ontario’s Rates Finding #9 – Rates Are Consistent Between Canada’s Public Auto Systems Finding #10 - Under Private Auto Systems, Good Young Male Drivers Pay More Than Bad
Older Drivers With High Priced Vehicles
Consumers’ Association of Canada Auto Insurance Rates Study – September 2003
2003 Consumers Association of Canada 6
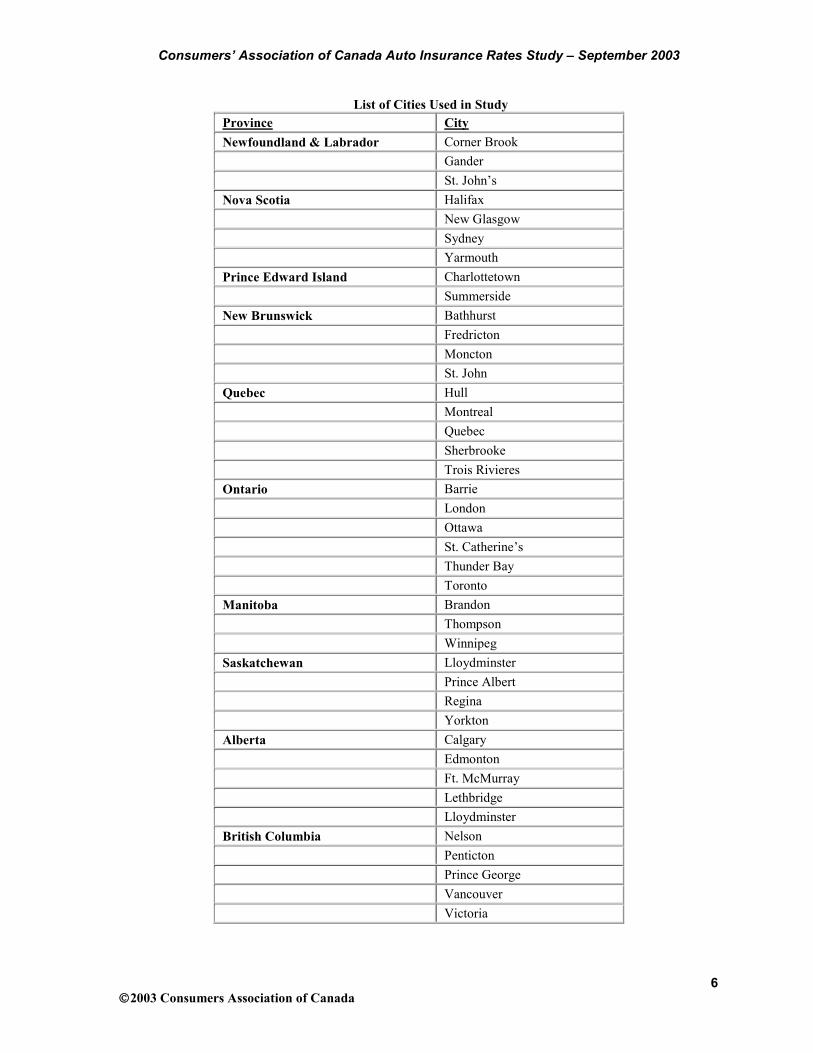
List of Cities Used in Study Province CityNewfoundland & Labrador Corner Brook
Gander St. John’s
Nova Scotia Halifax New Glasgow Sydney Yarmouth
Prince Edward Island Charlottetown Summerside
New Brunswick Bathhurst Fredricton Moncton St. John
Quebec Hull Montreal Quebec Sherbrooke Trois Rivieres
Ontario Barrie London Ottawa St. Catherine’s Thunder Bay Toronto
Manitoba Brandon Thompson Winnipeg
Saskatchewan Lloydminster Prince Albert Regina Yorkton
Alberta Calgary Edmonton Ft. McMurray Lethbridge Lloydminster
British Columbia Nelson Penticton Prince George Vancouver Victoria

Consumers’ Association of Canada Auto Insurance Rates Study – September 2003
2003 Consumers Association of Canada 7
1.0 OVERVIEW
1.1 STUDY FOCUS The purpose of this study is to provide an independent source of information for consumers about auto insurance rates across Canada. Recently, auto insurance has emerged as a significant consumer and political issue in those provinces where rates have increased dramatically over the last year. Each province has its own system of auto insurance. Canadian consumers face a variety of systems such as:
• Nova Scotia’s private insurer tort-based system • Quebec’s mixed public insurer no fault injury based system with a private insurer
based vehicle damage system • Ontario’s private insurer threshold no-fault injury based system • Manitoba’s public auto based pure no-fault injury system • Saskatchewan’s choice model, where a consumer can purchase either tort or no-fault
injury coverage under that province’s public auto insurance system
Irrespective of these differences consumers want to know, and this study focuses on delivering answers to a key question:
How much would the same driver pay for auto insurance if they had the same vehicle, same driving record and same claims history but lived in each of the 40 cities surveyed in this study?
1.2 STUDY METHODOLOGY This study examines and compares auto insurance rates in 40 cities in 10 provinces in Canada. A total of 34 different rating profiles is used which reflects a wide cross-section of vehicle types, families, families with multiple drivers, single parent families and singles, from young drivers to seniors, both genders, from clean driving records to not so perfect, and a variety of claims histories. In effect, this study provides a snapshot comparison of Canadian drivers.
Consumers’ Association of Canada Auto Insurance Rates Study – September 2003
2003 Consumers Association of Canada 8
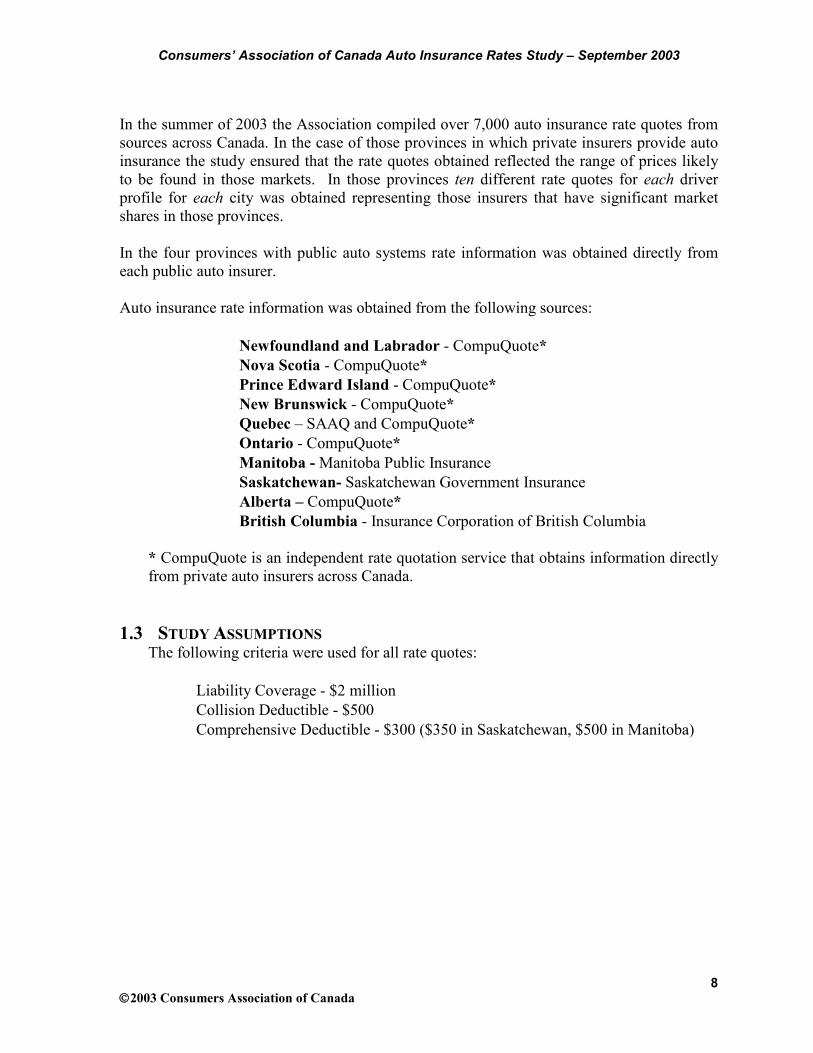
In the summer of 2003 the Association compiled over 7,000 auto insurance rate quotes from sources across Canada. In the case of those provinces in which private insurers provide auto insurance the study ensured that the rate quotes obtained reflected the range of prices likely to be found in those markets. In those provinces ten different rate quotes for each driver profile for each city was obtained representing those insurers that have significant market shares in those provinces. In the four provinces with public auto systems rate information was obtained directly from each public auto insurer. Auto insurance rate information was obtained from the following sources:
• Newfoundland and Labrador - CompuQuote*• Nova Scotia - CompuQuote*• Prince Edward Island - CompuQuote*• New Brunswick - CompuQuote*• Quebec – SAAQ and CompuQuote*• Ontario - CompuQuote*• Manitoba - Manitoba Public Insurance • Saskatchewan- Saskatchewan Government Insurance • Alberta – CompuQuote*• British Columbia - Insurance Corporation of British Columbia
* CompuQuote is an independent rate quotation service that obtains information directly from private auto insurers across Canada.
1.3 STUDY ASSUMPTIONS The following criteria were used for all rate quotes:
• Liability Coverage - $2 million • Collision Deductible - $500 • Comprehensive Deductible - $300 ($350 in Saskatchewan, $500 in Manitoba)
Consumers’ Association of Canada Auto Insurance Rates Study – September 2003
2003 Consumers Association of Canada 9
2.0 AUTO INSURANCE RATES & SYSTEMS
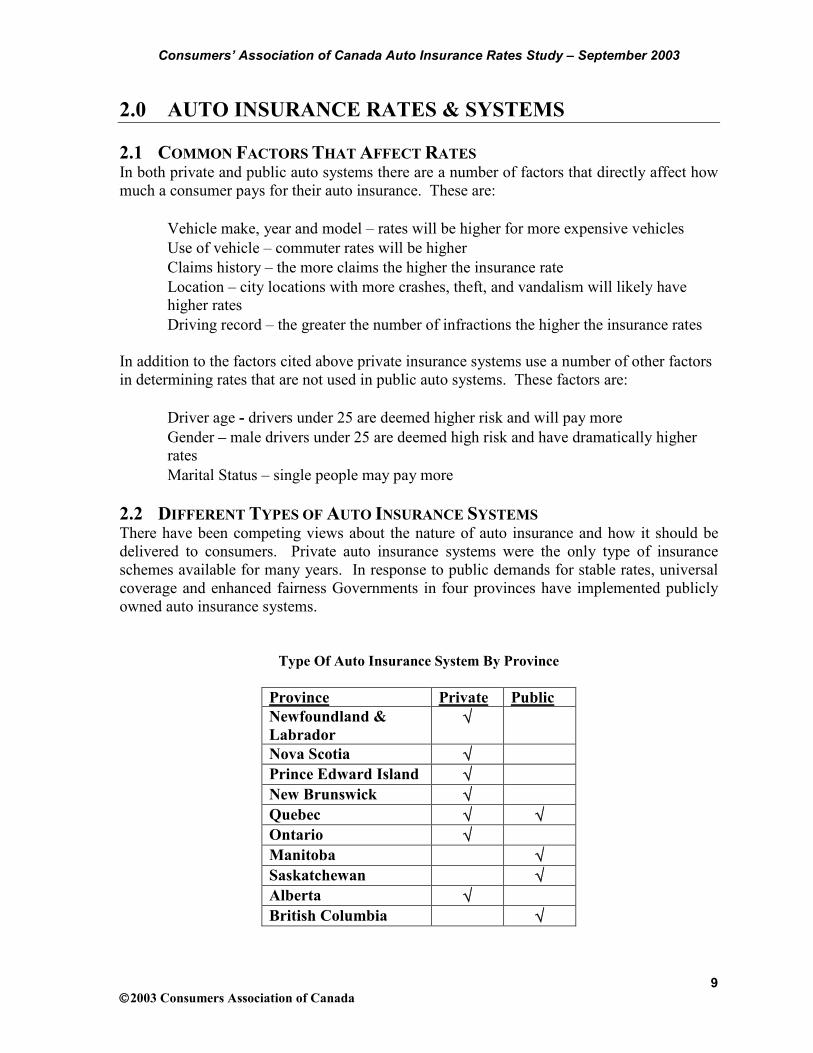
2.1 COMMON FACTORS THAT AFFECT RATES In both private and public auto systems there are a number of factors that directly affect how much a consumer pays for their auto insurance. These are:
• Vehicle make, year and model – rates will be higher for more expensive vehicles • Use of vehicle – commuter rates will be higher • Claims history – the more claims the higher the insurance rate • Location – city locations with more crashes, theft, and vandalism will likely have
higher rates • Driving record – the greater the number of infractions the higher the insurance rates
In addition to the factors cited above private insurance systems use a number of other factors in determining rates that are not used in public auto systems. These factors are:
• Driver age - drivers under 25 are deemed higher risk and will pay more • Gender – male drivers under 25 are deemed high risk and have dramatically higher
rates • Marital Status – single people may pay more
2.2 DIFFERENT TYPES OF AUTO INSURANCE SYSTEMS There have been competing views about the nature of auto insurance and how it should be delivered to consumers. Private auto insurance systems were the only type of insurance schemes available for many years. In response to public demands for stable rates, universal coverage and enhanced fairness Governments in four provinces have implemented publicly owned auto insurance systems.
Type Of Auto Insurance System By Province
Province Private PublicNewfoundland & Labrador
√
Nova Scotia √Prince Edward Island √New Brunswick √Quebec √ √Ontario √Manitoba √Saskatchewan √Alberta √British Columbia √

Consumers’ Association of Canada Auto Insurance Rates Study – September 2003
2003 Consumers Association of Canada 10
3.0 KEY FINDINGS
The key findings of this study are as follows: Finding #1 – Public Auto Insurance Systems Offer The Lowest Rates For Consumers Finding #2 – Toronto Consumers Pay The Highest Rates In Canada Finding #3 – Winnipeg Has Lowest Rates Of Canada’s Capital Cities Finding #4 – Canada’s Largest Cities - Toronto and Calgary Have The Highest Rates Finding #5 - Western Provinces Have Much Lower Rates Than The Maritimes Finding #6 – Alberta Consumers Pay Much Higher Rates Than In Neighbouring Provinces Finding #7 - Ontario’s Rates Are Much Higher Than In Western Public Auto Provinces Finding #8 - Quebec’s Rates Are Much Lower Than Ontario’s Rates Finding #9 – Rates Are Consistent Between Canada’s Public Auto Systems Finding #10 - Under Private Auto Systems, Good Young Male Drivers Pay More Than Bad
Older Drivers With High Priced Vehicles
Consumers’ Association of Canada Auto Insurance Rates Study – September 2003
11
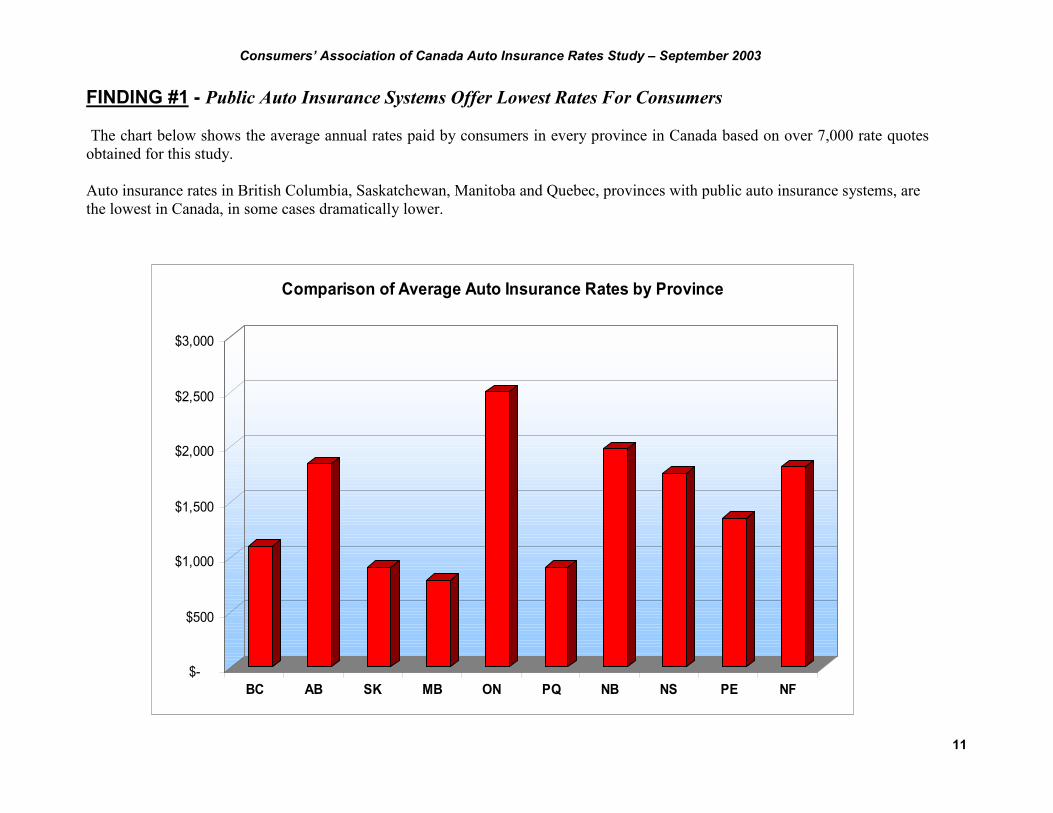
FINDING #1 - Public Auto Insurance Systems Offer Lowest Rates For Consumers
The chart below shows the average annual rates paid by consumers in every province in Canada based on over 7,000 rate quotesobtained for this study.
Auto insurance rates in British Columbia, Saskatchewan, Manitoba and Quebec, provinces with public auto insurance systems, arethe lowest in Canada, in some cases dramatically lower.
$-
$500
$1,000
$1,500
$2,000
$2,500
$3,000
BC AB SK MB ON PQ NB NS PE NF
Comparison of Average Auto Insurance Rates by Province

Consumers’ Association of Canada Auto Insurance Rates Study – September 2003
12
FINDING #2 – Toronto Consumers Pay The Highest Rates In Canada
Consumers in Canada’s largest city pay the highest average auto insurance rates in Canada.
$-
$500
$1,000
$1,500
$2,000
$2,500
$3,000
Van
couv
er, B
C
Vic
tori
a, B
C
Pent
icto
n, B
C
Prin
ce G
eorg
e, B
C
Nels
on, B
C
Cal
gary
, AB
Edm
onto
n, A
B
Leth
brid
ge, A
B
Lloy
dmin
ster
, AB
Ft. M
cMur
ray,
AB
Regi
na, S
K
Prin
ce A
lber
t, SK
Lloy
dmin
ster
, SK
York
ton,
SK
Win
nipe
g, M
B
Bran
don,
MB
Thom
pson
, MB
Toro
nto,
ON
Ott
awa,
ON
Lond
on, O
N
Thun
der
Bay,
ON
St. C
athe
rine
's, O
N
Barr
ie, O
N
Mon
trea
l, PQ
Que
bec
City
, PQ
Troi
s Ri
vier
es, P
Q
Sher
broo
ke, P
Q
Hull,
PQ
St. J
ohn,
NB
Mon
cton
, NB
Fred
eric
ton,
NB
Bath
urst
, NB
Halif
ax, N
S
Sydn
ey, N
S
New
Gla
sgow
, NS
Yarm
outh
, NS
Cha
rlot
teto
wn,
PE
Sum
mer
side
, PE
St. J
ohns
, NF
Cor
ner
Broo
k, N
F
City
Average Annual Insurance Cost by City

Consumers’ Association of Canada Auto Insurance Rates Study – September 2003
13
FINDING #3 – Winnipeg Has Lowest Rates Of Canada’s Capital Cities
The chart below shows a consumer's costs of obtaining insurance in each of the capital cities in tenprovinces. Winnipeg has the lowest rates of Canada’s capital cities. Regina followed very closelywith the next lowest rates and Toronto has the highest.
Rating Profile List
Rat
ing
Prof
ile
Vehi
cle
Year
Mak
e &
Mod
el
Prim
ary
Driv
er
Gen
der
Prim
ary
Driv
er
Age
Cla
im(s
) or
Con
vict
ion(
s)
1 1995 Chrysler Intrepid Male 58 No2 1996 Dodge Caravan Female 55 No3 1992 Toyota 4Runner Male 58 Yes4 1998 Ford Windstar Female 55 No5 1999 Toyota Camry Male 48 Yes6 1994 Ford Taurus Female 42 No7 1992 Honda Civic Male 22 No8 2000 Ford Excursion Female 45 Yes9 1990 Dodge Spirit Female 22 No10 1995 GMC Sonoma Female 22 Yes11 1991 Mazda Protégé Female 87 Yes12 1997 Saturn SL1 Male 72 No13 1994 Plymouth Colt Female 38 Yes14 2000 Volvo V70 Male 45 Yes15 2002 Toyota Corolla Male 68 No16 1992 Pontiac Sunbird Female 51 Yes17 1997 Dodge Ram Male 35 Yes18 1990 Jeep Cherokee Male 40 Yes
19 1996ChevroletCavalier Female 33 Yes
20 1985 GMC K1500 Female 18 No21 1998 Dodge Neon Female 17 No22 1992 Toyota Pickup Male 19 Yes23 2003 Lexus ES 300 Female 57 Yes
24 1966VolkswagenVanagon Male 31 Yes
25 2000 Honda Odyssey Female 43 No26 2002 Chevy Astro Male 51 No27 1996 Suzuki Swift Female 43 No28 1999 BMW 323 Male 36 Yes29 1996 Mazda Miata Female 42 Yes30 1997 Ford Explorer Male 55 No
31 1988Chrysler NewYorker Female 70 No
32 1997 Ford F-150 Male 42 No
33 1993Buick ParkAvenue Male 75 Yes
34 2001VolkswagenBeetle Male 27 No
1 4 7
10 13 16 19 22 25 28 31 34
Winnipeg, M B
Regina, SKVictoria, BC
Quebec City, PQCharlo ttetown, PE
St. Johns, NFFredericton, NB
Edmonton, ABHalifax, NS
Toronto, ON
$-$1,000$2,000$3,000$4,000$5,000$6,000$7,000$8,000$9,000
$10,000
Rating Profile #
Provincial Capitals: A Comparison of Median Auto Insurance Rates
Winnipeg, MB Regina, SK Victoria, BC Quebec City, PQ Charlottetown, PESt. Johns, NF Fredericton, NB Edmonton, AB Halifax, NS Toronto, ON

Consumers’ Association of Canada Auto Insurance Rates Study – September 2003
14
FINDING #4 – Canada’s Largest Cities - Toronto and CalgaryHave The Highest Rates
The chart below shows a consumer's costs of auto insurance in five of Canada’s largest cities. Whatdifferentiates the cities with the highest rates, Toronto and Calgary, from Vancouver, Winnipeg andMontreal, is the latter three cities have public auto insurance systems.
Rating Profile List
Rat
ing
Prof
ile
Vehi
cle
Year
Mak
e &
Mod
el
Prim
ary
Driv
er
Gen
der
Prim
ary
Driv
er
Age
Cla
im(s
) or
Con
vict
ion(
s)
1 1995 Chrysler Intrepid Male 58 No2 1996 Dodge Caravan Female 55 No3 1992 Toyota 4Runner Male 58 Yes4 1998 Ford Windstar Female 55 No5 1999 Toyota Camry Male 48 Yes6 1994 Ford Taurus Female 42 No7 1992 Honda Civic Male 22 No8 2000 Ford Excursion Female 45 Yes9 1990 Dodge Spirit Female 22 No10 1995 GMC Sonoma Female 22 Yes11 1991 Mazda Protégé Female 87 Yes12 1997 Saturn SL1 Male 72 No13 1994 Plymouth Colt Female 38 Yes14 2000 Volvo V70 Male 45 Yes15 2002 Toyota Corolla Male 68 No16 1992 Pontiac Sunbird Female 51 Yes17 1997 Dodge Ram Male 35 Yes18 1990 Jeep Cherokee Male 40 Yes
19 1996ChevroletCavalier Female 33 Yes
20 1985 GMC K1500 Female 18 No21 1998 Dodge Neon Female 17 No22 1992 Toyota Pickup Male 19 Yes23 2003 Lexus ES 300 Female 57 Yes
24 1966VolkswagenVanagon Male 31 Yes
25 2000 Honda Odyssey Female 43 No26 2002 Chevy Astro Male 51 No27 1996 Suzuki Swift Female 43 No28 1999 BMW 323 Male 36 Yes29 1996 Mazda Miata Female 42 Yes30 1997 Ford Explorer Male 55 No
31 1988Chrysler NewYorker Female 70 No
32 1997 Ford F-150 Male 42 No
33 1993Buick ParkAvenue Male 75 Yes
34 2001VolkswagenBeetle Male 27 No
1 3 5 7 9
11 13 15 17 19 21 23 25 27 29 31 33
Winnipeg, MBMontreal, PQ
Vancouver, BCCalgary, AB
Toronto, ON
$-
$1,000
$2,000
$3,000
$4,000
$5,000
$6,000
$7,000
$8,000
$9,000
Rating Profile #
A Tale of Large Cities: A Comparison of Median Auto Insurance Rates
Winnipeg, MB Montreal, PQ Vancouver, BC Calgary, AB Toronto, ON

Consumers’ Association of Canada Auto Insurance Rates Study – September 2003
15
FINDING #5 - Western Provinces Have Much Lower Rates Than The Maritimes
The chart below shows a consumer's costs of obtaining insurance in the four western provinces andthe four maritime provinces. The three western provinces with public auto systems deliver thelowest rates for their consumers.
Rating Profile List
Rat
ing
Prof
ile
Vehi
cle
Year
Mak
e &
Mod
el
Prim
ary
Driv
er
Gen
der
Prim
ary
Driv
er
Age
Cla
im(s
) or
Con
vict
ion(
s)
1 1995 Chrysler Intrepid Male 58 No2 1996 Dodge Caravan Female 55 No3 1992 Toyota 4Runner Male 58 Yes4 1998 Ford Windstar Female 55 No5 1999 Toyota Camry Male 48 Yes6 1994 Ford Taurus Female 42 No7 1992 Honda Civic Male 22 No8 2000 Ford Excursion Female 45 Yes9 1990 Dodge Spirit Female 22 No10 1995 GMC Sonoma Female 22 Yes11 1991 Mazda Protégé Female 87 Yes12 1997 Saturn SL1 Male 72 No13 1994 Plymouth Colt Female 38 Yes14 2000 Volvo V70 Male 45 Yes15 2002 Toyota Corolla Male 68 No16 1992 Pontiac Sunbird Female 51 Yes17 1997 Dodge Ram Male 35 Yes18 1990 Jeep Cherokee Male 40 Yes
19 1996ChevroletCavalier Female 33 Yes
20 1985 GMC K1500 Female 18 No21 1998 Dodge Neon Female 17 No22 1992 Toyota Pickup Male 19 Yes23 2003 Lexus ES 300 Female 57 Yes
24 1966VolkswagenVanagon Male 31 Yes
25 2000 Honda Odyssey Female 43 No26 2002 Chevy Astro Male 51 No27 1996 Suzuki Swift Female 43 No28 1999 BMW 323 Male 36 Yes29 1996 Mazda Miata Female 42 Yes30 1997 Ford Explorer Male 55 No
31 1988Chrysler NewYorker Female 70 No
32 1997 Ford F-150 Male 42 No
33 1993Buick ParkAvenue Male 75 Yes
34 2001VolkswagenBeetle Male 27 No
1 5 9
13 17 21 25 29 33
M anitoba
SaskatchewanBritish Columbia
Prince Edward IslandNewfoundland
New BrunswickAlberta
Nova Scotia
$-$1,000$2,000
$3,000$4,000
$5,000
$6,000
$7,000
Rating Profile #
East vs West: Median Ratesfor the Maritimes and the Four Western Provinces
Manitoba Saskatchewan British Columbia Prince Edward IslandNewfoundland New Brunswick Alberta Nova Scotia

Consumers’ Association of Canada Auto Insurance Rates Study – September 2003
16
Finding 5 continued: Halifax vs. Victoria
An example of two cities on each side of Canada that are comparable in size is Victoria, BritishColumbia and Halifax, Nova Scotia. The rates in the west coast city are much less than whatconsumers pay in Halifax.
Rating Profile List
Rat
ing
Prof
ile
Vehi
cle
Year
Mak
e &
Mod
el
Prim
ary
Driv
er
Gen
der
Prim
ary
Driv
er
Age
Cla
im(s
) or
Con
vict
ion(
s)
1 1995 Chrysler Intrepid Male 58 No2 1996 Dodge Caravan Female 55 No3 1992 Toyota 4Runner Male 58 Yes4 1998 Ford Windstar Female 55 No5 1999 Toyota Camry Male 48 Yes6 1994 Ford Taurus Female 42 No7 1992 Honda Civic Male 22 No8 2000 Ford Excursion Female 45 Yes9 1990 Dodge Spirit Female 22 No10 1995 GMC Sonoma Female 22 Yes11 1991 Mazda Protégé Female 87 Yes12 1997 Saturn SL1 Male 72 No13 1994 Plymouth Colt Female 38 Yes14 2000 Volvo V70 Male 45 Yes15 2002 Toyota Corolla Male 68 No16 1992 Pontiac Sunbird Female 51 Yes17 1997 Dodge Ram Male 35 Yes18 1990 Jeep Cherokee Male 40 Yes
19 1996ChevroletCavalier Female 33 Yes
20 1985 GMC K1500 Female 18 No21 1998 Dodge Neon Female 17 No22 1992 Toyota Pickup Male 19 Yes23 2003 Lexus ES 300 Female 57 Yes
24 1966VolkswagenVanagon Male 31 Yes
25 2000 Honda Odyssey Female 43 No26 2002 Chevy Astro Male 51 No27 1996 Suzuki Swift Female 43 No28 1999 BMW 323 Male 36 Yes29 1996 Mazda Miata Female 42 Yes30 1997 Ford Explorer Male 55 No
31 1988Chrysler NewYorker Female 70 No
32 1997 Ford F-150 Male 42 No
33 1993Buick ParkAvenue Male 75 Yes
34 2001VolkswagenBeetle Male 27 No
1 3 5 7 9 11 13 15 17 19 21 23 25 27 29 31 33
$-
$1,000
$2,000
$3,000
$4,000
$5,000
$6,000
$7,000
$8,000
$9,000
$10,000
Rating Profile #
A Comparison of Annual Auto Insurance:Victoria, BC vs the Median Rate in Halifax, NS
Victoria, BC Halifax, NS

Consumers’ Association of Canada Auto Insurance Rates Study – September 2003
17
FINDING #6 – Alberta Consumers Pay Much Higher Rates Than In NeighbouringProvinces
Albertans enjoy many benefits from their healthy economy but low auto insurance rates are notamong them. Compared to its neighbours, rates in Alberta are much higher.
Rating Profile List
Rat
ing
Prof
ile
Vehi
cle
Year
Mak
e &
Mod
el
Prim
ary
Driv
er
Gen
der
Prim
ary
Driv
er
Age
Cla
im(s
) or
Con
vict
ion(
s)
1 1995 Chrysler Intrepid Male 58 No2 1996 Dodge Caravan Female 55 No3 1992 Toyota 4Runner Male 58 Yes4 1998 Ford Windstar Female 55 No5 1999 Toyota Camry Male 48 Yes6 1994 Ford Taurus Female 42 No7 1992 Honda Civic Male 22 No8 2000 Ford Excursion Female 45 Yes9 1990 Dodge Spirit Female 22 No10 1995 GMC Sonoma Female 22 Yes11 1991 Mazda Protégé Female 87 Yes12 1997 Saturn SL1 Male 72 No13 1994 Plymouth Colt Female 38 Yes14 2000 Volvo V70 Male 45 Yes15 2002 Toyota Corolla Male 68 No16 1992 Pontiac Sunbird Female 51 Yes17 1997 Dodge Ram Male 35 Yes18 1990 Jeep Cherokee Male 40 Yes
19 1996ChevroletCavalier Female 33 Yes
20 1985 GMC K1500 Female 18 No21 1998 Dodge Neon Female 17 No22 1992 Toyota Pickup Male 19 Yes23 2003 Lexus ES 300 Female 57 Yes
24 1966VolkswagenVanagon Male 31 Yes
25 2000 Honda Odyssey Female 43 No26 2002 Chevy Astro Male 51 No27 1996 Suzuki Swift Female 43 No28 1999 BMW 323 Male 36 Yes29 1996 Mazda Miata Female 42 Yes30 1997 Ford Explorer Male 55 No
31 1988Chrysler NewYorker Female 70 No
32 1997 Ford F-150 Male 42 No
33 1993Buick ParkAvenue Male 75 Yes
34 2001VolkswagenBeetle Male 27 No
1 3 5 7 9
11 13 15 17 19 21 23 25 27 29 31 33
ManitobaSaskatchewan
British ColumbiaAlberta
$-
$1,000
$2,000
$3,000
$4,000
$5,000
$6,000
$7,000
Rating Profile #
Median Rates: Four Western Provinces
Manitoba Saskatchewan British Columbia Alberta

Consumers’ Association of Canada Auto Insurance Rates Study – September 2003
18
Finding 6 continued: Alberta Cities vs. Cities In Other Western Provinces
1 5 9
13 17 21 25 29 33
R egina, SK
P rince A lbert , SK
Llo ydminster, SK
Yo rkto n, SK
Winnipeg, M BB rando n, M B
T ho mpso n, M BVicto ria , B C
P entic to n, B CP rince Geo rge, B C
N elso n, B CVanco uver, B C
F t. M cM urray, A BLlo ydminster, A B
Lethbridge, A BEdmo nto n, A B
C algary, A B
$-
$1,000
$2,000
$3,000
$4,000
$5,000
$6,000
$7,000
Rating Profile #
Median Rates in Western Cities
Consumers’ Association of Canada Auto Insurance Rates Study – September 2003
19
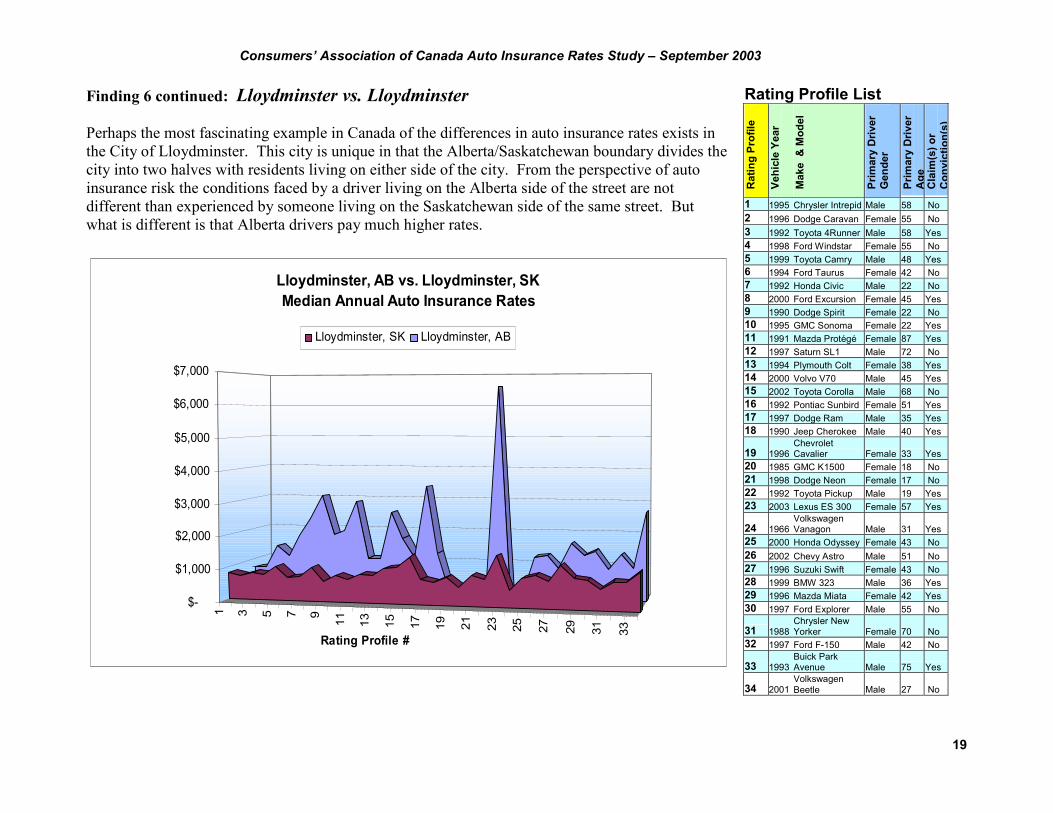
Finding 6 continued: Lloydminster vs. Lloydminster
Perhaps the most fascinating example in Canada of the differences in auto insurance rates exists inthe City of Lloydminster. This city is unique in that the Alberta/Saskatchewan boundary divides thecity into two halves with residents living on either side of the city. From the perspective of autoinsurance risk the conditions faced by a driver living on the Alberta side of the street are notdifferent than experienced by someone living on the Saskatchewan side of the same street. Butwhat is different is that Alberta drivers pay much higher rates.
Rating Profile List
Rat
ing
Prof
ile
Vehi
cle
Year
Mak
e &
Mod
el
Prim
ary
Driv
er
Gen
der
Prim
ary
Driv
er
Age
Cla
im(s
) or
Con
vict
ion(
s)
1 1995 Chrysler Intrepid Male 58 No2 1996 Dodge Caravan Female 55 No3 1992 Toyota 4Runner Male 58 Yes4 1998 Ford Windstar Female 55 No5 1999 Toyota Camry Male 48 Yes6 1994 Ford Taurus Female 42 No7 1992 Honda Civic Male 22 No8 2000 Ford Excursion Female 45 Yes9 1990 Dodge Spirit Female 22 No10 1995 GMC Sonoma Female 22 Yes11 1991 Mazda Protégé Female 87 Yes12 1997 Saturn SL1 Male 72 No13 1994 Plymouth Colt Female 38 Yes14 2000 Volvo V70 Male 45 Yes15 2002 Toyota Corolla Male 68 No16 1992 Pontiac Sunbird Female 51 Yes17 1997 Dodge Ram Male 35 Yes18 1990 Jeep Cherokee Male 40 Yes
19 1996ChevroletCavalier Female 33 Yes
20 1985 GMC K1500 Female 18 No21 1998 Dodge Neon Female 17 No22 1992 Toyota Pickup Male 19 Yes23 2003 Lexus ES 300 Female 57 Yes
24 1966VolkswagenVanagon Male 31 Yes
25 2000 Honda Odyssey Female 43 No26 2002 Chevy Astro Male 51 No27 1996 Suzuki Swift Female 43 No28 1999 BMW 323 Male 36 Yes29 1996 Mazda Miata Female 42 Yes30 1997 Ford Explorer Male 55 No
31 1988Chrysler NewYorker Female 70 No
32 1997 Ford F-150 Male 42 No
33 1993Buick ParkAvenue Male 75 Yes
34 2001VolkswagenBeetle Male 27 No
1 3 5 7 9
11 13 15 17 19 21 23 25 27 29 31 33
$-
$1,000
$2,000
$3,000
$4,000
$5,000
$6,000
$7,000
Rating Profile #
Lloydminster, AB vs. Lloydminster, SKMedian Annual Auto Insurance Rates
Lloydminster, SK Lloydminster, AB

Consumers’ Association of Canada Auto Insurance Rates Study – September 2003
20
FINDING #7 – Ontario’s Rates Are Much Higher Than In WesternPublic Auto Provinces
Ontario’s rates are much higher than those in the four western provinces, except for Alberta.
Rating Profile List
Rat
ing
Prof
ile
Vehi
cle
Year
Mak
e &
Mod
el
Prim
ary
Driv
er
Gen
der
Prim
ary
Driv
er
Age
Cla
im(s
) or
Con
vict
ion(
s)
1 1995 Chrysler Intrepid Male 58 No2 1996 Dodge Caravan Female 55 No3 1992 Toyota 4Runner Male 58 Yes4 1998 Ford Windstar Female 55 No5 1999 Toyota Camry Male 48 Yes6 1994 Ford Taurus Female 42 No7 1992 Honda Civic Male 22 No8 2000 Ford Excursion Female 45 Yes9 1990 Dodge Spirit Female 22 No10 1995 GMC Sonoma Female 22 Yes11 1991 Mazda Protégé Female 87 Yes12 1997 Saturn SL1 Male 72 No13 1994 Plymouth Colt Female 38 Yes14 2000 Volvo V70 Male 45 Yes15 2002 Toyota Corolla Male 68 No16 1992 Pontiac Sunbird Female 51 Yes17 1997 Dodge Ram Male 35 Yes18 1990 Jeep Cherokee Male 40 Yes
19 1996ChevroletCavalier Female 33 Yes
20 1985 GMC K1500 Female 18 No21 1998 Dodge Neon Female 17 No22 1992 Toyota Pickup Male 19 Yes23 2003 Lexus ES 300 Female 57 Yes
24 1966VolkswagenVanagon Male 31 Yes
25 2000 Honda Odyssey Female 43 No26 2002 Chevy Astro Male 51 No27 1996 Suzuki Swift Female 43 No28 1999 BMW 323 Male 36 Yes29 1996 Mazda Miata Female 42 Yes30 1997 Ford Explorer Male 55 No
31 1988Chrysler NewYorker Female 70 No
32 1997 Ford F-150 Male 42 No
33 1993Buick ParkAvenue Male 75 Yes
34 2001VolkswagenBeetle Male 27 No
1 3 5 7 9
11 13 15 17
19
21 23 25 27 29
31 33
ManitobaSaskatchewan
British ColumbiaAlberta
Ontario
$-
$1,000
$2,000
$3,000
$4,000
$5,000
$6,000
$7,000
$8,000
$9,000
Rating Profile #
Ontario vs. the West (Median Rates)
Manitoba Saskatchewan British Columbia Alberta Ontario
Consumers’ Association of Canada Auto Insurance Rates Study – September 2003
21
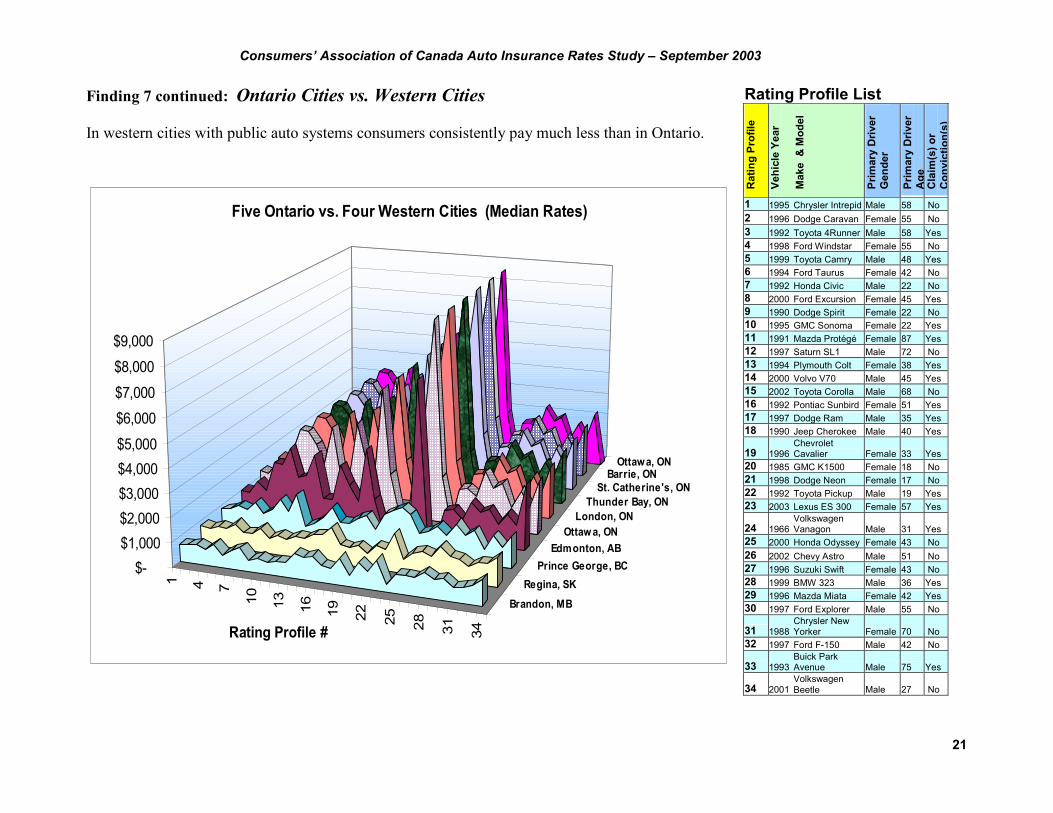
Finding 7 continued: Ontario Cities vs. Western Cities
In western cities with public auto systems consumers consistently pay much less than in Ontario.
Rating Profile List
Rat
ing
Prof
ile
Vehi
cle
Year
Mak
e &
Mod
el
Prim
ary
Driv
er
Gen
der
Prim
ary
Driv
er
Age
Cla
im(s
) or
Con
vict
ion(
s)
1 1995 Chrysler Intrepid Male 58 No2 1996 Dodge Caravan Female 55 No3 1992 Toyota 4Runner Male 58 Yes4 1998 Ford Windstar Female 55 No5 1999 Toyota Camry Male 48 Yes6 1994 Ford Taurus Female 42 No7 1992 Honda Civic Male 22 No8 2000 Ford Excursion Female 45 Yes9 1990 Dodge Spirit Female 22 No10 1995 GMC Sonoma Female 22 Yes11 1991 Mazda Protégé Female 87 Yes12 1997 Saturn SL1 Male 72 No13 1994 Plymouth Colt Female 38 Yes14 2000 Volvo V70 Male 45 Yes15 2002 Toyota Corolla Male 68 No16 1992 Pontiac Sunbird Female 51 Yes17 1997 Dodge Ram Male 35 Yes18 1990 Jeep Cherokee Male 40 Yes
19 1996ChevroletCavalier Female 33 Yes
20 1985 GMC K1500 Female 18 No21 1998 Dodge Neon Female 17 No22 1992 Toyota Pickup Male 19 Yes23 2003 Lexus ES 300 Female 57 Yes
24 1966VolkswagenVanagon Male 31 Yes
25 2000 Honda Odyssey Female 43 No26 2002 Chevy Astro Male 51 No27 1996 Suzuki Swift Female 43 No28 1999 BMW 323 Male 36 Yes29 1996 Mazda Miata Female 42 Yes30 1997 Ford Explorer Male 55 No
31 1988Chrysler NewYorker Female 70 No
32 1997 Ford F-150 Male 42 No
33 1993Buick ParkAvenue Male 75 Yes
34 2001VolkswagenBeetle Male 27 No
1 4 7
10 13 16 19 22 25 28 31 34
Brandon, MB
Regina, SKPrince George, BC
Edmonton, ABOttawa, ON
London, ONThunder Bay, ON
St. Catherine's, ONBarrie, ON
Ottawa, ON
$-$1,000$2,000$3,000$4,000$5,000
$6,000
$7,000
$8,000
$9,000
Rating Profile #
Five Ontario vs. Four Western Cities (Median Rates)
Consumers’ Association of Canada Auto Insurance Rates Study – September 2003
22
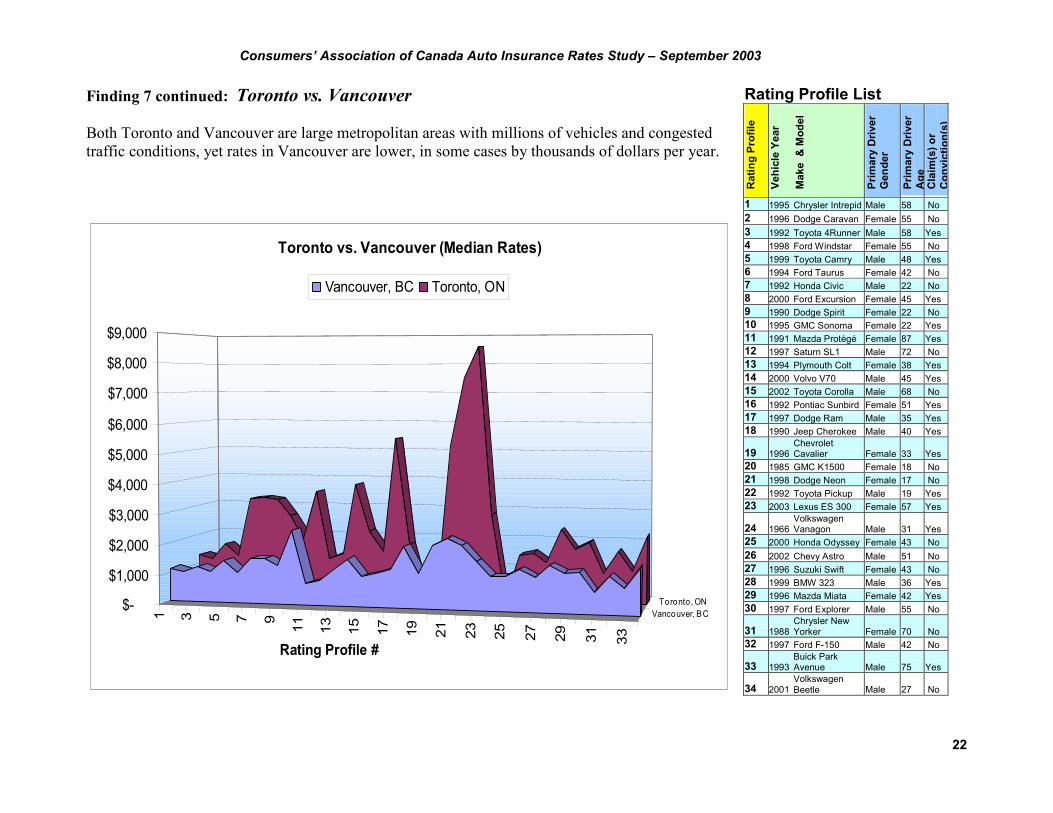
Finding 7 continued: Toronto vs. Vancouver
Both Toronto and Vancouver are large metropolitan areas with millions of vehicles and congestedtraffic conditions, yet rates in Vancouver are lower, in some cases by thousands of dollars per year.
Rating Profile List
Rat
ing
Prof
ile
Vehi
cle
Year
Mak
e &
Mod
el
Prim
ary
Driv
er
Gen
der
Prim
ary
Driv
er
Age
Cla
im(s
) or
Con
vict
ion(
s)
1 1995 Chrysler Intrepid Male 58 No2 1996 Dodge Caravan Female 55 No3 1992 Toyota 4Runner Male 58 Yes4 1998 Ford Windstar Female 55 No5 1999 Toyota Camry Male 48 Yes6 1994 Ford Taurus Female 42 No7 1992 Honda Civic Male 22 No8 2000 Ford Excursion Female 45 Yes9 1990 Dodge Spirit Female 22 No10 1995 GMC Sonoma Female 22 Yes11 1991 Mazda Protégé Female 87 Yes12 1997 Saturn SL1 Male 72 No13 1994 Plymouth Colt Female 38 Yes14 2000 Volvo V70 Male 45 Yes15 2002 Toyota Corolla Male 68 No16 1992 Pontiac Sunbird Female 51 Yes17 1997 Dodge Ram Male 35 Yes18 1990 Jeep Cherokee Male 40 Yes
19 1996ChevroletCavalier Female 33 Yes
20 1985 GMC K1500 Female 18 No21 1998 Dodge Neon Female 17 No22 1992 Toyota Pickup Male 19 Yes23 2003 Lexus ES 300 Female 57 Yes
24 1966VolkswagenVanagon Male 31 Yes
25 2000 Honda Odyssey Female 43 No26 2002 Chevy Astro Male 51 No27 1996 Suzuki Swift Female 43 No28 1999 BMW 323 Male 36 Yes29 1996 Mazda Miata Female 42 Yes30 1997 Ford Explorer Male 55 No
31 1988Chrysler NewYorker Female 70 No
32 1997 Ford F-150 Male 42 No
33 1993Buick ParkAvenue Male 75 Yes
34 2001VolkswagenBeetle Male 27 No
1 3 5 7 9
11 13 15 17 19 21 23 25 27 29 31 33Vancouver, BC
Toronto, ON$-
$1,000
$2,000
$3,000
$4,000
$5,000
$6,000
$7,000
$8,000
$9,000
Rating Profile #
Toronto vs. Vancouver (Median Rates)
Vancouver, BC Toronto, ON
Consumers’ Association of Canada Auto Insurance Rates Study – September 2003
23
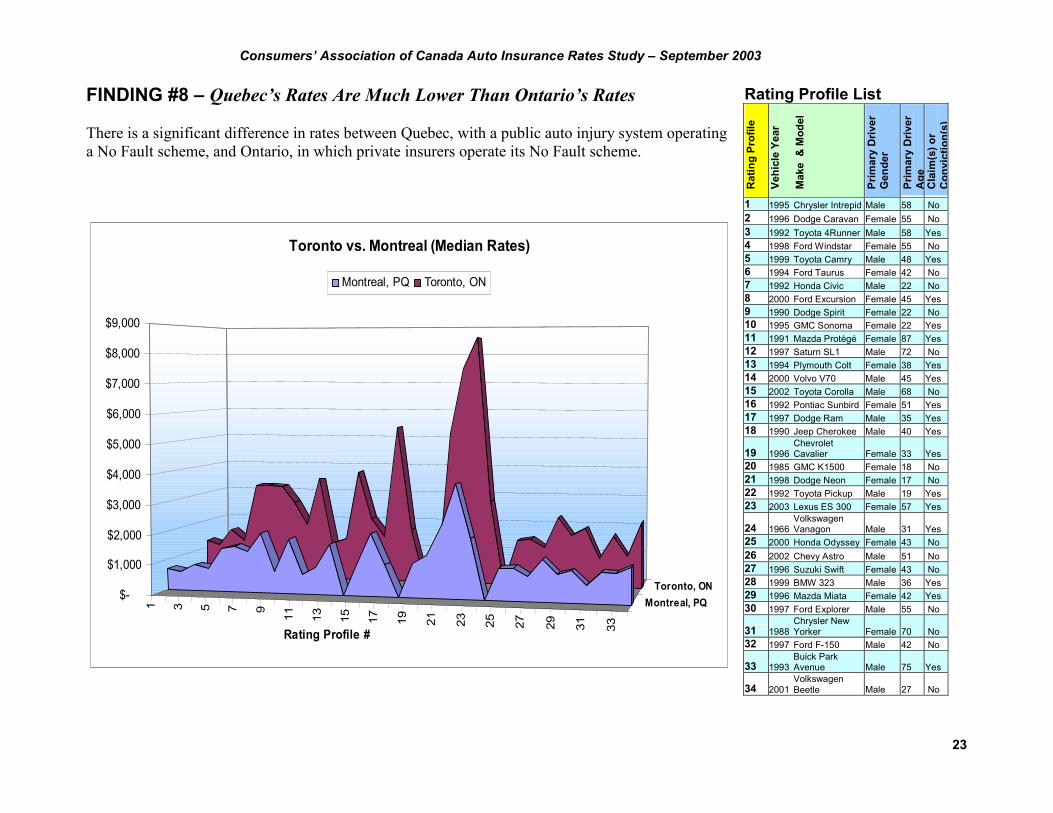
FINDING #8 – Quebec’s Rates Are Much Lower Than Ontario’s Rates
There is a significant difference in rates between Quebec, with a public auto injury system operatinga No Fault scheme, and Ontario, in which private insurers operate its No Fault scheme.
Rating Profile List
Rat
ing
Prof
ile
Vehi
cle
Year
Mak
e &
Mod
el
Prim
ary
Driv
er
Gen
der
Prim
ary
Driv
er
Age
Cla
im(s
) or
Con
vict
ion(
s)
1 1995 Chrysler Intrepid Male 58 No2 1996 Dodge Caravan Female 55 No3 1992 Toyota 4Runner Male 58 Yes4 1998 Ford Windstar Female 55 No5 1999 Toyota Camry Male 48 Yes6 1994 Ford Taurus Female 42 No7 1992 Honda Civic Male 22 No8 2000 Ford Excursion Female 45 Yes9 1990 Dodge Spirit Female 22 No10 1995 GMC Sonoma Female 22 Yes11 1991 Mazda Protégé Female 87 Yes12 1997 Saturn SL1 Male 72 No13 1994 Plymouth Colt Female 38 Yes14 2000 Volvo V70 Male 45 Yes15 2002 Toyota Corolla Male 68 No16 1992 Pontiac Sunbird Female 51 Yes17 1997 Dodge Ram Male 35 Yes18 1990 Jeep Cherokee Male 40 Yes
19 1996ChevroletCavalier Female 33 Yes
20 1985 GMC K1500 Female 18 No21 1998 Dodge Neon Female 17 No22 1992 Toyota Pickup Male 19 Yes23 2003 Lexus ES 300 Female 57 Yes
24 1966VolkswagenVanagon Male 31 Yes
25 2000 Honda Odyssey Female 43 No26 2002 Chevy Astro Male 51 No27 1996 Suzuki Swift Female 43 No28 1999 BMW 323 Male 36 Yes29 1996 Mazda Miata Female 42 Yes30 1997 Ford Explorer Male 55 No
31 1988Chrysler NewYorker Female 70 No
32 1997 Ford F-150 Male 42 No
33 1993Buick ParkAvenue Male 75 Yes
34 2001VolkswagenBeetle Male 27 No
1 3 5 7 9
11 13 15 17 19 21 23 25 27 29 31 33Montreal, PQ
Toronto, ON$-
$1,000
$2,000
$3,000
$4,000
$5,000
$6,000
$7,000
$8,000
$9,000
Rating Profile #
Toronto vs. Montreal (Median Rates)
Montreal, PQ Toronto, ON
Consumers’ Association of Canada Auto Insurance Rates Study – September 2003
24
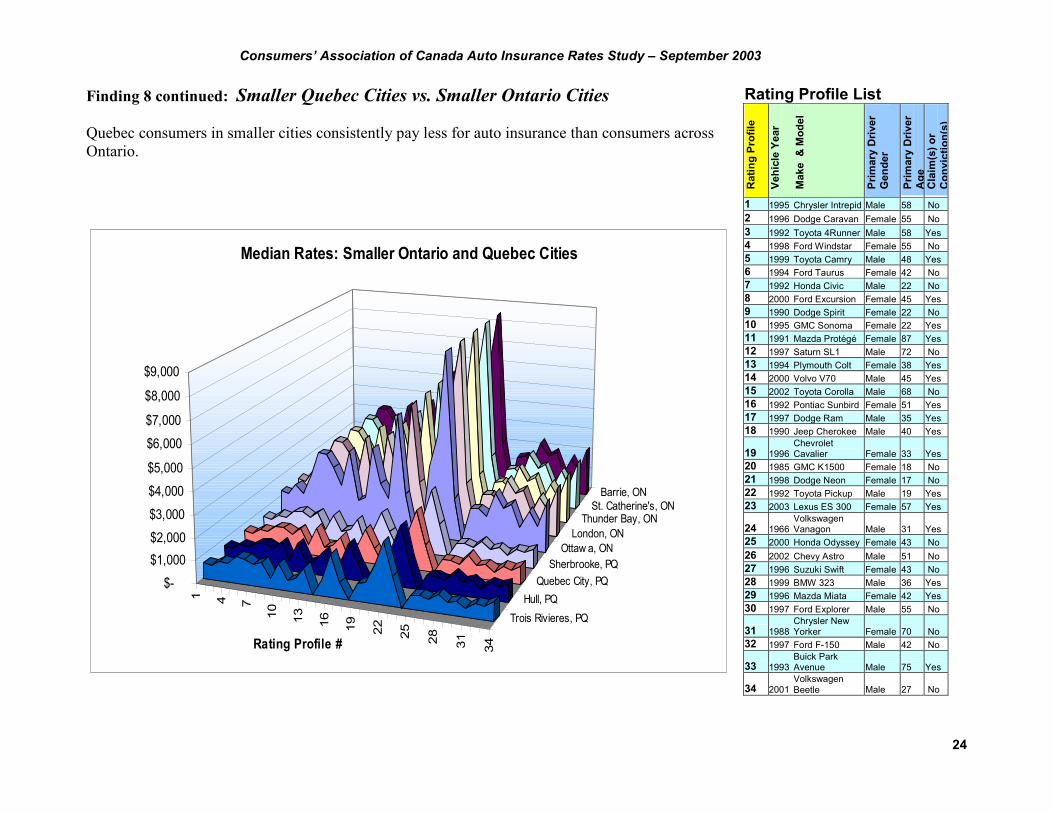
Finding 8 continued: Smaller Quebec Cities vs. Smaller Ontario Cities
Quebec consumers in smaller cities consistently pay less for auto insurance than consumers acrossOntario.
Rating Profile List
Rat
ing
Prof
ile
Vehi
cle
Year
Mak
e &
Mod
el
Prim
ary
Driv
er
Gen
der
Prim
ary
Driv
er
Age
Cla
im(s
) or
Con
vict
ion(
s)
1 1995 Chrysler Intrepid Male 58 No2 1996 Dodge Caravan Female 55 No3 1992 Toyota 4Runner Male 58 Yes4 1998 Ford Windstar Female 55 No5 1999 Toyota Camry Male 48 Yes6 1994 Ford Taurus Female 42 No7 1992 Honda Civic Male 22 No8 2000 Ford Excursion Female 45 Yes9 1990 Dodge Spirit Female 22 No10 1995 GMC Sonoma Female 22 Yes11 1991 Mazda Protégé Female 87 Yes12 1997 Saturn SL1 Male 72 No13 1994 Plymouth Colt Female 38 Yes14 2000 Volvo V70 Male 45 Yes15 2002 Toyota Corolla Male 68 No16 1992 Pontiac Sunbird Female 51 Yes17 1997 Dodge Ram Male 35 Yes18 1990 Jeep Cherokee Male 40 Yes
19 1996ChevroletCavalier Female 33 Yes
20 1985 GMC K1500 Female 18 No21 1998 Dodge Neon Female 17 No22 1992 Toyota Pickup Male 19 Yes23 2003 Lexus ES 300 Female 57 Yes
24 1966VolkswagenVanagon Male 31 Yes
25 2000 Honda Odyssey Female 43 No26 2002 Chevy Astro Male 51 No27 1996 Suzuki Swift Female 43 No28 1999 BMW 323 Male 36 Yes29 1996 Mazda Miata Female 42 Yes30 1997 Ford Explorer Male 55 No
31 1988Chrysler NewYorker Female 70 No
32 1997 Ford F-150 Male 42 No
33 1993Buick ParkAvenue Male 75 Yes
34 2001VolkswagenBeetle Male 27 No
1 4 7
10 13 16 19 22 25 28 31 34
Trois Rivieres, PQHull, PQ
Quebec City, PQSherbrooke, PQ
Ottaw a, ONLondon, ON
Thunder Bay, ONSt. Catherine's, ON
Barrie, ON
$-
$1,000$2,000
$3,000
$4,000
$5,000
$6,000
$7,000
$8,000
$9,000
Rating Profile #
Median Rates: Smaller Ontario and Quebec Cities
Consumers’ Association of Canada Auto Insurance Rates Study – September 2003
25
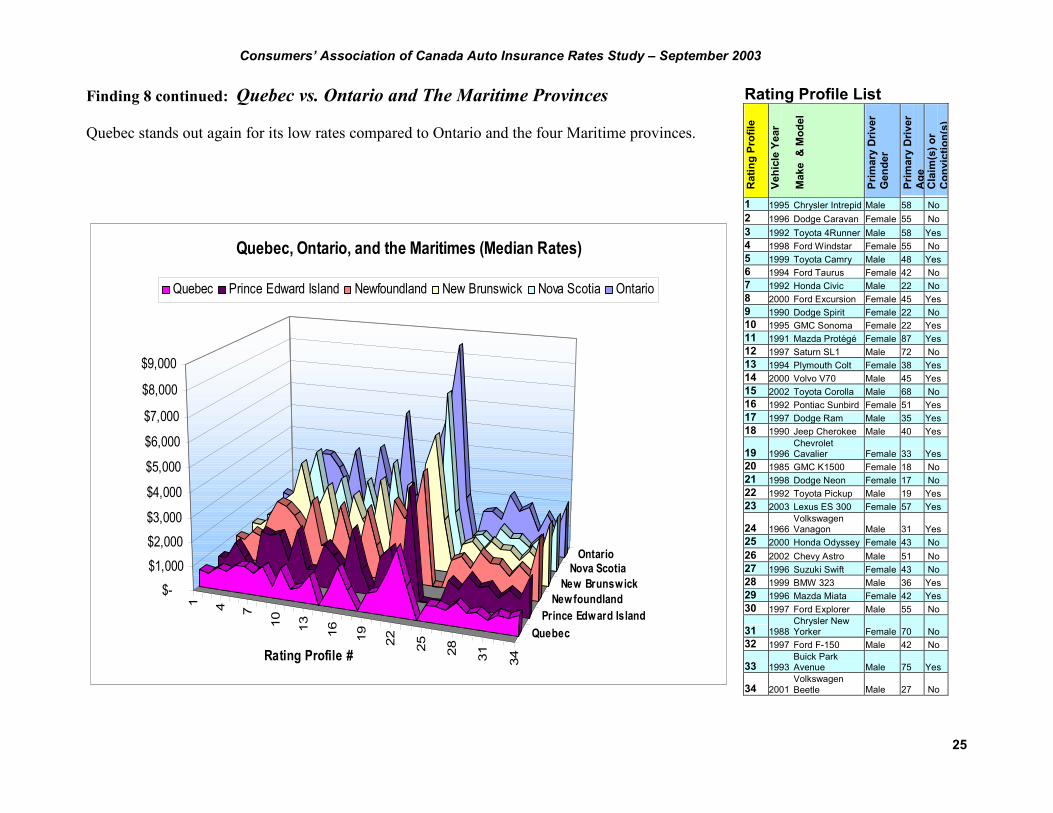
Finding 8 continued: Quebec vs. Ontario and The Maritime Provinces
Quebec stands out again for its low rates compared to Ontario and the four Maritime provinces.
Rating Profile List
Rat
ing
Prof
ile
Vehi
cle
Year
Mak
e &
Mod
el
Prim
ary
Driv
er
Gen
der
Prim
ary
Driv
er
Age
Cla
im(s
) or
Con
vict
ion(
s)
1 1995 Chrysler Intrepid Male 58 No2 1996 Dodge Caravan Female 55 No3 1992 Toyota 4Runner Male 58 Yes4 1998 Ford Windstar Female 55 No5 1999 Toyota Camry Male 48 Yes6 1994 Ford Taurus Female 42 No7 1992 Honda Civic Male 22 No8 2000 Ford Excursion Female 45 Yes9 1990 Dodge Spirit Female 22 No10 1995 GMC Sonoma Female 22 Yes11 1991 Mazda Protégé Female 87 Yes12 1997 Saturn SL1 Male 72 No13 1994 Plymouth Colt Female 38 Yes14 2000 Volvo V70 Male 45 Yes15 2002 Toyota Corolla Male 68 No16 1992 Pontiac Sunbird Female 51 Yes17 1997 Dodge Ram Male 35 Yes18 1990 Jeep Cherokee Male 40 Yes
19 1996ChevroletCavalier Female 33 Yes
20 1985 GMC K1500 Female 18 No21 1998 Dodge Neon Female 17 No22 1992 Toyota Pickup Male 19 Yes23 2003 Lexus ES 300 Female 57 Yes
24 1966VolkswagenVanagon Male 31 Yes
25 2000 Honda Odyssey Female 43 No26 2002 Chevy Astro Male 51 No27 1996 Suzuki Swift Female 43 No28 1999 BMW 323 Male 36 Yes29 1996 Mazda Miata Female 42 Yes30 1997 Ford Explorer Male 55 No
31 1988Chrysler NewYorker Female 70 No
32 1997 Ford F-150 Male 42 No
33 1993Buick ParkAvenue Male 75 Yes
34 2001VolkswagenBeetle Male 27 No
1 4 7
10 13
16 19
22 25 28 31 34
QuebecPrince Edward Island
NewfoundlandNew Brunswick
Nova ScotiaOntario
$-
$1,000
$2,000
$3,000
$4,000
$5,000
$6,000
$7,000
$8,000
$9,000
Rating Profile #
Quebec, Ontario, and the Maritimes (Median Rates)
Quebec Prince Edward Island Newfoundland New Brunswick Nova Scotia Ontario
Consumers’ Association of Canada Auto Insurance Rates Study – September 2003
26
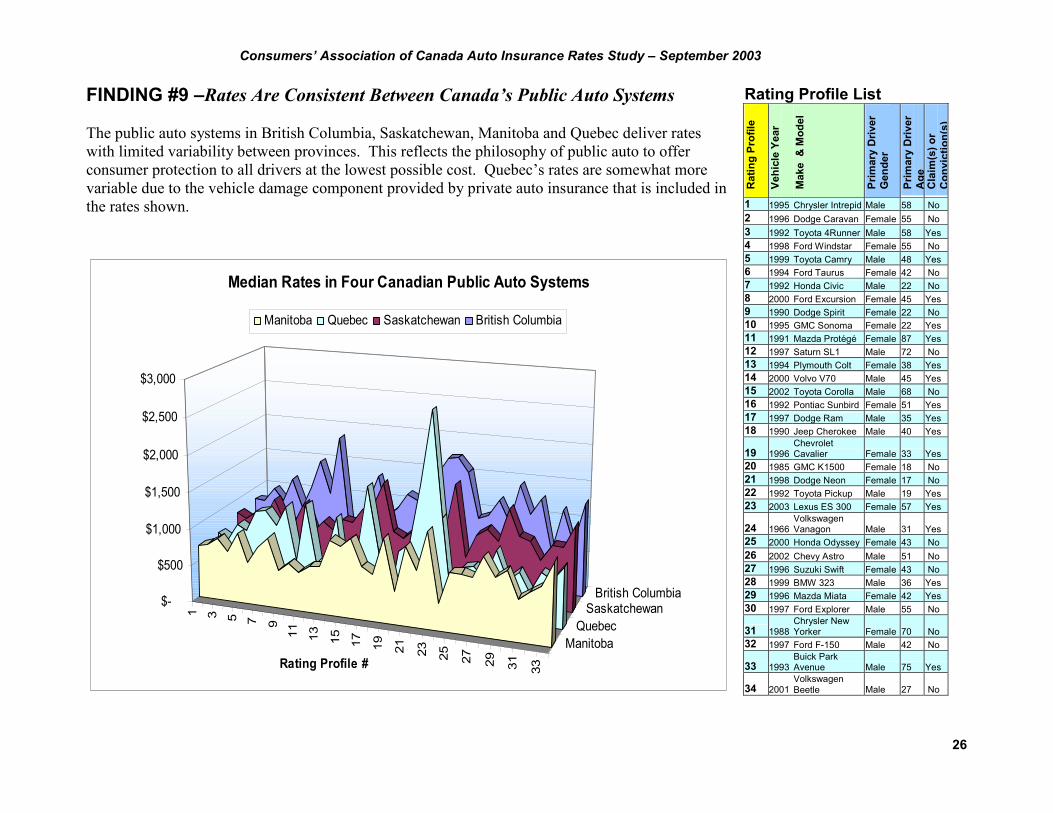
FINDING #9 –Rates Are Consistent Between Canada’s Public Auto Systems
The public auto systems in British Columbia, Saskatchewan, Manitoba and Quebec deliver rateswith limited variability between provinces. This reflects the philosophy of public auto to offerconsumer protection to all drivers at the lowest possible cost. Quebec’s rates are somewhat morevariable due to the vehicle damage component provided by private auto insurance that is included inthe rates shown.
Rating Profile List
Rat
ing
Prof
ile
Vehi
cle
Year
Mak
e &
Mod
el
Prim
ary
Driv
er
Gen
der
Prim
ary
Driv
er
Age
Cla
im(s
) or
Con
vict
ion(
s)
1 1995 Chrysler Intrepid Male 58 No2 1996 Dodge Caravan Female 55 No3 1992 Toyota 4Runner Male 58 Yes4 1998 Ford Windstar Female 55 No5 1999 Toyota Camry Male 48 Yes6 1994 Ford Taurus Female 42 No7 1992 Honda Civic Male 22 No8 2000 Ford Excursion Female 45 Yes9 1990 Dodge Spirit Female 22 No10 1995 GMC Sonoma Female 22 Yes11 1991 Mazda Protégé Female 87 Yes12 1997 Saturn SL1 Male 72 No13 1994 Plymouth Colt Female 38 Yes14 2000 Volvo V70 Male 45 Yes15 2002 Toyota Corolla Male 68 No16 1992 Pontiac Sunbird Female 51 Yes17 1997 Dodge Ram Male 35 Yes18 1990 Jeep Cherokee Male 40 Yes
19 1996ChevroletCavalier Female 33 Yes
20 1985 GMC K1500 Female 18 No21 1998 Dodge Neon Female 17 No22 1992 Toyota Pickup Male 19 Yes23 2003 Lexus ES 300 Female 57 Yes
24 1966VolkswagenVanagon Male 31 Yes
25 2000 Honda Odyssey Female 43 No26 2002 Chevy Astro Male 51 No27 1996 Suzuki Swift Female 43 No28 1999 BMW 323 Male 36 Yes29 1996 Mazda Miata Female 42 Yes30 1997 Ford Explorer Male 55 No
31 1988Chrysler NewYorker Female 70 No
32 1997 Ford F-150 Male 42 No
33 1993Buick ParkAvenue Male 75 Yes
34 2001VolkswagenBeetle Male 27 No
1 3 5 7 9
11 13 15 17 19 21 23 25 27 29 31 33
ManitobaQuebec
SaskatchewanBritish Columbia$-
$500
$1,000
$1,500
$2,000
$2,500
$3,000
Rating Profile #
Median Rates in Four Canadian Public Auto Systems
Manitoba Quebec Saskatchewan British Columbia
Consumers’ Association of Canada Auto Insurance Rates Study – September 2003
27
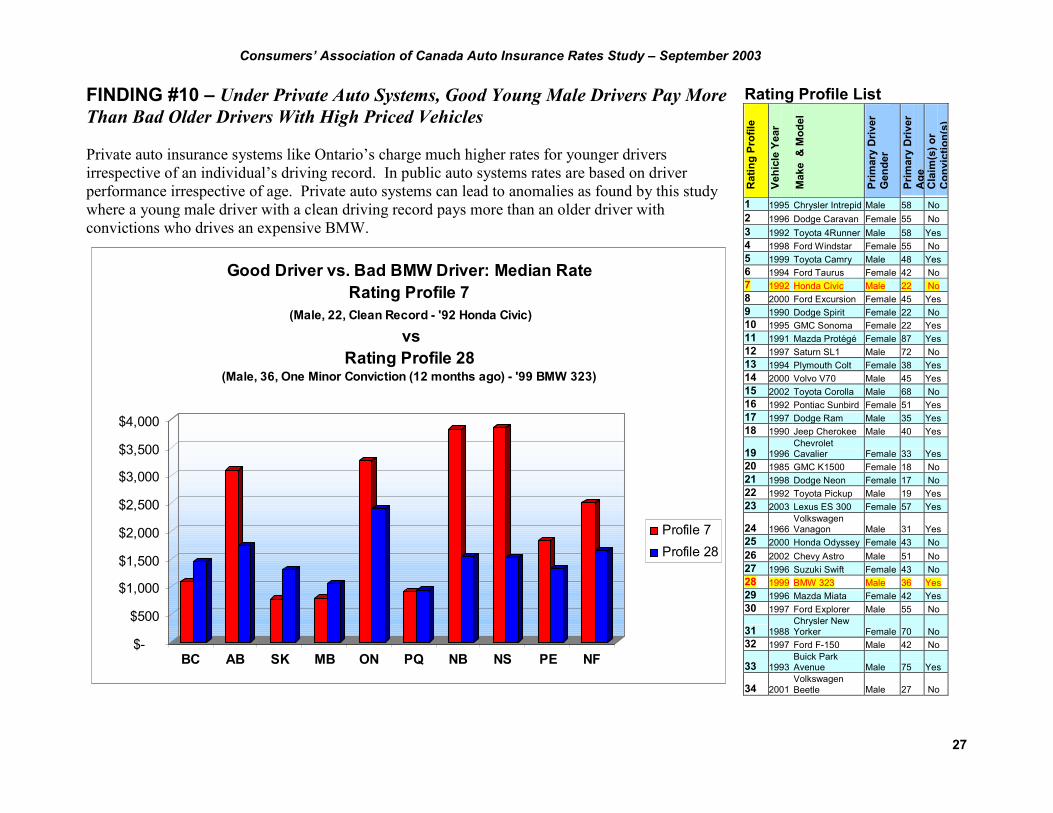
FINDING #10 – Under Private Auto Systems, Good Young Male Drivers Pay MoreThan Bad Older Drivers With High Priced Vehicles
Private auto insurance systems like Ontario’s charge much higher rates for younger driversirrespective of an individual’s driving record. In public auto systems rates are based on driverperformance irrespective of age. Private auto systems can lead to anomalies as found by this studywhere a young male driver with a clean driving record pays more than an older driver withconvictions who drives an expensive BMW.
Rating Profile List
Rat
ing
Prof
ile
Vehi
cle
Year
Mak
e &
Mod
el
Prim
ary
Driv
er
Gen
der
Prim
ary
Driv
er
Age
Cla
im(s
) or
Con
vict
ion(
s)
1 1995 Chrysler Intrepid Male 58 No2 1996 Dodge Caravan Female 55 No3 1992 Toyota 4Runner Male 58 Yes4 1998 Ford Windstar Female 55 No5 1999 Toyota Camry Male 48 Yes6 1994 Ford Taurus Female 42 No7 1992 Honda Civic Male 22 No8 2000 Ford Excursion Female 45 Yes9 1990 Dodge Spirit Female 22 No10 1995 GMC Sonoma Female 22 Yes11 1991 Mazda Protégé Female 87 Yes12 1997 Saturn SL1 Male 72 No13 1994 Plymouth Colt Female 38 Yes14 2000 Volvo V70 Male 45 Yes15 2002 Toyota Corolla Male 68 No16 1992 Pontiac Sunbird Female 51 Yes17 1997 Dodge Ram Male 35 Yes18 1990 Jeep Cherokee Male 40 Yes
19 1996ChevroletCavalier Female 33 Yes
20 1985 GMC K1500 Female 18 No21 1998 Dodge Neon Female 17 No22 1992 Toyota Pickup Male 19 Yes23 2003 Lexus ES 300 Female 57 Yes
24 1966VolkswagenVanagon Male 31 Yes
25 2000 Honda Odyssey Female 43 No26 2002 Chevy Astro Male 51 No27 1996 Suzuki Swift Female 43 No28 1999 BMW 323 Male 36 Yes29 1996 Mazda Miata Female 42 Yes30 1997 Ford Explorer Male 55 No
31 1988Chrysler NewYorker Female 70 No
32 1997 Ford F-150 Male 42 No
33 1993Buick ParkAvenue Male 75 Yes
34 2001VolkswagenBeetle Male 27 No
$-
$500
$1,000
$1,500
$2,000
$2,500
$3,000
$3,500
$4,000
BC AB SK MB ON PQ NB NS PE NF
Good Driver vs. Bad BMW Driver: Median RateRating Profile 7
(Male, 22, Clean Record - '92 Honda Civic)
vsRating Profile 28
(Male, 36, One Minor Conviction (12 months ago) - '99 BMW 323)
Profile 7Profile 28
Consumers’ Association of Canada Auto Insurance Rates Study – September 2003
28
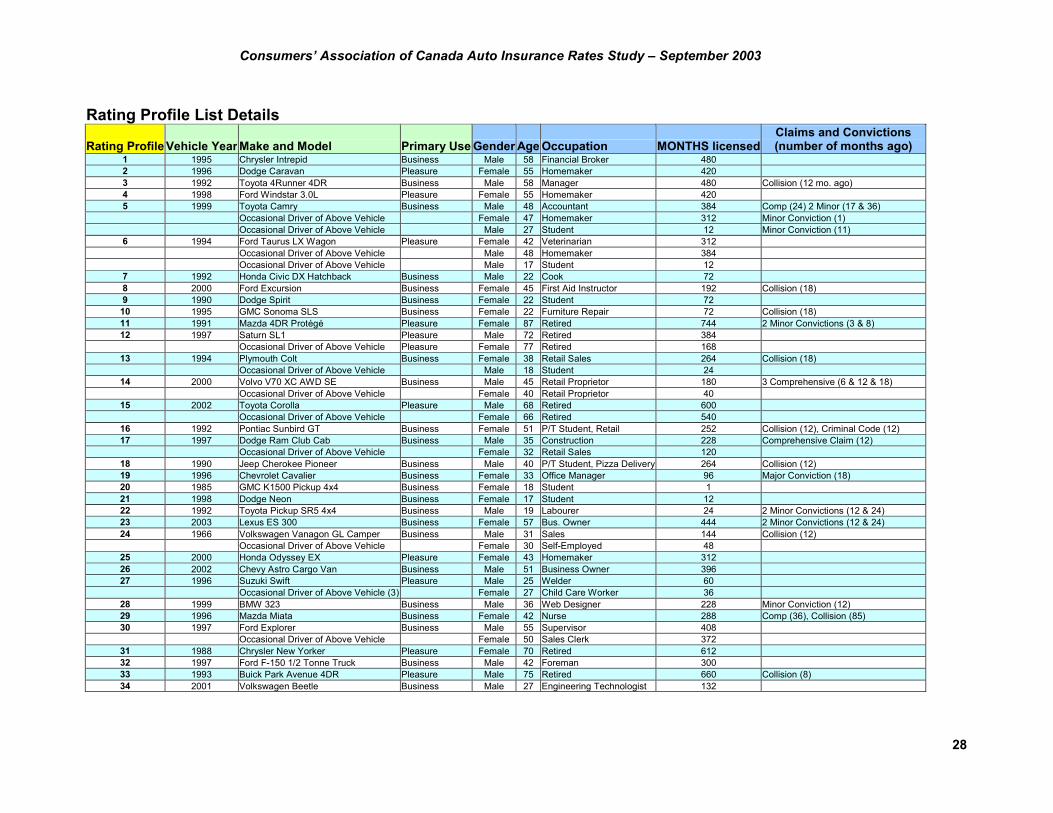
Rating Profile List Details
Rating Profile Vehicle Year Make and Model Primary Use Gender Age Occupation MONTHS licensedClaims and Convictions(number of months ago)
1 1995 Chrysler Intrepid Business Male 58 Financial Broker 4802 1996 Dodge Caravan Pleasure Female 55 Homemaker 4203 1992 Toyota 4Runner 4DR Business Male 58 Manager 480 Collision (12 mo. ago)4 1998 Ford Windstar 3.0L Pleasure Female 55 Homemaker 4205 1999 Toyota Camry Business Male 48 Accountant 384 Comp (24) 2 Minor (17 & 36)
Occasional Driver of Above Vehicle Female 47 Homemaker 312 Minor Conviction (1)Occasional Driver of Above Vehicle Male 27 Student 12 Minor Conviction (11)
6 1994 Ford Taurus LX Wagon Pleasure Female 42 Veterinarian 312Occasional Driver of Above Vehicle Male 48 Homemaker 384Occasional Driver of Above Vehicle Male 17 Student 12
7 1992 Honda Civic DX Hatchback Business Male 22 Cook 728 2000 Ford Excursion Business Female 45 First Aid Instructor 192 Collision (18)9 1990 Dodge Spirit Business Female 22 Student 7210 1995 GMC Sonoma SLS Business Female 22 Furniture Repair 72 Collision (18)11 1991 Mazda 4DR Protégé Pleasure Female 87 Retired 744 2 Minor Convictions (3 & 8)12 1997 Saturn SL1 Pleasure Male 72 Retired 384
Occasional Driver of Above Vehicle Pleasure Female 77 Retired 16813 1994 Plymouth Colt Business Female 38 Retail Sales 264 Collision (18)
Occasional Driver of Above Vehicle Male 18 Student 2414 2000 Volvo V70 XC AWD SE Business Male 45 Retail Proprietor 180 3 Comprehensive (6 & 12 & 18)
Occasional Driver of Above Vehicle Female 40 Retail Proprietor 4015 2002 Toyota Corolla Pleasure Male 68 Retired 600
Occasional Driver of Above Vehicle Female 66 Retired 54016 1992 Pontiac Sunbird GT Business Female 51 P/T Student, Retail 252 Collision (12), Criminal Code (12)17 1997 Dodge Ram Club Cab Business Male 35 Construction 228 Comprehensive Claim (12)
Occasional Driver of Above Vehicle Female 32 Retail Sales 12018 1990 Jeep Cherokee Pioneer Business Male 40 P/T Student, Pizza Delivery 264 Collision (12)19 1996 Chevrolet Cavalier Business Female 33 Office Manager 96 Major Conviction (18)20 1985 GMC K1500 Pickup 4x4 Business Female 18 Student 121 1998 Dodge Neon Business Female 17 Student 1222 1992 Toyota Pickup SR5 4x4 Business Male 19 Labourer 24 2 Minor Convictions (12 & 24)23 2003 Lexus ES 300 Business Female 57 Bus. Owner 444 2 Minor Convictions (12 & 24)24 1966 Volkswagen Vanagon GL Camper Business Male 31 Sales 144 Collision (12)
Occasional Driver of Above Vehicle Female 30 Self-Employed 4825 2000 Honda Odyssey EX Pleasure Female 43 Homemaker 31226 2002 Chevy Astro Cargo Van Business Male 51 Business Owner 39627 1996 Suzuki Swift Pleasure Male 25 Welder 60
Occasional Driver of Above Vehicle (3) Female 27 Child Care Worker 3628 1999 BMW 323 Business Male 36 Web Designer 228 Minor Conviction (12)29 1996 Mazda Miata Business Female 42 Nurse 288 Comp (36), Collision (85)30 1997 Ford Explorer Business Male 55 Supervisor 408
Occasional Driver of Above Vehicle Female 50 Sales Clerk 37231 1988 Chrysler New Yorker Pleasure Female 70 Retired 61232 1997 Ford F-150 1/2 Tonne Truck Business Male 42 Foreman 30033 1993 Buick Park Avenue 4DR Pleasure Male 75 Retired 660 Collision (8)34 2001 Volkswagen Beetle Business Male 27 Engineering Technologist 132