review of air quality impacts resulting from particle emissions from poultry … · aecom review of...
TRANSCRIPT
Environment
Defra
Review of Air Quality Impacts Resulting from Particle Emissions from Poultry Farms
Environment
Defra
Prepared by: .................Checked by: ................. Sam Pollard Gareth Collins Principal Environmental Scientist Technical Director
Approved by: ...................... Michele Hackman Technical Director Review of Air Quality Impacts Resulting from Particle Emissions from Poultry Farms
Rev No Comments Checked by
Approved by
Date
1 Draft for Bureau Veritas Comment GMC MPH July 2011
2 Revised to incorporate initial comments from Bureau Veritas GMC MPH July 2011
3 Revised to incorporate additional comments from Bureau Veritas GMC MPH September 2011
4 Revised to incorporate additional comments from Bureau Veritas GMC MPH September 2012
5 Final version GMC MPH October 2012
6 Final version incorporating BV amendments YV* YB* November 2012
* YV (Yasmin Vawda – Bureau Veritas), YB (Yvonne Brown – Bureau Veritas) 9th & 10th Floors, Sunley House, 4 Bedford Park, CR0 2AP Telephone: 020 8639 3500 Website: http://www.aecom.com Job No 60190372 Reference SJP Date Created November 2012 This document has been prepared by AECOM Limited for the sole use of our client (the “Client”) and in accordance with generally accepted consultancy principles, the budget for fees and the terms of reference agreed between AECOM Limited and the Client. Any information provided by third parties and referred to herein has not been checked or verified by AECOM Limited, unless otherwise expressly stated in the document. No third party may rely upon this document without the prior and express written agreement of AECOM Limited. f:\projects\environmental services - laqm services lot 1\laqm poultry farms\pm emissions from poultry farms 26112.doc
1 Introduction ....................................................................................................................................................................... 2 1.1 PM10 Criteria .......................................................................................................................................................... 2
2 Current Screening Criteria ............................................................................................................................................... 4 2.1 Environment Agency (EA) and Scottish Environment Protection Agency (SEPA) Regulation ............................... 4 2.2 Local Air Quality Management Technical Guidance .............................................................................................. 4
3 Summary of UK Poultry Industry ..................................................................................................................................... 7 3.1 Poultry Farming in England ................................................................................................................................... 7 3.2 Poultry Farming in Scotland ................................................................................................................................... 8 3.3 Poultry Farming in Wales ....................................................................................................................................... 8 3.4 Poultry Farming in Northern Ireland ....................................................................................................................... 8
4 Particulate Emissions from Poultry Farms ..................................................................................................................... 9 4.1 Poultry Housing and Ventilation ............................................................................................................................. 9 4.2 Sources of Particulate Emissions from Poultry Farms ........................................................................................... 9 4.3 Factors Affecting Particulate Emissions from Poultry Farms ............................................................................... 10
5 Assessment Methodology .............................................................................................................................................. 12 5.1 Review of Monitoring Studies .............................................................................................................................. 12 5.2 Estimating Poultry Farm Contribution .................................................................................................................. 12
6 Monitoring Studies .......................................................................................................................................................... 14 6.1 Monitoring Studies Undertaken for LAQM Purposes or by the EA ...................................................................... 14 6.2 Estimated Contribution of Poultry Farms to Daily Mean PM10 concentrations ..................................................... 19 6.3 Defra Funded Research Project .......................................................................................................................... 20
7 Emission Factors ............................................................................................................................................................ 23 7.1 Emission Factors Derived from Monitoring Studies ............................................................................................. 23 7.2 Emission Factors from Emissions Inventories ..................................................................................................... 24 7.3 Variation in Emission Rates over Time ................................................................................................................ 24
8 Discussion and Conclusions ......................................................................................................................................... 26 8.1 Origins and Suitability of LAQM.TG(09) Screening Criteria ................................................................................. 26 8.2 Further Evidence Provided By Recent Studies .................................................................................................... 26 8.3 Recommendations for updated Guidance ........................................................................................................... 31 8.4 Conclusions ......................................................................................................................................................... 32
References .................................................................................................................................................................................... 91 Appendix A: Poultry Farm Monitoring Studies ................................................................................................................................ 34 Appendix B: PM10 Increments from Poultry Farms ......................................................................................................................... 50 Appendix C: Terminology ............................................................................................................................................................... 90 Table 1: List of Local Authorities with Poultry Farms in Excess of LAQM.TG(09) Criteria ................................................................6 Table 2: Number of Holdings and Populations of Laying Birds, by Housing Type in 2009 ...............................................................7 Table 3: Poultry Numbers in Northern Ireland, 2010.........................................................................................................................8 Table 4: Location, Method and Duration of Monitoring Undertaken near poultry Farms for LAQM ................................................ 15 Table 5: Location, Method and Duration of Monitoring Undertaken near Poultry Farms by the EA ................................................ 15 Table 6: Poultry Farm Type and Capacity at which LAQM or EA Monitoring was undertaken ....................................................... 16 Table 7: Summary of Results of LAQM and EA Monitoring near UK Poultry Farms ....................................................................... 17 Table 8: Comparison of Monitoring Results to LAQM.TG(09) Screening Criteria ........................................................................... 18 Table 9: Estimated Incremental Contribution of Poultry Farms ....................................................................................................... 19 Table 10: Results of Defra Funded Research Project ..................................................................................................................... 21 Table 11: Estimated Poultry Farm Contribution from Results of Defra Poultry Farm Monitoring Study .......................................... 22 Table 12: Compilation of Emission Factors from Literature (modified from Roumeliotis and Van Heyst) ....................................... 23
Table of Contents
Table 13: Estimates of PM10 Emission factors within Emission Inventories .................................................................................... 24 Table 14: Derivation of Scaling Factors from Monitoring Data ....................................................................................................... 28 Table 15: Comparison of Predicted and Measured Results Using Broiler Farm Ratios ................................................................. 29 Table 16: Comparison of Predicted and Measured Results Using Fleet Fen Farm Ratios ............................................................ 30 Table 17: Monitoring results from the Green Pastures monitor ...................................................................................................... 34 Table 18: Monitoring Results from Frith Farm ................................................................................................................................ 36 Table 19: Percentiles of hourly PM10 concentrations measured at Frith Farm. ............................................................................... 38 Table 20: Monitored Concentrations at East Down Farm in Comparison to those at Background Sites......................................... 39 Table 21: Monitored PM10 Concentrations at Poultry Farm in Augher ............................................................................................ 41 Table 22: Monitored PM10 Concentrations at Poultry Farm in Brantry ............................................................................................ 43 Table 23: Maximum Measured 1-Hour Concentrations at Cubley .................................................................................................. 49 Table 24: Calculation of Incremental Contribution of Augher Poultry Farm to PM10 Concentrations .............................................. 50 Table 25: Calculation of Incremental Contribution of Eglish Poultry Farm to PM10 Concentrations ................................................ 60 Table 26: Calculation of Incremental Contribution of Brantry Poultry Farm to PM10 Concentrations .............................................. 67 Table 27: Calculation of Incremental Contribution of Pen Lon Poultry Farm to PM10 Concentrations ............................................ 76 Table 28: Calculation of Incremental Contribution of Cubley Farm to PM10 Concentrations ........................................................... 79 Table 29: Calculation of Incremental Contribution of Fleet Fen Farm to PM10 Concentrations ....................................................... 81 Table 30: Calculation of Incremental Contribution of Great Moulton Farm to PM10 Concentrations ............................................... 85 Figure 1: Poultry Numbers in England at June 2002 - 2010 .................................................................................................7 Figure 2: Example of Schematic Cross-section of Broiler House with Reverse Flow Ventilation ..........................................9 Figure 3: Real-time Emission Rates for Three Seasons (Roumeliotis and Van Heyst (2007)) ........................................... 25 Figure 4: Relationship between Maximum Estimated Incremental Contribution to Daily Mean PM10 and Distance ........... 27 Figure 5: Hourly PM10 Measurements at Green Pastures Monitor (corrected BAM) ........................................................... 35 Figure 6: Pollution Rose of Average PM10 Concentrations ................................................................................................. 37 Figure 7: Pollution Rose of Percentile PM10 Concentrations ............................................................................................... 37 Figure 8: Monitored PM10 Concentrations at Poultry Farm in Eglish, County Tyrone ......................................................... 40 Figure 9: Monitored PM10 Concentrations at Poultry Farm in Augher ................................................................................. 42 Figure 10: Monitored PM10 Concentrations at Poultry Farm in Brantry ................................................................................. 44 Figure 11: Average PM10 Concentrations versus Wind Direction at Poultry Farm in Brantry ................................................ 44 Figure 12: Monitored PM10 Concentrations at Poultry Farm in Pen Lôn ............................................................................... 45 Figure 13: PM10 Pollution Rose at Poultry Farm in Pen Lôn ................................................................................................. 46 Figure 14: PM10 Percentile Rose at Poultry Farm in Pen Lôn ............................................................................................... 46 Figure 15: Measured 15-Minute Mean PM10 and PM2.5 Concentrations at Cubley ............................................................... 47 Figure 16: Measured 24-Hour Mean PM10 Concentrations at Cubley ................................................................................... 48 Figure 17: Estimated Incremental Contribution of Augher Poultry Farm to PM10 Concentrations ......................................... 59 Figure 18: Estimated Incremental Contribution of Eglish Poultry Farm to PM10 Concentrations ........................................... 66 Figure 19: Estimated Incremental Contribution of Brantry Poultry Farm to PM10 Concentrations ......................................... 76
AECOM Review of Air Quality Impacts Resulting from Particle Emissions from Poultry Farms 2
Capabilities on project:
Environment
Particulate matter (PM) is generally categorised on the basis of the size of the particles (for example PM10 are
particles with a median aerodynamic diameter of less than 10 μm). Particulate matter comprises primary particles
emitted directly into the atmosphere and secondary particles formed by chemical reactions in the air.
Both short-term and long-term exposure to ambient levels of particles is associated with respiratory and
cardiovascular illness and mortality, as well as other ill-health effects. The associations are believed to be causal.
PM10 roughly equates to the mass of particles less than 10 micrometres in diameter that are likely to be inhaled into
the thoracic region of the respiratory tract.
Data from the most recent National Atmospheric Emissions Inventory (NAEI)1 suggests that poultry farming
contributes approximately 7.1% to total primary PM10 emissions within the UK. As the UK poultry industry is
dominated by very large scale units2, there is therefore concern that particle emissions from poultry farms could lead
locally to exceedences of national Air Quality Strategy objectives for PM10, particularly where large poultry units are
present close to locations of relevant exposure.
Poultry farms were introduced into the review and assessment process by LAQM.TG(09)3 because “a small number
of local authorities have identified potential exceedences of the PM10 objectives associated with emissions from
poultry farms”, albeit very localised. However, whilst screening criteria were introduced, the guidance contained
within LAQM.TG(09) on assessing, and more specifically modelling, the air quality impact of PM emissions from
poultry farms is limited, such that the Detailed Assessments of poultry farms carried out to date have been based on
ambient PM10 monitoring, which can be both time consuming and relatively expensive.
The purpose of this study was therefore to review the suitability of the screening criteria within LAQM.TG(09) and to
develop a suitable assessment methodology which local authorities could use to further assess or screen the impact
of particulate matter emissions from poultry farms on air quality, potentially minimising the requirement for local
authorities to proceed to a Detailed Assessment, and/or undertake ambient monitoring. This work has been
undertaken by AECOM as part of the Local Air Quality Management (LAQM) Lot 1 Helpdesk Contract.
The objectives of the study were as follows:
- To review the evidence on which the existing screening criteria for the assessment of poultry farms are based; - To review further evidence on the impacts of poultry farms on PM10 concentrations, provided by additional
monitoring studies (including those funded by Defra); and - To make recommendations for updated guidance to local authorities, based on the results of these additional
studies.
1.1 PM10 Criteria
There are two Air Quality Strategy (AQS) objectives for PM10 against which ambient concentrations are compared.
The first relates to long-term (annual mean) concentrations, and the other to short-term (24-hour or daily mean)
concentrations. The PM10 objectives set in the Air Quality Strategy (which apply in England, Wales and Northern
Ireland) are the same as limit values set by the European Union (EU), although it should be noted that the EU limit
values are mandatory, whereas the AQS objectives are targets. Both have been incorporated into Statutory
Instruments. The air quality objectives for PM10 which apply in England, Wales and Northern Ireland are:
- 50 µg/m3 for a 24-hour mean, not to be exceeded more than 35 times a year; and
- 40 µg/m3 for the annual mean.
The Air Quality Regulations make clear that likely exceedences of the objectives should be assessed in relation to
“the quality of the air at locations which are situated outside of buildings or other natural or man-made structures,
above or below ground, and where members of the public are regularly present”. Air quality objectives therefore
1 Introduction
AECOM Review of Air Quality Impacts Resulting from Particle Emissions from Poultry Farms 3
Capabilities on project:
Environment
only apply where members of the public are likely to be regularly present and are likely to be exposed for a period of
time appropriate to the averaging period of the objective. These locations are termed relevant exposure.
Experience suggests that the daily mean objective is harder to achieve than the annual mean objective in England,
Wales and Northern Ireland.
The following air quality objectives apply in Scotland, which are considerably more stringent than those described
above for England, Wales and Northern Ireland:
- 50 µg/m3 for a 24-hour mean, not to be exceeded more than 7 times a year; and
- 18 µg/m3 for the annual mean.
The annual mean objectives for Scotland is more difficult to achieve that the 24-hour mean objective.
AECOM Review of Air Quality Impacts Resulting from Particle Emissions from Poultry Farms 4
Capabilities on project:
Environment
2.1 Environment Agency (EA) and Scottish Environment Protection Agency (SEPA) Regulation
In England, Wales and Northern Ireland, poultry farms with a capacity greater than 40,000 birds (including chickens,
layers, pullets, turkeys, ducks and guinea fowl) are permitted by the EA under the Environmental Permitting
Regulations (EPR). In Scotland, intensive agriculture sites are permitted by SEPA under the Pollution Prevention
and Control (PPC) Regulations 2000 as amended.
Local authorities are therefore advised within LAQM.TG(09) to always ensure that their local EA/SEPA officer is
aware that a particular farm had been identified in their Updating and Screening Assessment (USA) as a potential
issue. The EA/SEPA however has not issued any guidance on how to assess dust emissions from poultry farms;
instead EA/SEPA guidance has focussed on the sources of PM from poultry farms and measures to minimise these
PM emissions.
The EPR implement the Integrated Pollution Prevention and Control (IPPC) Directive in England and Wales and
came into force on 6th April 2008. The IPPC Directive requires that the Best Available Techniques (BAT) are used.
Guidance has been issued by the EA on dust control emissions for poultry farms which shows that mitigation is an
important factor in determining emissions. When making an application for a permit to the EA, the costs and
benefits of a range of options should be compared to show that an applicant’s proposals represent BAT. In
Scotland, SEPA’s Standard Farming Installation Rules attempt to minimise emissions from poultry units for the
varying types of housing design, housing management, diet selection, production cycles etc.
If an applicant proposes to use the measures which are expressed as BAT within the relevant sector guidance
note4, options would not need to be compared. In order to assist this process, a BAT Reference Document (BREF)
for Intensive Rearing of Poultry and Pigs has been produced by the European IPPC Bureau. This is currently being
reviewed, and the updated version is expected in early 2013. BAT must be achieved within 4 years of the issue of
the Sector BREF.
For bespoke permits, the EA/SEPA expects all new plant and livestock housing to be designed and built to the
required standards. Where regulatory controls are being applied to existing plant, the EA/SEPA expects plant to be
upgraded to meet the standards where necessary, with the EA/SEPA setting improvement conditions with a
timescale. This would occur, for example, where a farm currently below the threshold expands above the threshold
and would have a mix of existing and new buildings.
2.2 Local Air Quality Management Technical Guidance
LAQM.TG(09) introduced screening criteria in order to consider poultry farms during the Updating and Screening
Assessment (USA) process. This was because “a small number of local authorities have identified potential
exceedences of the PM10 objectives associated with emissions from poultry farms”. The authorities where potential
exceedences were identified were South Norfolk Council and Derbyshire Dales District Council5; the results of the
monitoring surveys are provided in full in Section 6.
The screening criteria in LAQM.TG(09) were derived based on experience from studies carried out by the
Environment Agency (EA), Department for Environment Northern Ireland (DoENI) and a local authority, and are
reproduced below:
“1. Identify any farms housing in excess of 400,000 birds if mechanically ventilated.
200,000 birds if naturally ventilated.
100,000 birds for any turkey unit.
2 Current Screening Criteria
AECOM Review of Air Quality Impacts Resulting from Particle Emissions from Poultry Farms 5
Capabilities on project:
Environment
2. Establish whether there is relevant exposure within 100 m of the poultry units. Relevant exposure will include
residential properties that form part of the farm itself.”
If both these criteria are met, a Detailed Assessment for PM10 is required.
LAQM.TG(09) goes on to state:
“Detailed Assessments for poultry farms are likely to be based on both monitoring and modelling studies. In many
cases a suitable monitoring programme will need to be established to determine the impact of these sources”
and
“Quantifying the PM10 emissions arising from a poultry farm is not straightforward. Where authorities need to
quantify these emissions for input to a dispersion model, they are advised to contact the relevant regulatory
authority and/or the Local Authority Air Quality Support Helpdesk”.
2.2.1 Origin of LAQM.TG(09) Screening Criteria
The screening criteria were developed based on the limited monitoring data available at the time (i.e. prior to 2009),
taking into account the size and type of installation and the proximity of residential exposure, in order to identify
those local authorities where particulate emissions from poultry farms could potentially be significant. The intention
being that those locations of greatest concern would subsequently be investigated in more detail to obtain more
information19
.
2.2.2 More Recent Guidance
Since LAQM.TG(09) was a published, a Frequently Asked Question (FAQ)6 was published on the Defra LAQM
website, which is reproduced below:
“I have identified the need to undertake a Detailed Assessment for Poultry Farms. Is there any guidance on
how to do this?
A number of local authorities have completed their Updating and Screening Assessments and have identified poultry
farms that meet the criteria (as set out in the Technical Guidance (LAQM.TG(09)) that would require proceeding to a
Detailed Assessment.
It is recognised that the screening criteria in TG(09) have been based on limited data, and it was stated that further
information would be provided as and when new information became available. To assist this process, three local
authorities in England have been awarded Air Quality Grant funding in order to carry out studies at the poultry farms
they have identified, in order to assess both the local risk of exceedences of the air quality objectives, and to provide
additional information to verify, or amend if necessary, the current screening criteria.
Until this assessment work is completed, there is no requirement for local authorities to move forward to a Detailed
Assessment at this time. Where local circumstances (such as a history of nuisance complaints related to the farm in
question) suggest that it would be preferable to proceed to a Detailed Assessment as soon as possible, authorities
are advised to contact the Review and Assessment Helpdesk in order to ensure that any work carried out is in line
with best practice.
Where the outcome of the Updating and Screening Assessment has identified a need for a Detailed Assessment for
one or more poultry farms, then the Review and Assessment Helpdesk will have been in contact to obtain further
information on their location(s). If authorities in this situation have not been contacted they should get in touch with
the Helpdesk at the earliest opportunity.
As these processes are likely to be permitted by the Environment Agency, local authorities should always ensure
that their local EA officer is aware that the farm has been identified in their USA as a potential issue.”
AECOM Review of Air Quality Impacts Resulting from Particle Emissions from Poultry Farms 6
Capabilities on project:
Environment
The three local authorities referred to above which received Air Quality Grant funding were:
- South Holland District Council; - New Forest District Council; and - Aylesbury Vale District Council (this study however was not undertaken).
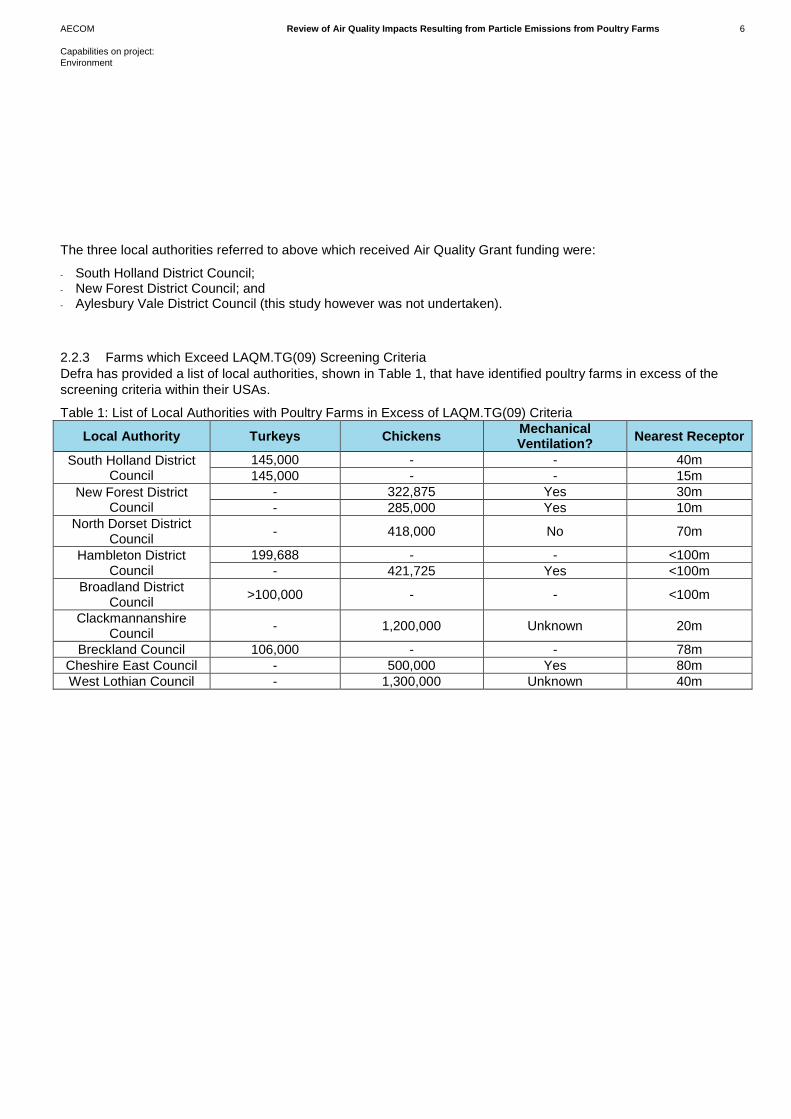
2.2.3 Farms which Exceed LAQM.TG(09) Screening Criteria
Defra has provided a list of local authorities, shown in Table 1, that have identified poultry farms in excess of the
screening criteria within their USAs.
Table 1: List of Local Authorities with Poultry Farms in Excess of LAQM.TG(09) Criteria
Local Authority Turkeys Chickens Mechanical Ventilation?
Nearest Receptor
South Holland District Council
145,000 - - 40m
145,000 - - 15m
New Forest District Council
- 322,875 Yes 30m
- 285,000 Yes 10m
North Dorset District Council
- 418,000 No 70m
Hambleton District Council
199,688 - - <100m
- 421,725 Yes <100m
Broadland District Council
>100,000 - - <100m
Clackmannanshire Council
- 1,200,000 Unknown 20m
Breckland Council 106,000 - - 78m
Cheshire East Council - 500,000 Yes 80m
West Lothian Council - 1,300,000 Unknown 40m
AECOM Review of Air Quality Impacts Resulting from Particle Emissions from Poultry Farms 7
Capabilities on project:
Environment
The UK poultry industry predominantly consists of broilers (i.e. chickens raised for meat production), layers (i.e.
chickens raised for egg production), geese, ducks and turkeys. Further explanations of some of the terminology
used in this report relating to the poultry farming industry can be found in Appendix C.
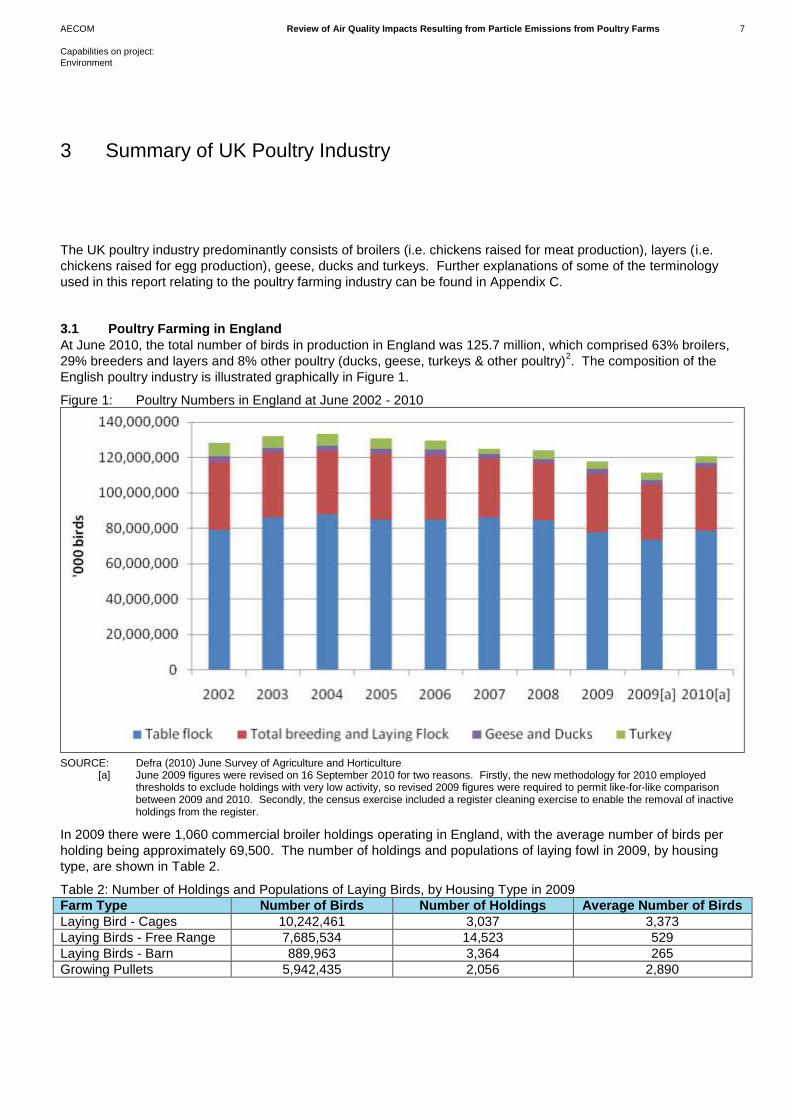
3.1 Poultry Farming in England
At June 2010, the total number of birds in production in England was 125.7 million, which comprised 63% broilers,
29% breeders and layers and 8% other poultry (ducks, geese, turkeys & other poultry)2. The composition of the
English poultry industry is illustrated graphically in Figure 1.
Figure 1: Poultry Numbers in England at June 2002 - 2010
SOURCE: Defra (2010) June Survey of Agriculture and Horticulture
[a] June 2009 figures were revised on 16 September 2010 for two reasons. Firstly, the new methodology for 2010 employed thresholds to exclude holdings with very low activity, so revised 2009 figures were required to permit like-for-like comparison between 2009 and 2010. Secondly, the census exercise included a register cleaning exercise to enable the removal of inactive holdings from the register.
In 2009 there were 1,060 commercial broiler holdings operating in England, with the average number of birds per
holding being approximately 69,500. The number of holdings and populations of laying fowl in 2009, by housing
type, are shown in Table 2.
Table 2: Number of Holdings and Populations of Laying Birds, by Housing Type in 2009
Farm Type Number of Birds Number of Holdings Average Number of Birds
Laying Bird - Cages 10,242,461 3,037 3,373
Laying Birds - Free Range 7,685,534 14,523 529
Laying Birds - Barn 889,963 3,364 265
Growing Pullets 5,942,435 2,056 2,890
3 Summary of UK Poultry Industry
AECOM Review of Air Quality Impacts Resulting from Particle Emissions from Poultry Farms 8
Capabilities on project:
Environment
These data demonstrate that in terms of bird numbers, the English poultry industry is dominated by broilers.
Furthermore, as there are significantly fewer broiler farms in England than layer farms, this results in broiler farms
housing, on average, a significantly greater number of birds.
3.2 Poultry Farming in Scotland In June 2010 the total poultry population in Scotland was 14.59 million. The vast majority of these birds were broilers and other table birds e.g. turkeys (60%), followed by pullets and hens in the laying flock (25%). Fowls for breeding accounted for 8%, whilst pullets being reared for laying made up 6%. Other poultry made up just under 0.5% of the total
7.
3.3 Poultry Farming in Wales In June 2010 the total poultry population in Wales was 7.6 million, spread over a total of 284 holdings
8.
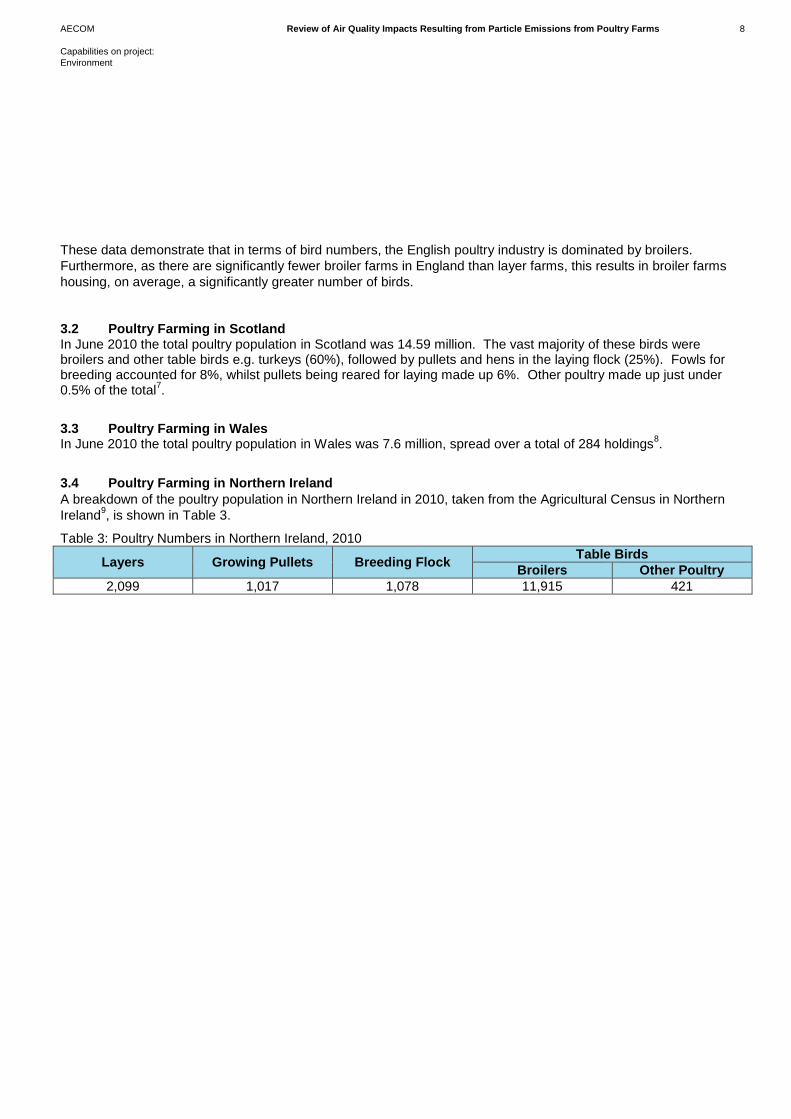
3.4 Poultry Farming in Northern Ireland
A breakdown of the poultry population in Northern Ireland in 2010, taken from the Agricultural Census in Northern
Ireland9, is shown in Table 3.
Table 3: Poultry Numbers in Northern Ireland, 2010
Layers Growing Pullets Breeding Flock Table Birds
Broilers Other Poultry
2,099 1,017 1,078 11,915 421
AECOM Review of Air Quality Impacts Resulting from Particle Emissions from Poultry Farms 9
Capabilities on project:
Environment
4.1 Poultry Housing and Ventilation
Birds used for meat production, e.g. broilers, turkeys and ducks, are commonly housed in litter-covered floor
systems. Birds for egg production are housed in more varied systems such as part-littered / part-slatted floors
(sometimes multi-tiered) or in tiered-cage or colony systems. Cage systems can themselves be subdivided into
deep-pit houses that store droppings beneath the bird living quarters, or belt-clean houses that remove droppings
from the house either direct to fields or to covered storage facilities.
All these houses must be ventilated to remove waste gases and to ensure fresh air for the birds, as well as to
control internal temperatures. For litter floor systems, there is a legal remit to maintain dry, friable litter10
to, for
example, reduce contact dermatitis11
and to promote natural behaviours. Ventilation systems achieve this by
removing moisture from houses.
Ventilation can be provided by powered or natural systems. Fans can be placed in the roof or the sidewalls of
buildings, mostly extracting from buildings, but occasionally designed to blow into buildings under pressure. The
different types of air circulation system within a poultry house are designed for the maintenance of bird welfare as an
overriding factor, and until recently within the UK, very little consideration had been given to designs specifically
incorporating dust reduction techniques.
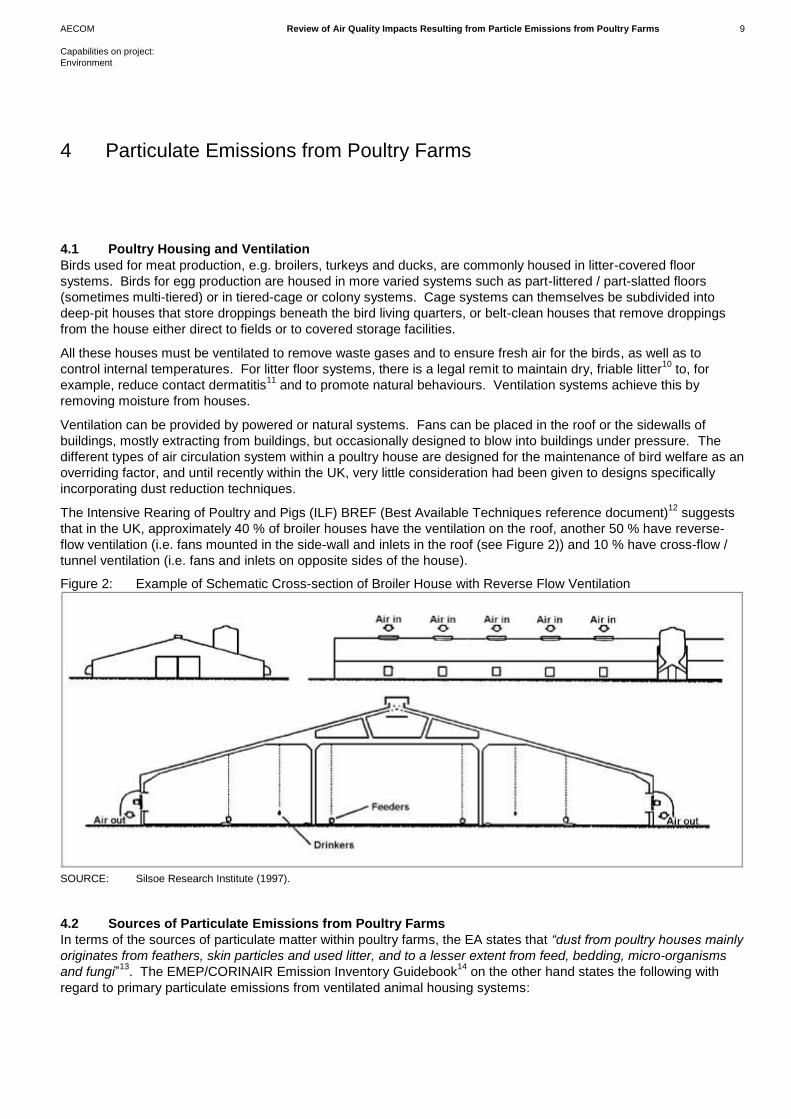
The Intensive Rearing of Poultry and Pigs (ILF) BREF (Best Available Techniques reference document)12
suggests
that in the UK, approximately 40 % of broiler houses have the ventilation on the roof, another 50 % have reverse-
flow ventilation (i.e. fans mounted in the side-wall and inlets in the roof (see Figure 2)) and 10 % have cross-flow /
tunnel ventilation (i.e. fans and inlets on opposite sides of the house).
Figure 2: Example of Schematic Cross-section of Broiler House with Reverse Flow Ventilation
SOURCE: Silsoe Research Institute (1997).
4.2 Sources of Particulate Emissions from Poultry Farms
In terms of the sources of particulate matter within poultry farms, the EA states that “dust from poultry houses mainly
originates from feathers, skin particles and used litter, and to a lesser extent from feed, bedding, micro-organisms
and fungi”13
. The EMEP/CORINAIR Emission Inventory Guidebook14
on the other hand states the following with
regard to primary particulate emissions from ventilated animal housing systems:
4 Particulate Emissions from Poultry Farms
AECOM Review of Air Quality Impacts Resulting from Particle Emissions from Poultry Farms 10
Capabilities on project:
Environment
“There are several sources of the enrichment of airborne particulate matter within livestock buildings. The feed itself
and the feeding process may contribute to 80 to 90 % of the total dust generation. Bedding materials like straw or
wood shavings can also have extraordinary effects on the particle concentration in the livestock air. Depending on
the type and the amount of litter and its spreading, its contribution can be between 55 and 68 % of the total airborne
particulates observed. The animal skin, fleece or plumage of housed animals and their faeces and urine cause dust
emissions which may contribute up to 12 % of the total dust amounts released within livestock buildings. To a
lesser extent, particles may originate from friction against floors, walls and other structural elements and from the air
intake into the house.
Animal activity may also lead to re-suspension into the livestock house atmosphere of dust already settled (re-
entrainment).”
It should be noted that the EMEP/CORINAIR guidance relates to animal housing in general (i.e. it also includes
cattle and pigs etc.), whereas the guidance from the EA relates specifically to poultry farms and is UK specific. The
above statements suggest that the relative contribution of different sources to total particulate emissions from
poultry farms is far from certain.
4.3 Factors Affecting Particulate Emissions from Poultry Farms
Factors affecting particulate emissions from poultry farms include type of bird, type of housing system, type of
ventilation, bedding materials, litter condition, air temperature, humidity, flow rate, type and amount of feed and
animal activity level15
.
In addition, the EMEP/EEA emission inventory guidebook16
suggests that mass flows of emitted particulates from poultry farms are governed by the following parameters (examples in brackets), thus causing uncertainties in terms of predicted emissions
17:
- physical density and particle size distribution of livestock related particulate matter; - type of housed animals; - type of feeding system (dry vs. wet, automatic vs. manual, feed storage conditions); - type of floor (partly or fully slatted); - the use of bedding material (straw or wood shavings); - the manure system (liquid vs. solid, removal and storage, manure drying on conveyor belts); - animal activity (species, circadian rhythms, young vs adult animals, caged vs aviary systems); - ventilation rate (summer vs. winter, forced vs naturally ventilated); - geometry and positions of inlets and outlets (re-entrainment of deposited particles caused by turbulence above
the surfaces within the building); - indoor climate in the building (temperature and relative humidity); - the time-period of housing (whole year vs. seasonal housing); - the management (all-in and all-out systems, with periods of empty livestock building due to cleaning and
disinfection procedures vs. continuously rearing systems); - secondary sources due to farmers’ activities (tractors, walking through the building to check on livestock); - cleaning practices (forced air vs. vacuum).
4.3.1 Feed
One component of livestock-derived particulate matter is feed18
. Particulate matter concentrations within poultry
units may be increased if the form of the feed is initially dusty, as with some non-pelleted feeds for laying hens.
Broiler feed is less dusty as it is moulded into pellet form that contains a higher level of fat.
AECOM Review of Air Quality Impacts Resulting from Particle Emissions from Poultry Farms 11
Capabilities on project:
Environment
The equipment in which feed is administered can also increase the amount of airborne particulates. Li et al19
found
that dust increased by 150% when both meal and pellet feeds were administered by a “screw” auger system rather
than by hand. Automatic feeders can generate particulates when feed is being dropped into the troughs, especially
if the feed is as a meal or if the pellets are badly formed. Feeders that “over administer” are also a cause of
particulate formation, for example in broiler housing20
. The spilled feed is gradually crushed on the floor into smaller
particles which become airborne due to bird activity.
4.3.2 Bedding
A second source of poultry-related particulate emissions is the re-suspension of bedding material. Takai et al. and
Ellen et al.21
found that particulate emissions were four to five times higher from houses using bedding rather than
cages with wire floors. However, many egg producers in the UK (and throughout Europe) are moving towards
littered systems for poultry on the grounds of animal welfare. Various bedding materials are used, such as sawdust,
flax, wheat, barley or rye straw paper, clay pellets, peat and wood shavings.
Deep bedding systems as used in turkey and duck production have been shown to contribute fewer particles to the
environment than shallow bedding systems22
. Deep litter is thought to “sediment” the particles to the lower layers of
the bedding where the increased humidity traps the particles and helps to bind it in place, reducing particle
concentrations by approximately 50%. However, deep litter is not deemed suitable for broilers, as a study has
shown that litter deeper than 5 cm resulted in a significantly (P< 0.05) higher prevalence of foot-pad dermatitis23
in
the flock. As bedding materials break down to a dry friable litter, particle production increases. As the straw
degenerates with time, fine straw particles become airborne and elevate indoor particulate matter levels. Even with
“pre-packed, dust-extracted” bedding materials, particle levels will be low at first but will increase due to activity
occurring in the litter.
AECOM Review of Air Quality Impacts Resulting from Particle Emissions from Poultry Farms 12
Capabilities on project:
Environment
The following assessment methodology has been employed within this study:
- Information pertinent to this study was extracted from reports on PM10 monitoring in the vicinity of poultry farms; - If required, additional information was subsequently requested from the relevant monitoring body, including raw
monitoring datasets; - Where possible, the incremental contribution of the poultry farms to monitored local PM10 concentrations was
estimated, by subtracting appropriate background concentrations; - A literature review was undertaken in order to determine published PM10 emission factors associated with poultry
farms, and the factors affecting emission rates; - The information derived from the monitoring studies was used to develop a method for assessing the potential
impact of poultry farms on short-term PM10 concentrations.
5.1 Review of Monitoring Studies
Initially, the following reports on PM10 monitoring in the vicinity of poultry farms were reviewed, in order to extract
information pertinent to this study.
Studies prior to publication of LAQM.TG(09):
- South Norfolk District Council’s PM10 Detailed Assessment (2006)24
; - Study of Ambient Air Quality At Newborough (2003)
25;
- Isle of Anglesey County Council’s Air Quality Progress Reports (2003/04 – 2006/07)26
; - Report on PM10 Sampling Equipment at Poultry Farm, Eglish (2005)
27;
- Report on PM10 Sampling Equipment at Poultry Farm, Augher (2007)28
; - Report on PM10 Sampling Equipment at Poultry Farm, Brantry (2008)
29;
Studies following publication of LAQM.TG(09):
- South Holland District Council’s PM10 Detailed Assessment (2011)30
; - New Forest District Council’s PM10 Detailed Assessment (2011)
31;
- North Dorset Council’s PM10 Detailed Assessment (2010)32
; - Derbyshire Dales District Council’s PM10 Detailed Assessment (2009)
33; and
- Study of Ambient Air Quality at Cubley (2011)34
.
Where information of importance to this study was not provided within the reports described above, the relevant
organisation was contacted in an attempt to obtain the relevant information. This included requesting raw
monitoring data. In a number of cases, information of relevance to this study was not recorded during the
monitoring study, including in some instances the number of birds on the farm at the time of the monitoring, and the
type and location of ventilation.
5.2 Estimating Poultry Farm Contribution
Using the available raw monitoring data obtained, the contribution of each farm to monitored PM10 concentrations
was estimated, by subtracting representative background levels from monitored daily mean concentrations. The
monitoring sites from which background concentrations were obtained for each farm are described in Appendix B,
together with the data used to estimate the average and maximum incremental contribution of the relevant poultry
farm to measured PM10 concentrations.
5 Assessment Methodology
AECOM Review of Air Quality Impacts Resulting from Particle Emissions from Poultry Farms 13
Capabilities on project:
Environment
5.2.1 Limitations
It should be noted that in most cases, the process described above was complicated by the scarcity of background
monitoring data local to the farms in question, and in particular by the lack of rural background sites which monitor
PM10. This has resulted in some of the background data used being sourced from monitoring sites some distance
from the farms in question, and in some cases from urban background sites. The approximate distance of the
background site used to determine the incremental contribution for each of the farms has therefore been provided.
Ideally, hourly or even 15-minute data would have been used when subtracting the background contribution from
monitored PM10 concentrations, given that PM10 emissions of short duration, or brief periods when the analyser was
downwind of the poultry farm, may be obscured by comparing PM10 concentrations averaged over a 24-hour period.
However, for the purposes of consistency and in some cases because of limited data availability, daily mean PM10
concentrations have been considered in all cases.
The effect of the limitations described above is illustrated quite clearly by those days where assumed daily mean
PM10 background concentrations exceeded monitored PM10 concentrations at the farm in question. On these
occasions, the incremental contribution of the farm to monitored PM10 concentrations was assumed to be zero.
It should also be noted that this process assumes that the estimated incremental contribution is due solely to the
poultry unit under investigation, whereas PM10 concentrations could be affected by other sources or other farm-
related activities. This is evidenced by the comments associated with the daily mean concentrations recorded at the
Augher and Brantry farms, where a number of days where PM10 concentrations exceeded 50 µg/m3 were attributed
to other activities and not the chicken-rearing process.
AECOM Review of Air Quality Impacts Resulting from Particle Emissions from Poultry Farms 14
Capabilities on project:
Environment
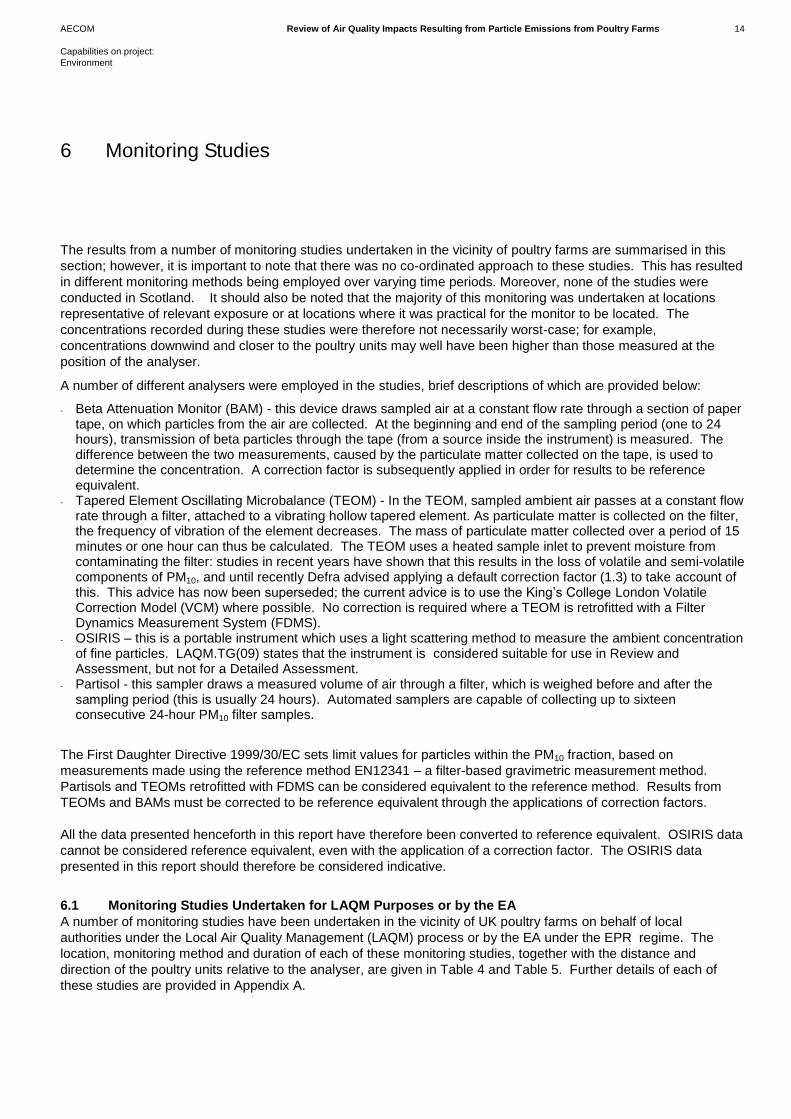
The results from a number of monitoring studies undertaken in the vicinity of poultry farms are summarised in this
section; however, it is important to note that there was no co-ordinated approach to these studies. This has resulted
in different monitoring methods being employed over varying time periods. Moreover, none of the studies were
conducted in Scotland. It should also be noted that the majority of this monitoring was undertaken at locations
representative of relevant exposure or at locations where it was practical for the monitor to be located. The
concentrations recorded during these studies were therefore not necessarily worst-case; for example,
concentrations downwind and closer to the poultry units may well have been higher than those measured at the
position of the analyser.
A number of different analysers were employed in the studies, brief descriptions of which are provided below:
- Beta Attenuation Monitor (BAM) - this device draws sampled air at a constant flow rate through a section of paper tape, on which particles from the air are collected. At the beginning and end of the sampling period (one to 24 hours), transmission of beta particles through the tape (from a source inside the instrument) is measured. The difference between the two measurements, caused by the particulate matter collected on the tape, is used to determine the concentration. A correction factor is subsequently applied in order for results to be reference equivalent.
- Tapered Element Oscillating Microbalance (TEOM) - In the TEOM, sampled ambient air passes at a constant flow rate through a filter, attached to a vibrating hollow tapered element. As particulate matter is collected on the filter, the frequency of vibration of the element decreases. The mass of particulate matter collected over a period of 15 minutes or one hour can thus be calculated. The TEOM uses a heated sample inlet to prevent moisture from contaminating the filter: studies in recent years have shown that this results in the loss of volatile and semi-volatile components of PM10, and until recently Defra advised applying a default correction factor (1.3) to take account of this. This advice has now been superseded; the current advice is to use the King’s College London Volatile Correction Model (VCM) where possible. No correction is required where a TEOM is retrofitted with a Filter Dynamics Measurement System (FDMS).
- OSIRIS – this is a portable instrument which uses a light scattering method to measure the ambient concentration of fine particles. LAQM.TG(09) states that the instrument is considered suitable for use in Review and Assessment, but not for a Detailed Assessment.
- Partisol - this sampler draws a measured volume of air through a filter, which is weighed before and after the sampling period (this is usually 24 hours). Automated samplers are capable of collecting up to sixteen consecutive 24-hour PM10 filter samples.
The First Daughter Directive 1999/30/EC sets limit values for particles within the PM10 fraction, based on
measurements made using the reference method EN12341 – a filter-based gravimetric measurement method.
Partisols and TEOMs retrofitted with FDMS can be considered equivalent to the reference method. Results from
TEOMs and BAMs must be corrected to be reference equivalent through the applications of correction factors.
All the data presented henceforth in this report have therefore been converted to reference equivalent. OSIRIS data
cannot be considered reference equivalent, even with the application of a correction factor. The OSIRIS data
presented in this report should therefore be considered indicative.
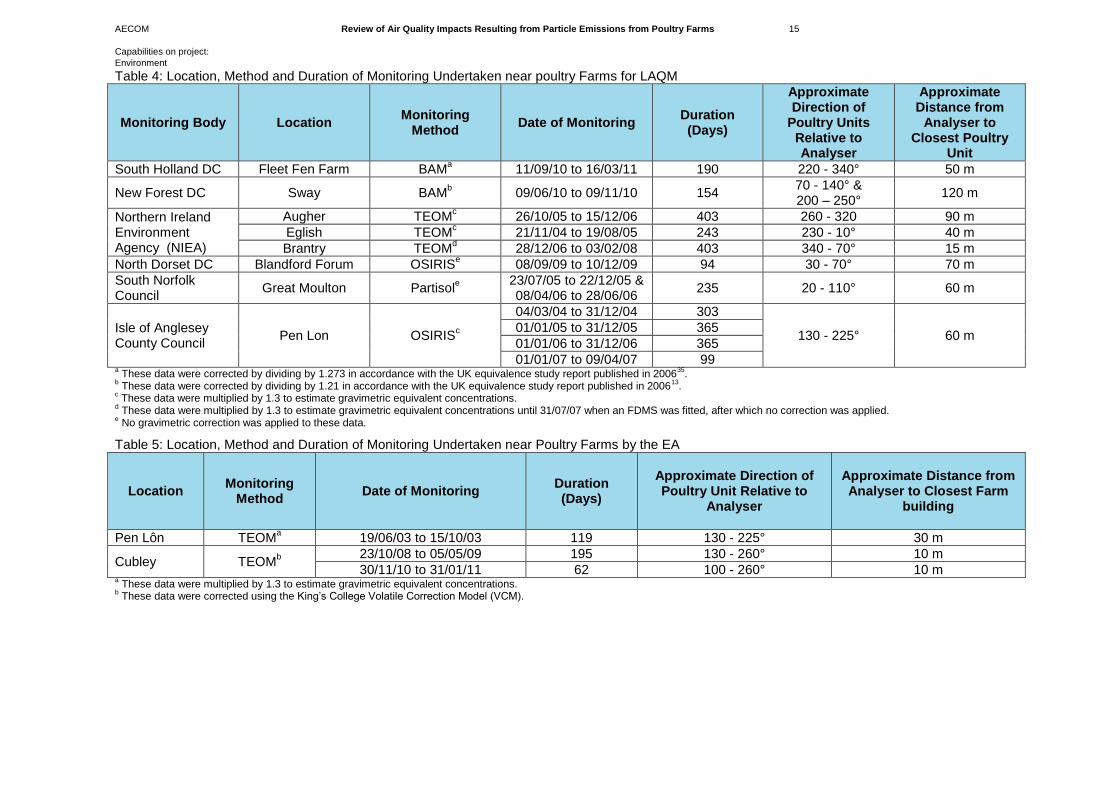
6.1 Monitoring Studies Undertaken for LAQM Purposes or by the EA
A number of monitoring studies have been undertaken in the vicinity of UK poultry farms on behalf of local
authorities under the Local Air Quality Management (LAQM) process or by the EA under the EPR regime. The
location, monitoring method and duration of each of these monitoring studies, together with the distance and
direction of the poultry units relative to the analyser, are given in Table 4 and Table 5. Further details of each of
these studies are provided in Appendix A.
6 Monitoring Studies
AECOM Review of Air Quality Impacts Resulting from Particle Emissions from Poultry Farms 15
Capabilities on project:
Environment
Table 4: Location, Method and Duration of Monitoring Undertaken near poultry Farms for LAQM
Monitoring Body Location Monitoring
Method Date of Monitoring
Duration (Days)
Approximate Direction of
Poultry Units Relative to Analyser
Approximate Distance from
Analyser to Closest Poultry
Unit
South Holland DC Fleet Fen Farm BAMa 11/09/10 to 16/03/11 190 220 - 340° 50 m
New Forest DC Sway BAMb 09/06/10 to 09/11/10 154
70 - 140° & 200 – 250°
120 m
Northern Ireland Environment Agency (NIEA)
Augher TEOMc 26/10/05 to 15/12/06 403 260 - 320 90 m
Eglish TEOMc 21/11/04 to 19/08/05 243 230 - 10° 40 m
Brantry TEOMd 28/12/06 to 03/02/08 403 340 - 70° 15 m
North Dorset DC Blandford Forum OSIRISe 08/09/09 to 10/12/09 94 30 - 70° 70 m
South Norfolk Council
Great Moulton Partisole
23/07/05 to 22/12/05 & 08/04/06 to 28/06/06
235 20 - 110° 60 m
Isle of Anglesey County Council
Pen Lon OSIRISc
04/03/04 to 31/12/04 303
130 - 225° 60 m 01/01/05 to 31/12/05 365
01/01/06 to 31/12/06 365
01/01/07 to 09/04/07 99 a These data were corrected by dividing by 1.273 in accordance with the UK equivalence study report published in 2006
35.
b These data were corrected by dividing by 1.21 in accordance with the UK equivalence study report published in 2006
13.
c These data were multiplied by 1.3 to estimate gravimetric equivalent concentrations.
d These data were multiplied by 1.3 to estimate gravimetric equivalent concentrations until 31/07/07 when an FDMS was fitted, after which no correction was applied.
e No gravimetric correction was applied to these data.
Table 5: Location, Method and Duration of Monitoring Undertaken near Poultry Farms by the EA
Location Monitoring
Method Date of Monitoring
Duration (Days)
Approximate Direction of Poultry Unit Relative to
Analyser
Approximate Distance from Analyser to Closest Farm
building
Pen Lôn TEOMa 19/06/03 to 15/10/03 119 130 - 225° 30 m
Cubley TEOMb
23/10/08 to 05/05/09 195 130 - 260° 10 m
30/11/10 to 31/01/11 62 100 - 260° 10 m a These data were multiplied by 1.3 to estimate gravimetric equivalent concentrations.
b These data were corrected using the King’s College Volatile Correction Model (VCM).
AECOM Review of Air Quality Impacts Resulting from Particle Emissions from Poultry Farms 16
Capabilities on project:
Environment
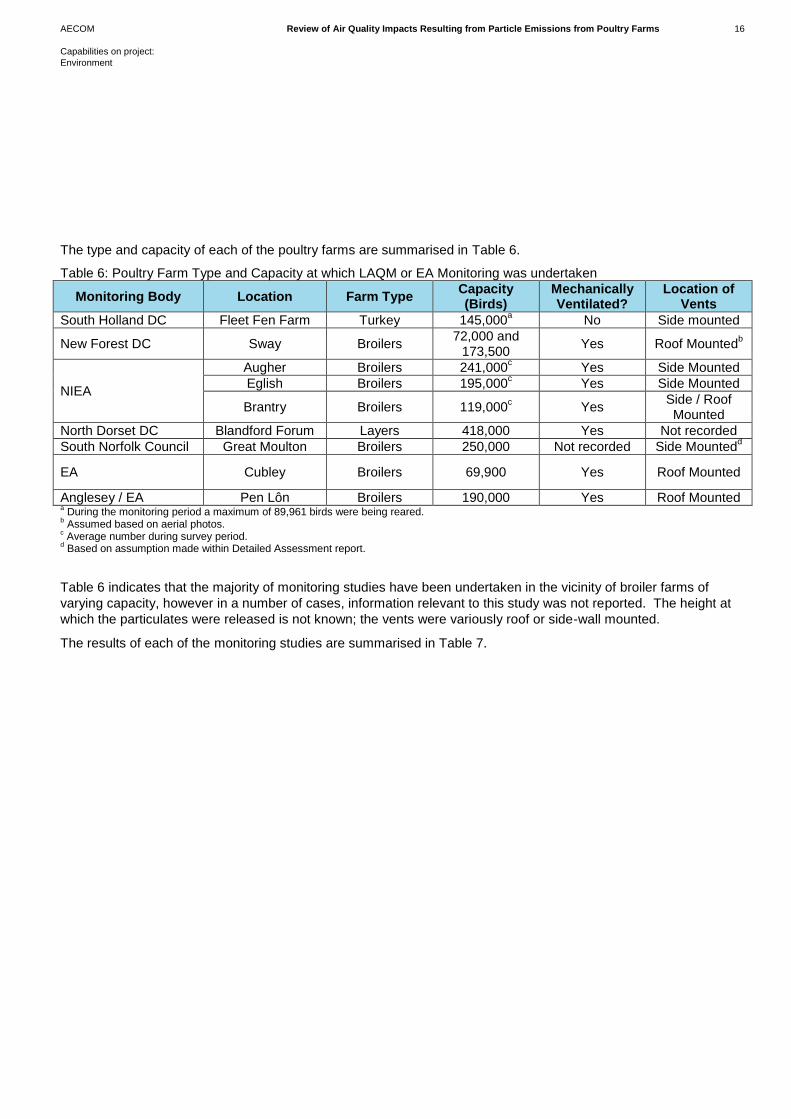
The type and capacity of each of the poultry farms are summarised in Table 6.
Table 6: Poultry Farm Type and Capacity at which LAQM or EA Monitoring was undertaken
Monitoring Body Location Farm Type Capacity (Birds)
Mechanically Ventilated?
Location of Vents
South Holland DC Fleet Fen Farm Turkey 145,000a No Side mounted
New Forest DC Sway Broilers 72,000 and
173,500 Yes Roof Mounted
b
NIEA
Augher Broilers 241,000c Yes Side Mounted
Eglish Broilers 195,000c Yes Side Mounted
Brantry Broilers 119,000c Yes
Side / Roof Mounted
North Dorset DC Blandford Forum Layers 418,000 Yes Not recorded
South Norfolk Council Great Moulton Broilers 250,000 Not recorded Side Mountedd
EA Cubley Broilers 69,900 Yes Roof Mounted
Anglesey / EA Pen Lôn Broilers 190,000 Yes Roof Mounted a During the monitoring period a maximum of 89,961 birds were being reared.
b Assumed based on aerial photos.
c Average number during survey period.
d Based on assumption made within Detailed Assessment report.
Table 6 indicates that the majority of monitoring studies have been undertaken in the vicinity of broiler farms of
varying capacity, however in a number of cases, information relevant to this study was not reported. The height at
which the particulates were released is not known; the vents were variously roof or side-wall mounted.
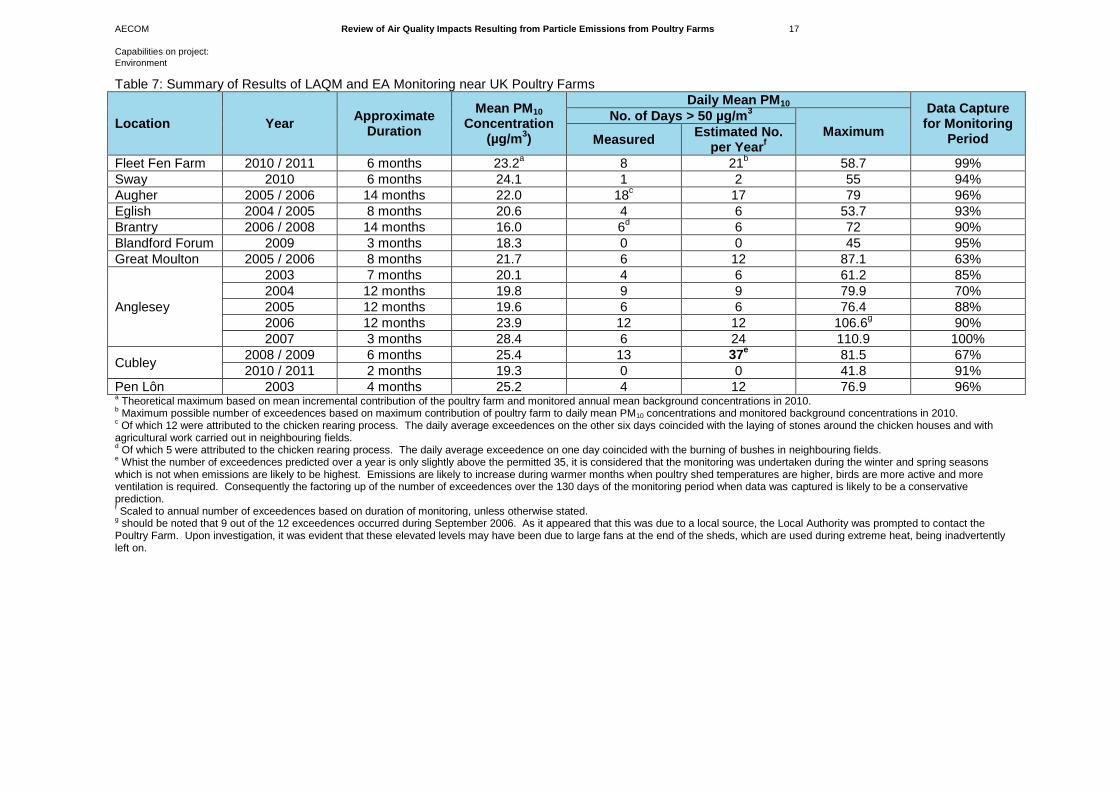
The results of each of the monitoring studies are summarised in Table 7.
AECOM Review of Air Quality Impacts Resulting from Particle Emissions from Poultry Farms 17
Capabilities on project:
Environment
Table 7: Summary of Results of LAQM and EA Monitoring near UK Poultry Farms
Location Year Approximate
Duration
Mean PM10 Concentration
(µg/m3)
Daily Mean PM10 Data Capture
for Monitoring Period
No. of Days > 50 µg/m3
Maximum Measured
Estimated No. per Year
f
Fleet Fen Farm 2010 / 2011 6 months 23.2a 8 21
b 58.7 99%
Sway 2010 6 months 24.1 1 2 55 94%
Augher 2005 / 2006 14 months 22.0 18c 17 79 96%
Eglish 2004 / 2005 8 months 20.6 4 6 53.7 93%
Brantry 2006 / 2008 14 months 16.0 6d 6 72 90%
Blandford Forum 2009 3 months 18.3 0 0 45 95%
Great Moulton 2005 / 2006 8 months 21.7 6 12 87.1 63%
Anglesey
2003 7 months 20.1 4 6 61.2 85%
2004 12 months 19.8 9 9 79.9 70%
2005 12 months 19.6 6 6 76.4 88%
2006 12 months 23.9 12 12 106.6g 90%
2007 3 months 28.4 6 24 110.9 100%
Cubley 2008 / 2009 6 months 25.4 13 37
e 81.5 67%
2010 / 2011 2 months 19.3 0 0 41.8 91%
Pen Lôn 2003 4 months 25.2 4 12 76.9 96% a Theoretical maximum based on mean incremental contribution of the poultry farm and monitored annual mean background concentrations in 2010.
b Maximum possible number of exceedences based on maximum contribution of poultry farm to daily mean PM10 concentrations and monitored background concentrations in 2010.
c Of which 12 were attributed to the chicken rearing process. The daily average exceedences on the other six days coincided with the laying of stones around the chicken houses and with
agricultural work carried out in neighbouring fields. d Of which 5 were attributed to the chicken rearing process. The daily average exceedence on one day coincided with the burning of bushes in neighbouring fields.
e Whist the number of exceedences predicted over a year is only slightly above the permitted 35, it is considered that the monitoring was undertaken during the winter and spring seasons
which is not when emissions are likely to be highest. Emissions are likely to increase during warmer months when poultry shed temperatures are higher, birds are more active and more ventilation is required. Consequently the factoring up of the number of exceedences over the 130 days of the monitoring period when data was captured is likely to be a conservative prediction. f Scaled to annual number of exceedences based on duration of monitoring, unless otherwise stated.
g should be noted that 9 out of the 12 exceedences occurred during September 2006. As it appeared that this was due to a local source, the Local Authority was prompted to contact the
Poultry Farm. Upon investigation, it was evident that these elevated levels may have been due to large fans at the end of the sheds, which are used during extreme heat, being inadvertently left on.
AECOM Review of Air Quality Impacts Resulting from Particle Emissions from Poultry Farms 18
Capabilities on project:
Environment
6.1.1 Discussion of Results
The results in Table 7 indicate that annual mean PM10 concentrations in the vicinity of the poultry farms at which
monitoring has been undertaken are well within the annual mean AQS objective (applicable in England, Wales and
Northern Ireland) at locations of relevant exposure where monitoring was feasible, reflecting the rural location of
these sites. However, the number of days on which PM10 concentrations exceeded 50 µg/m3, and the maximum
daily mean PM10 concentrations measured during the surveys, suggest that poultry farms have the potential to
significantly affect short-term PM10 concentrations. Only one site (Cubley) was estimated to have exceeded the
PM10 AQS objective for short-term concentrations (applicable in England, Wales and Northern Ireland), in 2008 /
2009. However, it should be noted that a more recent survey at this farm undertaken in 2010 / 2011 indicates that
the daily mean PM10 objective would now be met. This more recent monitoring followed the implementation of a
number of measures aimed at reducing PM10 emissions from the farm36
. The EA has undertaken additional
monitoring at this farm, completed at the end of September 201137
.
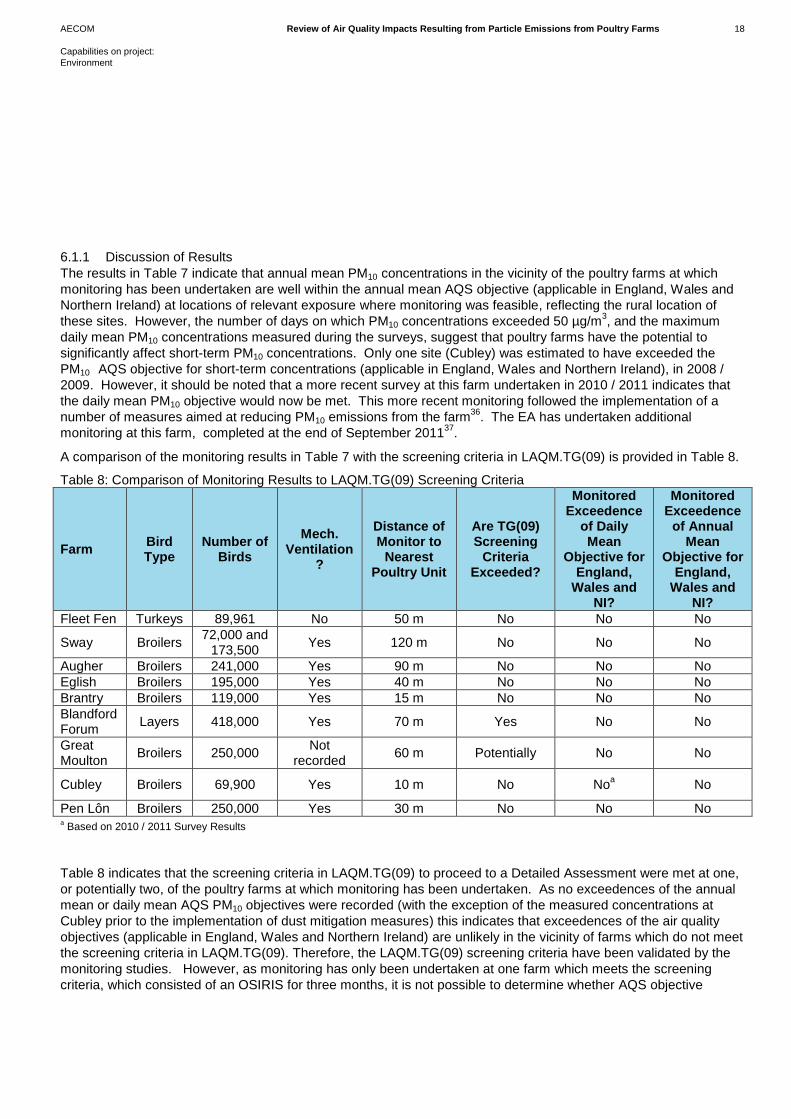
A comparison of the monitoring results in Table 7 with the screening criteria in LAQM.TG(09) is provided in Table 8.
Table 8: Comparison of Monitoring Results to LAQM.TG(09) Screening Criteria
Farm Bird Type
Number of Birds
Mech. Ventilation
?
Distance of Monitor to
Nearest Poultry Unit
Are TG(09) Screening
Criteria Exceeded?
Monitored Exceedence
of Daily Mean
Objective for England,
Wales and NI?
Monitored Exceedence
of Annual Mean
Objective for England,
Wales and NI?
Fleet Fen Turkeys 89,961 No 50 m No No No
Sway Broilers 72,000 and
173,500 Yes 120 m No No No
Augher Broilers 241,000 Yes 90 m No No No
Eglish Broilers 195,000 Yes 40 m No No No
Brantry Broilers 119,000 Yes 15 m No No No
Blandford Forum
Layers 418,000 Yes 70 m Yes No No
Great Moulton
Broilers 250,000 Not
recorded 60 m Potentially No No
Cubley Broilers 69,900 Yes 10 m No Noa No
Pen Lôn Broilers 250,000 Yes 30 m No No No a Based on 2010 / 2011 Survey Results
Table 8 indicates that the screening criteria in LAQM.TG(09) to proceed to a Detailed Assessment were met at one,
or potentially two, of the poultry farms at which monitoring has been undertaken. As no exceedences of the annual
mean or daily mean AQS PM10 objectives were recorded (with the exception of the measured concentrations at
Cubley prior to the implementation of dust mitigation measures) this indicates that exceedences of the air quality
objectives (applicable in England, Wales and Northern Ireland) are unlikely in the vicinity of farms which do not meet
the screening criteria in LAQM.TG(09). Therefore, the LAQM.TG(09) screening criteria have been validated by the
monitoring studies. However, as monitoring has only been undertaken at one farm which meets the screening
criteria, which consisted of an OSIRIS for three months, it is not possible to determine whether AQS objective
AECOM Review of Air Quality Impacts Resulting from Particle Emissions from Poultry Farms 19
Capabilities on project:
Environment
exceedences are likely when the screening criteria are exceeded, particularly as the results from the 2008 / 2009
survey at Cubley illustrate that exceedences can potentially occur in very close proximity to relatively small farms in
the absence of appropriate mitigation. This suggests that a revision or update of the screening criteria is
necessary, as the LAQM.TG(09) screening criteria may oblige a Detailed Assessment to be conducted when in fact
the AQS objectives are unlikely to be breached.
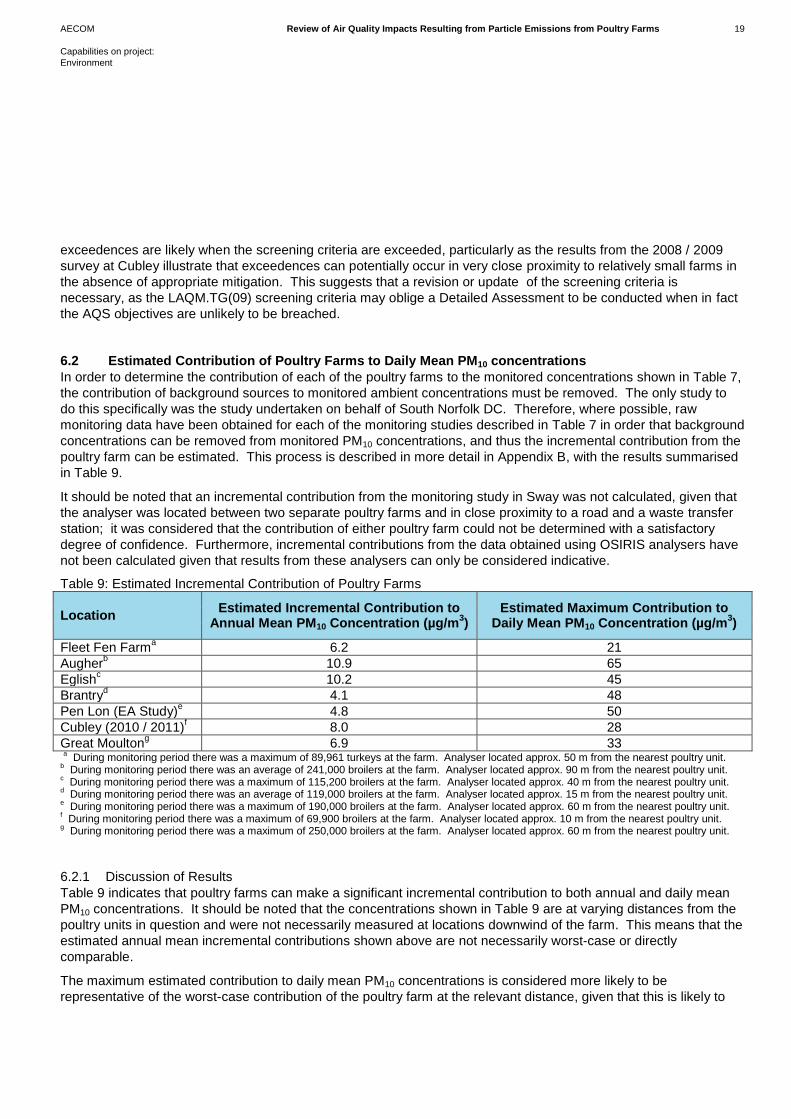
6.2 Estimated Contribution of Poultry Farms to Daily Mean PM10 concentrations
In order to determine the contribution of each of the poultry farms to the monitored concentrations shown in Table 7,
the contribution of background sources to monitored ambient concentrations must be removed. The only study to
do this specifically was the study undertaken on behalf of South Norfolk DC. Therefore, where possible, raw
monitoring data have been obtained for each of the monitoring studies described in Table 7 in order that background
concentrations can be removed from monitored PM10 concentrations, and thus the incremental contribution from the
poultry farm can be estimated. This process is described in more detail in Appendix B, with the results summarised
in Table 9.
It should be noted that an incremental contribution from the monitoring study in Sway was not calculated, given that
the analyser was located between two separate poultry farms and in close proximity to a road and a waste transfer
station; it was considered that the contribution of either poultry farm could not be determined with a satisfactory
degree of confidence. Furthermore, incremental contributions from the data obtained using OSIRIS analysers have
not been calculated given that results from these analysers can only be considered indicative.
Table 9: Estimated Incremental Contribution of Poultry Farms
Location Estimated Incremental Contribution to
Annual Mean PM10 Concentration (µg/m3)
Estimated Maximum Contribution to Daily Mean PM10 Concentration (µg/m
3)
Fleet Fen Farma 6.2 21
Augherb 10.9 65
Eglishc 10.2 45
Brantryd 4.1 48
Pen Lon (EA Study)e 4.8 50
Cubley (2010 / 2011)f 8.0 28
Great Moultong 6.9 33
a During monitoring period there was a maximum of 89,961 turkeys at the farm. Analyser located approx. 50 m from the nearest poultry unit.
b During monitoring period there was an average of 241,000 broilers at the farm. Analyser located approx. 90 m from the nearest poultry unit.
c During monitoring period there was a maximum of 115,200 broilers at the farm. Analyser located approx. 40 m from the nearest poultry unit.
d During monitoring period there was an average of 119,000 broilers at the farm. Analyser located approx. 15 m from the nearest poultry unit.
e During monitoring period there was a maximum of 190,000 broilers at the farm. Analyser located approx. 60 m from the nearest poultry unit.
f During monitoring period there was a maximum of 69,900 broilers at the farm. Analyser located approx. 10 m from the nearest poultry unit.
g During monitoring period there was a maximum of 250,000 broilers at the farm. Analyser located approx. 60 m from the nearest poultry unit.
6.2.1 Discussion of Results
Table 9 indicates that poultry farms can make a significant incremental contribution to both annual and daily mean
PM10 concentrations. It should be noted that the concentrations shown in Table 9 are at varying distances from the
poultry units in question and were not necessarily measured at locations downwind of the farm. This means that the
estimated annual mean incremental contributions shown above are not necessarily worst-case or directly
comparable.
The maximum estimated contribution to daily mean PM10 concentrations is considered more likely to be
representative of the worst-case contribution of the poultry farm at the relevant distance, given that this is likely to

AECOM Review of Air Quality Impacts Resulting from Particle Emissions from Poultry Farms 20
Capabilities on project:
Environment
have occurred when the analyser was downwind of the poultry farm. This is evidenced by the maximum monitored
concentrations at Pen Lon, South Holland, Brantry and Cubley, which all occurred when the analyser was downwind
of the poultry farm. This parameter is therefore considered a more reliable measure of the potential worst-case
contribution of poultry farms than the annual mean PM10 contributions shown in Table 9.
It should be noted that, as is evidenced in Figures 16, 17 and 18 in Appendix B, PM10 concentrations in the vicinity
of poultry farms can be significantly affected by other activities at the farm, in particular the removal of birds from the
poultry units. This process only occurs on a relatively infrequent basis at the end of each rearing cycle (i.e.
approximately every 40 days), meaning that these maximum contributions are likely to occur infrequently.
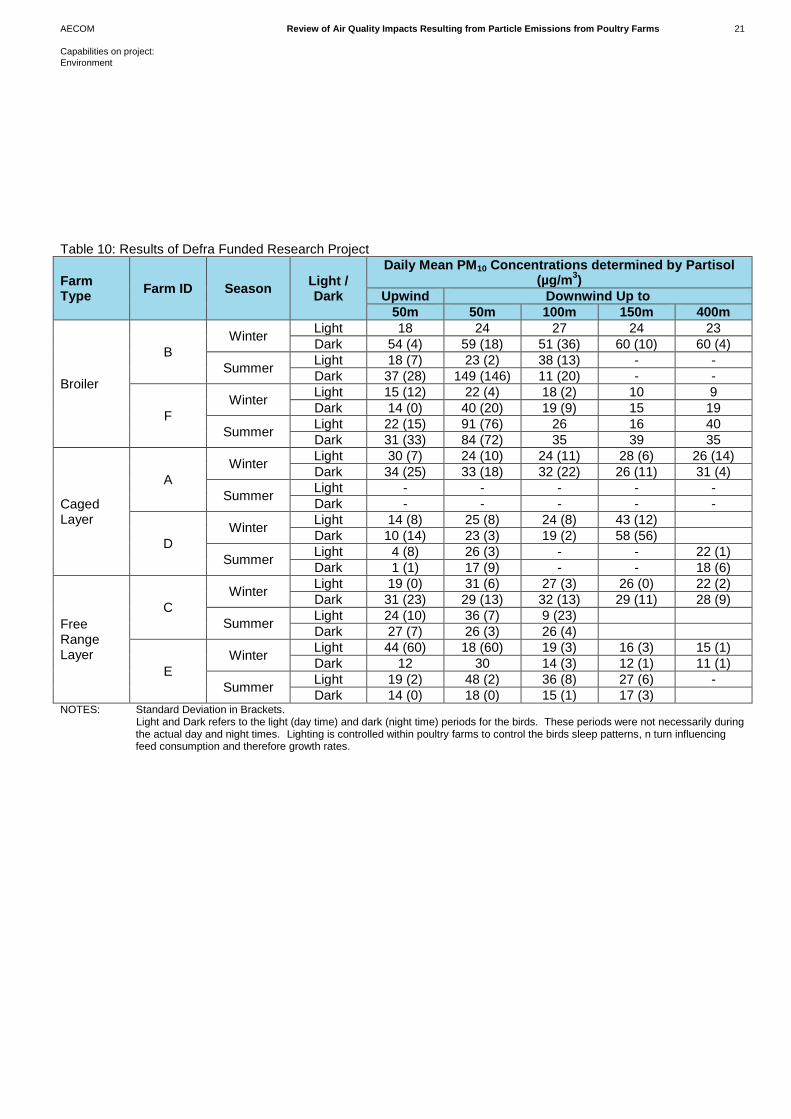
6.3 Defra Funded Research Project
A recent research project undertaken on behalf of Defra38
aimed to characterise poultry dust, quantify emission
levels, review emission abatement techniques and assess the potential impact on human health. During the study a
total of eight poultry farms (two broiler, two caged layer, two free range layer and two broiler farms fitted with
abatement techniques) were visited twice (summer and winter).
The monitoring results shown in Table 10 were obtained using static Partisol samplers located ‘upwind’ and at
various distances ‘downwind’ of the poultry farms, although these measurements were made over a period of only
two to three days during each farm visit. The report therefore states that “the particulates data in this study provide
a snapshot of conditions in the vicinity of poultry houses and should be viewed in this context”. This statement is
reinforced by the high variability of these measurements, illustrated by the high standard deviation of the
measurements.
The monitoring undertaken at the broiler farms was timed so that the broilers were between 25-30 days old at the
start of the monitoring, so that the birds were large enough to be a representative sample, whilst avoiding thinning
events (usually at 32 days of age), i.e. when dust concentrations were expected to be at or near peak.
Whilst the results in Table 10 cannot be compared directly to AQS objectives because of the limited duration of the
monitoring, comparison of the measurements upwind and downwind of the respective farms suggests that PM10
concentrations were elevated in the vicinity of the poultry farms, particularly up to 50 metres downwind. To illustrate
this point, the contribution of the different poultry farms to monitored daily mean PM10 concentrations have been
estimated by subtracting the daily mean PM10 concentrations measured upwind of each farm, from those measured
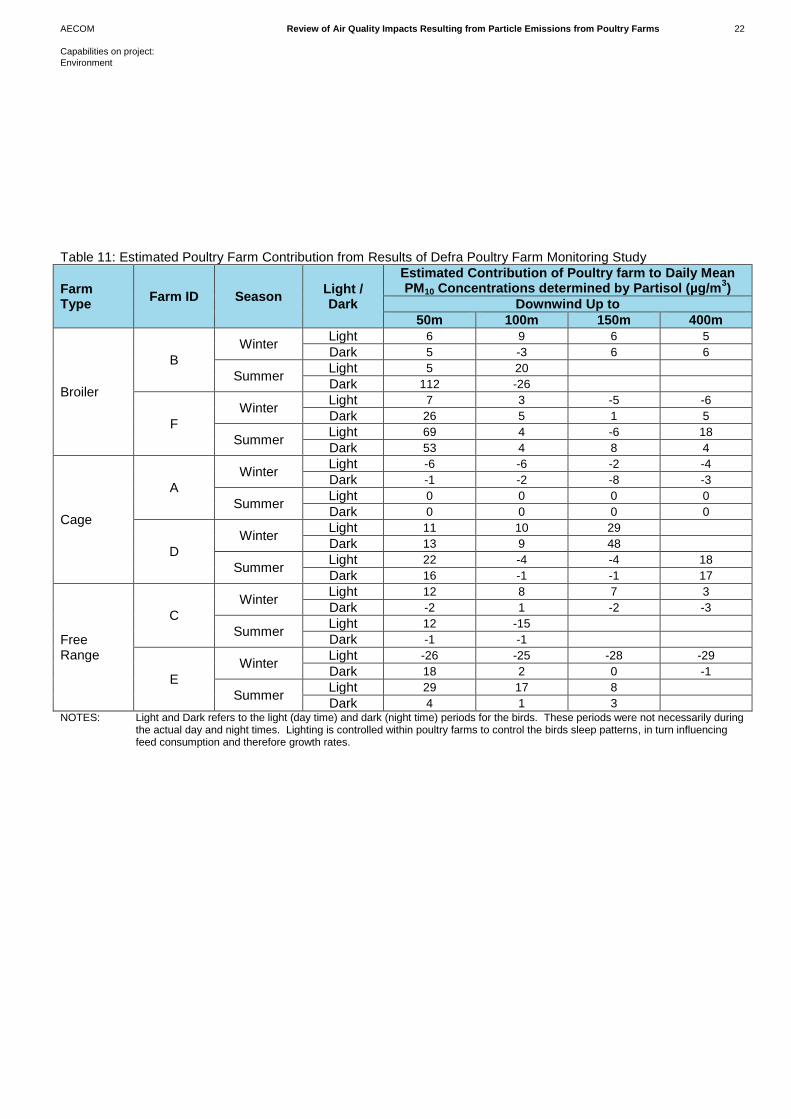
downwind, as shown in Table 11.
Table 11 suggests that the contribution of poultry farms to daily mean PM10 can be significant, particularly in close proximity to the farms. The majority of the measured concentrations in Table 11 are likely to be worst-case, given that the monitoring was undertaken downwind of the farms and during the periods when dust emissions were expected to be highest. The negative values in Table 11 highlight the difficulty in separating the contribution from the poultry farms from total monitored concentrations, and suggest that either that the ‘downwind’ monitors were not always downwind of the farms and/or that some of the upwind monitors were affected by emissions from other sources.
AECOM Review of Air Quality Impacts Resulting from Particle Emissions from Poultry Farms 21
Capabilities on project:
Environment
Table 10: Results of Defra Funded Research Project
Farm Type
Farm ID Season Light / Dark
Daily Mean PM10 Concentrations determined by Partisol (µg/m
3)
Upwind Downwind Up to
50m 50m 100m 150m 400m
Broiler
B
Winter Light 18 24 27 24 23
Dark 54 (4) 59 (18) 51 (36) 60 (10) 60 (4)
Summer Light 18 (7) 23 (2) 38 (13) - -
Dark 37 (28) 149 (146) 11 (20) - -
F
Winter Light 15 (12) 22 (4) 18 (2) 10 9
Dark 14 (0) 40 (20) 19 (9) 15 19
Summer Light 22 (15) 91 (76) 26 16 40
Dark 31 (33) 84 (72) 35 39 35
Caged Layer
A
Winter Light 30 (7) 24 (10) 24 (11) 28 (6) 26 (14)
Dark 34 (25) 33 (18) 32 (22) 26 (11) 31 (4)
Summer Light - - - - -
Dark - - - - -
D
Winter Light 14 (8) 25 (8) 24 (8) 43 (12)
Dark 10 (14) 23 (3) 19 (2) 58 (56)
Summer Light 4 (8) 26 (3) - - 22 (1)
Dark 1 (1) 17 (9) - - 18 (6)
Free Range Layer
C
Winter Light 19 (0) 31 (6) 27 (3) 26 (0) 22 (2)
Dark 31 (23) 29 (13) 32 (13) 29 (11) 28 (9)
Summer Light 24 (10) 36 (7) 9 (23)
Dark 27 (7) 26 (3) 26 (4)
E
Winter Light 44 (60) 18 (60) 19 (3) 16 (3) 15 (1)
Dark 12 30 14 (3) 12 (1) 11 (1)
Summer Light 19 (2) 48 (2) 36 (8) 27 (6) -
Dark 14 (0) 18 (0) 15 (1) 17 (3) NOTES: Standard Deviation in Brackets.
Light and Dark refers to the light (day time) and dark (night time) periods for the birds. These periods were not necessarily during the actual day and night times. Lighting is controlled within poultry farms to control the birds sleep patterns, n turn influencing feed consumption and therefore growth rates.
AECOM Review of Air Quality Impacts Resulting from Particle Emissions from Poultry Farms 22
Capabilities on project:
Environment
Table 11: Estimated Poultry Farm Contribution from Results of Defra Poultry Farm Monitoring Study
Farm Type
Farm ID Season Light / Dark
Estimated Contribution of Poultry farm to Daily Mean PM10 Concentrations determined by Partisol (µg/m
3)
Downwind Up to
50m 100m 150m 400m
Broiler
B
Winter Light 6 9 6 5
Dark 5 -3 6 6
Summer Light 5 20
Dark 112 -26
F
Winter Light 7 3 -5 -6
Dark 26 5 1 5
Summer Light 69 4 -6 18
Dark 53 4 8 4
Cage
A
Winter Light -6 -6 -2 -4
Dark -1 -2 -8 -3
Summer Light 0 0 0 0
Dark 0 0 0 0
D
Winter Light 11 10 29
Dark 13 9 48
Summer Light 22 -4 -4 18
Dark 16 -1 -1 17
Free Range
C
Winter Light 12 8 7 3
Dark -2 1 -2 -3
Summer Light 12 -15
Dark -1 -1
E
Winter Light -26 -25 -28 -29
Dark 18 2 0 -1
Summer Light 29 17 8
Dark 4 1 3 NOTES: Light and Dark refers to the light (day time) and dark (night time) periods for the birds. These periods were not necessarily during
the actual day and night times. Lighting is controlled within poultry farms to control the birds sleep patterns, in turn influencing feed consumption and therefore growth rates.
AECOM Review of Air Quality Impacts Resulting from Particle Emissions from Poultry Farms 23
Capabilities on project:
Environment
Numerous emission factors have been proposed (or derived) in an attempt to estimate PM10 emissions from poultry farms. A selection of these emissions factors are summarised below including those emission factors derived from monitoring studies, and those proposed for emission inventory purposes.
7.1 Emission Factors Derived from Monitoring Studies
A number of monitoring studies have been undertaken in an attempt to determine particulate emission rates from
poultry farms. For these emissions data to be of practical use, the emission rates have been reported as a rate of
emission per livestock unit (LU), thereby enabling the emissions from one poultry operation to be correlated to
another poultry operation. Roumeliotis and Van Heyst undertook a review of emission factors in 200839
which was
summarised in a recent study undertaken on behalf of Defra, along with the results of the Defra-funded research
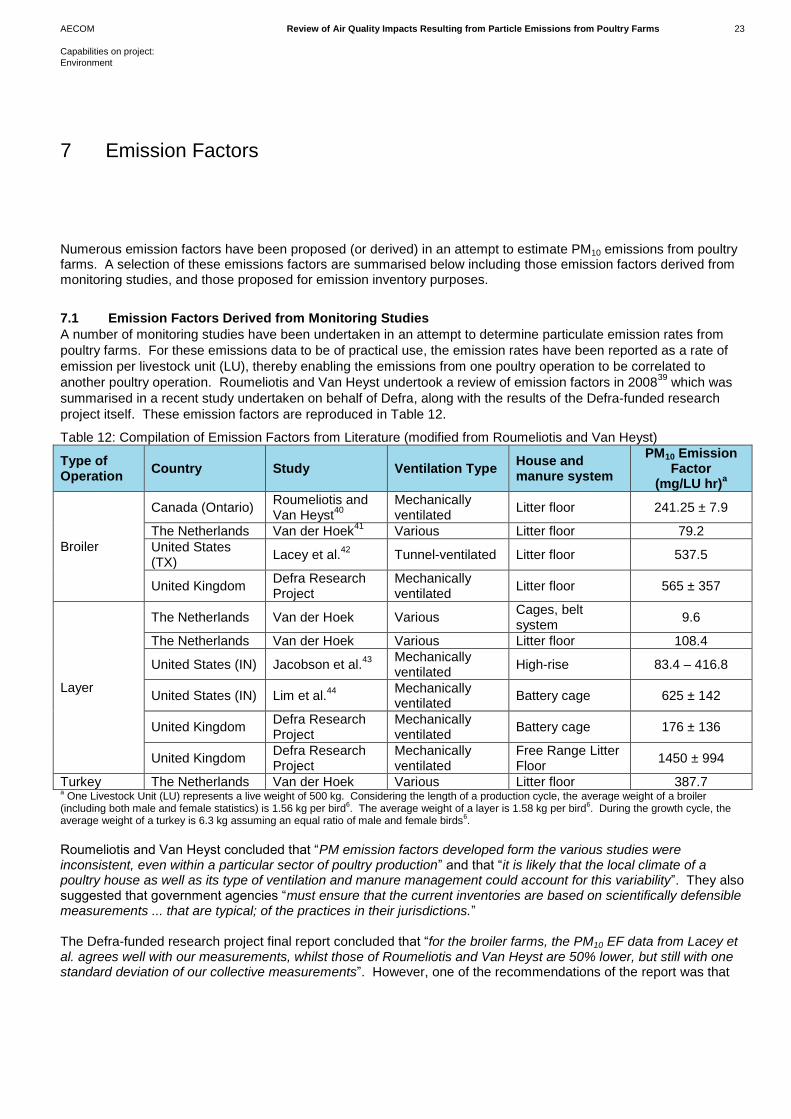
project itself. These emission factors are reproduced in Table 12.
Table 12: Compilation of Emission Factors from Literature (modified from Roumeliotis and Van Heyst)
Type of Operation
Country Study Ventilation Type House and manure system
PM10 Emission Factor
(mg/LU hr)a
Broiler
Canada (Ontario) Roumeliotis and Van Heyst
40
Mechanically ventilated
Litter floor 241.25 ± 7.9
The Netherlands Van der Hoek41
Various Litter floor 79.2
United States (TX)
Lacey et al.42
Tunnel-ventilated Litter floor 537.5
United Kingdom Defra Research Project
Mechanically ventilated
Litter floor 565 ± 357
Layer
The Netherlands Van der Hoek Various Cages, belt system
9.6
The Netherlands Van der Hoek Various Litter floor 108.4
United States (IN) Jacobson et al.43
Mechanically ventilated
High-rise 83.4 – 416.8
United States (IN) Lim et al.44
Mechanically ventilated
Battery cage 625 ± 142
United Kingdom Defra Research Project
Mechanically ventilated
Battery cage 176 ± 136
United Kingdom Defra Research Project
Mechanically ventilated
Free Range Litter Floor
1450 ± 994
Turkey The Netherlands Van der Hoek Various Litter floor 387.7 a One Livestock Unit (LU) represents a live weight of 500 kg. Considering the length of a production cycle, the average weight of a broiler
(including both male and female statistics) is 1.56 kg per bird6. The average weight of a layer is 1.58 kg per bird
6. During the growth cycle, the
average weight of a turkey is 6.3 kg assuming an equal ratio of male and female birds6.
Roumeliotis and Van Heyst concluded that “PM emission factors developed form the various studies were inconsistent, even within a particular sector of poultry production” and that “it is likely that the local climate of a poultry house as well as its type of ventilation and manure management could account for this variability”. They also suggested that government agencies “must ensure that the current inventories are based on scientifically defensible measurements ... that are typical; of the practices in their jurisdictions.” The Defra-funded research project final report concluded that “for the broiler farms, the PM10 EF data from Lacey et al. agrees well with our measurements, whilst those of Roumeliotis and Van Heyst are 50% lower, but still with one standard deviation of our collective measurements”. However, one of the recommendations of the report was that
7 Emission Factors
AECOM Review of Air Quality Impacts Resulting from Particle Emissions from Poultry Farms 24
Capabilities on project:
Environment
“given the high variability of the measured PM2.5 and PM10 emission factors in this work, a further program of measurements (less detailed) should be undertaken to improve the certainty of the data.”
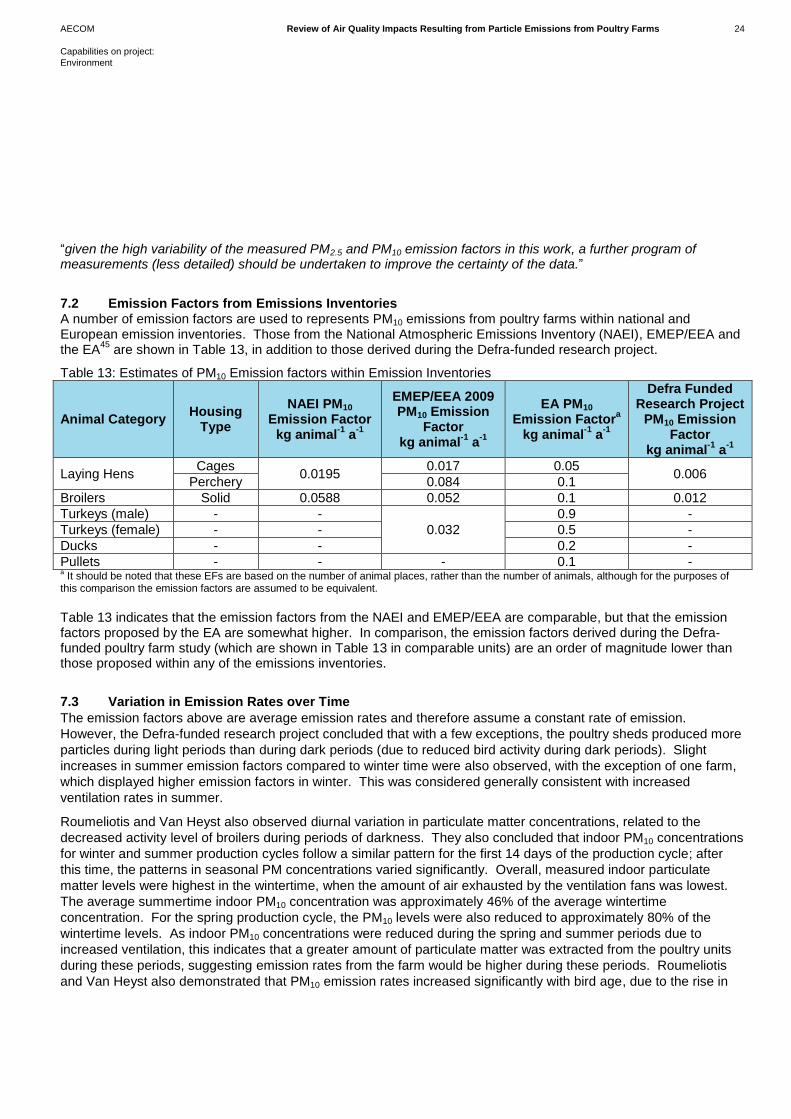
7.2 Emission Factors from Emissions Inventories A number of emission factors are used to represents PM10 emissions from poultry farms within national and European emission inventories. Those from the National Atmospheric Emissions Inventory (NAEI), EMEP/EEA and the EA
45 are shown in Table 13, in addition to those derived during the Defra-funded research project.
Table 13: Estimates of PM10 Emission factors within Emission Inventories
Animal Category Housing
Type
NAEI PM10 Emission Factor
kg animal-1
a-1
EMEP/EEA 2009 PM10 Emission
Factor kg animal
-1 a
-1
EA PM10 Emission Factor
a
kg animal-1
a-1
Defra Funded Research Project
PM10 Emission Factor
kg animal-1
a-1
Laying Hens Cages
0.0195 0.017 0.05
0.006 Perchery 0.084 0.1
Broilers Solid 0.0588 0.052 0.1 0.012
Turkeys (male) - -
0.032
0.9 -
Turkeys (female) - - 0.5 -
Ducks - - 0.2 -
Pullets - - - 0.1 - a It should be noted that these EFs are based on the number of animal places, rather than the number of animals, although for the purposes of
this comparison the emission factors are assumed to be equivalent.
Table 13 indicates that the emission factors from the NAEI and EMEP/EEA are comparable, but that the emission factors proposed by the EA are somewhat higher. In comparison, the emission factors derived during the Defra-funded poultry farm study (which are shown in Table 13 in comparable units) are an order of magnitude lower than those proposed within any of the emissions inventories.
7.3 Variation in Emission Rates over Time
The emission factors above are average emission rates and therefore assume a constant rate of emission.
However, the Defra-funded research project concluded that with a few exceptions, the poultry sheds produced more
particles during light periods than during dark periods (due to reduced bird activity during dark periods). Slight
increases in summer emission factors compared to winter time were also observed, with the exception of one farm,
which displayed higher emission factors in winter. This was considered generally consistent with increased
ventilation rates in summer.
Roumeliotis and Van Heyst also observed diurnal variation in particulate matter concentrations, related to the
decreased activity level of broilers during periods of darkness. They also concluded that indoor PM10 concentrations
for winter and summer production cycles follow a similar pattern for the first 14 days of the production cycle; after
this time, the patterns in seasonal PM concentrations varied significantly. Overall, measured indoor particulate
matter levels were highest in the wintertime, when the amount of air exhausted by the ventilation fans was lowest.
The average summertime indoor PM10 concentration was approximately 46% of the average wintertime
concentration. For the spring production cycle, the PM10 levels were also reduced to approximately 80% of the
wintertime levels. As indoor PM10 concentrations were reduced during the spring and summer periods due to
increased ventilation, this indicates that a greater amount of particulate matter was extracted from the poultry units
during these periods, suggesting emission rates from the farm would be higher during these periods. Roumeliotis
and Van Heyst also demonstrated that PM10 emission rates increased significantly with bird age, due to the rise in
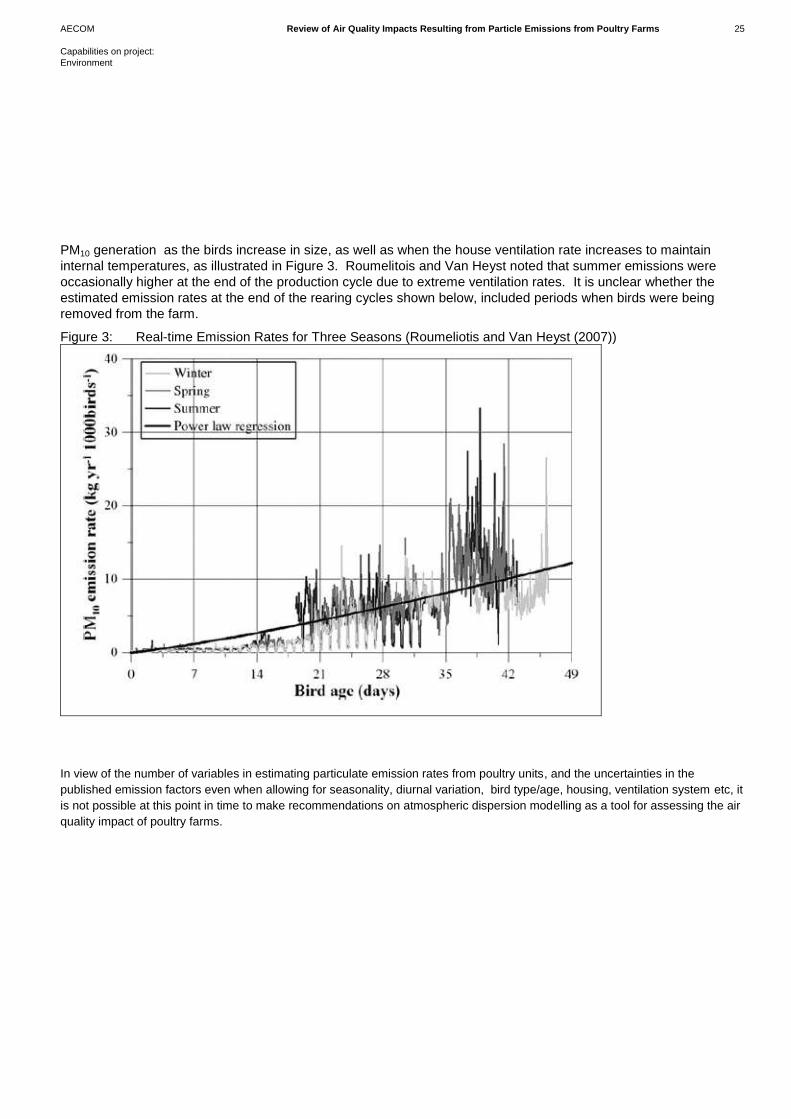
AECOM Review of Air Quality Impacts Resulting from Particle Emissions from Poultry Farms 25
Capabilities on project:
Environment
PM10 generation as the birds increase in size, as well as when the house ventilation rate increases to maintain
internal temperatures, as illustrated in Figure 3. Roumelitois and Van Heyst noted that summer emissions were
occasionally higher at the end of the production cycle due to extreme ventilation rates. It is unclear whether the
estimated emission rates at the end of the rearing cycles shown below, included periods when birds were being
removed from the farm.
Figure 3: Real-time Emission Rates for Three Seasons (Roumeliotis and Van Heyst (2007))
In view of the number of variables in estimating particulate emission rates from poultry units, and the uncertainties in the
published emission factors even when allowing for seasonality, diurnal variation, bird type/age, housing, ventilation system etc, it
is not possible at this point in time to make recommendations on atmospheric dispersion modelling as a tool for assessing the air
quality impact of poultry farms.
AECOM Review of Air Quality Impacts Resulting from Particle Emissions from Poultry Farms 26
Capabilities on project:
Environment
The objectives of this study were as follows:
- To review the evidence on which the existing screening criteria for the assessment of poultry farms were based; - To assess further evidence on the impacts of poultry farms on PM10 concentrations provided by additional
monitoring studies; and - To make recommendations for updated guidance to local authorities (where possible and necessary), based on
the results of these additional studies.
8.1 Origins and Suitability of LAQM.TG(09) Screening Criteria
The poultry farm screening criteria in LAQM.TG(09) were developed based on the limited monitoring data available
at the time. It is clear that they comprised a rough estimate based on the size and type of installation and the
proximity of residential exposure, which was proposed to identify those local authorities where particulate emissions
from poultry farms had the potential to be significant. The intention was that those locations of greatest concern
would subsequently be investigated in more detail to obtain more information.
The results of the monitoring studies undertaken in the proximity of poultry farms to date suggest that exceedences
of the air quality objectives for PM10 (applicable in England, Wales and Northern Ireland) are unlikely at farms below
the screening criteria in LAQM.TG(09). Therefore, the LAQM.TG(09) criteria have been validated.
However, the LAQM.TG(09) criteria may be too conservative, indicating the need for a Detailed Assessment when
in fact the likelihood of breaches of the AQS objectives is very low. For this reason, a revision/update to the
screening criteria would be helpful for LAQM, based on the new data provided by the more recent monitoring
studies.
The monitoring results also suggests that exceedences of the AQS objectives for PM10 which are applicable in
Scotland are possible. However, it should be noted that none of the monitoring studies were undertaken in
Scotland and therefore the results obtained may not be representative of conditions in Scotland.
8.2 Further Evidence Provided By Recent Studies
The LAQM monitoring studies undertaken to date, and those undertaken by the EA, demonstrate that exceedences
of the annual mean AQS objective for PM10 (applicable in England, Wales and Northern Ireland) in the vicinity of
poultry farms are unlikely, but that poultry farms have the potential to have a significant effect on daily mean PM10
concentrations. The potential effect of poultry farms on daily mean PM10 concentrations has therefore been the
focus of additional analysis.
Only one study (undertaken on behalf of South Holland DC), specifically estimated the contribution of the poultry
farm to daily mean PM10 concentrations, by subtracting background measurements made elsewhere from monitored
concentrations. The maximum measured incremental contribution from the farm to daily mean concentrations was
subsequently used to estimate the maximum number of days > 50 ug/m3 which could occur, based on monitored
background concentrations over the course of the year. This methodology is considered to be a suitable approach
to estimate the likely maximum effect of a poultry farm on daily mean PM10 concentrations.
The maximum incremental contribution to daily mean PM10 concentrations measured during each monitoring study
was therefore estimated, where raw data could be obtained, by subtracting measured local background
concentrations from monitored daily mean PM10 concentrations. An attempt has subsequently been made to infer a
relationship between maximum (i.e. 100th percentile) estimated daily mean PM10 concentrations and distance (from
source to monitor), by normalising monitored concentrations against the number of birds on each farm. Figure 4
below illustrates the results of this process for the Eglish, Brantry, Pen Lon, Cubley and Great Moulton broiler farms.
The results from the Augher and Fleet Fen farms are included in Figure 4 for information purposes, but have not
8 Discussion and Conclusions

AECOM Review of Air Quality Impacts Resulting from Particle Emissions from Poultry Farms 27
Capabilities on project:
Environment
been used to develop the inferred relationship as Augher is considered to be an outlier and Fleet Fen is a turkey
farm.
Figure 4: Relationship between Maximum Estimated Incremental Contribution to Daily Mean PM10 and Distance
Figure 4 suggests that the maximum estimated incremental contribution to daily mean PM10 concentrations per bird
tends to decrease with distance and that a good relationship can be fitted between the majority of data points
(excluding the results at Augher). Additional monitoring data (if they can be obtained by future monitoring studies),
particularly at farms in excess of the screening criteria in LAQM.TG(09) would lead to greater confidence in the
trend established. As evidenced by the results at the Augher farm, there will not to be a direct correlation between
maximum daily mean PM10 concentrations and distance in all instances. These discrepancies are thought likely to
be as a result of activities and management processes employed the farms, which, as described in this report, can
significantly affect PM10 concentrations.
Fleet Fen is a turkey farm. If the number of birds on the farm is multiplied by 1.5 to account for the turkey’s larger
size, the data from this farm also fit the relationship.
The relationship described above can be used to estimate the maximum (i.e. 100th percentile) incremental
contribution to daily mean PM10 concentrations (MD) for a given number of broilers (b) at a given distance (d) using
the following formula:
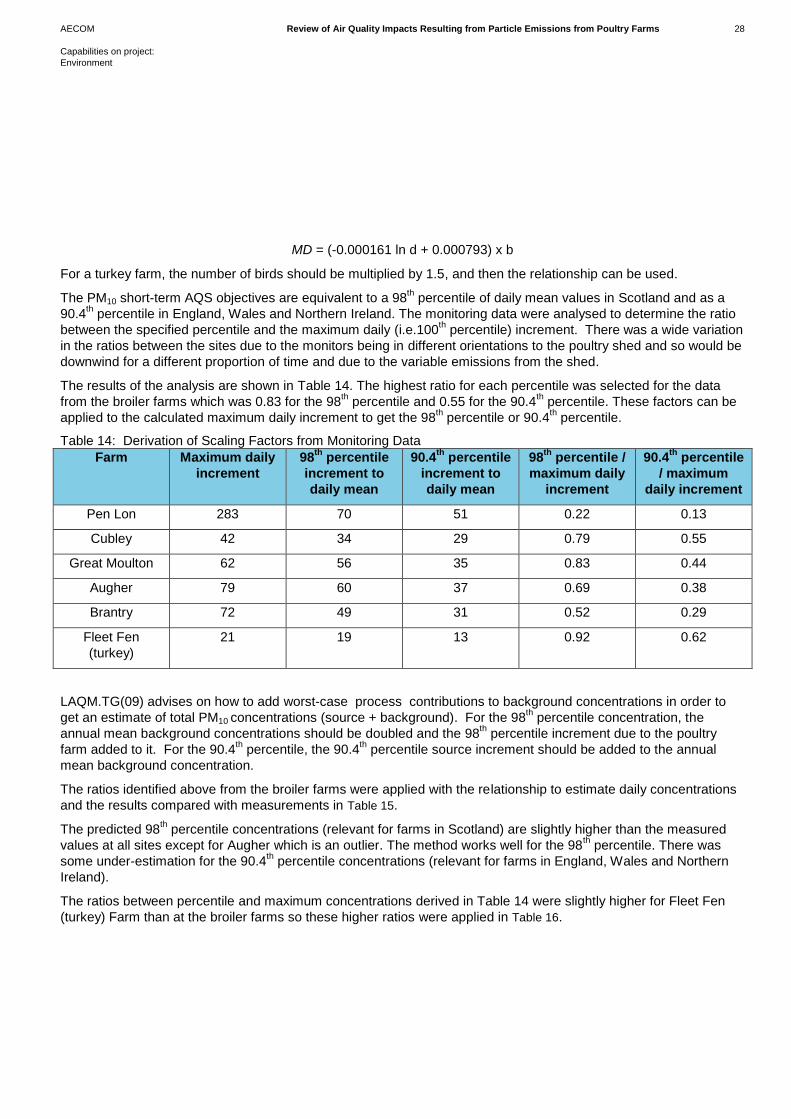
AECOM Review of Air Quality Impacts Resulting from Particle Emissions from Poultry Farms 28
Capabilities on project:
Environment
MD = (-0.000161 ln d + 0.000793) x b
For a turkey farm, the number of birds should be multiplied by 1.5, and then the relationship can be used.
The PM10 short-term AQS objectives are equivalent to a 98th percentile of daily mean values in Scotland and as a
90.4th percentile in England, Wales and Northern Ireland. The monitoring data were analysed to determine the ratio
between the specified percentile and the maximum daily (i.e.100th percentile) increment. There was a wide variation
in the ratios between the sites due to the monitors being in different orientations to the poultry shed and so would be
downwind for a different proportion of time and due to the variable emissions from the shed.
The results of the analysis are shown in Table 14. The highest ratio for each percentile was selected for the data
from the broiler farms which was 0.83 for the 98th percentile and 0.55 for the 90.4
th percentile. These factors can be
applied to the calculated maximum daily increment to get the 98th percentile or 90.4
th percentile.
Table 14: Derivation of Scaling Factors from Monitoring Data
Farm Maximum daily
increment
98th
percentile
increment to
daily mean
90.4th
percentile
increment to
daily mean
98th
percentile /
maximum daily
increment
90.4th
percentile
/ maximum
daily increment
Pen Lon 283 70 51 0.22 0.13
Cubley 42 34 29 0.79 0.55
Great Moulton 62 56 35 0.83 0.44
Augher 79 60 37 0.69 0.38
Brantry 72 49 31 0.52 0.29
Fleet Fen
(turkey)
21 19 13 0.92 0.62
LAQM.TG(09) advises on how to add worst-case process contributions to background concentrations in order to
get an estimate of total PM10 concentrations (source + background). For the 98th percentile concentration, the
annual mean background concentrations should be doubled and the 98th percentile increment due to the poultry
farm added to it. For the 90.4th percentile, the 90.4
th percentile source increment should be added to the annual
mean background concentration.
The ratios identified above from the broiler farms were applied with the relationship to estimate daily concentrations
and the results compared with measurements in Table 15.
The predicted 98th percentile concentrations (relevant for farms in Scotland) are slightly higher than the measured
values at all sites except for Augher which is an outlier. The method works well for the 98th percentile. There was
some under-estimation for the 90.4th percentile concentrations (relevant for farms in England, Wales and Northern
Ireland).
The ratios between percentile and maximum concentrations derived in Table 14 were slightly higher for Fleet Fen
(turkey) Farm than at the broiler farms so these higher ratios were applied in Table 16.
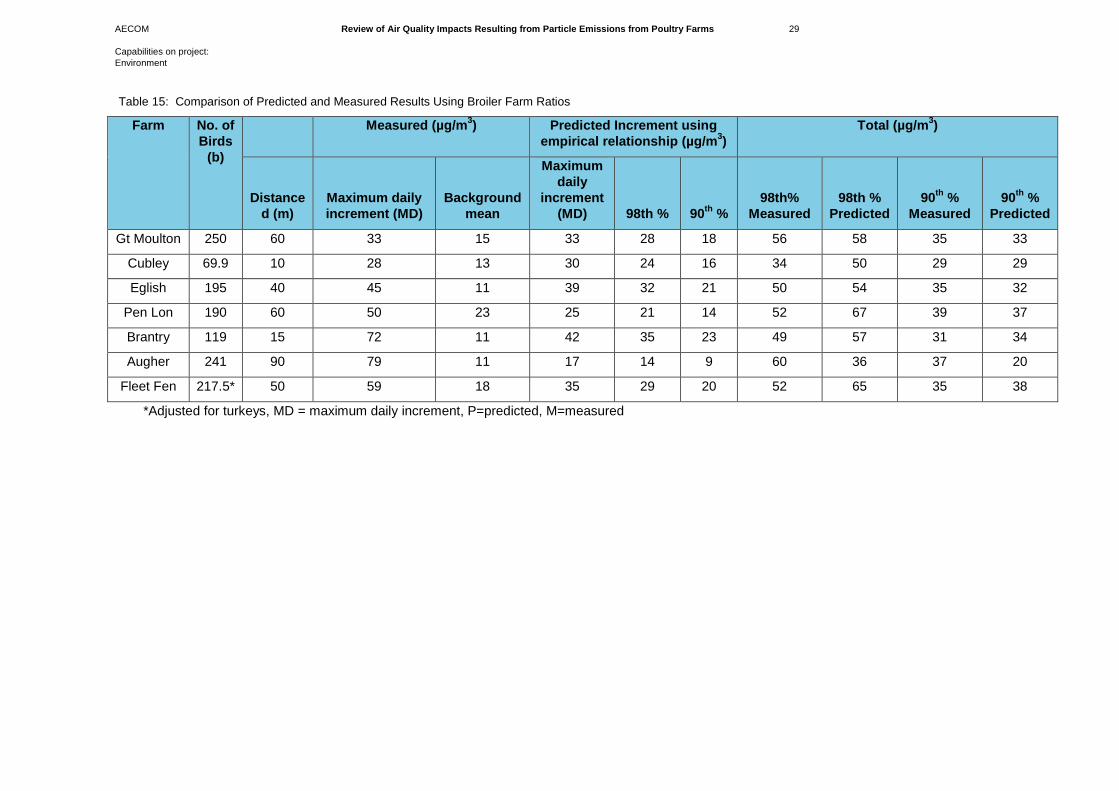
AECOM Review of Air Quality Impacts Resulting from Particle Emissions from Poultry Farms 29
Capabilities on project:
Environment
Table 15: Comparison of Predicted and Measured Results Using Broiler Farm Ratios
Farm No. of
Birds
(b)
Measured (µg/m3) Predicted Increment using
empirical relationship (µg/m3)
Total (µg/m3)
Distance
d (m)
Maximum daily
increment (MD)
Background
mean
Maximum
daily
increment
(MD) 98th % 90th
%
98th%
Measured
98th %
Predicted
90th
%
Measured
90th
%
Predicted
Gt Moulton 250 60 33 15 33 28 18 56 58 35 33
Cubley 69.9 10 28 13 30 24 16 34 50 29 29
Eglish 195 40 45 11 39 32 21 50 54 35 32
Pen Lon 190 60 50 23 25 21 14 52 67 39 37
Brantry 119 15 72 11 42 35 23 49 57 31 34
Augher 241 90 79 11 17 14 9 60 36 37 20
Fleet Fen 217.5* 50 59 18 35 29 20 52 65 35 38
*Adjusted for turkeys, MD = maximum daily increment, P=predicted, M=measured
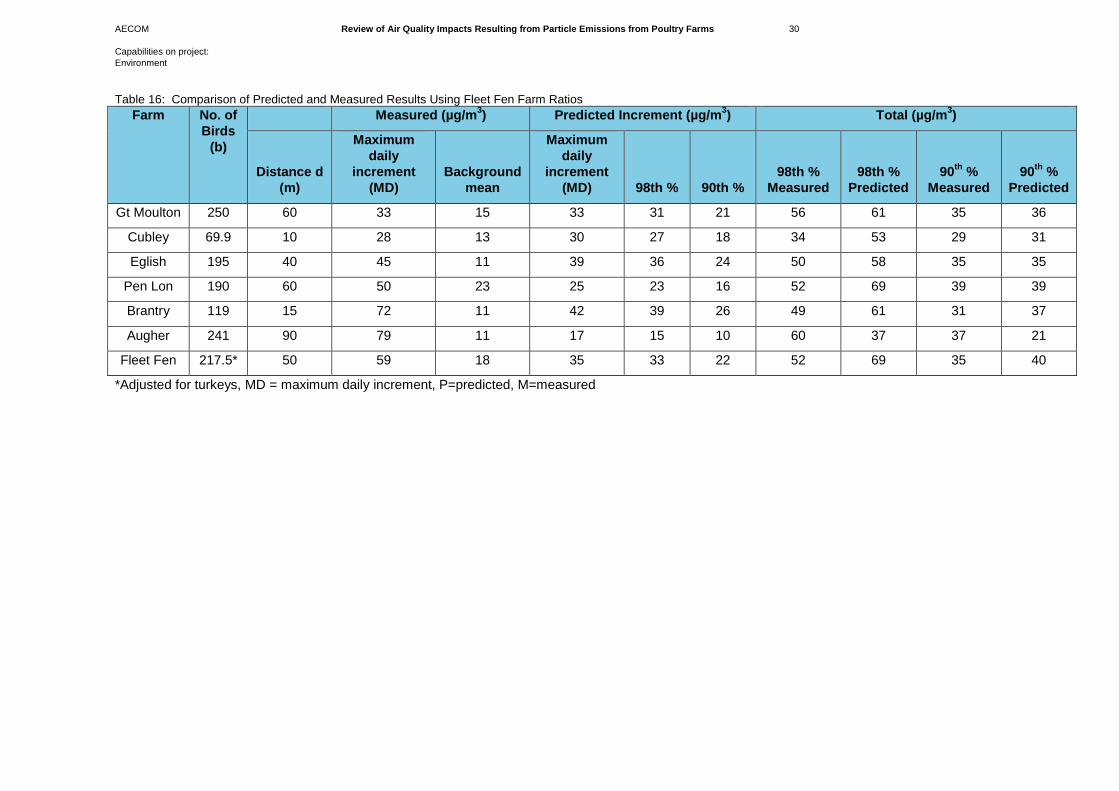
AECOM Review of Air Quality Impacts Resulting from Particle Emissions from Poultry Farms 30
Capabilities on project:
Environment
Table 16: Comparison of Predicted and Measured Results Using Fleet Fen Farm Ratios
Farm No. of
Birds
(b)
Measured (µg/m3) Predicted Increment (µg/m
3) Total (µg/m
3)
Distance d
(m)
Maximum
daily
increment
(MD)
Background
mean
Maximum
daily
increment
(MD) 98th % 90th %
98th %
Measured
98th %
Predicted
90th
%
Measured
90th
%
Predicted
Gt Moulton 250 60 33 15 33 31 21 56 61 35 36
Cubley 69.9 10 28 13 30 27 18 34 53 29 31
Eglish 195 40 45 11 39 36 24 50 58 35 35
Pen Lon 190 60 50 23 25 23 16 52 69 39 39
Brantry 119 15 72 11 42 39 26 49 61 31 37
Augher 241 90 79 11 17 15 10 60 37 37 21
Fleet Fen 217.5* 50 59 18 35 33 22 52 69 35 40
*Adjusted for turkeys, MD = maximum daily increment, P=predicted, M=measured
AECOM Review of Air Quality Impacts Resulting from Particle Emissions from Poultry Farms 31
Capabilities on project:
Environment
The predicted 98th percentile concentrations are higher than the measured values at all sites except for Augher
which is an outlier and higher than the values predicted using the broiler farm ratio. The predicted 90.4th percentile
concentrations are higher than the measured values at all sites except for Augher which is an outlier. The higher
(Fleet Fen) ratio works better for the 90.4th percentile predictions.
The scaling factors that should be used to adjust the maximum (100th percentile) daily increments are therefore 0.83
for the 98th percentile and 0.62 for the 90.4
th percentile.
These empirical relationships can comprise the updated screening criteria for assessing the air quality impact of
poultry farms. The results of the equations are conservative, as befits a screening tool. If the results of these new
equations indicate a breach of the relevant short-term AQO for PM10, then there is a need for a Detailed
Assessment, which should be based on ambient monitoring. If the results of the equations indicate no breach of the
relevant short-term objective for PM10, then there is no need to proceed to a Detailed Assessment.
A similar empirical relationship could not be established from estimated contributions to annual mean PM10
concentrations (of particular importance for compliance in Scotland), as there was too much scatter in the data and
no clear pattern. This may be due in part to the fact that monitoring was not undertaken downwind of the farms in all
cases. This has meant that the annual mean concentrations recorded are influenced by the location of the analyser
in relation to the fluctuating direction of prevailing winds, as well as distance.
8.3 Recommendations for updated Guidance
The key factors in determining PM10 concentrations in the vicinity of poultry farms are considered to be:
- PM10 emission rates from the poultry units (which depend on a number of factors including the number of birds, the type of bird, bird age, the building ventilation system employed and conditions and activities within the poultry unit);
- The distance between relevant exposure and the poultry units; - The location of relevant exposure/monitoring relative to the poultry units, as this determines how often the farm is
downwind; - Dispersion conditions (wind speed and stability etc.); and - Background PM10 concentrations.
It is likely that the information available to a local authority when carrying out an assessment of particulate emissions
from poultry farms would be background concentration, the location and distance of relevant exposure in relation to
the farm, and the number and type of birds at the farm. Any assessment/screening tool would therefore need to
take account of these data only.
Emission factors collected as part of a literature review vary significantly, meaning that certainty in these emission
factors is low. Whilst the emission factors determined during the research project undertaken on behalf of Defra
could be considered of greatest relevance to this study (being UK specific and having been undertaken relatively
recently), the authors of the study itself recommend that “given the high variability of the measured PM2.5 and PM10
emission factors in this work a further program of measurements (less detailed) should be undertaken to improve
the certainty of the data”. In addition, the emission factors proposed for national and European emission inventory
purposes (e.g. NAEI, EMEP/EEA) are an order of magnitude greater than those determined during the Defra study,
suggesting that if these were used, they are likely over estimate PM10 emissions.
AECOM Review of Air Quality Impacts Resulting from Particle Emissions from Poultry Farms 32
Capabilities on project:
Environment
Two research projects have demonstrated that particulate matter emissions from poultry farms vary on a diurnal
basis due to changes in bird activity, as well as seasonally and over the course of bird rearing cycles, due to
increasing bird size and ventilation rates. Furthermore, the results of the monitoring undertaken to-date indicates
that PM10 concentrations in the vicinity of poultry farms can increase significantly when birds are being removed
from the poultry farm at the end of rearing cycles. The ‘average’ emission factors described in Section 7 are
therefore considered unlikely to be representative of worst-case particulate emissions from poultry farms. It is
during periods when these worst-case emissions occur that exceedences of daily mean PM10 concentrations are
most likely.
Confidence in predicting daily mean PM10 concentrations using dispersion modelling is therefore considered
relatively low given the uncertainties described above.
A relationship has been developed between the incremental contribution of broiler farms to maximum daily mean
PM10 concentrations and distance, which can form the basis of updated guidance on the air quality assessment of
poultry farms. However, additional monitoring, particularly at farms in excess of the screening criteria in
LAQM.TG(09), is recommended in order to improve confidence in this relationship. Any additional monitoring
should include the determination of the incremental contribution of the poultry farm to annual and daily mean PM10
concentrations by the subtraction of monitored background concentrations. Additional monitoring data is also
required to further test the applicability of the empirical relationships to turkey and layer farms.
8.4 Conclusions
The conclusions of this report are summarised below:
- The existing screening criteria for poultry farms in LAQM.TG(09) were developed based on the limited amount of monitoring data available at the time. They were a rough estimate based on the size and type of installation and the proximity of residential exposure, derived primarily to determine those local authorities where impacts of particulate emissions from poultry farms had the potential to be most significant and therefore where additional assessment should be undertaken.
- - The results of monitoring studies undertaken in the proximity of poultry farms suggest that the air quality strategy
objectives for PM10 that apply in England, Wales and Northern Ireland, are unlikely to be exceeded at farms below the screening criteria in LAQM.TG(09). However, the monitoring studies also show that the existing screening criteria may be overly conservative, suggesting the need for a Detailed Assessment for certain poultry farms which would not in reality cause breaches of the AQOs for PM10. Therefore, an empirical relationship has been established which provides updated/further screening of short-term PM10 impacts.
- - The monitoring studies indicate that poultry farms have the potential to have a significant effect on daily mean
PM10 concentrations, suggesting that exceedences of the AQS daily mean objective that applies in England, Wales and Northern Ireland (equivalent to a 90.4
th percentile), could potentially occur in close proximity to large
poultry farms. - - The monitoring results also suggests that exceedences of the air quality objectives for PM10 that apply in Scotland
(equivalent to a 98th percentile), which are considerably more stringent than those which apply in the rest of the
UK, have the potential to occur. However, none of the monitoring studies were undertaken in Scotland specifically and therefore the results obtained may not be representative of conditions in Scotland.
- - Emission factors identified as part of a literature review vary significantly, meaning that certainty in these emission
factors is low. Furthermore, it has been demonstrated that particulate emissions from poultry farms vary on a diurnal basis due to changes in bird activity, as well as seasonally and over the course of bird rearing cycles, due
AECOM Review of Air Quality Impacts Resulting from Particle Emissions from Poultry Farms 33
Capabilities on project:
Environment
to increasing bird size and ventilation rates. In addition, the results of the monitoring undertaken to date indicate that PM10 concentrations in the vicinity of poultry farms can increase significantly when birds are being removed from the poultry farm at the end of rearing cycles. The ‘average’ emission factors described in Section 7 are therefore considered unlikely to be representative of worst-case particulate emissions from poultry farms. As it is during periods when these worst-case emissions occur that exceedences of daily mean PM10 concentrations are most likely to be observed, this suggests that dispersion modelling of particulate emissions from poultry farms based on ‘average’ emission factors is unlikely to result in accurately predict maximum daily mean PM10 concentrations.
- - The maximum incremental contribution to daily mean PM10 concentrations measured during each monitoring
study was subsequently estimated by subtracting measured background concentrations from monitored daily mean PM10 concentrations. A relationship was then established, for mechanically ventilated broiler farms, between maximum (100
th percentile) estimated daily mean PM10 concentrations and distance, by normalising
maximum estimated daily mean PM10 concentrations against the number of broilers on each farm. The relationship derived can therefore be used to estimate the maximum incremental contribution to daily mean PM10 concentrations (MD) for a given number of birds(b) at a given distance (d) using the following formula:
MD =( -0.000161 ln d + 0.000793) x b
- It can also be applied for turkey farms if the number of birds is multiplied by 1.5 to account for their larger size. The 98
th and 90.4
th percentile contributions from the poultry farm should be estimated by scaling the maximum
increment by factors of 0.83 and 0.62 respectively. - This value can then be added to the annual mean background concentration for the 90.4
th percentile (applicable
in England, Wales and Northern Ireland), or twice the annual mean for the 98th percentile (applicable in Scotland)
, to estimate the total percentile concentration. This estimate is likely to be worst-case, and so can be used as an updated screening tool.
- - A similar empirical relationship could not be established from derived estimated contributions to annual mean
PM10 concentrations; the annual mean concentrations recorded are influenced by the location of the analyser in relation to the direction of prevailing winds, as well as distance. The annual mean contributions estimated for each farm are therefore not directly comparable.
-
- Additional monitoring, particularly at farms in excess of the screening criteria in LAQM.TG(09), is recommended in order to test, and improve confidence in, the empirical relationship which comprises the updated screening tool. Any additional monitoring should include the determination of the incremental contribution of the poultry farm to annual and daily mean PM10 concentrations by the subtraction of monitored background concentrations. Additional monitoring data is also required to verify or improve similar relationships for turkey, goose and layer farms.
AECOM Review of Air Quality Impacts Resulting from Particle Emissions from Poultry Farms 34
Capabilities on project:
Environment
New Forest DC
AEA installed an air quality monitoring station to measure PM10 concentrations at a relevant location near to the two
poultry farms on Pitmore Lane. The monitor was located in the garden of a residential property (Green Pastures)
between Pitmore Farm, Matford Farm, and Ambervale Waste Transfer station and was approximately 100 m north-
east of the poultry sheds at Pitmore Farm, 100 m north-west of the poultry sheds at Matford Farm, and 100 m south
west of Ambervale Waste Transfer Station.
The monitor measured PM10 concentrations by beta-attenuation. The air quality objectives relate to PM10
concentrations measured by gravimetric device. The unheated Met-One Beta Attenuation Monitor (BAM) meets the
gravimetric equivalence criteria with a correction factor for the gradient, i.e. results should be divided by a factor of
1.21 when the flow is measured at standard temperature and pressure conditions. The results reported here include
the correction factor.
The monitor operated from 9 June 2010 to 9 November 2010. Defra’s Technical Guidance recommends that ideally
monitoring should be carried out for a period of at least 12 months. It recommends that where this is not possible,
measurements should be carried out over the period when emissions are likely to be highest. The 5-month
monitoring period includes the driest summer months and so it is expected that it covers the period when emissions
are likely to be highest. The production period for broiler chickens is approximately 50 days (including the time taken
to clean and restock the sheds). The monitoring period thus includes three cycles of production. Table 17
summarises the monitoring results.
Table 17: Monitoring results from the Green Pastures monitor
Statistic PM10
Maximum hourly mean 456 μg m-3
Maximum daily mean 55 μg m-3
Number of days when daily mean exceeded 50 μg m-3
1
Average 24.1 μg m-3
Data capture 94.0 %
Figure 5 shows the hourly mean concentrations (corrected BAM, gravimetric equivalent) measured throughout the
period. The plot shows that relatively high hourly mean concentrations in excess of 150 μg m-3
were measured on
several occasions throughout the summer. However, the daily mean concentration only exceeded 50 μg m-3
(gravimetric) on one day (8th October 2010). It is thus likely that the air quality objective of less than 35 exceedence
days in a year would be met at the monitoring site. The period average concentration of 24.1 μg m-3
was
substantially smaller than the annual mean objective of 40 μg m-3
. It is therefore likely that the annual mean
objective would be met as the contribution from the poultry farms would be lower in the winter months.
Appendix A: Poultry Farm Monitoring Studies
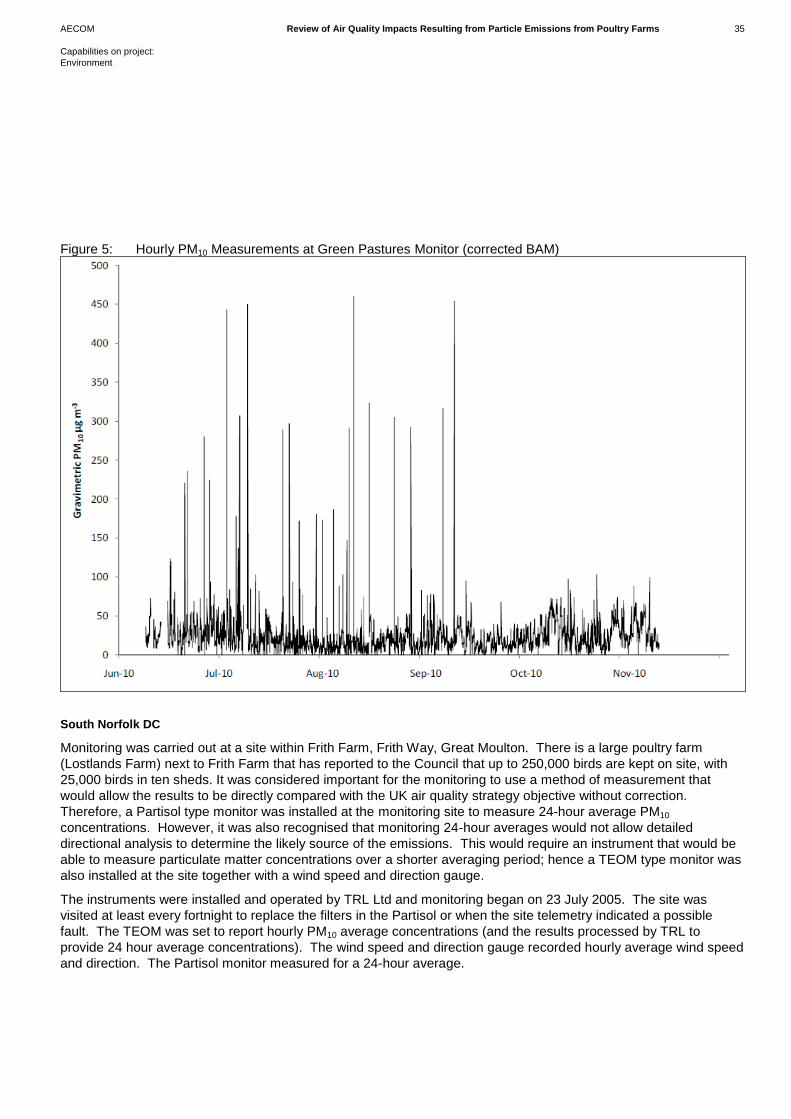
AECOM Review of Air Quality Impacts Resulting from Particle Emissions from Poultry Farms 35
Capabilities on project:
Environment
Figure 5: Hourly PM10 Measurements at Green Pastures Monitor (corrected BAM)
South Norfolk DC
Monitoring was carried out at a site within Frith Farm, Frith Way, Great Moulton. There is a large poultry farm
(Lostlands Farm) next to Frith Farm that has reported to the Council that up to 250,000 birds are kept on site, with
25,000 birds in ten sheds. It was considered important for the monitoring to use a method of measurement that
would allow the results to be directly compared with the UK air quality strategy objective without correction.
Therefore, a Partisol type monitor was installed at the monitoring site to measure 24-hour average PM10
concentrations. However, it was also recognised that monitoring 24-hour averages would not allow detailed
directional analysis to determine the likely source of the emissions. This would require an instrument that would be
able to measure particulate matter concentrations over a shorter averaging period; hence a TEOM type monitor was
also installed at the site together with a wind speed and direction gauge.
The instruments were installed and operated by TRL Ltd and monitoring began on 23 July 2005. The site was
visited at least every fortnight to replace the filters in the Partisol or when the site telemetry indicated a possible
fault. The TEOM was set to report hourly PM10 average concentrations (and the results processed by TRL to
provide 24 hour average concentrations). The wind speed and direction gauge recorded hourly average wind speed
and direction. The Partisol monitor measured for a 24-hour average.
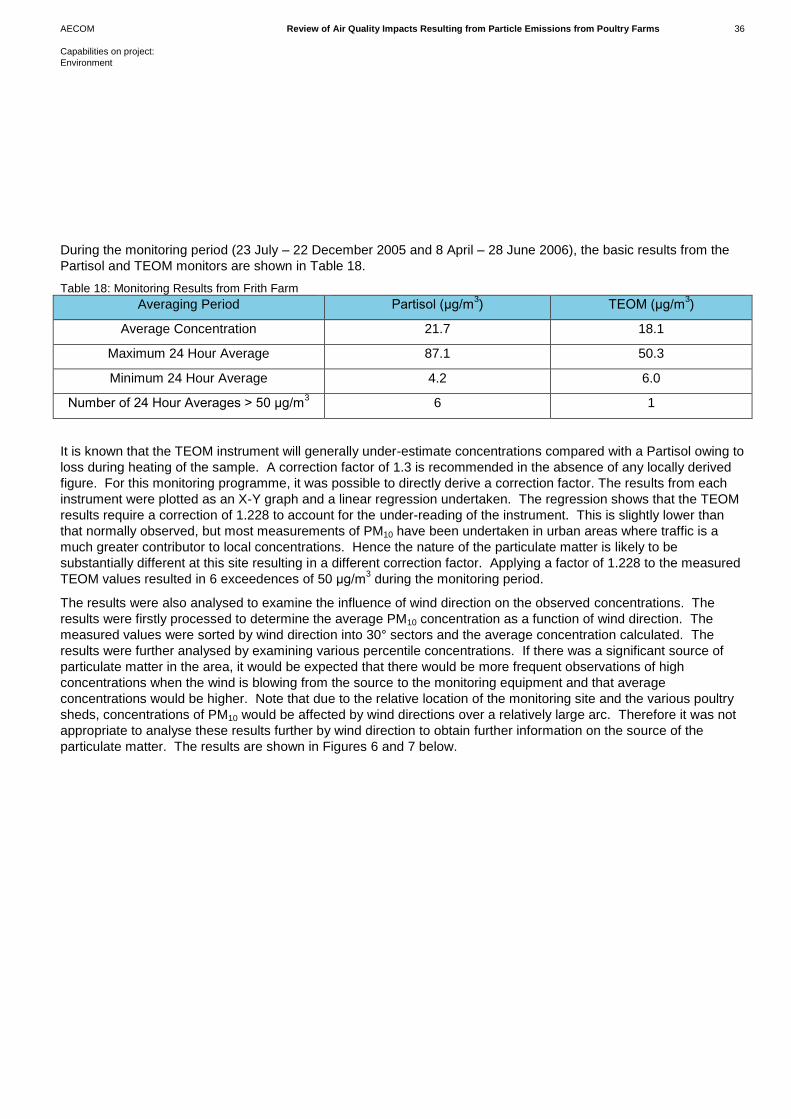
AECOM Review of Air Quality Impacts Resulting from Particle Emissions from Poultry Farms 36
Capabilities on project:
Environment
During the monitoring period (23 July – 22 December 2005 and 8 April – 28 June 2006), the basic results from the
Partisol and TEOM monitors are shown in Table 18.
Table 18: Monitoring Results from Frith Farm
Averaging Period Partisol (μg/m3) TEOM (μg/m
3)
Average Concentration 21.7 18.1
Maximum 24 Hour Average 87.1 50.3
Minimum 24 Hour Average 4.2 6.0
Number of 24 Hour Averages > 50 μg/m3 6 1
It is known that the TEOM instrument will generally under-estimate concentrations compared with a Partisol owing to
loss during heating of the sample. A correction factor of 1.3 is recommended in the absence of any locally derived
figure. For this monitoring programme, it was possible to directly derive a correction factor. The results from each
instrument were plotted as an X-Y graph and a linear regression undertaken. The regression shows that the TEOM
results require a correction of 1.228 to account for the under-reading of the instrument. This is slightly lower than
that normally observed, but most measurements of PM10 have been undertaken in urban areas where traffic is a
much greater contributor to local concentrations. Hence the nature of the particulate matter is likely to be
substantially different at this site resulting in a different correction factor. Applying a factor of 1.228 to the measured
TEOM values resulted in 6 exceedences of 50 μg/m3 during the monitoring period.
The results were also analysed to examine the influence of wind direction on the observed concentrations. The
results were firstly processed to determine the average PM10 concentration as a function of wind direction. The
measured values were sorted by wind direction into 30° sectors and the average concentration calculated. The
results were further analysed by examining various percentile concentrations. If there was a significant source of
particulate matter in the area, it would be expected that there would be more frequent observations of high
concentrations when the wind is blowing from the source to the monitoring equipment and that average
concentrations would be higher. Note that due to the relative location of the monitoring site and the various poultry
sheds, concentrations of PM10 would be affected by wind directions over a relatively large arc. Therefore it was not
appropriate to analyse these results further by wind direction to obtain further information on the source of the
particulate matter. The results are shown in Figures 6 and 7 below.
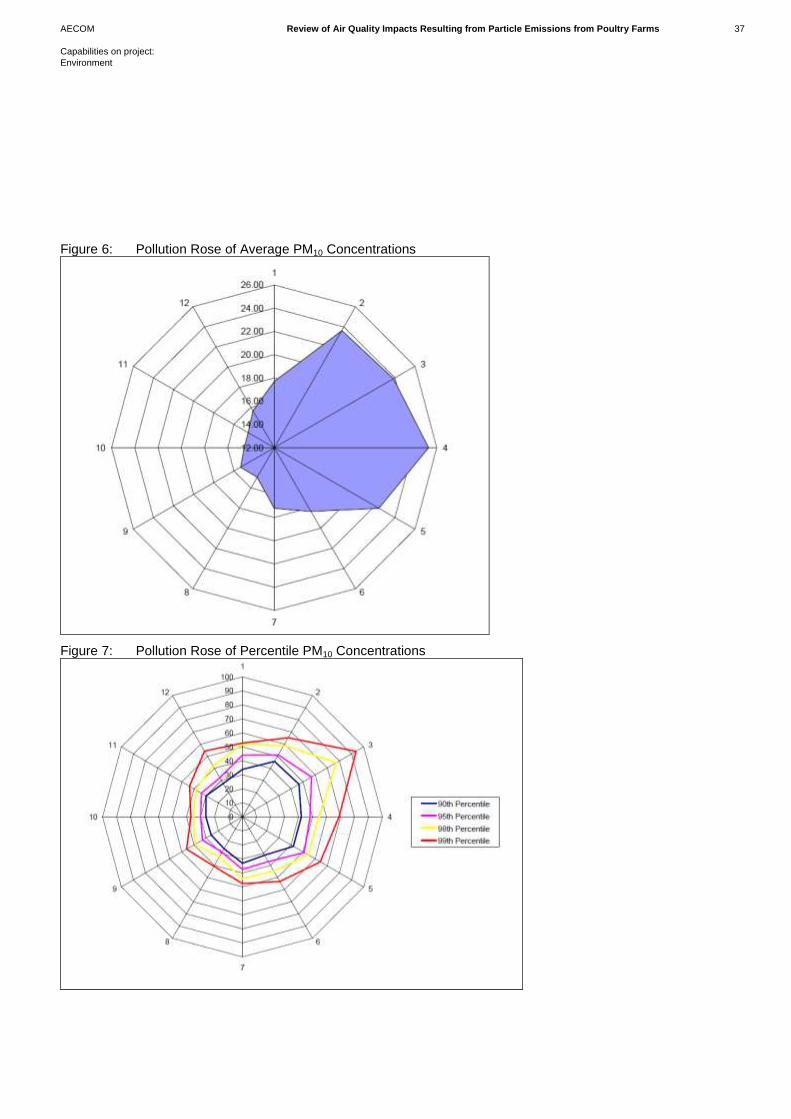
AECOM Review of Air Quality Impacts Resulting from Particle Emissions from Poultry Farms 37
Capabilities on project:
Environment
Figure 6: Pollution Rose of Average PM10 Concentrations
Figure 7: Pollution Rose of Percentile PM10 Concentrations
AECOM Review of Air Quality Impacts Resulting from Particle Emissions from Poultry Farms 38
Capabilities on project:
Environment
As can be seen from the results, there is a clear influence on PM10 concentrations with easterly winds (i.e. from the
direction of the poultry sheds). The average PM10 concentration increases by a maximum of nearly 12 μg/m3 for
easterly winds and the 95th (and above) percentile concentrations nearly double.
To assess the contribution of the poultry farm operations on average concentrations monitored at the site the
following assumptions were made:
1. The average concentrations measured from directions where the poultry sheds could not influence the results
represent the average concentration if the poultry emissions did not influence the site.
2. The concentrations from the arc of 15-135° are all influenced by the poultry farm emissions.
Making these assumptions the increase in PM10 concentrations as a result of emissions from the farm is 2.6 μg/m3.
A similar analysis was undertaken for the hourly percentile values taking first the percentile values for the sector
unaffected by emissions from the farms and then comparing these with the values for the entire data set. The
results are shown in Table 19.
Table 19: Percentiles of hourly PM10 concentrations measured at Frith Farm.
Percentile Dataset Unaffected by Farm
Emissions Entire Dataset
95 29.3 34.2
96 34.6 40.3
97 38.2 44.5
98 41.1 47.8
99 46.9 55.6
The results show that there is an increase in percentile concentrations when the easterly sector is included in the
data suggesting that the farm emissions could increase the 99th percentile of hourly means by approximately
9 μg/m3.
The same analysis could not be undertaken for the 24-hour mean concentrations as the wind direction varied
throughout the day.
North Dorset DC
Although the most probable “worst case” location for monitoring would have been to the north-east of the site, the
location selected for locating a sampler was to the south-west. This location was selected for two reasons. One
practical reason was that electrical power to operate the sampler was readily available at that location. The main
reason was that it was close to locations of relevant exposure. The exact location was decided on to minimise any
effect of nearby trees.
The nature of the location also influenced the choice of sampler. Although it would have been preferable to use a
sampler with proven equivalence to the European reference method, the costs and infrastructure involved with
locating such a sampler would have made the exercise unviable. As a result of this it was decided to use an
OSIRIS optical sampler. This was mounted, at head height, in a weather proof casing on a pole located in the
garden of the residential property closest to the poultry farm.
AECOM Review of Air Quality Impacts Resulting from Particle Emissions from Poultry Farms 39
Capabilities on project:
Environment
Monitoring commenced on 8 September 2009 and concluded on 10 December 2009. An overall data capture of
94.7% was achieved for PM10 with some data being lost due to software problems and some readings being
eliminated in ratification as being unreliable. There were two short periods where data were eliminated from the
final dataset. The first was a period of 8 hours beginning at midnight on 24 October when the hourly average
concentration of PM10 jumped from about 1 μg m-3
to in excess of 3,000 μg m-3
. The second was a period of 14
hours from midday on 12 November when the hourly average concentration of PM10 jumped from about 20 μg m-3
to
almost 400 μg m-3
.
For comparison, data from the following Automated Urban and Rural Network (AURN) sites, Bristol St Pauls,
Harwell, Narberth, Portsmouth and Plymouth Centre, were downloaded from the National Air Quality Information
Archive (NAQIA) for the period of the monitoring exercise. The Bristol, Portsmouth and Plymouth sites were
selected as being the closest sites to East Down Farm where particles are measured whilst Harwell and Narberth
are rural sites with particle monitoring. These data were only ratified for the period 8 to 30 September and so must
be treated with a measure of caution. The data is summarized in Table 20.
Table 20: Monitored Concentrations at East Down Farm in Comparison to those at Background Sites
Site Metric PM10 (μg m-3
) PM2.5 (μg m-3
)
East Down Farm Period Mean 18.3 7.5
90th Percentile 27.6 N/A
Bristol St Pauls Period Mean 16.8 9.5
90th Percentile 27.7 N/A
Harwell Period Mean 15.9 6.4
90th Percentile 22.5 N/A
Narberth Period Mean 11.6 N/A
90th Percentile 17.0 N/A
Portsmouth Period Mean 26.1 7.7
90th Percentile 32.8 N/A
The concentrations of PM10 at East Down Farm during this period were substantially higher than at Narberth in
Pembroke but only slightly higher than at Harwell and Bristol St Pauls. They were comparable with those at
Plymouth and substantially lower than those recorded at Portsmouth. The concentrations of PM2.5 at East Down
Farm were generally comparable with those recorded at other sites.
Northern Ireland Environment Agency (NIEA)
The NIEA has undertaken PM10 monitoring in the vicinity of three poultry farms in Northern Ireland. The sampling
methodology employed and the results obtained during each of these surveys are described below.
Eglish
A TEOM analyser was used to measure PM10 at a farm in Eglish, County Tyrone, between November 2004 and
August 2005. PM10 measurements made by the TEOM were adjusted by multiplying the data by 1.3 to estimate
gravimetric equivalent concentrations.
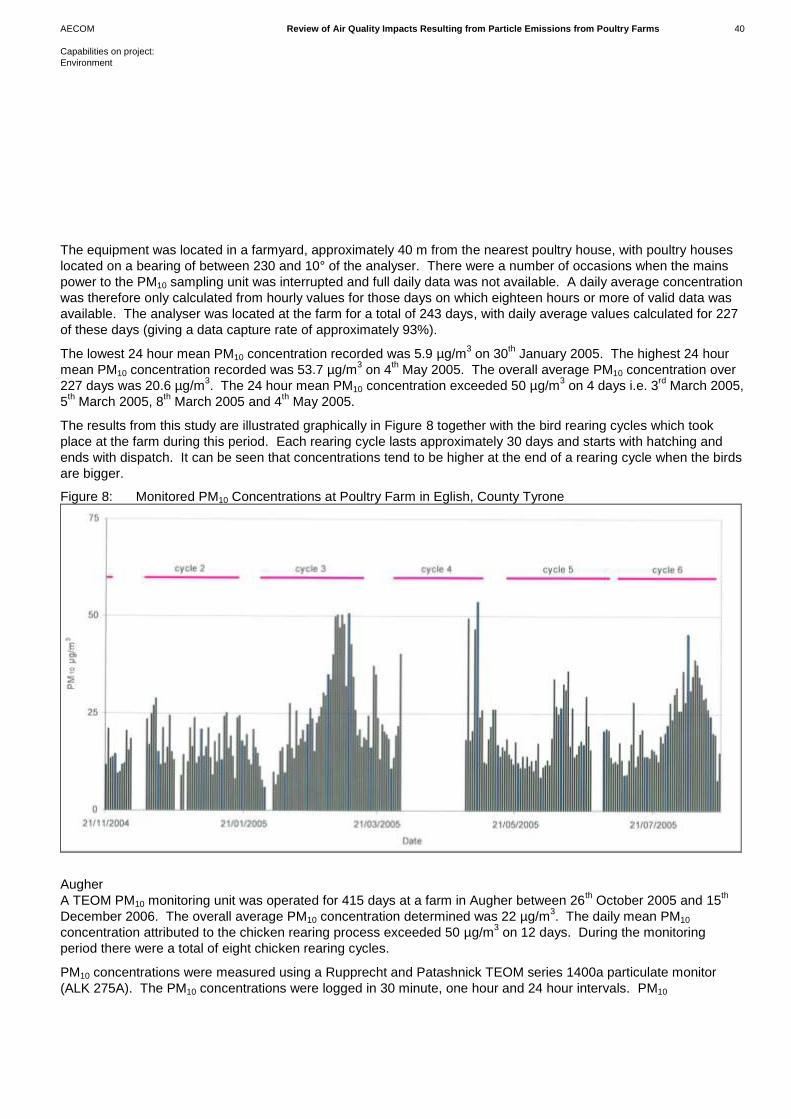
AECOM Review of Air Quality Impacts Resulting from Particle Emissions from Poultry Farms 40
Capabilities on project:
Environment
The equipment was located in a farmyard, approximately 40 m from the nearest poultry house, with poultry houses
located on a bearing of between 230 and 10° of the analyser. There were a number of occasions when the mains
power to the PM10 sampling unit was interrupted and full daily data was not available. A daily average concentration
was therefore only calculated from hourly values for those days on which eighteen hours or more of valid data was
available. The analyser was located at the farm for a total of 243 days, with daily average values calculated for 227
of these days (giving a data capture rate of approximately 93%).
The lowest 24 hour mean PM10 concentration recorded was 5.9 µg/m3 on 30
th January 2005. The highest 24 hour
mean PM10 concentration recorded was 53.7 µg/m3 on 4
th May 2005. The overall average PM10 concentration over
227 days was 20.6 µg/m3. The 24 hour mean PM10 concentration exceeded 50 µg/m
3 on 4 days i.e. 3
rd March 2005,
5th March 2005, 8
th March 2005 and 4
th May 2005.
The results from this study are illustrated graphically in Figure 8 together with the bird rearing cycles which took
place at the farm during this period. Each rearing cycle lasts approximately 30 days and starts with hatching and
ends with dispatch. It can be seen that concentrations tend to be higher at the end of a rearing cycle when the birds
are bigger.
Figure 8: Monitored PM10 Concentrations at Poultry Farm in Eglish, County Tyrone
Augher
A TEOM PM10 monitoring unit was operated for 415 days at a farm in Augher between 26th October 2005 and 15
th
December 2006. The overall average PM10 concentration determined was 22 µg/m3. The daily mean PM10
concentration attributed to the chicken rearing process exceeded 50 µg/m3 on 12 days. During the monitoring
period there were a total of eight chicken rearing cycles.
PM10 concentrations were measured using a Rupprecht and Patashnick TEOM series 1400a particulate monitor
(ALK 275A). The PM10 concentrations were logged in 30 minute, one hour and 24 hour intervals. PM10
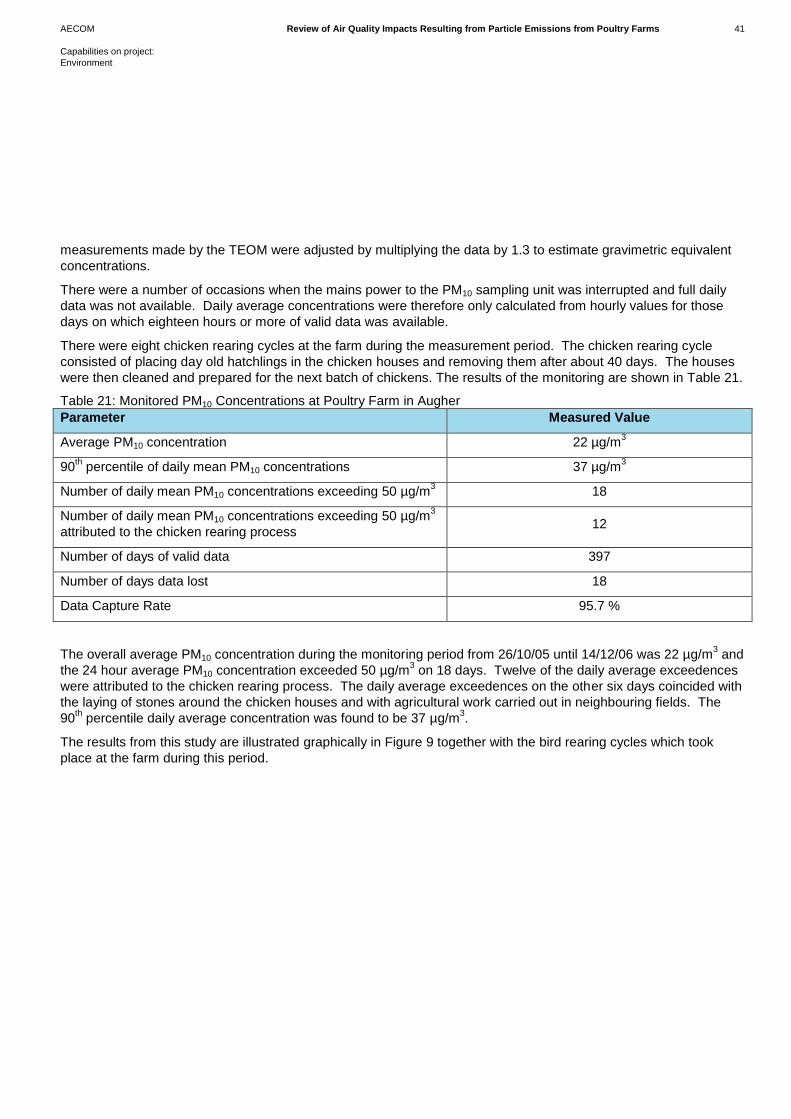
AECOM Review of Air Quality Impacts Resulting from Particle Emissions from Poultry Farms 41
Capabilities on project:
Environment
measurements made by the TEOM were adjusted by multiplying the data by 1.3 to estimate gravimetric equivalent
concentrations.
There were a number of occasions when the mains power to the PM10 sampling unit was interrupted and full daily
data was not available. Daily average concentrations were therefore only calculated from hourly values for those
days on which eighteen hours or more of valid data was available.
There were eight chicken rearing cycles at the farm during the measurement period. The chicken rearing cycle
consisted of placing day old hatchlings in the chicken houses and removing them after about 40 days. The houses
were then cleaned and prepared for the next batch of chickens. The results of the monitoring are shown in Table 21.
Table 21: Monitored PM10 Concentrations at Poultry Farm in Augher
Parameter Measured Value
Average PM10 concentration 22 µg/m3
90th percentile of daily mean PM10 concentrations 37 µg/m
3
Number of daily mean PM10 concentrations exceeding 50 µg/m3 18
Number of daily mean PM10 concentrations exceeding 50 µg/m3
attributed to the chicken rearing process 12
Number of days of valid data 397
Number of days data lost 18
Data Capture Rate 95.7 %
The overall average PM10 concentration during the monitoring period from 26/10/05 until 14/12/06 was 22 µg/m3 and
the 24 hour average PM10 concentration exceeded 50 µg/m3 on 18 days. Twelve of the daily average exceedences
were attributed to the chicken rearing process. The daily average exceedences on the other six days coincided with
the laying of stones around the chicken houses and with agricultural work carried out in neighbouring fields. The
90th percentile daily average concentration was found to be 37 µg/m
3.
The results from this study are illustrated graphically in Figure 9 together with the bird rearing cycles which took
place at the farm during this period.
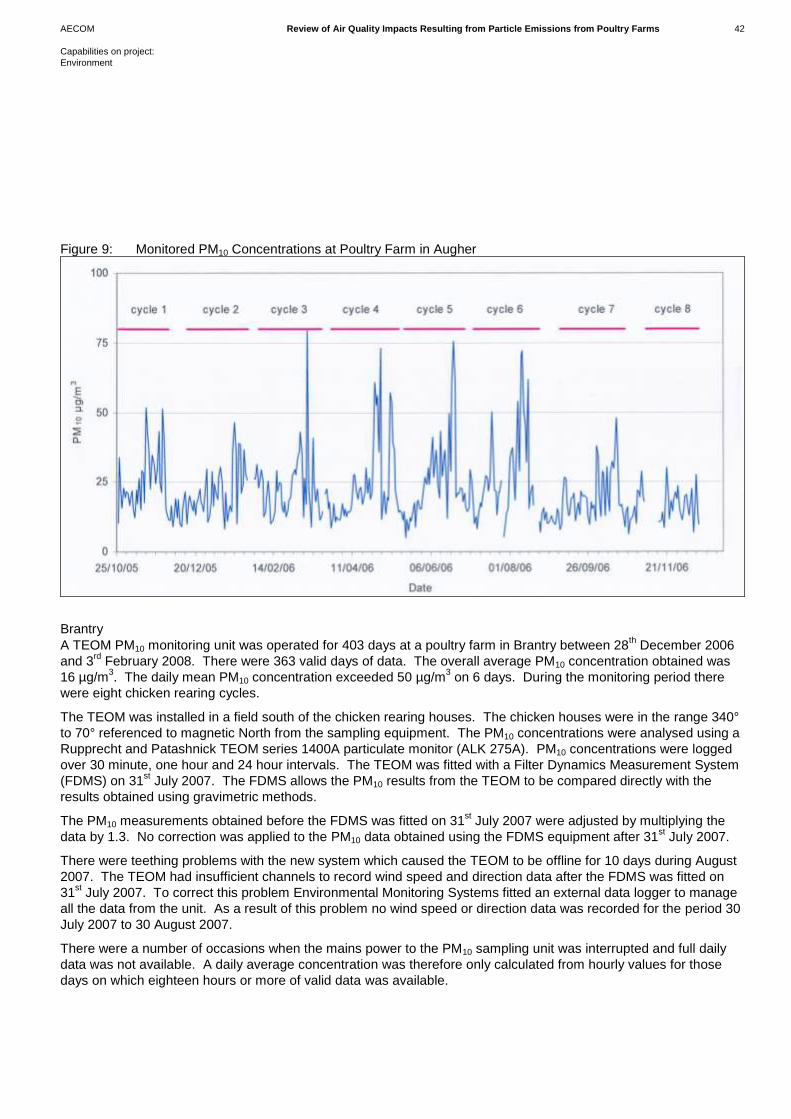
AECOM Review of Air Quality Impacts Resulting from Particle Emissions from Poultry Farms 42
Capabilities on project:
Environment
Figure 9: Monitored PM10 Concentrations at Poultry Farm in Augher
Brantry
A TEOM PM10 monitoring unit was operated for 403 days at a poultry farm in Brantry between 28th December 2006
and 3rd
February 2008. There were 363 valid days of data. The overall average PM10 concentration obtained was
16 µg/m3. The daily mean PM10 concentration exceeded 50 µg/m
3 on 6 days. During the monitoring period there
were eight chicken rearing cycles.
The TEOM was installed in a field south of the chicken rearing houses. The chicken houses were in the range 340°
to 70° referenced to magnetic North from the sampling equipment. The PM10 concentrations were analysed using a
Rupprecht and Patashnick TEOM series 1400A particulate monitor (ALK 275A). PM10 concentrations were logged
over 30 minute, one hour and 24 hour intervals. The TEOM was fitted with a Filter Dynamics Measurement System
(FDMS) on 31st July 2007. The FDMS allows the PM10 results from the TEOM to be compared directly with the
results obtained using gravimetric methods.
The PM10 measurements obtained before the FDMS was fitted on 31st July 2007 were adjusted by multiplying the
data by 1.3. No correction was applied to the PM10 data obtained using the FDMS equipment after 31st July 2007.
There were teething problems with the new system which caused the TEOM to be offline for 10 days during August
2007. The TEOM had insufficient channels to record wind speed and direction data after the FDMS was fitted on
31st July 2007. To correct this problem Environmental Monitoring Systems fitted an external data logger to manage
all the data from the unit. As a result of this problem no wind speed or direction data was recorded for the period 30
July 2007 to 30 August 2007.
There were a number of occasions when the mains power to the PM10 sampling unit was interrupted and full daily
data was not available. A daily average concentration was therefore only calculated from hourly values for those
days on which eighteen hours or more of valid data was available.
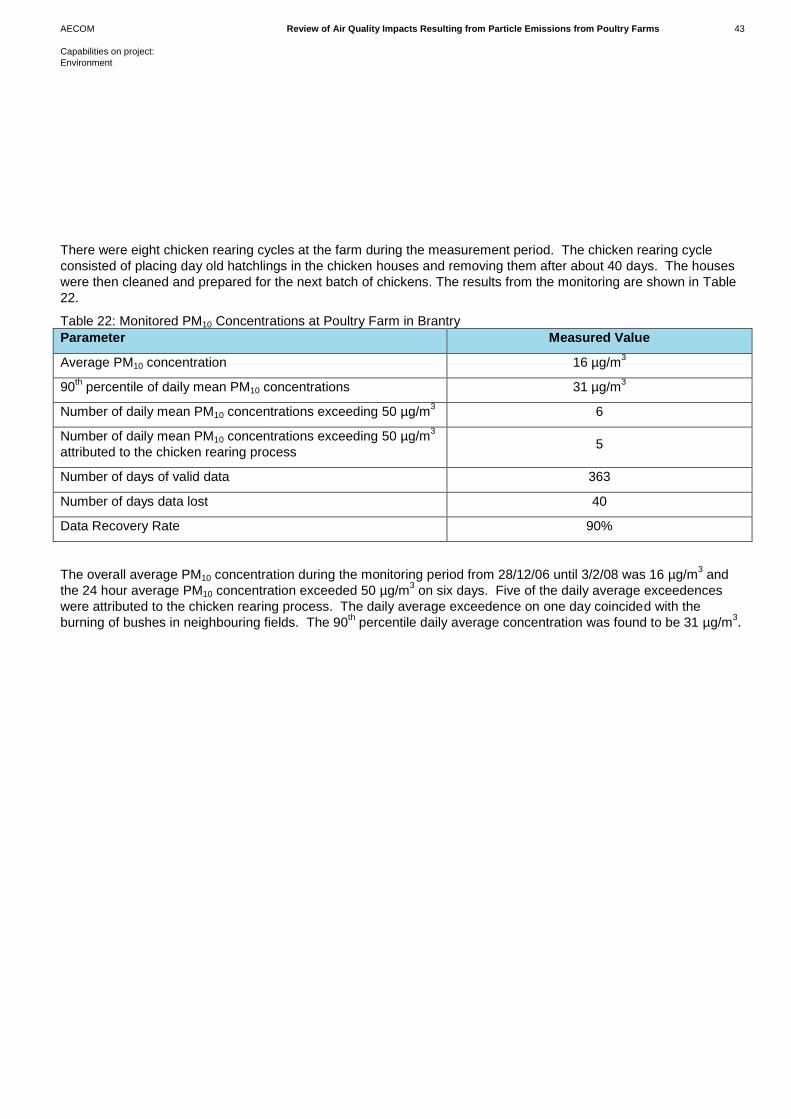
AECOM Review of Air Quality Impacts Resulting from Particle Emissions from Poultry Farms 43
Capabilities on project:
Environment
There were eight chicken rearing cycles at the farm during the measurement period. The chicken rearing cycle
consisted of placing day old hatchlings in the chicken houses and removing them after about 40 days. The houses
were then cleaned and prepared for the next batch of chickens. The results from the monitoring are shown in Table
22.
Table 22: Monitored PM10 Concentrations at Poultry Farm in Brantry
Parameter Measured Value
Average PM10 concentration 16 µg/m3
90th percentile of daily mean PM10 concentrations 31 µg/m
3
Number of daily mean PM10 concentrations exceeding 50 µg/m3 6
Number of daily mean PM10 concentrations exceeding 50 µg/m3
attributed to the chicken rearing process 5
Number of days of valid data 363
Number of days data lost 40
Data Recovery Rate 90%
The overall average PM10 concentration during the monitoring period from 28/12/06 until 3/2/08 was 16 µg/m3 and
the 24 hour average PM10 concentration exceeded 50 µg/m3 on six days. Five of the daily average exceedences
were attributed to the chicken rearing process. The daily average exceedence on one day coincided with the
burning of bushes in neighbouring fields. The 90th percentile daily average concentration was found to be 31 µg/m
3.
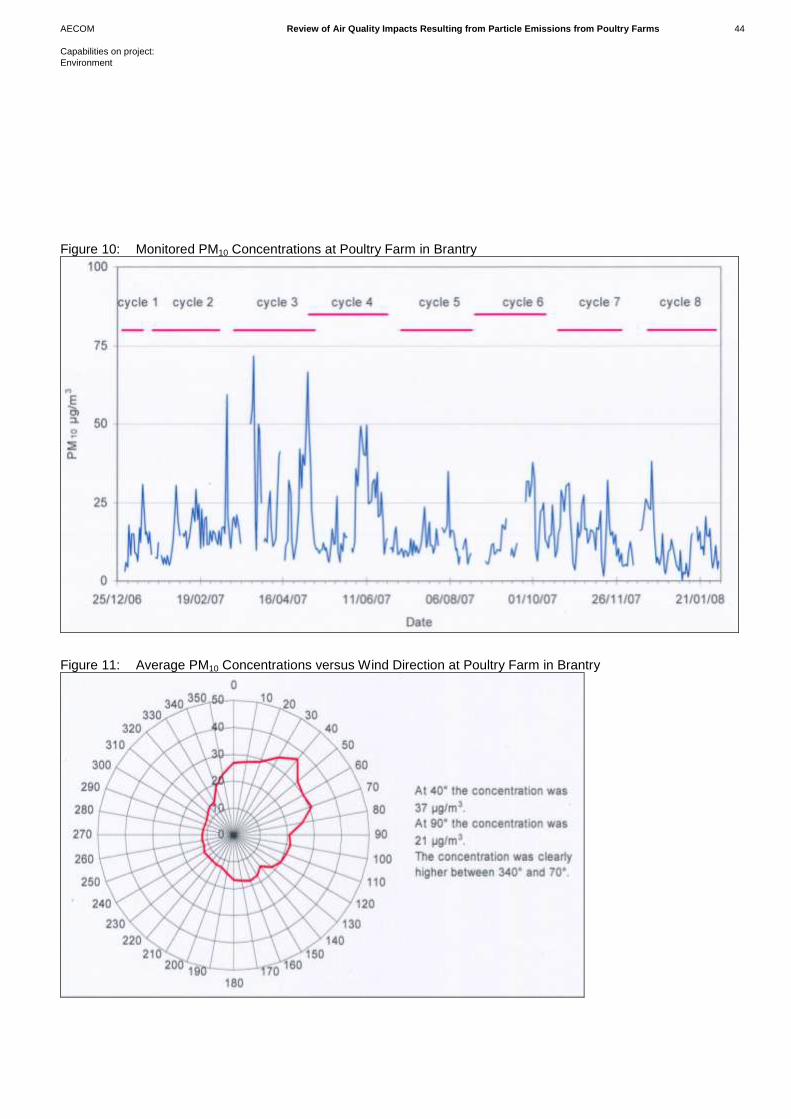
AECOM Review of Air Quality Impacts Resulting from Particle Emissions from Poultry Farms 44
Capabilities on project:
Environment
Figure 10: Monitored PM10 Concentrations at Poultry Farm in Brantry
Figure 11: Average PM10 Concentrations versus Wind Direction at Poultry Farm in Brantry
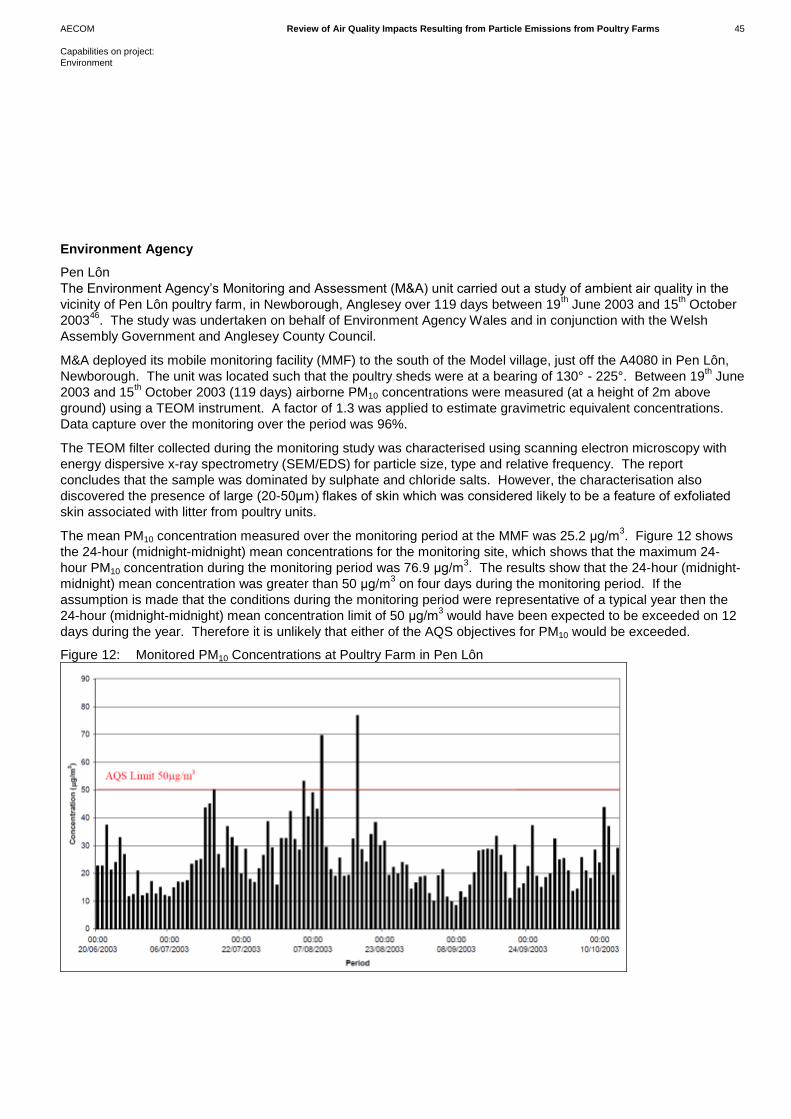
AECOM Review of Air Quality Impacts Resulting from Particle Emissions from Poultry Farms 45
Capabilities on project:
Environment
Environment Agency
Pen Lôn
The Environment Agency’s Monitoring and Assessment (M&A) unit carried out a study of ambient air quality in the
vicinity of Pen Lôn poultry farm, in Newborough, Anglesey over 119 days between 19th June 2003 and 15
th October
200346
. The study was undertaken on behalf of Environment Agency Wales and in conjunction with the Welsh
Assembly Government and Anglesey County Council.
M&A deployed its mobile monitoring facility (MMF) to the south of the Model village, just off the A4080 in Pen Lôn,
Newborough. The unit was located such that the poultry sheds were at a bearing of 130° - 225°. Between 19th June
2003 and 15th October 2003 (119 days) airborne PM10 concentrations were measured (at a height of 2m above
ground) using a TEOM instrument. A factor of 1.3 was applied to estimate gravimetric equivalent concentrations.
Data capture over the monitoring over the period was 96%.
The TEOM filter collected during the monitoring study was characterised using scanning electron microscopy with
energy dispersive x-ray spectrometry (SEM/EDS) for particle size, type and relative frequency. The report
concludes that the sample was dominated by sulphate and chloride salts. However, the characterisation also
discovered the presence of large (20-50μm) flakes of skin which was considered likely to be a feature of exfoliated
skin associated with litter from poultry units.
The mean PM10 concentration measured over the monitoring period at the MMF was 25.2 μg/m3. Figure 12 shows
the 24-hour (midnight-midnight) mean concentrations for the monitoring site, which shows that the maximum 24-
hour PM10 concentration during the monitoring period was 76.9 μg/m3. The results show that the 24-hour (midnight-
midnight) mean concentration was greater than 50 μg/m3 on four days during the monitoring period. If the
assumption is made that the conditions during the monitoring period were representative of a typical year then the
24-hour (midnight-midnight) mean concentration limit of 50 μg/m3 would have been expected to be exceeded on 12
days during the year. Therefore it is unlikely that either of the AQS objectives for PM10 would be exceeded.
Figure 12: Monitored PM10 Concentrations at Poultry Farm in Pen Lôn
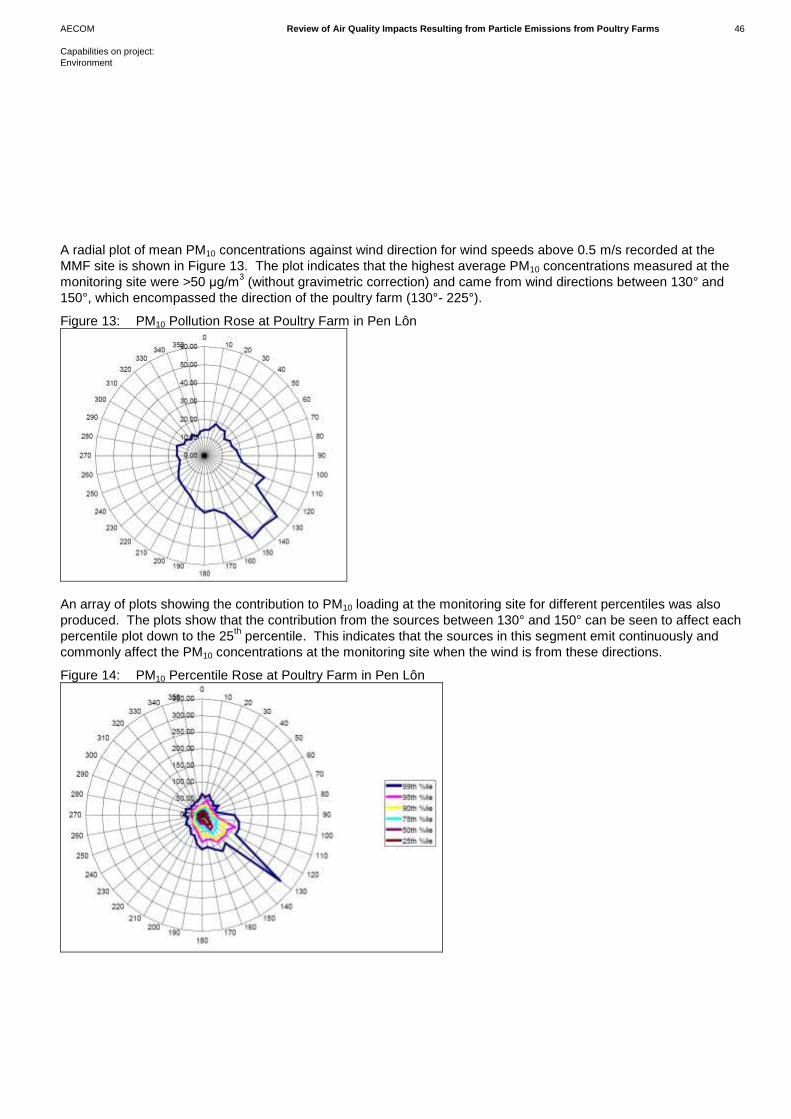
AECOM Review of Air Quality Impacts Resulting from Particle Emissions from Poultry Farms 46
Capabilities on project:
Environment
A radial plot of mean PM10 concentrations against wind direction for wind speeds above 0.5 m/s recorded at the
MMF site is shown in Figure 13. The plot indicates that the highest average PM10 concentrations measured at the
monitoring site were >50 μg/m3 (without gravimetric correction) and came from wind directions between 130° and
150°, which encompassed the direction of the poultry farm (130°- 225°).
Figure 13: PM10 Pollution Rose at Poultry Farm in Pen Lôn
An array of plots showing the contribution to PM10 loading at the monitoring site for different percentiles was also
produced. The plots show that the contribution from the sources between 130° and 150° can be seen to affect each
percentile plot down to the 25th percentile. This indicates that the sources in this segment emit continuously and
commonly affect the PM10 concentrations at the monitoring site when the wind is from these directions.
Figure 14: PM10 Percentile Rose at Poultry Farm in Pen Lôn
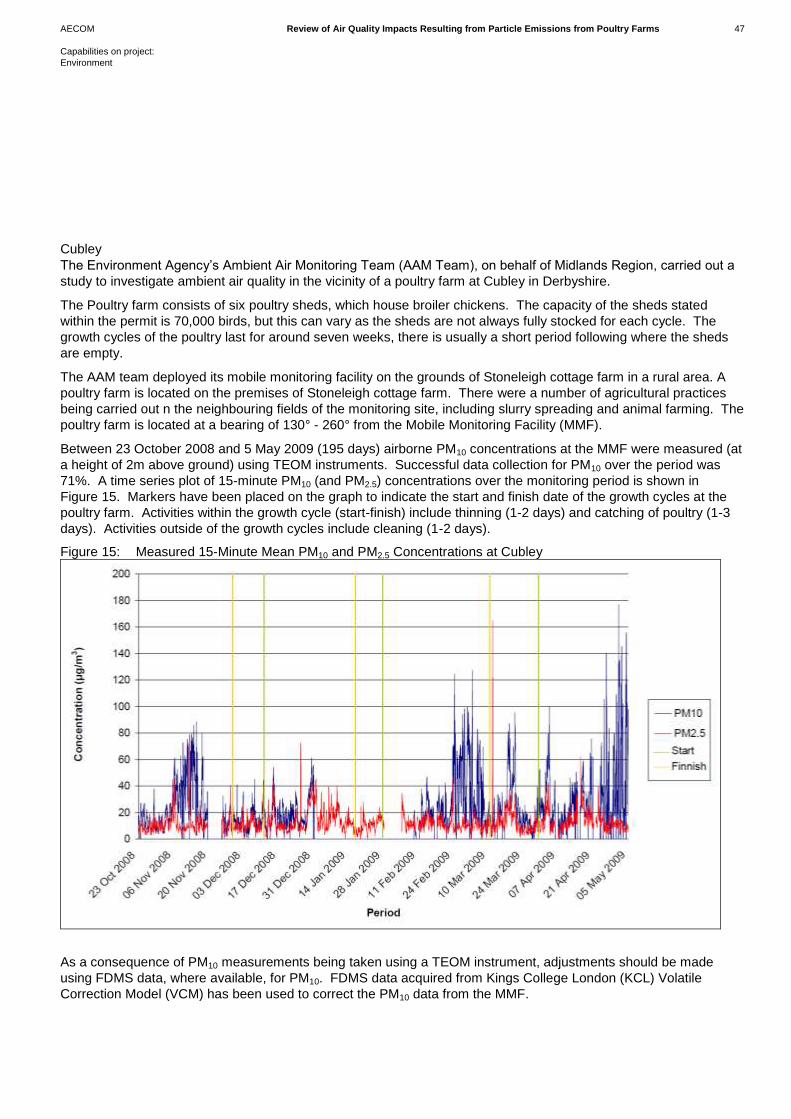
AECOM Review of Air Quality Impacts Resulting from Particle Emissions from Poultry Farms 47
Capabilities on project:
Environment
Cubley
The Environment Agency’s Ambient Air Monitoring Team (AAM Team), on behalf of Midlands Region, carried out a
study to investigate ambient air quality in the vicinity of a poultry farm at Cubley in Derbyshire.
The Poultry farm consists of six poultry sheds, which house broiler chickens. The capacity of the sheds stated
within the permit is 70,000 birds, but this can vary as the sheds are not always fully stocked for each cycle. The
growth cycles of the poultry last for around seven weeks, there is usually a short period following where the sheds
are empty.
The AAM team deployed its mobile monitoring facility on the grounds of Stoneleigh cottage farm in a rural area. A
poultry farm is located on the premises of Stoneleigh cottage farm. There were a number of agricultural practices
being carried out n the neighbouring fields of the monitoring site, including slurry spreading and animal farming. The
poultry farm is located at a bearing of 130° - 260° from the Mobile Monitoring Facility (MMF).
Between 23 October 2008 and 5 May 2009 (195 days) airborne PM10 concentrations at the MMF were measured (at
a height of 2m above ground) using TEOM instruments. Successful data collection for PM10 over the period was
71%. A time series plot of 15-minute PM10 (and PM2.5) concentrations over the monitoring period is shown in
Figure 15. Markers have been placed on the graph to indicate the start and finish date of the growth cycles at the
poultry farm. Activities within the growth cycle (start-finish) include thinning (1-2 days) and catching of poultry (1-3
days). Activities outside of the growth cycles include cleaning (1-2 days).
Figure 15: Measured 15-Minute Mean PM10 and PM2.5 Concentrations at Cubley
As a consequence of PM10 measurements being taken using a TEOM instrument, adjustments should be made
using FDMS data, where available, for PM10. FDMS data acquired from Kings College London (KCL) Volatile
Correction Model (VCM) has been used to correct the PM10 data from the MMF.
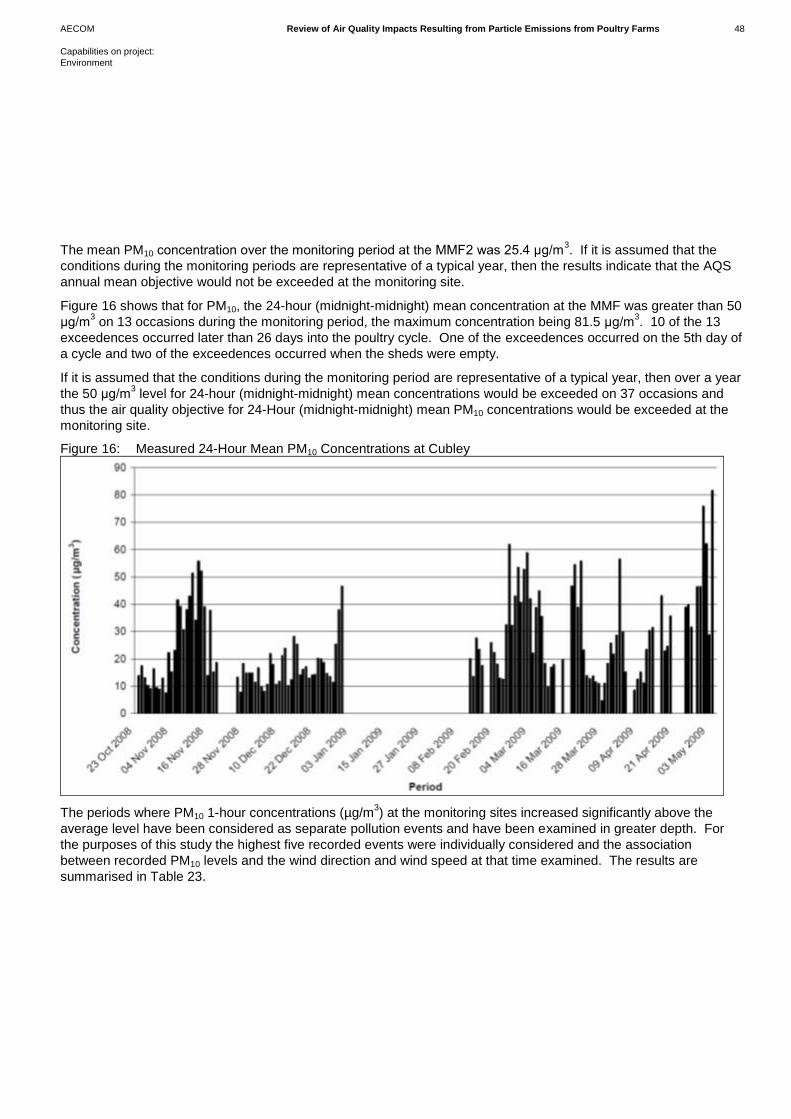
AECOM Review of Air Quality Impacts Resulting from Particle Emissions from Poultry Farms 48
Capabilities on project:
Environment
The mean PM10 concentration over the monitoring period at the MMF2 was 25.4 μg/m3. If it is assumed that the
conditions during the monitoring periods are representative of a typical year, then the results indicate that the AQS
annual mean objective would not be exceeded at the monitoring site.
Figure 16 shows that for PM10, the 24-hour (midnight-midnight) mean concentration at the MMF was greater than 50
μg/m3 on 13 occasions during the monitoring period, the maximum concentration being 81.5 μg/m
3. 10 of the 13
exceedences occurred later than 26 days into the poultry cycle. One of the exceedences occurred on the 5th day of
a cycle and two of the exceedences occurred when the sheds were empty.
If it is assumed that the conditions during the monitoring period are representative of a typical year, then over a year
the 50 μg/m3 level for 24-hour (midnight-midnight) mean concentrations would be exceeded on 37 occasions and
thus the air quality objective for 24-Hour (midnight-midnight) mean PM10 concentrations would be exceeded at the
monitoring site.
Figure 16: Measured 24-Hour Mean PM10 Concentrations at Cubley
The periods where PM10 1-hour concentrations (µg/m3) at the monitoring sites increased significantly above the
average level have been considered as separate pollution events and have been examined in greater depth. For
the purposes of this study the highest five recorded events were individually considered and the association
between recorded PM10 levels and the wind direction and wind speed at that time examined. The results are
summarised in Table 23.
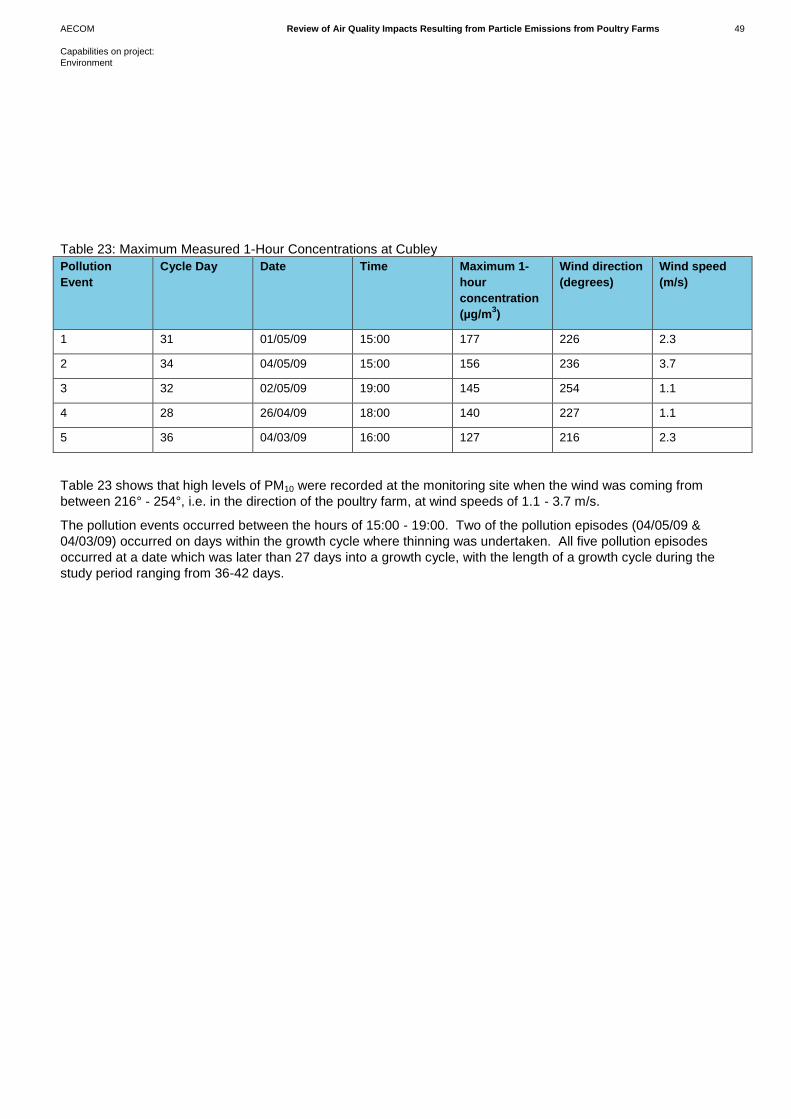
AECOM Review of Air Quality Impacts Resulting from Particle Emissions from Poultry Farms 49
Capabilities on project:
Environment
Table 23: Maximum Measured 1-Hour Concentrations at Cubley
Pollution
Event
Cycle Day Date Time Maximum 1-
hour
concentration
(µg/m3)
Wind direction
(degrees)
Wind speed
(m/s)
1 31 01/05/09 15:00 177 226 2.3
2 34 04/05/09 15:00 156 236 3.7
3 32 02/05/09 19:00 145 254 1.1
4 28 26/04/09 18:00 140 227 1.1
5 36 04/03/09 16:00 127 216 2.3
Table 23 shows that high levels of PM10 were recorded at the monitoring site when the wind was coming from
between 216° - 254°, i.e. in the direction of the poultry farm, at wind speeds of 1.1 - 3.7 m/s.
The pollution events occurred between the hours of 15:00 - 19:00. Two of the pollution episodes (04/05/09 &
04/03/09) occurred on days within the growth cycle where thinning was undertaken. All five pollution episodes
occurred at a date which was later than 27 days into a growth cycle, with the length of a growth cycle during the
study period ranging from 36-42 days.
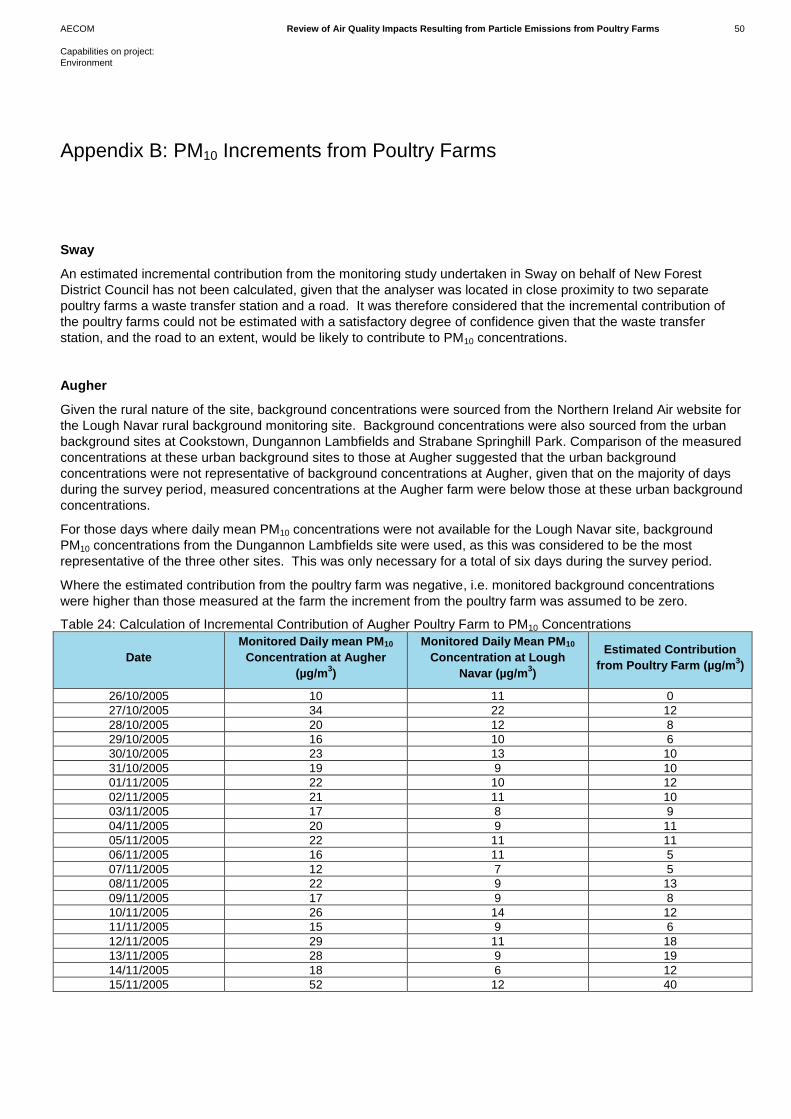
AECOM Review of Air Quality Impacts Resulting from Particle Emissions from Poultry Farms 50
Capabilities on project:
Environment
Sway
An estimated incremental contribution from the monitoring study undertaken in Sway on behalf of New Forest
District Council has not been calculated, given that the analyser was located in close proximity to two separate
poultry farms a waste transfer station and a road. It was therefore considered that the incremental contribution of
the poultry farms could not be estimated with a satisfactory degree of confidence given that the waste transfer
station, and the road to an extent, would be likely to contribute to PM10 concentrations.
Augher
Given the rural nature of the site, background concentrations were sourced from the Northern Ireland Air website for
the Lough Navar rural background monitoring site. Background concentrations were also sourced from the urban
background sites at Cookstown, Dungannon Lambfields and Strabane Springhill Park. Comparison of the measured
concentrations at these urban background sites to those at Augher suggested that the urban background
concentrations were not representative of background concentrations at Augher, given that on the majority of days
during the survey period, measured concentrations at the Augher farm were below those at these urban background
concentrations.
For those days where daily mean PM10 concentrations were not available for the Lough Navar site, background
PM10 concentrations from the Dungannon Lambfields site were used, as this was considered to be the most
representative of the three other sites. This was only necessary for a total of six days during the survey period.
Where the estimated contribution from the poultry farm was negative, i.e. monitored background concentrations
were higher than those measured at the farm the increment from the poultry farm was assumed to be zero.
Table 24: Calculation of Incremental Contribution of Augher Poultry Farm to PM10 Concentrations
Date
Monitored Daily mean PM10
Concentration at Augher
(µg/m3)
Monitored Daily Mean PM10
Concentration at Lough
Navar (µg/m3)
Estimated Contribution
from Poultry Farm (µg/m3)
26/10/2005 10 11 0
27/10/2005 34 22 12
28/10/2005 20 12 8
29/10/2005 16 10 6
30/10/2005 23 13 10
31/10/2005 19 9 10
01/11/2005 22 10 12
02/11/2005 21 11 10
03/11/2005 17 8 9
04/11/2005 20 9 11
05/11/2005 22 11 11
06/11/2005 16 11 5
07/11/2005 12 7 5
08/11/2005 22 9 13
09/11/2005 17 9 8
10/11/2005 26 14 12
11/11/2005 15 9 6
12/11/2005 29 11 18
13/11/2005 28 9 19
14/11/2005 18 6 12
15/11/2005 52 12 40
Appendix B: PM10 Increments from Poultry Farms

AECOM Review of Air Quality Impacts Resulting from Particle Emissions from Poultry Farms 51
Capabilities on project:
Environment
Date
Monitored Daily mean PM10
Concentration at Augher
(µg/m3)
Monitored Daily Mean PM10
Concentration at Lough
Navar (µg/m3)
Estimated Contribution
from Poultry Farm (µg/m3)
16/11/2005 41 10 31
17/11/2005 38 11 27
18/11/2005 23 14 9
19/11/2005 35 10 25
20/11/2005 34 11 23
21/11/2005 30 11 19
22/11/2005 25 9 16
23/11/2005 30 10 20
24/11/2005 43 8 35
25/11/2005 25 13 12
26/11/2005 21 14 7
27/11/2005 51 7 44
28/11/2005 40 8 32
29/11/2005 15 6 9
30/11/2005 14 6 8
01/12/2005 12 5 7
02/12/2005 11 8 3
03/12/2005 17 11 6
04/12/2005 9 8 1
05/12/2005 12 9 3
06/12/2005 19 8 11
07/12/2005 12 9 3
08/12/2005 19 9 10
09/12/2005 10 7 3
10/12/2005 9 7 2
11/12/2005 16 10 6
12/12/2005 20 7 13
13/12/2005 22 10 12
14/12/2005 10 8 2
15/12/2005 18 15 3
16/12/2005 20 15 5
17/12/2005 17 8 9
18/12/2005 15 8 7
19/12/2005 18 10 8
20/12/2005 13 7 6
21/12/2005 17 8 9
22/12/2005 20 12 8
23/12/2005 23 11 12
24/12/2005 18 9 9
25/12/2005 16 8 8
26/12/2005 14 7 7
27/12/2005 22 9 13
28/12/2005 30 12 18
29/12/2005 11 5 6
30/12/2005 13 7 6
31/12/2005 18 11 7
01/01/2006 29 14 15
02/01/2006 16 7 9

AECOM Review of Air Quality Impacts Resulting from Particle Emissions from Poultry Farms 52
Capabilities on project:
Environment
Date
Monitored Daily mean PM10
Concentration at Augher
(µg/m3)
Monitored Daily Mean PM10
Concentration at Lough
Navar (µg/m3)
Estimated Contribution
from Poultry Farm (µg/m3)
03/01/2006 24 8 16
04/01/2006 21 11 10
05/01/2006 19 12 7
06/01/2006 27 15 12
07/01/2006 31 16 15
08/01/2006 25 16 9
09/01/2006 16 9 7
10/01/2006 8 6 2
11/01/2006 21 10 11
12/01/2006 11 7 4
13/01/2006 15 7 8
14/01/2006 17 7 10
15/01/2006 15 10 5
16/01/2006 37 8 29
17/01/2006 46 11 35
18/01/2006 36 9 27
19/01/2006 10 6 4
20/01/2006 39 13 26
21/01/2006 39 14 25
22/01/2006 21 13 8
23/01/2006 24 15 9
24/01/2006 37 20 17
25/01/2006 28 17 11
26/01/2006 26 11 15
27/01/2006 No Data 12 N/A
28/01/2006 No Data 10 N/A
29/01/2006 No Data 13 N/A
30/01/2006 No Data 21 N/A
31/01/2006 26 19 7
01/02/2006 26 19 7
02/02/2006 31 27 4
03/02/2006 23 18 5
04/02/2006 25 11 14
05/02/2006 29 19 10
06/02/2006 26 17 9
07/02/2006 12 8 4
08/02/2006 14 8 6
09/02/2006 19 7 12
10/02/2006 25 12 13
11/02/2006 17 12 5
12/02/2006 10 6 4
13/02/2006 11 6 5
14/02/2006 12 4 8
15/02/2006 14 7 7
16/02/2006 29 7 22
17/02/2006 22 11 11
18/02/2006 25 10 15
19/02/2006 24 13 11

AECOM Review of Air Quality Impacts Resulting from Particle Emissions from Poultry Farms 53
Capabilities on project:
Environment
Date
Monitored Daily mean PM10
Concentration at Augher
(µg/m3)
Monitored Daily Mean PM10
Concentration at Lough
Navar (µg/m3)
Estimated Contribution
from Poultry Farm (µg/m3)
20/02/2006 16 11 5
21/02/2006 14 7 7
22/02/2006 18 11 7
23/02/2006 13 9 4
24/02/2006 15 9 6
25/02/2006 19 13 6
26/02/2006 19 12 7
27/02/2006 27 8 19
28/02/2006 28 7 21
01/03/2006 29 5 24
02/03/2006 28 5 23
03/03/2006 33 8 25
04/03/2006 36 7 29
05/03/2006 43 6 37
06/03/2006 35 7 28
07/03/2006 12 5 7
08/03/2006 26 5 21
09/03/2006 17 7 10
10/03/2006 79 14 65
11/03/2006 22 6 16
12/03/2006 14 18 0
13/03/2006 9 6 3
14/03/2006 41 7 34
15/03/2006 25 17 8
16/03/2006 18 12 6
17/03/2006 23 16 7
18/03/2006 18 14 4
19/03/2006 11 7 4
20/03/2006 13 8 5
21/03/2006 15 9 6
22/03/2006 No Data 12 N/A
23/03/2006 21 17 4
24/03/2006 23 18 5
25/03/2006 15 12 3
26/03/2006 18 11 7
27/03/2006 8 5 3
28/03/2006 12 10 2
29/03/2006 17 10 7
30/03/2006 11 8 3
31/03/2006 13 7 6
01/04/2006 12 8 4
02/04/2006 11 9 2
03/04/2006 12 10 2
04/04/2006 17 11 6
05/04/2006 13 7 6
06/04/2006 15 12 3
07/04/2006 13 9 4
08/04/2006 15 11 4

AECOM Review of Air Quality Impacts Resulting from Particle Emissions from Poultry Farms 54
Capabilities on project:
Environment
Date
Monitored Daily mean PM10
Concentration at Augher
(µg/m3)
Monitored Daily Mean PM10
Concentration at Lough
Navar (µg/m3)
Estimated Contribution
from Poultry Farm (µg/m3)
09/04/2006 14 8 6
10/04/2006 15 7 8
11/04/2006 18 13 5
12/04/2006 28 20 8
13/04/2006 28 17 11
14/04/2006 22 10 12
15/04/2006 19 9 10
16/04/2006 22 13 9
17/04/2006 23 9 14
18/04/2006 17 9 8
19/04/2006 18 18 0
20/04/2006 22 11 11
21/04/2006 30 10 20
22/04/2006 21 9 12
23/04/2006 26 10 16
24/04/2006 19 9 10
25/04/2006 21 14 7
26/04/2006 44 14 30
27/04/2006 61 22 39
28/04/2006 53 19 34
29/04/2006 56 13 43
30/04/2006 36 8 28
01/05/2006 73 9 64
02/05/2006 12 7 5
03/05/2006 18 14 4
04/05/2006 22 13 9
05/05/2006 13 10 3
06/05/2006 19 13 6
07/05/2006 18 13 5
08/05/2006 57 37 20
09/05/2006 53 28 25
10/05/2006 39 27 12
11/05/2006 36 19 17
12/05/2006 22 13 9
13/05/2006 18 13 5
14/05/2006 14 9 5
15/05/2006 15 10 5
16/05/2006 14 9 5
17/05/2006 11 7 4
18/05/2006 14 11 3
19/05/2006 5 7 0
20/05/2006 12 8 4
21/05/2006 7 6 1
22/05/2006 12 8 4
23/05/2006 11 8 3
24/05/2006 14 12 2
25/05/2006 18 13 5
26/05/2006 9 8 1
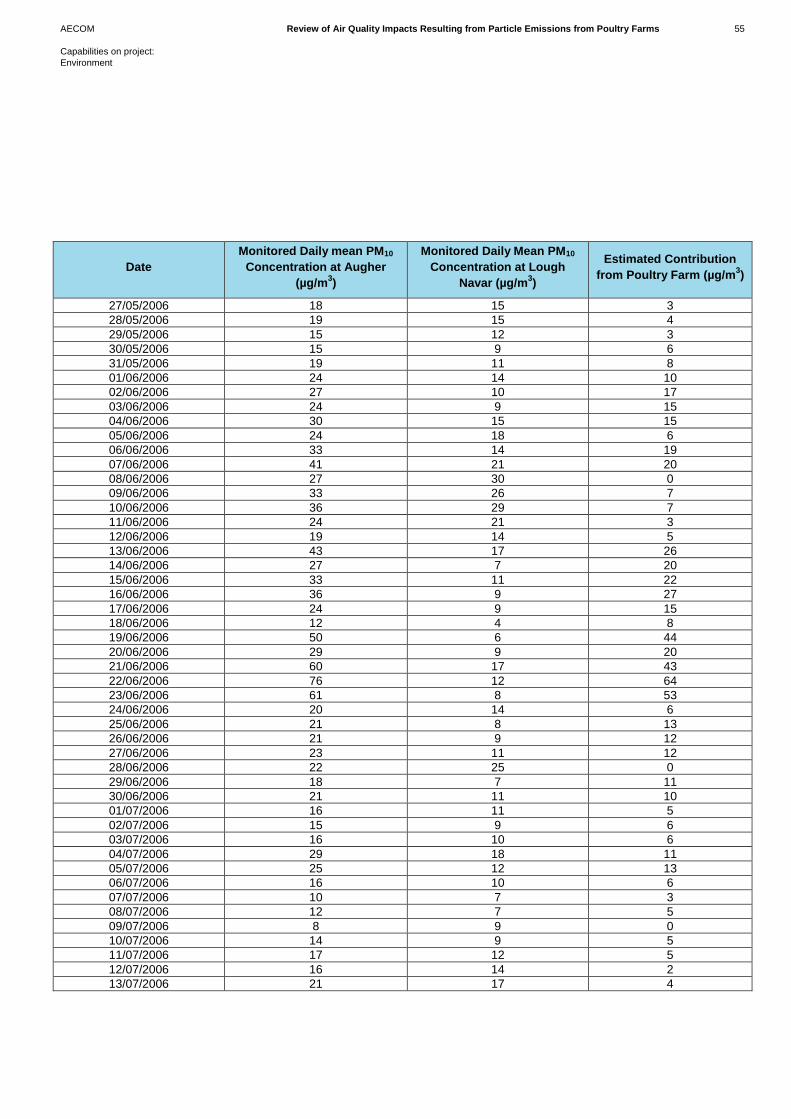
AECOM Review of Air Quality Impacts Resulting from Particle Emissions from Poultry Farms 55
Capabilities on project:
Environment
Date
Monitored Daily mean PM10
Concentration at Augher
(µg/m3)
Monitored Daily Mean PM10
Concentration at Lough
Navar (µg/m3)
Estimated Contribution
from Poultry Farm (µg/m3)
27/05/2006 18 15 3
28/05/2006 19 15 4
29/05/2006 15 12 3
30/05/2006 15 9 6
31/05/2006 19 11 8
01/06/2006 24 14 10
02/06/2006 27 10 17
03/06/2006 24 9 15
04/06/2006 30 15 15
05/06/2006 24 18 6
06/06/2006 33 14 19
07/06/2006 41 21 20
08/06/2006 27 30 0
09/06/2006 33 26 7
10/06/2006 36 29 7
11/06/2006 24 21 3
12/06/2006 19 14 5
13/06/2006 43 17 26
14/06/2006 27 7 20
15/06/2006 33 11 22
16/06/2006 36 9 27
17/06/2006 24 9 15
18/06/2006 12 4 8
19/06/2006 50 6 44
20/06/2006 29 9 20
21/06/2006 60 17 43
22/06/2006 76 12 64
23/06/2006 61 8 53
24/06/2006 20 14 6
25/06/2006 21 8 13
26/06/2006 21 9 12
27/06/2006 23 11 12
28/06/2006 22 25 0
29/06/2006 18 7 11
30/06/2006 21 11 10
01/07/2006 16 11 5
02/07/2006 15 9 6
03/07/2006 16 10 6
04/07/2006 29 18 11
05/07/2006 25 12 13
06/07/2006 16 10 6
07/07/2006 10 7 3
08/07/2006 12 7 5
09/07/2006 8 9 0
10/07/2006 14 9 5
11/07/2006 17 12 5
12/07/2006 16 14 2
13/07/2006 21 17 4
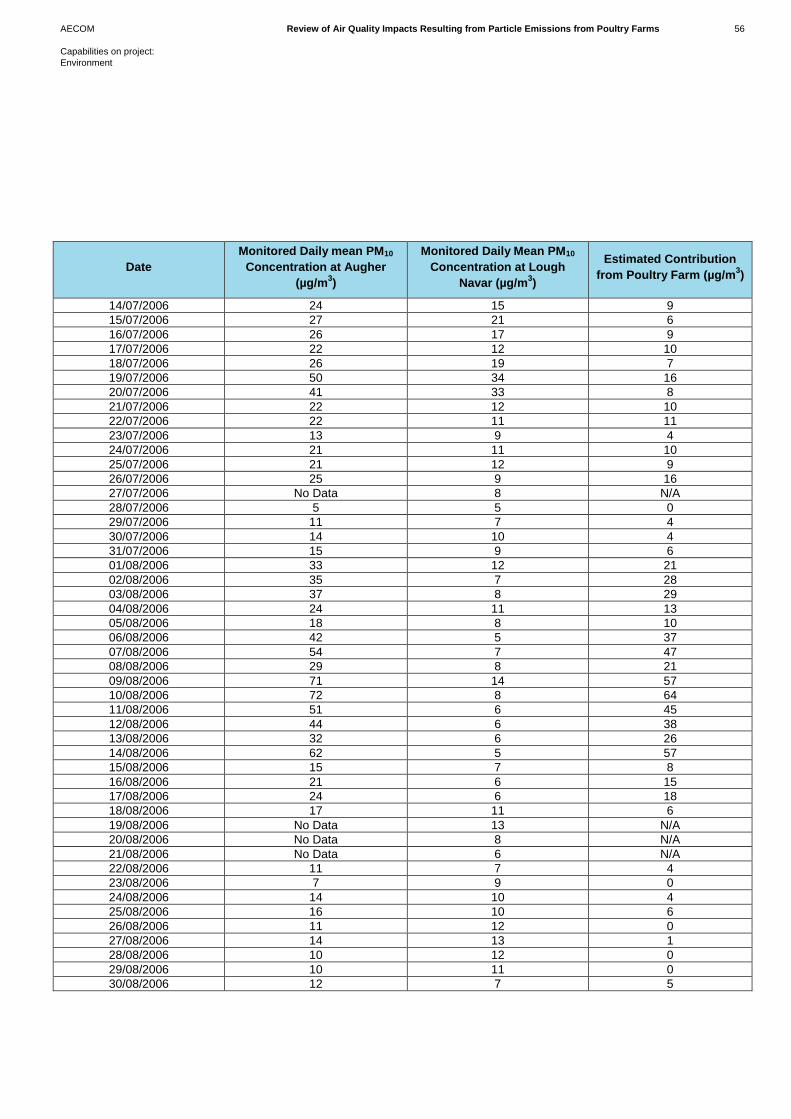
AECOM Review of Air Quality Impacts Resulting from Particle Emissions from Poultry Farms 56
Capabilities on project:
Environment
Date
Monitored Daily mean PM10
Concentration at Augher
(µg/m3)
Monitored Daily Mean PM10
Concentration at Lough
Navar (µg/m3)
Estimated Contribution
from Poultry Farm (µg/m3)
14/07/2006 24 15 9
15/07/2006 27 21 6
16/07/2006 26 17 9
17/07/2006 22 12 10
18/07/2006 26 19 7
19/07/2006 50 34 16
20/07/2006 41 33 8
21/07/2006 22 12 10
22/07/2006 22 11 11
23/07/2006 13 9 4
24/07/2006 21 11 10
25/07/2006 21 12 9
26/07/2006 25 9 16
27/07/2006 No Data 8 N/A
28/07/2006 5 5 0
29/07/2006 11 7 4
30/07/2006 14 10 4
31/07/2006 15 9 6
01/08/2006 33 12 21
02/08/2006 35 7 28
03/08/2006 37 8 29
04/08/2006 24 11 13
05/08/2006 18 8 10
06/08/2006 42 5 37
07/08/2006 54 7 47
08/08/2006 29 8 21
09/08/2006 71 14 57
10/08/2006 72 8 64
11/08/2006 51 6 45
12/08/2006 44 6 38
13/08/2006 32 6 26
14/08/2006 62 5 57
15/08/2006 15 7 8
16/08/2006 21 6 15
17/08/2006 24 6 18
18/08/2006 17 11 6
19/08/2006 No Data 13 N/A
20/08/2006 No Data 8 N/A
21/08/2006 No Data 6 N/A
22/08/2006 11 7 4
23/08/2006 7 9 0
24/08/2006 14 10 4
25/08/2006 16 10 6
26/08/2006 11 12 0
27/08/2006 14 13 1
28/08/2006 10 12 0
29/08/2006 10 11 0
30/08/2006 12 7 5

AECOM Review of Air Quality Impacts Resulting from Particle Emissions from Poultry Farms 57
Capabilities on project:
Environment
Date
Monitored Daily mean PM10
Concentration at Augher
(µg/m3)
Monitored Daily Mean PM10
Concentration at Lough
Navar (µg/m3)
Estimated Contribution
from Poultry Farm (µg/m3)
31/08/2006 13 9 4
01/09/2006 11 10 1
02/09/2006 10 7 3
03/09/2006 10 10 0
04/09/2006 15 11 4
05/09/2006 14 8 6
06/09/2006 8 9 0
07/09/2006 10 9 1
08/09/2006 19 13 6
09/09/2006 27 22 5
10/09/2006 26 18 8
11/09/2006 18 10 8
12/09/2006 13 7 6
13/09/2006 13 14 0
14/09/2006 19 26 0
15/09/2006 20 15 5
16/09/2006 21 15 6
17/09/2006 11 12 0
18/09/2006 13 9 4
19/09/2006 18 12 6
20/09/2006 13 8 5
21/09/2006 22 15 7
22/09/2006 20 12 8
23/09/2006 20 15 5
24/09/2006 20 17 3
25/09/2006 19 11 8
26/09/2006 13 8 5
27/09/2006 10 8 2
28/09/2006 18 9 9
29/09/2006 15 11 4
30/09/2006 17 11 6
01/10/2006 11 9 2
02/10/2006 38 10 28
03/10/2006 34 9 25
04/10/2006 21 8 13
05/10/2006 12 7 5
06/10/2006 29 11 18
07/10/2006 28 14 14
08/10/2006 13 9 4
09/10/2006 30 11 19
10/10/2006 21 14 7
11/10/2006 14 9 5
12/10/2006 28 18 10
13/10/2006 32 19 13
14/10/2006 30 21 9
15/10/2006 35 26 9
16/10/2006 48 37 11
17/10/2006 40 30 10
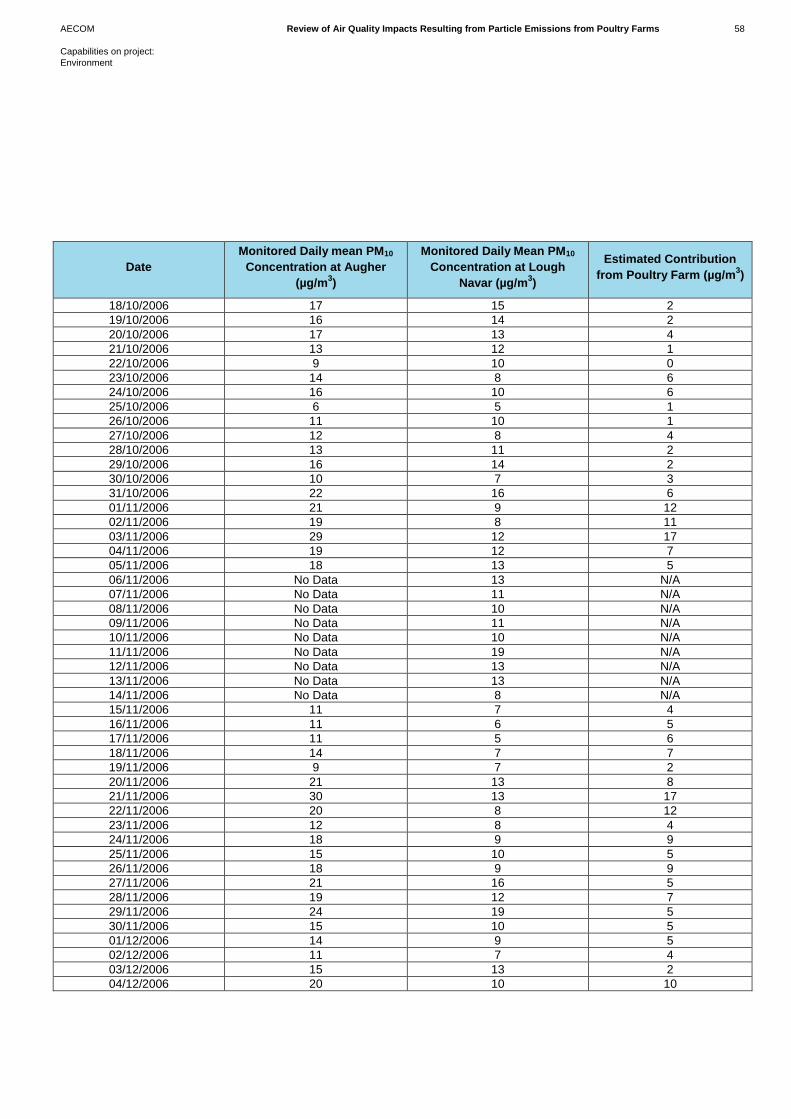
AECOM Review of Air Quality Impacts Resulting from Particle Emissions from Poultry Farms 58
Capabilities on project:
Environment
Date
Monitored Daily mean PM10
Concentration at Augher
(µg/m3)
Monitored Daily Mean PM10
Concentration at Lough
Navar (µg/m3)
Estimated Contribution
from Poultry Farm (µg/m3)
18/10/2006 17 15 2
19/10/2006 16 14 2
20/10/2006 17 13 4
21/10/2006 13 12 1
22/10/2006 9 10 0
23/10/2006 14 8 6
24/10/2006 16 10 6
25/10/2006 6 5 1
26/10/2006 11 10 1
27/10/2006 12 8 4
28/10/2006 13 11 2
29/10/2006 16 14 2
30/10/2006 10 7 3
31/10/2006 22 16 6
01/11/2006 21 9 12
02/11/2006 19 8 11
03/11/2006 29 12 17
04/11/2006 19 12 7
05/11/2006 18 13 5
06/11/2006 No Data 13 N/A
07/11/2006 No Data 11 N/A
08/11/2006 No Data 10 N/A
09/11/2006 No Data 11 N/A
10/11/2006 No Data 10 N/A
11/11/2006 No Data 19 N/A
12/11/2006 No Data 13 N/A
13/11/2006 No Data 13 N/A
14/11/2006 No Data 8 N/A
15/11/2006 11 7 4
16/11/2006 11 6 5
17/11/2006 11 5 6
18/11/2006 14 7 7
19/11/2006 9 7 2
20/11/2006 21 13 8
21/11/2006 30 13 17
22/11/2006 20 8 12
23/11/2006 12 8 4
24/11/2006 18 9 9
25/11/2006 15 10 5
26/11/2006 18 9 9
27/11/2006 21 16 5
28/11/2006 19 12 7
29/11/2006 24 19 5
30/11/2006 15 10 5
01/12/2006 14 9 5
02/12/2006 11 7 4
03/12/2006 15 13 2
04/12/2006 20 10 10
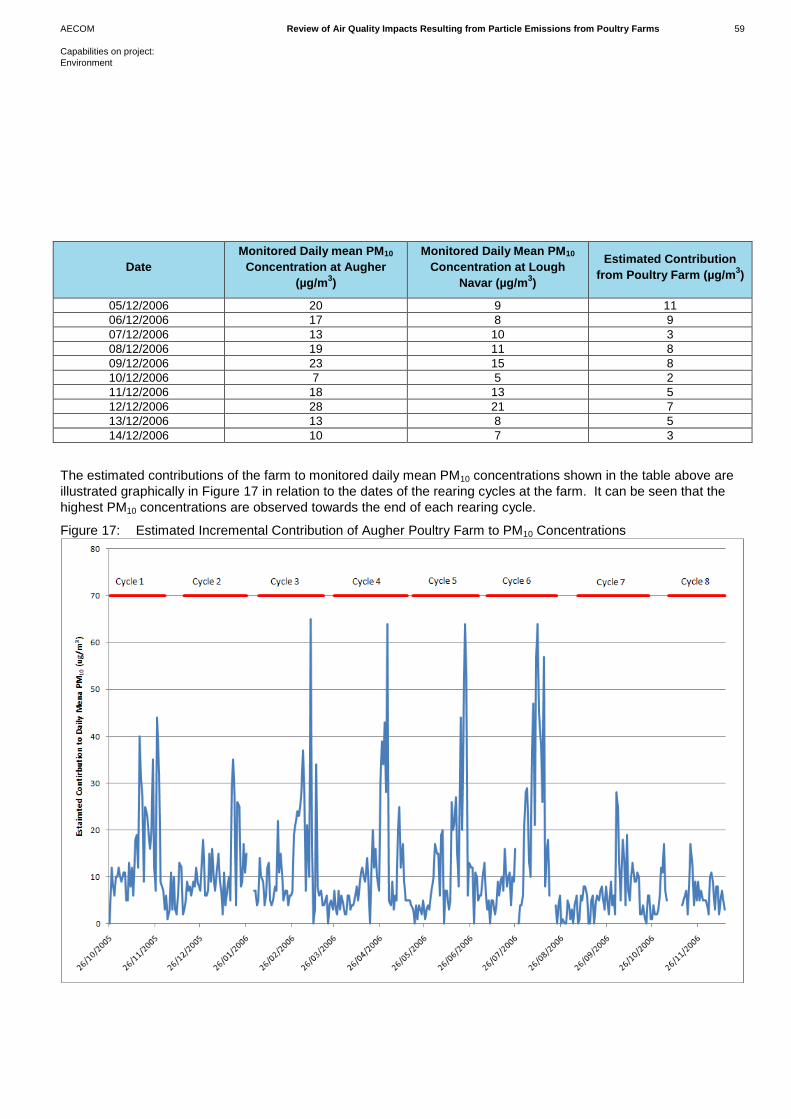
AECOM Review of Air Quality Impacts Resulting from Particle Emissions from Poultry Farms 59
Capabilities on project:
Environment
Date
Monitored Daily mean PM10
Concentration at Augher
(µg/m3)
Monitored Daily Mean PM10
Concentration at Lough
Navar (µg/m3)
Estimated Contribution
from Poultry Farm (µg/m3)
05/12/2006 20 9 11
06/12/2006 17 8 9
07/12/2006 13 10 3
08/12/2006 19 11 8
09/12/2006 23 15 8
10/12/2006 7 5 2
11/12/2006 18 13 5
12/12/2006 28 21 7
13/12/2006 13 8 5
14/12/2006 10 7 3
The estimated contributions of the farm to monitored daily mean PM10 concentrations shown in the table above are
illustrated graphically in Figure 17 in relation to the dates of the rearing cycles at the farm. It can be seen that the
highest PM10 concentrations are observed towards the end of each rearing cycle.
Figure 17: Estimated Incremental Contribution of Augher Poultry Farm to PM10 Concentrations
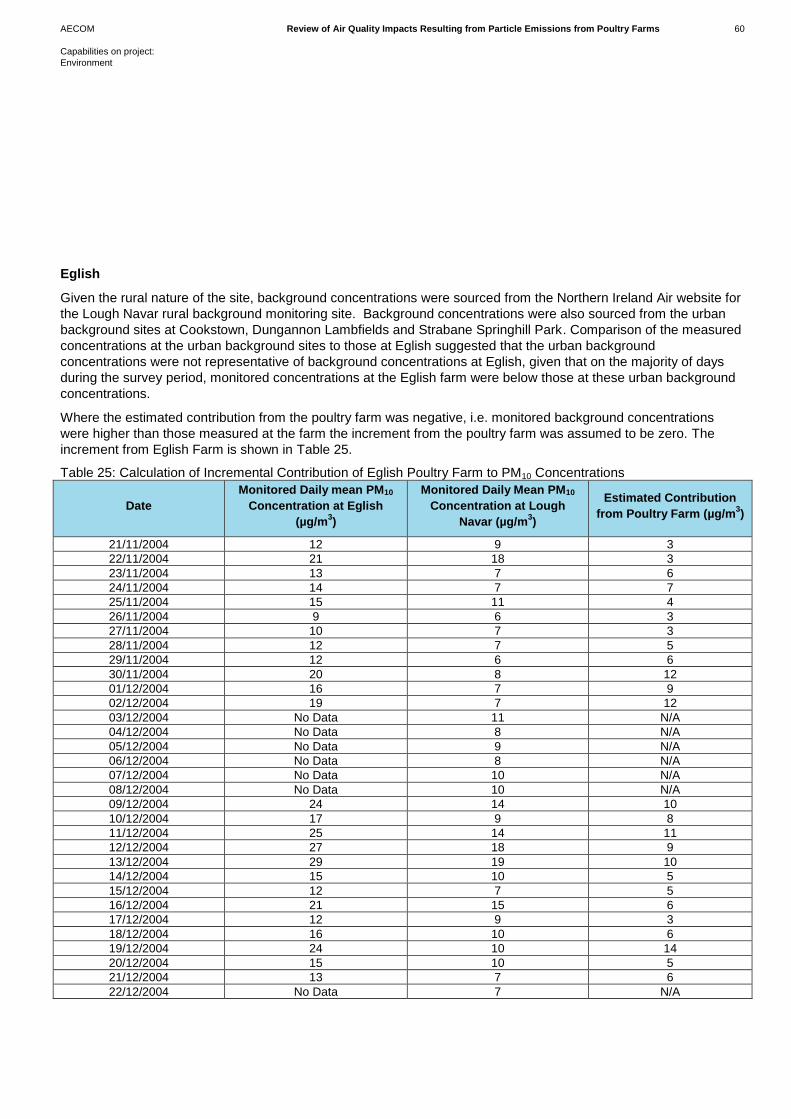
AECOM Review of Air Quality Impacts Resulting from Particle Emissions from Poultry Farms 60
Capabilities on project:
Environment
Eglish
Given the rural nature of the site, background concentrations were sourced from the Northern Ireland Air website for
the Lough Navar rural background monitoring site. Background concentrations were also sourced from the urban
background sites at Cookstown, Dungannon Lambfields and Strabane Springhill Park. Comparison of the measured
concentrations at the urban background sites to those at Eglish suggested that the urban background
concentrations were not representative of background concentrations at Eglish, given that on the majority of days
during the survey period, monitored concentrations at the Eglish farm were below those at these urban background
concentrations.
Where the estimated contribution from the poultry farm was negative, i.e. monitored background concentrations
were higher than those measured at the farm the increment from the poultry farm was assumed to be zero. The
increment from Eglish Farm is shown in Table 25.
Table 25: Calculation of Incremental Contribution of Eglish Poultry Farm to PM10 Concentrations
Date
Monitored Daily mean PM10
Concentration at Eglish
(µg/m3)
Monitored Daily Mean PM10
Concentration at Lough
Navar (µg/m3)
Estimated Contribution
from Poultry Farm (µg/m3)
21/11/2004 12 9 3
22/11/2004 21 18 3
23/11/2004 13 7 6
24/11/2004 14 7 7
25/11/2004 15 11 4
26/11/2004 9 6 3
27/11/2004 10 7 3
28/11/2004 12 7 5
29/11/2004 12 6 6
30/11/2004 20 8 12
01/12/2004 16 7 9
02/12/2004 19 7 12
03/12/2004 No Data 11 N/A
04/12/2004 No Data 8 N/A
05/12/2004 No Data 9 N/A
06/12/2004 No Data 8 N/A
07/12/2004 No Data 10 N/A
08/12/2004 No Data 10 N/A
09/12/2004 24 14 10
10/12/2004 17 9 8
11/12/2004 25 14 11
12/12/2004 27 18 9
13/12/2004 29 19 10
14/12/2004 15 10 5
15/12/2004 12 7 5
16/12/2004 21 15 6
17/12/2004 12 9 3
18/12/2004 16 10 6
19/12/2004 24 10 14
20/12/2004 15 10 5
21/12/2004 13 7 6
22/12/2004 No Data 7 N/A

AECOM Review of Air Quality Impacts Resulting from Particle Emissions from Poultry Farms 61
Capabilities on project:
Environment
Date
Monitored Daily mean PM10
Concentration at Eglish
(µg/m3)
Monitored Daily Mean PM10
Concentration at Lough
Navar (µg/m3)
Estimated Contribution
from Poultry Farm (µg/m3)
23/12/2004 No Data 14 N/A
24/12/2004 9 6 3
25/12/2004 14 0 ND
26/12/2004 No Data 13 N/A
27/12/2004 12 8 4
28/12/2004 21 15 6
29/12/2004 16 11 5
30/12/2004 24 9 15
31/12/2004 12 7 5
01/01/2005 14 10 4
02/01/2005 21 15 6
03/01/2005 14 11 3
04/01/2005 16 10 6
05/01/2005 21 11 10
06/01/2005 14 8 6
07/01/2005 9 4 5
08/01/2005 18 10 8
09/01/2005 13 8 5
10/01/2005 20 14 6
11/01/2005 13 11 2
12/01/2005 24 14 10
13/01/2005 25 11 14
14/01/2005 16 7 9
15/01/2005 19 12 7
16/01/2005 14 8 6
17/01/2005 8 5 3
18/01/2005 24 17 7
19/01/2005 24 14 10
20/01/2005 18 11 7
21/01/2005 17 12 5
22/01/2005 20 9 11
23/01/2005 13 9 4
24/01/2005 12 7 5
25/01/2005 21 13 8
26/01/2005 16 7 9
27/01/2005 15 5 10
28/01/2005 11 7 4
29/01/2005 8 5 3
30/01/2005 6 5 1
31/01/2005 No Data 12 N/A
01/02/2005 No Data 6 N/A
02/02/2005 No Data 11 N/A
03/02/2005 10 7 3
04/02/2005 7 3 4
05/02/2005 9 5 4
06/02/2005 15 7 8
07/02/2005 16 9 7
08/02/2005 10 8 2

AECOM Review of Air Quality Impacts Resulting from Particle Emissions from Poultry Farms 62
Capabilities on project:
Environment
Date
Monitored Daily mean PM10
Concentration at Eglish
(µg/m3)
Monitored Daily Mean PM10
Concentration at Lough
Navar (µg/m3)
Estimated Contribution
from Poultry Farm (µg/m3)
09/02/2005 17 15 2
10/02/2005 28 18 10
11/02/2005 16 7 9
12/02/2005 13 12 1
13/02/2005 26 18 8
14/02/2005 17 9 8
15/02/2005 19 7 12
16/02/2005 21 8 13
17/02/2005 18 7 11
18/02/2005 22 13 9
19/02/2005 26 15 11
20/02/2005 24 8 16
21/02/2005 15 6 9
22/02/2005 23 8 15
23/02/2005 24 7 17
24/02/2005 27 12 15
25/02/2005 30 14 16
26/02/2005 30 9 21
27/02/2005 35 9 26
28/02/2005 34 8 26
01/03/2005 40 6 34
02/03/2005 50 7 43
03/03/2005 50 8 42
04/03/2005 47 22 25
05/03/2005 51 18 33
06/03/2005 48 8 40
07/03/2005 32 5 27
08/03/2005 51 6 45
09/03/2005 43 6 37
10/03/2005 35 10 25
11/03/2005 26 14 12
12/03/2005 19 11 8
13/03/2005 21 9 12
14/03/2005 16 12 4
15/03/2005 19 15 4
16/03/2005 18 20 0
17/03/2005 24 19 5
18/03/2005 16 11 5
19/03/2005 37 24 13
20/03/2005 35 26 9
21/03/2005 24 10 14
22/03/2005 13 10 3
23/03/2005 22 15 7
24/03/2005 20 14 6
25/03/2005 20 11 9
26/03/2005 19 11 8
27/03/2005 11 9 2
28/03/2005 14 11 3
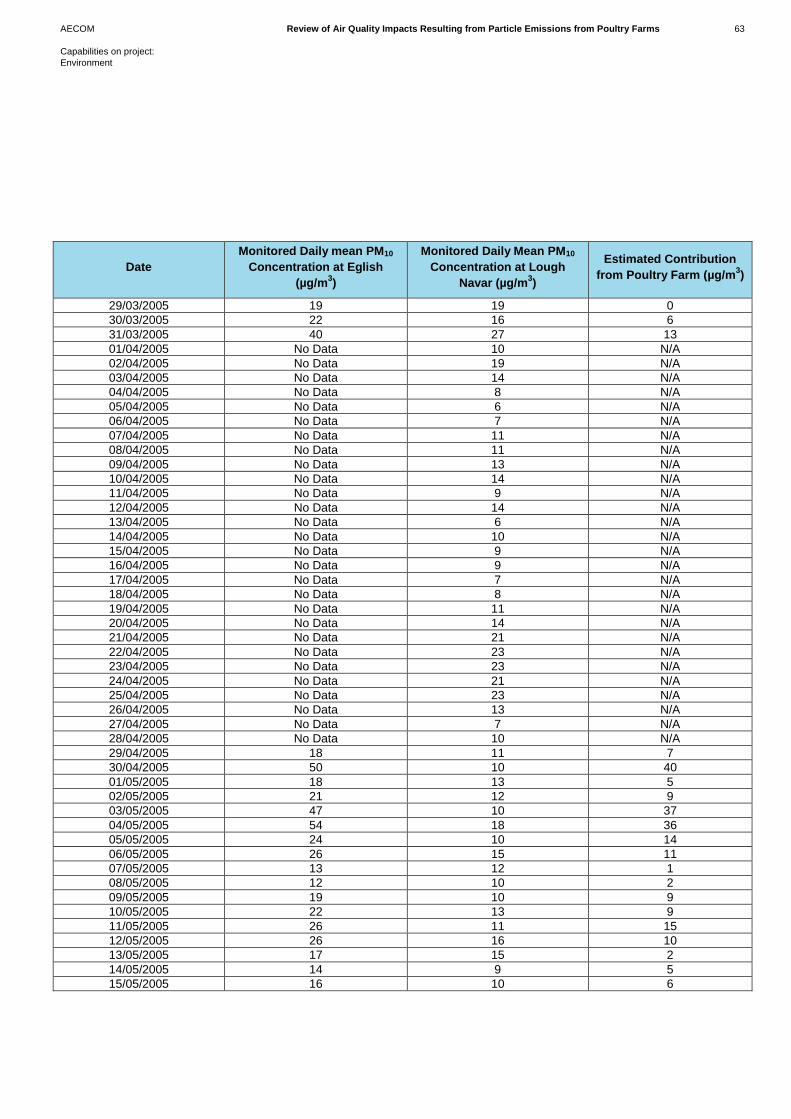
AECOM Review of Air Quality Impacts Resulting from Particle Emissions from Poultry Farms 63
Capabilities on project:
Environment
Date
Monitored Daily mean PM10
Concentration at Eglish
(µg/m3)
Monitored Daily Mean PM10
Concentration at Lough
Navar (µg/m3)
Estimated Contribution
from Poultry Farm (µg/m3)
29/03/2005 19 19 0
30/03/2005 22 16 6
31/03/2005 40 27 13
01/04/2005 No Data 10 N/A
02/04/2005 No Data 19 N/A
03/04/2005 No Data 14 N/A
04/04/2005 No Data 8 N/A
05/04/2005 No Data 6 N/A
06/04/2005 No Data 7 N/A
07/04/2005 No Data 11 N/A
08/04/2005 No Data 11 N/A
09/04/2005 No Data 13 N/A
10/04/2005 No Data 14 N/A
11/04/2005 No Data 9 N/A
12/04/2005 No Data 14 N/A
13/04/2005 No Data 6 N/A
14/04/2005 No Data 10 N/A
15/04/2005 No Data 9 N/A
16/04/2005 No Data 9 N/A
17/04/2005 No Data 7 N/A
18/04/2005 No Data 8 N/A
19/04/2005 No Data 11 N/A
20/04/2005 No Data 14 N/A
21/04/2005 No Data 21 N/A
22/04/2005 No Data 23 N/A
23/04/2005 No Data 23 N/A
24/04/2005 No Data 21 N/A
25/04/2005 No Data 23 N/A
26/04/2005 No Data 13 N/A
27/04/2005 No Data 7 N/A
28/04/2005 No Data 10 N/A
29/04/2005 18 11 7
30/04/2005 50 10 40
01/05/2005 18 13 5
02/05/2005 21 12 9
03/05/2005 47 10 37
04/05/2005 54 18 36
05/05/2005 24 10 14
06/05/2005 26 15 11
07/05/2005 13 12 1
08/05/2005 12 10 2
09/05/2005 19 10 9
10/05/2005 22 13 9
11/05/2005 26 11 15
12/05/2005 26 16 10
13/05/2005 17 15 2
14/05/2005 14 9 5
15/05/2005 16 10 6
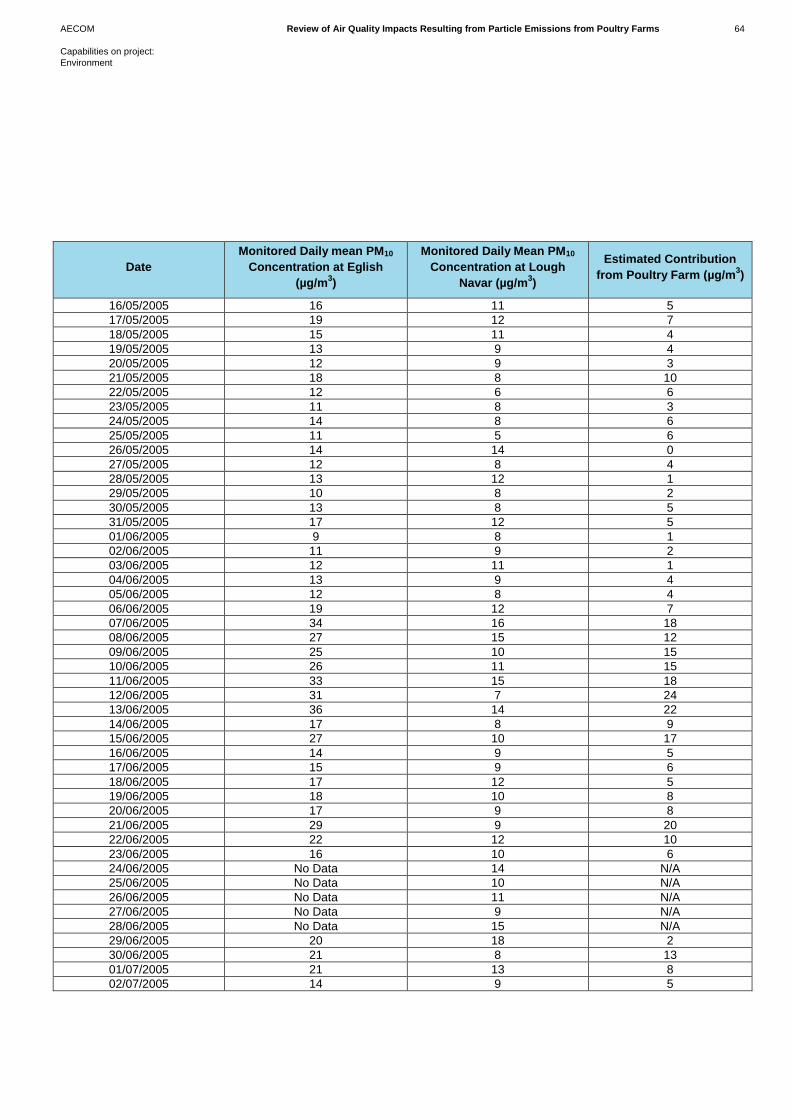
AECOM Review of Air Quality Impacts Resulting from Particle Emissions from Poultry Farms 64
Capabilities on project:
Environment
Date
Monitored Daily mean PM10
Concentration at Eglish
(µg/m3)
Monitored Daily Mean PM10
Concentration at Lough
Navar (µg/m3)
Estimated Contribution
from Poultry Farm (µg/m3)
16/05/2005 16 11 5
17/05/2005 19 12 7
18/05/2005 15 11 4
19/05/2005 13 9 4
20/05/2005 12 9 3
21/05/2005 18 8 10
22/05/2005 12 6 6
23/05/2005 11 8 3
24/05/2005 14 8 6
25/05/2005 11 5 6
26/05/2005 14 14 0
27/05/2005 12 8 4
28/05/2005 13 12 1
29/05/2005 10 8 2
30/05/2005 13 8 5
31/05/2005 17 12 5
01/06/2005 9 8 1
02/06/2005 11 9 2
03/06/2005 12 11 1
04/06/2005 13 9 4
05/06/2005 12 8 4
06/06/2005 19 12 7
07/06/2005 34 16 18
08/06/2005 27 15 12
09/06/2005 25 10 15
10/06/2005 26 11 15
11/06/2005 33 15 18
12/06/2005 31 7 24
13/06/2005 36 14 22
14/06/2005 17 8 9
15/06/2005 27 10 17
16/06/2005 14 9 5
17/06/2005 15 9 6
18/06/2005 17 12 5
19/06/2005 18 10 8
20/06/2005 17 9 8
21/06/2005 29 9 20
22/06/2005 22 12 10
23/06/2005 16 10 6
24/06/2005 No Data 14 N/A
25/06/2005 No Data 10 N/A
26/06/2005 No Data 11 N/A
27/06/2005 No Data 9 N/A
28/06/2005 No Data 15 N/A
29/06/2005 20 18 2
30/06/2005 21 8 13
01/07/2005 21 13 8
02/07/2005 14 9 5

AECOM Review of Air Quality Impacts Resulting from Particle Emissions from Poultry Farms 65
Capabilities on project:
Environment
Date
Monitored Daily mean PM10
Concentration at Eglish
(µg/m3)
Monitored Daily Mean PM10
Concentration at Lough
Navar (µg/m3)
Estimated Contribution
from Poultry Farm (µg/m3)
03/07/2005 12 9 3
04/07/2005 13 11 2
05/07/2005 12 8 4
06/07/2005 17 10 7
07/07/2005 13 9 4
08/07/2005 9 7 2
09/07/2005 9 7 2
10/07/2005 13 8 5
11/07/2005 17 13 4
12/07/2005 28 10 18
13/07/2005 11 7 4
14/07/2005 14 9 5
15/07/2005 20 15 5
16/07/2005 21 13 8
17/07/2005 14 7 7
18/07/2005 14 12 2
19/07/2005 14 10 4
20/07/2005 16 11 5
21/07/2005 16 6 10
22/07/2005 15 6 9
23/07/2005 13 8 5
24/07/2005 19 15 4
25/07/2005 18 10 8
26/07/2005 20 9 11
27/07/2005 22 12 10
28/07/2005 28 13 15
29/07/2005 23 9 14
30/07/2005 30 6 24
31/07/2005 32 7 25
01/08/2005 26 9 17
02/08/2005 26 11 15
03/08/2005 36 15 21
04/08/2005 28 9 19
05/08/2005 46 9 37
06/08/2005 31 9 22
07/08/2005 35 9 26
08/08/2005 39 11 28
09/08/2005 38 6 32
10/08/2005 35 15 20
11/08/2005 33 6 27
12/08/2005 29 7 22
13/08/2005 29 8 21
14/08/2005 26 9 17
15/08/2005 24 10 14
16/08/2005 20 11 9
17/08/2005 20 9 11
18/08/2005 8 8 0
19/08/2005 15 16 0
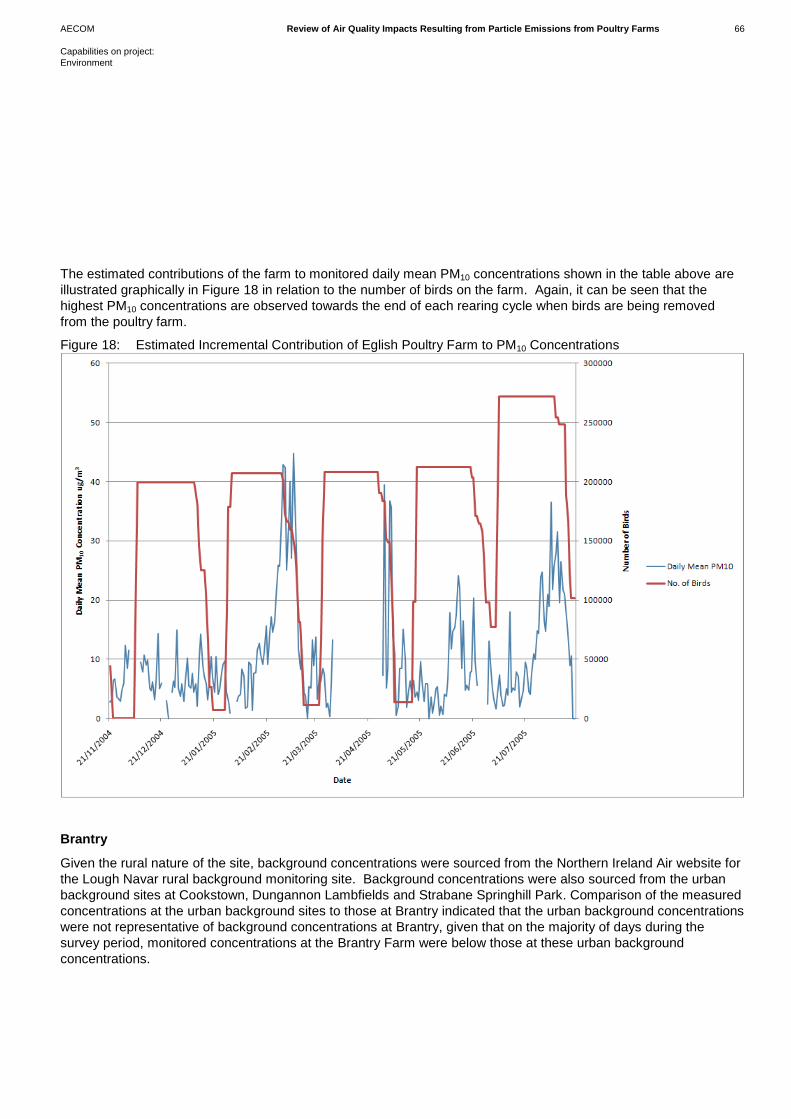
AECOM Review of Air Quality Impacts Resulting from Particle Emissions from Poultry Farms 66
Capabilities on project:
Environment
The estimated contributions of the farm to monitored daily mean PM10 concentrations shown in the table above are
illustrated graphically in Figure 18 in relation to the number of birds on the farm. Again, it can be seen that the
highest PM10 concentrations are observed towards the end of each rearing cycle when birds are being removed
from the poultry farm.
Figure 18: Estimated Incremental Contribution of Eglish Poultry Farm to PM10 Concentrations
Brantry
Given the rural nature of the site, background concentrations were sourced from the Northern Ireland Air website for
the Lough Navar rural background monitoring site. Background concentrations were also sourced from the urban
background sites at Cookstown, Dungannon Lambfields and Strabane Springhill Park. Comparison of the measured
concentrations at the urban background sites to those at Brantry indicated that the urban background concentrations
were not representative of background concentrations at Brantry, given that on the majority of days during the
survey period, monitored concentrations at the Brantry Farm were below those at these urban background
concentrations.
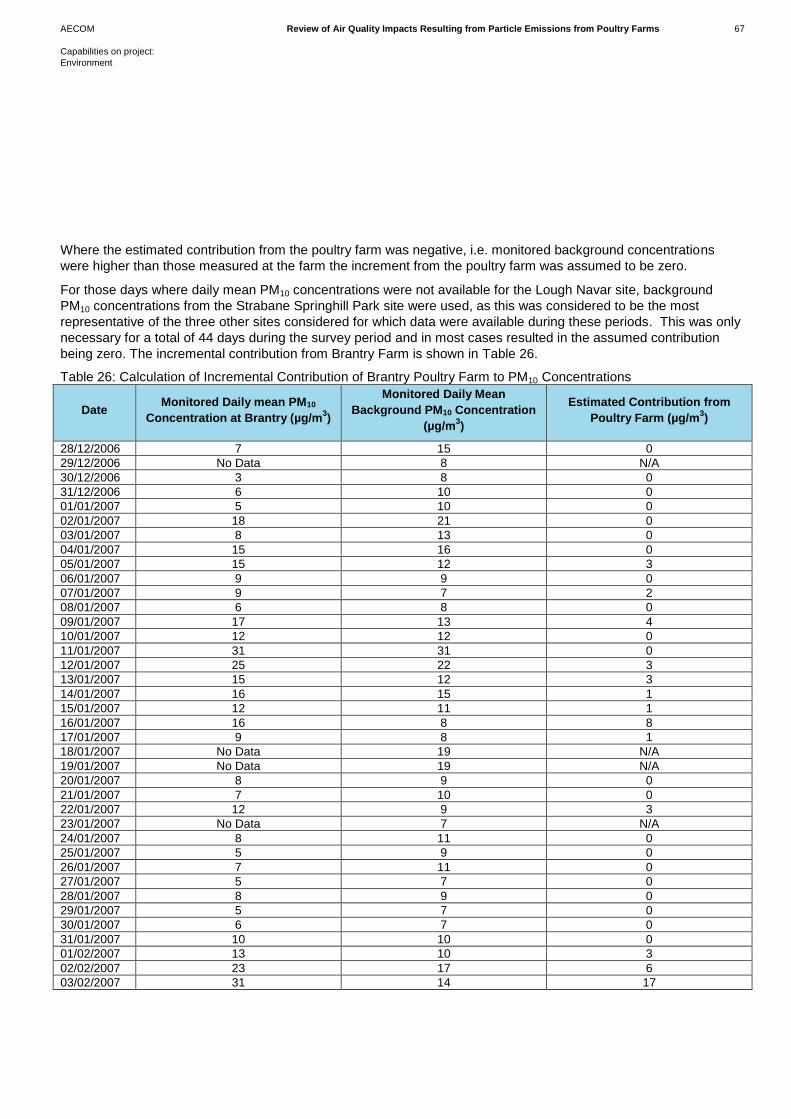
AECOM Review of Air Quality Impacts Resulting from Particle Emissions from Poultry Farms 67
Capabilities on project:
Environment
Where the estimated contribution from the poultry farm was negative, i.e. monitored background concentrations
were higher than those measured at the farm the increment from the poultry farm was assumed to be zero.
For those days where daily mean PM10 concentrations were not available for the Lough Navar site, background
PM10 concentrations from the Strabane Springhill Park site were used, as this was considered to be the most
representative of the three other sites considered for which data were available during these periods. This was only
necessary for a total of 44 days during the survey period and in most cases resulted in the assumed contribution
being zero. The incremental contribution from Brantry Farm is shown in Table 26.
Table 26: Calculation of Incremental Contribution of Brantry Poultry Farm to PM10 Concentrations
Date Monitored Daily mean PM10
Concentration at Brantry (µg/m3)
Monitored Daily Mean
Background PM10 Concentration
(µg/m3)
Estimated Contribution from
Poultry Farm (µg/m3)
28/12/2006 7 15 0
29/12/2006 No Data 8 N/A
30/12/2006 3 8 0
31/12/2006 6 10 0
01/01/2007 5 10 0
02/01/2007 18 21 0
03/01/2007 8 13 0
04/01/2007 15 16 0
05/01/2007 15 12 3
06/01/2007 9 9 0
07/01/2007 9 7 2
08/01/2007 6 8 0
09/01/2007 17 13 4
10/01/2007 12 12 0
11/01/2007 31 31 0
12/01/2007 25 22 3
13/01/2007 15 12 3
14/01/2007 16 15 1
15/01/2007 12 11 1
16/01/2007 16 8 8
17/01/2007 9 8 1
18/01/2007 No Data 19 N/A
19/01/2007 No Data 19 N/A
20/01/2007 8 9 0
21/01/2007 7 10 0
22/01/2007 12 9 3
23/01/2007 No Data 7 N/A
24/01/2007 8 11 0
25/01/2007 5 9 0
26/01/2007 7 11 0
27/01/2007 5 7 0
28/01/2007 8 9 0
29/01/2007 5 7 0
30/01/2007 6 7 0
31/01/2007 10 10 0
01/02/2007 13 10 3
02/02/2007 23 17 6
03/02/2007 31 14 17
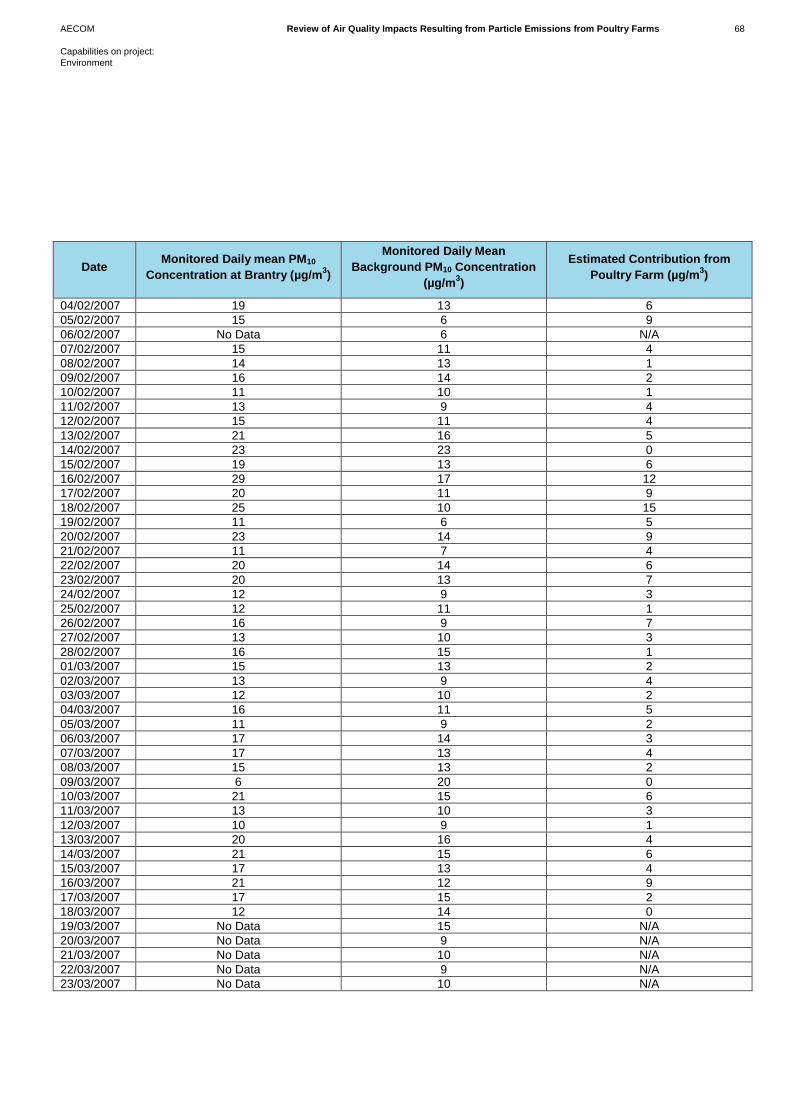
AECOM Review of Air Quality Impacts Resulting from Particle Emissions from Poultry Farms 68
Capabilities on project:
Environment
Date Monitored Daily mean PM10
Concentration at Brantry (µg/m3)
Monitored Daily Mean
Background PM10 Concentration
(µg/m3)
Estimated Contribution from
Poultry Farm (µg/m3)
04/02/2007 19 13 6
05/02/2007 15 6 9
06/02/2007 No Data 6 N/A
07/02/2007 15 11 4
08/02/2007 14 13 1
09/02/2007 16 14 2
10/02/2007 11 10 1
11/02/2007 13 9 4
12/02/2007 15 11 4
13/02/2007 21 16 5
14/02/2007 23 23 0
15/02/2007 19 13 6
16/02/2007 29 17 12
17/02/2007 20 11 9
18/02/2007 25 10 15
19/02/2007 11 6 5
20/02/2007 23 14 9
21/02/2007 11 7 4
22/02/2007 20 14 6
23/02/2007 20 13 7
24/02/2007 12 9 3
25/02/2007 12 11 1
26/02/2007 16 9 7
27/02/2007 13 10 3
28/02/2007 16 15 1
01/03/2007 15 13 2
02/03/2007 13 9 4
03/03/2007 12 10 2
04/03/2007 16 11 5
05/03/2007 11 9 2
06/03/2007 17 14 3
07/03/2007 17 13 4
08/03/2007 15 13 2
09/03/2007 6 20 0
10/03/2007 21 15 6
11/03/2007 13 10 3
12/03/2007 10 9 1
13/03/2007 20 16 4
14/03/2007 21 15 6
15/03/2007 17 13 4
16/03/2007 21 12 9
17/03/2007 17 15 2
18/03/2007 12 14 0
19/03/2007 No Data 15 N/A
20/03/2007 No Data 9 N/A
21/03/2007 No Data 10 N/A
22/03/2007 No Data 9 N/A
23/03/2007 No Data 10 N/A

AECOM Review of Air Quality Impacts Resulting from Particle Emissions from Poultry Farms 69
Capabilities on project:
Environment
Date Monitored Daily mean PM10
Concentration at Brantry (µg/m3)
Monitored Daily Mean
Background PM10 Concentration
(µg/m3)
Estimated Contribution from
Poultry Farm (µg/m3)
24/03/2007 No Data 15 N/A
25/03/2007 50 39 11
26/03/2007 56 40 16
27/03/2007 72 56 16
28/03/2007 20 22 0
29/03/2007 10 7 3
30/03/2007 50 41 9
31/03/2007 48 39 9
01/04/2007 25 18 7
02/04/2007 No Data 23 N/A
03/04/2007 13 18 0
04/04/2007 14 12 2
05/04/2007 12 13 0
06/04/2007 22 17 5
07/04/2007 29 20 9
08/04/2007 17 18 0
09/04/2007 11 13 0
10/04/2007 12 8 4
11/04/2007 14 10 4
12/04/2007 24 19 5
13/04/2007 40 29 11
14/04/2007 41 36 5
15/04/2007 No Data 21 N/A
16/04/2007 No Data 10 N/A
17/04/2007 7 10 0
18/04/2007 11 11 0
19/04/2007 13 9 4
20/04/2007 32 21 11
21/04/2007 28 21 7
22/04/2007 13 8 5
23/04/2007 7 5 2
24/04/2007 9 11 0
25/04/2007 13 17 0
26/04/2007 23 9 14
27/04/2007 42 13 29
28/04/2007 30 16 14
29/04/2007 40 22 18
30/04/2007 37 21 16
01/05/2007 44 20 24
02/05/2007 67 19 48
03/05/2007 51 16 35
04/05/2007 37 17 20
05/05/2007 23 20 3
06/05/2007 15 16 0
07/05/2007 12 12 0
08/05/2007 10 10 0
09/05/2007 10 9 1
10/05/2007 9 9 0

AECOM Review of Air Quality Impacts Resulting from Particle Emissions from Poultry Farms 70
Capabilities on project:
Environment
Date Monitored Daily mean PM10
Concentration at Brantry (µg/m3)
Monitored Daily Mean
Background PM10 Concentration
(µg/m3)
Estimated Contribution from
Poultry Farm (µg/m3)
11/05/2007 10 7 3
12/05/2007 10 9 1
13/05/2007 12 9 3
14/05/2007 10 9 1
15/05/2007 11 7 4
16/05/2007 7 7 0
17/05/2007 6 6 0
18/05/2007 12 13 0
19/05/2007 17 16 1
20/05/2007 12 12 0
21/05/2007 12 9 3
22/05/2007 27 30 0
23/05/2007 9 6 3
24/05/2007 6 5 1
25/05/2007 12 11 1
26/05/2007 9 7 2
27/05/2007 15 10 5
28/05/2007 14 9 5
29/05/2007 14 11 3
30/05/2007 No Data 12 N/A
31/05/2007 No Data 11 N/A
01/06/2007 10 15 0
02/06/2007 9 7 2
03/06/2007 12 10 2
04/06/2007 30 14 16
05/06/2007 45 16 29
06/06/2007 49 16 33
07/06/2007 43 18 25
08/06/2007 40 21 19
09/06/2007 40 19 21
10/06/2007 50 21 29
11/06/2007 25 30 0
12/06/2007 25 28 0
13/06/2007 25 7 18
14/06/2007 31 7 24
15/06/2007 32 7 25
16/06/2007 26 8 18
17/06/2007 35 10 25
18/06/2007 21 13 8
19/06/2007 21 16 5
20/06/2007 28 17 11
21/06/2007 18 16 2
22/06/2007 9 9 0
23/06/2007 12 7 5
24/06/2007 14 8 6
25/06/2007 No Data 10 N/A
26/06/2007 11 18 0
27/06/2007 11 10 1
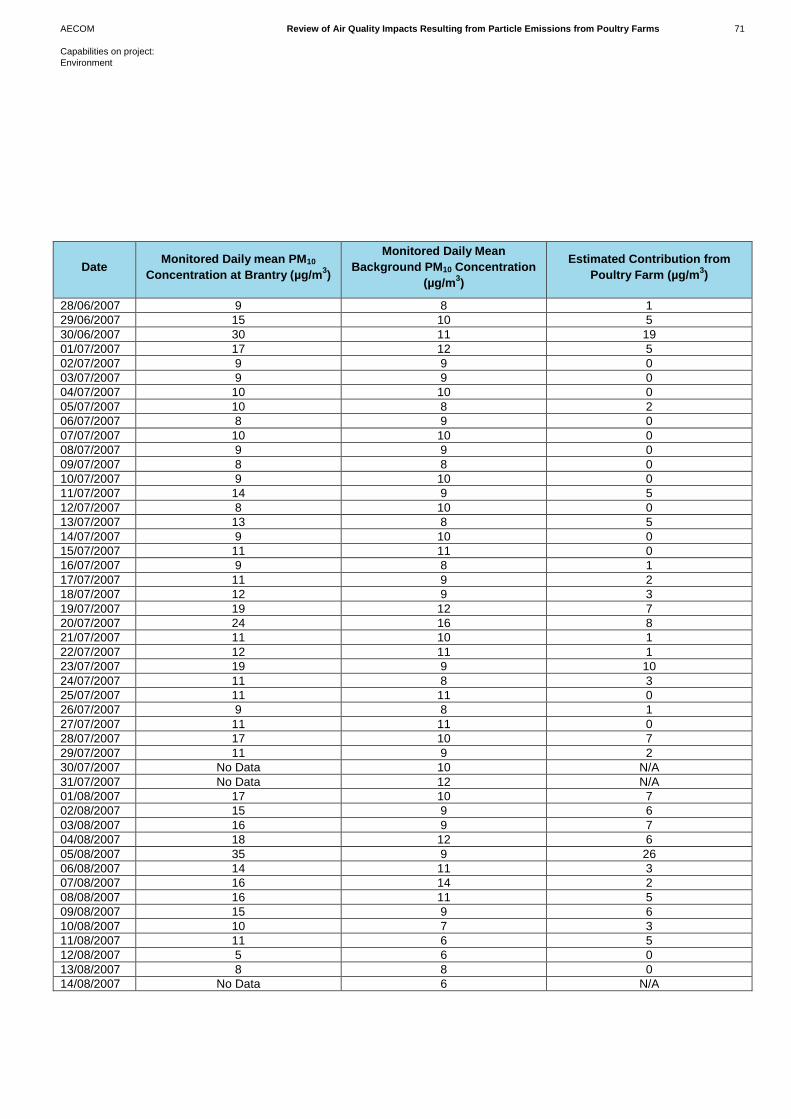
AECOM Review of Air Quality Impacts Resulting from Particle Emissions from Poultry Farms 71
Capabilities on project:
Environment
Date Monitored Daily mean PM10
Concentration at Brantry (µg/m3)
Monitored Daily Mean
Background PM10 Concentration
(µg/m3)
Estimated Contribution from
Poultry Farm (µg/m3)
28/06/2007 9 8 1
29/06/2007 15 10 5
30/06/2007 30 11 19
01/07/2007 17 12 5
02/07/2007 9 9 0
03/07/2007 9 9 0
04/07/2007 10 10 0
05/07/2007 10 8 2
06/07/2007 8 9 0
07/07/2007 10 10 0
08/07/2007 9 9 0
09/07/2007 8 8 0
10/07/2007 9 10 0
11/07/2007 14 9 5
12/07/2007 8 10 0
13/07/2007 13 8 5
14/07/2007 9 10 0
15/07/2007 11 11 0
16/07/2007 9 8 1
17/07/2007 11 9 2
18/07/2007 12 9 3
19/07/2007 19 12 7
20/07/2007 24 16 8
21/07/2007 11 10 1
22/07/2007 12 11 1
23/07/2007 19 9 10
24/07/2007 11 8 3
25/07/2007 11 11 0
26/07/2007 9 8 1
27/07/2007 11 11 0
28/07/2007 17 10 7
29/07/2007 11 9 2
30/07/2007 No Data 10 N/A
31/07/2007 No Data 12 N/A
01/08/2007 17 10 7
02/08/2007 15 9 6
03/08/2007 16 9 7
04/08/2007 18 12 6
05/08/2007 35 9 26
06/08/2007 14 11 3
07/08/2007 16 14 2
08/08/2007 16 11 5
09/08/2007 15 9 6
10/08/2007 10 7 3
11/08/2007 11 6 5
12/08/2007 5 6 0
13/08/2007 8 8 0
14/08/2007 No Data 6 N/A
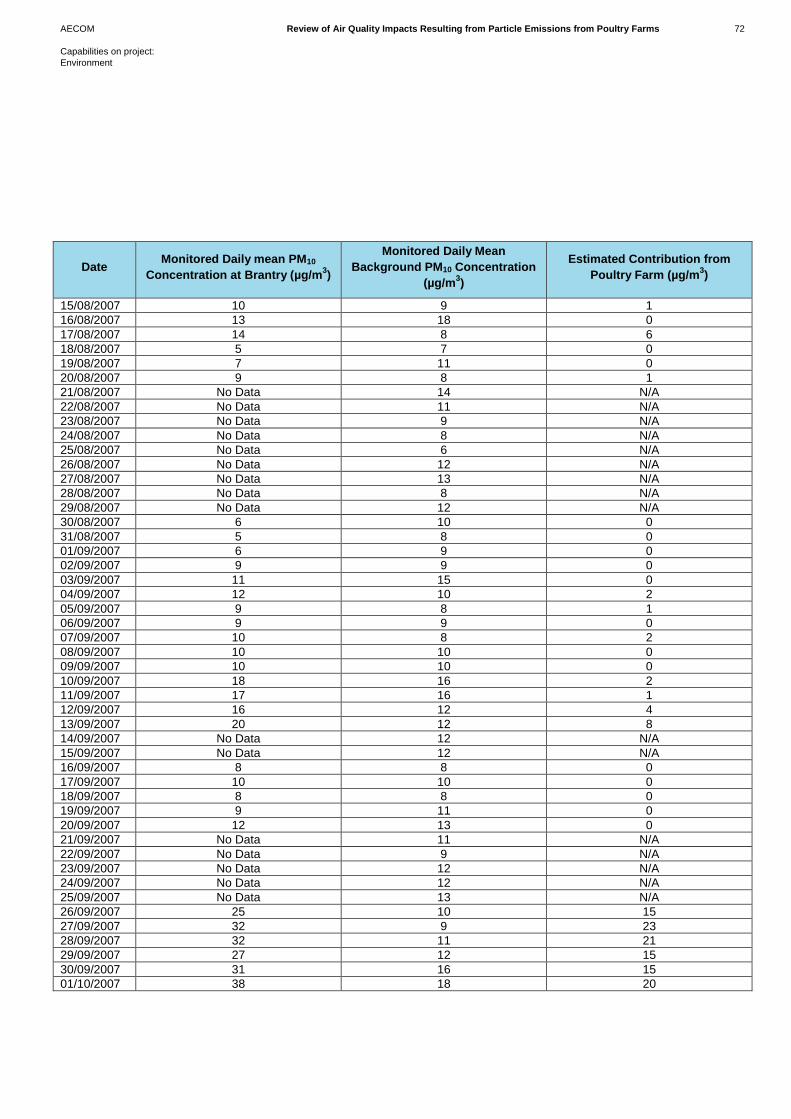
AECOM Review of Air Quality Impacts Resulting from Particle Emissions from Poultry Farms 72
Capabilities on project:
Environment
Date Monitored Daily mean PM10
Concentration at Brantry (µg/m3)
Monitored Daily Mean
Background PM10 Concentration
(µg/m3)
Estimated Contribution from
Poultry Farm (µg/m3)
15/08/2007 10 9 1
16/08/2007 13 18 0
17/08/2007 14 8 6
18/08/2007 5 7 0
19/08/2007 7 11 0
20/08/2007 9 8 1
21/08/2007 No Data 14 N/A
22/08/2007 No Data 11 N/A
23/08/2007 No Data 9 N/A
24/08/2007 No Data 8 N/A
25/08/2007 No Data 6 N/A
26/08/2007 No Data 12 N/A
27/08/2007 No Data 13 N/A
28/08/2007 No Data 8 N/A
29/08/2007 No Data 12 N/A
30/08/2007 6 10 0
31/08/2007 5 8 0
01/09/2007 6 9 0
02/09/2007 9 9 0
03/09/2007 11 15 0
04/09/2007 12 10 2
05/09/2007 9 8 1
06/09/2007 9 9 0
07/09/2007 10 8 2
08/09/2007 10 10 0
09/09/2007 10 10 0
10/09/2007 18 16 2
11/09/2007 17 16 1
12/09/2007 16 12 4
13/09/2007 20 12 8
14/09/2007 No Data 12 N/A
15/09/2007 No Data 12 N/A
16/09/2007 8 8 0
17/09/2007 10 10 0
18/09/2007 8 8 0
19/09/2007 9 11 0
20/09/2007 12 13 0
21/09/2007 No Data 11 N/A
22/09/2007 No Data 9 N/A
23/09/2007 No Data 12 N/A
24/09/2007 No Data 12 N/A
25/09/2007 No Data 13 N/A
26/09/2007 25 10 15
27/09/2007 32 9 23
28/09/2007 32 11 21
29/09/2007 27 12 15
30/09/2007 31 16 15
01/10/2007 38 18 20
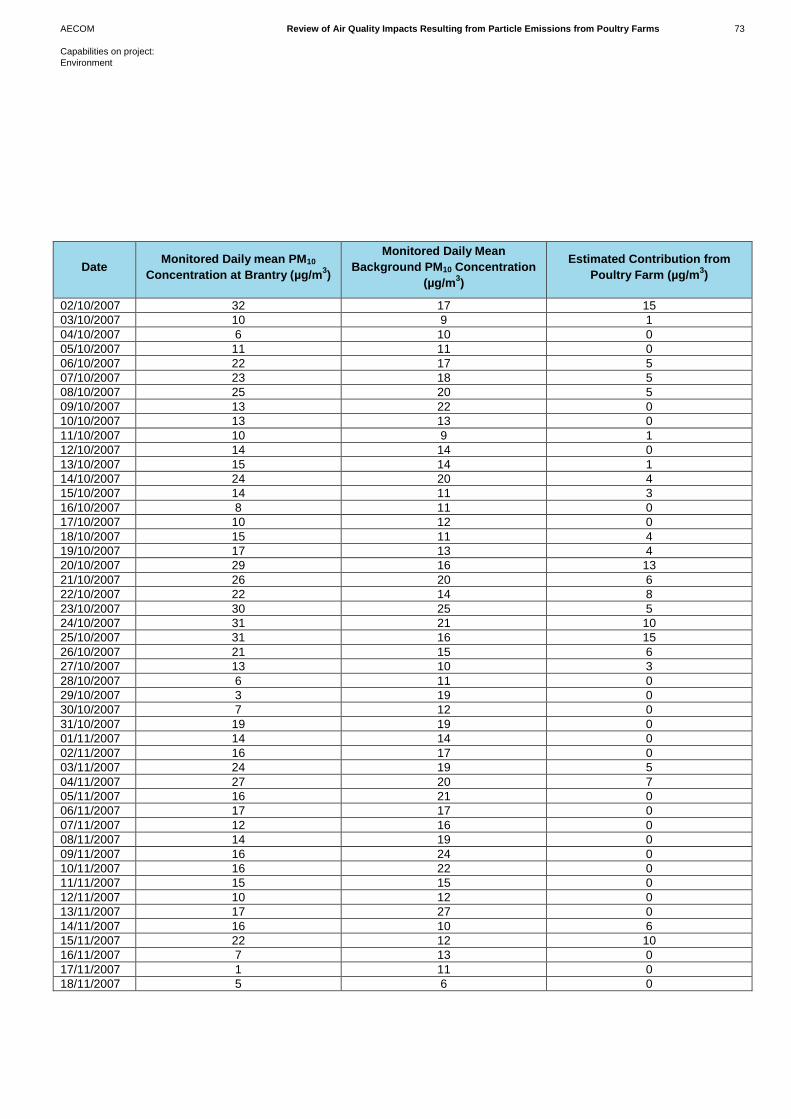
AECOM Review of Air Quality Impacts Resulting from Particle Emissions from Poultry Farms 73
Capabilities on project:
Environment
Date Monitored Daily mean PM10
Concentration at Brantry (µg/m3)
Monitored Daily Mean
Background PM10 Concentration
(µg/m3)
Estimated Contribution from
Poultry Farm (µg/m3)
02/10/2007 32 17 15
03/10/2007 10 9 1
04/10/2007 6 10 0
05/10/2007 11 11 0
06/10/2007 22 17 5
07/10/2007 23 18 5
08/10/2007 25 20 5
09/10/2007 13 22 0
10/10/2007 13 13 0
11/10/2007 10 9 1
12/10/2007 14 14 0
13/10/2007 15 14 1
14/10/2007 24 20 4
15/10/2007 14 11 3
16/10/2007 8 11 0
17/10/2007 10 12 0
18/10/2007 15 11 4
19/10/2007 17 13 4
20/10/2007 29 16 13
21/10/2007 26 20 6
22/10/2007 22 14 8
23/10/2007 30 25 5
24/10/2007 31 21 10
25/10/2007 31 16 15
26/10/2007 21 15 6
27/10/2007 13 10 3
28/10/2007 6 11 0
29/10/2007 3 19 0
30/10/2007 7 12 0
31/10/2007 19 19 0
01/11/2007 14 14 0
02/11/2007 16 17 0
03/11/2007 24 19 5
04/11/2007 27 20 7
05/11/2007 16 21 0
06/11/2007 17 17 0
07/11/2007 12 16 0
08/11/2007 14 19 0
09/11/2007 16 24 0
10/11/2007 16 22 0
11/11/2007 15 15 0
12/11/2007 10 12 0
13/11/2007 17 27 0
14/11/2007 16 10 6
15/11/2007 22 12 10
16/11/2007 7 13 0
17/11/2007 1 11 0
18/11/2007 5 6 0
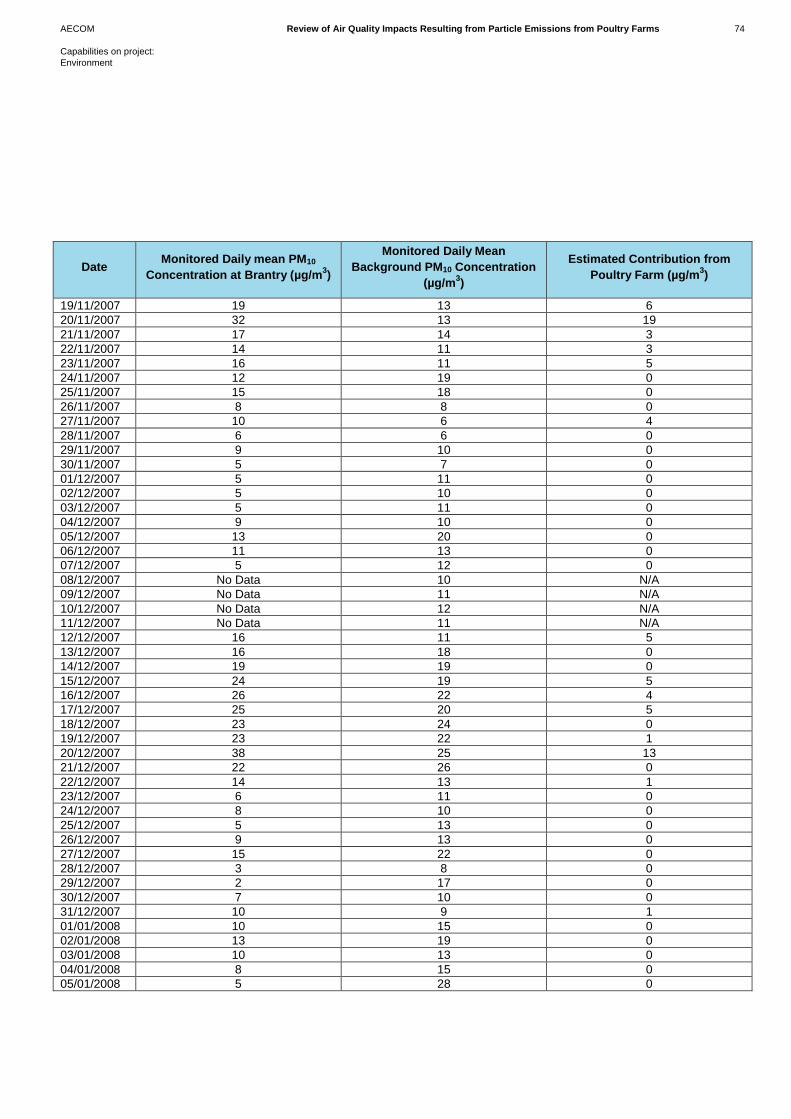
AECOM Review of Air Quality Impacts Resulting from Particle Emissions from Poultry Farms 74
Capabilities on project:
Environment
Date Monitored Daily mean PM10
Concentration at Brantry (µg/m3)
Monitored Daily Mean
Background PM10 Concentration
(µg/m3)
Estimated Contribution from
Poultry Farm (µg/m3)
19/11/2007 19 13 6
20/11/2007 32 13 19
21/11/2007 17 14 3
22/11/2007 14 11 3
23/11/2007 16 11 5
24/11/2007 12 19 0
25/11/2007 15 18 0
26/11/2007 8 8 0
27/11/2007 10 6 4
28/11/2007 6 6 0
29/11/2007 9 10 0
30/11/2007 5 7 0
01/12/2007 5 11 0
02/12/2007 5 10 0
03/12/2007 5 11 0
04/12/2007 9 10 0
05/12/2007 13 20 0
06/12/2007 11 13 0
07/12/2007 5 12 0
08/12/2007 No Data 10 N/A
09/12/2007 No Data 11 N/A
10/12/2007 No Data 12 N/A
11/12/2007 No Data 11 N/A
12/12/2007 16 11 5
13/12/2007 16 18 0
14/12/2007 19 19 0
15/12/2007 24 19 5
16/12/2007 26 22 4
17/12/2007 25 20 5
18/12/2007 23 24 0
19/12/2007 23 22 1
20/12/2007 38 25 13
21/12/2007 22 26 0
22/12/2007 14 13 1
23/12/2007 6 11 0
24/12/2007 8 10 0
25/12/2007 5 13 0
26/12/2007 9 13 0
27/12/2007 15 22 0
28/12/2007 3 8 0
29/12/2007 2 17 0
30/12/2007 7 10 0
31/12/2007 10 9 1
01/01/2008 10 15 0
02/01/2008 13 19 0
03/01/2008 10 13 0
04/01/2008 8 15 0
05/01/2008 5 28 0
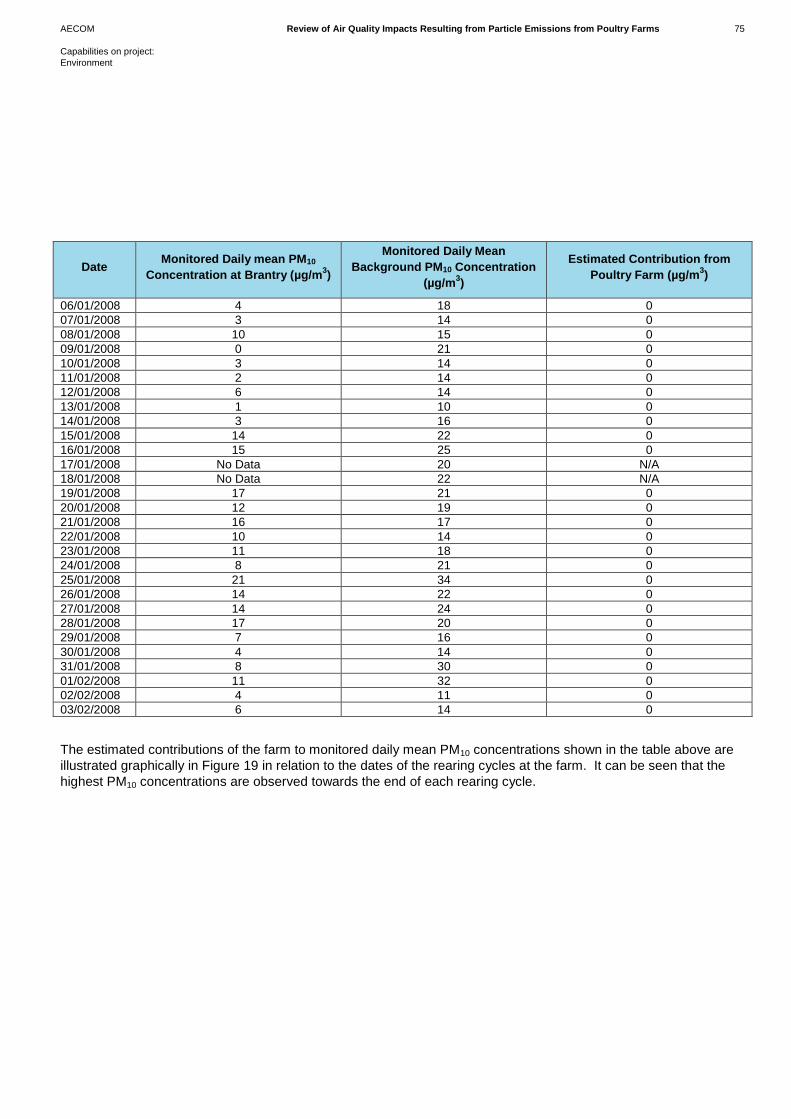
AECOM Review of Air Quality Impacts Resulting from Particle Emissions from Poultry Farms 75
Capabilities on project:
Environment
Date Monitored Daily mean PM10
Concentration at Brantry (µg/m3)
Monitored Daily Mean
Background PM10 Concentration
(µg/m3)
Estimated Contribution from
Poultry Farm (µg/m3)
06/01/2008 4 18 0
07/01/2008 3 14 0
08/01/2008 10 15 0
09/01/2008 0 21 0
10/01/2008 3 14 0
11/01/2008 2 14 0
12/01/2008 6 14 0
13/01/2008 1 10 0
14/01/2008 3 16 0
15/01/2008 14 22 0
16/01/2008 15 25 0
17/01/2008 No Data 20 N/A
18/01/2008 No Data 22 N/A
19/01/2008 17 21 0
20/01/2008 12 19 0
21/01/2008 16 17 0
22/01/2008 10 14 0
23/01/2008 11 18 0
24/01/2008 8 21 0
25/01/2008 21 34 0
26/01/2008 14 22 0
27/01/2008 14 24 0
28/01/2008 17 20 0
29/01/2008 7 16 0
30/01/2008 4 14 0
31/01/2008 8 30 0
01/02/2008 11 32 0
02/02/2008 4 11 0
03/02/2008 6 14 0
The estimated contributions of the farm to monitored daily mean PM10 concentrations shown in the table above are
illustrated graphically in Figure 19 in relation to the dates of the rearing cycles at the farm. It can be seen that the
highest PM10 concentrations are observed towards the end of each rearing cycle.

AECOM Review of Air Quality Impacts Resulting from Particle Emissions from Poultry Farms 76
Capabilities on project:
Environment
Figure 19: Estimated Incremental Contribution of Brantry Poultry Farm to PM10 Concentrations
Pen Lon
Background concentrations were sourced from the Defra website for the Blackpool urban background monitoring
site, located approximately 110 km north-east of the Pen Lon site. Background concentrations were also sourced
from the rural background site at Narberth; however, there was no data for this site for a significant duration of the
monitoring period. Where data was available, it was comparable to the Blackpool data.
Where the estimated contribution from the poultry farm was negative, i.e. monitored background concentrations
were higher than those measured at the farm the increment from the poultry farm was assumed to be zero. The
incremental contribution from Pen Lon Farm is shown in Table 27.
Table 27: Calculation of Incremental Contribution of Pen Lon Poultry Farm to PM10 Concentrations
Date Monitored Daily Mean PM10
Concentration at Pen Lon (µg/m3)
Monitored Daily Mean
Background PM10 Concentration
(µg/m3)
Estimated Contribution from
Poultry Farm (µg/m3)
20/06/2003 23 21 2
21/06/2003 23 20 3
22/06/2003 36 27 9

AECOM Review of Air Quality Impacts Resulting from Particle Emissions from Poultry Farms 77
Capabilities on project:
Environment
Date Monitored Daily Mean PM10
Concentration at Pen Lon (µg/m3)
Monitored Daily Mean
Background PM10 Concentration
(µg/m3)
Estimated Contribution from
Poultry Farm (µg/m3)
23/06/2003 23 22 1
24/06/2003 24 17 7
25/06/2003 32 28 4
26/06/2003 27 32 0
27/06/2003 12 19 0
28/06/2003 12 13 0
29/06/2003 20 17 3
30/06/2003 13 12 1
01/07/2003 12 13 0
02/07/2003 17 19 0
03/07/2003 13 18 0
04/07/2003 15 20 0
05/07/2003 12 14 0
06/07/2003 12 12 0
07/07/2003 15 16 0
08/07/2003 17 15 2
09/07/2003 16 18 0
10/07/2003 18 18 0
11/07/2003 23 22 1
12/07/2003 25 24 1
13/07/2003 25 33 0
14/07/2003 No Data 35 N/A
15/07/2003 44 41 3
16/07/2003 51 40 11
17/07/2003 28 21 7
18/07/2003 22 13 9
19/07/2003 37 23 14
20/07/2003 33 16 17
21/07/2003 30 16 14
22/07/2003 21 15 6
23/07/2003 29 13 16
24/07/2003 17 13 4
25/07/2003 18 12 6
26/07/2003 23 12 11
27/07/2003 25 15 10
28/07/2003 39 18 21
29/07/2003 30 13 17
30/07/2003 15 18 0
31/07/2003 33 14 19
01/08/2003 33 17 16
02/08/2003 43 25 18
03/08/2003 33 26 7
04/08/2003 29 31 0
05/08/2003 53 44 9
06/08/2003 42 32 10
07/08/2003 48 32 16
08/08/2003 43 36 7
09/08/2003 70 58 12
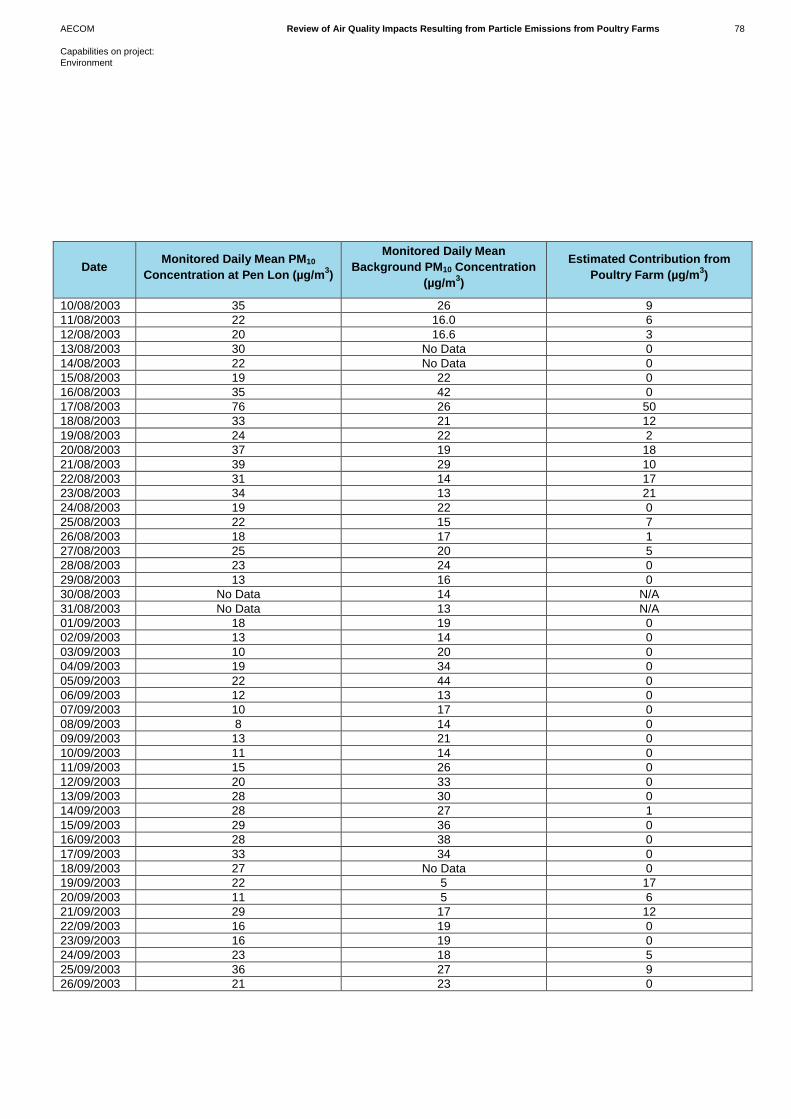
AECOM Review of Air Quality Impacts Resulting from Particle Emissions from Poultry Farms 78
Capabilities on project:
Environment
Date Monitored Daily Mean PM10
Concentration at Pen Lon (µg/m3)
Monitored Daily Mean
Background PM10 Concentration
(µg/m3)
Estimated Contribution from
Poultry Farm (µg/m3)
10/08/2003 35 26 9
11/08/2003 22 16.0 6
12/08/2003 20 16.6 3
13/08/2003 30 No Data 0
14/08/2003 22 No Data 0
15/08/2003 19 22 0
16/08/2003 35 42 0
17/08/2003 76 26 50
18/08/2003 33 21 12
19/08/2003 24 22 2
20/08/2003 37 19 18
21/08/2003 39 29 10
22/08/2003 31 14 17
23/08/2003 34 13 21
24/08/2003 19 22 0
25/08/2003 22 15 7
26/08/2003 18 17 1
27/08/2003 25 20 5
28/08/2003 23 24 0
29/08/2003 13 16 0
30/08/2003 No Data 14 N/A
31/08/2003 No Data 13 N/A
01/09/2003 18 19 0
02/09/2003 13 14 0
03/09/2003 10 20 0
04/09/2003 19 34 0
05/09/2003 22 44 0
06/09/2003 12 13 0
07/09/2003 10 17 0
08/09/2003 8 14 0
09/09/2003 13 21 0
10/09/2003 11 14 0
11/09/2003 15 26 0
12/09/2003 20 33 0
13/09/2003 28 30 0
14/09/2003 28 27 1
15/09/2003 29 36 0
16/09/2003 28 38 0
17/09/2003 33 34 0
18/09/2003 27 No Data 0
19/09/2003 22 5 17
20/09/2003 11 5 6
21/09/2003 29 17 12
22/09/2003 16 19 0
23/09/2003 16 19 0
24/09/2003 23 18 5
25/09/2003 36 27 9
26/09/2003 21 23 0
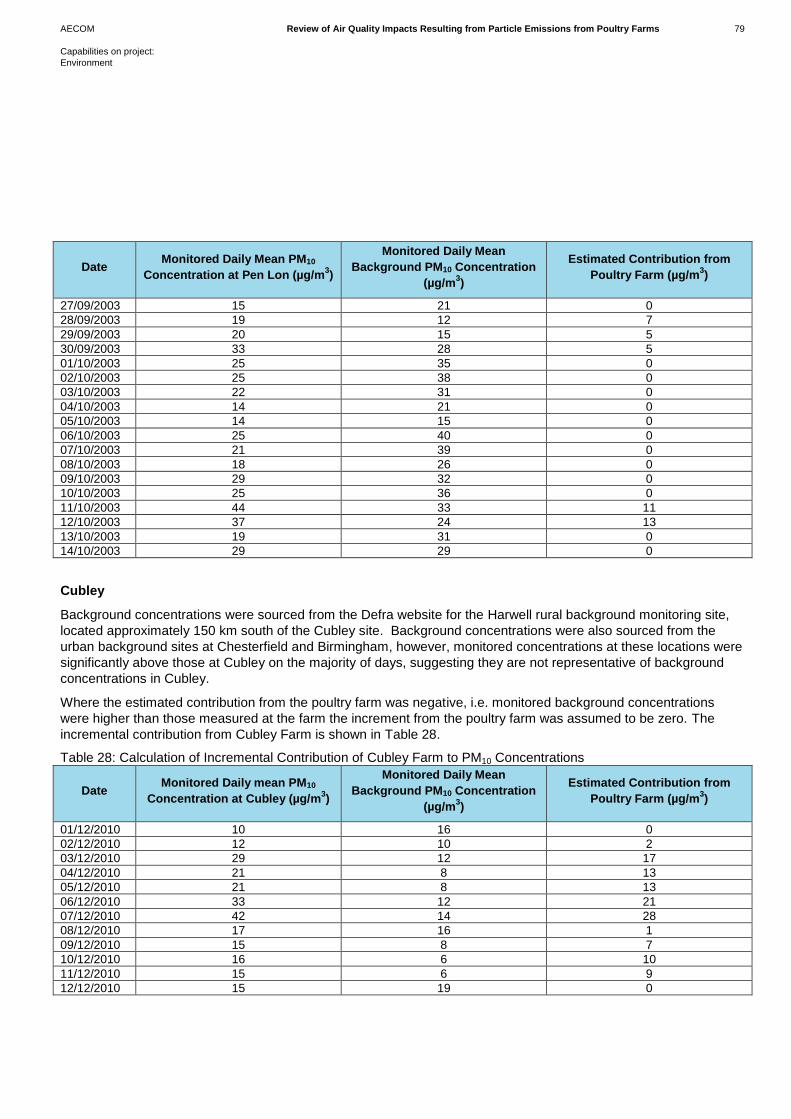
AECOM Review of Air Quality Impacts Resulting from Particle Emissions from Poultry Farms 79
Capabilities on project:
Environment
Date Monitored Daily Mean PM10
Concentration at Pen Lon (µg/m3)
Monitored Daily Mean
Background PM10 Concentration
(µg/m3)
Estimated Contribution from
Poultry Farm (µg/m3)
27/09/2003 15 21 0
28/09/2003 19 12 7
29/09/2003 20 15 5
30/09/2003 33 28 5
01/10/2003 25 35 0
02/10/2003 25 38 0
03/10/2003 22 31 0
04/10/2003 14 21 0
05/10/2003 14 15 0
06/10/2003 25 40 0
07/10/2003 21 39 0
08/10/2003 18 26 0
09/10/2003 29 32 0
10/10/2003 25 36 0
11/10/2003 44 33 11
12/10/2003 37 24 13
13/10/2003 19 31 0
14/10/2003 29 29 0
Cubley
Background concentrations were sourced from the Defra website for the Harwell rural background monitoring site,
located approximately 150 km south of the Cubley site. Background concentrations were also sourced from the
urban background sites at Chesterfield and Birmingham, however, monitored concentrations at these locations were
significantly above those at Cubley on the majority of days, suggesting they are not representative of background
concentrations in Cubley.
Where the estimated contribution from the poultry farm was negative, i.e. monitored background concentrations
were higher than those measured at the farm the increment from the poultry farm was assumed to be zero. The
incremental contribution from Cubley Farm is shown in Table 28.
Table 28: Calculation of Incremental Contribution of Cubley Farm to PM10 Concentrations
Date Monitored Daily mean PM10
Concentration at Cubley (µg/m3)
Monitored Daily Mean
Background PM10 Concentration
(µg/m3)
Estimated Contribution from
Poultry Farm (µg/m3)
01/12/2010 10 16 0
02/12/2010 12 10 2
03/12/2010 29 12 17
04/12/2010 21 8 13
05/12/2010 21 8 13
06/12/2010 33 12 21
07/12/2010 42 14 28
08/12/2010 17 16 1
09/12/2010 15 8 7
10/12/2010 16 6 10
11/12/2010 15 6 9
12/12/2010 15 19 0
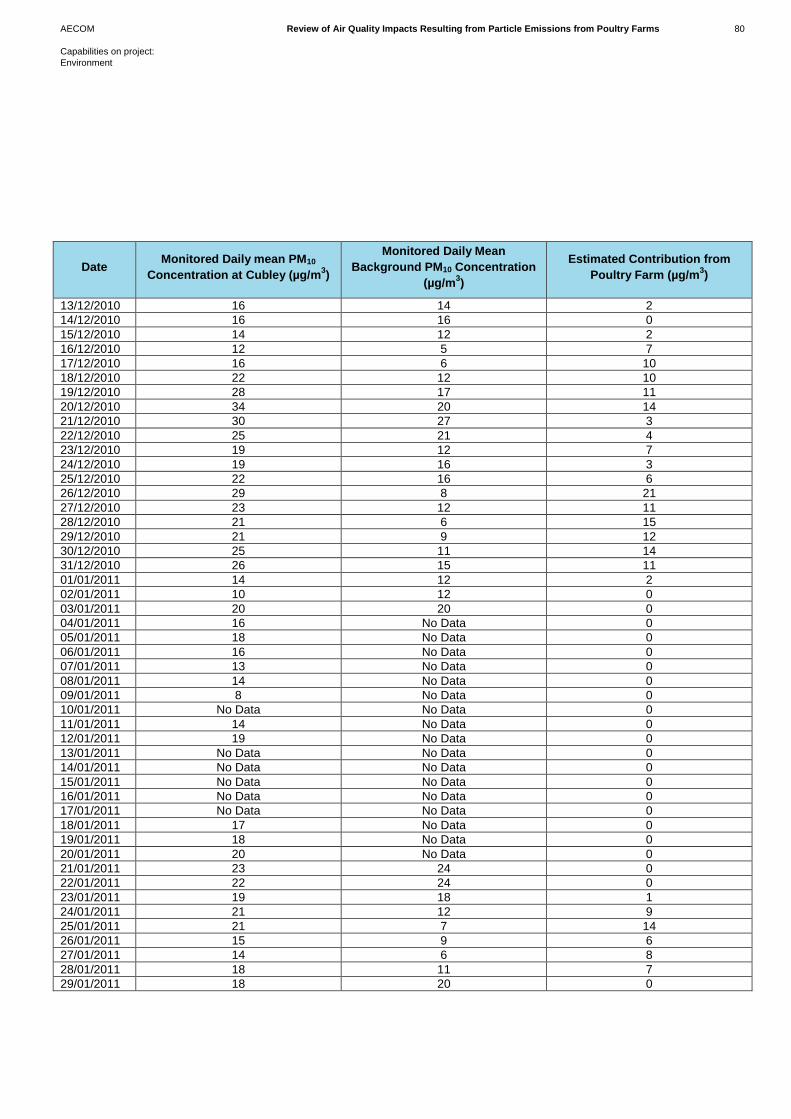
AECOM Review of Air Quality Impacts Resulting from Particle Emissions from Poultry Farms 80
Capabilities on project:
Environment
Date Monitored Daily mean PM10
Concentration at Cubley (µg/m3)
Monitored Daily Mean
Background PM10 Concentration
(µg/m3)
Estimated Contribution from
Poultry Farm (µg/m3)
13/12/2010 16 14 2
14/12/2010 16 16 0
15/12/2010 14 12 2
16/12/2010 12 5 7
17/12/2010 16 6 10
18/12/2010 22 12 10
19/12/2010 28 17 11
20/12/2010 34 20 14
21/12/2010 30 27 3
22/12/2010 25 21 4
23/12/2010 19 12 7
24/12/2010 19 16 3
25/12/2010 22 16 6
26/12/2010 29 8 21
27/12/2010 23 12 11
28/12/2010 21 6 15
29/12/2010 21 9 12
30/12/2010 25 11 14
31/12/2010 26 15 11
01/01/2011 14 12 2
02/01/2011 10 12 0
03/01/2011 20 20 0
04/01/2011 16 No Data 0
05/01/2011 18 No Data 0
06/01/2011 16 No Data 0
07/01/2011 13 No Data 0
08/01/2011 14 No Data 0
09/01/2011 8 No Data 0
10/01/2011 No Data No Data 0
11/01/2011 14 No Data 0
12/01/2011 19 No Data 0
13/01/2011 No Data No Data 0
14/01/2011 No Data No Data 0
15/01/2011 No Data No Data 0
16/01/2011 No Data No Data 0
17/01/2011 No Data No Data 0
18/01/2011 17 No Data 0
19/01/2011 18 No Data 0
20/01/2011 20 No Data 0
21/01/2011 23 24 0
22/01/2011 22 24 0
23/01/2011 19 18 1
24/01/2011 21 12 9
25/01/2011 21 7 14
26/01/2011 15 9 6
27/01/2011 14 6 8
28/01/2011 18 11 7
29/01/2011 18 20 0
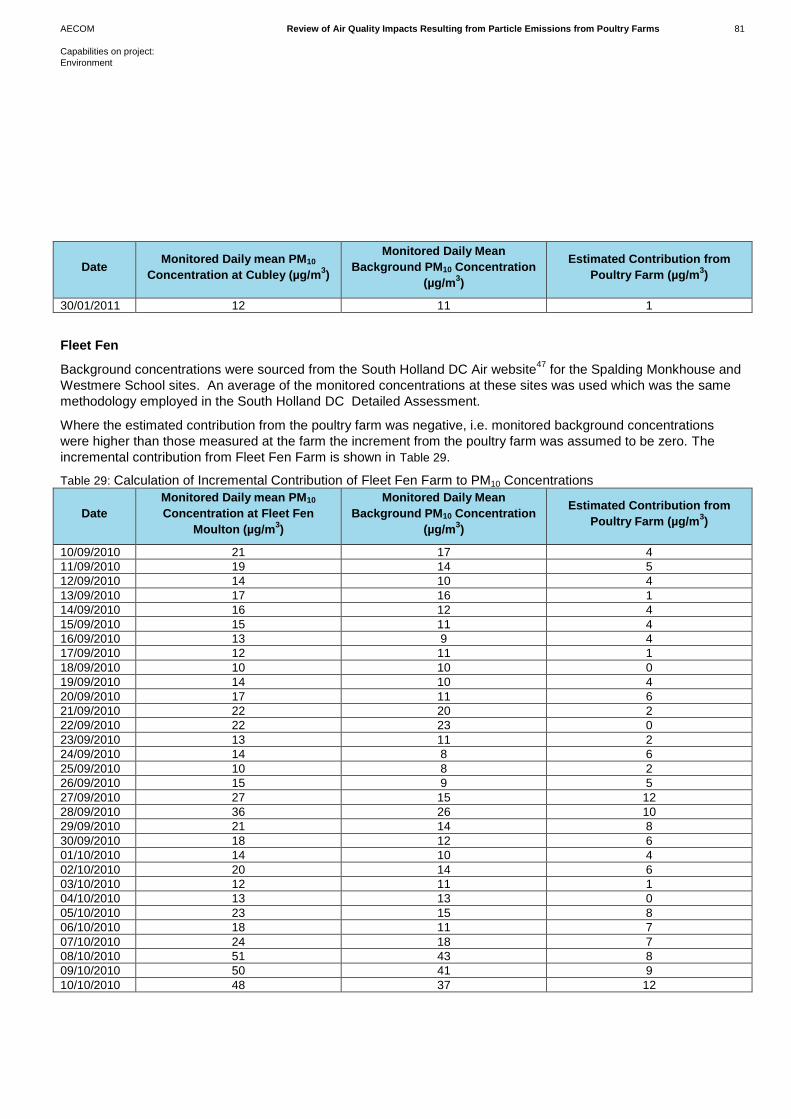
AECOM Review of Air Quality Impacts Resulting from Particle Emissions from Poultry Farms 81
Capabilities on project:
Environment
Date Monitored Daily mean PM10
Concentration at Cubley (µg/m3)
Monitored Daily Mean
Background PM10 Concentration
(µg/m3)
Estimated Contribution from
Poultry Farm (µg/m3)
30/01/2011 12 11 1
Fleet Fen
Background concentrations were sourced from the South Holland DC Air website47
for the Spalding Monkhouse and
Westmere School sites. An average of the monitored concentrations at these sites was used which was the same
methodology employed in the South Holland DC Detailed Assessment.
Where the estimated contribution from the poultry farm was negative, i.e. monitored background concentrations
were higher than those measured at the farm the increment from the poultry farm was assumed to be zero. The
incremental contribution from Fleet Fen Farm is shown in Table 29.
Table 29: Calculation of Incremental Contribution of Fleet Fen Farm to PM10 Concentrations
Date
Monitored Daily mean PM10
Concentration at Fleet Fen
Moulton (µg/m3)
Monitored Daily Mean
Background PM10 Concentration
(µg/m3)
Estimated Contribution from
Poultry Farm (µg/m3)
10/09/2010 21 17 4
11/09/2010 19 14 5
12/09/2010 14 10 4
13/09/2010 17 16 1
14/09/2010 16 12 4
15/09/2010 15 11 4
16/09/2010 13 9 4
17/09/2010 12 11 1
18/09/2010 10 10 0
19/09/2010 14 10 4
20/09/2010 17 11 6
21/09/2010 22 20 2
22/09/2010 22 23 0
23/09/2010 13 11 2
24/09/2010 14 8 6
25/09/2010 10 8 2
26/09/2010 15 9 5
27/09/2010 27 15 12
28/09/2010 36 26 10
29/09/2010 21 14 8
30/09/2010 18 12 6
01/10/2010 14 10 4
02/10/2010 20 14 6
03/10/2010 12 11 1
04/10/2010 13 13 0
05/10/2010 23 15 8
06/10/2010 18 11 7
07/10/2010 24 18 7
08/10/2010 51 43 8
09/10/2010 50 41 9
10/10/2010 48 37 12

AECOM Review of Air Quality Impacts Resulting from Particle Emissions from Poultry Farms 82
Capabilities on project:
Environment
Date
Monitored Daily mean PM10
Concentration at Fleet Fen
Moulton (µg/m3)
Monitored Daily Mean
Background PM10 Concentration
(µg/m3)
Estimated Contribution from
Poultry Farm (µg/m3)
11/10/2010 30 26 4
12/10/2010 15 14 1
13/10/2010 15 12 2
14/10/2010 28 18 10
15/10/2010 25 16 10
16/10/2010 15 13 2
17/10/2010 21 15 6
18/10/2010 24 17 7
19/10/2010 21 12 9
20/10/2010 19 9 10
21/10/2010 16 10 5
22/10/2010 12 11 0
23/10/2010 17 9 7
24/10/2010 14 8 6
25/10/2010 18 14 4
26/10/2010 16 12 4
27/10/2010 23 14 9
28/10/2010 23 14 8
29/10/2010 23 16 6
30/10/2010 18 11 7
31/10/2010 27 17 10
01/11/2010 35 25 10
02/11/2010 35 19 16
03/11/2010 18 11 7
04/11/2010 11 11 0
05/11/2010 18 15 3
06/11/2010 31 34 0
07/11/2010 29 27 2
08/11/2010 14 12 2
09/11/2010 12 7 6
10/11/2010 20 9 11
11/11/2010 17 11 6
12/11/2010 21 11 10
13/11/2010 16 11 5
14/11/2010 28 15 13
15/11/2010 25 19 6
16/11/2010 30 24 6
17/11/2010 34 24 10
18/11/2010 27 19 8
19/11/2010 20 14 6
20/11/2010 20 15 6
21/11/2010 13 9 4
22/11/2010 15 10 5
23/11/2010 25 10 15
24/11/2010 28 12 16
25/11/2010 19 10 9
26/11/2010 28 16 12
27/11/2010 16 12 5

AECOM Review of Air Quality Impacts Resulting from Particle Emissions from Poultry Farms 83
Capabilities on project:
Environment
Date
Monitored Daily mean PM10
Concentration at Fleet Fen
Moulton (µg/m3)
Monitored Daily Mean
Background PM10 Concentration
(µg/m3)
Estimated Contribution from
Poultry Farm (µg/m3)
28/11/2010 33 20 13
29/11/2010 22 16 6
30/11/2010 13 10 3
01/12/2010 16 17 0
02/12/2010 17 13 4
03/12/2010 29 22 7
04/12/2010 18 15 3
05/12/2010 39 18 21
06/12/2010 41 29 12
07/12/2010 49 35 14
08/12/2010 28 15 13
09/12/2010 33 13 20
10/12/2010 29 15 14
11/12/2010 35 14 21
12/12/2010 31 18 14
13/12/2010 32 19 13
14/12/2010 32 17 14
15/12/2010 25 17 8
16/12/2010 19 11 8
17/12/2010 22 12 10
18/12/2010 20 18 2
19/12/2010 27 22 6
20/12/2010 26 26 0
21/12/2010 30 27 3
22/12/2010 18 23 0
23/12/2010 18 18 0
24/12/2010 25 17 7
25/12/2010 28 22 6
26/12/2010 28 26 3
27/12/2010 22 18 4
28/12/2010 27 19 8
29/12/2010 19 22 0
30/12/2010 25 25 1
31/12/2010 41 29 12
01/01/2011 29 16 12
02/01/2011 22 10 12
03/01/2011 28 23 5
04/01/2011 25 18 7
05/01/2011 16 11 5
06/01/2011 26 17 9
07/01/2011 23 18 5
08/01/2011 19 13 6
09/01/2011 16 11 5
10/01/2011 18 15 2
11/01/2011 24 11 13
12/01/2011 17 12 4
13/01/2011 28 9 19
14/01/2011 18 12 6
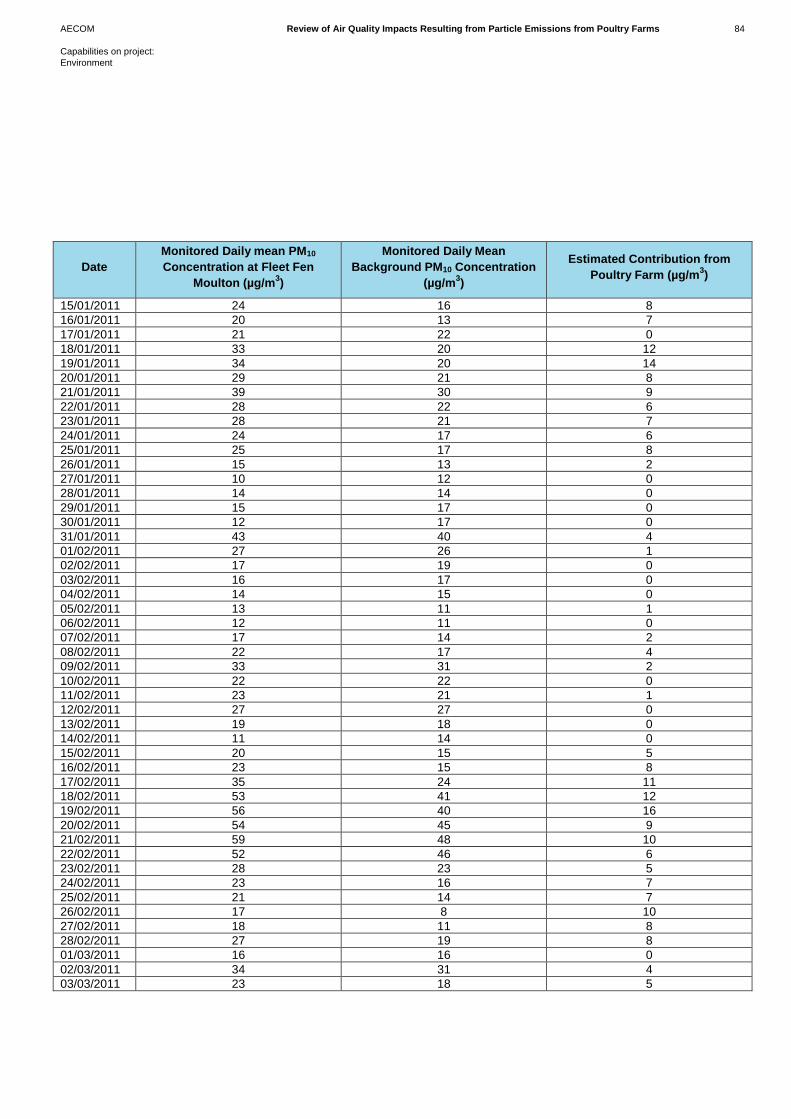
AECOM Review of Air Quality Impacts Resulting from Particle Emissions from Poultry Farms 84
Capabilities on project:
Environment
Date
Monitored Daily mean PM10
Concentration at Fleet Fen
Moulton (µg/m3)
Monitored Daily Mean
Background PM10 Concentration
(µg/m3)
Estimated Contribution from
Poultry Farm (µg/m3)
15/01/2011 24 16 8
16/01/2011 20 13 7
17/01/2011 21 22 0
18/01/2011 33 20 12
19/01/2011 34 20 14
20/01/2011 29 21 8
21/01/2011 39 30 9
22/01/2011 28 22 6
23/01/2011 28 21 7
24/01/2011 24 17 6
25/01/2011 25 17 8
26/01/2011 15 13 2
27/01/2011 10 12 0
28/01/2011 14 14 0
29/01/2011 15 17 0
30/01/2011 12 17 0
31/01/2011 43 40 4
01/02/2011 27 26 1
02/02/2011 17 19 0
03/02/2011 16 17 0
04/02/2011 14 15 0
05/02/2011 13 11 1
06/02/2011 12 11 0
07/02/2011 17 14 2
08/02/2011 22 17 4
09/02/2011 33 31 2
10/02/2011 22 22 0
11/02/2011 23 21 1
12/02/2011 27 27 0
13/02/2011 19 18 0
14/02/2011 11 14 0
15/02/2011 20 15 5
16/02/2011 23 15 8
17/02/2011 35 24 11
18/02/2011 53 41 12
19/02/2011 56 40 16
20/02/2011 54 45 9
21/02/2011 59 48 10
22/02/2011 52 46 6
23/02/2011 28 23 5
24/02/2011 23 16 7
25/02/2011 21 14 7
26/02/2011 17 8 10
27/02/2011 18 11 8
28/02/2011 27 19 8
01/03/2011 16 16 0
02/03/2011 34 31 4
03/03/2011 23 18 5
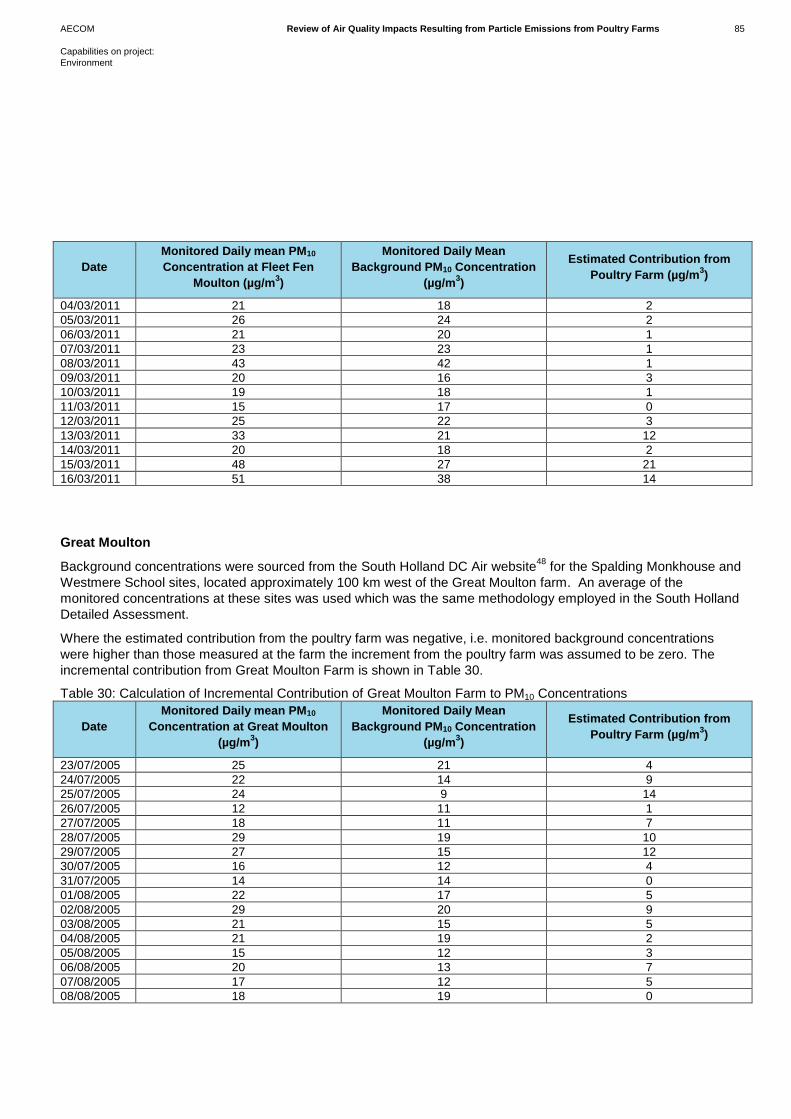
AECOM Review of Air Quality Impacts Resulting from Particle Emissions from Poultry Farms 85
Capabilities on project:
Environment
Date
Monitored Daily mean PM10
Concentration at Fleet Fen
Moulton (µg/m3)
Monitored Daily Mean
Background PM10 Concentration
(µg/m3)
Estimated Contribution from
Poultry Farm (µg/m3)
04/03/2011 21 18 2
05/03/2011 26 24 2
06/03/2011 21 20 1
07/03/2011 23 23 1
08/03/2011 43 42 1
09/03/2011 20 16 3
10/03/2011 19 18 1
11/03/2011 15 17 0
12/03/2011 25 22 3
13/03/2011 33 21 12
14/03/2011 20 18 2
15/03/2011 48 27 21
16/03/2011 51 38 14
Great Moulton
Background concentrations were sourced from the South Holland DC Air website48
for the Spalding Monkhouse and
Westmere School sites, located approximately 100 km west of the Great Moulton farm. An average of the
monitored concentrations at these sites was used which was the same methodology employed in the South Holland
Detailed Assessment.
Where the estimated contribution from the poultry farm was negative, i.e. monitored background concentrations
were higher than those measured at the farm the increment from the poultry farm was assumed to be zero. The
incremental contribution from Great Moulton Farm is shown in Table 30.
Table 30: Calculation of Incremental Contribution of Great Moulton Farm to PM10 Concentrations
Date
Monitored Daily mean PM10
Concentration at Great Moulton
(µg/m3)
Monitored Daily Mean
Background PM10 Concentration
(µg/m3)
Estimated Contribution from
Poultry Farm (µg/m3)
23/07/2005 25 21 4
24/07/2005 22 14 9
25/07/2005 24 9 14
26/07/2005 12 11 1
27/07/2005 18 11 7
28/07/2005 29 19 10
29/07/2005 27 15 12
30/07/2005 16 12 4
31/07/2005 14 14 0
01/08/2005 22 17 5
02/08/2005 29 20 9
03/08/2005 21 15 5
04/08/2005 21 19 2
05/08/2005 15 12 3
06/08/2005 20 13 7
07/08/2005 17 12 5
08/08/2005 18 19 0

AECOM Review of Air Quality Impacts Resulting from Particle Emissions from Poultry Farms 86
Capabilities on project:
Environment
Date
Monitored Daily mean PM10
Concentration at Great Moulton
(µg/m3)
Monitored Daily Mean
Background PM10 Concentration
(µg/m3)
Estimated Contribution from
Poultry Farm (µg/m3)
09/08/2005 25 18 7
10/08/2005 39 18 21
11/08/2005 21 17 4
12/08/2005 23 16 7
13/08/2005 17 13 4
14/08/2005 17 14 3
15/08/2005 16 16 0
16/08/2005 27 15 12
17/08/2005 33 27 7
18/08/2005 57 29 28
19/08/2005 37 13 24
20/08/2005 19 14 5
21/08/2005 26 15 11
22/08/2005 17 13 4
23/08/2005 25 16 9
24/08/2005 16 11 5
25/08/2005 12 10 3
26/08/2005 18 10 7
27/08/2005 19 12 7
28/08/2005 24 15 10
29/08/2005 29 14 15
30/08/2005 44 20 25
31/08/2005 54 30 24
01/09/2005 28 17 10
02/09/2005 24 14 10
03/09/2005 37 23 14
04/09/2005 25 27 0
05/09/2005 42 23 19
07/09/2005 21 17 4
08/09/2005 23 14 9
09/09/2005 36 22 15
10/09/2005 16 10 6
11/09/2005 18 15 3
12/09/2005 12 12 1
13/09/2005 17 19 0
14/09/2005 19 14 5
23/09/2005 21 23 0
24/09/2005 16 14 2
25/09/2005 15 11 4
26/09/2005 15 11 4
27/09/2005 16 15 1
28/09/2005 15 14 1
29/09/2005 14 13 1
30/09/2005 22 9 13
01/10/2005 11 10 0
02/10/2005 13 9 4
03/10/2005 32 17 15
04/10/2005 34 16 18

AECOM Review of Air Quality Impacts Resulting from Particle Emissions from Poultry Farms 87
Capabilities on project:
Environment
Date
Monitored Daily mean PM10
Concentration at Great Moulton
(µg/m3)
Monitored Daily Mean
Background PM10 Concentration
(µg/m3)
Estimated Contribution from
Poultry Farm (µg/m3)
05/10/2005 28 14 13
06/10/2005 42 29 13
07/10/2005 56 35 21
08/10/2005 40 28 13
09/10/2005 10 8 1
10/10/2005 30 21 8
11/10/2005 36 27 9
12/10/2005 27 21 6
13/10/2005 12 8 4
14/10/2005 30 11 19
15/10/2005 59 30 29
16/10/2005 60 30 31
17/10/2005 62 29 33
18/10/2005 31 19 11
19/10/2005 17 13 4
20/10/2005 14 10 3
21/10/2005 15 10 5
22/10/2005 13 11 2
23/10/2005 16 13 3
24/10/2005 14 7 8
25/10/2005 13 13 0
26/10/2005 29 20 9
27/10/2005 22 18 4
28/10/2005 17 14 3
29/10/2005 14 12 3
30/10/2005 24 16 8
31/10/2005 13 15 0
01/11/2005 13 12 1
02/11/2005 16 11 5
03/11/2005 22 13 8
04/11/2005 15 12 3
05/11/2005 26 17 9
06/11/2005 19 10 9
07/11/2005 17 14 2
08/11/2005 26 15 11
09/11/2005 21 12 8
10/11/2005 25 10 15
11/11/2005 8 8 0
12/11/2005 15 13 1
13/11/2005 19 14 5
14/11/2005 15 13 2
15/11/2005 15 11 3
16/11/2005 10 10 0
17/11/2005 19 13 6
18/11/2005 23 21 2
19/11/2005 21 24 0
20/11/2005 26 23 3
21/11/2005 25 31 0
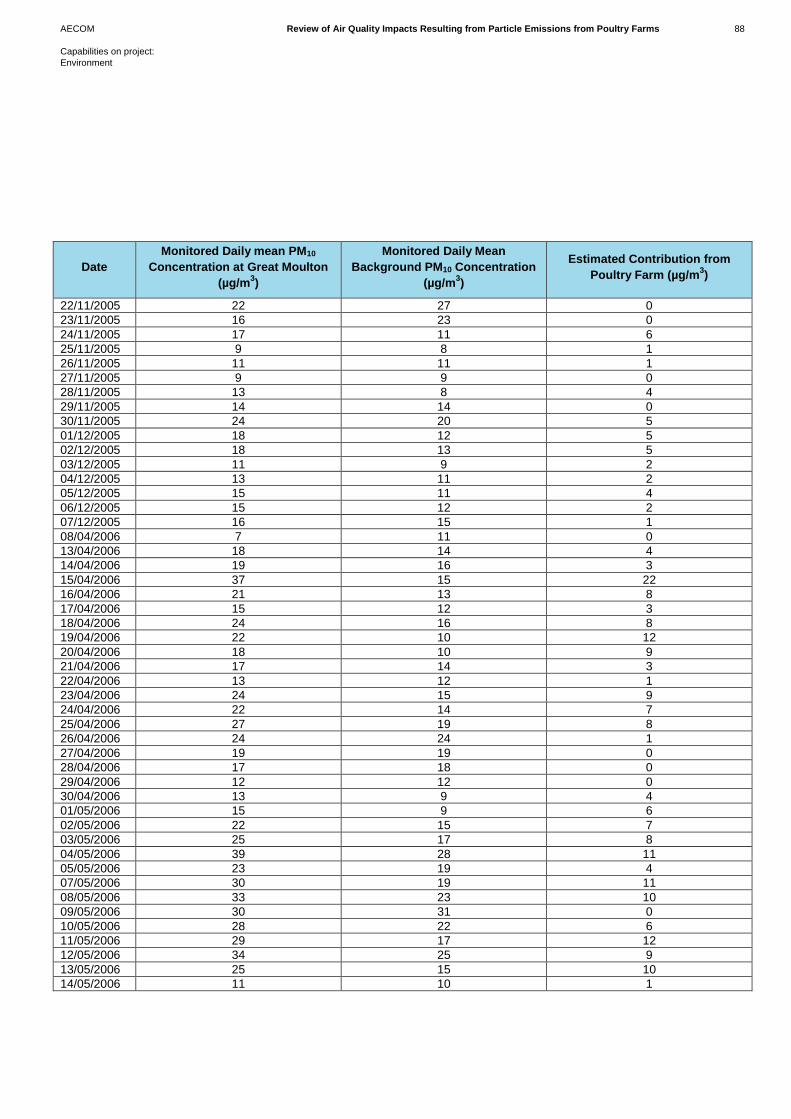
AECOM Review of Air Quality Impacts Resulting from Particle Emissions from Poultry Farms 88
Capabilities on project:
Environment
Date
Monitored Daily mean PM10
Concentration at Great Moulton
(µg/m3)
Monitored Daily Mean
Background PM10 Concentration
(µg/m3)
Estimated Contribution from
Poultry Farm (µg/m3)
22/11/2005 22 27 0
23/11/2005 16 23 0
24/11/2005 17 11 6
25/11/2005 9 8 1
26/11/2005 11 11 1
27/11/2005 9 9 0
28/11/2005 13 8 4
29/11/2005 14 14 0
30/11/2005 24 20 5
01/12/2005 18 12 5
02/12/2005 18 13 5
03/12/2005 11 9 2
04/12/2005 13 11 2
05/12/2005 15 11 4
06/12/2005 15 12 2
07/12/2005 16 15 1
08/04/2006 7 11 0
13/04/2006 18 14 4
14/04/2006 19 16 3
15/04/2006 37 15 22
16/04/2006 21 13 8
17/04/2006 15 12 3
18/04/2006 24 16 8
19/04/2006 22 10 12
20/04/2006 18 10 9
21/04/2006 17 14 3
22/04/2006 13 12 1
23/04/2006 24 15 9
24/04/2006 22 14 7
25/04/2006 27 19 8
26/04/2006 24 24 1
27/04/2006 19 19 0
28/04/2006 17 18 0
29/04/2006 12 12 0
30/04/2006 13 9 4
01/05/2006 15 9 6
02/05/2006 22 15 7
03/05/2006 25 17 8
04/05/2006 39 28 11
05/05/2006 23 19 4
07/05/2006 30 19 11
08/05/2006 33 23 10
09/05/2006 30 31 0
10/05/2006 28 22 6
11/05/2006 29 17 12
12/05/2006 34 25 9
13/05/2006 25 15 10
14/05/2006 11 10 1
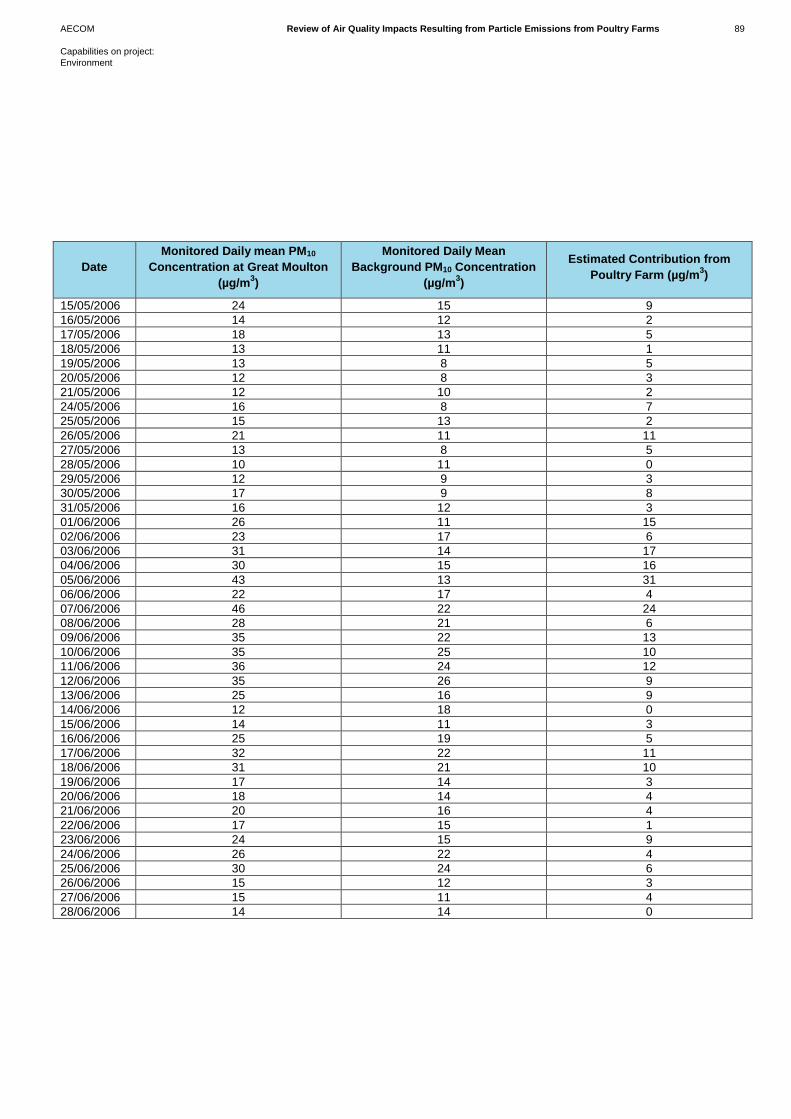
AECOM Review of Air Quality Impacts Resulting from Particle Emissions from Poultry Farms 89
Capabilities on project:
Environment
Date
Monitored Daily mean PM10
Concentration at Great Moulton
(µg/m3)
Monitored Daily Mean
Background PM10 Concentration
(µg/m3)
Estimated Contribution from
Poultry Farm (µg/m3)
15/05/2006 24 15 9
16/05/2006 14 12 2
17/05/2006 18 13 5
18/05/2006 13 11 1
19/05/2006 13 8 5
20/05/2006 12 8 3
21/05/2006 12 10 2
24/05/2006 16 8 7
25/05/2006 15 13 2
26/05/2006 21 11 11
27/05/2006 13 8 5
28/05/2006 10 11 0
29/05/2006 12 9 3
30/05/2006 17 9 8
31/05/2006 16 12 3
01/06/2006 26 11 15
02/06/2006 23 17 6
03/06/2006 31 14 17
04/06/2006 30 15 16
05/06/2006 43 13 31
06/06/2006 22 17 4
07/06/2006 46 22 24
08/06/2006 28 21 6
09/06/2006 35 22 13
10/06/2006 35 25 10
11/06/2006 36 24 12
12/06/2006 35 26 9
13/06/2006 25 16 9
14/06/2006 12 18 0
15/06/2006 14 11 3
16/06/2006 25 19 5
17/06/2006 32 22 11
18/06/2006 31 21 10
19/06/2006 17 14 3
20/06/2006 18 14 4
21/06/2006 20 16 4
22/06/2006 17 15 1
23/06/2006 24 15 9
24/06/2006 26 22 4
25/06/2006 30 24 6
26/06/2006 15 12 3
27/06/2006 15 11 4
28/06/2006 14 14 0
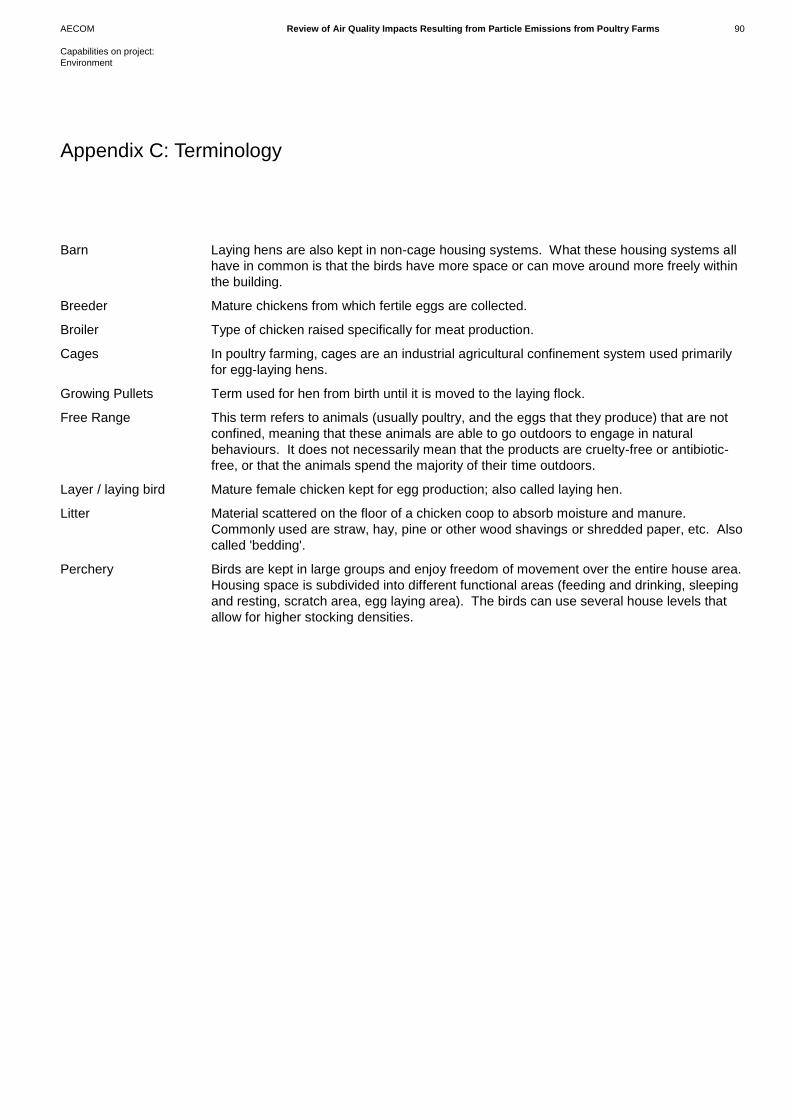
AECOM Review of Air Quality Impacts Resulting from Particle Emissions from Poultry Farms 90
Capabilities on project:
Environment
Barn Laying hens are also kept in non-cage housing systems. What these housing systems all
have in common is that the birds have more space or can move around more freely within
the building.
Breeder Mature chickens from which fertile eggs are collected.
Broiler Type of chicken raised specifically for meat production.
Cages In poultry farming, cages are an industrial agricultural confinement system used primarily
for egg-laying hens.
Growing Pullets Term used for hen from birth until it is moved to the laying flock.
Free Range This term refers to animals (usually poultry, and the eggs that they produce) that are not
confined, meaning that these animals are able to go outdoors to engage in natural
behaviours. It does not necessarily mean that the products are cruelty-free or antibiotic-
free, or that the animals spend the majority of their time outdoors.
Layer / laying bird Mature female chicken kept for egg production; also called laying hen.
Litter Material scattered on the floor of a chicken coop to absorb moisture and manure.
Commonly used are straw, hay, pine or other wood shavings or shredded paper, etc. Also
called 'bedding'.
Perchery Birds are kept in large groups and enjoy freedom of movement over the entire house area.
Housing space is subdivided into different functional areas (feeding and drinking, sleeping
and resting, scratch area, egg laying area). The birds can use several house levels that
allow for higher stocking densities.
Appendix C: Terminology
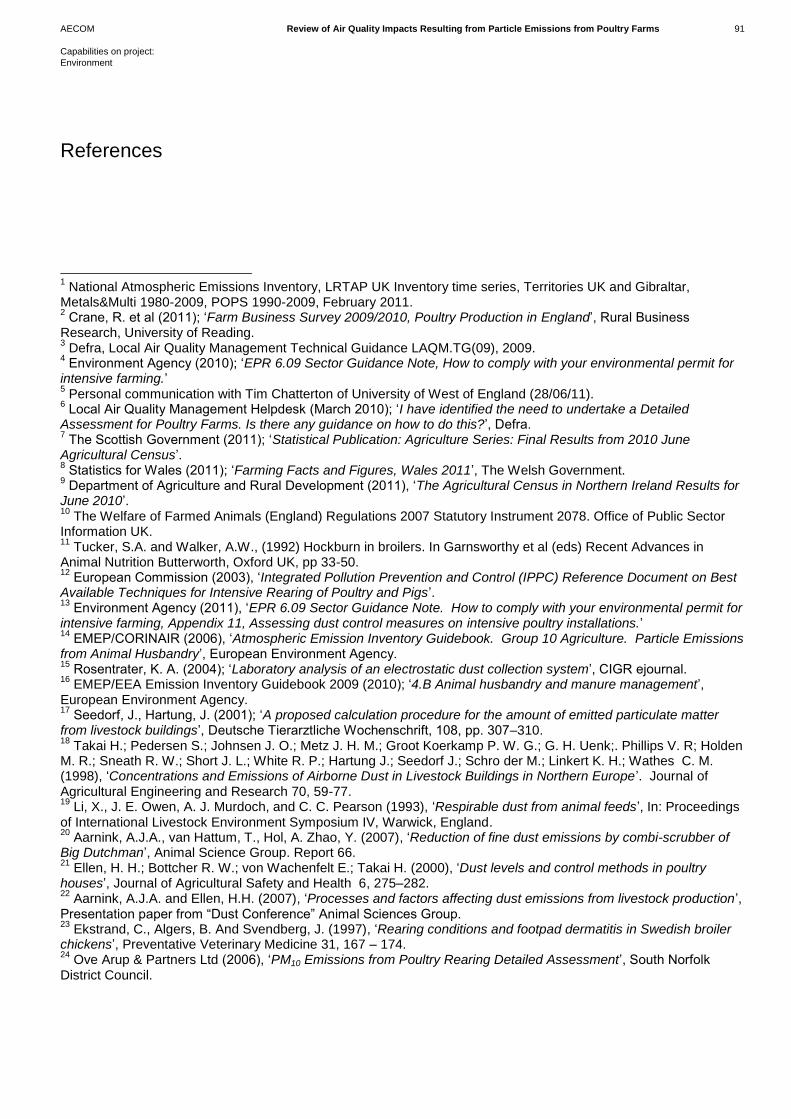
AECOM Review of Air Quality Impacts Resulting from Particle Emissions from Poultry Farms 91
Capabilities on project:
Environment
1 National Atmospheric Emissions Inventory, LRTAP UK Inventory time series, Territories UK and Gibraltar,
Metals&Multi 1980-2009, POPS 1990-2009, February 2011. 2 Crane, R. et al (2011); ‘Farm Business Survey 2009/2010, Poultry Production in England’, Rural Business
Research, University of Reading. 3 Defra, Local Air Quality Management Technical Guidance LAQM.TG(09), 2009.
4 Environment Agency (2010); ‘EPR 6.09 Sector Guidance Note, How to comply with your environmental permit for
intensive farming.’ 5 Personal communication with Tim Chatterton of University of West of England (28/06/11).
6 Local Air Quality Management Helpdesk (March 2010); ‘I have identified the need to undertake a Detailed
Assessment for Poultry Farms. Is there any guidance on how to do this?’, Defra. 7 The Scottish Government (2011); ‘Statistical Publication: Agriculture Series: Final Results from 2010 June
Agricultural Census’. 8 Statistics for Wales (2011); ‘Farming Facts and Figures, Wales 2011’, The Welsh Government.
9 Department of Agriculture and Rural Development (2011), ‘The Agricultural Census in Northern Ireland Results for
June 2010’. 10
The Welfare of Farmed Animals (England) Regulations 2007 Statutory Instrument 2078. Office of Public Sector Information UK. 11
Tucker, S.A. and Walker, A.W., (1992) Hockburn in broilers. In Garnsworthy et al (eds) Recent Advances in Animal Nutrition Butterworth, Oxford UK, pp 33-50. 12
European Commission (2003), ‘Integrated Pollution Prevention and Control (IPPC) Reference Document on Best Available Techniques for Intensive Rearing of Poultry and Pigs’. 13
Environment Agency (2011), ‘EPR 6.09 Sector Guidance Note. How to comply with your environmental permit for intensive farming, Appendix 11, Assessing dust control measures on intensive poultry installations.’ 14
EMEP/CORINAIR (2006), ‘Atmospheric Emission Inventory Guidebook. Group 10 Agriculture. Particle Emissions from Animal Husbandry’, European Environment Agency. 15
Rosentrater, K. A. (2004); ‘Laboratory analysis of an electrostatic dust collection system’, CIGR ejournal. 16
EMEP/EEA Emission Inventory Guidebook 2009 (2010); ‘4.B Animal husbandry and manure management’, European Environment Agency. 17
Seedorf, J., Hartung, J. (2001); ‘A proposed calculation procedure for the amount of emitted particulate matter from livestock buildings’, Deutsche Tierarztliche Wochenschrift, 108, pp. 307–310. 18
Takai H.; Pedersen S.; Johnsen J. O.; Metz J. H. M.; Groot Koerkamp P. W. G.; G. H. Uenk;. Phillips V. R; Holden M. R.; Sneath R. W.; Short J. L.; White R. P.; Hartung J.; Seedorf J.; Schro der M.; Linkert K. H.; Wathes C. M. (1998), ‘Concentrations and Emissions of Airborne Dust in Livestock Buildings in Northern Europe’. Journal of Agricultural Engineering and Research 70, 59-77. 19
Li, X., J. E. Owen, A. J. Murdoch, and C. C. Pearson (1993), ‘Respirable dust from animal feeds’, In: Proceedings of International Livestock Environment Symposium IV, Warwick, England. 20
Aarnink, A.J.A., van Hattum, T., Hol, A. Zhao, Y. (2007), ‘Reduction of fine dust emissions by combi-scrubber of Big Dutchman’, Animal Science Group. Report 66. 21
Ellen, H. H.; Bottcher R. W.; von Wachenfelt E.; Takai H. (2000), ‘Dust levels and control methods in poultry houses’, Journal of Agricultural Safety and Health 6, 275–282. 22
Aarnink, A.J.A. and Ellen, H.H. (2007), ‘Processes and factors affecting dust emissions from livestock production’, Presentation paper from “Dust Conference” Animal Sciences Group. 23
Ekstrand, C., Algers, B. And Svendberg, J. (1997), ‘Rearing conditions and footpad dermatitis in Swedish broiler chickens’, Preventative Veterinary Medicine 31, 167 – 174. 24
Ove Arup & Partners Ltd (2006), ‘PM10 Emissions from Poultry Rearing Detailed Assessment’, South Norfolk District Council.
References
AECOM Review of Air Quality Impacts Resulting from Particle Emissions from Poultry Farms 92
Capabilities on project:
Environment
25
Victoria Sheppard (2003), ‘Study of Ambient Air Quality At Newborough, 19 June 2003 to 15 October 2003’, The Environment Agency 26
Isle of Anglesey County Council (2003 – 2007), ‘Air Quality Progress Report 2003/04’, ‘Air Quality Progress Report 2004/05’ and ‘Air Quality Progress Report 2006/07’. 27
Environment and Heritage Service Northern Ireland (2005), ‘Report on PM10 Sampling Equipment at Poultry Farm, Eglish during the Period November 2004 - August 2005’. 28
Environment and Heritage Service Northern Ireland (2007), ‘Report on PM10 Sampling Equipment at Poultry Farm, Augher during the Period October 2005 to December 2006’. 29
Environment and Heritage Service Northern Ireland (2008), ‘Report on PM10 Sampling Equipment at Poultry Farm, Brantry during the Period December 2006 to February 2008’. 30
Bureau Veritas (2011), ‘Local Air Quality Management Review and Assessment PM10 Detailed Assessment: Fleet Fen Farm’, South Holland District Council. 31
AEA (2011), ‘Detailed assessment of PM10 concentrations near two poultry farms in Sway, Hampshire’, New Forest District Council. 32
Muir Environment Ltd (2010), ‘2010 Air Quality Detailed Assessment for North Dorset District Council’, North Dorset Council. 33
Derbyshire Dales District Council (2009), ‘Detailed Assessment for PM10 Stoneleigh Cottage Poultry Farm, Cubley, Derbyshire’. 34
The Environment Agency (2011), ‘Study of Ambient Air Quality at Cubley’. 35
http://uk-air.defra.gov.uk/reports/cat05/0606130952_UKPMEquivalence.pdf. 36
Vernon, C and Speller D (2010), ‘Action Plan for Dust & Ammonia at Cubley Poultry Farm’, Derbyshire Dales District Council. 37
Personal communication with Jim Storey of the Environment Agency 18/07/11. 38
Royal Veterinary College, Centre for Ecology and Hydrology, Health and Safety Laboratory and ADAS (2009); ‘Characterising poultry dust properties, assessing the human health implications, quantifying emission levels and assessing the potential for abatement”, Defra. 39
Roumeliotis, T.S. and Van Heyst, B.J. (2008); ‘Summary of Ammonia and Particulate Matter Emission Factors for Poultry Operations’, Poultry Science Association. Inc. 40
Roumeliotis, T. S., and Van Heyst, B. J. (2007); ‘Size fractionated particulate matter emissions from a broiler house in southern Ontario, Canada’, Total Environ. 383:174–182. 41
Van Der Hoek, K. (2007); ‘Particulate matter emissions from animal production in the Netherlands’, Pages 1–5 in DustConf Int. Conf., Maastricht, the Netherlands. 42
Lacey, R. E., J. S. Redwine, and C. B. Parnell Jr. (2003); ‘Particulate matter and ammonia emission factors for tunnel-ventilated broiler production houses in the southern U.S.’ ASAE 46:1203–1214. 43
Jacobson, L. D., B. P. Hetchler, V. J. Johnson, R. E. Nicolai, D. R. Schmidt, P. R. Goodrch, A. J. Heber, J.-Q. Ni, T. T. Lim, P. C. Tao, S. J. Hoff, D. S. Bundy, M. A. Huebner, B. C. Zelle, Y. Zhang, J. McClure, M. Roberts, J. A. Koziel, B. H. Baek, A. Balota, J. P. Spinhirne, J. M. Sweeten, D. B. Beasley, G. R. Baughman, and R. Munilla. (2004); ‘Preliminary NH3, H2S, and PM10 data from pig and poultry building for six-state project’, Soc. Eng. Agric, Food, and Biol. Syst. Paper no. 044156. Presented at ASAE/CSAE Meet., Ottawa, Ontario, Canada. ASAE, St. Joseph, MI. 44
Lim, T. T., A. J. Heber, J.-Q. Ni, J. X. Gallien, and H. Xin. (2003); ‘Air quality measurements at a laying hen house: Particulate matter concentrations and emissions’, Pages 249–256 in Proc. Air Pollut. Agric. Oper. III. ASAE, St. Joseph, MI. 45
Environment Agency (2011); ‘Pollution Inventory reporting, Environmental Permitting (England and Wales) Regulations 2010, Regulation 60(1), Intensive farming guidance note’. 46
Sheppard, V. (2003); ‘Study of Ambient Air Quality at Newborough 19 June 2003 to 15 October 2003, Main Report’, Environment Agency. 47
http://shollandair.aeat.com/

AECOM Review of Air Quality Impacts Resulting from Particle Emissions from Poultry Farms 93
Capabilities on project:
Environment
48
http://shollandair.aeat.com/