reverse engineering socialbot infiltration
TRANSCRIPT
Seediscussions,stats,andauthorprofilesforthispublicationat:http://www.researchgate.net/publication/262489474
ReverseEngineeringSocialbotInfiltrationStrategiesinTwitter
ARTICLE·MAY2014
Source:arXiv
CITATIONS
2
READS
50
4AUTHORS,INCLUDING:
CarlosAlessandroSenadeFreitas
FederalUniversityofMinasGerais
2PUBLICATIONS2CITATIONS
SEEPROFILE
FabrícioBenevenuto
FederalUniversityofMinasGerais
72PUBLICATIONS1,742CITATIONS
SEEPROFILE
SaptarshiGhosh
UniversityofNorthBengal
31PUBLICATIONS130CITATIONS
SEEPROFILE
Availablefrom:CarlosAlessandroSenadeFreitas
Retrievedon:05December2015

Reverse Engineering Socialbot InfiltrationStrategies in Twitter
Carlos A. FreitasUFMG, Belo Horizonte, [email protected]
Fabricio BenevenutoUFMG, Belo Horizonte, Brazil
[email protected] GhoshIIEST Shibpur, India
Adriano VelosoUFMG, Belo Horizonte, [email protected]
ABSTRACTData extracted from social networks like Twitter are increas-ingly being used to build applications and services that mineand summarize public reactions to events, such as trafficmonitoring platforms, identification of epidemic outbreaks,and public perception about people and brands. However,such services are vulnerable to attacks from socialbots− au-tomated accounts that mimic real users − seeking to tamperstatistics by posting messages generated automatically andinteracting with legitimate users. Potentially, if created inlarge scale, socialbots could be used to bias or even inval-idate many existing services, by infiltrating the social net-works and acquiring trust of other users with time. Thisstudy aims at understanding infiltration strategies of social-bots in the Twitter microblogging platform. To this end, wecreate 120 socialbot accounts with different characteristicsand strategies (e.g., gender specified in the profile, how ac-tive they are, the method used to generate their tweets, andthe group of users they interact with), and investigate theextent to which these bots are able to infiltrate the Twittersocial network. Our results show that even socialbots em-ploying simple automated mechanisms are able to success-fully infiltrate the network. Additionally, using a 2k factorialdesign, we quantify infiltration effectiveness of different botstrategies. Our analysis unveils findings that are key for thedesign of detection and counter measurements approaches.
1. INTRODUCTIONOnline Social Networks (OSNs) have become popular
communication platforms where people post messages abouteverything, from day-to-day conversations to their opinionsabout noteworthy events. The size of the active user basesand the volume of data created daily on OSNs are massive.Twitter, a popular micro-blogging site, has more than 200million active users, who post more than 500 million tweetsa day [30]. Notably, about 90% of the Twitter users maketheir content public [6], allowing researchers and companiesto gather and analyze data at scale.
The massive amount of public data offered by Twitter, as-sociated with its simple and easy-to-use public API, have al-
lowed the emergence of a new wave of applications that ex-plore real-time Twitter data to offer data mining and knowl-edge extraction services. Indeed, in the last few years,there was a dramatic proliferation of applications and stud-ies that monitor memes, brands, people, products, and note-worthy events in Twitter, including political elections [36],stock marketing fluctuations [45], disease epidemic out-breaks [15], and natural disasters [32].
Although appealing as mechanisms to summarize infor-mation from the crowds, these services may be vulnerableto attacks that attempt to tamper their statistics, by dissemi-nating misinformation in the network [5]. For instance, con-sider that users of a Twitter-based service might be interestedin knowing what others think about a certain political can-didate to formulate their own opinion. In this scenario, onecould try to create fake accounts which post tweets to dis-honestly improve or damage the public perception about thisperson, as an attempt to manipulate public opinion. Recentefforts estimate that more than 20 million Twitter accountswere fake in 2013 [11] and even Twitter admitted that 5% ofits users are fake [10]. More alarmingly, socialbots – OSNaccounts that are automatically controlled but are made tolook like real users – are already being used to automate thiskind of attack [3, 18, 26].
If socialbots could be created in large numbers, they canpotentially be used to bias public opinion, for example, bywriting large amounts of fake messages and dishonestly im-prove or damage the public perception about a topic. Thereare already evidences of the use of socialbots to create a im-pression that emerging political movements are popular andspontaneous [31]. Socialbots have also been used by politi-cal candidates during election campaigns to try to change the“trending topics” [28], or to artificially increase their num-ber of followers [4]. This scenario only gets worse when weconsider the existence of socialbot sale services.1
Despite the large number of applications and services thatrely on Twitter data and the emerging black markets that at-tempt to manipulate such data [34], there are many unan-swered questions related to socialbots infiltration in Twit-1http://www.jetbots.com/
1
arX
iv:1
405.
4927
v1 [
cs.S
I] 2
0 M
ay 2
014

ter. For instance, Can socialbots really infiltrate Twittereasily?, What are the characteristics of socialbots thatwould enable them to evade current Twitter defenses?,What strategies could be more effective to gain followersand influence?, What automatic posting patterns couldbe deployed by socialbots without being detected?, and soon.
To answer these and other questions related to socialbots,this study attempts to reverse engineer socialbot infiltrationstrategies in Twitter. Our methodology consists of creating120 socialbot accounts with different characteristics and in-filtration strategies (e.g., gender specified in the profile, howactive they are in interacting with users, the method used togenerate their tweets), and investigating the extent to whichthese bots are able to infiltrate the Twitter social networkover the duration of a month. More specifically, we ana-lyze which socialbot strategy is more successful in acquir-ing followers and provoking interactions (such as retweetsand mentions) from other Twitter users.2 Then, we performa 2k factorial design experiment [20] to quantitatively mea-sure the extent to which each social strategy affect differentinfiltration metrics.
Our findings raise a huge alert about the vulnerability ofmany existing Twitter-based services. First, we show thatout of the 120 socialbots we created, only 31% could be de-tected by Twitter after a period of one month of executingonly automated behavior, suggesting that automated strate-gies are able to evade Twitter defense mechanisms. Second,we show that even socialbots employing simple automatedmechanisms successfully acquired hordes of followers andtriggered a large number of interactions from other users,making several bots to become relatively highly influentialaccording to metrics like Klout score [22]. Therefore, ourproposed approach to measure which bot strategy works bet-ter for infiltrating Twitter, may be extremely valuable forthe design of future defense mechanisms. Particularly, wefound that higher Twitter activity (such as following usersand posting messages) showed to be the most important fac-tor towards successful infiltration when bots target a randomgroup of users. Other factors, such as the gender and theprofile picture, may gain importance when the attack is con-centrated on a particular type of users.
As a final contribution, we plan to make our datasetavailable to the research community by the time of publi-cation of this article. The dataset consists of the timeline ofactivities and performance of infiltration of each of the 120socialbots during the 30 days of experimentation. To thebest of our knowledge, this dataset is the first of its kind, andwould allow researchers to explore new aspects of socialbotsinfiltration in Twitter.2Note that our only objective in analyzing the factors thatcan enable socialbot infiltration, is to improve defense mech-anisms in OSNs. We ensured that none of our socialbotsactually posted any malicious content in Twitter. Fur-thermore, all the socialbot accounts were deleted after onemonth of experimentation.
The rest of the paper is organized as follows. The next sec-tion briefly surveys related efforts. In Section 3, we presentthe methodology used to create the socialbots. Section 4presents the metrics used to evaluate the infiltration perfor-mance of socialbots. Section 5 describes which socialbotswere able to evade Twitter defenses, whereas Section 6 eval-uates the socialbots configurations that achieve the best infil-tration performance. Then, Section 7 describes a 2k factorialdesign experiment to quantitatively assess the relative impor-tance of various features in socialbot infiltration strategies.Finally, Section 8 discusses the implications of our findingsto future defense mechanisms and directions of future work.
2. RELATED WORKDifferent forms of spam have been observed in online sys-
tems [19] and OSNs such as Twitter. Specifically, there hasbeen lot of attention on spam in Twitter, which has beenobserved to be much more potent than conventional modesof spam such as email-spam [16]. In fact, several differ-ent types of spam activity have been observed in Twitter,including spamming trending topics [2], polluters [25], linkfarming [13], phishing [7], content credibility issues [5], andautomated and fraudulent accounts [34, 45]. Given that thepresent study focuses on socialbots in Twitter, the rest of thissection is devoted to review studies related to socialbots.
Bots in OSNs: A particular form of OSN spam con-sists of the spammers creating socialbots (or simply bots)which attempt to acquire influence and trust in the OSN be-fore engaging in malicious activities such as spreading mis-information and manipulating public opinion. There havebeen several attempts towards large-scale creation of botsin OSNs, such as the Realboy project [9] or the Web Ecol-ogy project [43]. Messias et al. [26] created bots capableof interacting with users on Twitter, and achieved signifi-cant scores according to influence metrics such as Klout andTwitalyzer.3 Boshmaf et al. [3] designed a social network ofbots in order to conduct a large-scale infiltration; the studydemonstrated that OSNs can be infiltrated with a success rateof up to 80%. In general, these efforts demonstrate the vul-nerability of Twitter to the infiltration of bots.
There have also been attempts for detection of bots inOSNs. Chu et al. [8] used machine learning techniques toidentify three types of accounts on Twitter − users, bots andcyborgs (users assisted by bots). They showed that the reg-ularity of posting, the fraction of tweets with URLs and theposting medium used (e.g., external apps), provide evidencefor the type of the account. Complementary to the detectionof bots, Wagner et al. [41] created a machine learning modelto predict user’s susceptibility to bot attacks using three dif-ferent set of attributes of the user (network, behavior andlinguistic characteristics). Their results indicate that usersmore “open” to social interactions are more susceptible toattacks. Subsequently, a similar study by Wald et al. [42]3http://twitalyzer.com
2
found that the Klout score, number of followers and friends,are good predictors of whether a user will interact with bots.
Two perspectives of studying spam: The numer-ous studies on spam in online forums can be broadly dividedinto two classes based on the perspective from which thestudy is conducted. A large majority of the studies (includ-ing the ones stated above) are from the perspective of thosewho build spam defense mechanisms, such as developingclassifiers for spammers and bots [8, 25]. However, therehave been a few studies which were conducted from the per-spective of spammers; these studies essentially attempt toreverse engineer the strategies of spammers in order to gaininsights which can help to develop better spam defenses.
Most of such studies (from the perspective of spammers)have been on email spam, and spam in the Web. Pitsillidiset al. [29] attempted to filter spam emails by exploiting theperspective of the spammers− they instantiated botnet hostsin a controlled environment, and monitored spam emails asthey were created, and thus inferred the underlying templateused to generate such emails. Stone-Gross et al. [33] stud-ied a large-scale botnet from the perspective of the botmas-ter, and analyzed the methodologies used in orchestratingspam email campaigns. Gyongyi et al. studied link farmson the Web, which are groups of interconnected web-pageswhich attempt to boost the rankings of particular web-pages.Specifically, they investigated how multiple web-pages canbe interconnected to optimize rankings [17].
Almost all studies on Twitter spam has focused on under-standing the dynamics of different forms of spam in Twitter,or on designing spam defense mechanisms. To the best ofour knowledge, there is no previous study attempting to an-alyze the strategies of bots/spammers from the perspectiveof the spammers themselves. This is the motivation of thepresent study − to reverse engineer socialbot strategies inthe Twitter OSN. We believe that this is complementary toall the aforementioned studies on Twitter spam, can offer anovel perspective to building more effective defense mecha-nisms against spam and bot accounts in the future.
3. METHODOLOGYThis study aims to reverse-engineer socialbot strategies in
Twitter, and analyze how various characteristics of the so-cialbots impact their infiltration performance. For this, itis necessary to create a set of socialbots in Twitter, whichwould attempt to infiltrate the network, and then observetheir behavior and infiltration performance. This section de-tails the steps followed in this infiltration experiment.
3.1 Creation of socialbotsFor the experiments in this study, a set of 120 socialbots
were created on Twitter. The socialbots were implementedusing the open-source Realboy project [9] which is an exper-imental effort to create ‘believable’ Twitter bots using simpleautomated techniques to follow other Twitter users and post
tweets (see [9] for details). Our 120 bots were created overa period of 20 days, using 12 distinct IP addresses (10 botswere operated from each IP address). Subsequently, startingfrom 10 days after the creation of the last bot, we monitoredtheir behavior and their interactions with other Twitter usersover a period of 30 days.
Profile settings of socialbots: To make bot accountslook similar to real users in Twitter, we took the followingsteps while creating the bot accounts. Each socialbot has acustomized profile, which includes a name, a biography, aprofile picture, and a background. The gender of the bot isalso set to ‘male’ or ‘female’ using a proper name and profilepicture. Further, to ensure that when other Twitter users seeour bot accounts, they do not see a totally ‘empty’ profile,the socialbots are initially set to have a few followers, fol-lowings and tweets. As detailed later in this section, the 120socialbots are divided into groups based on the set of targetusers they are assigned to follow. Each bot initially followsa small number (randomly selected between one and seven)of the most popular users among the target users assigned toit. Also, all socialbots assigned to the same target-set followeach other, so that every bot account has some followers tostart with. Finally, every socialbot posted 10 tweets beforeattempting to interact with other users.
Activity settings of socialbots: Since the objective ofour socialbots is to infiltrate the social network, it is neces-sary that they interact with other users in the social network.For this, our socialbots can perform a set of basic actions:(i) post tweets, (ii) retweet tweets posted by the users theyfollow, and (iii) follow users on Twitter.
Specifically, a socialbot becomes ‘active’ at pre-definedinstants of time; the gap between two such instants of ac-tivity is chosen randomly (as detailed later in this section).Once a socialbot becomes active, it performs the followingtwo actions – (i) with equal probability, the socialbot eitherposts a new tweet, or retweets a tweet that it has receivedfrom its followings, and (ii) the socialbot follows a randomnumber (between 1 and 5) of the target users assigned to it,and follows some of the users who have followed it (if any)since the last instant of activity.
Note that we attempt to ensure that our bots do not link tospammers or other fake accounts, which could make Twit-ter’s spam defense mechanisms suspicious, and potentiallylead to suspension of the bot accounts. For this, our botsonly follow users from their respective target-set, and someselected users from among those who have followed them.Since it is known that spammers in Twitter usually havefar less number of followers than the number of follow-ings [2, 25], our socialbots follow back non-targeted usersonly if those users have their number of followers greaterthan half the number of their followings.
3.2 Attributes of the socialbots
3

There are a number of attributes of a Twitter user-accountwhich could potentially influence how it is viewed by otherusers. Since analyzing the impact of all possible attributesinvolves a high cost, we decided to focus on the followingfour specific attributes of the socialbot accounts: (i) the gen-der mentioned in the bot’s profile, (ii) the activity level, i.e.,how active the bot is in following users and posting tweets,(iii) the strategy used by the socialbot to generate tweets, and(iv) the target set of users whom the socialbot links with.
We set the socialbot accounts such that they have diversecharacteristics with respect to each of the four attributesstated above, and then attempt to measure whether any ofthese attributes can make a bot more successful in terms ofinfiltration. The rest of this section describes these attributes,and their distribution in the 120 socialbots created.
3.2.1 GenderOut of the 120 socialbots created for our experiments, half
are specified to be male, while the other half are specified tobe female. Setting the gender of a socialbot involves usingan appropriate name and profile picture.
3.2.2 Activity levelHere we aim at investigating whether more active bots
are more likely to be successful in infiltration tasks, thanless active ones. Note that while more active bots are morelikely to be visible to other users, they are also more likelyto be detected by Twitter defense mechanisms; hence thereis a trade-off in deciding the activity level of socialbots.For simplicity, we create socialbots with only two levelsof activity, based on the interval between two consecutiveinstants when a bot becomes ‘active’ and engages in follow-ing users and posting tweets (as stated earlier in Section 3.1):
(1) High activity: For these socialbots, the intervalsbetween two consecutive instances of activity are chosenrandomly between 1 and 60 minutes.(2) Low activity: For these socialbots, the intervalsbetween two consecutive instances of activity are chosenrandomly between 1 and 120 minutes.
Half of our 120 socialbots are configured with high activ-ity, while the other 60 are configured with low activity. Also,all socialbots ‘sleep’ between 22:00 and 09:00 Pacific timezone, simulating the expected downtime of human users.
3.2.3 Tweet generating strategyMaking a socialbot to look like a legitimate user requires
automated methodologies for generating well-writtentweets with relevant content. We employ two differentmethodologies for generating tweets from our bot accounts:
(1) Re-posting: As the name indicates, this method con-sists of re-posting tweets that were originally posted by an-other user, as if they were one’s own. A socialbot employing
I
don’t snails
turtleslike
rabbits
start 0.66
1.0
0.33
0.33
0.330.33
Figure 1: Example of a bigram Markov chain – to demon-strate the approach used to synthetically generate tweetsposted by the socialbots.
this strategy simply re-posts tweets (written by other Twitterusers) drawn from the random sample of the Twitter stream.4
Note that a very large fraction of posts in Twitter are day-to-day conversation [14, 40]. Hence blindly re-posting anyrandom tweet may result in posting mostly conversationaltweets, which would not seem interesting to the target users(whom the bot intends to interact with). Thus, we adoptedthe following approach to increase the odds that the tweetsre-posted by our bots have content relevant to the targetusers. For a particular bot, we extracted the top 20 termsthat are most frequently used by the target users of that bot(after ignoring a common set of English stop-words). Sub-sequently, a bot considers a tweet for re-posting only if itcontains at least one of these top 20 terms.(2) Generating synthetic tweets: This approach syn-thetically generates tweets that are likely to be as relevantas the tweets posted by the target users. Our approach usesa Markov generator [1, 21] − a mathematical model usedto generate text that looks similar to the text contained in asample set of documents. Figure 1 shows an example of abigram Markov generator, extracted from the sample set ofdocuments {“I like turtles”, “I like rabbits” and “I don’t likesnails”}. Here, the weight of an edge wi → wj denotes theprobability that the word wj immediately follows word wi,as measured from the sample documents.5 A possible textgenerated by the Markov generator in Figure 1 is “I don’tlike rabbits” (see [1, 21] for details of the method).
To increase the likelihood that the tweets generated by asocialbot are considered relevant by the target users, we usea set of tweets recently posted by the target users of that so-cialbot, as the sample set to create the Markov generator.Specifically, we use a trigram Markov generator, since tri-grams showed the best results when compared to n-grams ofanother order. We initially extract the empirical probability
4Twitter provides a 1% random sample of the completetweet stream for public use.5For instance, there is an edge of weight 2
3between the
nodes “I” and “like” since, out of the three occurrences ofthe word “I” in the sample documents, two occurrences areimmediately followed by the word “like”.
4

I don’t have an error in it :)The amount of content being published this week :: thenumber of people who’ve finished this website but it makesit easier to argue thatWhy isn’t go in the morning! night y’allNight y’all ???!take me to fernandos and you’ll seeend aids now, the marilyn chambers memorial film festivalI’d fix health care continues to outpace much of nation’sissues move to the
Table 1: Examples of tweets synthetically generated bythe Markov generator
of occurrence of each trigram in the sample set, then gener-ate a Markov generator from the obtained set of trigrams.
The main advantages of this method are that it does notrequire any human effort, but it generates text containing therepresentative terms of the sample set of documents. Thus,with a relatively high probability, the tweets generated bythe socialbots are on the topics of interest of the target group.However, the textual quality of the tweets may be low, e.g.,some tweets may be unfinished sentences. Moreover,because of the way that the method has been implementedit is unable to generate tweets containing user-mentions orURLs. Table 1 shows some example tweets generated bythe Markov generator used in our experiment.
Half of our 120 socialbots use only the reposting method,while the others utilize both the above methods, where eachmethod has an equal probability to generate the next tweet.
3.2.4 Target usersAnother factor which potentially affects the performance
of socialbots in infiltration tasks is the set of target users, i.e.,the set of users with whom the socialbot attempts to interactand infiltrate. For instance, we wanted to check whether itis easier for socialbots to infiltrate randomly selected users,or users who are similar to each other in some way (e.g.,users who are interested in a common topic, or users whoare socially connected among themselves).
As stated earlier, we wished to ensure that our socialbotsdo not link to spammers or other fake accounts in Twitter.Hence, we consider as a potential target user, only thoseuser-accounts which possess the following characteristics:(i) are controlled by a human (as manually judged fromthe account’s profile and the nature of the tweets posted),(ii) post tweets in English, to ensure that they understandthe language used by our bots and, (iii) are active, i.e.,has posted at least one tweet since December 2013. Weconsidered the following three groups of target users:
Group 1: Consisting of 200 users randomly selected fromthe Twitter stream random sample, and verified that theymeet the above mentioned criteria.Group 2: Consisting of 200 users who post tweets on aspecific topic. We decided to focus on a group of softwaredevelopers; hence, we selected users from the Twitter ran-dom sample, who have posted at least one tweet containing
102 103 104
Age of the user account0.0
0.2
0.4
0.6
0.8
1.0
CDF
Group 1Group 2Group 3
(a) Age of the user account
100 101 102 103 104 105 106
Number of tweets0.0
0.2
0.4
0.6
0.8
1.0
CDF
Group 3Group 2Group 1
(b) Number of tweets posted
100 101 102 103 104 105 106
Number of followers0.0
0.2
0.4
0.6
0.8
1.0
CDF
Group 1Group 2Group 3
(c) Number of followers
0 20 40 60 80Klout Score
0.0
0.2
0.4
0.6
0.8
1.0
CDF
Group 1Group 2Group 3
(d) Klout score
Figure 2: Comparing the three groups of target users:CDFs for (i) age of the user-accounts, (ii) number oftweets posted by the users, (iii) number of followers, and(iv) Klout Score of the users in the three groups.
any of the terms “jQuery”, “javascript” or “nodejs”. Sub-sequently, we randomly selected 200 accounts from amongthese users, after verifying that they meet the criteria statedabove. Note that though we focus on software developers,the study could be conducted on groups of users interestedin any arbitrary topic.Group 3: Consisting of 200 users who post tweets ona specific topic, and are socially connected among them-selves. As the topic, we again focus on software developers.Here we started with a ‘seed user’ – @jeresig, who is aninfluential software developer on Twitter, and creator of‘jQuery’ – and collected the 1-hop neighborhood of theseed user. From among these users, we extracted 200 userswhose profiles show that they are software developers, whosatisfy the criteria stated above, and whose social links forma dense sub-graph in the Twitter social network.
Out of the 120 socialbots, 40 were assigned to each groupof target users. To bring out the differences among the threegroups (selected as described above), we conducted a briefcharacterization of each group. Figure 2 shows distribu-tions of the users in the three target groups according to:(i) the age of their accounts, (ii) the total number of tweetsposted during their life-time, (iii) their number of followers,and (iv) their Klout scores. We found that users in group 1have relatively newer accounts than the other groups (Fig-ure 2(a)); however, they are more active in posting tweets(Figure 2(b)). Further, users in group 3 are more influentialthan the other groups, i.e., have a greater number of follow-ers (Figure 2(c)) and higher Klout scores (Figure 2(d)).
The justification behind our choices of target users is asfollows. First, we intend to check whether it is easier for so-cialbots to interact with and infiltrate heterogeneous groups
5

of users (Group 1), or a particular category of users basedon common interests (e.g., software developers, as in Group2 and Group 3). Second, we wanted to compare the rela-tive difficulty in infiltrating a group of users who are sociallywell-connected among themselves, versus users who are notsocially connected. For this, we select Group 2 and Group3 as stated above, so that both groups of users are interestedin the same topic, but Group 3 is densely connected in thesocial network while Group 2 is not.Thus, the 120 socialbots created for this experiment wereconfigured with different strategies for the four chosen at-tributes. The subsequent sections will analyze which ofthese strategies result in better infiltration performance.
4. MEASURING INFILTRATION PER-FORMANCE
The objective of this study is to investigate whether,and to what extent, various socialbot strategies are able toinfiltrate the Twitter social network. Naturally, we needsome metrics to quantify the infiltration performance ofsocialbots, so that the performance of different strategies(employed by the socialbots) can be compared. To quantifyinfiltration performance we use the following three metrics,measured at the end of the duration of the experiment.
(1) Followers acquired by the socialbot: We countthe number of followers acquired by the socialbot, which isa standard metric for estimating the popularity / influence ofusers in the Twitter social network [6].(2) Klout score acquired by the socialbot: Kloutscore [22] is a popular metric for the online social influenceof a user. Though the exact algorithm for the metric is notknown publicly, the Klout score for a given user is known toconsider various data points from Twitter (and other OSNs,if available), such as the number of followers and followingsof the user, retweets, membership of the user in Lists, howmany spam / dead accounts are following the user, how in-fluential are the people who retweet / mention the user, andso on [23]. Klout scores range from 1 to 100, with higherscores implying a higher online social influence of a user.(3) Message-based interactions with other users:We measure the number of times other users interact witha socialbot through messages (tweets) posted in the socialnetwork. Considering the different types of message-basedinteractions allowed in Twitter, we specifically count the to-tal number of times some user @mentions the bot, or repliesto the bot, or retweets / favorites a tweet posted by the bot.This metric estimates the social engagement of the bot,which is defined as the extent to which a user participates ina broad range of social roles and relationships [44].
If a bot scores well in terms of the above metrics, it impliesthat the tweets posted by this bot are more likely to be visi-ble, e.g., more likely to be included in Twitter search results,
Group 1 Group 2 Group 3 Male Female Male Female Male Female
Bot 1 Bot 2 Bot 3 Bot 4 Bot 5 Bot 6 Bot 7 Bot 8 Bot 9 Bot 10 Bot 11 Bot 12 Bot 13 Bot 14 Bot 15 Bot 16 Bot 17 Bot 18 Bot 19 Bot 20 Bot 21 Bot 22 Bot 23 Bot 24 Bot 25 Bot 26 Bot 27 Bot 28 Bot 29 Bot 30 Bot 31 Bot 32 Bot 33 Bot 34 Bot 35 Bot 36 Bot 37 Bot 38 Bot 39 Bot 40 Bot 41 Bot 42 Bot 43 Bot 44 Bot 45 Bot 46 Bot 47 Bot 48 Bot 49 Bot 50 Bot 51 Bot 52 Bot 53 Bot 54 Bot 55 Bot 56 Bot 57 Bot 58 Bot 59 Bot 60 Bot 61 Bot 62 Bot 63 Bot 64 Bot 65 Bot 66 Bot 67 Bot 68 Bot 69 Bot 70 Bot 71 Bot 72 Bot 73 Bot 74 Bot 75 Bot 76 Bot 77 Bot 78 Bot 79 Bot 80 Bot 81 Bot 82 Bot 83 Bot 84 Bot 85 Bot 86 Bot 87 Bot 88 Bot 89 Bot 90 Bot 91 Bot 92 Bot 93 Bot 94 Bot 95 Bot 96 Bot 97 Bot 98 Bot 99 Bot 100 Bot 101 Bot 102 Bot 103 Bot 104 Bot 105 Bot 106 Bot 107 Bot 108 Bot 109 Bot 110 Bot 111 Bot 112 Bot 113 Bot 114 Bot 115 Bot 116 Bot 117 Bot 118 Bot 119 Bot 120
High Activity
Low Activity
Reposting
Resposting
Resposting +
Markov
Resposting +
Markov
Figure 3: Distribution of attributes of the 120 socialbotscreated for the infiltration experiment, showing those so-cialbots which were detected and suspended by Twitterduring the experiment (shown in red color). Note that69% of the socialbots (shown in blue color) could not bedetected by Twitter.
and is hence more likely to affect the opinion of other users(which are common goals of bots in social networks).
The subsequent sections measure the success of varioussocialbot strategies in infiltrating the social network accord-ing to the metrics specified above.
5. CAN SOCIALBOTS INFILTRATE TWIT-TER?
We first investigate whether, and to what extent, social-bots can infiltrate the Twitter social network. For a social-bot to successfully infiltrate the network, it needs to achievethe following two objectives. (i) evade detection by Twit-ter’s spam defense mechanisms which regularly check forand suspend accounts exhibiting automated activities [38],and (ii) acquire a substantial level of popularity and influ-ence in the social network, and interact with large number ofother users, i.e., achieve high scores in the metrics describedin Section 4In this section, we investigate how socialbots performed withrespect to the above objectives.
5.1 Socialbots can evade Twitter defensesWe start by checking how many of the 120 socialbots
could be detected by Twitter. We find that over the 30 daysduring which the experiment was carried out, 38 out of the120 socialbots were suspended. This implies that althoughall our socialbots actively posted tweets and followed otherusers during this period, as many as 69% of the socialbotscould not be detected by Twitter spam defense mechanisms.
We next analyze which of the 120 socialbots could be de-tected by Twitter. Figure 3 shows the distribution of the fourattributes – gender, level of activity, tweeting methodology,and target group of users followed – among the 120 social-bots created. The socialbots are indicated by numeric identi-fiers in the same order in which they were created, i.e., Bot1was created first and Bot120 was the last socialbot created.The socialbots which were suspended by Twitter during theexperiment (one month) are indicated in red color, while the
6
socialbots which could not be detected by Twitter are shownin blue color.
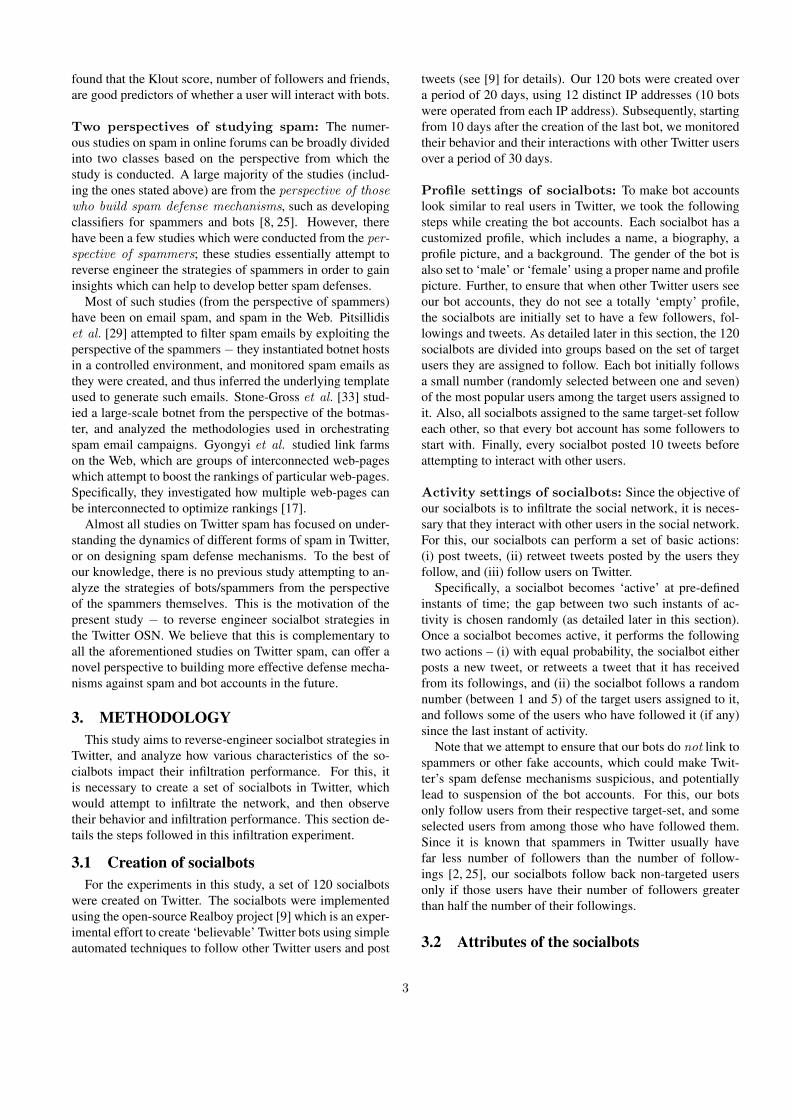
We note that a large majority of the socialbots whichwere suspended were the ones which were created at theend of the account creation process (with ids between 90and 120). This is probably because by the time these ac-counts were created, Twitter’s defense mechanisms had be-come suspicious of several accounts being created from thesame block of IP addresses.6 We also find that the socialbotswhich used the Markov-based posting method were morelikely to be suspended. This is expected, since about halfof the tweets posted by these accounts were syntheticallygenerated, and hence likely to be of low textual quality.
However, the Twitter defense mechanisms could detectonly a small fraction of the socialbots which were createdearly, and which adopted the re-posting strategy, i.e., re-posted others’ tweets. These statistics highlight that exist-ing defense mechanisms are of only limited use in detectingsocialbots which employ simple but intelligent strategies forposting tweets and linking to other users. Further, the rela-tively low fraction of suspended accounts justifies our strate-gies such as re-posting others’ tweets, and ensuring that oursocialbots do not link with large number of spammers andfake accounts (as described in Section 3).
5.2 Bots can infiltrate Twitter successfullyWe next check to what extent socialbots can infiltrate the
Twitter social network, and whether they can gain relativelyhigh scores according to the metrics stated in Section 4.
Over the duration of the experiment, the 120 socialbotscreated by us received in total 4,999 follows from 1,952 dis-tinct users, and 2,128 message-based interactions from 1,187distinct users. Figure 4 shows the distribution of the numberof followers, the Klout score and the number of message-based interactions acquired by the socialbots at the end ofthe experiment. It is evident that a significant fraction of thesocialbots acquire relatively high popularity and influencescores. Within just one month (the duration of the experi-ment), more than 20% of the socialbots acquired more than100 followers (Figure 4(a)); it can be noted that 46% of theusers in Twitter have less than 100 followers [37]. Further-more, Figure 4(b) shows that 20% of the socialbots acquiredKlout scores higher than 35 within only one month.
Table 2 compares the Klout scores acquired by the threesocialbots that acquired the highest Klout scores7 with somereal and active Twitter users – members of the COSN com-munity. We find that the socialbots achieved Klout scoresof the same order of (or, at times, even higher than) sev-
6As stated in Section 3, we used 12 distinct IP addressesto create the 120 socialbots, i.e., 10 accounts were operatedfrom each IP address.7The three socialbots which acquired the highest Kloutscores have common characteristics – all of them had theirgender specified as ‘female’, were highly active, used onlyreposting as the mechanism for posting tweets, and followedGroup 2 of target users (see Section 3).
eral of these well-known academicians and social networkresearchers. Additionally, these socialbots also acquiredhigher Klout scores than the two bots developed in the priorstudy [26].
Note that the Klout scores of our socialbots were ac-quired over only one month (the duration of the experiment),whereas the real users in Table 2 have accumulated influ-ence over several years. Besides, most of the real usersin Table 2 have accounts in multiple OSNs (e.g., Twitter,Facebook, LinkedIn), all of which contribute towards theirKlout scores; on the other hand, the Klout scores of our so-cialbots are only contributed by their Twitter accounts. Inspite of the above limitations, the scores of our socialbotshighlight the fact that bots employing relatively simple auto-mated strategies to follow users and post tweets, can achievesignificantly high levels of popularity and social engagementin Twitter network.
User Description KloutCarlos Castillo COSN’14 TPC member 56Ben Zhao COSN’14 TPC member 52Ashish Goel COSN’14 TPC member 46Francesco Bonchi COSN’14 TPC member 44Winter Mason COSN’14 TPC member 44PK COSN’14 Publicity Chair 43Mirco Musolesi COSN’14 TPC member 43Bot 28 Socialbot in this study 42Bot 4 Socialbot in this study 39Bot 16 Socialbot in this study 39Christo Wilson COSN’14 Budget Chair 38scarina Bot developed in [26] 37.5Fabricio Benevenuto COSN’14 TPC member 27Paolo Boldi COSN’14 TPC member 19fepessoinha Bot developed in [26] 12.3
Table 2: Comparison of Klout scores of some of our so-cialbots with members of the COSN community, andbots developed in the prior study [26].
6. EVALUATING INFILTRATION STRA-TEGIES
The previous section showed that a significant fraction ofthe socialbots are indeed able to infiltrate and gain popularityin the Twitter social network. This section analyzes whichsocialbot strategies lead to better infiltration performance.Recall from Section 3 that the socialbots were configuredwith multiple strategies for each of the four attributes – gen-der, activity level, tweet-posting method, and type of targetusers. We now investigate which strategies for each of thefour attributes yields the best infiltration performance. Notethat the results stated in this section (and the next) considerthose socialbots which were not suspended by Twitter duringthe experiment (as described in Section 5).
6.1 GenderWe start by analyzing the impact of the gender of the so-
cialbots in our experiments. Figure 5(a) and (b) respectivelyshow the mean number of followers and the Klout score ac-quired by the male and female socialbots over each day dur-
7

0 50 100 150 200Number of followers
0.0
0.2
0.4
0.6
0.8
1.0CD
F
Bots
(a) Number of followers
0 5 10 15 20 25 30 35 40 45Klout Score
0.0
0.2
0.4
0.6
0.8
1.0
CDF
Bots
(b) Klout Score
0 10 20 30 40 50 60 70Number of message-based interactions
0.0
0.2
0.4
0.6
0.8
1.0
CDF
Bots
(c) Message interactions
Figure 4: Infiltration performance of our socialbots: CDFs for (i) number of followers, (ii) Klout Score, and (iii)number of message-based interactions with other users.
0 5 10 15 20 25 30 35Time (days)
30
40
50
60
70
80
90
Numb
er of
follow
ers
Male Female
(a) Number of followers
0 5 10 15 20 25 30 35Time (days)
5
0
5
10
15
20
25
30
Klout
Score
Male Female
(b) Klout Score
0 5 10 15 20 25 30 35Time (days)
0
5
10
15
20
25
30
Intera
ction
s
Male Female
(c) Message interactions
Figure 5: Infiltration performance of socialbots of different genders through the duration of the experiment: (i) meannumber of followers acquired, (ii) mean Klout score acquired, and (iii) mean number of message-based interactionswith other users. The curves represent the mean values, which the error bars indicated the 95% confidence intervals.
ing our experiment. In these figures, the curves representthe mean values considering all the socialbots of a particu-lar gender (on a given day during the experiment), and theerror bars indicate the 95% confidence intervals of the meanvalues. We find that there is no significant difference in thepopularity acquired by socialbots of different genders.
We next turn to the message-based interactions of the maleand female socialbots with other users. Figure 5(c) showsthe mean number of interactions of the socialbots on eachday during the experiment. Again, we observe that usersinteracted almost equally with socialbots of both genders.8
The above results imply that the gender specified in theaccount profile does not significantly influence the infiltra-tion performance of the socialbots. It can be noted that, inthis section, we are considering all the socialbots (and in-teractions with all target users) together. Later in Section 7,when we separately analyze the performance of socialbots ininfiltrating each group of target users, we shall see that thegender attribute is indeed significant for some specific targetgroups.
6.2 Activity LevelWe next study the impact of the socialbots’ activity levels,
which we define as lower or higher based on how frequentlya socialbot posts tweets and follows users.
8The number of distinct users who interacted with the fe-male socialbots (1,697), was, in fact, slightly higher thanthe number who interacted with the male socialbots (1,528).But, as evident from Figure 5(c), this difference is not a sig-nificant one.
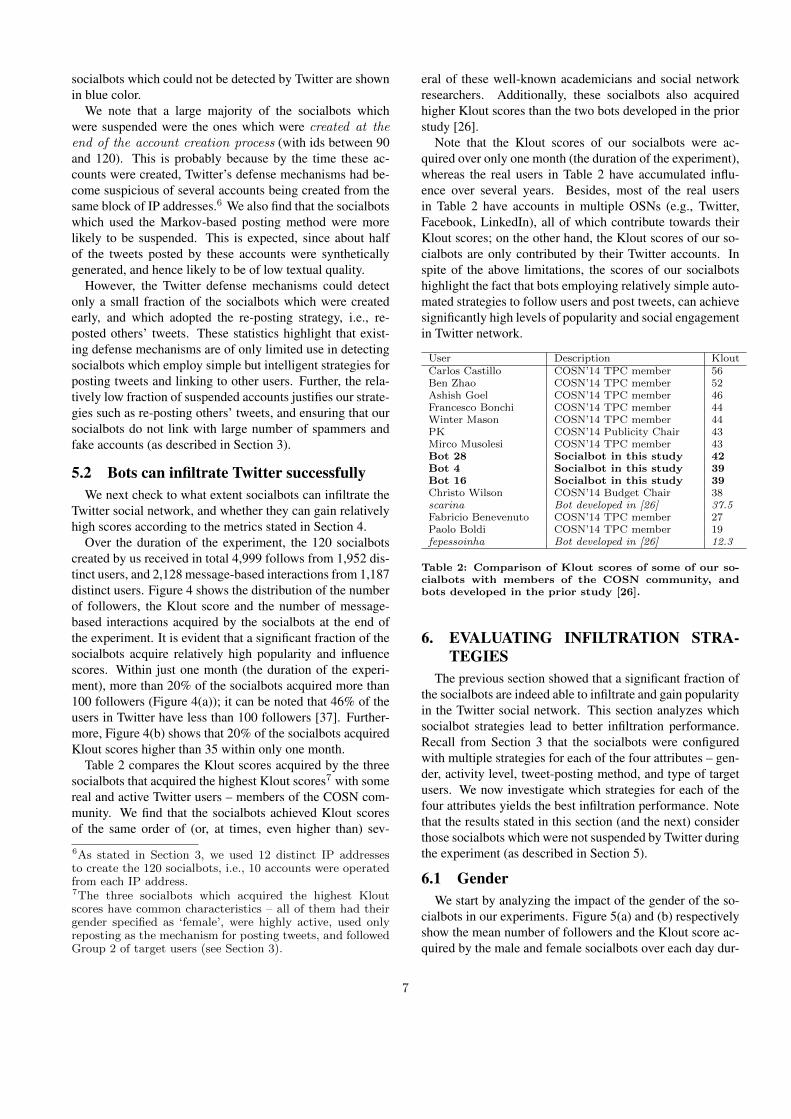
Figure 6(a) and (b) respectively show the mean number offollowers and mean Klout scores of the socialbots (havingthe two different levels of activity) on each day during theexperiment. We can see that socialbots with higher activitylevels achieve significantly more popularity and Klout scorethan less active socialbots. Figure 6(c) show the mean num-ber of message-based interactions of socialbots with otherusers in Twitter. Again, the more active socialbots achievedmuch more interactions.
Thus, we find that the more active are the bots, the morelikely they are to be successful in infiltration tasks, as well asin gaining popularity in the social network. This is expected,since the more active a bot is, the higher is the likelihood ofits being visible to other users. However, it must also benoted that the more active a bot is, the more likely it is to bedetected by Twitter’s defense mechanisms.
6.3 Tweet generating methodWe next analyze the impact of the tweet generating
method used by the socialbots. Recall from Section 3 thathalf of our socialbots only re-posted tweets written by otherusers (strategy denoted as ‘reposting’), while the other halfre-posted tweets as well as synthetically generated tweetsusing a Markov generator, with equal probability (strategydenoted as ‘reposting + Markov’).
Figure 7(a), (b), and (c) respectively show the mean num-ber of followers, mean Klout scores, and the mean number ofmessage-based interactions acquired by the socialbots em-ploying the two posting strategies (on each day during theexperiment). It is seen that the socialbots employing the ‘re-
8
0 5 10 15 20 25 30 35Time (days)
30
40
50
60
70
80
90
100Nu
mber
of fol
lowers
High activity Low activity
(a) Number of followers
0 5 10 15 20 25 30 35Time (days)
5
0
5
10
15
20
25
30
Klout
Score
High activity Low activity
(b) Klout Score
0 5 10 15 20 25 30 35Time (days)
0
5
10
15
20
25
30
Intera
ction
s
High activity Low activity
(c) Message interactions
Figure 6: Infiltration performance of socialbots having different activity levels: (i) mean number of followers, (ii) meanKlout score, and (iii) mean number of message-based interactions with other users.
0 5 10 15 20 25 30 35Time (days)
30
40
50
60
70
80
90
100
Numb
er of
follow
ers
Reposting Reposting + Markov
(a) Number of followers
0 5 10 15 20 25 30 35Time (days)
5
0
5
10
15
20
25
30
35
Klout
Score
Reposting Reposting + Markov
(b) Klout Score
0 5 10 15 20 25 30 35Time (days)
0
5
10
15
20
25
30
35
Intera
ction
s
Resposting Resposting + Markov
(c) Message interactions
Figure 7: Infiltration performance of socialbots employing different methodologies to generate tweets: (i) mean numberof followers acquired, (ii) mean Klout score, and (iii) mean number of message-based interactions with other users.
posting + Markov’ strategy acquired marginally higher lev-els of popularity (number of followers and Klout scores),and much higher amount of interactions (social engagement)with other users.
The fact that socialbots which automatically generatedabout half of their tweets achieved higher social engagementis surprising, since it indicates that users in Twitter are notable to distinguish between (accounts which post) human-generated tweets and automatically generated tweets usingsimple statistical models. This is possibly because a largefraction of tweets in Twitter are written in an informal, gram-matically incoherent style [24], so that even simple statisti-cal models can produce tweets with quality similar to thoseposted by humans in Twitter.
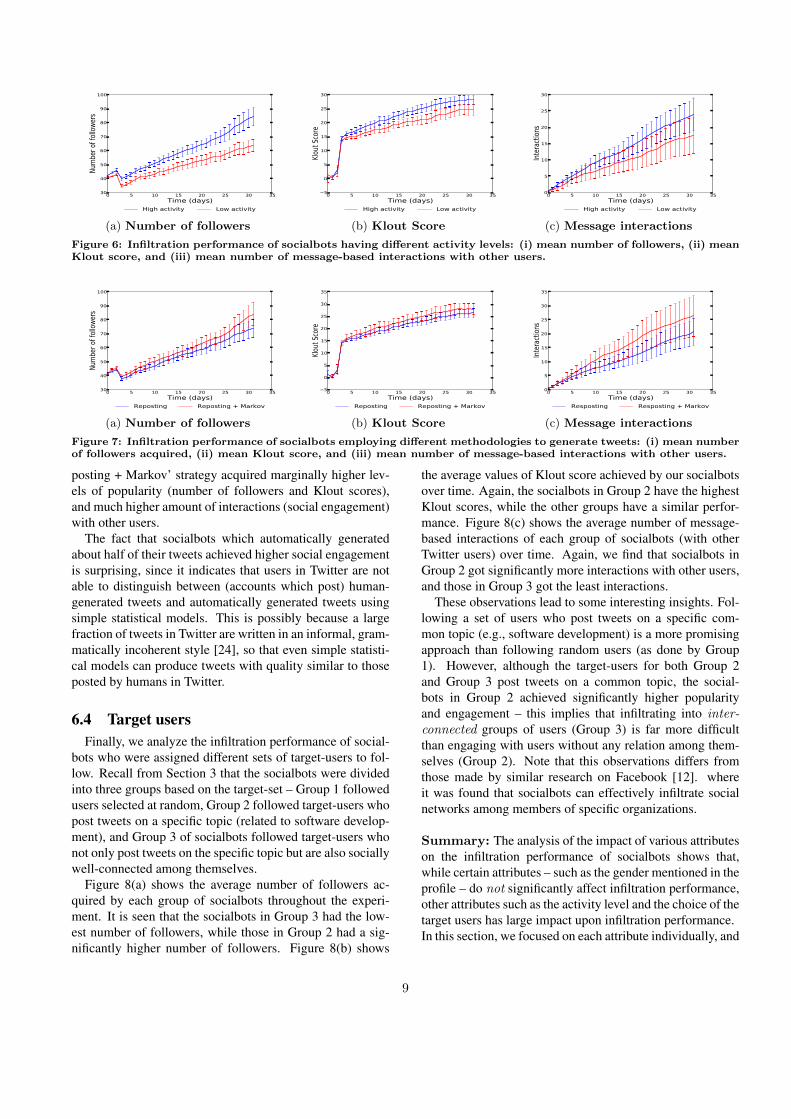
6.4 Target usersFinally, we analyze the infiltration performance of social-
bots who were assigned different sets of target-users to fol-low. Recall from Section 3 that the socialbots were dividedinto three groups based on the target-set – Group 1 followedusers selected at random, Group 2 followed target-users whopost tweets on a specific topic (related to software develop-ment), and Group 3 of socialbots followed target-users whonot only post tweets on the specific topic but are also sociallywell-connected among themselves.
Figure 8(a) shows the average number of followers ac-quired by each group of socialbots throughout the experi-ment. It is seen that the socialbots in Group 3 had the low-est number of followers, while those in Group 2 had a sig-nificantly higher number of followers. Figure 8(b) shows
the average values of Klout score achieved by our socialbotsover time. Again, the socialbots in Group 2 have the highestKlout scores, while the other groups have a similar perfor-mance. Figure 8(c) shows the average number of message-based interactions of each group of socialbots (with otherTwitter users) over time. Again, we find that socialbots inGroup 2 got significantly more interactions with other users,and those in Group 3 got the least interactions.
These observations lead to some interesting insights. Fol-lowing a set of users who post tweets on a specific com-mon topic (e.g., software development) is a more promisingapproach than following random users (as done by Group1). However, although the target-users for both Group 2and Group 3 post tweets on a common topic, the social-bots in Group 2 achieved significantly higher popularityand engagement – this implies that infiltrating into inter-connected groups of users (Group 3) is far more difficultthan engaging with users without any relation among them-selves (Group 2). Note that this observations differs fromthose made by similar research on Facebook [12]. whereit was found that socialbots can effectively infiltrate socialnetworks among members of specific organizations.
Summary: The analysis of the impact of various attributeson the infiltration performance of socialbots shows that,while certain attributes – such as the gender mentioned in theprofile – do not significantly affect infiltration performance,other attributes such as the activity level and the choice of thetarget users has large impact upon infiltration performance.In this section, we focused on each attribute individually, and
9

0 5 10 15 20 25 30 35Time (days)
30
40
50
60
70
80
90
100Nu
mber
of fol
lowers
Group 1 Group 2 Group 3
(a) Number of followers
0 5 10 15 20 25 30 35Time (days)
5
0
5
10
15
20
25
30
35
Klout
Score
Group 1 Group 2 Group 3
(b) Klout Score
0 5 10 15 20 25 30 35Time (days)
0
10
20
30
40
50
Intera
ction
s
Group 1 Group 2 Group 3
(c) Message interactions
Figure 8: Infiltration performance of socialbots which followed different sets of target users: (i) mean umber of followersacquired, (ii) mean Klout score, and (iii) mean number of message-based interactions with other users.
compared the infiltration performance for different choices(strategies) of that attribute. However, we did not attemptto analyze the relative importance of different attributes;for instance, we did not investigate which of the two at-tributes (i) activity level and (ii) choice of target users hasthe larger impact upon infiltration performance. The nextsection quantifies the relative impact of the various attributeson infiltration performances.
7. ASSESSING ATTRIBUTE IMPOR-TANCE
In this section, we aim to assess the relative importanceof the different attributes and infiltration strategies of the so-cialbots. Our objective is to quantify which strategy (or,combination of strategies) has the greatest impact in decid-ing how the socialbots can infiltrate specific groups of targetusers. Note that, differently from Section 6, here we considerthe socialbots’ performance in infiltrating specific groups oftargeted users.
We present a factorial design experiment to assess therelative impact of the different infiltration strategies. We be-gin by briefly describing how we designed our experiments,and then discuss the obtained results.
7.1 2k factorial experimentWe here include a brief description of the theory of 2k
factorial experiments; we refer the reader to [20] for a com-prehensive description.
An experimental design strategy is usually necessary inscenarios with a large number of factors, as an attempt toreduce the number of factors that will be part of the experi-ment. Particularly, 2k designs refer to experimental designswith k factors where each factor has the minimal numberof levels, just two. As an illustrative example, suppose anexperimental performance scenario in which three factors –memory, disk, and CPU of a machine – can potentially af-fect the performance of an algorithm. Suppose now that eachexperiment takes about one day to run and there are 10 pos-sible types of memory, 10 types of disks, and 10 types ofCPUs to be tested. Running an experiment with all possi-bilities would take 10 × 10 × 10 = 1, 000 days. Insteadof running all possibilities, a 2k design would consider two
Factor −1 +1Gender (G) Female MaleActivity Level (A) Low activity High activityPosting Method (P) Repost Repost+Markov
Table 3: Factors used in the factorial experiment for thesocialbot infiltration study.
(usually extreme) types of memory, two types of disk, andtwo types of CPUs to compare, which would result in only23 = 8 days of experiments. The theory of factorial experi-ments [20] would then allow one to estimate how much eachfactor impacts on the final result, a key information to helpdecide on which factors an experiment should focus.
Note that, differently of the above example, our goal hereis not primarily to reduce the number of experiment scenar-ios. Instead we use a 2k design to infer how much a factor– which, in our case, correspond to attributes like gender,activity level, and posting method – impacts the different in-filtration metrics.
7.2 Factorial experiment on the socialbot in-filtration
For certain applications, the objective of socialbots mightbe to infiltrate a particular target group of users. Hence, wehere individually consider the success of our socialbots ininfiltrating each of the three target groups (which were de-scribed in Section 3). For each target group, we considerthe three infiltration metrics stated earlier – the number offollowers acquired, the number of message-based interac-tions and the Klout score. Then, for each metric and eachtarget group, we executed a 23 design considering the at-tributes and their values as described in Table 3, resultingin 3 × 3 × 23 = 216 experiments. We performed experi-ments that associates +1 or −1 for the strategies employedfor each attribute. All experimental configurations for alldatasets were averaged over 5 results, which is the numberof socialbots in each configuration.
The basic idea of the factorial design model consists offormulating y, the infiltration impact, as a function of a num-ber of factors and their possible combinations, as defined byEquation 1. Here, GP, AP, AG, and GAP account for allpossible combinations among the factors. For instance, theexperiments for ‘GP’ attempts to measure the impact of a
10

certain combination of the attributes Gender (G) and Post-ing method (P) (e.g., ‘Female and Repost’, or ‘Male and Re-post+Markov’).
y = Q0 +∑i∈F
Qi · xi (1)
where F = {G,A, P,GA,GP,AP,GAP} and xi isdefined as follows.
xG =
{-1 if Female+1 if Male
xA =
{-1 if Low activity+1 if High activity
xP =
{-1 if Repost+1 if Repost + Markov
and the xi’s for the feature-combinations (e.g., AG, GP) aredefined from the values of xG, xA, and xP following thestandard way described in [20] (details omitted for brevity).
In the above equation, Qi is the infiltration performance(according to a certain metric like number of followers, orKlout score) when strategy i ∈ F is applied, and Q0 standsfor the average infiltration performance, averaged over allpossible features and their combinations. By empiricallymeasuring y according to different feature-combinations(which, in our case, refer to the various socialbot strategies),we can estimate the values of the different Qi and Q0. Thisallows us to understand by how much each factor impactsthe final infiltration performance.
Instead of presenting results for all possible values of Qi,we focus on the variations of Qi due to changes in thefeatures (or their combinations), which helps to estimatethe importance of a particular factor to the final result. Asan example, if we find that a factor accounts for only 1% oftotal variation on the results, we can infer that this attributeis unimportant for infiltrating Twitter with a socialbot.
As proposed in [20], the importance of the various factorscan be quantitatively estimated by assessing the proportionof the total variation in the final result that is explainedby each factor. To compute this variation, we first considerthe variation of y (as defined by Equation 1) across all runs,and then compute SST as the sum of the squared differencebetween each measured value of y and the mean value of y.Then, we compute SSi as the variation only due to thechanges on factor i, which can be computed similarly toSST , but considering only those runs in which the values ofthe factor i were changed. Finally, we calculate the fractionof variation due to factor i as SSi
SST. We now use this metric to
compute the impact of each attribute for different infiltrationmetrics and groups of target users.
7.3 Attribute ImportanceWe begin by analyzing to what extent each of the at-
tributes impacts the number of followers acquired by thesocialbots. Table 4 shows the variation explained by eachattribute in the number of followers acquired by the social-bots from each of the target groups. We note that the ac-
tivity level of a socialbot is the most important attribute forGroup 1 (random users) of target users, being 53.75% re-sponsible for deciding the number of followers acquired by asocialbot. The second most important attribute is the postingmethod (i.e., technique used to generate the tweets), whichaccounts for 12.44% of the variation on the number of fol-lowers. The combination of these two attributes (AP columnin Table 4) leads to a high variation (about 20%) on the num-ber of followers as well.
Similar observations can be made from Table 5 and Ta-ble 6, which shows the percentage variation explained byeach attribute on the number of message-based interactions(i.e., number of tweets retweeted or favorited, number ofmentions, and number of replies) and on the Klout Scores,respectively.
We also observe that the importance of some of the at-tributes varies significantly according to the group of userstargeted by the socialbots. For instance, the gender attributehas a great importance in the experiments with target usersfrom Group 3, being responsible for 20.52% of the varia-tion of the number of followers (Table 4) and 12.71% of themessage-based interactions (Table 5) when the target usersare from this group.9 However, the gender attribute does notseem to have much influence on the other target groups. Thissuggests that the gender of the socialbots can make a differ-ence if the target users are gender-biased, or susceptible tofollow and interact with users of a certain gender.
8. CONCLUDING DISCUSSIONIn this work, we exposed Twitter’s vulnerability against
large-scale socialbot attacks that can affect both Twitter it-self and services built on crowd-sourced data gathered fromTwitter. This problem is a clear adversarial fight, or as usu-ally called, a cat and mouse fight. We put ourselves in themouse’s shoes (i.e., assumed the perspective of socialbot-developers) as an attempt to bring to the research communitya novel perspective to the problem. We analyzed the impor-tance of various attributes in deciding the infiltration per-formance of socialbots, and designed a 2k factorial designexperiment in order to quantify the extent to which differentsocialbot strategies impact their infiltration performance.
We believe that our findings have a number of implica-tions for designers of spam defense mechanisms in OSNs.First, we demonstrated that it is possible to infiltrate Twitterwith simple automated strategies – this calls for better de-fense mechanisms than those that are currently deployed onTwitter. We also show that existing influence metrics suchas Klout are vulnerable to socialbot strategies. Second, ma-licious activities have different nuances in the Twitter plat-form, including Sybil attacks [39], link-farming [13], con-tent pollution [25], content credibility [5], search SPAM [2],phishing [7], and so on. Socialbots may be used to per-form any of these forms of attacks; moreover, their strate-9We found that the users in Group 3 were more likely tofollow and interact with socialbots having female profiles.
11
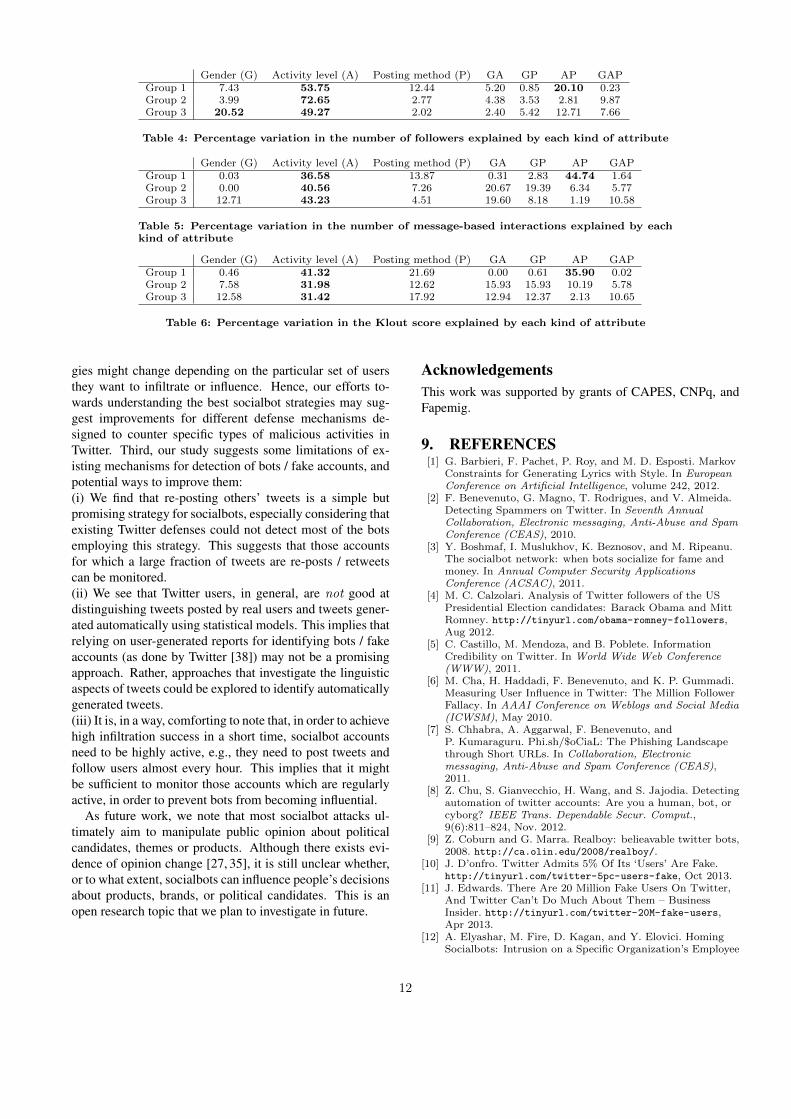
Gender (G) Activity level (A) Posting method (P) GA GP AP GAPGroup 1 7.43 53.75 12.44 5.20 0.85 20.10 0.23Group 2 3.99 72.65 2.77 4.38 3.53 2.81 9.87Group 3 20.52 49.27 2.02 2.40 5.42 12.71 7.66
Table 4: Percentage variation in the number of followers explained by each kind of attribute
Gender (G) Activity level (A) Posting method (P) GA GP AP GAPGroup 1 0.03 36.58 13.87 0.31 2.83 44.74 1.64Group 2 0.00 40.56 7.26 20.67 19.39 6.34 5.77Group 3 12.71 43.23 4.51 19.60 8.18 1.19 10.58
Table 5: Percentage variation in the number of message-based interactions explained by eachkind of attribute
Gender (G) Activity level (A) Posting method (P) GA GP AP GAPGroup 1 0.46 41.32 21.69 0.00 0.61 35.90 0.02Group 2 7.58 31.98 12.62 15.93 15.93 10.19 5.78Group 3 12.58 31.42 17.92 12.94 12.37 2.13 10.65
Table 6: Percentage variation in the Klout score explained by each kind of attribute
gies might change depending on the particular set of usersthey want to infiltrate or influence. Hence, our efforts to-wards understanding the best socialbot strategies may sug-gest improvements for different defense mechanisms de-signed to counter specific types of malicious activities inTwitter. Third, our study suggests some limitations of ex-isting mechanisms for detection of bots / fake accounts, andpotential ways to improve them:(i) We find that re-posting others’ tweets is a simple butpromising strategy for socialbots, especially considering thatexisting Twitter defenses could not detect most of the botsemploying this strategy. This suggests that those accountsfor which a large fraction of tweets are re-posts / retweetscan be monitored.(ii) We see that Twitter users, in general, are not good atdistinguishing tweets posted by real users and tweets gener-ated automatically using statistical models. This implies thatrelying on user-generated reports for identifying bots / fakeaccounts (as done by Twitter [38]) may not be a promisingapproach. Rather, approaches that investigate the linguisticaspects of tweets could be explored to identify automaticallygenerated tweets.(iii) It is, in a way, comforting to note that, in order to achievehigh infiltration success in a short time, socialbot accountsneed to be highly active, e.g., they need to post tweets andfollow users almost every hour. This implies that it mightbe sufficient to monitor those accounts which are regularlyactive, in order to prevent bots from becoming influential.
As future work, we note that most socialbot attacks ul-timately aim to manipulate public opinion about politicalcandidates, themes or products. Although there exists evi-dence of opinion change [27, 35], it is still unclear whether,or to what extent, socialbots can influence people’s decisionsabout products, brands, or political candidates. This is anopen research topic that we plan to investigate in future.
AcknowledgementsThis work was supported by grants of CAPES, CNPq, andFapemig.
9. REFERENCES[1] G. Barbieri, F. Pachet, P. Roy, and M. D. Esposti. Markov
Constraints for Generating Lyrics with Style. In EuropeanConference on Artificial Intelligence, volume 242, 2012.
[2] F. Benevenuto, G. Magno, T. Rodrigues, and V. Almeida.Detecting Spammers on Twitter. In Seventh AnnualCollaboration, Electronic messaging, Anti-Abuse and SpamConference (CEAS), 2010.
[3] Y. Boshmaf, I. Muslukhov, K. Beznosov, and M. Ripeanu.The socialbot network: when bots socialize for fame andmoney. In Annual Computer Security ApplicationsConference (ACSAC), 2011.
[4] M. C. Calzolari. Analysis of Twitter followers of the USPresidential Election candidates: Barack Obama and MittRomney. http://tinyurl.com/obama-romney-followers,Aug 2012.
[5] C. Castillo, M. Mendoza, and B. Poblete. InformationCredibility on Twitter. In World Wide Web Conference(WWW), 2011.
[6] M. Cha, H. Haddadi, F. Benevenuto, and K. P. Gummadi.Measuring User Influence in Twitter: The Million FollowerFallacy. In AAAI Conference on Weblogs and Social Media(ICWSM), May 2010.
[7] S. Chhabra, A. Aggarwal, F. Benevenuto, andP. Kumaraguru. Phi.sh/$oCiaL: The Phishing Landscapethrough Short URLs. In Collaboration, Electronicmessaging, Anti-Abuse and Spam Conference (CEAS),2011.
[8] Z. Chu, S. Gianvecchio, H. Wang, and S. Jajodia. Detectingautomation of twitter accounts: Are you a human, bot, orcyborg? IEEE Trans. Dependable Secur. Comput.,9(6):811–824, Nov. 2012.
[9] Z. Coburn and G. Marra. Realboy: belieavable twitter bots,2008. http://ca.olin.edu/2008/realboy/.
[10] J. D’onfro. Twitter Admits 5% Of Its ‘Users’ Are Fake.http://tinyurl.com/twitter-5pc-users-fake, Oct 2013.
[11] J. Edwards. There Are 20 Million Fake Users On Twitter,And Twitter Can’t Do Much About Them – BusinessInsider. http://tinyurl.com/twitter-20M-fake-users,Apr 2013.
[12] A. Elyashar, M. Fire, D. Kagan, and Y. Elovici. HomingSocialbots: Intrusion on a Specific Organization’s Employee
12
Using Socialbots. In IEEE/ACM Conference on Advancesin Social Networks Analysis and Mining (ASONAM), 2013.
[13] S. Ghosh, B. Viswanath, F. Kooti, N. K. Sharma,G. Korlam, F. Benevenuto, N. Ganguly, and K. P.Gummadi. Understanding and Combating Link Farming inthe Twitter Social Network. In World Wide WebConference (WWW), 2012.
[14] S. Ghosh, M. B. Zafar, P. Bhattacharya, N. Sharma,N. Ganguly, and K. Gummadi. On Sampling the Wisdomof Crowds: Random vs. Expert Sampling of the TwitterStream. In ACM Conference on Information & KnowledgeManagement (CIKM), 2013.
[15] J. Gomide, A. Veloso, W. M. Jr., V. Almeida,F. Benevenuto, F. Ferraz, and M. Teixeira. Denguesurveillance based on a computational model ofspatio-temporal locality of twitter. In ACM Web ScienceConference (WebSci), 2011.
[16] C. Grier, K. Thomas, V. Paxson, and M. Zhang. @spam:The underground on 140 characters or less. In ACMConference on Computer and Communications Security(CCS), 2010.
[17] Z. Gyongyi and H. Garcia-Molina. Link spam alliances. InProceedings of International Conference on Very LargeData Bases (VLDB), 2005.
[18] D. Harris. Can evil data scientists fool us all with theworld’s best spam?http://tinyurl.com/evil-data-scientists, Feb 2013.
[19] P. Heymann, G. Koutrika, and H. Garcia-Molina. Fightingspam on social web sites: a survey of approaches and futurechallenges. IEEE Internet Computing, 11:36–45, 2007.
[20] R. Jain. The Art of Computer Systems PerformanceAnalysis: Techniques for Experimental Design,Measurement, Simulation, and Modeling. John Wiley andSons, INC, 1991.
[21] D. Jurafsky and J. H. Martin. Speech and LanguageProcessing: An Introduction to Natural LanguageProcessing, Computational Linguistics, and SpeechRecognition. Prentice Hall PTR, Upper Saddle River, NJ,USA, 1st edition, 2000.
[22] Klout — The Standard for Influence. http://klout.com/.[23] Klout – Wikipedia. http://en.wikipedia.org/wiki/Klout.[24] E. Kouloumpis, T. Wilson, and J. Moore. Twitter
Sentiment Analysis: The Good, the Bad and the OMG! InInt’l Conference on Weblogs and Social Media (ICWSM),2011.
[25] K. Lee, B. D. Eoff, and J. Caverlee. Seven months with thedevils: A long-term study of content polluters on twitter.In Int’l Conference on Weblogs and Social Media(ICWSM), 2011.
[26] J. Messias, L. Schmidt, R. Rabelo, and F. Benevenuto. Youfollowed my bot! Transforming robots into influential usersin Twitter. First Monday, 18(7), July 2013.
[27] L. Muchnik, S. Aral, and S. J. Taylor. Social Influence Bias:A Randomized Experiment. Science, 341(6146):647–651,Aug 2013.
[28] M. Orcutt. Twitter mischief plagues mexico’s election.http://www.technologyreview.com/news/428286/twitter-mischief-plagues-mexicos-election/, June 2012.
[29] A. Pitsillidis, K. Levchenko, C. Kreibich, C. Kanich, G. M.Voelker, V. Paxson, N. Weaver, and S. Savage. BotnetJudo: Fighting Spam with Itself. In Symposium onNetwork and Distributed System Security (NDSS), 2010.
[30] E. Protalinski. Twitter sees 218M monthly active users,163.5M monthly mobile users, 100M daily users, and 500Mtweets per day.http://tinyurl.com/twitter-stats-oct13, Oct 2013.
[31] J. Ratkiewicz, M. Conover, M. Meiss, B. Goncalves,S. Patil, A. Flammini, and F. Menczer. Truthy: Mappingthe spread of astroturf in microblog streams. In WorldWide Web Conference (WWW), 2011.
[32] T. Sakaki, M. Okazaki, and Y. Matsuo. Earthquake shakestwitter users: Real-time event detection by social sensors.In World Wide Web Conference (WWW), 2010.
[33] B. Stone-Gross, T. Holz, G. Stringhini, and G. Vigna. TheUnderground Economy of Spam: A Botmaster’sPerspective of Coordinating Large-scale Spam Campaigns.In USENIX Conference on Large-scale Exploits andEmergent Threats (LEET), pages 4–4, 2011.
[34] K. Thomas, D. McCoy, C. Grier, A. Kolcz, and V. Paxson.Trafficking Fraudulent Accounts: The Role of theUnderground Market in Twitter Spam and Abuse. InUsenix Security Symposium, 2013.
[35] C. Timberg. Research in india suggests google searchresults can influence an election.http://tinyurl.com/search-influence-election, 2013.
[36] A. Tumasjan, T. O. Sprenger, P. G. Sandner, and I. M.Welpe. Predicting elections with Twitter: What 140characters reveal about political sentiment. In Int’lConference on Weblogs and Social Media (ICWSM), 2010.
[37] 46% of Twitter users have less than 100 followers -Simplify360. http://simplify360.com/blog/46-of-twitter-users-have-less-than-100-followers/.
[38] Shutting down spammers, Apr 2012. https://blog.twitter.com/2012/shutting-down-spammers.
[39] B. Viswanath, A. Post, K. P. Gummadi, and A. Mislove.An analysis of social network-based sybil defenses.SIGCOMM Comput. Commun. Rev., 41(4):–, Aug. 2010.
[40] C. Wagner, V. Liao, P. Pirolli, L. Nelson, andM. Strohmaier. It’s not in their tweets: modeling topicalexpertise of Twitter users. In AASE/IEEE InternationalConference on Social Computing (SocialCom), 2012.
[41] C. Wagner, S. Mitter, C. Korner, and M. Strohmaier.When social bots attack: Modeling susceptibility of users inonline social networks. In 2nd workshop on Making Senseof Microposts at WWW ’12, 2012.
[42] R. Wald, T. M. Khoshgoftaar, A. Napolitano, andC. Sumner. Which Users Reply to and Interact withTwitter Social Bots? In IEEE Conference on Tools withArtificial Intelligence (ICTAI), Nov 2013.
[43] Web Ecology Project.http://www.webecologyproject.org/.
[44] J. D. M. William R. Avison and B. A. P. (Eds.). MentalHealth, Social Mirror. Springer, 2007.
[45] C. M. Zhang and V. Paxson. Detecting and analyzingautomated activity on twitter. In International Conferenceon Passive and Active Measurement (PAM), 2011.
13