revenue mobilization in local government units: the … · the local government code ... government...
TRANSCRIPT

For comments, suggestions or further inquiries please contact:
Philippine Institute for Development Studies
The PIDS Discussion Paper Seriesconstitutes studies that are preliminary andsubject to further revisions. They are be-ing circulated in a limited number of cop-ies only for purposes of soliciting com-ments and suggestions for further refine-ments. The studies under the Series areunedited and unreviewed.
The views and opinions expressedare those of the author(s) and do not neces-sarily reflect those of the Institute.
Not for quotation without permissionfrom the author(s) and the Institute.
The Research Information Staff, Philippine Institute for Development Studies3rd Floor, NEDA sa Makati Building, 106 Amorsolo Street, Legaspi Village, Makati City, PhilippinesTel Nos: 8924059 and 8935705; Fax No: 8939589; E-mail: [email protected]
Or visit our website at http://www.pids.gov.ph
Revenue Mobilization in LocalGovernment Units: The Early Years of Local
Government Code Implementation
DISCUSSION PAPER SERIES NO. 95-02
Rosario G. Manasan
May 1995

SecondRevifion
6-4-95
REVENUE MOBILIZATION IN LOCAL GOVERNMENT UNITS:THE EARLY YEARS OF LOCAL GOVEKNMENT CODE IMPLEMENTATION
Rosario G. Manasan
1. INTRODUCTION
Revenue mobilization at the local government level is a function of a myriad of factors,some of which are outside the range of control of local government units (LGUs). Given thelevel of LGU tax administration capability, policy makers can essentiaily work with twovariables, namely the tax base 03) and the tax rate (t), to influence the amount of revenue theycollect. Overall the tax base is determined by changes in the level of economic activity whichmay conceptually be divided into changes in population, incomes and prices. These factors arelargely outside the influence of local governments. At the same time, the tax base is alsodetermined by the relation between the economic base and the statutory tax base. LGUs are ableto exert some control on their tax base to the extent that they are able to select the appropriatemix of taxes, i.e., one that optimizes the potential revenue from the economic base at theirdisposai. Even here, their flexibility may be impaired by central government limitations on thekind of taxes they may impose. Similarly, the statutory tax rate is usually set by the localgovernment units (LGUs) themselves within the parameters established by the centralgovernment. Needless to say, the success of LGU officials in using these tax handles to increaselocal revenue is dependent on LGU tax administration practices which determines the collectionrate, i.e., the proportion of the actual tax collection to the legal tax liability. However, taxcollection efficiency may likewise be influenced by the level and structure of intergovernmentaltransfers.
The objective of this paper is to review and analyze the revenue performance of localgovernment units (LGUs) between 1981 and 1993 looking at the various factors described above.First, the study reviews the changing legal framework that governs local taxation (Section 2).Second, it documents the trend and pattern of local government income (Section 3). Third, itprovides estimates of various measures of revenue performance: buoyancy of local sourcerevenue (total as well as its components), collection rate, tax intensity (per capita tax revenue)in Section 4. That section also focuses on the determinants of these various measures of
performance. Section 5 attempts to determine the relative importance of expanding the taxingpowers of LGUs (i.e., increasing local taxable capacity) and improved local tax administration(i.e., tax effort) in increasing LGU revenue. Section 6 reviews the existing problems in LGUtax administration and suggests ways of improving them. Finally, Section 7 evaluates LGUs'experience in managing local public enterprises.

2. LEGAL FRAMEWORK
This Section focuses in greater detail on the changing policy regime that defines therevenue structure of local governments for the period under study.
To a large extent, various types of taxes are assigned exclusively to different levels ofgovernments. However, there are instances where different levels of governments areempowered to impose the same type of tax.
The central government levies and collects most of the more revenue productive type oftaxes. Tariffs on imports, the value added tax (VAT), tax on incomes of individuals andcorporations, excise taxes on alcoholic, tobacco and petroleum products, taxes on the grossreceipt, of transportation contractors and common carriers, taxes on estates, inheritance, andgifts, and the documentary stamp tax are absolutely restricted for centa-al government use. Inaddition, the central government also imposes taxes like the franchise tax that LGUs maythemselves levy.
On the other hand, the bulk of local government taxes are derived from the real propertytax (RPT) and the local business tax (LBT) although there is a plethora of other taxes and feesthat LGUs are authorized to levy. The base of each of these taxes is defined by centrallegislation which also sets limits (floors and/or ceilings) on the tax rates that LGUs may impose.The Local Government Code (the Code or LGC) of 1991 expanded the tax base of LGUs toinclude activities, and sectors (income of banks and financial institutions, agricultural productsexcept when sold by marginal farmers and fishermen, forest concessions and forest product whensold domestically by the concessionaire himself, and mining operations and mineral productswhen sold domestically by the operator) that used to be outside the reach of local taxation. Atthe same time, the Code increased the maximum allowable rates for most local taxes. However,to a large extent, the taxing powers of LGUs remained circumscribed by central legislation.
2.1. Real Property Tax
Basic Rate
The real property tax is reserved solely for local governments. Under the 1991 LGC,provinces may tax real property at a basic rate that is not greater than 1 percent of its assessedvalue while cities and Metro Manila (MM) municipalities may impose a tax not greater than 2percent. In contrast, prior to the enactment of the 1991, Presidential Decree (PD) 4641authorized provinces and their constituent municipalities to separately tax real property at ratesnot exceeding 1/2 of 1 percent. PD 464 likewise allowed cities to levy RPT at rates not higherthan 2 percent and not lower than 1/2 of 1 percent. Thus, the LGC did not increase the ceilings
1pD 464 or the Real Property Code of 1974 codified all provisions related to LGU real property taxation and was
in force until the enact.meat of the 1991 LGC.
2

on the basic RPT ram that were originally set by PD 464. However, the Code abolished thefloor rates for the basic RPT. Since most LGUs, with the exception of a number of cities, have
already adopted the maximum allowable rate for basic RPT even before the enactment of theCode, it is expected that, if LGUs do decide to change the rate of imposition of the basic RPT,the adjustments in the basic RPT rate would be in the downward direction.
Special Levy on Real Property: Special Education Fund
The 1991 LGC allows provinces, cities and Metro Manila municipalities to levy andcollect an annual tax equal to 1 percent of the assessed value of real property on top of the basicreal l_'operty tax. The proceeds of this imposition accrue exclusively to the Special EducationFund (SEF). In contrast, PD 464, by itself, imposed an additional 1 percent tax on real propertyto accrue to the SEF. This implies that the SEF imposition under PD 464 was a centralgovernment tax. In contrast, under the 1991 LGC, the additional levy on real property for theSEF is a purely local tax.
Sharing of Proceeds
Under the new Code, 35 percent of the proceeds of the basic RPT imposed by theprovince goes to the province itself, 40 percent to the municipality and 25 percent to thebarangay where the property is located. On the other hand, 70 percent of the RPT levied by thecity remains with the city while the remaining 30 percent goes to all barangays in the city (with50 percent of the total barangay share allotted to the barangay where the property is located andthe remaining 50 percent being shared by all the barangays in the city on an equal basis). Incontrast, under PD 464, 45 percent of the proceeds of the combined provincial/municipal RPTaccrues to the province, 45 percent to the municipality and 10 percent to the barangay where theproperty is located while 90 percent of the proceeds of the RPT imposed by the city accrues tothe city itself and 10 percent to the barangay where the property is situated (Table 1).
Under the 1991 LGC, the proceeds of the provincial SEF imposition is divided equallybetween the provincial and the municipal school boards while the entire proceeds of the cities'SEF levy goes to the city school board. On the other hand, PD 464 decreed that 55 percent ofSEF tax collected in provinces accrue to the municipalities where the property is located, 25 %to the province and 20 percent to the National Treasury while 80 percent of the cities' and MMmunicipalities' SEF collections were retained by these LGUs and the remaining 20 percent wereremitted to the National Treasury (Table 1).
Other things being equal, the changes in the sharing formula of the proceeds of the RPTresult in a small increase in the RPT revenue of provinces and barangays and some decline inthat of cities and municipalities (Manasan 1992).
3

Assessment Levels
The taxable base of the RPT is the assessed value of the real property. In turn, the
assessed value is computed as the product of the fair market value (as determined by theschedule of fair market values for RPT purposes) and the assessment level. The 1991 LGCprovides that the assessment levels in any particular LGU should be legislated by its localsanggunian and should not exceed rates prescribed therein. In contrast, PD 464 by itself fixedthe assessment levels for different kinds and classes of real properties (i.e., no local ordinancewas necessary to effect the assessment levels).
In the case of lands, the; maximum assessment levels established under the 1991 LGC isas follows: 20 percent for residential lands, 40 percent for agricultural lands, 50 percent forcommercial, industrial or mineral lands and 20 percent for timberlands. In comparison, PD 464fixed the assessment levels for land at rates equal to the ceiling rates allowed in the 1991 LGCwith the exception of residential land which was then assessed at 30 percent. Note that thetimberland category was non-existent under PD 464 (Table 2).
Relative to PD 464, the 1991 LGC cuts down the assessment level on agriculturalmachinery from a fixed rate of 60 percent to a maximum rate of 40 percent and that onresidential machinery from a.fixed rate of 70 percent to a maximum rate of 50 percent.Similarly, the assessment level on commercial and industrial machinery is reduced from a fixedrate of 80 percent to a maximum rate of 80 percent (Table 2).
Like PD 464, the 1991 LGC mandates that the assessment levels for buildings and other
improvements follow a graduated schedule applicable to different brackets of fair market values.Compared to PD 464, the Code effectively reduced the assessment levels for residentialbuildings from a schedule in the 15 to 80 percent range to one in the 0 to 60 percent range atthe maximum; from a schedule in the 40-80 percent range to one in the 25-50 percent range atthe maximum for agricultural buildings; and from a schedule in the 50-80 percent range to onein the 30-80 percent range at the maximum for commercial/industrial buildings (Table 2). 2
Manasan (1992) simulated the impact of the change in the assessment levels on the yieldof RPT for a sample province, city and municipality. The results show that the change in theassessment levels, ceteris paribus, will result in a substantial diminution (approximately 20percent decrease) in total RPT revenue (Table 3). The reduction in RPT in any particular LGUwill depend on the relative weight of the various classes of land, buildings, other improvementsand machinery in the total taxable assessed value of real properties in its jurisdiction. Needlessto say, the potential reduction in the RPT tax liability will tend to be mitigated by the revisionin the schedule of fair market values scheduled to take effect in 1994.
2Note that under the new Code residential buildings with fair market value below P175,000 are effectively exemptedfrom the RPT because they are subject to zero assessment level.

PD 464 mandated a general revision of the schedule of fair market values of real propertyevery three years. The schedule is prepared by local assessors and reviewed by the Departmentof Finance. The 1991 LGC likev_iseprovides for triennial revision in the schedule of value butthe review function is transferred to the Local Sanggunians who are required to legislate the newschedule. Many analysts have pointed out that this shift tends to politicize property assessmentmore than ever before.
2.2. Local Business Tax (LBT)
Under the 1991 LGC, municipalities and cities may levy and collect a tax on businesseson the basis of their gross receipts/sales at rates prescribed according to a graduated schedule. 3Different schedules are applicable to (1) manufacturers, assemblers, repackers and processorsof all goods not otherwise classified as essential commcuities including brewers, distillers andrectifiers of liquors, distilled spirits and wines; (2) wholesalers and dealers; (3) exporters andproducers/wholesalers/retailers of essential commodities; (4) all other retailers; and (5)contractors. The provisions of PD 231 (Local T_ Code of 1973) on the local business tax weresimilar to those outlined above but the rates prescribed therein were maximum allowable rateswith the ceilings differentiated according to the income class of a given municipality (Table 4).Moreover, the rates were lower than those under the LGC. Also, the top brackets (of grossreceipts) were subject to unit rates rather than ad valorem rates. Moreover, the gross receiptsof banks and financial institutions were then not subject to tax while under the new Code thesame may be taxed at an ad valorem rate not exceeding 1/2 of 1 percent.
The increase in the local business tax rates implied by the 1991 LGC varies dependingon the commodity/activity being taxed and the subject estabIishment's gross receipts bracket.For instance, under the new Code, the tax rate on manufacturers for the domestic market withgross receipts less than P6.5 million is 10 percent higher relative to the maximum allowable rateunder PD 231 while the LBT on manufacturers with gross receipts of P10 million went up by25 percent. Similarly, the LBT rate on wholesalers/dealers with gross receipts less than P1million rose by 10 percent while the rate applicable to those with gross receipts of P3 millionjumped by 50 percent (Table 4).
The impact of increasing the LBT rate on potential LBT revenue of municipalities andcities will depend on the relative importance of various taxable activities in their LBT base.Assuming that local sanggunians pass new revenue ordinances adopting the higher LBT ratesallowed under the Code, the projected rate of increase in LBT revenue in poor agriculturalmunicipalities is 65 percent while that in urban municipalities is 35 percent (Table 5). Thisexample shows that rural/agricultural municipalities are better able to augment their LBTrevenue in proportional terms via rate increases. However, note that their tax base might be so
3With the exception of the top bracket, all the brackets of each schedule are subject to fixed unitrates. The top bracket, however, is subject to a maximum allowable ad valorem rate. The toprate of the different rate schedules never exceeds 1 percent.
5

small that even if the proportional change is large, the absolute change in LBT revenue may notbe significant.
It is also important to emphasize that the base of the LBT is essentially more mobile thanthose other types of taxes. This suggests that raising the tax rates beyond a certain level mightbe counterproductive as supply side effects begin to bite. Finally, the LBT is one area wheremacro-micro tension is strong. The taxes with significant rates of increase in the maximumallowable rates of imposition are those that are undesirable from the point of view of overalleconomic efficiency. One example is the tax on the gross receipts of exporters. Still anotherexample is the gross receipts tax on banks. Note also that the tax on the gross receipts ofmanufacturers and wholesalers is a turnover tax that counteracts the efficiency gains from theintroduction of the VAT at the national level.
In the medium term, the assignment of taxing authorities to various levels of governmentmust be reviewed. At this point, existing theoretical guidance on tax assignments suggest thatresidence-based taxes like taxes on retail sales and taxes on immobile factors like real property
are appropriate for local taxation. The taxation of business income by local governments is notan efficient tax because businesses are highly mobile. Moreover, such a tax tends to becounterproductive because it encourages tax competition among LGUs.
2,3. Other Taxes, Charges and Fees
Provinces are empowered to impose a tax on the transfer of ownership of real property,on franchises, on the business of printing or publication, on sand and gravel extraction, onprofessionals, on amusement places and on delivery vans. Under the 1991 LGC, provinces areauthorized to levy a transfer tax at a rate not exceeding 1/2 of 1 percent of the totalconsideration involved in the transaction or the fair market value whichever is higher. This rate
is double the ceiling rate provided in PD 231. Moreover, the statutory tax base in PD 231(which was equal to either the actual monetary consideration involved in the transaction or theassessed value of the real property) is smaller.
The maximum allowable rate for the sand and gravel tax was increased from P0.75 percubic meter of material extracted to 10 percent of its fair market value. The 1991 LGC alsoincreased the rate of imposition of the professional tax from P50/P75 to P300 per year.However, the new Code limits the definition of professional for purposes of coUecting this taxto individuals who practice profession requiring government examinations.
The 1991 LGC provides that provinces may levy art amusement tax not exceeding 30percent of the admission price from a two-tiered (ceiling) rate of 20 percent when the admissionprice is P1 or less and 30 percent when the admission price is greater than P1. Similarly, thetax on delivery vans was increased from a maximum of P50/P75 to P500. However, the taxrates on the printing and publications and franchises was maintained at 1/2 of 1 percent of grossreceipts.
6

The new Code also authorized all LGUs to impose reasonable fees and charges forservices rendered in contrast to PD 231 which stipulated the amount of fees they may collect(ranging from P1 to P100 per afinum) for specified services. Finally, the Code changed thesharing formula governing these taxes and fees.
The substantial rate increase applicable to most other local taxes (other than the RPT andthe LBT) can have significant impact on LGU revenue depending on the share of these taxes inthe aggregate of locally generated income. Assuming LGUs adopt the higher rates allowedunder the 1991 LGC, revenue from the transfer tax may increase by 300 to 700 percentdepending on the kind and class of property being transferred. Revenue from the sand and
gravel tax may increase by some 400 percent. Those from professional tax may increase by 300to 500 percent while those from delivery van tax may rise by 650 to 900 percent. Thecommunity tax revenue may go up by 400 percent. Table 6 show that the revenue from othertaxes, fees and charges of our sample urban province may increase by 103 percent, those of oursample rural province by 31 percent, those of our urban municipality by 374 percent and thoseof our sample rural municipality by 223 percent if the rate increases authorized by the Codewere legislated by local sanggunians. These results highlight the tendency of the provisions ofthe Code on other taxes, fees and charges to favor municipalities relative to provinces and tofavor LGUs with more developed economies relative to those which are less urbanized and/orindustrialized.
2,4. Summing Up
The analysis above indicates that the tax provisions of the 1991 LGC do not guaranteesubstantial increases in the revenue LGUs generate from local sources. The overall impact ofthe various provisions of the 1991 LGC on LGUs' local source revenue will depend on (1)changes in the statutory rates; (2) changes in the legal tax base; (3) changes in the sharingformula; (4) the extent to which LGUs exercise their taxing powers; (5) the composition of thetax base of LGUs; and the buoyancy of their tax bases. Table 7 shows that if LGUs adopt themaximum allowable RPT/LBT rates and assessment levels together with a 50 percent increasein their schedule of fair market values, then total local revenue (exclusive of SEF) of our urban(rural) province is projected to grow by 10 percent (16 percent) and that of our sample urban(rural) municipality by 38 percent (57 percent). Note that the increase in the total local sourcerevenue net of SEF of our sample urban province is just equal to the 10 percent inflation rateassumed in these simulations while the growth in local source revenue of our sample ruralprovince is just equal to the average trend growth rate of 15 percent. However, the projectedincrease in local source revenue of municipalities is quite substantial.
Thus, our results indicate wide variation in the possible effects of the 1991 LGC on thefinancial position of specific LGUs. It.must be stressed that while the Code broadens the taxingpowers of LGUs, it is simply an enabling act. In the final analysis, local sanggunians will haveto decide what taxes to impose and at what rates. Furthermore, local sanggunians must decideon the changes in the schedule of fair market values of real properties.
7

The business sector, particularly the Philippine Chamber of Commerce and Industry, hasraised the specter of "exorbitant" LGU taxes under the 1991 Local Government Code. While
it is true that a good number of LGUs passed new tax ordinances that failed to comply with themandatory procedural requirements (like posting or publication of proposed ordinance, writtennotices of public hearings) under the law, it is not clear that the tax rates adopted by LGUs aregenerally high. For one, the maximum allowable tax rate on RPT and the local business tax arenot high by international standards. For instance, Dillinger pointed out that the Philippine RPTrate is low compared to that of other countries if one takes into account the low assessment
levels set by PD 464. Note that the 1991 Code generally reduced the assessment levels so thatour effective RPT rate was cut down further. At the same time, the maximum allowable rate
for the local business tax is 1 percent of g_'oss receipts for retail establishments and less than 1percent for other types of establishments. These rates are not high when compared to the 2percent turnover tax imposed by the cent.,_l government on small establishments. At the sametime, the Rapid Field Appraisal conducted by the LDAP in I993 covering all regions nationwideindicated that on the whole LGUs have been rather restrained in passing new tax ordinances thannews reports suggest. Many local officials are concerned about the negative impact of high taxrates on their popularity. While it is true that some LGUs, many of them in urban areas, havetried to impose the ceiling rates, counter-examples also exist (e.g., Quezon City, for one). Thisis not to deny the sector-specific issues discussed earlier. Also, certain ambiguities in the Codeneed clarification in order to avoid unnecessary tension between the business sector and LGUs.An example is the imposition of the higher rates on contractors rather than the rates applicableto exporters on export-oriented electronics, semi-conductor and garments sub-contractors.
3. TREND AND PATTERN OF LGU INCOME,
Public sector finance in recent Philippine history is largely concentrated at the center withlocal governments accounting for 5.8 percent of general government 4 revenue from 1981-t991(Table 8). Contrary to initial expectations, the share of LGUs in total general governmentrevenue declined to 5.4 percent in 1992-1993, the early years fo Code implementation. Thisoccurred even as the revenue effort (i.e., the ratio of locally generated revenue to GN-P) of localgovernments in the aggregate increased from 0.8 percent to 1.0 percent of GNP.
Total LGU receipts/income (equal to 1.7 percent of GN'P on the average) isapproximately double the level of total LGU local source revenue in 1981-1991 (Table 9.a).This is so because locally sourced and externally sourced revenue are roughly equal to eachother during that period. However, the share of LGU income from external sources (largelyderived from the internal revenue allotment or IRA and other inter-governmental transfers)increased markedly from an average of 49.3 percent in 1981-1991 to 59.9 percent in 1992-1993(Table 9.b). This came about because LGU external source income was growing faster thanLGU local source income. Thus, relative to GNP, LGU income from external sources doubledfrom 0.8 percent of GNP in 1981-1991 to 1.5 percent of GNP in 1992-1993 while LGU local
4General government is comprised of the central government and LGUs_
source income increased slightly from 0.8 percent to 1.0 percent of GNP (Table 9.a).Similarly, while real per capita LGU esternal source income rose by 85.7 percennt from anaverage of P95 in 1981-1991 to and average of P168 in 1992-1993, real per capita LGU localsource income increased by only 16.5 percent from P67 to P113 (Table 9.c).
There is some variation in the importance of externally sourced income in the totalincome of different levels of local governments. Provinces were largely dependent on non-localsources which comprised 64.0 percent of their total income in 1981-1991. On the other hand,externally sourced income contributed 49.1 percent of the total income of municipalities and 37.8percent of the total income of cities in the same period (Table 9..b). In all cases, thecontribution of externally sourced income to the total receipts of LGUs was magnified in 1992-1993 to 73.8 percent for provinces, 56.9 percent for municipalities, and 53.9 percent for cities.Moreover, the share of the IRA alone ir_total LGU income rose from 42.3 percent in 1991 to72.6 percent in 1993 in the case of provinces, from 35.3 percent to 48.6 percent in the case ofcities, and from 41.7 percent to 51.6 percent in the case of municipalities. At the same time,real per capita IRA of provinces more than doubied from P30 in 1991 to P72 in 1993, while thatof cities rose from P119 to P264 and that of municipalities from P48 to P91 (Table 9.c).
The tax effort of all LGUs in the aggregate increased somewhat from 0.58 percent ofGNP in 1981-1991 to 0.73 percent in 1992-1993 (Table 9.a). Tax revenue as a proportion oflocally generated LGU income was 68.4 percent in 1981-1991 and expanded to 73.3 percent in1992-1993 (Table 10).
Focusing on the different levels of local governments, the share of taxes in locallygenerated revenue has been consistently highest in cities and lowest in provinces in 1981-1993;Thus, taxes contributed 74.4 percent of all local source revenue of cities, 69.4 percent of thatof municipalities, and 57.2 percent of that of provinces during the period (Table 10). Likewise,provinces have the lowest tax to GNP ratio at 0.09 percent, compared to the 0.23 percent ofmunicipalities and 0.28 percent of cities (Table 9.a).
The real property tax is the single major source of locally generated LGU revenue,contributing 40.9 percent of local source I,,GU iniomein 1:981-t993. However, its importancewas weakened dffring the period, with its share in total LGU local source income dropping from41.9 percent in 1981-1991 to 35.4 percent in 1992-1993 (Table 10). This trend is mirrored inthe declining share of RPT revenue in total locally generated income of cities (from 42.3 percentto 36.9 percent) and municipalities (from 39.9 percent to 30.5 percent). The ratio of RPTrevenue to local source revenue of provinces in provinces increased slightly from 45.4 percentto 46.7 percent.
On the other hand, thereal property tax revenue to GNP ratio of all LGUs deterioratedalmost imperceptibly from 0.35 percent of GNP in 1981-1991 to 0.34 percent in 1992-1993(Table 9.a). The ratio of RPT r-_:venueto GNP declined in cities (from 0.16 percent to 0.14percent), was stable at 0.07 percent in provinces and increased (from 0.12 percent to 0.13percent) in municipalities.

Meanwhile, revenue from other (or non-property) local taxes rose relative to total locallygenerated LGU revenue (from 26.5 percent in 1981-1991 to 37.9 percent in 1992-1993) andrelative to GNP (from 0.22 percent to 0.39 percent of GNP). Also, non-property taxesaccounted for an increasing share of local source income in all levels of local government:provinces (from 11.3 percent to 13.0 percent), cities (from 31.5 percent to 40.6 percent) andmunicipalities (from 26.7 percent to 43.8 percent).
In contrast, operating, service and miscellaneous revenue of all LGUs shrank from 30.2percent of total local source LGU income (or 0.25 percent of GNP) 1981-1991 to 25.2 percentof total local source LGU income (or 0.24 percent of GNP) in 1992-1993. A similar trend isalso observed for all levels of local government (Table 9.a and Table 10).
4. Measures of LGU Revenue Performance and its Determii_unts
4.1 Revenue Buoyancy
Because governments have to address the mounting demand for public services that isbrought about by growing populations, rising prices and increasing incomes, the automaticgrowth of LGU revenue in response to expanding economic base is generally deemed desirable.The buoyancy/elasticity coefficient (defined as the percentage change in revenue to percentagechange in income or tax base) measures the responsiveness of government revenue to changesin income or tax base. 5
Table I1 presents the buoyancy coefficients of the major sources of locally generatedLGU revenue. Local source income of all LGUs in the aggregate is mildly inelastic in theperiod 1983-1991 with a buoyancy coefficient of 0.97. The buoyancy coefficient of locallygenerated income of municipalities is lowest at 0.88 while that of cities is highest at 1.05.
The inelastic revenue structure of LGUs in 1983-1991 is largely traced to the inelasticityof the dominant revenue source: the real property tax. The elasticity of RPT revenue withrespect to GNP of 0.88 for all LGUs during this period indicates that the real property tax didnot keep pace with GNP growth.
Disaggregating the buoyancy estimate into its components show that the real propertyrevaluation problem is the principal culprit in the poor performance of RPT. The elasticity ofthe assessed value of real property with respect to GNP (i.e., the base buoyance of RPT) is lessthan unity (0.72) in 1983-1991. This may be attributed to the numerous delays in implementing
5Techaically, a buoyancy coefficient makes no distinction between changes in revenues due to discretionary changes
in tax policy (e.g., an increase in the tax rate, a broadening of the statutory tax base) and changes due to growth in
economic activity. In contrast, tax elasfi_;?ty refers only to revenue changes brought about by economically-inducedchanges ia the tax base. Empirically in the case of the Philippines, it is difficult to segregate discretionary from non-discretionary changes in revenues. Thus, this paper makes use of buoyancy estimates only and henceforth uses the twoterms interchange.ably.
10

the general revisions in the schedule of fair market value of real property during the 1980s. Theproblem was probably even worse than what the numbers suggest considering that an increasingnumber of LGUs have been tax "mapped during the period which should have resulted in anexpansion in the level of assessed value with the discovery of erstwhile unregistered propertiesand the gathering of more accurate information on the physical attributes of properties.
It should be pointed out that undervaluation of real property for RPT tax purposes isprevalent nationwide. Dillinger (1988) estimated the ratio of tax liability to fair market valueon urban land at 0.75 percent and the ratio of tax liability to current market value at 0.15percent, implying a true market value to fair market value ratio of 5. On the other hand, the
•results of Tan (1993) confirm the findings from key informant interviews (Manasan 1992) thatthe ratio of the "true" market value to the fair market value in the assessor's schedule vary from
3 tc 5 (Table 12). If the degree of undervaluation remains unchanged over time, the base.elasticity of RPT will also not change. Conversely, changes in the ratio of fair market value totrue market value will be translated to changes in the base elasticity. Thus, the overall buoyancyof the RPT may be boosted by reducing the wedge between these two measures of market value.
On the other hand, the buoyancy of RPT revenue of all LGUs in the aggregate withrespect to assessed value is equal to 1.22 in 1983-1991. Since there were no changes in the taxrate as well as in the assessment ratios during the period, this measure reflects improvementsin collection efficiency. It should be pointed out that while the collection rate was increasingduring this period it remained at a low level suggesting the potential for future improvements(Table 13).
At the same time, non-property tax revenue is inelastic with respect to GNP with abuoyancy estimate of 0.91 in 1983-1991. Note that the base of non-property taxes (non-agriculture GVA) has not quite kept abreast with the growth in GNP. Also, the specific characteras well as the regressive rat_ structure of non-property taxes makes it inelastic reltive to its base.
There were also significant variations across the different levels of local government inthis regard. The buoyancy coefficients of cities' non-property taxes with respect to GNP andwith respect to non-agricultural GVA are both greater than unity in 1983-1991. However, thecorresponding coefficients for provinces and municipalities are below unity. These resultsindicate that there were improvements in the collection rate of cities while there was none forthat of provinces and municipalities.
In contrast, non-tax revenue is elastic with respect to GNP for all LGUs in the aggregatein 1983-1991 with a buoyancy coefficient of 1.01. However, non-tax revenue does not accountfor a large enough portion of total local source LGU income nor is the positive relationshipbetween non-tax revenue growth and GNP growth strong enough to offset the opposite trend inRPT and non-property tax revenue during the period.
Again, differences across levels of local governments were observed. The buoyancyestimates of non-tax revenue with respect to GNP in cities and provinces are greater than unity
11

while that of municipalities is less than unity. This implies that the former has taken advantageof their authority to increase user charges in line with inflation while the latter failed to do soduring the period.
Looking more closely at the developments in 1992-1993, the extremely low growth inlocally generated LGU revenue in 1992, the first year of Code imPlementation, and theconsequent decline to 0.5 of the buoyancy coefficient for all local source revenue is ratheralarming ('Table 11). Note also that the overall buoyancy coefficient of RPT plummeted to 0.05in 1992 largely because of the decline in the collection rate (Table 13). In contrast to thesituation in 1983-1991, the assessed value of real property grew at a faster rate than GNP in1992. As a result, the base buoyancy (or the elasticity of assessed value with respect to GNP)stood at 1.64 in that year. This was largely due to the revaluation of the schedule of fair marketvalue which was implemented in a phased program during the eazly 1990s.
The negative buoyancy of RPT revenue with respect to GNP in cities and municipalitiesin I992 may be explained by the reduced share of these levels of governments in the proceedsof the RPT under the 1991 LGC. This is further exacerbated by the worsening collectionefficiency of these levels of government. Conversely, the increased share of provinces in theproceeds from RPT explains the rise in its buoyancy coefficient despite the decline in theircollection rate in 1992.
At the same time, the buoyancy coefficient of non-tax revenue turned negative in 1992.Thus, the tripling of the buoyancy coefficient of non-property taxes was not enough to counteract.these two opposing forces.
In contrast, the buoyancy coefficients of all the major sources of local source income ofLGUs improved dramatically in 1993 relative to 1992. Thusl if one looks at the the period1992-1993, the buoyancy coefficient for all major types of local source revenue went upsignificantly with the exception of non-tax revenue of provinces. One can only speculate thattis is directly linked to the widespread adoption of higher local tax rates (as permitted by the1991 LGC) in that year.
The analysis above shows wild gyrations in the buoyancy coefficients of local sourcerevenue of LGUs in 1992-1993. There was a sharp decline in the elasticity of locally generatedrevenue in 1992. However, LGU revenue performance rebounded dramatically in 1993.Clearly, LGU behavior in the area of local taxation has been unsettled by the 1991 LGC. Atthis point, it is not clear that it has reached an equilibrium yet. The fluctuations we observedin LGU revenue mobilization in the early years of Code implementation seem to suggest thatLGUs are experimenting with the various alternative options of organizing and operating in thisarea, thus, calling for close monitoring in the coming years.
12

4.2. Determinants of LGU Revenue Performance
Stimulative Effect of IRA
The issue of whether intergovernmental grants/transfers stimulate or substitute for localgovernment revenue effort has nagged many analysts over the years (World Bank 1992). Onthe one hand, there has been some concern that central government transfers to LGUs maysubstitute for locally generated revenue when the allocation formula for grants does not explicitlytake the level of LGU revenue performance into account and when grant levels are substantial.On the other hand, other analysts argue that intergovernmental grants may allow LGUs to breachthe threshold income that is associated with the provision of more and higher quality services.In this case, higher allotments may encourage LGUs to generate more revenues locally tocomplement what they .receive from the center.
To investigate this question in more systematic fashion, the study used three measuresof LGU revenue performance: the RPT collection rate and per capita locally generated revenue.The analysis is carried out for various levels of governments. Furthermore, three years (1985,1990, 1992 and 1993) were considered to be able to discern whether the changing policyenvironment with regards to the central government transfers to LGUs has a significant impacton LGU revenue effort. The year 1992 is an important year because it is the first year ofimplementation of the 1991 LGC with its higher mandated IRA levels. Moreover, all LGUswere net gainers in that year since the devolution of functions and responsibilities from nationalgovernment agencies to LGUs was not yet completed. On the other hand, the devolution offunctions mandated in the LGC was completed only in 1993. In contrast, 1985 and 1990 wereyears prior to the 1991 LGC. However, the IRA level in 1990 is significantly higher than thatin previous years, reflective of the Aquino government's decentralization thrust.
First, the relationship between the collection rate for the current year's liabilities of thebasic RPT and per capita IRA, holding per capita assessed value, and land area constant, wasestimated. The results presented in Table 14 indicate that central government grants to LGUsdo not have a positive incentive effect on LGUs' RPT collection efficiency. In the case of cities,their RPT collection rate exhibited a negative and significant (at the 10 percent level ofsignificance) relationship with per capita IRA in 1990 and 1992 indicating that IRA substitutesfor cities' RPT revenue in those years. (The relationship is negative but not significant for1985.) On the other hand, while the results show that RPT collection rate of provinces andmunicipalities combined is also inversely related with per capita IRA in all three years, saidrelationship is not statistically significant.
The coefficient of land area is negative and statistically significant in all years understudy for provinces and municipalities combined. This is suggestive of the increasing difficultyin collecting RPT as the LGUs' land area increases. Land area did not appear to be a significant
explanatory variable for cities' RPT_qollection rate. Finally, the relationship between the RPTcollection rate and per capita assessed value is positive and significant for all years in the
13

equations for provinces and municipalities combined and for 1990 and 1992 in the equations forcities. 6
When LGU revenue performance is measured in terms of per capita locally generatedrevenue, the results shown in Table 15 once again suggest that the while intergovernmentaltransfers had a neutral effect on local revenue performance in 1985,7 it substituted for local taxrevenue in all levels of local governments in 1992 and 1993._ The Coefficients of per capitaIRA are negative and significant for all major types of local taxes (with the exception ofprovincial non-property tax) in provinces, cities and municipalities alike in 1992. 9 Moreover,the per capita IRA coefficients in the equations for total locally generated revenue of cities and
•municipalities are also negative and significant in that year indicating that IRA substitutes fornon-tax revenue in cities and municipalities in 1992. In Contrast, the IRA coefficient for totallocatly generated revenue of provinces is positive and significant signifying that increased IRAtends to lead to higher per capita non-tax revenue for provinces in 1992. Roughly similar resultswere observed with regards to the regressions using 1993 data.
While the relationship between per capita local tax revenue and per capita IRA is weakfor provinces (where a PI increase inper capita IRA leads to a P0.01 reduction in per capitalocal tax revenue in 1992-1993), it is not negligible in the case of cities (where a P1 increasein per capita IRA is predicted to lead to a P0.43 decrease in per capita local tax revenue) andmunicipalities (where a P1 increase in per capita IRA results in a P0.09 decline in per capitalocal tax revenue). These results, thus, suggest the need to include a maintenance of tax effortfactor directly and explicitly in the IRA distribution formula. One way of doing this is to setaside a specific proportion of IRA that will be distributed to specific LGUs on the basis of theirtax effort.
The coefficients of per capita income are positive and significant for all major categoriesof per capita local source revenue and per capita income is positive and significant in all levelsof local government in the three years under study with the exception of that for per capita non-property tax revenue in provinces in 1990 and in cities in 1992. However, the relationship isweak with the increase in per capita revenue never exceeding P2 for every P100 increase in per
6No regression basexl on this specification was run for 1993 because there was no data available on collectionefficiency.
7The relationship between per capita IRA azd per capita revenues of all major local tax is either negative and
insignificant or positive and significant (with the exception of municipal RPT revenues) in 1985.
_I'he results for 1990 are mixed. Some types of local taxes exhibited a significant and negative relationship withper capita IRA while others did not.
9The level of significance is 10 percent for the equations relating to provinces and 5 percent for the equationsrelating to cities and municipalities.
14

capita income. This may be indicative of inability of LGUs to fully capture the revenuepotential of their economic base.
Impact of Level of Economic Development
Earlier studies have shown that LGU revenue performance is not only determined by thesize of the economic base (usually measured by personal income) but also by other economicvariables indicating the overall level of economic development like the degree of urbanizationand the degree of industrialization (Bahl and Schroeder 1983). Following this tradition, weregressed various categories of per capita local source revenue against the following explanatory
• variables: per capita income, per capita IRA and the share of urban population to totalpopulation.I° Again, the analysis was done for different levels of local government and for theyears 1985, i990 and 1992. The results shown in Table 16 show a positi ,c and significantrelationship between all categories of per capita local source revenue (with the exception of non-property tax of provinces), on the one hand, and the degree of urbanization, on the other, forprovinces and municipalities in all three years. Apparently, a higher degree of urbanizationallows LGUs to derive more revenue from a given economic base. This may be due to the factthat the informal sector is smaller in more urbanized areas making it easier to collect taxes inthose areas. Moreover, urbanization also tends to expand the LGU tax base as it leads toincreases in real property values and growth in activities that are subject to the local businesstax. In contrast, the coefficients of the urbanization valfable was not significant in theregressions for per capita local source revenue of cities.
The coefficients for per capita IRA shown in Table 16 are generally consistent withearlier results. Intergovernmental grants exhibited either a stimulative effect (its coefficients arepositive and significant in provinces) or a neutral effect (its coefficients are positive but notsignificant in the regressions for cities and municipalities) On per capita locally generatedrevenue in 1985. However, results indicate that IRA substituted for all types of local sourcerevenue of all levels of local governments (with the exception of non-property tax revenue ofprovinces) in 1992. The coefficients of per capita IRA are negative and significant for all typesof local source revenue in cities and municipalities while the coefficients for per capita IRA arenegative and insignificant for RPT revenue of provinces. Note, however, IRA exhibited asignificant and positive relationship with respect to non-property tax revenue and total localsource revenue of provinces in the same year. Again, similar results were obtained in theregressions using 1993 data.
5. TAX CAPACITY AND TAX EFFORT
Section 3 documented the low level of LGU revenue performance (revenue measuredrelative to population or to income) while Section 4 showed that said performance is partly due
l°The coefficients of the share of nonagrieulture income are not. significant except in some of the equations for the1992 equations for cities and provinces.
15

to poor collection efficiency and to the inelasticity of the tax base with respect to income. Onthe other hand, Section 2 argued that LGU tax capacity (their ability to raise taxes) issignificantly constrained by central government legislation in the sense that the former definesthe types of taxes that LGUs may levy and their statutory base, and sets limits on the rate ofimposition. In this section, we focus on the relative importance of fiscal capacity (or revenuepotential) and tax effort in increasing LGU revenue performance.
The following accounting identity shows explicitly that LGU revenue depend on fiscalcapacity or the economic base of the LGU as defined by its per capita income and population,on the relation between the economic base and the tax base, on the tax rate, and on collection
rate (Bahl and Lin 1992).
R R L B Y_-_ ,_ ._ ,_ , p (1)L B Y P
R = c,t,b,yp,P (2)
where R = tax revenue,L = legal tax liability,B = tax base,Y = personal income,P = population,c = collection rate,t = legal tax rate,b = base to income ratio,y_ = per capita income.
In principle, different taxes of any given level of government as well as the same tax forvarying levels of government will exhibit different values of c, t, and b. Thus, total LGUrevenue also depend on the mix of taxes selected.
The economic base defines the limits to LGUs' tax capacity 0. e., their ability to raisetax revenue). It is largely outside the influence of both central and local governments.However, the tax bases assigned to LGUs are generally defined by central legislation and, to thatextent, the central government determines the extent to which LGUs may derive revenue out ofa given level of income. In contrast, _ collection rate is a function of LGU tax administrationpractice. On the other hand, Section 2 shows that LGU have restricted discretion in setting theirtax rates because central government legislation prescribes certain limitations on the same.
16

In this section, we attempt to determine the relative importance of various factors thatinfluence the yield of local taxes, the real property tax, in particular.
A slight variation of Equation (1) may be written for the real property tax:
R __V) AV FMVR--(>. ( . >, • (3>
where R = tax revenue,L = tax liability,AV = assessed value,FMV = fair market value for RPT purposes,TMV = true market value, andY = personal income.
Alternatively, it may be written as:
R = c • t • a • e • TMV (4)
where c = the collection rate,t = the tax rate,a = the assessment ratio, ande = assessment efficiency.
The collection rate is fully under the control of LGUs. In the Philippines, prior to the1991 LGC, the assessment ratio and the assessment efficiency were entirely determined by thecentral government. Under the Code, the assessment efficiency is put under the control ofLGUs while some discretion is given to LGUs in the determination of the assessment ratio aswell as the tax rate.
In 1992, the collection rate for all LGUs computed on the basis of current revenue inrelation to current billings was 0.5 and the average statutory tax rate was 1.2 percent. Theaverage assessment ratio is assumed to be 0.25 and the assessment efficiency is assumed to be0.33 (based on the findings of Manasan, 1992 and Tan, 1993). Counterfactual simulation showsthat if the collection rate is increased to 1 while other variables are held constant, RPT revenue
for the current year will increase by 100 percent or by P2.2 billion (8 percent of total LGUexpenditures or 20 percent of LGU Iocal source revenue) in 1992. Doubling the statutory taxrate will yield the same amount of re_,'nue as raising the collection rate to 1. On the otherhand, if, ceteris paribus, the assessment efficiency is increased to 1, RPT revenue for thecurrent year will increase by 200 percent or P4.3 billion (16 percent of total LGU expenditures
17

or 39 percent of LGU local source revenue) in 1992. If both the collection rate and theassessment efficiency are raised to 1, RPT revenue will increase by 500 percent or P10.8 billion.This amount is equivalent to 41 "percent of total LGU expenditures, 98 percent of LGU localsource revenue and 70 percent of the IRA level in 1992.
These numbers show (i) that correction of the undervaluation problem by adjusting theschedule of fair market values to the level of the true market values has the greatest potential
in increasing RPT revenue; (ii) that improvements in collection efficiency wilI lead to substantialgrowth in RPT revenue quite independently of the undervaluation problem; and (iii) that the RPTtax capacity, given prese.nt tax rates and assessment levels, is not negligible. Needless to say,any improvement in the assessment efficiency will not yield its full potential if there is noaccompanying improvement in collection efficiency. Conversely, the revenue gains fromimprovements in collection efficiency are magnified if assessment effic'_:ncy is enhanced at thesame time. These two improvements are reinforcing and should not be viewed as mutuallyinclusive.
There is no direct measure of the tax base for the local business tax, the most important
non-property tax. Thus, tax liability and, consequently, collection efficiency cannot beestablished accurately for the said tax. If one abstracts from under-reporting of gross receipts,the collection rate is presumably quite good. However, if one corrects for under-reporting, thencollection rate is likely to be low.
6. TAX ADMINISTRATION PRACTICES IN LGUS
6.1 RPT ADMINISTRATION
As indicated earlier, the importance of addressing the undervaluation problem in realproperty tax administration cannot be over-emphasized. In principle, under-assessment arisefrom two sources: infrequent revaluations and conscious under-assessment even in years whenrevaluation is carded out. In the Philippines, infrequent revaluations has been the norm in thepast decade even if the law mandated a gene/al revision in the schedule of fair market valuesonce every three years. Because of the repeated suspensions in the general revision, it is nowmore difficult to bring up the values in the schedule currently in force (based on 1981 data) totheir 1992 levels. This is so because the requisite adjustment in the schedule of fair marketvalues is so huge that it has become even more unpalatable to most politicians who now haveto legislate the new schedule under the 1991 LGC. In view of this problem, automaticadjustment with respect to inflation of the schedule of fair market value in between generalrevisions should be considered. 11 Such a move will protect the RPT base from being erodedby inflation during the years when no general revision is undertaken. By avoiding the need tomake lumpy adjustments in the schedule of fair market values, it will also make it easier to
11Even with indexation, a general revision would still be desirable to correct mis-alignments in the values of.
different kinds and classes of real property that is likely to occur when one or two rates of inflation are applied acrossthe board in the years between general revaluations.
18

narrow the gap between the "official" schedule of fair market values and true market values ofreal property in the medium term.
At the same time, interviews with the local assessors indicate that many of them do notvalue property at its true market value even when a general revision of the schedule of valuesis undertaken. Guidelines from the Department of Finance delineate that the local assessor mayuse (i) sales data from the Register of Deeds, (ii) sworn statements of real property owners filedevery time a general revaluation is undertaken or when a transfer or construction are made; (3)opinions of real estate agents. The first two of these data sources are inherently subject tounder-estimation. However, local assessors continue to rely on them, often to the exclusion ofthe third, because somehow the latter is viewed as being "unofficial" and, therefore, indefensibleif challenged either by local taxpayers and/or local elected officials themselves. In this regard,the use of the zonal values of real property (on which the BIR bases its assessment of estatetaxes imposed by the central government) should be considered as an alternative source ofinformation in computing the fair market value for RPT purposes. Some areas in Metro Manilaare already doing this.
The system governing interim revisions in the property records is another problematicarea. "It relies, at its peril, on other agencies of government (Register of Deeds for subdivisionsand Engineers Office for new construction) and on the cooperation of taxpayers .... It is thereforelikely that gaps in geographical coverage and obsolescence in building and ownership data willre-emerge in RPTA jurisdictions" (Dillinger 1988). The 1991 LGC mandates that Registers ofDeeds and notaries public furnish local assessors with copies of all contracts involving the sale,transfer, leasing or mortgaging of real properties that they have received. However, such amandate is not enough to ensure the maintenance of good records. Local assessors should betrained to aggressively seek the required information themselves on a regular basis andsystematically update their records accordingly.
Despite sufficient powers under the law to enforce delinquent accounts, the collection ratefor (current revenue relative to current billings) for RPT has never exceeded 60 percent in theperiod between 1983 and 1992. '2 Interviews with local treasurers suggest that a good deal ofreluctance on the part of local treasurers and/or local elected officials to use said legalremedies. However, the high collection efficiency of LGUs (e.g., Antique and other provincesin Region VI) whose local treasurers and local elected officials have shown the political will toauction off delinquent real properties indicate that these remedies, when put to use, can be aneffective deterrent to tax evasion.
However, the prevalence of delinquent accounts is also partly due to the lack ofsystematic procedures in monitoring RPT payments with the end in view of identifyingdelinquent accounts and making the appropriate collection follow-up. Computerization will
12Inaddition to interest surcharges on delinquent accounts, there are three legal remedies that LGUs may resort to
collect past due taxes: distraint of personal property, public auction of delinquent property, and civil action.
19

greatly enhance the performance of this function but it is not realiy a critical elementparticularly in small LGUs where good manual monitoring system is conceivable. Experiencein some LGUs indicate that regulir and personalized follow up can be effective. However, suchan approach will tend to increase the staffing requirement of Local Treasurer's Offices. In thisregard, barangay treasurers can be used more intensively in local tax collection.' (The 1991
LGC allows local treasurers to deputize barangay treasurers to collect local taxes, fees andcharges.) Installing an effective monitoring and co1iection follow- up system means that LGUsmove away from the present practice whereby LGUs rely on voluntary compliance in collectingRPT.
6.2. Non-Property Tax Administration
The major difficulty with regardsto the c,;lection of the business license tax is thedetermination of the gross receipts which is the statutory tax base. The practice in most LGUsis to accept establishments' sworn statement wherein they declare their gross receipts in theprevious year on faith. At best, local treasurers negotiate with the each taxpayer to establish theappropriate level of gross receipts. However, such a procedure is time consuming and can leadto considerable inequity in the system. Moreover, such an approach may encourage corruptionby giving local treasurers substantial discretion in tax assessment.
There is, thus, a need to establish a systematic procedure in ascertaining the accuratelevel of gross receipts. Requiring taxpayers to submit income tax returns (ITRs) filed with theBureau of Internal Revenue (BIR) is perhaps the most direct way of obtaining information.There are some timing difficulties involved here because of the unsynchronized tax calen_dar ofthe Bill and LGUs. However, these problems can easily be addressed either by introducingchanges in the LGU tax calendar (i.e., move back the payment of local business taxes fromJanuary 20 to April 30 of each year) or by making use of the previous year's ITR. In our view,the latter option is easier to implement. Since most establishments pay the local business taxquarterly, the initial assessment made on the basis of the previous year's ITR may be adjustedlater during the year. In addition to the ITRs, local treasurers may require large establishmentsto submit supplementary accounting records. In large and/or urban LGUs, local treasurersshould be trained in the conduct of field examination to check the veracity of reported grossreceipts of local businesses. The use of presumptive income levels (-PILs), particularly forsmall establishments should be explored. PILs may be established through various techniques:estimation of daily sales; and use of indicators such as the payroll value, electricity and waterbills, rental (ARD 1992). Initial discussion with the business sector indicates that presumptivetaxation per se is not acceptable to them. Thus, the PILs should really be viewed as an auditaid rather than as a surrogate tax base.
In terms of collection, LGUs again rely on voluntary compliance. In this case, since thepayment of the local business tax is a requirement in obtaining the mayor's permit to operatebusiness in the jurisdiction, the tax is essen_ally self-enforcing. However, 3 to 4 quarter delaysin the payment of the tax is common as firms pay their balance (of the previous year's taxliability) just in time to get their business permits at the start of the year.
2O

For other types of non-property taxes, poor LGU tax administration can be traced to theinadequate systems and procedures that currently govern assessment, collection and enforcement.ARD (1992) noted that the required improvements are simple. They only need consistency inpractice. These include: (i)the establishment of a tax roll for each type of tax that the LGUadministers (the conduct of a tax census and the development of a revenue data bank are keysteps in this regard); (ii) maintenance of systematic and organized records where payments ofall taxpayers are automaticallyentered as they occur; (iii) the sending of tax bills; (iv)conscientious monitoring of payments of taxpayers and identification and collection of taxtelinquencies; (v) strict implementation of sanctions and penalties on erring taxpayers.
5.3. Cost of Collecting Local Taxes
The cost of collecting LGU tax revenue appear to be inordinately high when t_,mparedto that of the BIR. In 1992, the ratio of BIR revenue to BIR expenditures was 85, i.e., the BIRcollects approximately P85 per peso spent in coIlection activities. The comparable figure forall LGUs in the aggregate was 4.9. _s Moreover, these aggregate figure tends to hide moreproblems at the LGU level. For instance, the cost of collecting the RPT in 11 out of 14 poorprovinces was even higher than the tax yield (Table 17). The discussion above noted that therevaluation of real property has the biggest potential in increasing tax revenue. However, LGUtax practitioners point out that cost cutting measures in the conduct of the general revision ofreal property assessment should be adopted to ensure that the tax remains cost effective. Theuse of computers is suggested to replace the numerous documents that have to be changed everytime a general revision is conducted. Moreover, if the proposed yearly automatic adjustmentof the schedule of fair market values in line with inflation is implemented, the number of yearsbetween general revisions may be increased to five (for example) to save on the tedious and timeconsuming work involved in said task.
7. USER CHARGES IN LGU BUSINESS ENTERPRISE
Recent evidence shows that the gross receipts from most LGU public enterprises in theaggregate are less than their current operating costs (Table 18). Only markets andslaughterhouses showed some profit with a gross receipts to operating cost ratio of 1.15 in 1992.All other types of LGU enterprises were losing propositions, except for city-operated cemeterieswhich posted some profit6.
13LGU expenditures for tax collection is computed as follows. Fifty percent of total expenditures of the Treasurer'sOffice was assumed to be allocated to tax collections. (The remaining 50 percent is implicitly attributed to its cashieringand other funetion_,) This figure is then is pro-rated to the various types of taxes in accordance to the proportionalcontribution of said taxes to total taxes. Thug, total r_2penditures in collecting total taxes is computed as the sum of theAssessor's Office budget and the portion of the Treasurer's Office budget which is devoted to tax collection. The costof collecting RPT is the sum of the Assessor's Office budget and the portion of the Treasurer's Office budget devotedto RPT collections.
:1

r_ote, however, that it is unt_kely mat markets and slauglaternouses woulo oe seen asprofitable once capital costs are taken into account. It has also been pointed out that the costfigures does not include outlays for security and engineering services provided by other LGUdepartments. Moreover, dilapidated state of a good number of public markets andslaughterhouses indicate that actual levels of maintenance and operating expenditure are sub-optimal. Finally, the gross receipts to operating costs ratio of LGU markets and slaughterhouses(l. 15) in 1992 Compares unfavorably with that of the private sector (1.85) indicating that LGUmarkets and slaughterhouses can do better financially,
The poor financial performance of LGU public enterprises has been traced to the highlevel of subsidy implicit in the pricing of their services. This is partly due to the fact PD 231(which has been repealed by the new _ Government Code) restricted the rates LGUs cancharge for the services of sore,; of these facilities. In turn, this is caused by the fragmentationof management responsibilities in the operation of LGU public enterprises. Thus, it is often thecase that the Local Treasurer is responsible for collecting the fees from these enterprises whilerepairs, maintenance, and security are undertaken by other departments in the local governmentwith no single person being accountable for the operation of the LGU business enterprise assuch. At the same time, cost data is poor and user fees are not systematically related to cost(PADCO/PHILNOR 1992).
The problem is also partly attributable to the political orientation of local officials thatdeters them from adopting cost-based pricing. While the 1991 LGC effectively removes thelimits on the levels of fees that LGUs may charge for public enterprise services, the political willto actually adopt cost-based pricing continues to be a major stumbling block to increased revenuegeneration from user charges. Despite elected officials protestations to the contrary, willingnessto pay on the part of beneficiaries is not the real problem. Many stall holders in public marketsreport subletting their stores to others at rates that are double or triple official rates. To get outof the political bind involved in raising user charges for LGU facilities some progressive mindedgovernors and mayors are exploring alternative arrangements in operating LGU publicenterprises. One such approach is privatization through management contract or lease. Forinstance, the market vendors cooperative in one municipality in Davao de1 Norte is negotiatingwith the municipal government for the lease of the public market there.
It is estimated that some P73 million can be generated yearly if user charges areincreased in all LGU public enterprises so that said enterprises break even. On the other hand,some P614 million can be mobilized if LGU enterprises set their rates so that they become asprofitable as their private sector counterpart.
Along the same vein, much has been said and written about the fiscal burden imposedon provincial governments by the devolution of DOH provincial and district hospitals. The costto operate the devolved hospiNs was P3.3 billion in 1993. However, it has been shown thaton the average public tertiary hospitals recov,_r only about 5 percent of their expenditures (SGVConsulting 1991). Thus, if another 10 percent of their expenditures are recovered from userfees, an additional P330 million could be generated by LGUs.
22

There appears to be some scope for increasing user charges in government hospitalswithout hurting the poor if the government puts in place a well-managed socialized pricingprogram. While the utilization Of government hospitals is progressive (with the proportion ofhouseholds using government hospitals increasing with the level of income), some 30-50 percentof current users are above the poverty line (Manasan and Llanto 1994).
In contrast to current practice, cost-based pricing should be adopted in LGU hospitals.In addition to this innovation on the technical side, local sanggunians need to pass legislation thatwill remove restrictions on the retention of income generated by these hospitals. It has beenfound that said restrictions discourage hospital personnel from collecting user fees.
8. RECOMMENDATIONSt
Analysis of the revenue structure of LGUs suggests that the LGU revenue performanceis generally poor. The need to improve the ability of local governments to mobilize moreresources is further highlighted by the devolution of substantial expenditure responsibilities toLGUs.
Perhaps one of the more important finding of this study is the substitutive effect of IRAunder the new regime defined by the 1991 LGC. To counteract this tendency, we recommendthat tax effort be taken into account explicitly in the IRA allocation formula. South Korea, Indiaand Nigeria follow such an approach. One way of doing this is to set aside a certain proportionof the aggregate IRA level, say 20 percent, and to distribute it to the various LGUs within agiven level of government in a manner that rewards tax effort.
The share of LGU i in the tax effort portion of the IRA may be computed as:
(r,- ,77")+Gt = . ] (5)
S](r,- + ,,ei:l
where Gi = share of LGU i in tax effort portion of IRA;K = tax effort portion of IRA which is computed as K = k IRA;T_ = actual local tax revenue of LGU i;T_"v° = taxable capacity of LGU i which is estimated by applying the average
national effective tax rate to total personal income of LGU i;F = absolute value of the ('ls - T_"°) of the LGU with the lowest tax effort, i.e.,
absolute value of ('P - Ti_5) with the smallest (algebraic) value.
23

Doing this procedure implies that all LGUs will receive some amount from the tax effort
incentive kitty in direct p.roportion to how well they perform with respect to the national averagein raising local taxes.
Our analysis also shows that (1) correction of the undervaluation problem by adjustingthe schedule of fair market values to the level of the true market values has the greatest potential
in increasing RPT revenue; (ii) that improvements in collection efficiency will lead to substantialgrowth in RPT revenue quite independently of the undervaluation problem; and (iii) that the RPTtax capacity, given present tax rates and assessment levels, is not negligible. Needless to say,any improvement in the assessment efficiency will not yield its full potential if there is no.accompanying improvement in collection efficiency. Conversely, the revenue gains fromimprovements in collection efficiency are magnified if assessment efficiency is enhanced at thesame 6 _. These two improvements are reinforcing and should not be viewed as mutuallyinclusive.
In this regard, we recommend the automatic adjustment with respect to inflation oftheschedule of fair market value in between general revisions. Such a move will protect the RPTbase from being eroded by inflation during the years when no general revision is undertaken.By avoiding the need to make lumpy adjustments in the schedule of fair market values, it willalso make it easier to narrow the gap between the "official" schedule of fair market values andtrue market values of real property in the medium term.
To counter the tendency of local assessors to value real property below it true marketvalue we recommend that the use of the zonal values of real property (on which the BIR basesits assessment of estate taxes imposed by the central government) should be considered as analternative source of information in computing the fair market value for RPT purposes.
To improve RPT collection efficiency, we recommend that local treasurers and localelected officials be sensitized to the gains from making use of the legal remedies available underthe Code to enforce its collection. The public auction of delinquent properties has been effectivein the LGUs which have used it. -
There is also a need for systematic procedures in monitoring RPT payments with the endin view of identifying delinquent accounts and making the appropriate collection follow-up.Computerization will greatly enhance the performance of this function but it is not really acritical element particularly in small LGUs where good manual monitoring system isconceivable. Regular and personalized follow-up has been proven effective in many LGUs. Inthis regard, barangay treasurers can be used more intensively in local tax collection.
Cost cutting measures in the conduct of the general revision of real property assessmentshould be adopted to ensure that the tax remains cost effective. The use of computers issuggested to replace the numerous documents t.hat have to be changed every time a generalrevision is conducted. Moreover, if the proposed yearly automatic adjustment of the scheduleof fair market values in line with inflation is implemented, the number of years between general
24

revisions may be increased to five (for example) to save on the tedious and time consuming workinvolved in said task.
The biggest problem with regards to the local business tax is the under-reporting of thegross receipts of business establishments. Requiring taxpayers to submit income tax returns(ITRs) filed with the Bureau of Internal Revenue (BIR) is perhaps the most direct way ofobtaining information. Given the present tax calendar of LGUs, this implies that the localbusiness tax is initially assessed on the basis of the previous year's ITR subject to finaladjustment later in the year as the current ITR becomes available. In addition to the ITRs, localtreasurers may require large establishments to submit supplementary accounting records. Inlarge and/or urban LGUs, local treasurers should be trained in the conduct of field examinationto check the veracity of reported gross receipts of local businesses. The use of presumptiveincome levels (PILs), particularly for small establishments should be explored. Initial discussionwith the business sector indicates that presumptive taxation per se is not acceptable to them.Thus, the PILs should really be viewed as an audit aid rather than as a surrogate tax base.
For other types of non-property taxes, poor LGU tax administration can be traced to theinadequate systems and procedures that currently govern assessment, collection and enforcement.ARD (1992) noted that the required improvements are simple. They only need consistency inpractice. These include: (i) the establishment of a tax roll for each type of tax that the LGUadministers (the conduct of a tax census and the development of a revenue data bank are keysteps in this regard); (ii) maintenance of systematic and organized records where payments ofall taxpayers are automatically entered as they occur; (iii) the sending of tax bills; (iv)conscientious monitoring of payments of taxpayers and identification and collection of taxdelinquencies; (v) strict implementation of sanctions and penalties on erring taxpayers.
Finally, the poor financial performance of LGU publ{c enterprises may partly beaddressed by installing a central unit for operating and managing local public enterprises(PADCO/PHILNOR 1992). Privatization either through the outright sale of government equityor through management contracts/lease should also be explored.
There appears to be some scope for increasing user charges in government hospitalswithout hurting the poor if the government puts in place a well-managed socialized pricingprogram. While the utilization of government hospitals is progressive (with the proportion ofhouseholds using government hospitals increasing with the level of income), some 30-50 percentof current users are above the poverty line (Manasan and Llanto 1994).
In contrast to current practice, cost-based pricing should be adopted in LGU hospitals.In addition to this innovation on the technical side, local sanggunians need to pass legislation thatwill remove restrictions on the retention of income generated by these hospitals. It has beenfound that said restrictions discourage hospital personnel from collecting user fees.
Some of the taxes that LGUs are allowed to collect at present are considered undesirablefrom the point of view of overall economic efficiency. One example is the tax on the gross
25

receipts of exporters. Still another example is the gross receipts tax on banks. Note also thatthe tax on the gross receipts of manufacturers and wholesalers is a turnover tax that counteractsthe efficiency gains from the inffoduction of the VAT at the national level.
In the medium term, the assignment of taxing authorities to various levels of governmentmust be reviewed. At this point, existing theoretical guidance on tax assignments suggest thatresidence-based taxes like taxes on retail sales and taxes on immobile factors like real propertyare appropriate for local taxation. (However, local tax on retail sales may be difficult toadminister in less developed LGUs with a large informal sector and with its many smallestablishments.) The taxation of business income by local governments is not an efficient taxbecause businesses are highly mobile. Moreover, such a tax tends to be counterproductivebecause it encourages tax competition among LGUs.
FN;LGUR_VI.pid
26
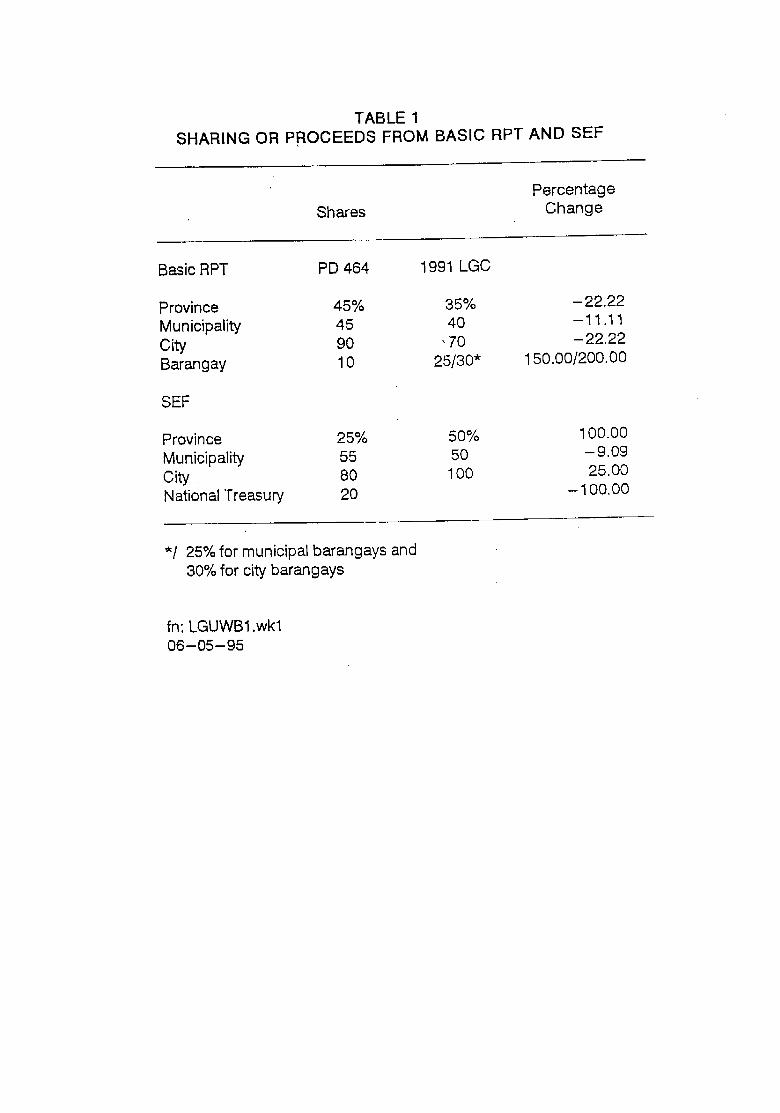
TABLE 1
SHARING OR PROCEEDS FROM BASIC RPT AND SEF
PercentageShares Change
Basic RPT PD 464 1991 LGC
Province 45% 35% - 22.22
Municipality 45 40 -11.11City 90 -70 -22,22Barangay 10 25/30* 150.00/200.00
SEF
Province 25% 50% 100.00
Municipality 55 50 - 9.09City 80 100 25.00National Treasury 20 - 100.00
*/ 25% for municipal barangays and30% for city barangays
fn: LGUWB1 .wkl06-05-95

TABLE 2.aCOMPARISON OF THE ASSESSMENT LEVELSPRESCRIBED IN PD 464 AND THE 1991 LGC •
A. Lands Assessment LevelPD 464 1991 LGC
Residential 30, 20Agricultural 40 40Commercial 50 50Industrial 50 50Mineral 50 50Timberland 20
B. Machineries Assessment LevelPD 464 1991 LGC
Residential 70 50
Agricultural 60 40Commercial 80 80Industrial 80 80
C. Buildings and other improvements
C.1 Residential
Fair market value Assessment LevelPD 464 1991 LGC
P30,000 or less 15 . 030,000-50,000 20 050,000-75,000 25 0
75,000-125,000 35 0125,000-175,000 45 0175,000- 250,000 55 10250,000-300,000 65 10300i000-350,000 65 20350,000-500,000 75 20500,000-750,000 80 25
750,000-1,000,000 .. 80 301,000,000- 2,000,000 80 352,.000,000-5,000,000 80 40
5,000,000 - 10,000,000" 80 50more than 10,000,000 80 60

TABLE 2.bCOMPARISON OF THE ASSESSMENT LEVELSPRESCRIBED IN PD 464 AND THE 1991 LGC
C.2 AgdculturaJ
Fair market value Assessment LevelPD 464 1991 LGC
P30,000 or less 40 2530,000-50,000 45 2550,000 -75,000 50 25
75,000-125,000 55 25125,000-175,000 60 25175,000-250,000 65 25250,000-_J)0,000 65 25300,000_-&50,000 70 30350,000-500,000 75 30500,000-750,000 80 35
750,000-1,000,000 80 401,000,000-2,000,000 80 45more than 2,000,000 80 50
C.3 Commercial/Industrial
Fair market value Assessment LevelPD 464 1991 LGC
P30,000 or less 50 3030,000-50,000 55 3050,000-75,000 60 30
75,000 -125,000 65 30125,000-175,000 70 30175,000-250,000 75 30250,000-300,000 80 30300,000-350,000 80 35350,000-500,000 80 35500,000-750,000 80 40
750,000-1,000,000 80 501,000,000-2,000,000 80 602,000,000 -5,000,000 80 70
5,000,000-10,000,000 80 75more than 10,000,000 80 80


Table 3RPT COLLECTIONS AND THE CHANGE IN THE
ASSESSMENT LEVELS: SOME ILLUSTRATIONS
Urban/ Rural/ Urban/ Rural/IndustriaJ Agric. Industrial Agric,Province Province Muni. Muni. City A City B
Levels in _ousand pesos
1992B
80% of res. bldg. exempt;new sharing formula;provinces set RPT rate at 1%;LGUs impose additional
1% tax for SEF
Basica, current 8306.74 2146.37 1473.45 58.08 2044.69 2507.04
b. previous year 2029.93 322.95 71.18 2.40 918,78 918.78c. penalties 576.84 272.06 40.49 1.99 541.46 541.48d. To_ 10913.51 2741.37 1585.12 62.48 3504.94 3967.28
SEFa. current 3593.65 946.31 418,59 72.61 486.83 596.91
b, previous year 87'2.25 131,44 19,96 36.45 131,25 131,25c. penalties 260.72 98.86 11.45 4,20 77.35 77.35d. Total 4726.63 1176.60 450.00 113.26 695,44 805.52
Total 15640.34 3917.97 2035.12 175,73 4200.37 4772.80
Percentage Change
1992/V1991
Basica. current -37,43 _34.60 -18.85 -_21,94 -38.89 -26.75
b. previous year -22.22 -22.22 -11.11 -11.11 -22,22 -22,22c. penalties -22.22 -22,22 -11.11 -11.11 -22.22 -22.22d. Total -34,43 -32.29 -18.17 -21,27 -33,00 -25.15
SEFa_ current year 60.89 68,16 -16.81 -20.17 -1.78 17.72b. previous years 100.00 100,00 -9,09 -9,09 25.00 25.00c. penalties 100,00 100.00 -9.09 -9.09 25.00 25.00d, Total 68.63 73.50 - 16.31 - 16,54 4.83 19.51
Total -19.58 -17.11 -17.76 -16,29 . -26.73 -20,11
19926/1991
Basic.a. currant -39.09 -35.63 -18.79 -22.78 -40.51 -27,05
b. previous year -22.22 -22.22 -11.11 -11.11 -22.22 -22.22c. penalties -22.22 -22.22 -11.11 -11.11 -22,22 -22.22d. Total -35,76 -33.13 -18.29 _22.O6 -34_05 -25.35
SEF
a. current year 56.63 65.52 -16.94 -21.03 -4.38 17.24b. previous years 100.00 100.00 -9.09 -9.09 25.00 _:_ 25.00c. penal'des 100.00 100.00 -9.09 -9.09 25.00 25.00d. Total 65.21 71.30 -16,44 -17.12 2.87 19,15
Total - 21.21 - 16,14 - 17.89 _ 18.95 - 29.88 - 20.32
fn: LGUWB3,wkl06-05-95

Table 4COMPARISON OF BUSINESS TAX PROVISION IN PD 231 AND 1991 LGC
4/1
L On manufacturer& assemblers, repackers, processors, brewers, distillers, rectifiers, and compounders of liqours.distilled spirils, and v_hes or manufacturers of any article of commerce of whatever kind or nature, inaccordance v4th the fol/ov_ng schedu/e:
With gross sales or re¢eiptsforthepreceding Amount of Tax per annum Percentage Changecalendar year inthe amountof:. PD 231 1991 LGC
Less than P10;000.00 P 150.00 P 165.00 10.0010,(300.00or more but lessthan P 15,000.00 200.00 220.00 10.0015,000.00 or more but lessthan 20°030.00 275.00 302.00 10.0020,000.00 or morebut lessthan 30,000,00 400.00 440.00 10.0030,000,00 or more but less than 40,000.00 600.00 660.00 10.0040,000.00 or more but less than 50,000,00 750.00 825.00 10.0350,030.00 or more but lessthan 75,000.00 1°203.00 1,320.00 10.0375,000.00 or more but lessthan 100,000.00 1,500.00 1,650.00 10.03
100,000.00 or more but less than 150,000,00 2,000.00 tZ.200.00 10.03150,000.00 or more but lessthan 200,000,00 2,500.00 2,750,00 10,03200,000.00 or more but lessthan 300,000.(73 3,500.00 3,850.00 10.03300,000.03 or more but lessthan 500,000.00 5,000.00 5,500.00 10.00500.000.00 or more but less than 750.000.00 7,500,00 8,003.00 10.00750,000.00 or more but lessthan 1,000,000.00 10,CO0.00 10,000.00 10,03
! ,0(30,000.00or more but lessthan 2,000,000.00 12,500.00 13,750,00 10.032,000,000.00 or more but lessthan 3,000,000,00 15.000.00 16,500.00 10,003°000,000.00 or more but lessthan 4,000,000.00 16,000.00 19,800.00 10.004,000,000.00 or more but lessthan 5,000,000.00 21,000,00 23,100.00 10.005,000,000.00 or more but lessthan 6,500,000.00 24,000.00 24,375.00 1.566,500,000.00 or more but lessthan 7,000,000.00 24,000.00 37.5% of 1% 1.72 to 9.377,000,000.00 or more but less than 9,000,000.00 27,000.00 37.5% of 1% (1.39) to 24.999,000,000.00 or more but less than 12,000,000.00 30,000.00 37.5% of 1% 2.27 to 49.99
12.000,000.00 or more but lessthan 15,000,000.00 33,000.00 37.5% of 1% 37,50 to 70.4515.000,000.00 or more but lessthan 18,000,000.00 36,000.00 37.5% of 1% 56,25 to 87.4918,000,000,00 or more but lessthan 20.000,000.00 40,000.00 37.5% of 1% 68.75 to 87.49For every P500.000.00 in excess of at least 85.19
P20,000,000.00 but notmore thanP50,000,000,00 500.00 37.5% of 1%
For every P500,000.O0in excessofP50,000.000.00 250.00 37.5% of 1%.

Table 4
COMPARISON OF BUSINESS TAX PROVISION IN PD 231 AND 1991 LGC4/2
B. On wholesalers, dis_'ibutors, or dealers in any arb'cleof commerce of whatever kind or nature in accordance with thefo//owing schedu/e:
Withgross salesor receipts for the preceding Amount of Tax per annum Percentage Changecalendar year in the amount of: PD 231 1991 LGC
Lessthan Pt ,000.00 P 15.00 P 18.00 20.001,003.00 or more but lessthan P 2,000.00 30.03 33.00 10.032,000.00 or more but less than 3,000.00 45.03 50.00 11.113.000.00 or more but less than 4,003.00 65.00 72.00 10.774.000.00 or more but lessthan 5.000.00 90.00 100.00 11.115,003.00 or more but less than 6.000.00 110.00 121.00 10.006,003.00 or more but lessthan 7,000.00 130.00 143.00 1o.007,000.00 ormore but lessthan 8,(XX).O0 150,00 165,00 10.038,000.00 or more but less than .10,000.00 170,00 167.00 10.00
10,000.00 or more but lessthan 15,000.00 200.00 220.00 10.0315,000.00 or more but less than 20,000.00 250.00 275.00 10,0320,000.00 or more but lessthan 30,000.00 300,00 330,00 10.0030,000,00 or more but less than 40,000.00 400,00 440.00 10.0340.000.00 or more but lessthan 50,000.00 600.00 660.00 10,0350,000.00 or more but lessthan 75,000,00 900,00 990.00 10.0075,030.00 or more but lessthan 100.000.03 1.200.00 1,320.00 10,03
100,000.03 ormore but less than 150,000.03 1,700.00 1,870,00 10,03150,000,03 or more but tessthan 200,000.03 2,200,00 2,420.00 • 10.03200,000.03 or more but lessthan 300.000,03 3,000.00 3.300.00 10.03300,000.00 or more but lessthan 500,000.00 4,003.00 4,400.00 10.00500.000.03 or more but less than 750,000.00 6,000.00 6,600.00 10.03750,000.00 or more but less than 1.003,000.00 8,003.00 6,800.00 10.03
1,003,000,00 or more but less than 2,000,000.00 8,103 = 9,003 10,000.00 11.11 to 23,452,003,000.00 or more 9,000 + 100
for everyP100,000 inexcess of
2,003,000 50% of 1% at least 15.38

Table 4COMPARISON OF BUSINESS TAX PROVISION IN PD 231 AND 1991 LGC
'4/3
C. On all exportersin accordance withthe followingschedule:
Vv%thgross sc'_lesorreceiptsfor the preceding . Amount of Tax per annum Percentage Changecalendar yeal in the amount of: PD 231 1991 LGC
LessthanPIO,O00.O0 p 82.50 (91.75)
10.000.00 or more but less than P 15,000.00 P 1,000.00 110.00 (89.00)1S,O00.O0or more but less than 20,000.00 1,000.00 151.00 (84,50)20,000.00 ormore but less than 30,000.00 1,000.00 220.00 (78.00)30,000.00 or more but lessthan 40,000.00 1,000.00 330.00 (67.00)40,000.00 or more but less than 50,000.00 1,000.00 412.50 (58.75)50,000.00 or more but Sessthan 75,000.00 1,000.00. 660.00 (34.00)75,000.00 or more but less than 100,000.00 1,000.00 825.00 (17.25)
100,000.00 or more but less than 150,000.00 1.000.00 1,100.00 10,00150,000.00 or morebut lessthan 200,000.00 1,000.00 1,375.00 37.50200,000.00 or morebut lessthan 300,000,00 1,000,00 1,925.00 92,5030_.000.00 or more but less than 500,000.00 1,000.00 2,750.00 175.00500,000.00 or more but lessthan 750,000.00 10000.00 4,000.00 300.00750,000.00 or morebut lessthan 1,000,000.00 1,000.00 5,000,00 400.00
1,000,000.00 or morebut lessthan 2,000,000.00 .2,000.00 6,875.00 273.752,0C0,000.00or more but lessthan 3,0000000.00 2,000,00 8,250.00 312.503,000,000.00 or more but less than 4,000,000.00 2,000,00 9,900.00 395.004,000,000.00 or morebut lessthan 5,000,000,00 2.000.00 11,550.00 477.505,000,000.00 or morebut lessthan "6,500,000,00 3,000.00 12,187.50 306.256,500,000.00 or more but lessthan 10,000,000.00 3,000.00 18.75% of 1%
lO,O00,O00,O0ormore but less than 20,000,000.00 5,000.oo 18,75% of 1% at least 306.B720,000,000.00 or more but less than 30,000°000.00 7,000.00 18.75% of 1%30,000,000.00 or more but less than 50,000,000.00 10,000.00 18.75% of 1%50,000.000.00 or more but lessthan 75,000.000.00 15,000.o075,000,000.00 or more but less than lO0,000,000.00 20,000.00over 100 million 20.000,00 +
P200 for
every P 1 M

Table 4VIPARISON OF BUSINESS TAX PROVISION IN PD 231 AND 1991 LGC
4/4
[2. On retailers in accordance with the following schedu/es:
W_thgross sales orreceipts forthe preceding Amount of Tax per annum Percentage Changecalendar year in theamountof: PD 231 1991 LGC
Less thanPI.000.O0 P 15.00 20% 33.331.000.00 or more but less than P 2,000.00 30.00 20% (33.27) to 33.272,000.00 ormore but lass than 3,000.00 45.00 20% (11,07) to 33.283,000.00 or more but less than 4,000.00 65,00 20% (7.66) to 23.054,000.00 or more but lessthan 5,000.00 90,00 .20% (11.09) to 11.095,000.00 or more but less than 6,000.00 110,00 20% (9.07) to 9.076,000.00 or more but less tha,n 7,030.00 130,00 20% (7,68) to 7.587,000.00 or more but lessthan 8,000.00 150.00 20% (6.6b--)to 6,658,003,00ormorebut less than • 10,000.00 170.00 20% (5.67) to 17.63
10,000.00 or more but less than 15,000,00 200.00 20% 0.00 to 49.9915,000.00 or more but less than 20,000.00 250.00 20% 20,00 to 59.9920,000.00 ormore but lessthan 30,000.00 300.00 20% 33.34 to 99,9930,000.00 or morebut lessthan 40,000.00 400.00 20% 50,03 to 99.9940,000.00 or more but lessthan 50.000.00 600.00 20% 33.33 to 66,6650,000.00 or more but less than 75,000.00 900.00 20% 11.11 to 66.6675,030.00 ormore but less than 100,000.00 1,200.00 20% 25,03 to 66,66
100,000,00 or mote but less than 150,000.00 1,703.00 20% 17.65 to 76,47150,000.03 or more but lessthan 200,000.00 2,200.00 20% 36.36 to 81.82200,000.00 or more but lessthan 300,000.00 3,000,00 20% 33,33 to 99.99300,000.00 or more but less than 400,000.00 4,003,00 2% 50,03 to99,99
400,000.00 or more but less than ,500,000-00 4,000,00 1% 0.00 to 25.00500,000.03 or more but less than 750,000.00 6,000.00 1% (16.67) to 24.99750,000.00 or morebut less than t ,000,000,00 8,000.00 1% (6,25) to 25.00
For everyPlOO,OOO.OOin excess of P1 million 100.00 1% at least 35.00

TABLE 5LICENSE AND BUSINESS TAX
AND CHANGES IN THE ALLOWABLE TAX RATES
Urban/ Rural/Industrial Agricultural
Municipality Municipality
Levels (P 1000)
1992 3688.37 61.53
1993A
Local Sanggunianpassesmax. ratesfor LBT 5001.44 101.51
1993B
Local Sangguniandoesnot passnew LBTord. 4167.86 69.53
Percentage Change'
1993A/1992 35.60 64.98
1993B/1992 13.00 13.00
Memo Items:
Share of retail 0.20 0.90Share of others 0.80 0.10% change in retailtaxl 0.40 0.50% change inother tax 0.15 0.10Trend growth 0.13 0.13

TABLE 6OTHER TAXES, FEES AND CHARGES
AND CHANGES IN THE ALLOWABLE TAX RATES2/1
Urban/ Rural Urban/ RuralIndustrial Agricultural Industrial AgriculturalProvince. Province Municipality Municipality
Levels (P i000)
1992
Transfer tax 903.94 37.27 0.00 0.00Tax on printing 3,82 2.91 0.00 0.00Franchise tax 24.98 5. _,7 0.00 0.00Sand and gravel tax 40,31 79._6 0.16 0.31Amusement tax 310.43 67,59 0.00 " 0.00Tax on delivery vans 20.77 11.21 0.00 0.00Professional tax 91.44 24.85 34.38 0.27Community tax 1234.73 310.47 145.24 10.59Other fees and charges 254.58 68.99 246.14 44.92
Total 2885.01 608.42 425.92 56.08
1993A
(with new ordinances)
Transfer tax 4338.89 178.92 0.00 0.00Tax on pdnting 4.40 3.35 0.00 0.00Franchise tax 49.13 .10,17 0,00 0.00Sand and gravel tax 95.77 189.96 0.91 1,72Amusement tax • 172.29 37,51 86.15 0.00Tax on delivery vans 191,12 103.09 0.00 0.00Professional tax 652.09 177.21 0.00 0.00Community tax 0.00 0.00 1577.83 114.99Other fees and charges 366.60 99.34 354.44 64.68
Total 5870.28 799.55 2019.33 181.39
1993B
(without new ordinances)
Transfer tax 1084.72 44,73 0.00 0.00Tax on printing 4.40 3.35 0.00 0.00Franchise tax 49.13 10.17 0.00 0.00Sand and gravel tax 17.97 35.64 0.17 0.32Amusement tax 172.29 37.51 88.15 0.00Tax on delivery vans 23.89 12,89 0.00 0.00Professional tax 135,85 36.92 0.00 0,0_Comr_unity tax 0,00 0,00 350.63 25.55Other fees and charc 305,50 82,78 295.37 53.90
Total 1793.74 263,99 732,31.. 79.78

TABLE 6OTHER TAXES, FEES AND CHARGES
AND CHANGES IN THE ALLOWABLE TAX RATES2/2
, Urban/ Rural Urban/ Rural
Industrial Agricultural Industrial AgriculturalProvince Province Municipality Municipality
Percentage Change
1993,4/1992
Transfer tax 380.00 380.00Tax on printing 15.00 15.00Franchise tax 96.67 96.67Sand and gravel tax 137.57 137.57 454.32 454.32Amusement tax -44.50 -44.50Tax on delivery vans 820.00 820.00Professional tax 613.14 613.14 -100.00 - 100.00Community tax - 100.00 - 100.00 966.35 986.35Other fees and charges 44.00 44.00 44.00 44.00
Total 103.47 31.41 374.10 223.44
1993,9/1992 "
Transfer tax •20.00 20.00
Tax on printing 15..00 15.00Franchise tax 96.67 96.67Sand and gravel tax -55.43 -55.43 4.00 4.00Amusement tax -44.50 -44.50Tax on delivery vans 15_00 15.00Professional tax 48.57 48.57. - 100.00 - 100.00Community tax -100.00 ' -100.00 141.41 141.41Other fees and charges 20.00 20.00 20.00 20.00
Total -37,83 -56.61 71.93 42.25
When no new ordinances are enacted, projected, change in revenuesresult from changes in shadng formula and trend growth in revenues.

TABLE 7PROJECTED LOCAL REVENUESOF LGU$ WITH THE 1991 LGC
Urb_Ln/ Rural Urban/ RurRI
Indus_ial Agricultural Industrial AgriculturaJProvince Province Municipality Municlpslity
Levels (P ! 000)
1992
RealProperty TaxBasic 16291.22 4110.89 2016.75 80,31SEF 3080.08 668,82 559,86 136.64Total 21371.30 4799.71 2576.61 2f 7.15
License and Business Tax 0.00 0.00 3688.37 61.53
Other Taxes, Fees and Charges" 2885.01 608.42 425.92 56.08
Income from Business Enterprise 429.22 2318.74 26200.62 266,17
Other Income 8747.17 ' 3685.75 36.29 32.44
Total 33432.71 11412.62 32928o01 633.37
Total less SF_F 3035233 10723.80 32368.1 5 496.53
1993
Max. RPT rates; max, !_ET/other tax rates;50% increase in schedule of values
Real Propsrty TaxBe_ic 16886.11 4136.51 2546.77 100.23SEF ,7224.30 1791.70 723.20 160.45Total 23910.41 5928.21 3269,97 260,68
License and Business Tax 0.00 0,00 5001.44 101.51
Other Taxes, Fees and Charges 5870.26 799.55 2019.33 161.39
income from Business E3"derprise 576.88 3116.39 35213.90 357.73
Other Income 10496.61 4422.90 43.55 38.93
Total 40654.17 14267,04 45548.19 940.25
TotaJless SEF 33629.87 1247534 44624.99 779.80
Percentage Change
199311992
Real Property TaxBasic -8.78 0.62 26.28 24.80_EF 134.55 160.11 29.18 17.25Total 11,88 23.51 26.91 20.05
License and BusinessTax 35.60 64.98
Other Taxes, I:ees and Charges 103.48 31.41 374.11 223.45
Income from Business Enterprise 34.40 34.40 34,40 34.40
Olher income 20.00 20.00 20.00 20.00
Total 22.20 25.01 38.33 48.45
Total less SEF 10.80 16.33 38.48 ' 57.05


R,_ 8TFIUI_E OF LOCAL (K)V_FtNMENTS*. 1981 --19_3 {RATIO TO _ In %)
_.],--, ,_" L ALJ. LGLk; 1_1-.gI 11_g2--g3 1gel-g3 IM1 lg82 1983 lg_4 1_5.5 198_ 1007 lg60 li_9 1990 1991 19g'_ 1993
A. LOCAL SOURCES 0.84 0.98 0.U 1.02 1,00 0.87 0.76 0.78 0.'/'/ 0.73 0,70 0,05 0,86 0,03 0.80 1.10
L Tax Re,,mm,,ws 0.S_ 0.73 0,60 0.75 0.71 0.57 0,52 0.52 0,55 0,51 0,49 0.51 0.50 0,55 0.55 0.90
1. Real Properly Te,x_; 0,35 0.34 0.05 0,415 0,44 0,41 0.32 0.3_ 0,35 0.32 o.;Yg 0.30 0,35 0.34 o,31 0,372. Od'_m; 0.22 0.39 0.25 0.29 0.27 0._S 0.20 0.21 0.20 0.19 0,20 0.21 0.21 0,21 0.24 0.53
I|_ Opemttrtg & MI=.=. Rev_r',_ 0._ 0.24 0,25 0`27 0`20 0.29 0,24 0.28 0.22 0.22 O.21 0.27 0,28 0.25 0,22 O,26
IlL Ga,pltd 0.01 0,01 0,01 * '* * * • 0,07 0.0"_ 0.02 0.02
B, 0.82 1,40 0._',',2 0.80 0,80 0,88 0,08 0.75 0,08 0,80 0.09 0.02 0.01 1,06 1.16 1,74
1. S,hat_ from NettonsI Tax_= 0,61 I._ 0,72 o.01 0,72 0.71 0,55 0.59 0.5.4 0.50 0.53 0.55 0_05 0.75 1.11 1.60
_.. Grants i_ AJ_ 0.10 0.04 0.17 0,15 0.1 _: 0.12 0.10 0.13 0.12 0.09 0.40 0.27 0.25 0.27 0.o4 0,043, Iflt_-kx=ll _ Trarsactl " * * * *
4, Borrowings 0.02 0.06 0,02 0.04 0.02 0,03 0,03 0.01 0,01 ," 0.01 0.01 0.04 0,03 0.00S_ OthQm " * 0.01 '* *
TOTAL INCOM, E & FjCI"RAORDINARY
RECEIPTS & BORP_:)WINGS (A,,kB) 1.67 2.44 1.79 1.82 1.89 1.5,4 1.45 1.$3 1.45 1.33 1.59 1.07 1.77 I _60 1+98 2.91
1. ALLPROVIN_S 1081,,-_1 1_r2,-,93 1ER51-D3 1961 1982 1983 19_4 1955 198_ 1987 1908 1909 1990 1_1 1992 1993
even_ge ev_rege i)v_fa_e
A_ LOCAL -_Ot,._CE_ 0.17 0.15 0.16 0.19 0.1" 0,20 • 0.18 0,15 0.14 0,13 0.12 0.23 0,17 O,15 0.13 0.16
L T_x Rev(_u, es O.i_ O.Og 0,Og 0.12 0,11 0.11 0.09 0.08 0.O_ 0.08 0.O_ 0.09 0.08 0.07 0.07 0.11
1. Re.e,IProperty Taxe,s 0.07" 0.07 0,07 O,10 0.00 0.09 0.07 0.0_ 0-08 0.07 0.06 0.07 ,0.06 0.06 0.O_ 0.052. Other 0.0_ 0.02 0.02 0.03 0.02 0,03 0.02 0.02 0.02 0.02 0.02 0.02 0.0! 0.01 0.01 0.03
11. Operet_ng & Mts,¢, Reverb, ms 0.07 0_05 o.o_ 0.07 0.08 0.06 0,06 0.07 0,05 0,04 0.04 0.05 0.0g 0-6o 0.o4 0.05
iII. C_plt_d 0.01 0.01 0.01 " - * 0.07 0,02
B. EXTERNAL $OUP.CE.,_ 0.29 0.43 0.31 0.30 0.32 0.32 0`25 0.2'g 0.26 0.22 0_39 0.28 0.27 0.34 0.34 0_52
1. She res from Ne_'Hon_lTaxe.a 0_IB 0.40 0`21 0.10 0`21 0.21 0.16 0.16 0.17 0.15 0.15 0.15 0.15 0.21 0.31 0.49
2. Grant= In Aide. 0.11 0._2 0.0g 0.11 0.10 0.O0 0.07 0_10 0.0g 0.06 0.24 0.12 0.08 0.11 0.(T2 0.0231 Inter--lo_:_,l Govetrm_nt Tra_v.actl * * * " "
4. Borrowlnga= 0.01 0.01 0,01 0.01 0.01 0.01 0.01 0.01 * * "5, Othem * * * *
TOTAL INCOME & EXTRAC_DIHARY
RECEIPTS & BORROWINGS (A+B) 0.46 0.5_ 0.48 0,50 0.51 0.51 0,39 0.44 0.40 0.35 0,51 0.51 0.44 0.49 0.47 0.58
fl, ALLOITfES 1051-_1 Ig¢_"_-03 1951-03 1981 1082 1983 1984 1955 1966 1987 105,5 1909 1900 1_1 1902 1_)03
averaoe avaf_ge evQmge
A- LOC,AL SOURCES 0.37 0.38 0,35 0.47 0.40 0.44 0.35 0.35 0,35 0.33 0.31 0.33 0,37 0.38 0.33 0_44
L Tax Rev,m_,,_ 0,28 0.30 0.23 0.38 0.36 0.33 0,26 0.25 0.28 0`24 0,23 0`24 0.26 0.25 0.25
1, Re.st P/openy Te,xe,= 0,16 0_14 0.16 0.22 0.21 0.10 0.15 0.14 0.15 0.14 0.13 0_13 0.15 0.15 0.13 0,152. Other_ 0.12 0.10 0.12 0.18 0.15 0.14 0.11 0,11 0.11 0.10 0,10 0,11 0.11 0.11 0.12 0.2
_,. Operaling &Ml¢c,. R_ 0.09 o.oE, D,Og 0.10 0.10. 0-11 O.Og 0.11 0.0g 0,O6 0.0.5 0.09 0_O9 0.0g 0.06 0.Og
IlL C_D[_I * * " * " *
B. EXTERNAL SOURCES 0_'3 0.46 0.26 0.25 0.2'0 0.28 0.22 ' 0.23 0.19 0,10 0.20 0.21 0.23 0,26 0.35 0.57
1. 5 hares frorn Ne.lJonal Taxes_ 0.20 0.40 0,23 0./P',_ 0,27 0,25 0.10 0.21 0.17 0.15 0.18 0.17 0.20 0.22 0,33 0.'_82. Gmrkts in Ak_ 0,02 0.02 0.01 0.02 0.01 0.01 0.ol 0.01 o.01 0.0o 0.133 0,03 0.03 *3. Inter - Ioc.al Go_'.m_t Tra r_,e"_ * *
4, Bo_'owingt 0.01 0.0_ 0.01 0.02 0.01 0.02 0.02 0.01 0.01 0,01 0_o1 0.02 0.07
TOTAL |N(;_V_ & _I_._FIOINARY
RECES_TS & BORROWINGS (A+B) 0,60 0.64 0.64 0.73 0.75 0.72 0.57 0,59 0.54 0.40 0.51 0.54 0.6o 0._1 o.68 1,0o0
N. ALLMUNICIPAUT1E$ 1981.,,-91 lt_'2,,-_3 1_1,,-93 1981 1982 1983 1984 19_.5 1008 1987 1988 1989 lggO 1991 1992 lO03average 8_"a ge _¢age
A. LOCAL SOURCES 0,30 0.45 0.'L_ 0._N_ 0.34 0.33 0`26 0`27 0.29 0.27 0.27 0.L>g 0.33 0.3_ 0,_L3 0.5_
L TaxRew_,"_._ 0,:Zl 0.34 0,23 0.25 0.24 0.23 0.16 0.10 0.20 0,18 0.17 0.16 0.23 0.22 0.23 " 0.44
1, Re_l P ropedy T_l_e,a_ 0,12 0.13 0.12 0.15 0.14 0.13 0.11 0,11 0.12 0.11 0.0_ 0.10 0,14 0.13 0.12 0.15Other= 0.00 0._'1 0.11 0,t0 0.10 0.10 0_08 0.08 0.08 0.08 0.0_ 0.09 0,00 0_og 0.12 0.3
I1. Opere, tlng & Mts_ Reve_.K_ 0,00 0.11 0.10 0.10 0.10 0,10 0.08 0,o5 0.08 0,og 0.0g 0.10 0,10 0.10 0.10 0.12
Itl. C..apl_ • - * - * ° ° "_"__ *
_,, EXTERNAL SOURCES 0,30 0.58 ,, 0.34 0.24 0.29 0.28 0, _'_ 0.23 0,2"3 0.21 0,41 0,34 0.41 0.46 0,50 0.6,0
1. _harasltomNsSon_Texe,s_ 0.2'3 0,_ " 0.28 0`21 0`25 0.25 0.20 0.21 0.20 0,10 0.22 0`23 0`27 0.33 0.47 0.82
2. Grants In Ak:_ 0.07 0.02 0_06 0.0_ 0.03 0.02 0.02 0-02 0.02 0.02 _ 0.19 0.11 0.14 0.13 0.02 0.02_. Inter -to<:al _ Tr_r, sa_l '_ * * * * * ° *
4. Bovrowh'tt_ 0.01 * * * - "- 0.01 0.015. Ott_ ° " " * - - ° " *
TOTAL IN_'OMI_ & EX'TI:tAORDINARY
RECeipTS & B(_=tRC)IN1NGS (A+B) 0,80 1.03 0.87 0.$0 0.G3 0.01 0,49 0.50 0,51 0,49 0,87 0.03 0.73 0.79 0.83 1.22
° L_s than .01%.
FN: LGUW_AB.wkl
_ed as of M_y 30, lg05

Tab_ 9.b
REVENUE _lr'R_ OF ,N,.L LOP.JU_ G(_NBRNIk_NTS; 19a1--lDr'Z (F_TIO TO TOTN_ INCOME in %)
(,.I. ALLLGUs 1081-_1 1992-93 1981-93
w_mgn average averagQ 11351 19_ 1983 1954 190 ¢; 1986 1967 1988 1989 1990 19'91 1992 1993
A. LOCAL SOURCES 5J0.73 40,13 49,10 56.17 52,69 52.48 52.74 51.09 53.30 54.79 41,32 50.82 48.82 44.07 40.26 40.00
L TsxR_ 34.78 29.42 _3,94 41,28 97,70 38.57 36,26 34.10 37.96 38.41 28.75 30.85 31.53 29.21 27.98 30.88
1. Reel Property Tax4H; _'1,31 14.21 20.22 25.30 23.45 22.45 22.28 20.81 24.02 23.62 16.99 17.91 19.56 17.96 15.72 12.712. Oth_n; 13.45 15,21 13.72 15.90 14,25 14.12 14.00 13.49 13.95 14.59 11.78 12.64 11.97 11,24 12.27 18.15
It, Spar ating & Mist Reve,nue¢ 15.30 10.10 14,$0 14.74 14.83 15_71 18.39 15.81 15.27 16.26 12.47 18.00 15.94 13.85 11.13 9.07
IlL Caplfi ,,I 0.66 0.60 0.66 0,14 0.18 0.16 0.07 0.18 O_06 0.10 0.11 4.28 "1.19 1.02 1_14
B. EX'TERNAL SOUR_5 49,27 59.87 50.90 43.8,3 47.31 47.54 47.26 48.91 45,70 45.21 5J__68 49.18 51:38 55.93 59.74
1. She,r,_; lrom Na(k:md Tsxe¢ 38.S1_ 55.82 39.54 33.29 3S.Z2 38,66 37.94 36,73 37.51 37.82 31.37 82.G3 36.89 39.?7 56,0_ 55,4_2. Gtsnts In Aide 11.42 1.72 0.93 0.31 7.75 8.75 7.14 8.79 6.4e, 7.10 28.91 18.O8 14.12 14.21 1,96 1.463. inlet - Io¢:_1_ Trm-Ba_-'_ 0,06 0,02 0.05 0.02 0,02 0.12 0.07 0.05 0.07 0.14 0.05 0.05 0.01 0.01 0.02 0.02
4. Borrowing= 1,08 2.29 0.25 ?_04 1.14 1.90 2.03 0.93 0.57 0.15 0.25 0.31 0-51 %88 1_53 3.045. OthQ_ 0.14 0.03 0.12 0.16 0.18 0.12 0.08 0.39 0.07 0.20 0.10 0.11 0.04 0.0_ 0.o4 0.02
TOTAL tNCOk_ & EXTRAORDINARY
RECEIPT5 & BORFOW'IN GS (A 4-B) 100.00 lO0.nn 100.00 100,00 100.00 100. nn 100. nn 100. nn 100.C0 100. nn 100.CO 100.CO 100.00 100.00 100.00 100.00
I. AU,.PROVINCE5 1961-91 1992-93 1981.-I;=3
aver=ga average avara9e 1981 1982 1983 1984 1955 1986 1967 196,6 1989 1990 1991 1992 1993
._ LOCAl SOURCE5 36.02 26.18 34.51 38.76 .'7.47 36.30 37.34 34.66 34.67 35.36 23.16 45.74 38.69 31.11 28.54 23.62
I. Tn!<Ray,muss 20.15 15.49 19.43 24.80 22.34 22.10 21.70 18.75 22.73 24.21 15.82 16.98 17.31 14.93 15.32 15.56
1. Real Property Ta]¢es 16.11 12.21 15.51 19.31 18.23 17.20 16.97 14+71 10.51 19.79 12.78 13.62 13.93 11.92 13.16 11.262. Others 4.04 3.28 3.92 5.40 4.11 4.91 4.73 4.04 3.91 4.42 306 3.37 3.38 3.01 2.16 4.413
IL. OperalJng & Mis.c. Raver,.,es 14.48 8.58 13.57 13.81 15,03 16.C_0 15.52 15.43 11.88 12.01 7,24 15.90 2O.97 15,67 9.08 B.09
In. capital 1.39 2.11 1.50 0.34 0.11 0.20 0.12 0.48 0.07 0.14 o.og 12.86 1)_41 0,$1 4.15
B, E-XTERNAL_;OURCE$ 83.98 73.82 05,49 61.24 62.53 61.70 62.66 65.34 (_5.33 . 63.54 75.84 54.26 61.31 68.89 71.46 76.1e
1. Shatas from NafJonal Taxe_; 39.35 69.4g 43.99 36.31 41.17 41.28 41.66 40.35 43.1)6 46,31 29.32 29.38 41.73 42.30 60.35 72-512. Grsnt_ in Aids 22.80 3.33 19,81 22.68 19.21 17.14 18.42 _'3.42 21.99 18.04 47.11 24.23 19.25 21.33 4.24 2.423. Inter -Ioc:_l Goven,_ent Tra_.a¢ti 0.16 n.02 0.14 0.09 0.06 0.43 0.22 0.00 0.19 0.46 0.15 0.11 0.03 0.1)4 0.03 0.014. Borfowlngs 1.42 0.95 1.35 1.96 1.57 2.52 2.11 1.24 0,02 0.36 0.05 0.45 0.17 5.22 0.79 1,115+ Othe_ 0.24 0.03 0._'1 I).21 0.52 0.32 0.25 0.33 0.07 1),48 0.21 0.11 0.13 0.01 0.03 0.03
TOTAL INCOME & F.JC_AORDINARY
REC'EIPT5 & BORROWINGS (A+B) lOO.00 100.(_ 100.00 10o.00 100.C0 100.m 100.00 100.C0 100.CO 100.00 100.00 100.00 100.C0 100.00 100.00 100.00
I, ALL C.,ITIE8 1981-91 1992-93 1981-931981 1962 1963 1984 196_ 1986 1987 1988, 1989 1990 1991 1992 1993
A. LOCAL SOURCE5 62.21 46.09 59.73 65.09 51,56 61.42 61,68 60.60 85.01 66.60 61;33 81.69 61.09 57.98 48.59 43.59
I. Tax Rev_a"tues 45.95 35.68 44.37 51,74 47.60 46.42 45._4 42.51 48.17 49.33 45.42 44.59 42.84 41.43 38.75 34.601. Real Propew Taxe.= 2_,30 17.06 24.93 30.12 26.(;0 26.94 26.25 23.90 27'.99 28-53 25.03 24.32 24.88 23_96 19.45 1,4.722. Othe_ 19..59 18,59 19,44 21.62 19.77 19.48 18.99 16_51 20.18 20.80 2O,40 20.27 17.95 17.47 17,31 19.86
IL Op efallng & Misc. Revent.m.s 15.R6 10.27 14.82 13,33 13.67 14.aJ5 16.80 18.04 16.81 17.22 15.79 18.26 15.41 14.19 11.65
111. C:epl_ 0.80 0.14 0.53 0.01 0.11 0.14 0.04 0.06 0.03 0.05 0.18 0,54 2.8.4 2.36 0.19
B. EXTERNAL SOURCES 37,79 53.91 40.27 34.91 38.4_ 38.58 36.12 39.40 34.99 33.40 38_67 38.31 38.91 42.02 51.41 56.41
1, Shares from Natlc_d Te.xez 32_85 48.27 35.2_ 2_.81 35.42 34.89. 33.34 35.09 31.36 30.39 31.83 31.43 32_71 35.30 47.89 45.572, Bran= In Aide 3.39 0.44 2.93 1,73 2.05 1.73 1.45 1.95 2.55 2.77 8.11 8.29 5.08 5.57 0-30 0.57
" 3, Inter-lo_,lGoverre'r_.ntTr_r_.actl O.0_ 0.01 0.01 * 0,01 0.17 0,01 0,014. Bon'owing; 1.39 5.19 1.98 3.21 0.86 2.10 3.30 1.46 1.02 0.08 0.65 0.42 1.11 1.12 3.10 7.27
_, Othen; 0.14 0.01 0.1_' 0.17 0.09 0_06 0.01 0.73 0.05 0.17 0.08 0.15 0.00 0.03 0.02
TOTAL INCOME & EXTRAORDINARY
RECEIPTS & BORROWINGS {A+_) 100.0o 100,00 100.00 lOO,00 100.nn lO0.co 10o.0o 100.00 100. nn lOO_Co 10o.00 100.00 lOO.00 1oo.00 100.00 100.00
I, AL.LMUNICIPALITIEs 1981.-.91 lg92-93 1961-4_3
Bvera_eaverage avetaoj_ 1981 198;?. 1983 1984 1985 1966 1967 19_ 1989 1990 1991 . 1992 1993
A. LOCAl,. SOLIRCE5 50.67 43.08 49.67 _9.75 54.4_ $3,76 5.4.49 54,42 55.50 56.13 39174 45.64 44.36 41,34 40.07 46.10
t, Tsx Revenues 34,93 32.1.3 34,50 4_0 38.10 37.10 37,57 37.77 39.12 37,64 25,77 29.57 30,7$ 28.61 27.081. Real Propert,j Teme_; 2_.35 12.99 19.21 24._; _2.22 21.58 21.92 21.96; 23.g0 21.99 14.o8 15._0 18.56 17.07 14.122. Others 14.58 19.14 15.28 1_.55 15.88 15+52 15.65 15.61 15.23 15_85 11.71 13.87 12.20 11.64 13.88 24.42
n, op era ring & MIs¢ RewL,,nLV_ 15.78 10,62 15.O2 17.4_ 18.04 16.48 16._6 16.59 15.30 18+38 13.86 15_85 13.40 12.45 11.88 g+7_
IlL Capital 0.16 0.13 0.15 0.13 0.28 0.19 0.08 0.06 0.07 0.11 0.10 0.23 0.21 " _'.':._6 0.21 0.06
B. __X3_RNAL SOURCES 49.13 ,_6.92 _50.33 40.25 45,5,8 48.24 45.51 45.58 44.50 43._,7 60.20 54.38 .5,5.54 $6.85 59.93 63._')
1. Shares from Natk:n_l "l,_xes 38,45 54,32 40.g0 35.03 39.16 41.13 40,31 41.56 39.65 38.85 32,$6 36.32 36.95 41+68 56.91 51.55
2. G*'an=lnAld¢ . 10.17 1.86 8.69. 4.4_ 5.27 3,95 4.70 3.93 4.18 5.0£; ' 27.55 17_63 16.45 18_S0 2.08 1.653. Inter-So=al _1Trarma¢:_ 0.02 0.03 0.02 " -_ " 0.01 * 0.0_ 0,0$ 0_03 0.01 0.01 0.02 0.O44, _Jo_owlngs 0.44 0.85 0.48 0+68 1.13 1.14 0.48 0.04 0.54 0-07 "0.10 0.11 0.22 0.37 0.68 0.84
5. Other= 0.05 0.04 0,05 0.12 0.(;Q 0.02 0.02 0.05 0.07 0.O4 0.05 0.07 0.01 0.11 0.07
TOTAL INCOME & EX'1RACIRDINARY
RECEPTS & BORROWINGS (A+B) 100.00 100.00 100.00 100,00 100.00 100.00 100.00 100.00 100.00 lO0.nn 100.00 100.00 100,00 100.00 100.00
FN: LGUW_�AB.wkl --
revised as c_ May 30, 1995

T_tbl_ G.¢
REVENUE STRUCI1JrlFE OF ALL LOCAL GOVERNMENT5:'1951-1M3 (REAL PERCAPITA IN 11)85 PRICES'}
L ALLLGUs 1991-51 1992-93 1901-934v_j_ _vera_ mp 1001 1982 1953 19_4 1905 1986 1087 1958 1959 1990 1991 1992
LOCAL SOURCES 97.51 112,75 99,55 129,50 126.79 121,91 85.49 72,54 50.05 76.90 77.65 07,6,5 100.90 96.18 21.50 134,09
L 7sx Re_e_ 06,57 63.51 59,43 95.23 00.71 84,99 58,70 53.08 57,03 53,0"2 54.03 58.70 55,43 53.74 53.51 103,48I. Rnl Property T_ 4%00 :_,15 40,71 95.54 55,42 52-15 36,10 32,08 35.00 33.43 31,93 34,41 40,59 39.20 35,73 42.602, O_hers 25.68 44.38 28,7"2 36.87 34.29 32.51 22.55 21,00 20,25 20,43 22,09 24.21_ 24.34 24+53 27.66 80,55
It. Oporstk_ & Mi*¢, R_ 20.20 27.85 _)_07 34.01 39.68 36,3t 28,5_ 28.17 22.94 22.8':' 23.43 30.73 33.08 30.23 28,30 30,40
Ilt. G_lld 1,34 1,41 1_35 0.33 0.40 0.41 0.11 0,25 0.09 0.13 0.20 6.22 2.35 2.22 2,53 0.23
¢;, Ex'nERNN_ _P_II_RC:E_; 98.01 166,41 106.31 101,11 113.84 110.49 76.56 76_13 70,15 63.45 110.25 94.50 109,53 122,05 135.50 201,12
1, Sharea krom NelloMI "fu_N 70.37 159._5 83.40 70.79 91.97 39.85 61.46 80.30 50,35 52`90 56,26 62.59 76.15 80.76 127,42 153.97
2- Gre_ In AJ¢ls _2.11 4.70 19,43 19,16 10.65 .1S.U 11.57 13,66 12,73 9,97 50.57 30.90 29.31 31,01 4.$1 4.59'3. Int_.r-local Gm_fn.'ite_ Ttlme."J( 0_T0 0.CG 0.09 0.06 0,04 0.25 0.11 0.10 0,11 0`20 0,09 0,09 0.03 0.03 0.04 0.1_
4. B_n'owk_js 2.17 6-83 2.89 4.71 2,75 4.41 3.20 1.45 0.56 0.21 0.47 0.60 1,06 4.09 3,43 10.185, Othart 0.26 0.08 0.;[3 0.38 0,44 0.23 0,13 0,61 0.10 0.20 0.20 0.22 0.08 0.13 0,10 0.06
TOTAl. INCOME & F,.XTR_ORBNARYFtECEII_r_;& II_ORROWJNGS(A +B) I92`52 _1.17 208.18 230.57 240.53 232.40 15"2.01 155.67 150.21 140,36 137.94 192.15 207.52 215,23 227.30 339`21
|. AL/PROVINCE5 1991-91 lg_2-93 11_1-93eversg I s_.rega sverage 1961 1952 1983 1954 1985 1955 1987 1968 1959 1990 1991 1992 1993
A. LOCAL SOURCES 24.23 21.';7 23._. 30,91 30.68 31.35 20,81 lg.72 15.17 17,02 16,48 33.97 25.06 22.40 19.45 23.71
t. TtAXR_nues 13.45 13.01 13.39 lg.75 8.20 15,09 12,0_ 10.67 11.91 11.33 11.26 12.61 11.21 10,75 10,4"4 15.591, ReelProl:>efly T4xes 10.74 10,09 10.64 15.40 t4.96 14.07 9 45 8,37 9,65 g.26 9,05 10_11 g.03 B,58 8,97 11`212. C,h_s 2.71 2.93 2.75 4.35 3 36 4,02 263 2.30 2,05 2.07 2,15 2.50 2`19 2.17 1.47 4,30
it. Opersttng & Misc. Re.._ _u._ 9,75 7.11 0.3,5 10,65 12.31 13.09 8,65 5,75 9,22 S.62 5.15 11.31 13.58 11,2B 6,17 5.0_
III. C_pt_al 1.02 1.45 1.09 0.27 0.09 0,17 0,07 0.:>7 0,04 0.07 [},07 g.35 0.27 0,37 2,53 0.06
B, EXTt_RNAL SOURCE5 42_51 62,_6 46.50 45.64 51.20 50.49 34.92 37.17 34,24 29.76 94,66 40.30 39.71 49.61 46.70 75.85
1, Shares 11om Nello _ ";_xet 26,00 58,6"5 31,I0 28,96 33.72 33,78 23._. 22.95 2"2.57 21.67 20.56 21.51 27.03 30,46 45,21 72.122. Grlmt_tnA_ll 15.44 2.58 13.47 1509 15,73 14.03 . 10.27 13.32 11.53 7,31 33.53 17.99 12.47 15.36 2,89 2.413, Irder-Iocat Go_-mmern Trar_ scl; 0,10 0,01 0.0g 007 005 0,35 o.12 0.00 0.10 0.21 0.11 0,06 0.02 0,03 0.02 0.014. _or¢owif_jt 1.02 0.52 O._H_ t.56 1.25 2,o6 1.18 0.71 0.01 0.17 O.0A 0.34 0.11 3.76 0.84 1.105. Ot t.mt_ 0.16 0.(T'_ 014 0.17 0.42 0.26 0.14 0,';9 0.04 0,22 0.18 0,05 0.08 0.00 0.02 0,03
TOTAL INCOME & EXTRAOR_NARY
R_CEIFIS & BORROWIN_;_; (A+ _ 67.05 53,53 69.63 79,75 51.69 51.&_ 3533 56.59 52.41 46,60 71.16 74.37 64.77 72,01 65._$ 99.56
I. ALLCITIES 1991-91 1_92-(_3 1951-53a_eragt avtr4_ge averso, 1981 1952 1983 1954 1965 1966 1957 1966 1959 1990 Ig91 1992 1993
A. LOCAL SOURCE5 205,70 210.03 20_.37 26394 251.40 2_2.50 186,o5 170,63 171.11 162.95 _65.13 _60_3_ 203.45 195.12 160.01 240._ 8
i. T_,_Re_,.J_s 162.75 163.36 154,41 225.74 216.45 195.61 136,02 110,61 126.76 1:_K).69 122`21) 130,33 142.67 139.43 13_,14 190.671. Real P1_f'ty T_xes 57.55 76,55 56.11 131.40 129.10 115,26 75.92 67,24 73.68 89.80 57.38 71.09 52.55 80,63 72.04 61.122, Others 64,93 66,60 &5.20 94.34 90.35 83.33 S7,0g 52,37 53,10 50.55 54.91 ¢;9.23 59,79 55.60 64,11 109.55
II. _er/_ti_& Misc. Re._mJ_t_ 5_.04 45.07 50,19 55.15 62.47 53,57 49.91 50.75 44.24 42-14 42.50 47.52 51.31 47.74 43.14 49,02
IlL C_plld 1_99 0.60 1.;'5 0.06 0,48 0,52 0,12 0.16 0,09 0.12 0.34 2.47 9.47 7.95 0,72 0,49
B. F..XTERNALSOURCE5 125.39 250,57 14.4.65 ' 152.31 175,57 169.0_ 114._0 110.57 92.09 51,73 104.10 111.97 129.59 141,40 190.43 310,56
1. ShaR's lto m N_1_'halT&x_1_ 100.23 220.41 128.33 130.06 161,84 148,43 100.24 05,74 82.33 74.36 65.71 31.87 10_.95 118.50 177,40 263,,562. Grent| In Aids 10,74 2,13 9.42 ?.53 9,39 7,39 4,35 3.49 6,72 6,77 16.44 16.39 16,9t 16.78 1,13 3.143. inter-local Go_,mn_rd Tr_rm4_'_ 0.09 0.03 0.04 0,00 0,00 0.00 0.04 0.47 0.00 0,00 0.(X_ 0.00 0.00 0.00 0.03 0,034. _o_owl_gs 4.93 25-76 B,14 t3,99 3.94 5,99 9.91 4.10 2.57 0.20 1.75 1.24 3.71 3.76 11.50 40,04S. OIh_rt 0,44 0.05 0.3_ 0.74 0.40 0.25 0.04 2`07 0,17 0,41 0.21 0.48 0,01 0.09 0.08 0,01
'TOTALINCOME & EXTRAOR01NARY
P_CEIP'r_ & BORROWING S (A+B) 331.09 ,1_0.50 351,1;_ 436,25 456,97 427,80 300,64 2&1,40 _-'_3.20 244.59 259,23 292.29 333,05 336.52 370.44 $51.0,4
l, PJ.LMUNICIPALITU_S 11;91-21 11_12-93 1951-93a_ra.R_ _,,m.tncle a,_rag_ 1961 II_92 1953 19G4 1955 1988 1957 1956 1989 19_0 199t 1992
LOCAL SOURCES 44.34 85.34 47.57 57.18 55.36 52.71 37.62 35.39 37.45 36._. 37.78 41.5_ 48.40 47.42 45.52 62.21
L TaX Revenue; 30,45 45,26 33.34 40.37 3_.76 35,37 25,94 24.56 " •26.40 24.59 24,49 _6.93 33,59 32,52 33.68 64,701. Resl Pmp4_ty Taxer 17.73 19.13 17.94 23.58 22.60 21.18 15.14 14._5 16.12 14,43 13.38 14.48 20.27 19.58 17,10 21.162. Othe_ 12.72 30.15 15,40 16.79 18_15 15.22 10,_0 10.25 10.27 10.26 11,13 12.45 12`32 13,23 18.75 43,54
6. Operating& MIsP_R_,_w..m_ 13.74 15.69 14.07 16.67 16.32 16.14 11.64 t0.79 11.o0 12.56 13.17 14.44 14.64 14.28 14.39 17.40
ILL CspIlal 0.15 0.10 0,15 0.13 0.20 0.19 0.04 0.04 0.0S 0.07 0.10 0.21 0.23 0.32 0.25 0.10
_. EXTERNAL SOURCES 44.09 64_3 50,27 38.50 48.37 45.34 3_1.43 29.64 30.03 28.78 57_25 49.52 50.79 67.25 72.58 96,13
1, Shares from Nstl_nd Taxe_ 32`59 79.79 40.95 33_51 39.53 40.32. 27._1 27.02 26_76 25.35 30.93 32`08 40.36 47.79 56._2 90.722. GmmsInAid'_ 2,'i'_ " 2.73 8,64 4._;_ 5.36 3.&7 3.24 2,55 2.52 3,32 26.18 16,25 20.15 18.92 2.$1 2`953. Irder - local _tr_menl Trsr_s¢t_ 0,01 0.04 0.02 0,00 D.00 0,00 0.00 0.00 0.04 0.03 0,00 0.03 0,01 0.01 _J)2 0.064_ Borrov_t D.41 0._ 0.50 0.65 1.15 1.11 0.33 0,03 0.36 0.05 0,09 0.10 0.24 0,42 0.82 1,155, O_harlt 0.0'5 0.06 0.05 0.11 0.02 0.0_ 0.01 0.03 0,05 0.02 0.04 0.05 0,01 0,13 0.0_ 0.04
_IOT_. INCOME & EX'II_AORDINARYRECEIPT_ & BORROWINGS (A + _ _4.42 142.67 97.54 95,56 101.73 95.04 59.08 8.5.03 57.45 55.59 95.01 91.09 109.24 114.70 121.10 171_.34
FN: LGt.NV_.wkl
as oi May 30,1995
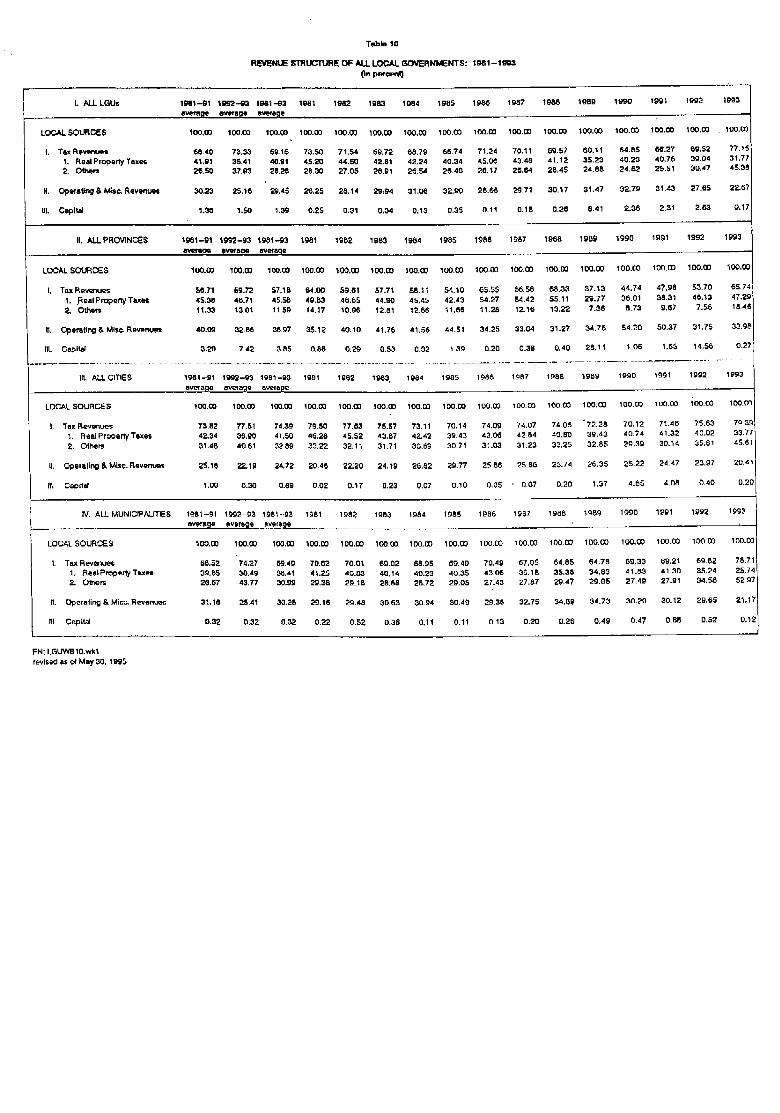
Table 10
RE'dENLE s'm_lE OF ALL LOCAL GOVERNI_ENTS: 1961-1_
Onp_
I, ALLLGUs 1_1-91 1992-93 1961-93 1981 1982 1983 1964 1985 1986 1957 19_6 1980 I990 199t 19.92 1993
.twemge ewerage _roge
LOCAL SOURCiE$ lOO._O 10o,(:o 10o_00 lOO.OO lO0,00 100,00 100,00 lO0.00 loo.oo 100.00 100,oo 100,Cz3 lOO.m lOO,(:o 100,00 , lOO.00
t. Ta,= R evem.m.; 68.40 73.33 69,16 73,60 71.54 89.72 68.79 68,74 71.24 70.11 69,57 60.11 64.56 66,27 69.52 77.15
1. Real Property Te_xel; 41+91 35.41 40.91 45.20 44.50 42.81 42.24 40,34 45.1X5 43_48 41.12 38.2'3 40,23 40.78 39.04 31,772. Othe_ 2_.50 37,rJ 28.25 28,30 27.05 26.91 26.54 26,40 26.1.7 2_,8.4 28.46 24.68 24,6_ 25.51 30.47 45.38
il, Operating & Misc. Revenues 30.23 25.16 29.45 26.25 28.14 29_94 31.08 32.90 28.66 29.71 30.17 31.47 32.79 31.43 27.65 22.67
IlL Capita/ 1.38 1.$0 1.39 0.2$ 0.31 0,34 0.13 0.35 oJ1 0.18 0,26 6.41 2.36 2.31 2.83 0.17
IL ALLPROV1NCE$ lg81-91 1992-93 1981-93 1981 1982 1983 1984 1985 1986 1987 1968 1989 1990 1991 1992 1993
avefa_ _etage _age
LOCAL SOURCES 1(]O.00 100.00 10o.00 10o.00 100,00 100.00 100.00 lO0,00 100_00 100.00 100.00 100.00 100.00 10o.o3 100.00 100.00
L Tax Re_ ,_,71 69.72 57.16 64,00 $9.61 57.71 58.11 .,54.10 65.55 66.58 68._'J 37.'L3 44.74 47,96 53.70 65.74 i
1..Fleal Properly T_e'= 45.58 48.71 45.58 49.83 48.65 44.g0 4.5,45 42.43 54._'7 54.42 55.11 29.77 36.01 38.31 46,13 47.29'2, Othe_ 11,33 13.01 11_59 14.17 10.96 12.81 12.66 11,66 11.28 12.16 13.22 7.38 8.73 9.67 7.56 18.46
IL Operating & Misc, Revenue= 40.Og 32.._ 38.97, 35.12 40.10 41.76 41.56 44.51 34.25 33.04 31.27 34.76 54.20 50.37 31.75 33.98
It[. CspltsI 3.20 7_42 3-86 0.88 0.29 0.53 0.32 1.39 0.20 0.38 0.40 28.11 1_O8 1.66 14.56 O.27
Ill. ALLCITIES 1961-91 1992-93 1981-93 1961 1982 1983 1984 1985 1986 1987 1988 1989 1990 1991 1992 1993average ev_age e=verege
LOCAL SOURCES lOO.00 100.00 100,00 100.00 100.00 10o.0o 10o.00 lOO.CO 1o0,00 loo,oo 10o,00 lOO,00 lOO.OO 1oo.oo i oo.00 lOO.m
I. Tax Rev_ues 73,82 77.51 74.39 79.50 77,63 75.57 73.11 70.14 74,09 74.07 74.06 "72.28 70.12 71,48 75.63 79.39
1, Real Property Tsxes 4?.,34 30.g0 41.50 46.28 45.52 43.87 42,42 39.43 43.06 42.84 40.80 39.43 40.74 41.32 40,02 33.772. OIhem 31.48 40.61 32.89 33.22 32.11 31.71 30.69 30,71 3%03 31.23 33.25 32.85 29.3o 30,14 35.61 45,61
IL Operaling & Misc. Revenue_ 25,18 22.19 24.72 20.48 22:20 24.19 26.82 29,77 25,8_ 25,30 25,74 26.35 ;'5.22 24.47 23.97 20.41
ml Cspilel 1.00 0.30 O_89 0,02 0.17 0.23 0.07 0.I0 0,05 ' 0.07 0.20 1.37 4.65 4,08 0.40 0.20
IV, ALL MUNICIPAU'T_S 1961-91 199"2-93 1981-93 Ig81 1982 1983 1984 1985 1986 1957 1988 1989 1990 1991 1992 1_3
averll._ _vgf_Oe iivet_oe
LOCAL SOURCES 100.00 100.00 100.00 100.00 lo0,00 100.00 lOO,O0 100,00 lOO,00 100,00 100,00' 100.00 lO0,00 lOO.00 100,00 lOO.1_
I. Teu_Rev_U_=; 58.5_' 74,27 69.40 70,62 70.01 69.02 68.95 69.40 70.49 67.05 64.85 64.78 69.33 69.21 69.82 78.71
1. ReelProp_rty "raxe= 32.65 30.49 58.41 41.25 40.83 40.14 40,23 40.35 43.08 39.16 35.38 34.89 41,53 41_30 35,24 26.742. Ofl'_em 26.67 43.77 30.99 29.38 29.18 28,88 26.72 29.05 27,43 27.87 29.47 29.05 27.49 27,91 34.58 52,97
I1. Operating & Misc, Revonues 31,18 25.41 30.26 29.16 29.48 30,63 30_94 30.49 29.38 32.75 34.89 34.73 30.20 30.12 29.65 21.17
nL Capital 0.32 0.32 0.32 0.22 0.52 0.36 0,11 0.11 0_13 0.20 0_26 0.49 0.47 0,68 0,52 0.12J
FN: LGUWB 10.wkl
revised as of May 30. 1995

T,._,kb11IMJOYANCYCOEFF_ OF LOCALLYGENERAT_
LG=JR_PV'E_TU_,lgC3-1gg3
1_-11_1 " lg,_ _ 1993= I gg2-93 b
Tci_d' R,_I d _m* Tc2_d" Rat, • Ba._e' TotaJ' Rate _ Base * TcCd* Rate d B*_e"
AI LGU= •
RPT .88 1.22. .72 ._ .03 1.64 3.37 1.5_Ob_erTcx_ .91 .l_ ._ 2.(_3 _.35 .70 15.40 15.05 .g7 10.Z2 11.77 .57
Tax Rwaou_ ._ 1.04 8.64 4.glNon-Tax Rwermesr 1.O1 -.81 3.4.8 1.O0
Lce-.Jd,_¢Jr_-.,Rw,nu,= .g7 .50 5.6g _L4_
Provtn¢_
RPT .75 1.{_ .70 1.5_ .S5 1._ 4.07 .g6OtherTnx*= .65 .M . ._ -2.63 -3.34 .71_ 25.07 25.96 .07 7.3J3 8.50 .S7
Tax Revenu*_ .7"3 .74 7+03 3.85Non-Tax Rev_u_ J 1.13 -4.14 4.75 -.71
Lcczd_:fJr¢* Rev_ut= 1.0 -.45 3.70 1.42
CtS,=
RPT 1.03 1.4_ .70 -.18 -.14 1.27 2.55 1.07O_*r Taxi_ 1.04 1.05 ._ ?_08 2.E5 31) 9.62 g,96 .97 6.38 7.33 " .57
Tax Revenues 1.00 38 5.88 3.30.Non-T_x Rev*e_Jesr 1.0_ -.1_6 2.67 1.20
Lce_.__>¢=urceRevenues 1.05 .16 5.07 ?..4_
RPT .82 1.07 .74 -.3_ -.21 1._ 3.g2 1.5_OtherTaxes .85 .86 .0_ 4.15 5.28 .Tg 20.42 21.15 .97 15.25 17.57 .87
Ta._R_eerues .84 1.44 1;LO_ 7,08Non-To( Rev_c_Je_ .64 1.15 3.58 ?-41
Loea.I$o_Jzc,Revenues ._ 1.34 g.47 5.60
• der_vec[ushg r_r_s.s_.._z_pproaz91
=I'aJ_OOfpercen_g, chang* _ revmu, to pttcmtage _m'_* _ Gt'JP_ of perce_g, ¢_'_r_geh rev_u$ to perc_t_g¢,¢h_ge in_ ba_e(___e-_l v'_JeforRPTand
• m_ of pccmb.ge d,.u_g, i_ taxb_,._eto p_=enlage ¢I'¢_g, _•xckJdes revenues _'c,m_ of _Le,._e_