return on investment (roi) analysis of employee assistance ......return on investment (roi) analysis...
TRANSCRIPT
Return on Investment (ROI) Analysis of Employee Assistance Program:
Employer Case Study of Piraeus Bank
Mark Attridge, PhD, MA President, Attridge Consulting, Inc.,
Minneapolis, MN, United States
May 17, 2016
Keynote Presentation at 5th EAP Forum
EAP & ROI Proven Workplace Outcomes
Hotel Royal Olympic, Athens, Greece
Dr. Mark Attridge President of Attridge Consulting, Inc. Based in Minneapolis, Minnesota, USA Managed Research Department at Optum Led Data Cooperative at Watson Wyatt Past Chair of EAPA Research Committee 2009 Award from EASNA for Outstanding Service to EAP Field Created over 200 scholarly papers, presentations, and trainings Ph.D. Psychology (Social) from University of Minnesota M.A. Communication from University of Wisconsin-Milwaukee (612) 889-2398 [email protected] Website: www.attridgeconsulting.com
2
© 2
01
7 -
Att
rid
ge
Con
su
ltin
g, In
c.
OUTLINE Part 1 – Starting Context & Conceptual Model Part 2 – Productivity Path (Absenteeism & Presenteeism) Part 3 – Pareto Path Part 4 – Primary Path Part 5 – Replication in Past Years 2014 & 2015 Part 6 – Results if Include Productivity Multiplier Part 7 – Partnership Path & Beyond ROI
© 2
01
7 -
Att
rid
ge
Con
su
ltin
g, In
c.
3
ROI
Primary Value
Productivity Value
Pareto Value
Partnership Value
4
© 2
01
7 -
Att
rid
ge
Con
su
ltin
g, In
c.
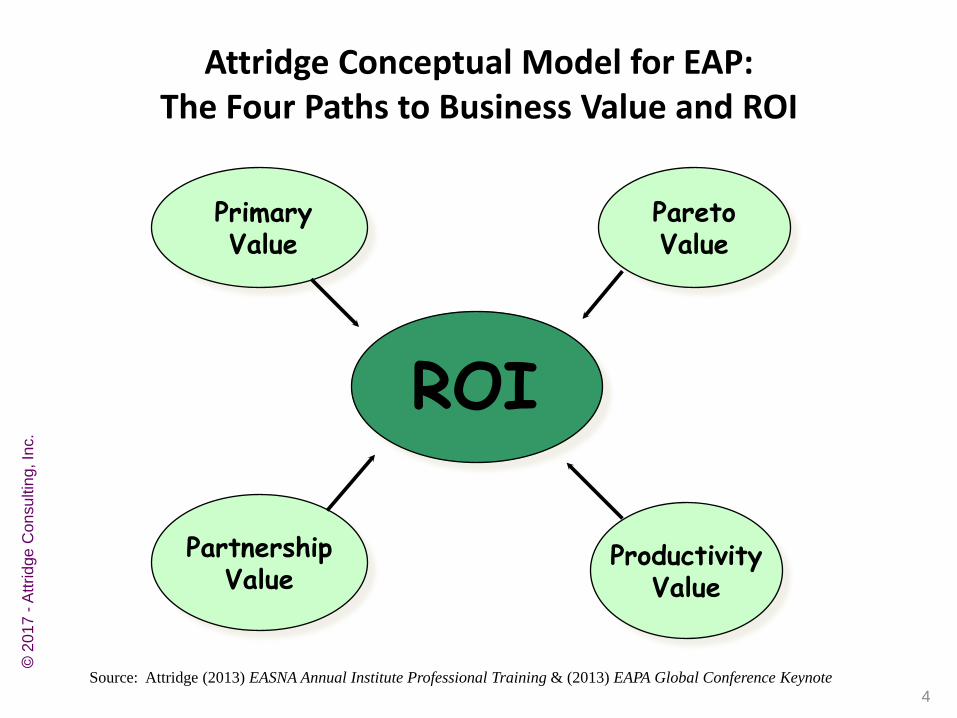
Attridge Conceptual Model for EAP: The Four Paths to Business Value and ROI
Source: Attridge (2013) EASNA Annual Institute Professional Training & (2013) EAPA Global Conference Keynote
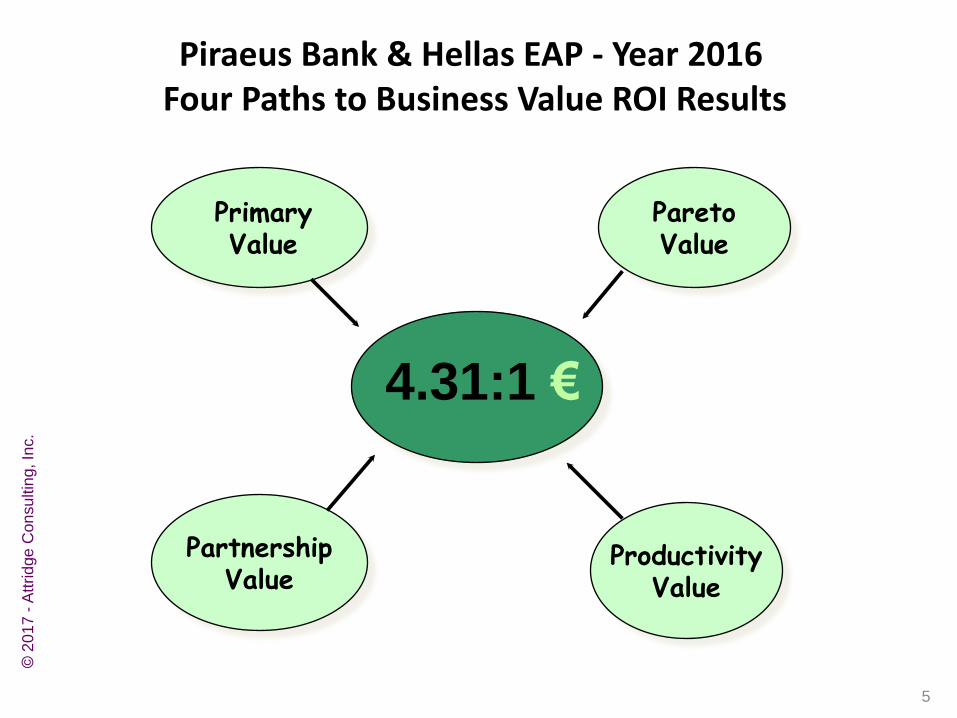
Piraeus Bank & Hellas EAP - Year 2016 Four Paths to Business Value ROI Results
4.31:1 €
Primary Value
Productivity Value
Pareto Value
Partnership Value
5
© 2
01
7 -
Att
rid
ge
Con
su
ltin
g, In
c.
PART 2
Results at Piraeus Bank in 2016
Productivity Path ROI
© 2
01
7 -
Att
rid
ge
Con
su
ltin
g, In
c.
6
ROI
Primary Value
Productivity Value
Pareto Value
Partnership Value
7
© 2
01
7 -
Att
rid
ge
Con
su
ltin
g, In
c.
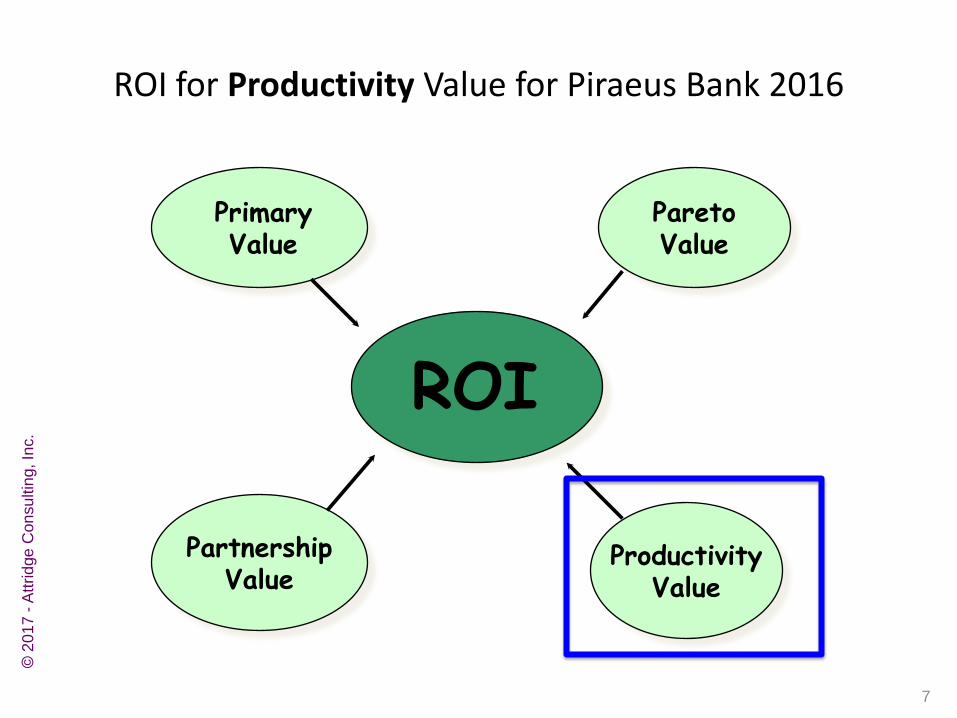
ROI for Productivity Value for Piraeus Bank 2016
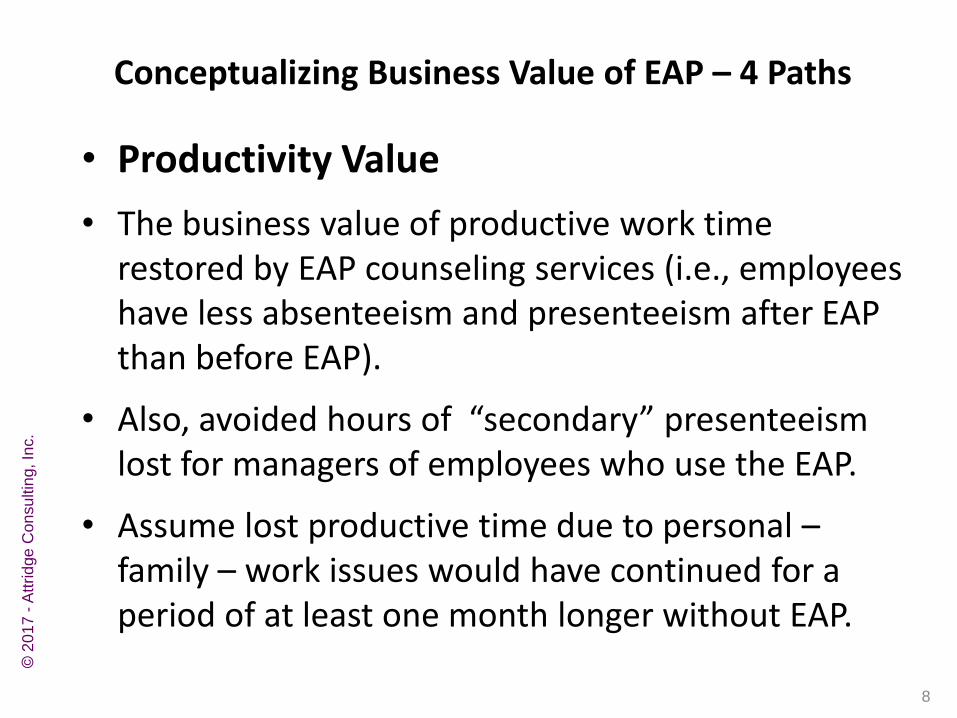
• Productivity Value
• The business value of productive work time restored by EAP counseling services (i.e., employees have less absenteeism and presenteeism after EAP than before EAP).
• Also, avoided hours of “secondary” presenteeism lost for managers of employees who use the EAP.
• Assume lost productive time due to personal – family – work issues would have continued for a period of at least one month longer without EAP.
8
Conceptualizing Business Value of EAP – 4 Paths
© 2
01
7 -
Att
rid
ge
Con
su
ltin
g, In
c.
Change in Lost Productive Time
Employee Users of EAP
Face to Face Counseling
© 2
01
7 -
Att
rid
ge
Con
su
ltin
g, In
c.
9
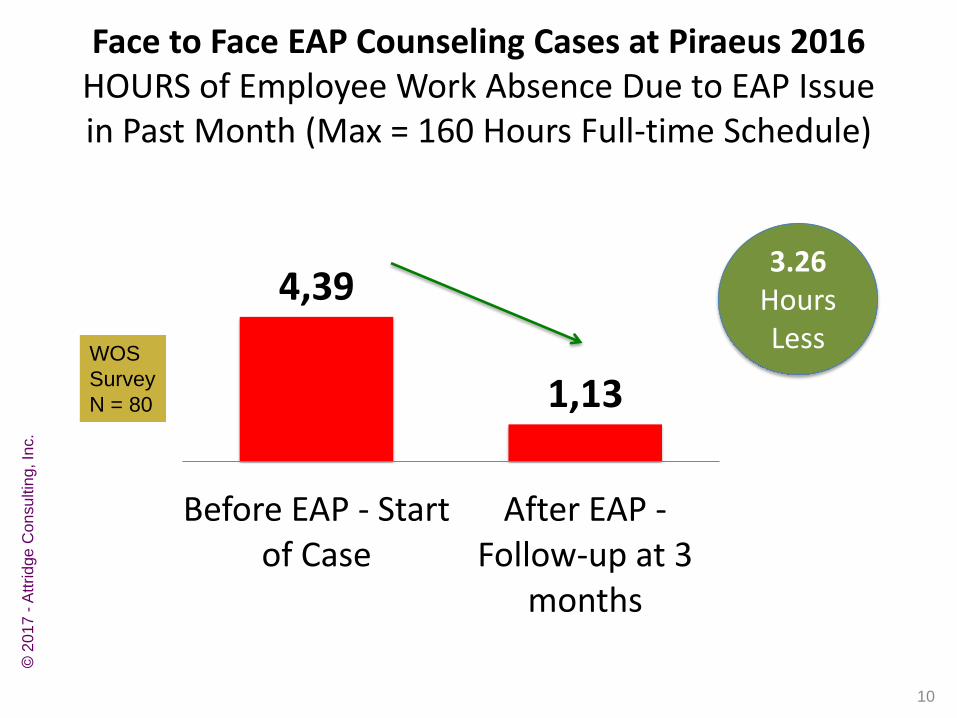
4,39
1,13
Before EAP - Start of Case
After EAP - Follow-up at 3
months
Face to Face EAP Counseling Cases at Piraeus 2016 HOURS of Employee Work Absence Due to EAP Issue in Past Month (Max = 160 Hours Full-time Schedule)
WOS
Survey
N = 80
© 2
01
7 -
Att
rid
ge
Con
su
ltin
g, In
c.
3.26 Hours Less
10
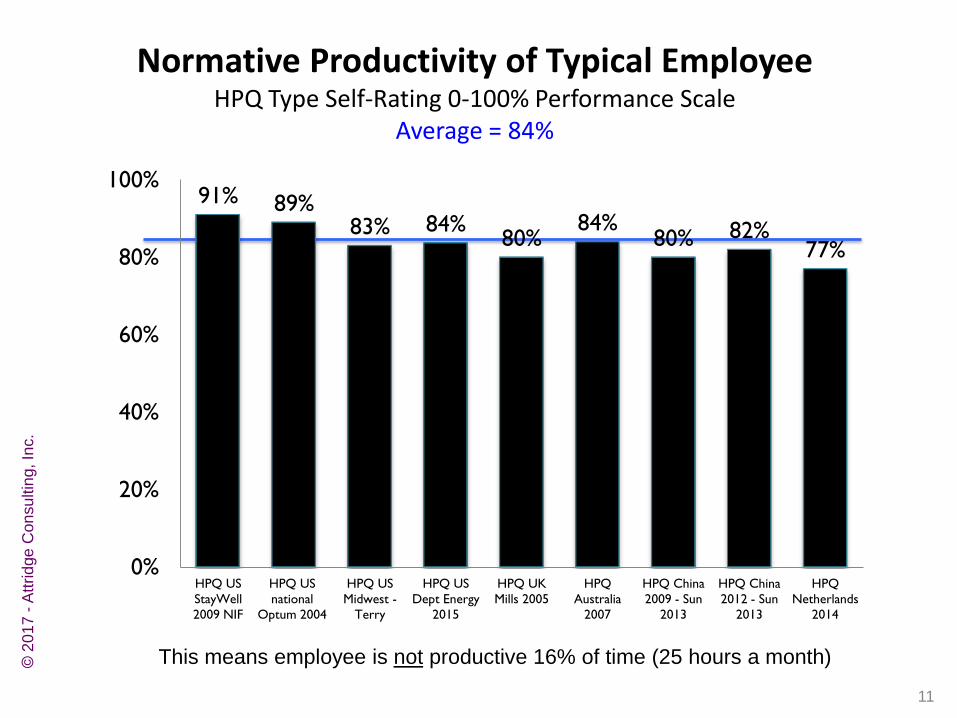
Normative Productivity of Typical Employee HPQ Type Self-Rating 0-100% Performance Scale
Average = 84%
91% 89% 83% 84%
80% 84%
80% 82% 77%
0%
20%
40%
60%
80%
100%
HPQ US
StayWell
2009 NIF
HPQ US
national
Optum 2004
HPQ US
Midwest -
Terry
HPQ US
Dept Energy
2015
HPQ UK
Mills 2005
HPQ
Australia
2007
HPQ China
2009 - Sun
2013
HPQ China
2012 - Sun
2013
HPQ
Netherlands
2014
This means employee is not productive 16% of time (25 hours a month)
11
© 2
01
7 -
Att
rid
ge
Con
su
ltin
g, In
c.
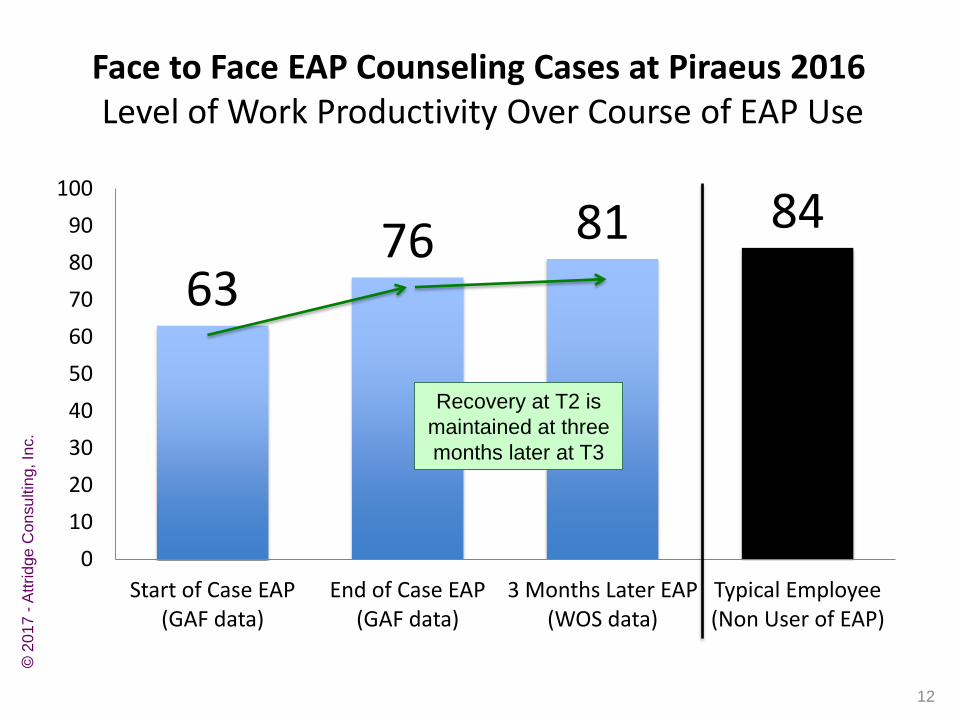
63 76 81 84
0
10
20
30
40
50
60
70
80
90
100
Start of Case EAP (GAF data)
End of Case EAP (GAF data)
3 Months Later EAP (WOS data)
Typical Employee (Non User of EAP)
Recovery at T2 is
maintained at three
months later at T3
© 2
01
7 -
Att
rid
ge
Con
su
ltin
g, In
c.
Face to Face EAP Counseling Cases at Piraeus 2016 Level of Work Productivity Over Course of EAP Use
12
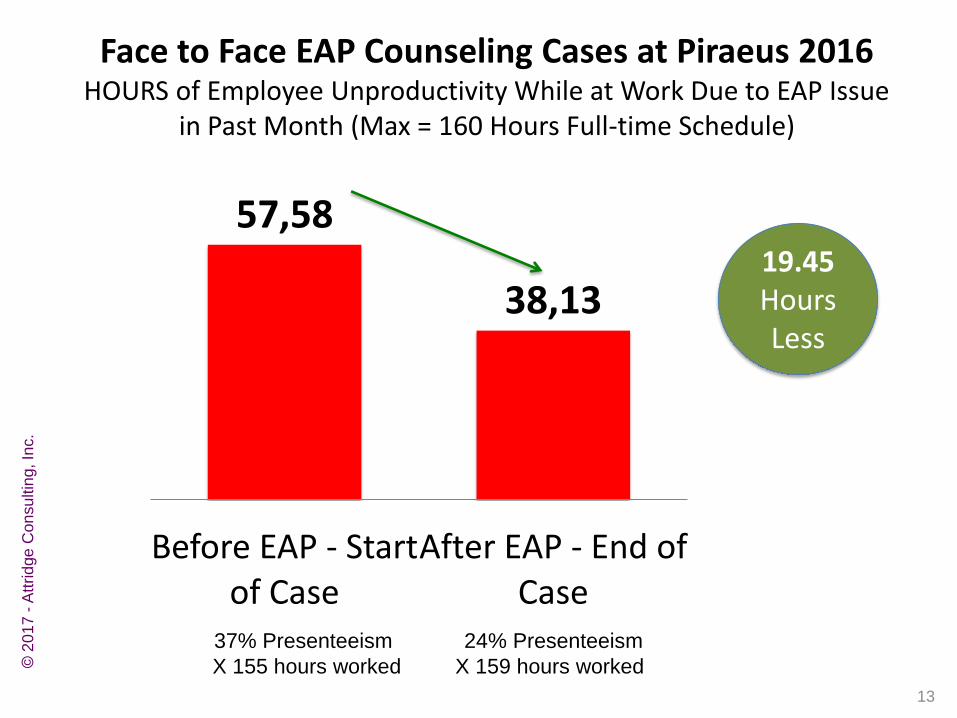
57,58
38,13
Before EAP - Start of Case
After EAP - End of Case
Face to Face EAP Counseling Cases at Piraeus 2016 HOURS of Employee Unproductivity While at Work Due to EAP Issue
in Past Month (Max = 160 Hours Full-time Schedule)
37% Presenteeism 24% Presenteeism
X 155 hours worked X 159 hours worked © 2
01
7 -
Att
rid
ge
Con
su
ltin
g, In
c.
19.45 Hours Less
13
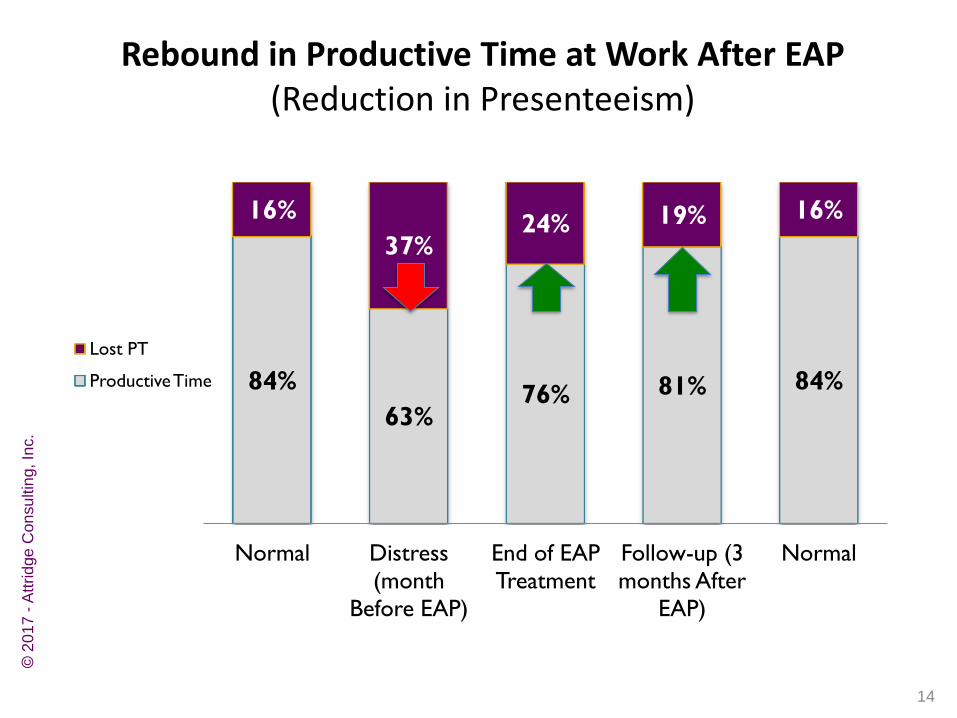
84%
63% 76% 81% 84%
16%
37% 24% 19% 16%
Normal Distress
(month
Before EAP)
End of EAP
Treatment
Follow-up (3
months After
EAP)
Normal
Lost PT
Productive Time
Rebound in Productive Time at Work After EAP (Reduction in Presenteeism)
14
© 2
01
7 -
Att
rid
ge
Con
su
ltin
g, In
c.
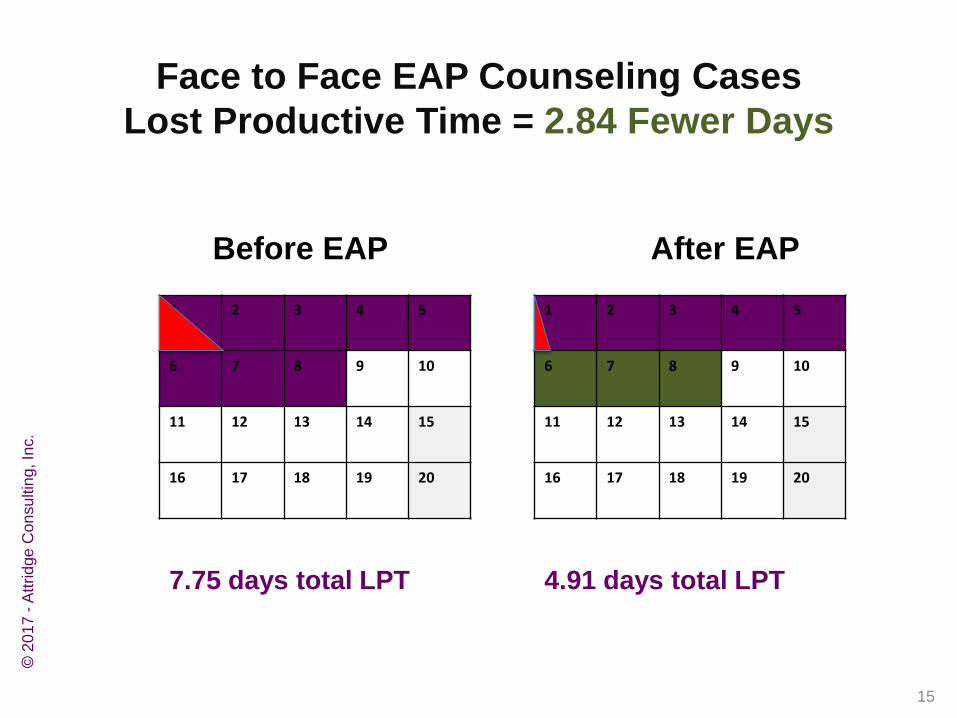
1 2 3 4 5
6 7 8 9 10
11 12 13 14 15
16 17 18 19 20
7.75 days total LPT
Face to Face EAP Counseling Cases
Lost Productive Time = 2.84 Fewer Days
15
1 2 3 4 5
6 7 8 9 10
11 12 13 14 15
16 17 18 19 20
4.91 days total LPT
Before EAP After EAP
© 2
01
7 -
Att
rid
ge
Con
su
ltin
g, In
c.
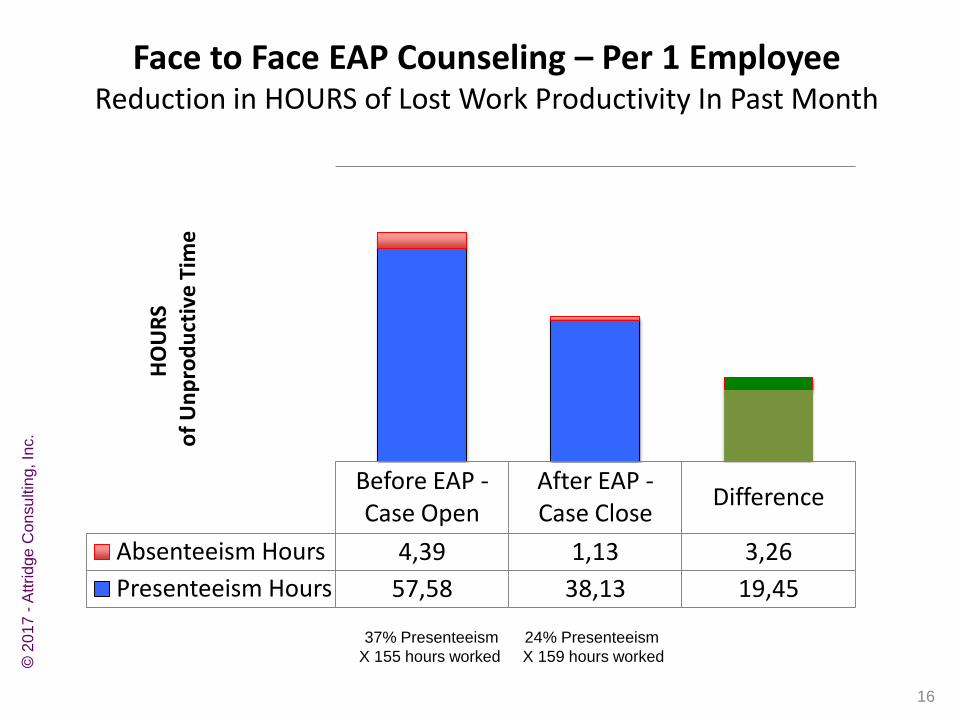
Before EAP - Case Open
After EAP - Case Close
Difference
Absenteeism Hours 4,39 1,13 3,26
Presenteeism Hours 57,58 38,13 19,45
HO
UR
S o
f U
np
rod
uct
ive
Tim
e
16
Face to Face EAP Counseling – Per 1 Employee Reduction in HOURS of Lost Work Productivity In Past Month
© 2
01
7 -
Att
rid
ge
Con
su
ltin
g, In
c.
37% Presenteeism 24% Presenteeism
X 155 hours worked X 159 hours worked
Before EAP - Case Open
After EAP - Case Close
Difference
Absenteeism Hours 4,39 1,13 3,26
Presenteeism Hours 65,36 38,13 27,23
HO
UR
S o
f U
np
rod
uct
ive
Tim
e
17
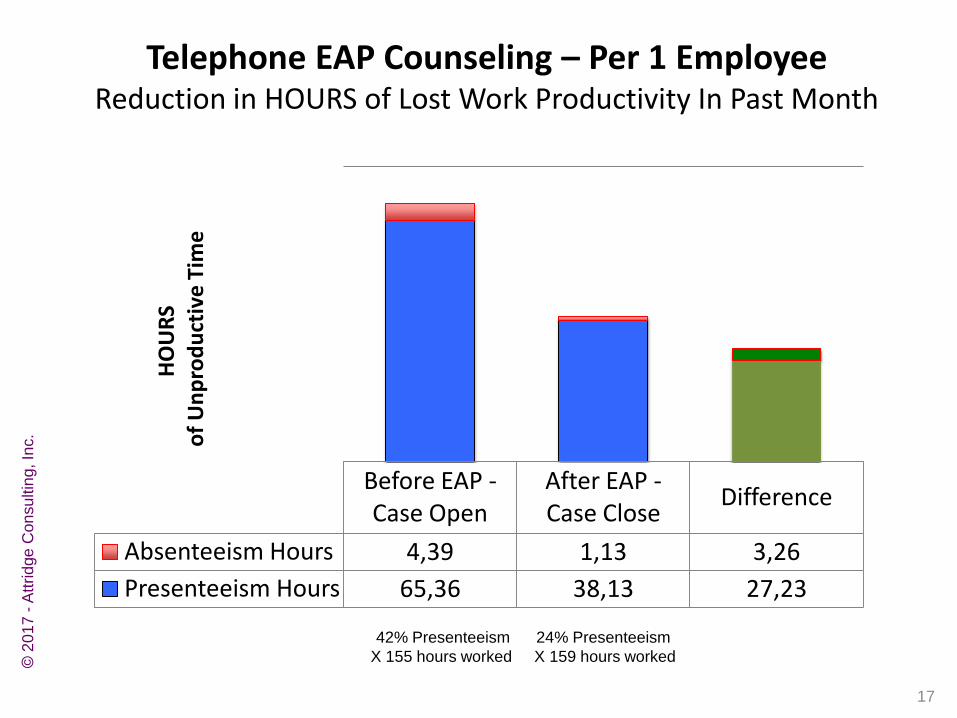
Telephone EAP Counseling – Per 1 Employee Reduction in HOURS of Lost Work Productivity In Past Month
© 2
01
7 -
Att
rid
ge
Con
su
ltin
g, In
c.
42% Presenteeism 24% Presenteeism
X 155 hours worked X 159 hours worked
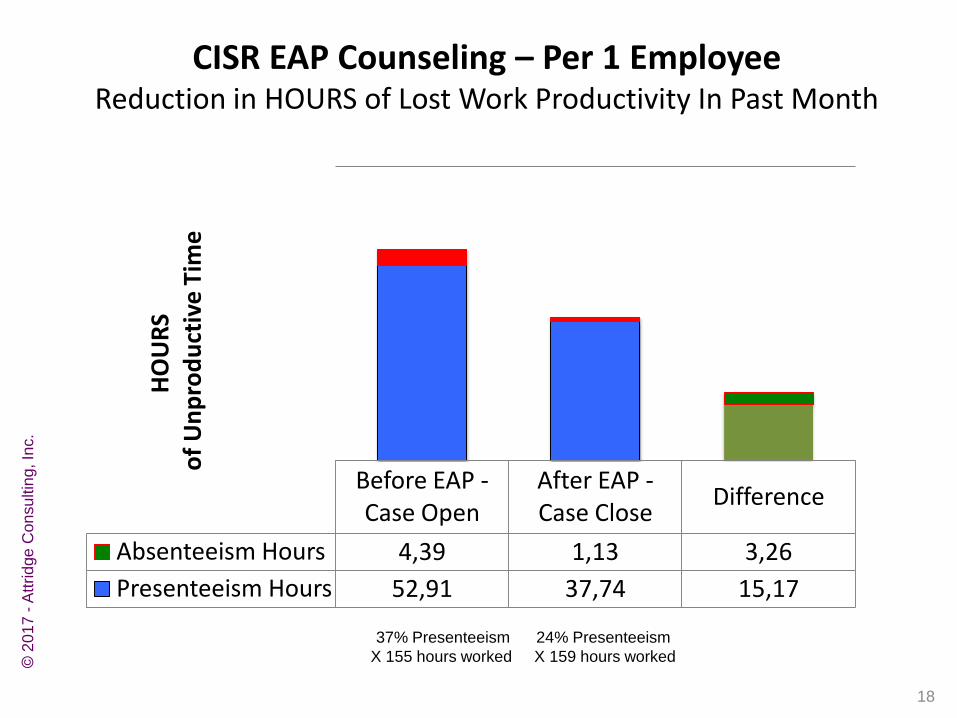
Before EAP - Case Open
After EAP - Case Close
Difference
Absenteeism Hours 4,39 1,13 3,26
Presenteeism Hours 52,91 37,74 15,17
HO
UR
S o
f U
np
rod
uct
ive
Tim
e
18
CISR EAP Counseling – Per 1 Employee Reduction in HOURS of Lost Work Productivity In Past Month
© 2
01
7 -
Att
rid
ge
Con
su
ltin
g, In
c.
37% Presenteeism 24% Presenteeism
X 155 hours worked X 159 hours worked
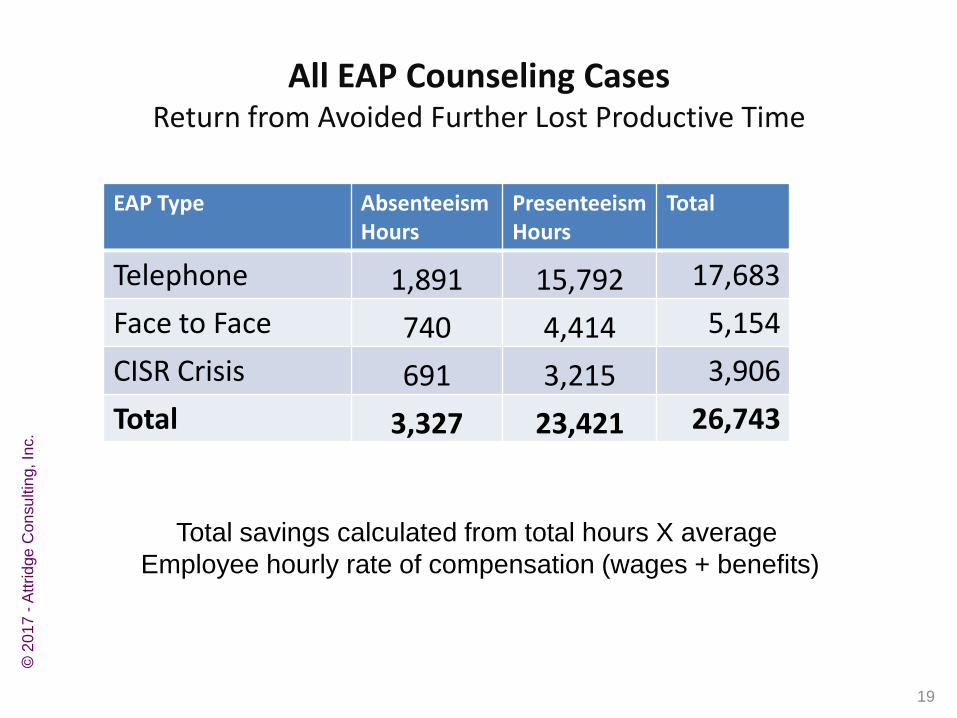
All EAP Counseling Cases Return from Avoided Further Lost Productive Time
19
EAP Type Absenteeism Hours
Presenteeism Hours
Total
Telephone 1,891 15,792 17,683
Face to Face 740 4,414 5,154
CISR Crisis 691 3,215 3,906
Total 3,327 23,421 26,743
© 2
01
7 -
Att
rid
ge
Con
su
ltin
g, In
c.
Total savings calculated from total hours X average
Employee hourly rate of compensation (wages + benefits)
Avoided “Secondary” Presenteeism
Among the Managers of
Employee Users of EAP
© 2
01
7 -
Att
rid
ge
Con
su
ltin
g, In
c.
20
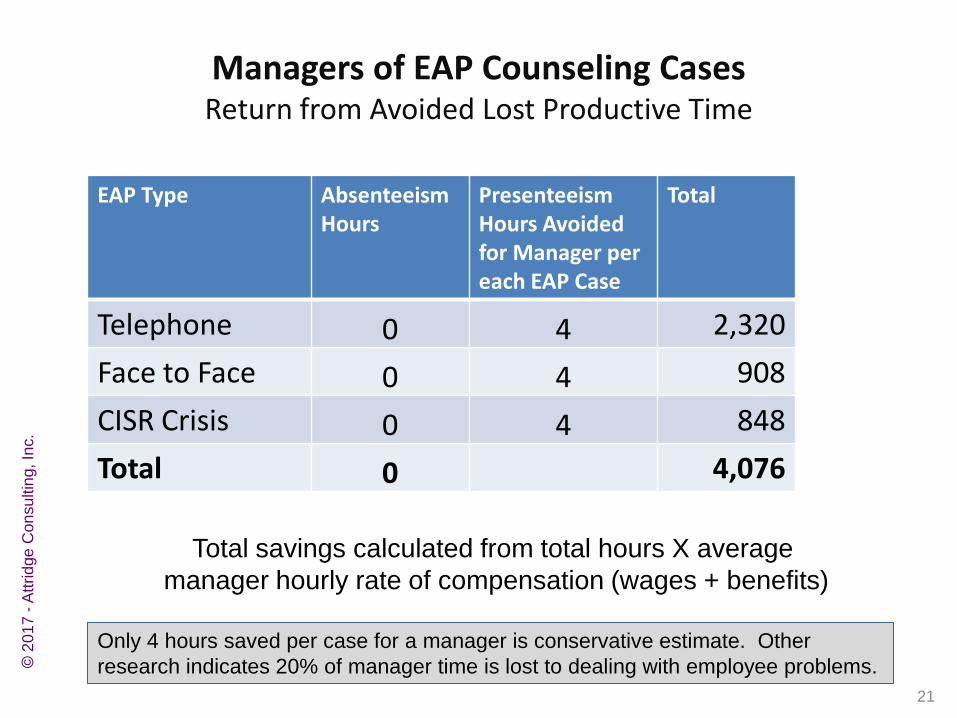
Managers of EAP Counseling Cases Return from Avoided Lost Productive Time
21
EAP Type Absenteeism Hours
Presenteeism Hours Avoided for Manager per each EAP Case
Total
Telephone 0 4 2,320
Face to Face 0 4 908
CISR Crisis 0 4 848
Total 0 4,076
© 2
01
7 -
Att
rid
ge
Con
su
ltin
g, In
c.
Only 4 hours saved per case for a manager is conservative estimate. Other
research indicates 20% of manager time is lost to dealing with employee problems.
Total savings calculated from total hours X average
manager hourly rate of compensation (wages + benefits)
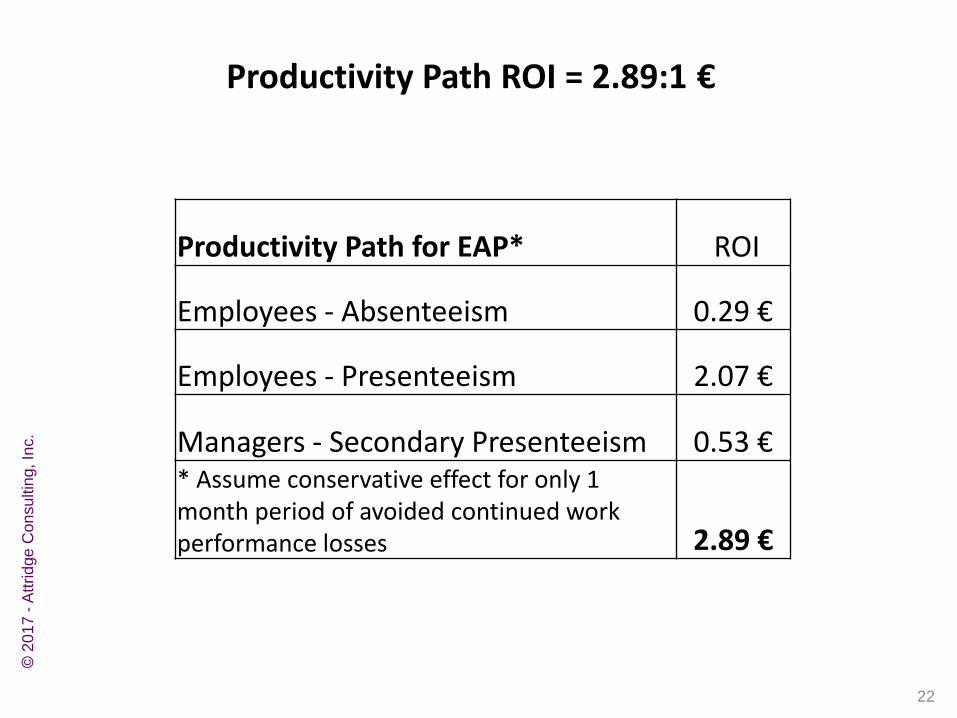
Productivity Path ROI = 2.89:1 €
22
Productivity Path for EAP* ROI
Employees - Absenteeism 0.29 €
Employees - Presenteeism 2.07 €
Managers - Secondary Presenteeism 0.53 € * Assume conservative effect for only 1 month period of avoided continued work performance losses 2.89 €
© 2
01
7 -
Att
rid
ge
Con
su
ltin
g, In
c.
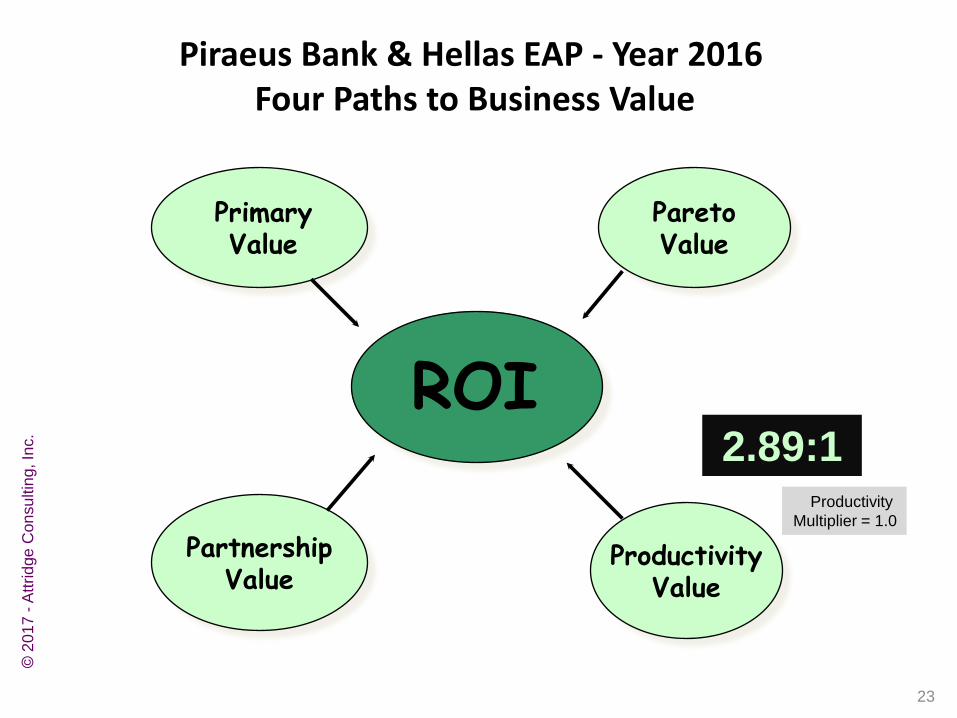
Piraeus Bank & Hellas EAP - Year 2016 Four Paths to Business Value
Primary Value
Productivity Value
Pareto Value
Partnership Value
23
2.89:1 Productivity
Multiplier = 1.0
© 2
01
7 -
Att
rid
ge
Con
su
ltin
g, In
c.
ROI

Mark
Onscreen
Live Video Here
24
PART 3
Results at Piraeus Bank in 2016
Pareto Path ROI
© 2
01
7 -
Att
rid
ge
Con
su
ltin
g, In
c.
25
ROI
Primary Value
Productivity Value
Pareto Value
Partnership Value
26
© 2
01
7 -
Att
rid
ge
Con
su
ltin
g, In
c.
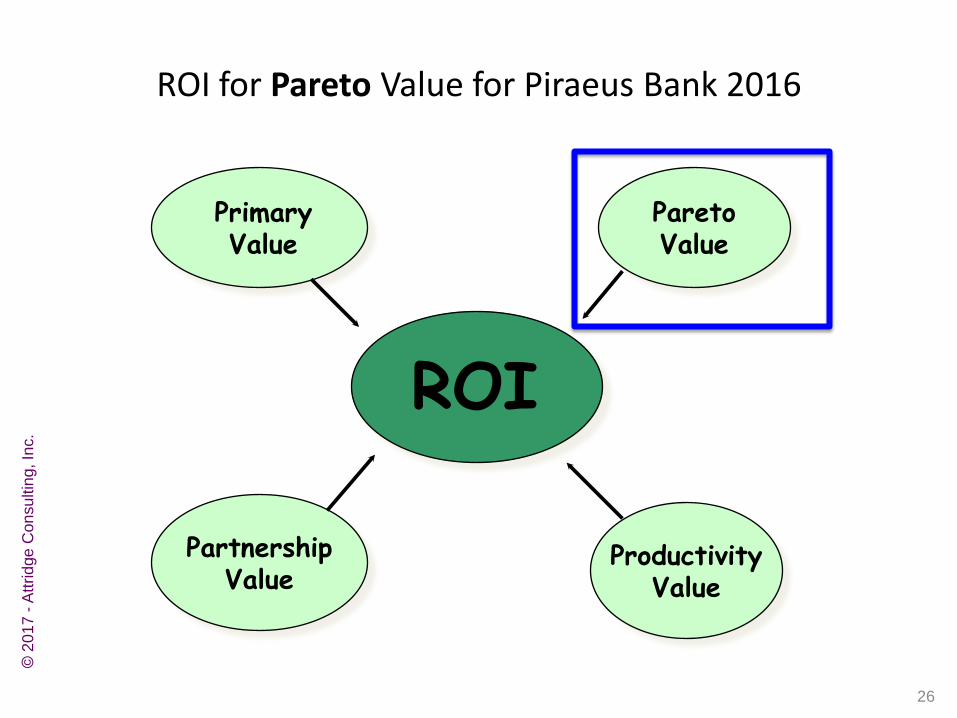
ROI for Pareto Value for Piraeus Bank 2016
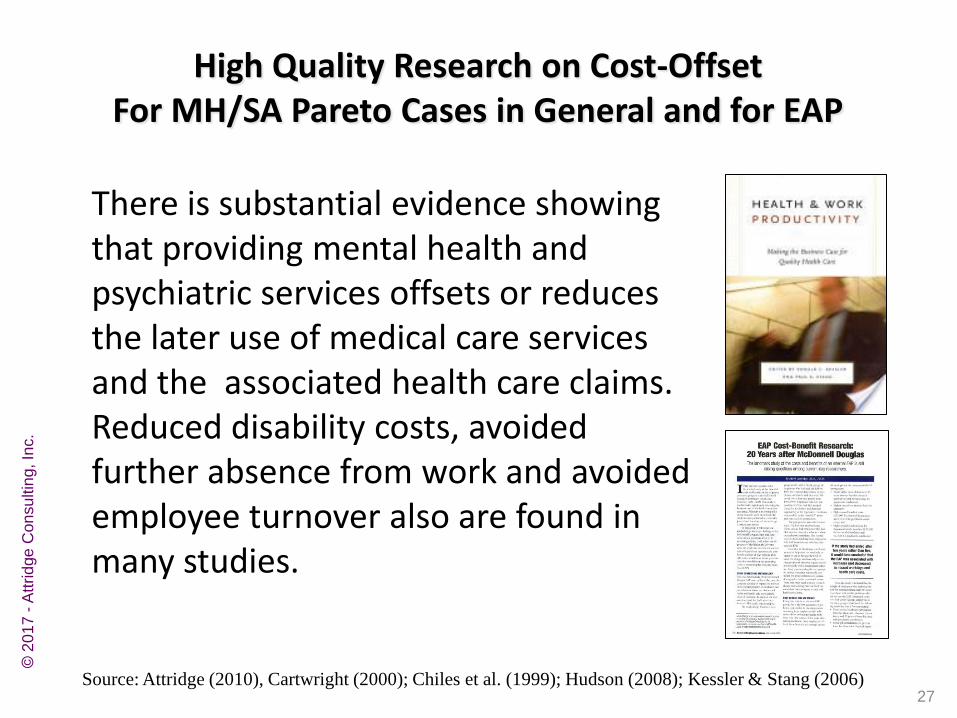
There is substantial evidence showing that providing mental health and psychiatric services offsets or reduces the later use of medical care services and the associated health care claims. Reduced disability costs, avoided further absence from work and avoided employee turnover also are found in many studies.
High Quality Research on Cost-Offset For MH/SA Pareto Cases in General and for EAP
Source: Attridge (2010), Cartwright (2000); Chiles et al. (1999); Hudson (2008); Kessler & Stang (2006) 27
© 2
01
7 -
Att
rid
ge
Con
su
ltin
g, In
c.
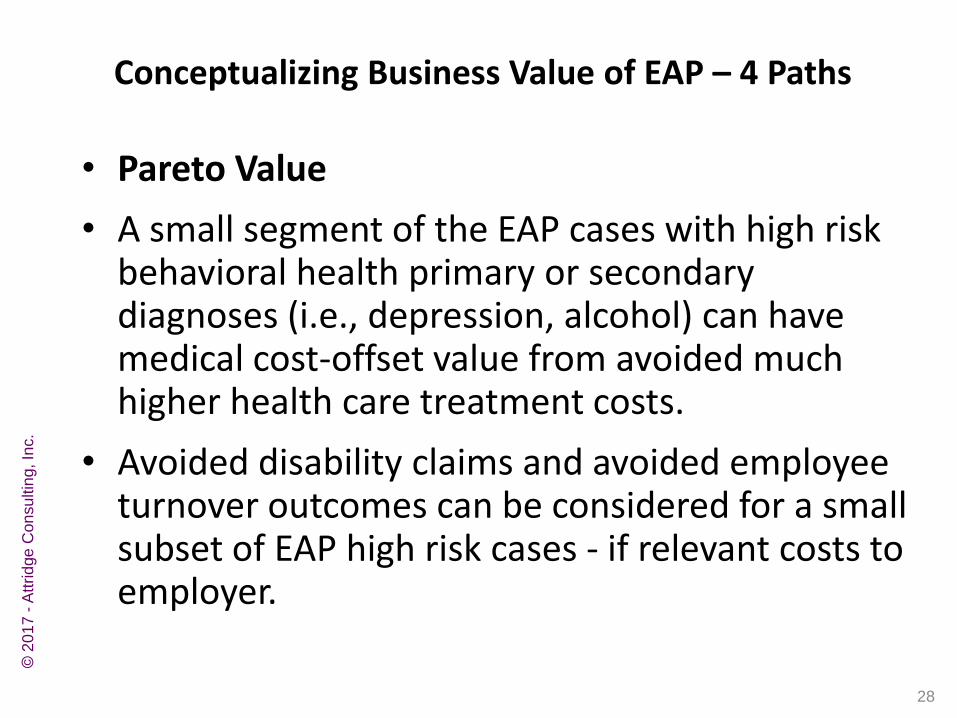
• Pareto Value
• A small segment of the EAP cases with high risk behavioral health primary or secondary diagnoses (i.e., depression, alcohol) can have medical cost-offset value from avoided much higher health care treatment costs.
• Avoided disability claims and avoided employee turnover outcomes can be considered for a small subset of EAP high risk cases - if relevant costs to employer.
28
Conceptualizing Business Value of EAP – 4 Paths
© 2
01
7 -
Att
rid
ge
Con
su
ltin
g, In
c.
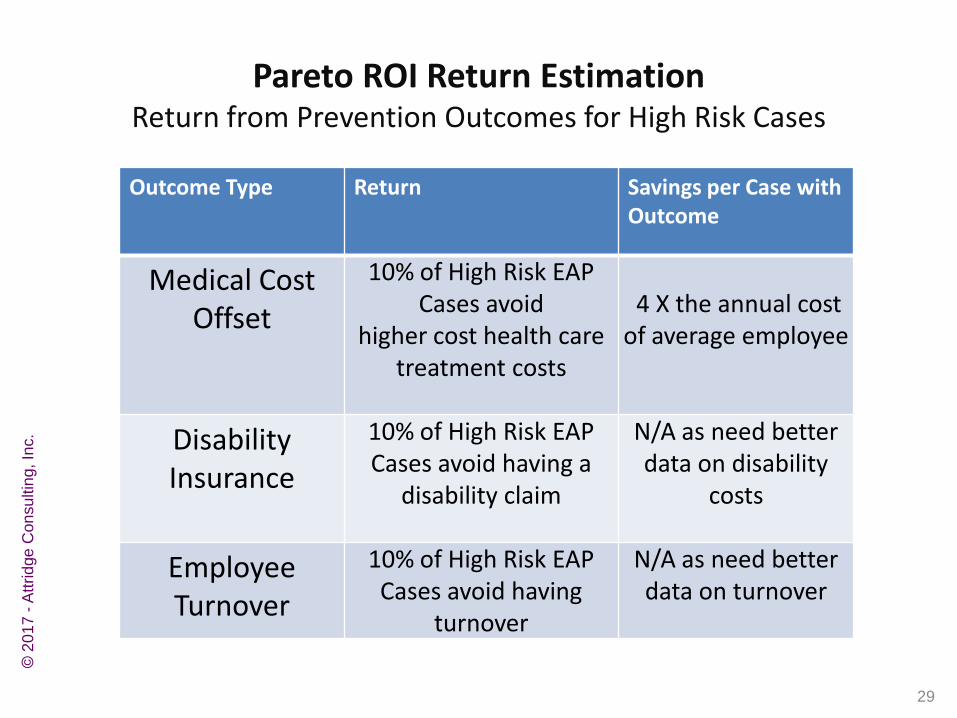
Pareto ROI Return Estimation Return from Prevention Outcomes for High Risk Cases
29
Outcome Type Return Savings per Case with Outcome
Medical Cost Offset
10% of High Risk EAP Cases avoid
higher cost health care treatment costs
4 X the annual cost of average employee
Disability Insurance
10% of High Risk EAP Cases avoid having a
disability claim
N/A as need better data on disability
costs
Employee Turnover
10% of High Risk EAP Cases avoid having
turnover
N/A as need better data on turnover
© 2
01
7 -
Att
rid
ge
Con
su
ltin
g, In
c.
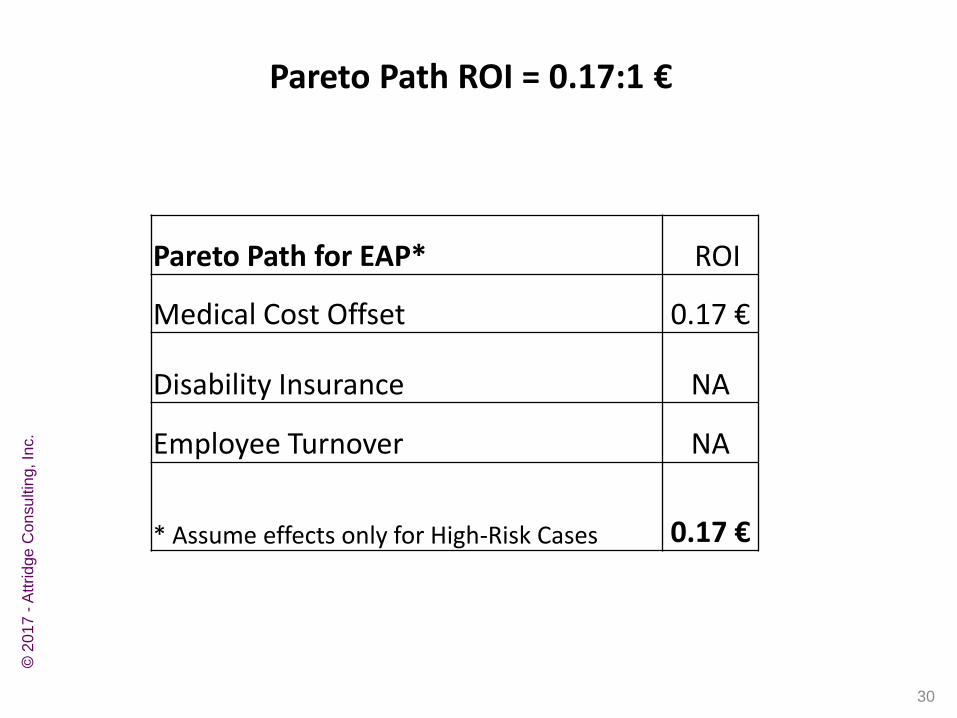
Pareto Path ROI = 0.17:1 €
30
Pareto Path for EAP* ROI
Medical Cost Offset 0.17 €
Disability Insurance NA
Employee Turnover NA
* Assume effects only for High-Risk Cases 0.17 €
© 2
01
7 -
Att
rid
ge
Con
su
ltin
g, In
c.
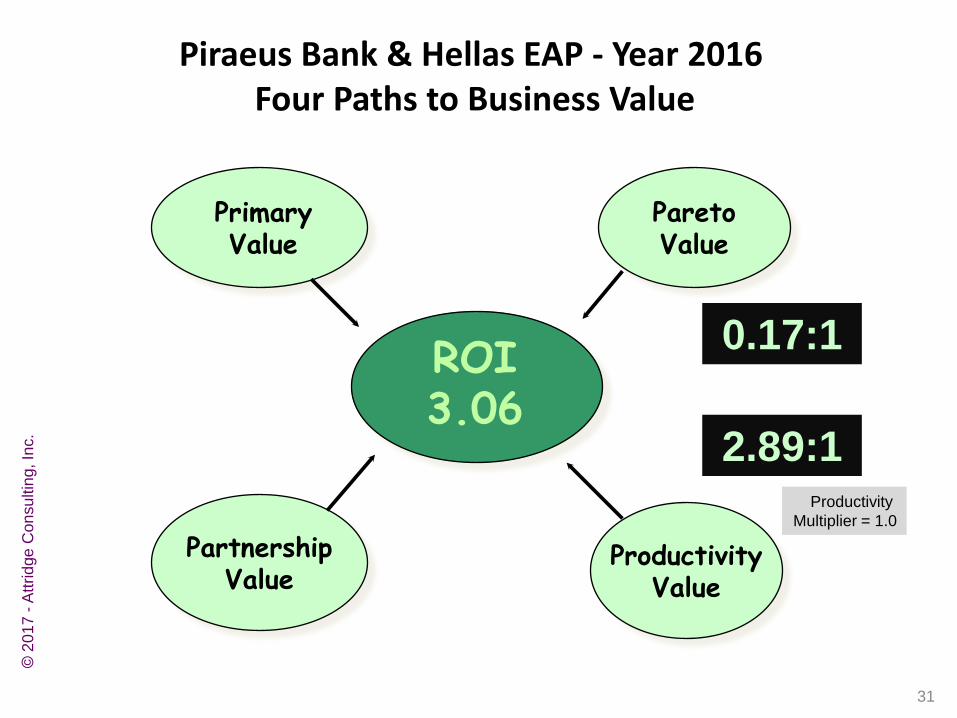
Piraeus Bank & Hellas EAP - Year 2016 Four Paths to Business Value
ROI 3.06
Primary Value
Productivity Value
Pareto Value
Partnership Value
31
2.89:1
0.17:1
Productivity
Multiplier = 1.0
© 2
01
7 -
Att
rid
ge
Con
su
ltin
g, In
c.
PART 4
Results at Piraeus Bank in 2016
Primary Path ROI
© 2
01
7 -
Att
rid
ge
Con
su
ltin
g, In
c.
32
ROI
Primary Value
Productivity Value
Pareto Value
Partnership Value
33
© 2
01
7 -
Att
rid
ge
Con
su
ltin
g, In
c.
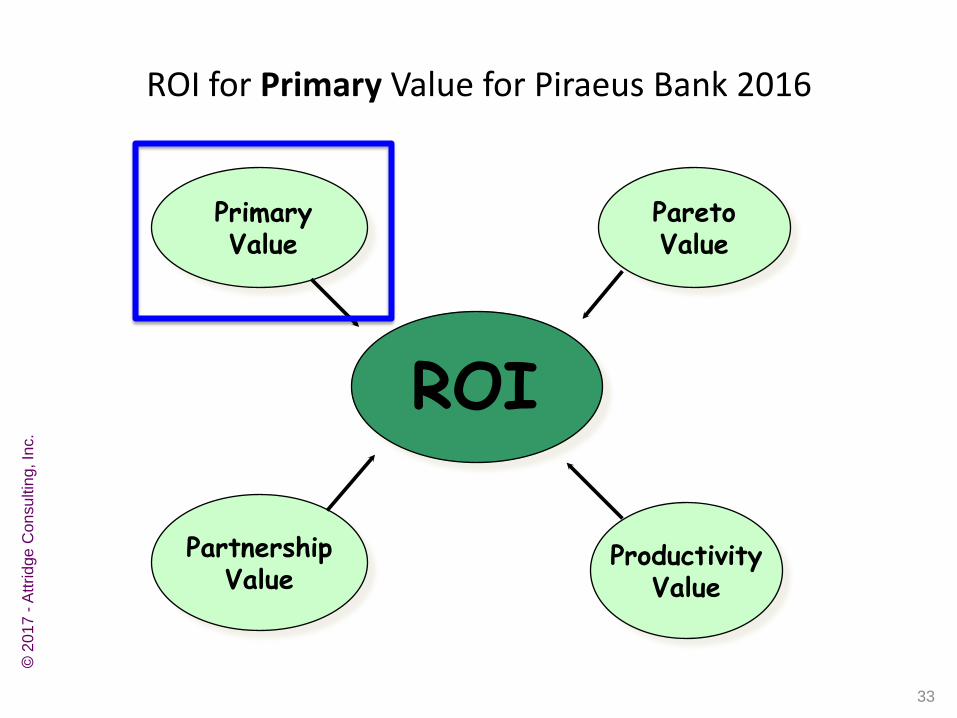
ROI for Primary Value for Piraeus Bank 2016
© 2
01
6 -
Att
rid
ge
Con
su
ltin
g, In
c.
Similar to paying for employee trainings or medical care preventive screening services at per transaction rates, each kind of EAP service has a per transaction rate of value to the business. If they were provided by an external source other than the EAP at “market rates” the services can be added up as another component of the ROI.
34
© 2
01
7 -
Att
rid
ge
Co
nsu
ltin
g, In
c.
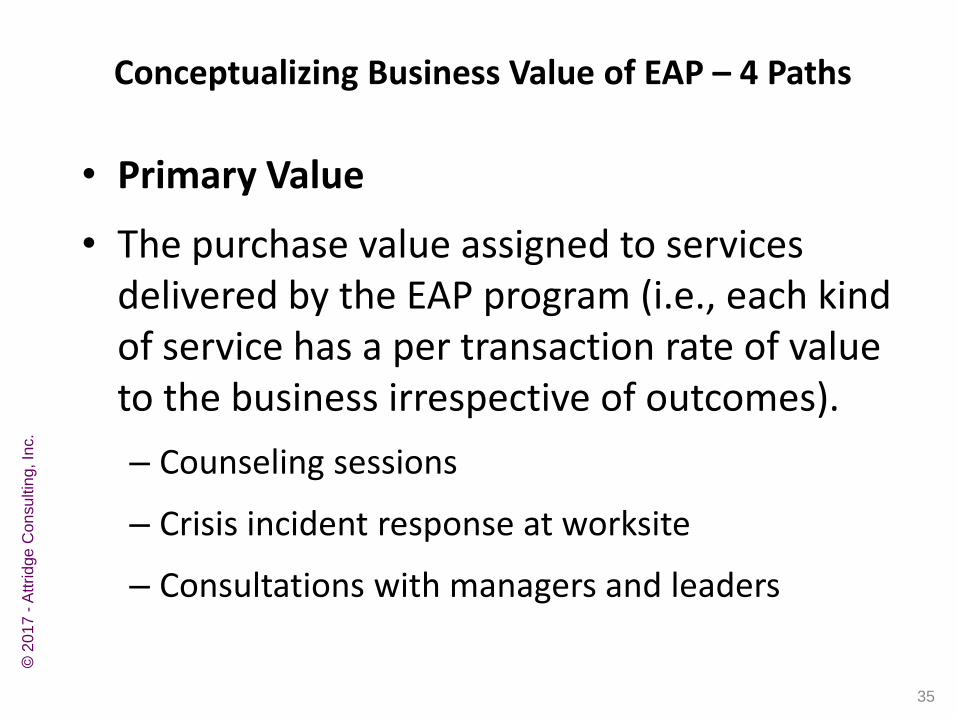
• Primary Value
• The purchase value assigned to services delivered by the EAP program (i.e., each kind of service has a per transaction rate of value to the business irrespective of outcomes).
– Counseling sessions
– Crisis incident response at worksite
– Consultations with managers and leaders
35
Conceptualizing Business Value of EAP – 4 Paths
© 2
01
7 -
Att
rid
ge
Con
su
ltin
g, In
c.
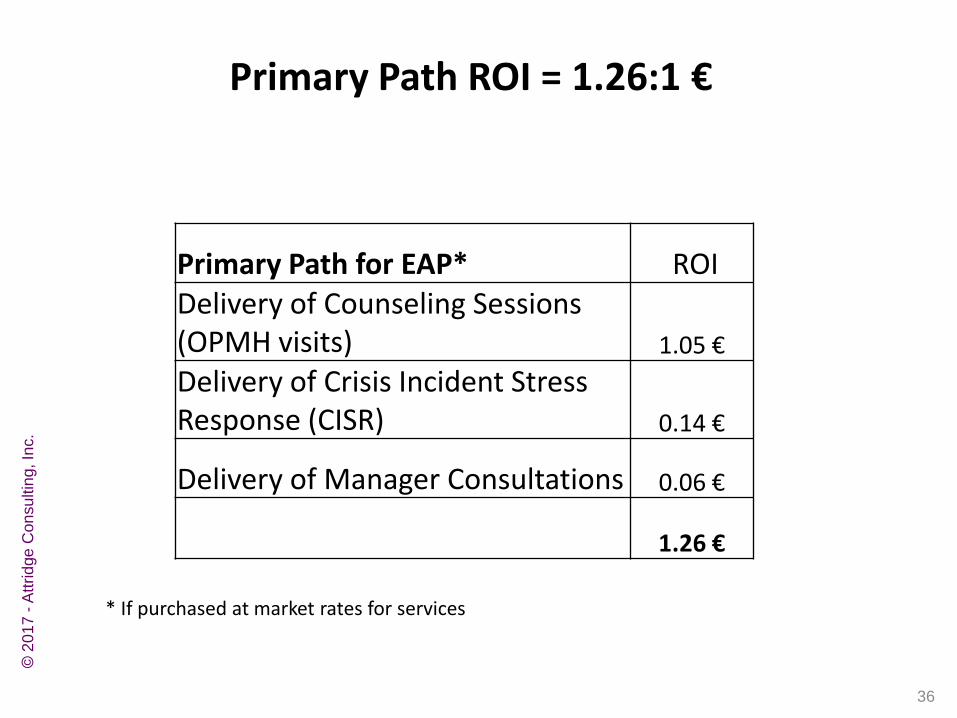
Primary Path ROI = 1.26:1 €
36
Primary Path for EAP* ROI Delivery of Counseling Sessions (OPMH visits) 1.05 €
Delivery of Crisis Incident Stress Response (CISR) 0.14 €
Delivery of Manager Consultations 0.06 €
1.26 €
© 2
01
7 -
Att
rid
ge
Con
su
ltin
g, In
c.
* If purchased at market rates for services
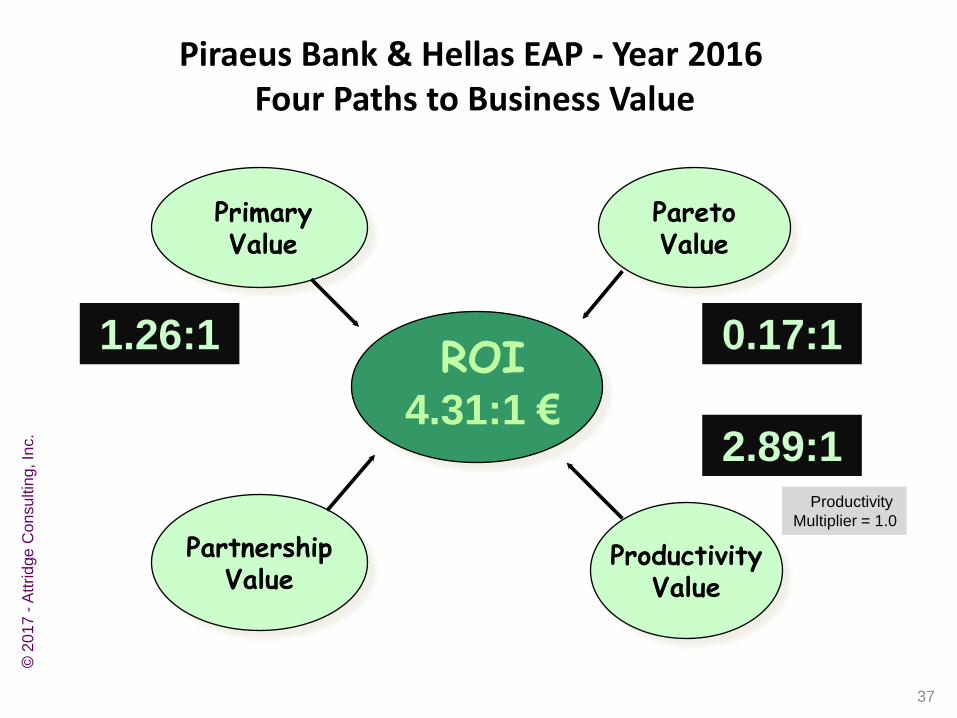
Piraeus Bank & Hellas EAP - Year 2016 Four Paths to Business Value
ROI 4.31:1 €
Primary Value
Productivity Value
Pareto Value
Partnership Value
37
2.89:1
0.17:1 1.26:1
Productivity
Multiplier = 1.0
© 2
01
7 -
Att
rid
ge
Con
su
ltin
g, In
c.
PART 5
ROI Results at Piraeus Bank
Year 2016 Year 2015 Year 2014
© 2
01
7 -
Att
rid
ge
Con
su
ltin
g, In
c.
38
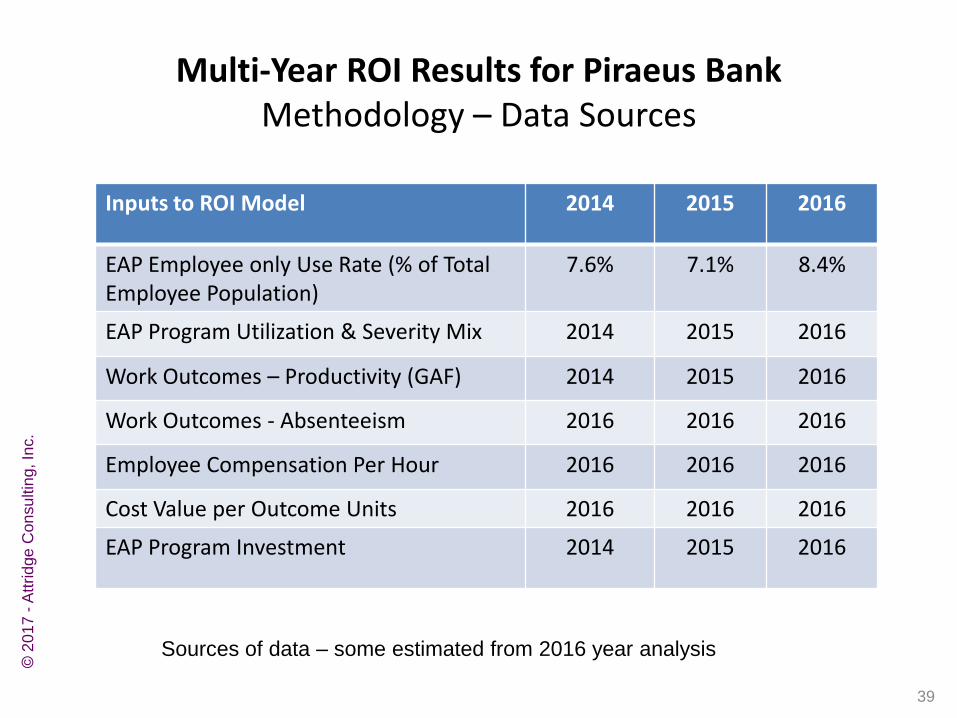
Multi-Year ROI Results for Piraeus Bank Methodology – Data Sources
© 2
01
7 -
Att
rid
ge
Con
su
ltin
g, In
c.
Inputs to ROI Model 2014 2015 2016
EAP Employee only Use Rate (% of Total Employee Population)
7.6% 7.1% 8.4%
EAP Program Utilization & Severity Mix 2014 2015 2016
Work Outcomes – Productivity (GAF) 2014 2015 2016
Work Outcomes - Absenteeism 2016 2016 2016
Employee Compensation Per Hour 2016 2016 2016
Cost Value per Outcome Units 2016 2016 2016
EAP Program Investment 2014 2015 2016
Sources of data – some estimated from 2016 year analysis
39
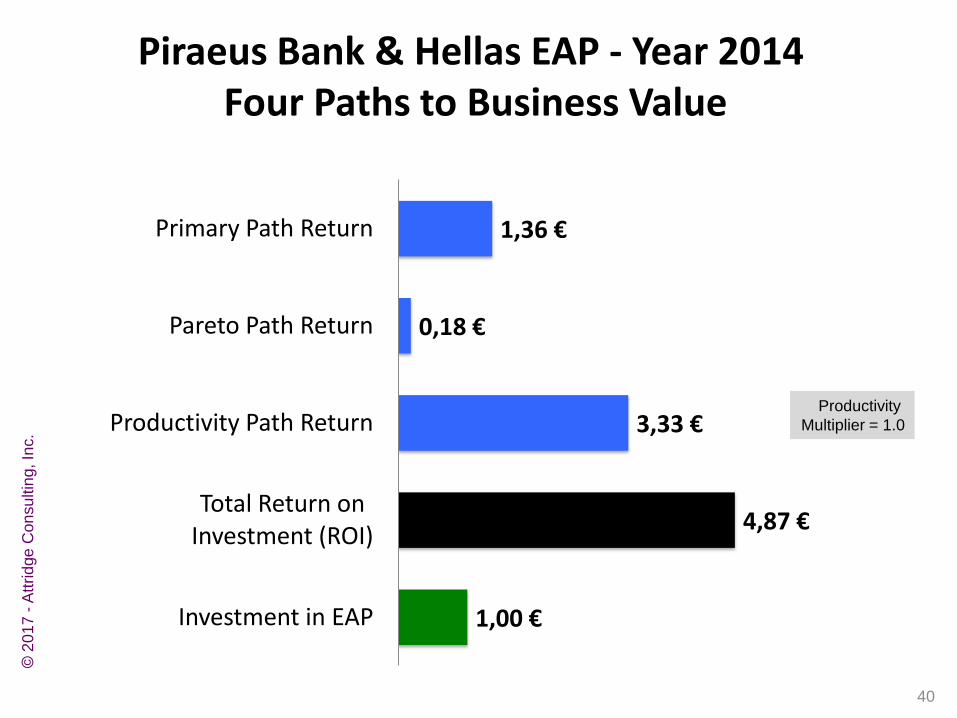
Piraeus Bank & Hellas EAP - Year 2014 Four Paths to Business Value
40
1,00 €
4,87 €
3,33 €
0,18 €
1,36 €
Investment in EAP
Total Return on Investment (ROI)
Productivity Path Return
Pareto Path Return
Primary Path Return
Productivity
Multiplier = 1.0
© 2
01
7 -
Att
rid
ge
Con
su
ltin
g, In
c.
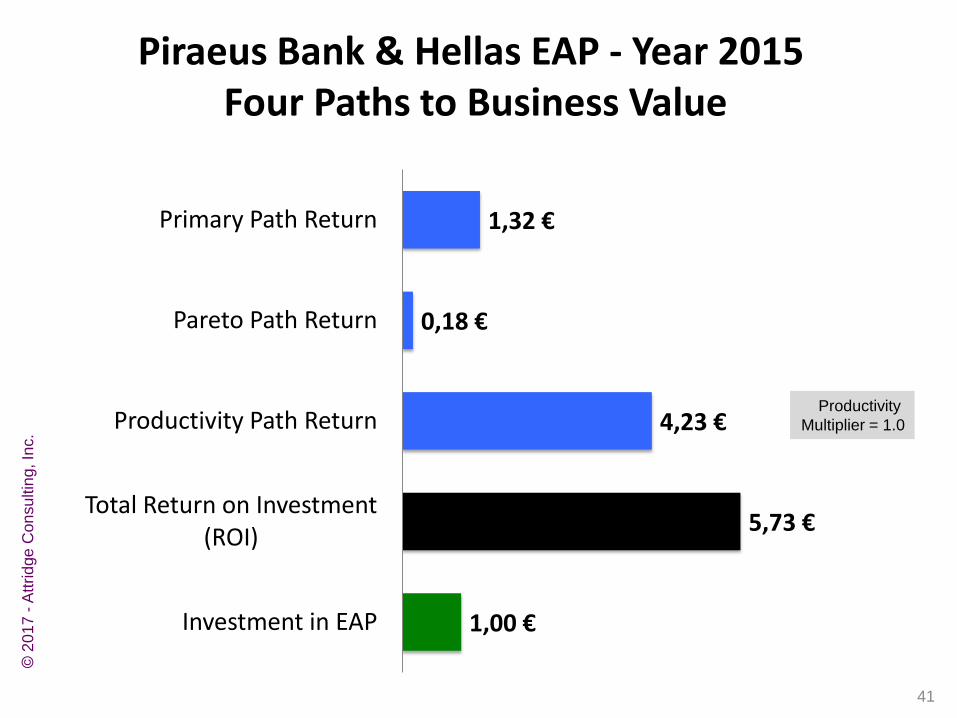
Piraeus Bank & Hellas EAP - Year 2015 Four Paths to Business Value
41
1,00 €
5,73 €
4,23 €
0,18 €
1,32 €
Investment in EAP
Total Return on Investment (ROI)
Productivity Path Return
Pareto Path Return
Primary Path Return
Productivity
Multiplier = 1.0
© 2
01
7 -
Att
rid
ge
Con
su
ltin
g, In
c.
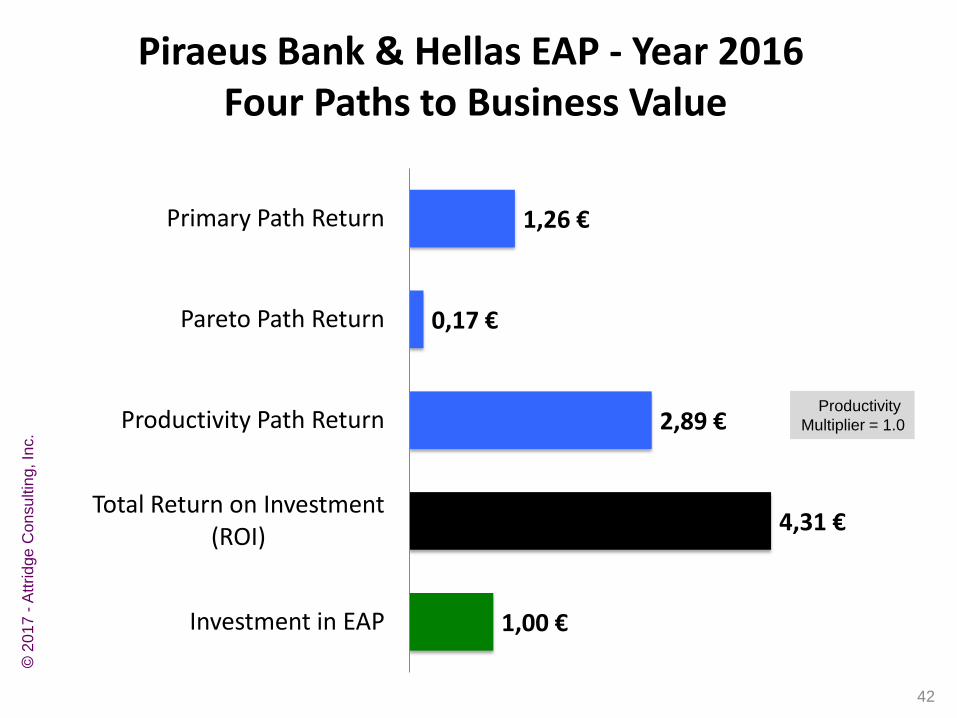
Piraeus Bank & Hellas EAP - Year 2016 Four Paths to Business Value
42
1,00 €
4,31 €
2,89 €
0,17 €
1,26 €
Investment in EAP
Total Return on Investment (ROI)
Productivity Path Return
Pareto Path Return
Primary Path Return
Productivity
Multiplier = 1.0
© 2
01
7 -
Att
rid
ge
Con
su
ltin
g, In
c.
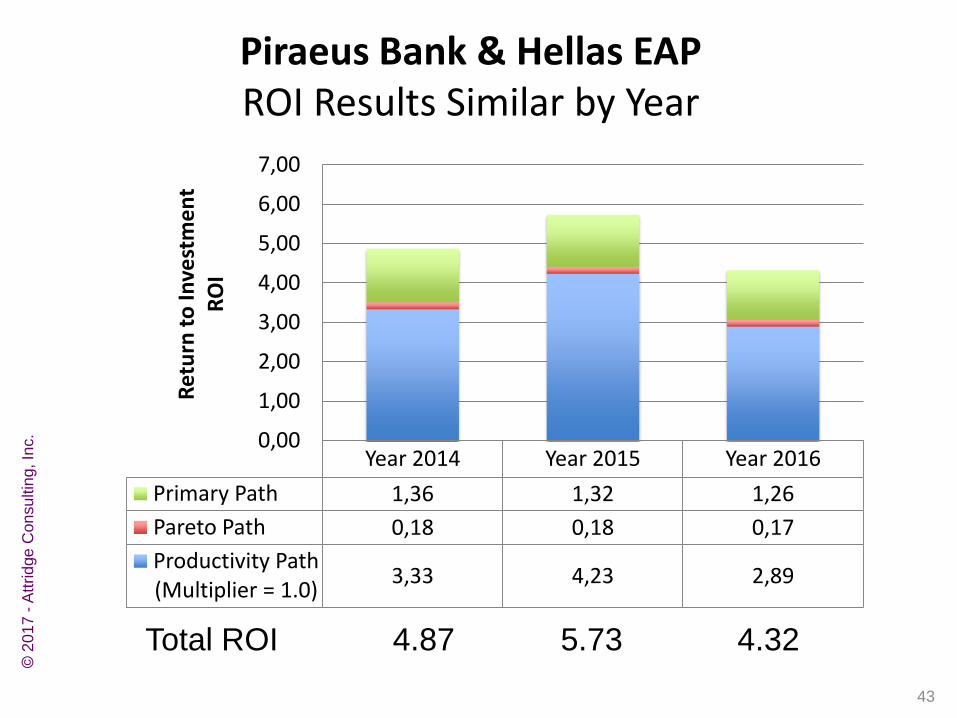
Piraeus Bank & Hellas EAP ROI Results Similar by Year
43
Year 2014 Year 2015 Year 2016
Primary Path 1,36 1,32 1,26
Pareto Path 0,18 0,18 0,17
Productivity Path (Multiplier = 1.0)
3,33 4,23 2,89
0,00
1,00
2,00
3,00
4,00
5,00
6,00
7,00 R
etu
rn t
o In
vest
me
nt
RO
I
Total ROI 4.87 5.73 4.32
© 2
01
7 -
Att
rid
ge
Con
su
ltin
g, In
c.
PART 6
Results at Piraeus Bank for Year 2016
with Productivity Multiplier for Employee Compensation
© 2
01
7 -
Att
rid
ge
Con
su
ltin
g, In
c.
44
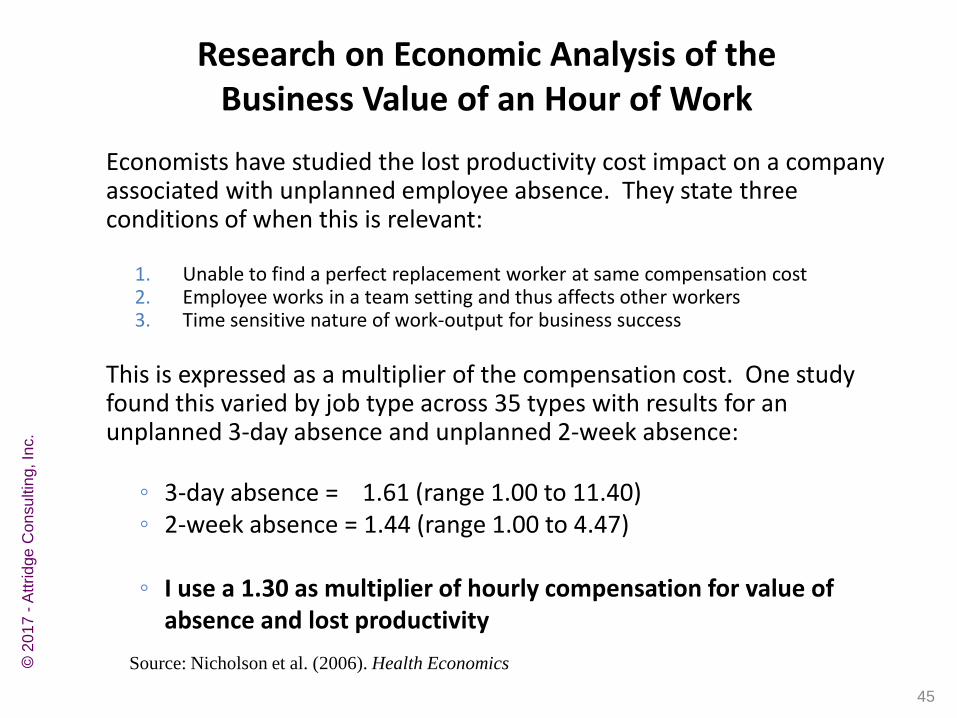
Research on Economic Analysis of the Business Value of an Hour of Work
45
Economists have studied the lost productivity cost impact on a company associated with unplanned employee absence. They state three conditions of when this is relevant:
1. Unable to find a perfect replacement worker at same compensation cost 2. Employee works in a team setting and thus affects other workers 3. Time sensitive nature of work-output for business success
This is expressed as a multiplier of the compensation cost. One study found this varied by job type across 35 types with results for an unplanned 3-day absence and unplanned 2-week absence:
◦ 3-day absence = 1.61 (range 1.00 to 11.40) ◦ 2-week absence = 1.44 (range 1.00 to 4.47)
◦ I use a 1.30 as multiplier of hourly compensation for value of
absence and lost productivity
Source: Nicholson et al. (2006). Health Economics
© 2
01
7 -
Att
rid
ge
Con
su
ltin
g, In
c.
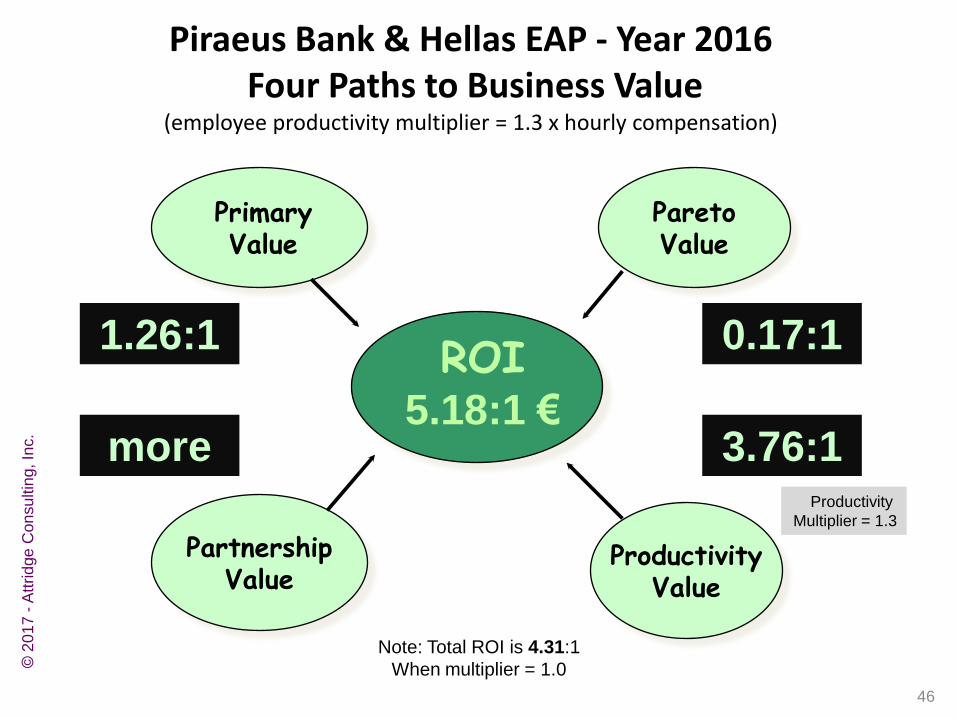
Piraeus Bank & Hellas EAP - Year 2016 Four Paths to Business Value
(employee productivity multiplier = 1.3 x hourly compensation)
ROI 5.18:1 €
Primary Value
Productivity Value
Pareto Value
Partnership Value
46
3.76:1
0.17:1 1.26:1
more Productivity
Multiplier = 1.3
Note: Total ROI is 4.31:1
When multiplier = 1.0 © 2
01
7 -
Att
rid
ge
Con
su
ltin
g, In
c.
PART 7
Results at Piraeus Bank in 2016
Partnership Path ROI
© 2
01
7 -
Att
rid
ge
Con
su
ltin
g, In
c.
47
ROI
Primary Value
Productivity Value
Pareto Value
Partnership Value
48
© 2
01
7 -
Att
rid
ge
Con
su
ltin
g, In
c.
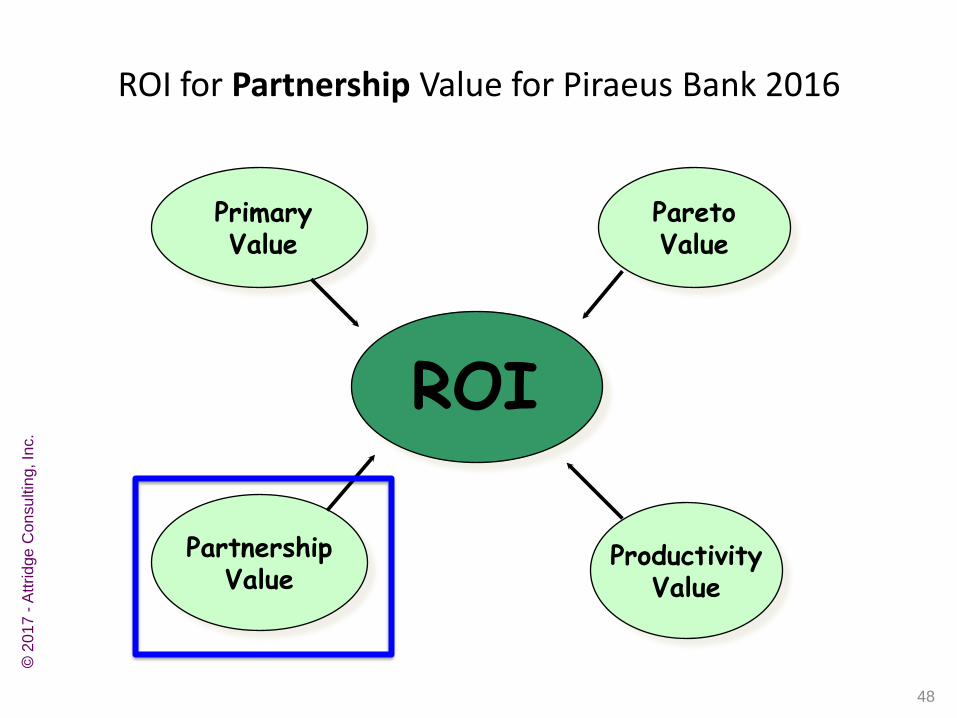
ROI for Partnership Value for Piraeus Bank 2016
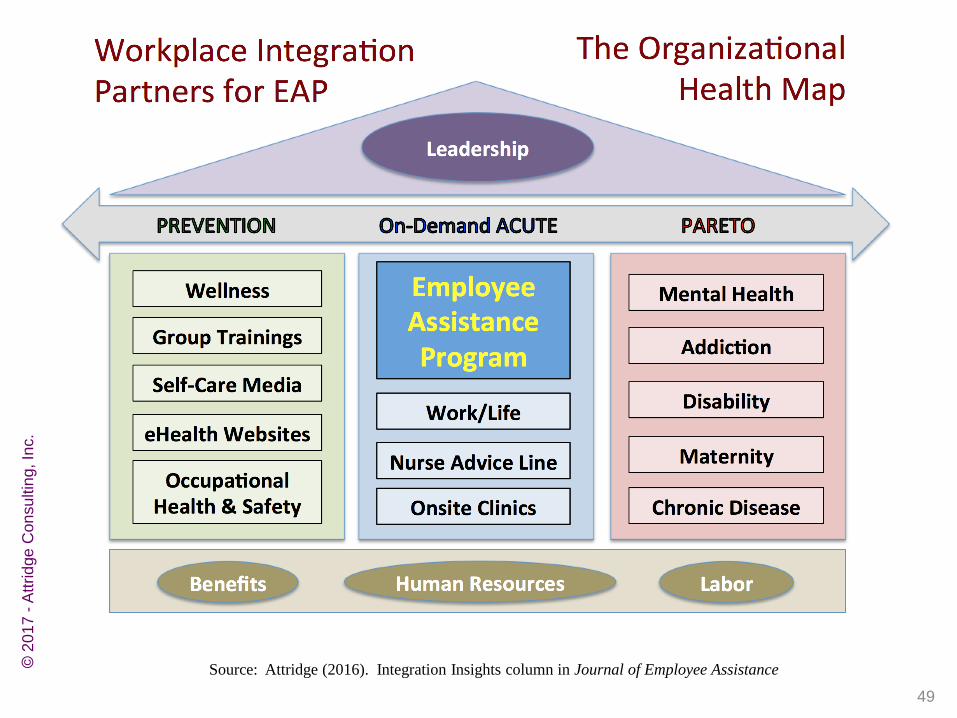
Source: Attridge (2016). Integration Insights column in Journal of Employee Assistance
49
© 2
01
7 -
Att
rid
ge
Con
su
ltin
g, In
c.
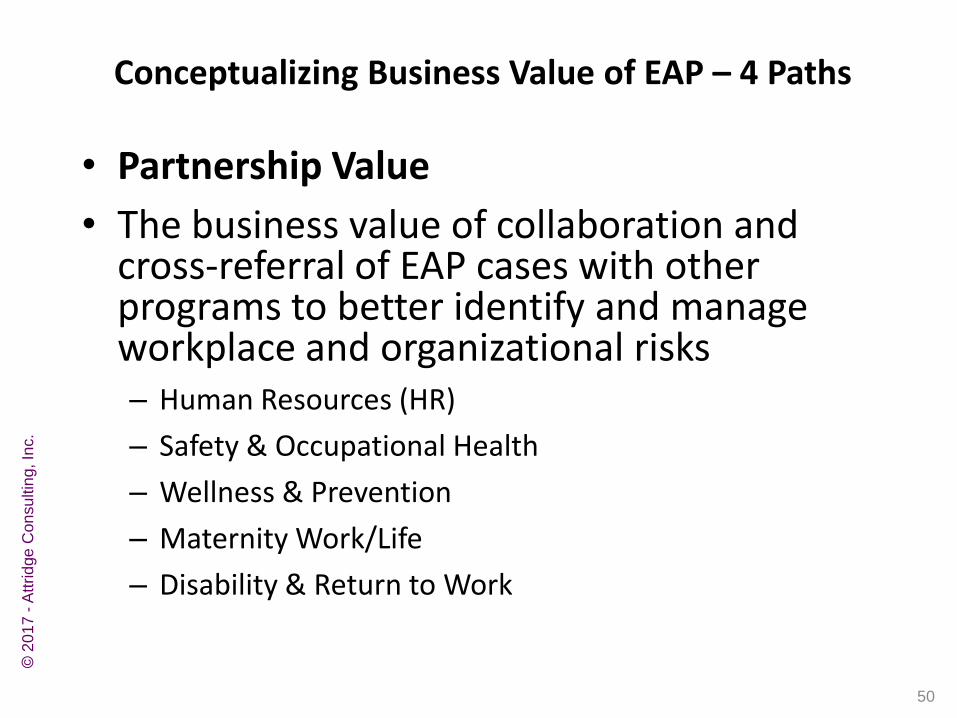
• Partnership Value
• The business value of collaboration and cross-referral of EAP cases with other programs to better identify and manage workplace and organizational risks – Human Resources (HR)
– Safety & Occupational Health
– Wellness & Prevention
– Maternity Work/Life
– Disability & Return to Work
50
Conceptualizing Business Value of EAP – 4 Paths
© 2
01
7 -
Att
rid
ge
Con
su
ltin
g, In
c.
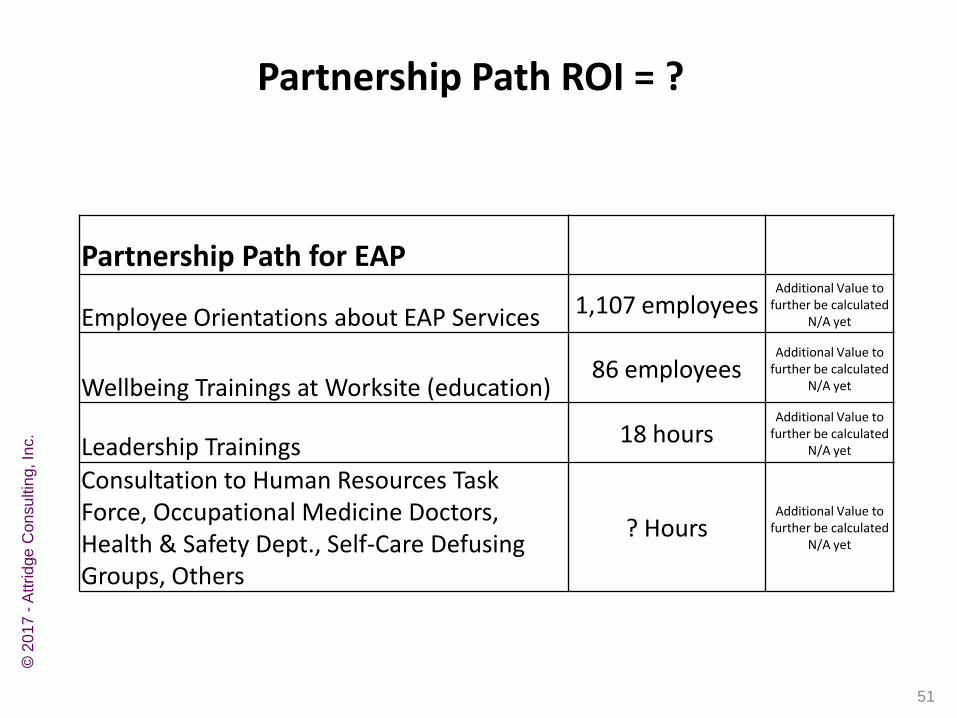
Partnership Path ROI = ?
51
Partnership Path for EAP
Employee Orientations about EAP Services 1,107 employees Additional Value to
further be calculated N/A yet
Wellbeing Trainings at Worksite (education) 86 employees
Additional Value to further be calculated
N/A yet
Leadership Trainings 18 hours Additional Value to
further be calculated N/A yet
Consultation to Human Resources Task Force, Occupational Medicine Doctors, Health & Safety Dept., Self-Care Defusing Groups, Others
? Hours Additional Value to
further be calculated N/A yet
© 2
01
7 -
Att
rid
ge
Con
su
ltin
g, In
c.
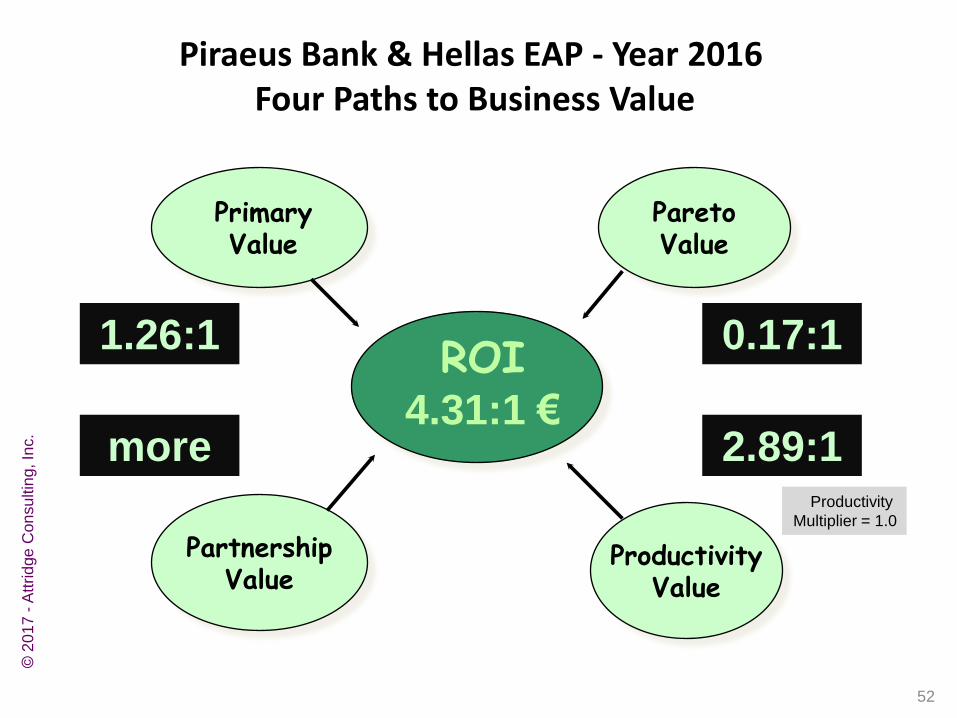
Piraeus Bank & Hellas EAP - Year 2016 Four Paths to Business Value
ROI 4.31:1 €
Primary Value
Productivity Value
Pareto Value
Partnership Value
52
2.89:1
0.17:1 1.26:1
more Productivity
Multiplier = 1.0
© 2
01
7 -
Att
rid
ge
Con
su
ltin
g, In
c.
Beyond ROI €
EAP helps manage employee behavioral health risks
and workplace crisis events and contributes to the long-term
Sustainability of the Organization
53
© 2
01
7 -
Att
rid
ge
Con
su
ltin
g, In
c.
Beyond ROI EAP as a Strategic Partnership
“the future of employee assistance lies with its adoption of a Comprehensive Service Program model. They must begin to identify the critical functions EAPs perform for work organizations that make them indispensable strategic partners in employers’ universal pursuit of productivity and innovation”
Kurzman. P. (2014). Employee Assistance Programs for the new millennium: Emergence of the
comprehensive model. Social Work in Mental Health, 11(5), 381-403.
54
© 2
01
7 -
Att
rid
ge
Con
su
ltin
g, In
c.
EAP Makes Workplaces Work Better
ROI
Photography by Workforce Magazine (2013)
Questions From Audience?
55
© 2
01
7 -
Att
rid
ge
Con
su
ltin
g, In
c.

Thank You
© 2
01
7 -
Att
rid
ge
Con
su
ltin
g, In
c.
56