retrofitting an aeration basin with anoxic zone to … pncwa conference, boise, idaho retrofitting...
TRANSCRIPT

2012 PNCWA Conference, Boise, Idaho
Retrofitting an Aeration Basin with Anoxic Zone to Reduce Operations Cost and Improve Performance
Ed Griffenberg, Operations Specialist HDR Engineering, Edmonds, WA

Case Study – Mount Vernon WWTP
• Project Background
• Retro!t Ideas
• Model
• Implementation
• Reality Check
• Design & Construction
• Conclusion

Background
• The City of Mount Vernon is located approximately half way between Everett and Bellingham in Washington State.
• Largest community in Skagit County.
• Draper Valley Farm is the largest industrial customer (15-20% of loading).

Mount Vernon Wastewater Treatment Plant - Before Upgrade

Wastewater Treatment Plant
• Provides secondary treatment utilizing the activated sludge process. This process is more "exible than others (trickling !lters for example) in adapting to changes, such as nutrient removal.
• Originally designed for TSS and BOD removal only
• Began partial nitrifying in 2001

Why Nitrify?
• Required by new permit
• Difficult to avoid in summer
• Develop data for plant upgrade design
• Operator interest

Nitrogen Transformations
Nitrification
Organic N (Growth)
Nitrogen Gas Denitrification
O2
O2 Organic Carbon
Decomposition
Organic N (Cells)
Organic N
Ammonia
Nitrite
Nitrate
Assimilation

Wastewater Treatment Plant Capacity
• Average day design "ow of 5.6 MGD
• Peak design "ow of 12.0 MGD

Future Expansions Increase Plant Capacity from 10.8 MGD to 16.4 MGD
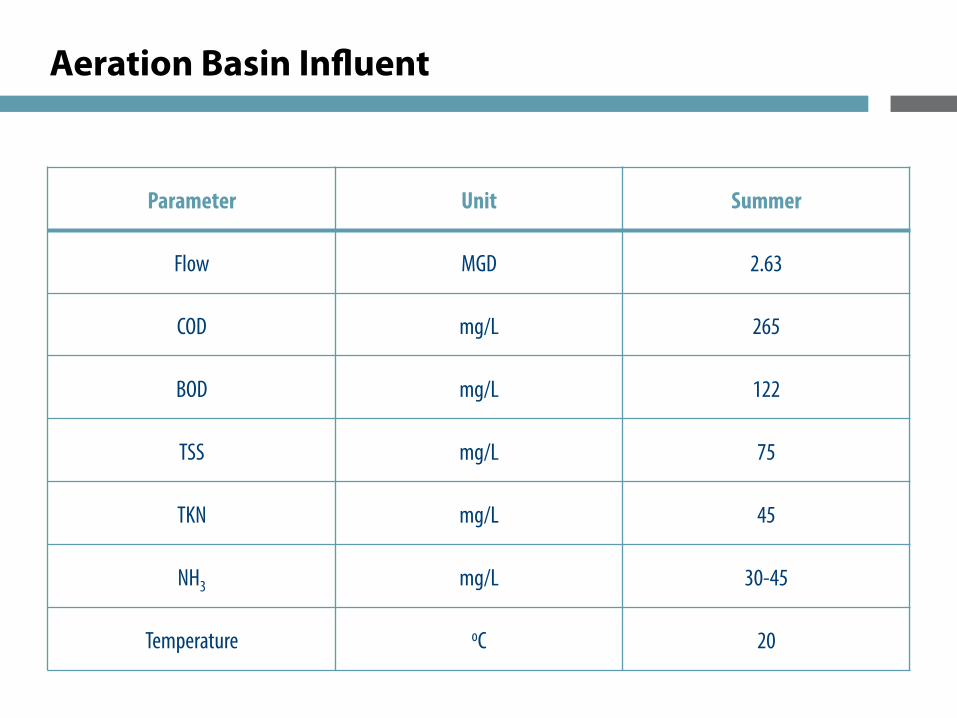
Aeration Basin Influent
Parameter Unit Summer
Flow" MGD" 2.63"
COD" mg/L" 265"
BOD" mg/L" 122"
TSS" mg/L" 75"
TKN" mg/L" 45"
NH3" mg/L" 30-45"
Temperature" oC" 20"
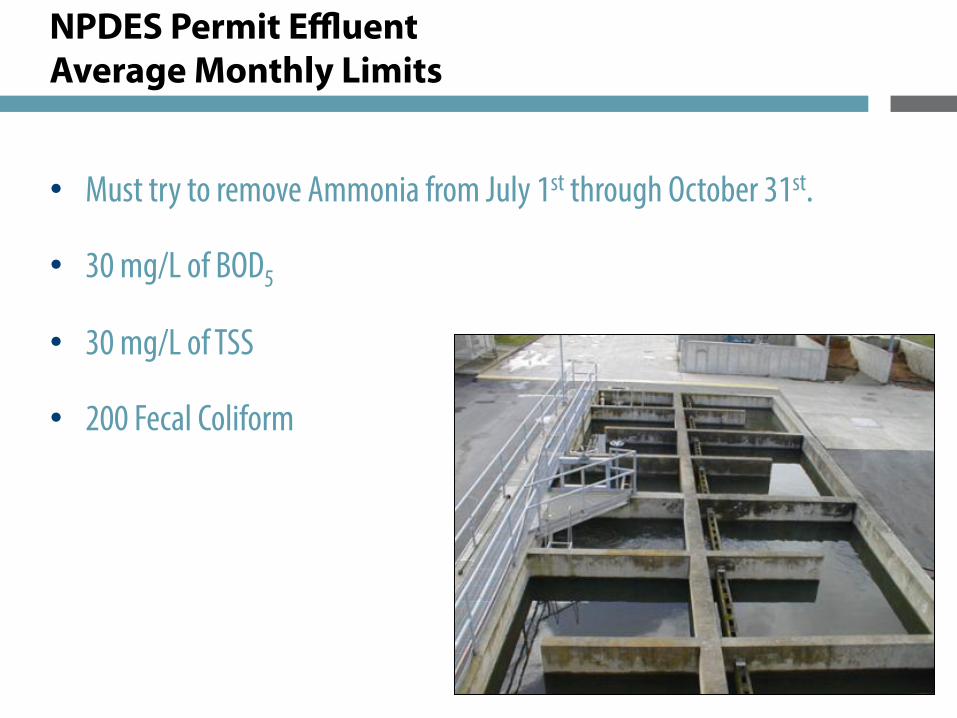
NPDES Permit Effluent Average Monthly Limits
• Must try to remove Ammonia from July 1st through October 31st.
• 30 mg/L of BOD5
• 30 mg/L of TSS
• 200 Fecal Coliform

Activated Sludge Process

Original Design
.
AB 2 Aerobic
AB 3 Aerobic
RAS Pri Eff

Previous Summer Nitrification Problems
• Floating sludge in clari!ers
• Trying to nitrify to just meet permit limits resulted in nitrite lock
• Nitrite lock - disinfection problems
• Insufficient alkalinity results in low effluent pH

Denitrification in Wrong Place

Attempt to Minimize Floating Sludge
• Increase RAS to the maximum to minimize clari!er sludge detention time was not effective

Why Did Sludge Float
• Nitri!cation converts ammonia to nitrate
• Without oxygen in the secondary clari!ers, nitrates will denitrify producing nitrogen gas
• Gas bubbles "oat the sludge blanket

Nitrogen Transformations
Denitrification
Organic N (Growth)
Nitrogen Gas
Assimilation
Nitr
ifica
tion
O Organic Carbon
Decomposition
Organic N (Cells)
Organic N
Ammonia
Nitrite
Nitrate

Solving the Problem
• What can be done to prevent "oating sludge?
• Prevent denitri!cation in secondary clari!er
• Denitrify somewhere else before nitrate enters clari!er

Solving the Problem
• How to remove the nitrate?
• Create an anoxic zone in the activated sludge basins, pump nitrate rich MLSS to the anoxic zone, provide a carbon source and the biomass will do the rest.

Modified Ludzack Ettinger (MLE) System

Original Design
.
AB 2 Aerobic
AB 3 Aerobic
RAS Pri Eff

Anoxic Basin Retrofit
.
Mixed Liquor Recycle
AB 1 WAS
Storage
AB 2 Aerobic
AB 3 Aerobic
AB 4 Anoxic
Mixer
RAS Pri Eff

Will the Idea Work?
• Before modi!cations are made, run computer model to determine feasibility – BioWin Model
Influent
Filtrate Return
EffluentReactor 1 Reactor 2 Anoxic
Waste Activated Sludge
Aerobic Aerobic

Base Conditions
• 100% Mixed Liquor Recycle (MLR) rate and 50% RAS rate
• Initial reactor D.O. at 2 mg/L (to simulate aeration by screw pumps)
• Sufficient aeration capacity to meet oxygen demand in aerobic reactors

Base Run Output
• Complete nitri!cation (98% ammonia removal)
• 50% nitrate removal was slightly lower than textbook denitri!cation performance
• High effluent nitrate (17 mg/l) due to high in"uent ammonia (36 mg/l)

Denitrification vs. Recycle
0%
20%
40%
60%
80%
100%
0 2 4 6 8 10
Recycle Ratio (RAS + MLSS)
RAS = 0.5 Q
IR = 1 Q
Recycle Ratio = 1.5 Q

Additional Model Observations
• 200% MLR rate resulted in same effluent nitrate concentration
• Modeling a higher in"uent BOD resulted in much lower effluent nitrate
• Results indicate actual BOD/TKN ratio is too low to achieve theoretical denitri!cation removal at higher MLR rates
Modeling Conclusions
• MLE mode will: • Recover alkalinity consumed in nitri!cation • Reduce oxygen demand • Result in effluent nitrate 50% lower than operating without
denitri!cation • Lower effluent nitrate will result in less potential for "oating sludge
in clari!er • High in"uent ammonia relative to in"uent BOD results in lower
denitri!cation rate • Thus – proceed with implementation!

Economic Retrofit
• Use spare vertical turbine pump
• Use existing basins
• Purchase Flygt submersible mixer
• Equipment/piping installed by plant staff
• Modi!cations completed in June 2003
RESULT – Minimal cost modi!cation
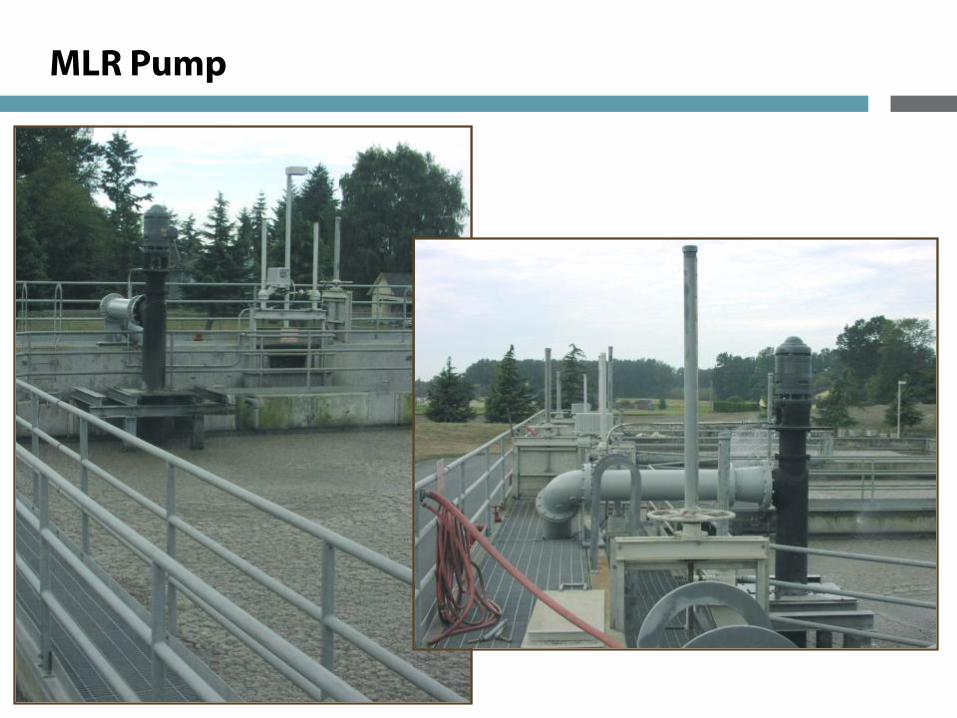
MLR Pump

Anoxic Basin Mixer

Reality Check
• Additional sampling and analysis conducted
• Actual in"uent parameters used in additional model runs
• Compare real life performance to model prediction

Nitrification Performance
Nitrification Performance
0%
20%
40%
60%
80%
100%
120%
0 10 20 30 40 50
Influent NH3 (mg/L)
% R
emo
val
Actual % Removal Stable Actual % Removal Unstable Model % Removal

Influent & Effluent NH3
0
5
10
15
20
25
0 10 20 30 40 50
Influent NH3 (mg/L)
Eff
luen
t N
H3
(mg
/L)
Actual NH3 Stable Actual NH3 Unstable Model NH3

Comparison of Nitrification
• Real life data indicates unstable nitri!cation at in"uent ammonia level higher than approximately 34 mg/L
• Computer model predicts complete nitri!cation for the same range of in"uent ammonia concentrations

Potential Reason
• Plant staff reported occasional difficulty maintaining sufficient D.O. (2 mg/L) in !rst aeration basin. Model assumes sufficient aeration at all times
• Implication – further work required to assess aeration capacity and !ne tune controls
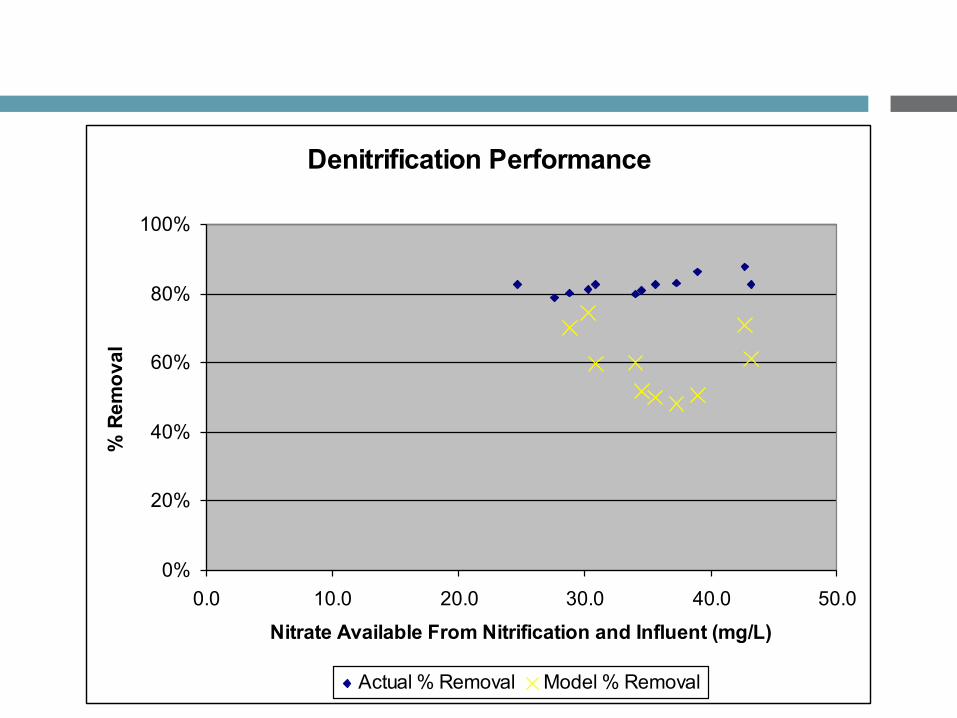
Denitrification Performance
0%
20%
40%
60%
80%
100%
0.0 10.0 20.0 30.0 40.0 50.0
Nitrate Available From Nitrification and Influent (mg/L)
% R
emo
val
Actual % Removal Model % Removal

Influent & Effluent Nitrate
0
5
10
15
20
25
0.0 10.0 20.0 30.0 40.0 50.0
Nitrate Available From Nitrification and Influent (mg/L)
Eff
luen
t N
itra
te (
mg
/L)
Actual Nitrate Model Nitrate

Real Life vs. Model - Impact of BOD/TKN Ratio
y = 0.1975x
R2 = 0.8616
0%
10%
20%
30%
40%
50%
60%
70%
80%
90%
100%
2.40 2.60 2.80 3.00 3.20 3.40 3.60 3.80 4.00
BOD/TKN Ratio
% R
emo
val
Model % Removal Actual % Removal Linear (Model % Removal)

Comparison of Denitrification
• Real life data indicates 80% nitrate removal for BOD/TKN ratio from 2.5 to 3.8.
• Actual nitrate removal meets theoretical maximum value even though BOD/TKN ratio is too low (< 4.0).
• Hypothesis – model kinetic parameters based on domestic wastewater. Industrial contribution (23% of plant "ow) may change dynamics.

Trial Outcome
• Plant meets effluent permit limits and nitrogen loading was reduced to improve water quality
• Clari!er "oating sludge problem solved
• Good data for plant upgrade generated (additional data needed to fully calibrate model)
• Plant staff enjoyed modifying process

Other Insights
• Side stream treatment of the dewatering !ltrate may be required to reduce ammonia loading on the aeration basins.
• Basic nitrogen removal, to 8 to 10 mg/L, doesn’t necessarily need to involve massive investment in capital facilities.

Design & Construction Services

Future Expansions Increase Plant Capacity from 10.8 MGD to 16.4 MGD

NDN Flow Pattern

New Process for Old Basins
To 2nd
RAS PE
ML Recycle
AB-1B
AB-1A
Oxic Basin Anoxic

Design Criteria
Constituent Units Annual Average
Max Month Wet Weather
Max Hour Wet Weather
Flow (BOD mode) mgd 9.0 15.0 22.0
Flow (nitri!cation mode) mgd 4.6 7.6 22.0
BOD (BOD mode) lb/day 13,600 17,300 N/A
mg/l 181 138 N/A
BOD (nitri!cation mode)
lb/day 7,000 8,500 N/A
mg/l 182 134 N/A
Ammonia (nitri!cation mode)
lb/day 800 1,000 N/A
mg/l 20.8
15.8 N/A

How’s it working
Month 2012
Average Flow MGD
Average TSS (mg/l)
Average BOD (mg/l)
Average NH3-N / NO3 (mg/l)
BOD Mode
Feb 5.1 7 5 20.0
March 5.3 6 5 23.9
April 4.5 15 9 30.3
May 4.4 4 9 20.0
Nitri!cation Mode
July 3. 8 7 16 4.6/6.7
August 2.8 6 13 0.8/0.8
September 2.6 7 12 1.8/2.5
October 2.5 9 12 2.2/9.6
Process Control Activities
• NH3/NO3 monitoring in each basin
• Adjustments to D.O., wasting rate, or caustic rate.
• Tight pH control with pH probe.
• Dewatering controls
• RAS and MLR rate controls
• Seasonal BNR/BOD mode
How’s it working
• Other Observations
• Side stream treatment not used in AB-1A
• Additional mixer placed in AB-1A to increase size of anoxic zone
• Resulted in a decrease of nitrate and thus of denitri!cation in the secondary clari!er
• SVI dropped from 300 to 180 in 30 day and then to 80 after an additional 30 days
• Filament growth was reduced to almost nothing

How’s it working
Oxic Basin
AB-1B Anoxic
AB-1A Anoxic
RAS + ML + PE
How’s it working
• By using our skills, the HDR/Mount Vernon team was successful in helping Mount Vernon develop and implement low-cost process modi!cations that improved plant operation, and achieved a secondary bene!t of improved water quality.

Acknowledgements
• Gary Duranceau – WWTP Superintendent
• Andrew Denham– Process Control/Lab
• Ray Pickens – Electrical Modi!cation
• Ron Eastman – Mechanical Modi!cation
• Dr. JB Neethling – BioWin Modeler
• Bob Bower – Operations Specialist

2012 PNCWA Conference, Boise, Idaho
Retrofitting an Aeration Basin with Anoxic Zone to Reduce Operations Cost and Improve Performance
Ed Griffenberg, Operations Specialist HDR Engineering, Edmonds, WA