retrospective study of biopsied head and neck lesions in a cohort of referral taiwanese patients
TRANSCRIPT
HEAD & FACE MEDICINE
Lei et al. Head & Face Medicine 2014, 10:28http://www.head-face-med.com/content/10/1/28
RESEARCH Open Access
Retrospective study of biopsied head and necklesions in a cohort of referral Taiwanese patientsFrank Lei1†, Ping-Ho Chen2, Jing-Yi Chen3, Wen-Chen Wang2,3, Li-Min Lin2,3,4, Hsien-Cheng Huang3, Kun-Yen Ho1,2†,Chung-Ho Chen5 and Yuk-Kwan Chen2,3,4*
Abstract
Introduction: A study of the whole spectrum of biopsied head and neck (HN) diseases in Taiwan has not yet beenperformed. Therefore, the current study aimed to provide updated information about HN lesions in a cohort ofreferral Taiwanese patients for histopathological examination.
Methods: HN lesions (2000–2011) in patients with records of age, sex, and histological diagnoses were retrievedfrom the Oral Pathology Department of the institution. These lesions were classified into four main categories:tumor/tumor-like reactive lesions, cystic/pseudocystic lesions, inflammatory/infective lesions, and others/miscellaneous lesions.
Results: A total of 37,210 HN lesions were included in the current study. Most of these lesions were distributed inthe group of tumor/tumor-like reactive lesions, followed by the groups of inflammatory/infective lesions, cystic/pseudocystic lesions, and others/miscellaneous lesions. Squamous cell carcinoma was the most common HN lesion,and was also the most frequent malignant lesion among the referral patients.
Conclusion: It was worthy of note that squamous cell carcinoma and oral potentially malignant disorderscomprised high percentages of all HN lesions for the present cohort of referral patients.
Keywords: Oral lesions, Oral health
IntroductionReviewing the English literature, to our knowledge, mostof the previous studies of HN lesions analyzed specificdiseases, such as odontogenic cysts or tumors [1,2], incertain populations, such as pediatric or geriatric popu-lations [3,4]. There are only a few retrospective reportsfocusing on the prevalence the whole spectrum of biop-sied oral and maxillofacial (OMF) lesions in variouscountries [5-11]. Information of the types and frequencyof HN lesions in the local population may always behelpful in management the patients. A study of a varietyof biopsied HN diseases in Taiwanese patients has notyet been performed. Hence, the present study aimed toprovide updated information about HN lesions in a
* Correspondence: [email protected]†Equal contributors2School of Dentistry, College of Dental Medicine, Kaohsiung MedicalUniversity, Kaohsiung, Taiwan3Division of Oral Pathology & Maxillofacial Radiology, Kaohsiung MedicalUniversity Hospital, Kaohsiung, TaiwanFull list of author information is available at the end of the article
© 2014 Lei et al.; licensee BioMed Central Ltd.Commons Attribution License (http://creativecreproduction in any medium, provided the orDedication waiver (http://creativecommons.orunless otherwise stated.
cohort of referral Taiwanese patients for histopathologicalexamination.
Materials and methodsThe Oral Pathology Department of the institution is thedepartment providing a histopathological service encom-passed by HN surgery specialty in southern Taiwan,receiving specimens mainly from the surgeons of the OMFSurgery Department, ENT Department, and PlasticSurgery Department of the hospital as well as other nearbyregional hospitals and local dental clinics. Three experi-enced board-certified HN pathologists make the histo-logical diagnosis for each biopsy independently, basedmostly on paraffin embedded sections of hematoxylin-eosin staining and sometimes conjunction with im-munohistochemical and/or histochemical staining. Thehistological diagnoses are established by peer slide review;however, if disagreement exists amongst the pathologists,a consensus is reached upon mutual discussion.
This is an Open Access article distributed under the terms of the Creativeommons.org/licenses/by/4.0), which permits unrestricted use, distribution, andiginal work is properly credited. The Creative Commons Public Domaing/publicdomain/zero/1.0/) applies to the data made available in this article,
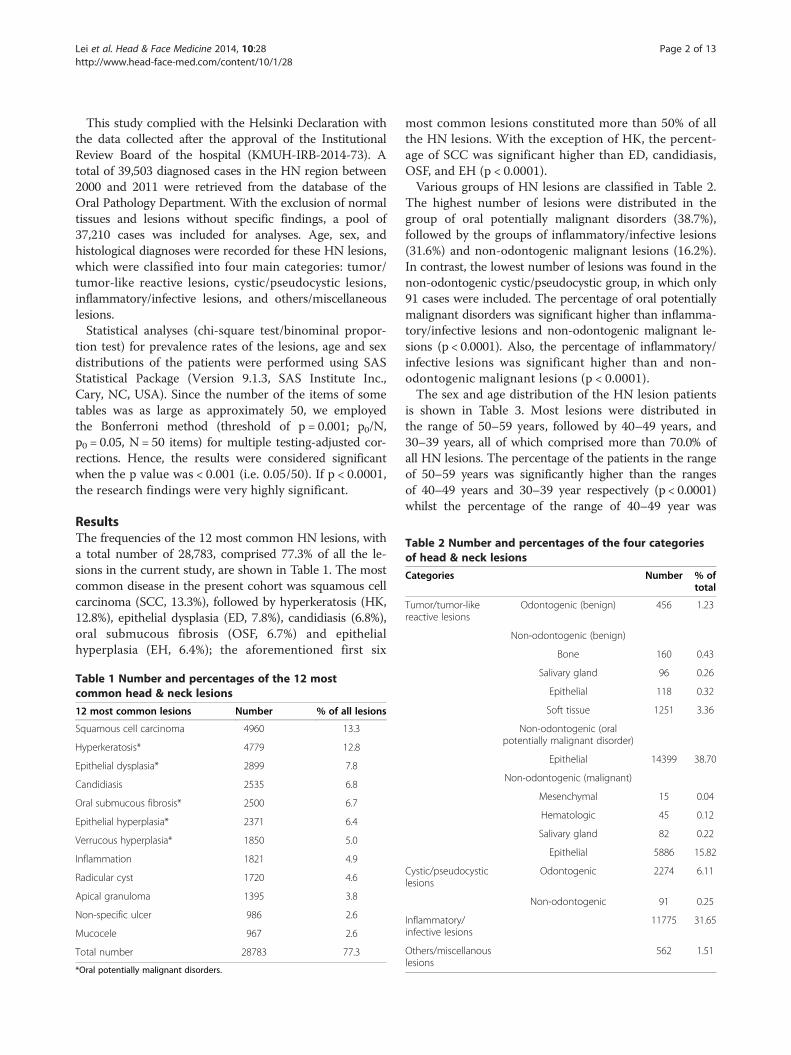
Table 2 Number and percentages of the four categoriesof head & neck lesions
Categories Number % oftotal
Tumor/tumor-likereactive lesions
Odontogenic (benign) 456 1.23
Non-odontogenic (benign)
Bone 160 0.43
Lei et al. Head & Face Medicine 2014, 10:28 Page 2 of 13http://www.head-face-med.com/content/10/1/28
This study complied with the Helsinki Declaration withthe data collected after the approval of the InstitutionalReview Board of the hospital (KMUH-IRB-2014-73). Atotal of 39,503 diagnosed cases in the HN region between2000 and 2011 were retrieved from the database of theOral Pathology Department. With the exclusion of normaltissues and lesions without specific findings, a pool of37,210 cases was included for analyses. Age, sex, andhistological diagnoses were recorded for these HN lesions,which were classified into four main categories: tumor/tumor-like reactive lesions, cystic/pseudocystic lesions,inflammatory/infective lesions, and others/miscellaneouslesions.Statistical analyses (chi-square test/binominal propor-
tion test) for prevalence rates of the lesions, age and sexdistributions of the patients were performed using SASStatistical Package (Version 9.1.3, SAS Institute Inc.,Cary, NC, USA). Since the number of the items of sometables was as large as approximately 50, we employedthe Bonferroni method (threshold of p = 0.001; p0/N,p0 = 0.05, N = 50 items) for multiple testing-adjusted cor-rections. Hence, the results were considered significantwhen the p value was < 0.001 (i.e. 0.05/50). If p < 0.0001,the research findings were very highly significant.
ResultsThe frequencies of the 12 most common HN lesions, witha total number of 28,783, comprised 77.3% of all the le-sions in the current study, are shown in Table 1. The mostcommon disease in the present cohort was squamous cellcarcinoma (SCC, 13.3%), followed by hyperkeratosis (HK,12.8%), epithelial dysplasia (ED, 7.8%), candidiasis (6.8%),oral submucous fibrosis (OSF, 6.7%) and epithelialhyperplasia (EH, 6.4%); the aforementioned first six
Table 1 Number and percentages of the 12 mostcommon head & neck lesions
12 most common lesions Number % of all lesions
Squamous cell carcinoma 4960 13.3
Hyperkeratosis* 4779 12.8
Epithelial dysplasia* 2899 7.8
Candidiasis 2535 6.8
Oral submucous fibrosis* 2500 6.7
Epithelial hyperplasia* 2371 6.4
Verrucous hyperplasia* 1850 5.0
Inflammation 1821 4.9
Radicular cyst 1720 4.6
Apical granuloma 1395 3.8
Non-specific ulcer 986 2.6
Mucocele 967 2.6
Total number 28783 77.3
*Oral potentially malignant disorders.
most common lesions constituted more than 50% of allthe HN lesions. With the exception of HK, the percent-age of SCC was significant higher than ED, candidiasis,OSF, and EH (p < 0.0001).Various groups of HN lesions are classified in Table 2.
The highest number of lesions were distributed in thegroup of oral potentially malignant disorders (38.7%),followed by the groups of inflammatory/infective lesions(31.6%) and non-odontogenic malignant lesions (16.2%).In contrast, the lowest number of lesions was found in thenon-odontogenic cystic/pseudocystic group, in which only91 cases were included. The percentage of oral potentiallymalignant disorders was significant higher than inflamma-tory/infective lesions and non-odontogenic malignant le-sions (p < 0.0001). Also, the percentage of inflammatory/infective lesions was significant higher than and non-odontogenic malignant lesions (p < 0.0001).The sex and age distribution of the HN lesion patients
is shown in Table 3. Most lesions were distributed inthe range of 50–59 years, followed by 40–49 years, and30–39 years, all of which comprised more than 70.0% ofall HN lesions. The percentage of the patients in the rangeof 50–59 years was significantly higher than the rangesof 40–49 years and 30–39 year respectively (p < 0.0001)whilst the percentage of the range of 40–49 year was
Salivary gland 96 0.26
Epithelial 118 0.32
Soft tissue 1251 3.36
Non-odontogenic (oralpotentially malignant disorder)
Epithelial 14399 38.70
Non-odontogenic (malignant)
Mesenchymal 15 0.04
Hematologic 45 0.12
Salivary gland 82 0.22
Epithelial 5886 15.82
Cystic/pseudocysticlesions
Odontogenic 2274 6.11
Non-odontogenic 91 0.25
Inflammatory/infective lesions
11775 31.65
Others/miscellanouslesions
562 1.51
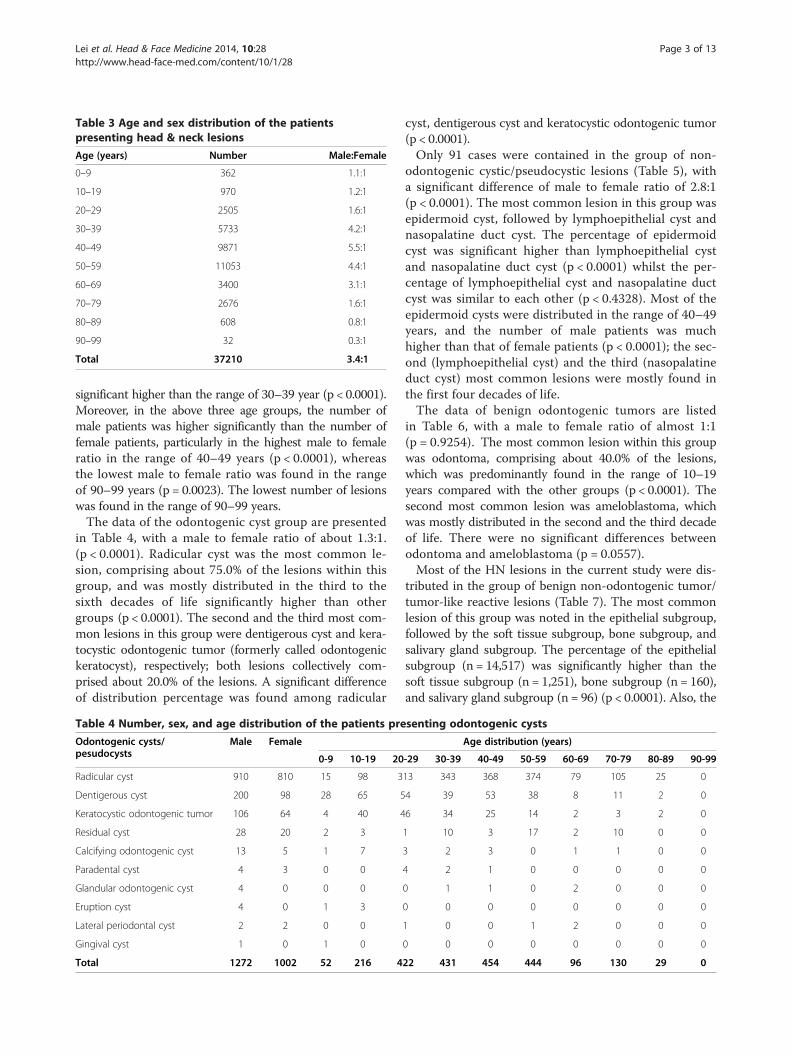
Table 3 Age and sex distribution of the patientspresenting head & neck lesions
Age (years) Number Male:Female
0–9 362 1.1:1
10–19 970 1.2:1
20–29 2505 1.6:1
30–39 5733 4.2:1
40–49 9871 5.5:1
50–59 11053 4.4:1
60–69 3400 3.1:1
70–79 2676 1.6:1
80–89 608 0.8:1
90–99 32 0.3:1
Total 37210 3.4:1
Lei et al. Head & Face Medicine 2014, 10:28 Page 3 of 13http://www.head-face-med.com/content/10/1/28
significant higher than the range of 30–39 year (p < 0.0001).Moreover, in the above three age groups, the number ofmale patients was higher significantly than the number offemale patients, particularly in the highest male to femaleratio in the range of 40–49 years (p < 0.0001), whereasthe lowest male to female ratio was found in the rangeof 90–99 years (p = 0.0023). The lowest number of lesionswas found in the range of 90–99 years.The data of the odontogenic cyst group are presented
in Table 4, with a male to female ratio of about 1.3:1.(p < 0.0001). Radicular cyst was the most common le-sion, comprising about 75.0% of the lesions within thisgroup, and was mostly distributed in the third to thesixth decades of life significantly higher than othergroups (p < 0.0001). The second and the third most com-mon lesions in this group were dentigerous cyst and kera-tocystic odontogenic tumor (formerly called odontogenickeratocyst), respectively; both lesions collectively com-prised about 20.0% of the lesions. A significant differenceof distribution percentage was found among radicular
Table 4 Number, sex, and age distribution of the patients pre
Odontogenic cysts/pesudocysts
Male Female
0-9 10-19 20
Radicular cyst 910 810 15 98 3
Dentigerous cyst 200 98 28 65 5
Keratocystic odontogenic tumor 106 64 4 40 4
Residual cyst 28 20 2 3
Calcifying odontogenic cyst 13 5 1 7
Paradental cyst 4 3 0 0
Glandular odontogenic cyst 4 0 0 0
Eruption cyst 4 0 1 3
Lateral periodontal cyst 2 2 0 0
Gingival cyst 1 0 1 0
Total 1272 1002 52 216 4
cyst, dentigerous cyst and keratocystic odontogenic tumor(p < 0.0001).Only 91 cases were contained in the group of non-
odontogenic cystic/pseudocystic lesions (Table 5), witha significant difference of male to female ratio of 2.8:1(p < 0.0001). The most common lesion in this group wasepidermoid cyst, followed by lymphoepithelial cyst andnasopalatine duct cyst. The percentage of epidermoidcyst was significant higher than lymphoepithelial cystand nasopalatine duct cyst (p < 0.0001) whilst the per-centage of lymphoepithelial cyst and nasopalatine ductcyst was similar to each other (p < 0.4328). Most of theepidermoid cysts were distributed in the range of 40–49years, and the number of male patients was muchhigher than that of female patients (p < 0.0001); the sec-ond (lymphoepithelial cyst) and the third (nasopalatineduct cyst) most common lesions were mostly found inthe first four decades of life.The data of benign odontogenic tumors are listed
in Table 6, with a male to female ratio of almost 1:1(p = 0.9254). The most common lesion within this groupwas odontoma, comprising about 40.0% of the lesions,which was predominantly found in the range of 10–19years compared with the other groups (p < 0.0001). Thesecond most common lesion was ameloblastoma, whichwas mostly distributed in the second and the third decadeof life. There were no significant differences betweenodontoma and ameloblastoma (p = 0.0557).Most of the HN lesions in the current study were dis-
tributed in the group of benign non-odontogenic tumor/tumor-like reactive lesions (Table 7). The most commonlesion of this group was noted in the epithelial subgroup,followed by the soft tissue subgroup, bone subgroup, andsalivary gland subgroup. The percentage of the epithelialsubgroup (n = 14,517) was significantly higher than thesoft tissue subgroup (n = 1,251), bone subgroup (n = 160),and salivary gland subgroup (n = 96) (p < 0.0001). Also, the
senting odontogenic cysts
Age distribution (years)
-29 30-39 40-49 50-59 60-69 70-79 80-89 90-99
13 343 368 374 79 105 25 0
4 39 53 38 8 11 2 0
6 34 25 14 2 3 2 0
1 10 3 17 2 10 0 0
3 2 3 0 1 1 0 0
4 2 1 0 0 0 0 0
0 1 1 0 2 0 0 0
0 0 0 0 0 0 0 0
1 0 0 1 2 0 0 0
0 0 0 0 0 0 0 0
22 431 454 444 96 130 29 0
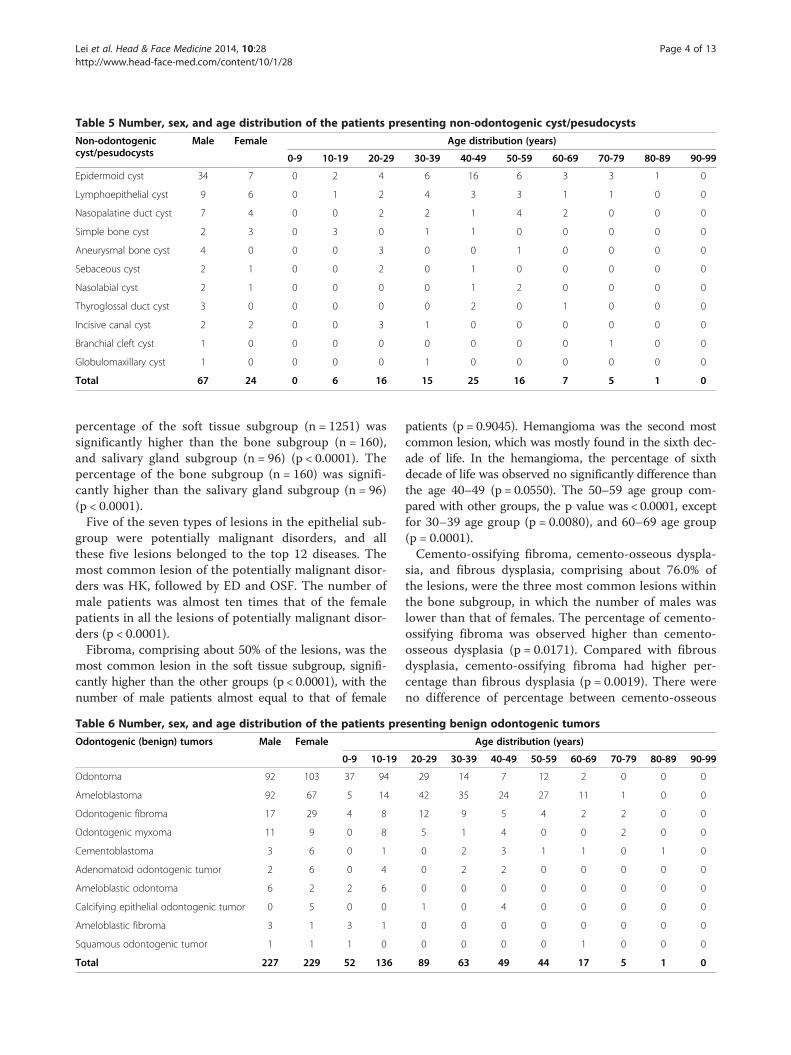
Table 5 Number, sex, and age distribution of the patients presenting non-odontogenic cyst/pesudocysts
Non-odontogeniccyst/pesudocysts
Male Female Age distribution (years)
0-9 10-19 20-29 30-39 40-49 50-59 60-69 70-79 80-89 90-99
Epidermoid cyst 34 7 0 2 4 6 16 6 3 3 1 0
Lymphoepithelial cyst 9 6 0 1 2 4 3 3 1 1 0 0
Nasopalatine duct cyst 7 4 0 0 2 2 1 4 2 0 0 0
Simple bone cyst 2 3 0 3 0 1 1 0 0 0 0 0
Aneurysmal bone cyst 4 0 0 0 3 0 0 1 0 0 0 0
Sebaceous cyst 2 1 0 0 2 0 1 0 0 0 0 0
Nasolabial cyst 2 1 0 0 0 0 1 2 0 0 0 0
Thyroglossal duct cyst 3 0 0 0 0 0 2 0 1 0 0 0
Incisive canal cyst 2 2 0 0 3 1 0 0 0 0 0 0
Branchial cleft cyst 1 0 0 0 0 0 0 0 0 1 0 0
Globulomaxillary cyst 1 0 0 0 0 1 0 0 0 0 0 0
Total 67 24 0 6 16 15 25 16 7 5 1 0
Lei et al. Head & Face Medicine 2014, 10:28 Page 4 of 13http://www.head-face-med.com/content/10/1/28
percentage of the soft tissue subgroup (n = 1251) wassignificantly higher than the bone subgroup (n = 160),and salivary gland subgroup (n = 96) (p < 0.0001). Thepercentage of the bone subgroup (n = 160) was signifi-cantly higher than the salivary gland subgroup (n = 96)(p < 0.0001).Five of the seven types of lesions in the epithelial sub-
group were potentially malignant disorders, and allthese five lesions belonged to the top 12 diseases. Themost common lesion of the potentially malignant disor-ders was HK, followed by ED and OSF. The number ofmale patients was almost ten times that of the femalepatients in all the lesions of potentially malignant disor-ders (p < 0.0001).Fibroma, comprising about 50% of the lesions, was the
most common lesion in the soft tissue subgroup, signifi-cantly higher than the other groups (p < 0.0001), with thenumber of male patients almost equal to that of female
Table 6 Number, sex, and age distribution of the patients pre
Odontogenic (benign) tumors Male Female
0-9 10-19
Odontoma 92 103 37 94
Ameloblastoma 92 67 5 14
Odontogenic fibroma 17 29 4 8
Odontogenic myxoma 11 9 0 8
Cementoblastoma 3 6 0 1
Adenomatoid odontogenic tumor 2 6 0 4
Ameloblastic odontoma 6 2 2 6
Calcifying epithelial odontogenic tumor 0 5 0 0
Ameloblastic fibroma 3 1 3 1
Squamous odontogenic tumor 1 1 1 0
Total 227 229 52 136
patients (p= 0.9045). Hemangioma was the second mostcommon lesion, which was mostly found in the sixth dec-ade of life. In the hemangioma, the percentage of sixthdecade of life was observed no significantly difference thanthe age 40–49 (p = 0.0550). The 50–59 age group com-pared with other groups, the p value was < 0.0001, exceptfor 30–39 age group (p = 0.0080), and 60–69 age group(p = 0.0001).Cemento-ossifying fibroma, cemento-osseous dyspla-
sia, and fibrous dysplasia, comprising about 76.0% ofthe lesions, were the three most common lesions withinthe bone subgroup, in which the number of males waslower than that of females. The percentage of cemento-ossifying fibroma was observed higher than cemento-osseous dysplasia (p = 0.0171). Compared with fibrousdysplasia, cemento-ossifying fibroma had higher per-centage than fibrous dysplasia (p = 0.0019). There wereno difference of percentage between cemento-osseous
senting benign odontogenic tumors
Age distribution (years)
20-29 30-39 40-49 50-59 60-69 70-79 80-89 90-99
29 14 7 12 2 0 0 0
42 35 24 27 11 1 0 0
12 9 5 4 2 2 0 0
5 1 4 0 0 2 0 0
0 2 3 1 1 0 1 0
0 2 2 0 0 0 0 0
0 0 0 0 0 0 0 0
1 0 4 0 0 0 0 0
0 0 0 0 0 0 0 0
0 0 0 0 1 0 0 0
89 63 49 44 17 5 1 0
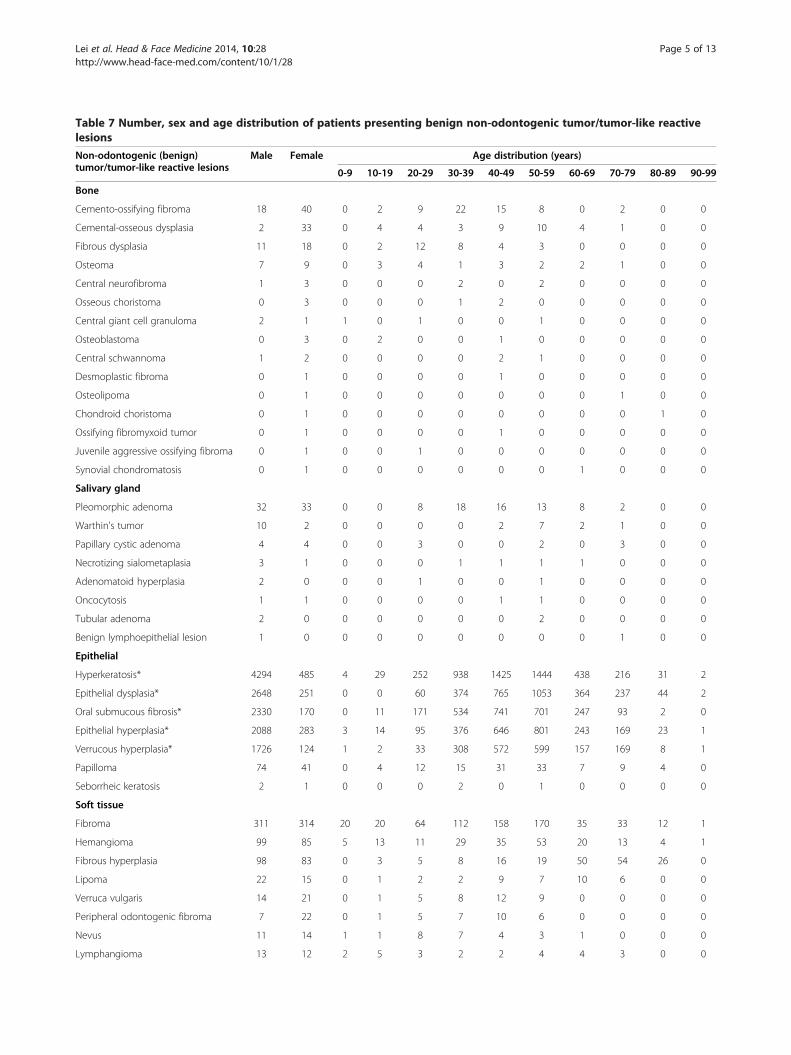
Table 7 Number, sex and age distribution of patients presenting benign non-odontogenic tumor/tumor-like reactivelesions
Non-odontogenic (benign)tumor/tumor-like reactive lesions
Male Female Age distribution (years)
0-9 10-19 20-29 30-39 40-49 50-59 60-69 70-79 80-89 90-99
Bone
Cemento-ossifying fibroma 18 40 0 2 9 22 15 8 0 2 0 0
Cemental-osseous dysplasia 2 33 0 4 4 3 9 10 4 1 0 0
Fibrous dysplasia 11 18 0 2 12 8 4 3 0 0 0 0
Osteoma 7 9 0 3 4 1 3 2 2 1 0 0
Central neurofibroma 1 3 0 0 0 2 0 2 0 0 0 0
Osseous choristoma 0 3 0 0 0 1 2 0 0 0 0 0
Central giant cell granuloma 2 1 1 0 1 0 0 1 0 0 0 0
Osteoblastoma 0 3 0 2 0 0 1 0 0 0 0 0
Central schwannoma 1 2 0 0 0 0 2 1 0 0 0 0
Desmoplastic fibroma 0 1 0 0 0 0 1 0 0 0 0 0
Osteolipoma 0 1 0 0 0 0 0 0 0 1 0 0
Chondroid choristoma 0 1 0 0 0 0 0 0 0 0 1 0
Ossifying fibromyxoid tumor 0 1 0 0 0 0 1 0 0 0 0 0
Juvenile aggressive ossifying fibroma 0 1 0 0 1 0 0 0 0 0 0 0
Synovial chondromatosis 0 1 0 0 0 0 0 0 1 0 0 0
Salivary gland
Pleomorphic adenoma 32 33 0 0 8 18 16 13 8 2 0 0
Warthin's tumor 10 2 0 0 0 0 2 7 2 1 0 0
Papillary cystic adenoma 4 4 0 0 3 0 0 2 0 3 0 0
Necrotizing sialometaplasia 3 1 0 0 0 1 1 1 1 0 0 0
Adenomatoid hyperplasia 2 0 0 0 1 0 0 1 0 0 0 0
Oncocytosis 1 1 0 0 0 0 1 1 0 0 0 0
Tubular adenoma 2 0 0 0 0 0 0 2 0 0 0 0
Benign lymphoepithelial lesion 1 0 0 0 0 0 0 0 0 1 0 0
Epithelial
Hyperkeratosis* 4294 485 4 29 252 938 1425 1444 438 216 31 2
Epithelial dysplasia* 2648 251 0 0 60 374 765 1053 364 237 44 2
Oral submucous fibrosis* 2330 170 0 11 171 534 741 701 247 93 2 0
Epithelial hyperplasia* 2088 283 3 14 95 376 646 801 243 169 23 1
Verrucous hyperplasia* 1726 124 1 2 33 308 572 599 157 169 8 1
Papilloma 74 41 0 4 12 15 31 33 7 9 4 0
Seborrheic keratosis 2 1 0 0 0 2 0 1 0 0 0 0
Soft tissue
Fibroma 311 314 20 20 64 112 158 170 35 33 12 1
Hemangioma 99 85 5 13 11 29 35 53 20 13 4 1
Fibrous hyperplasia 98 83 0 3 5 8 16 19 50 54 26 0
Lipoma 22 15 0 1 2 2 9 7 10 6 0 0
Verruca vulgaris 14 21 0 1 5 8 12 9 0 0 0 0
Peripheral odontogenic fibroma 7 22 0 1 5 7 10 6 0 0 0 0
Nevus 11 14 1 1 8 7 4 3 1 0 0 0
Lymphangioma 13 12 2 5 3 2 2 4 4 3 0 0
Lei et al. Head & Face Medicine 2014, 10:28 Page 5 of 13http://www.head-face-med.com/content/10/1/28
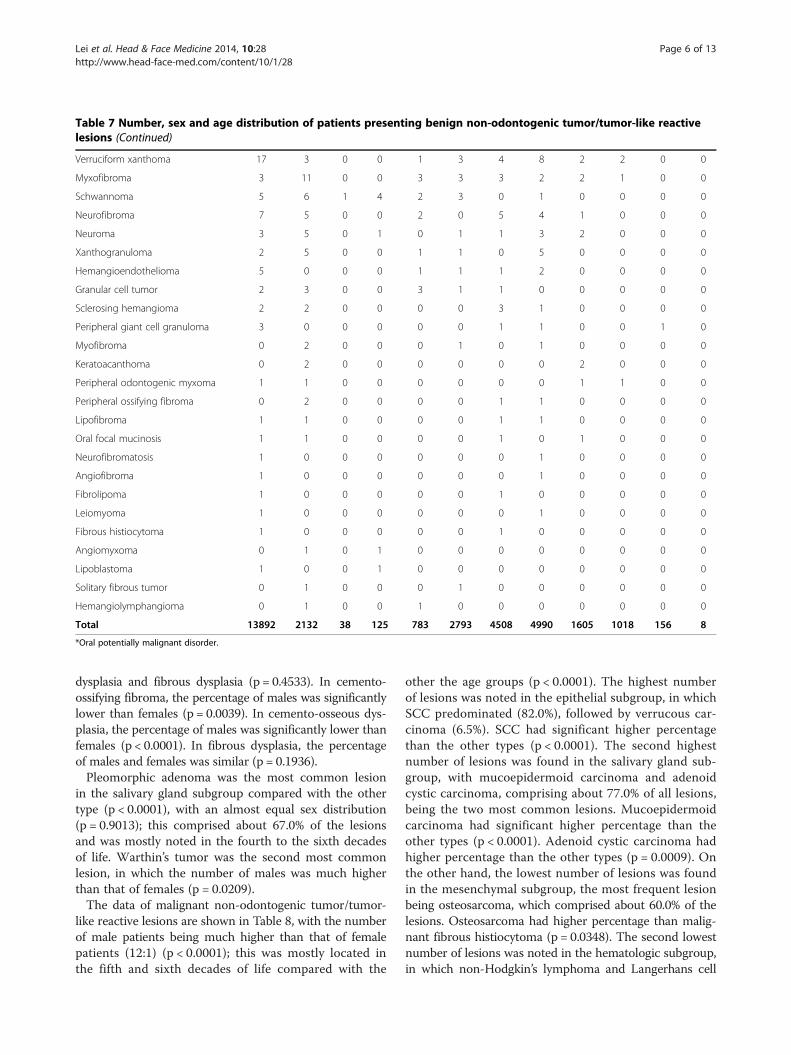
Table 7 Number, sex and age distribution of patients presenting benign non-odontogenic tumor/tumor-like reactivelesions (Continued)
Verruciform xanthoma 17 3 0 0 1 3 4 8 2 2 0 0
Myxofibroma 3 11 0 0 3 3 3 2 2 1 0 0
Schwannoma 5 6 1 4 2 3 0 1 0 0 0 0
Neurofibroma 7 5 0 0 2 0 5 4 1 0 0 0
Neuroma 3 5 0 1 0 1 1 3 2 0 0 0
Xanthogranuloma 2 5 0 0 1 1 0 5 0 0 0 0
Hemangioendothelioma 5 0 0 0 1 1 1 2 0 0 0 0
Granular cell tumor 2 3 0 0 3 1 1 0 0 0 0 0
Sclerosing hemangioma 2 2 0 0 0 0 3 1 0 0 0 0
Peripheral giant cell granuloma 3 0 0 0 0 0 1 1 0 0 1 0
Myofibroma 0 2 0 0 0 1 0 1 0 0 0 0
Keratoacanthoma 0 2 0 0 0 0 0 0 2 0 0 0
Peripheral odontogenic myxoma 1 1 0 0 0 0 0 0 1 1 0 0
Peripheral ossifying fibroma 0 2 0 0 0 0 1 1 0 0 0 0
Lipofibroma 1 1 0 0 0 0 1 1 0 0 0 0
Oral focal mucinosis 1 1 0 0 0 0 1 0 1 0 0 0
Neurofibromatosis 1 0 0 0 0 0 0 1 0 0 0 0
Angiofibroma 1 0 0 0 0 0 0 1 0 0 0 0
Fibrolipoma 1 0 0 0 0 0 1 0 0 0 0 0
Leiomyoma 1 0 0 0 0 0 0 1 0 0 0 0
Fibrous histiocytoma 1 0 0 0 0 0 1 0 0 0 0 0
Angiomyxoma 0 1 0 1 0 0 0 0 0 0 0 0
Lipoblastoma 1 0 0 1 0 0 0 0 0 0 0 0
Solitary fibrous tumor 0 1 0 0 0 1 0 0 0 0 0 0
Hemangiolymphangioma 0 1 0 0 1 0 0 0 0 0 0 0
Total 13892 2132 38 125 783 2793 4508 4990 1605 1018 156 8
*Oral potentially malignant disorder.
Lei et al. Head & Face Medicine 2014, 10:28 Page 6 of 13http://www.head-face-med.com/content/10/1/28
dysplasia and fibrous dysplasia (p = 0.4533). In cemento-ossifying fibroma, the percentage of males was significantlylower than females (p = 0.0039). In cemento-osseous dys-plasia, the percentage of males was significantly lower thanfemales (p < 0.0001). In fibrous dysplasia, the percentageof males and females was similar (p = 0.1936).Pleomorphic adenoma was the most common lesion
in the salivary gland subgroup compared with the othertype (p < 0.0001), with an almost equal sex distribution(p = 0.9013); this comprised about 67.0% of the lesionsand was mostly noted in the fourth to the sixth decadesof life. Warthin’s tumor was the second most commonlesion, in which the number of males was much higherthan that of females (p = 0.0209).The data of malignant non-odontogenic tumor/tumor-
like reactive lesions are shown in Table 8, with the numberof male patients being much higher than that of femalepatients (12:1) (p < 0.0001); this was mostly located inthe fifth and sixth decades of life compared with the
other the age groups (p < 0.0001). The highest numberof lesions was noted in the epithelial subgroup, in whichSCC predominated (82.0%), followed by verrucous car-cinoma (6.5%). SCC had significant higher percentagethan the other types (p < 0.0001). The second highestnumber of lesions was found in the salivary gland sub-group, with mucoepidermoid carcinoma and adenoidcystic carcinoma, comprising about 77.0% of all lesions,being the two most common lesions. Mucoepidermoidcarcinoma had significant higher percentage than theother types (p < 0.0001). Adenoid cystic carcinoma hadhigher percentage than the other types (p = 0.0009). Onthe other hand, the lowest number of lesions was foundin the mesenchymal subgroup, the most frequent lesionbeing osteosarcoma, which comprised about 60.0% of thelesions. Osteosarcoma had higher percentage than malig-nant fibrous histiocytoma (p = 0.0348). The second lowestnumber of lesions was noted in the hematologic subgroup,in which non-Hodgkin’s lymphoma and Langerhans cell

Table 8 Number, sex and age distribution of patients presenting malignant non-odontogenic tumors
Non-odontogenic (malignant)tumors
Male Female Age distribution (years)
0-9 10-19 20-29 30-39 40-49 50-59 60-69 70-79 80-89 90-99
Mesenchymal
Osteosarcoma 3 6 0 3 0 0 0 3 1 1 1 0
Malignant fibrous histiocytoma 2 0 0 0 0 0 0 2 0 0 0 0
Malignant solitary fibrous tumor 1 0 0 0 0 1 0 0 0 0 0 0
Neuroblastoma 0 1 1 0 0 0 0 0 0 0 0 0
Ewing sarcoma 1 0 0 1 0 0 0 0 0 0 0 0
Chondrosarcoma 0 1 0 0 0 0 0 1 0 0 0 0
Hematologic
Non-Hodgkin's lymphoma 13 6 0 1 3 0 5 5 0 4 1 0
Langerhans cell histocytosis 12 0 0 0 2 6 2 2 0 0 0 0
Plasmacytoma 3 4 0 0 0 0 5 2 0 0 0 0
Leukemia 0 3 2 0 0 0 1 0 0 0 0 0
Hodgkin's lymphoma 1 1 0 0 0 0 0 0 0 2 0 0
Malignant hemangioendothelioma 0 1 0 0 1 0 0 0 0 0 0 0
Multiple myeloma 0 1 0 0 0 0 0 0 0 1 0 0
Salivary gland
Mucoepidermoid carcinoma 19 16 0 0 7 9 7 6 0 3 3 0
Adenoid cystic carcinoma 18 10 0 0 1 4 3 5 0 12 3 0
Papillary cystic adenocarcinoma 6 2 0 0 0 0 0 0 0 6 2 0
Adenocarcinoma, NOS 4 3 0 0 2 0 2 3 0 0 0 0
Salivary duct carcinoma 2 1 0 0 1 2 0 0 0 0 0 0
Acinic cell carcinoma 1 0 0 0 0 0 0 0 0 1 0 0
Epithelial
Squamous cell carcinoma 4628 332 0 0 49 603 1709 1735 439 350 71 4
Verrucous carcinoma 359 34 0 1 0 42 113 136 40 52 9 0
Metastatic carcinoma 319 29 0 0 0 46 137 128 22 14 1 0
Carcinoma in situ 142 13 0 0 1 23 40 53 18 16 4 0
Undifferentiated carcinoma 11 4 0 0 0 2 2 3 2 3 3 0
Spindle cell carcinoma 10 1 0 0 0 4 1 4 0 2 0 0
Carcinosarcoma 3 1 0 0 0 1 2 1 0 0 0 0
Total 5558 470 3 6 67 743 2029 2089 522 467 98 4
Lei et al. Head & Face Medicine 2014, 10:28 Page 7 of 13http://www.head-face-med.com/content/10/1/28
histocytosis, comprising about 81.5% of the lesions, werethe two most frequent lesions.The second greatest number of HN lesions was noted
in the inflammatory/infective group (Table 9), which com-prised about 31.8% of all the HN lesions, with a male to fe-male ratio of about 1.7:1 (p < 0.0001). Candidiasis was themost common lesion in this group, followed by inflamma-tion, with both lesions being located in the range of 50–59years. In candidiasis, the 50–59 years had significanthigher percentage than the other age groups (p < 0.0001).In inflammation, the 50–59 years had significant higherpercentage than the other age groups (p < 0.0001), except
for 40–49 age group (p = 0.0112). Apical granuloma, dis-tributed evenly in the fourth to the sixth decades of age,was the third most common lesion in this group.The data of the others/miscellaneous lesions are shown
in Table 10, with the number of female patients beingslightly higher than that of the male patients (p = 0.8660).Exostosis, mostly distributed in the range of 50–59years, was the most common lesion within this groupand comprised about 44.0% of the lesions. The exostosishad the highest percentage than other types significantly(p < 0.0001). Dense fibrotic dental follicle was the sec-ond most common lesion, which occurred mostly in the
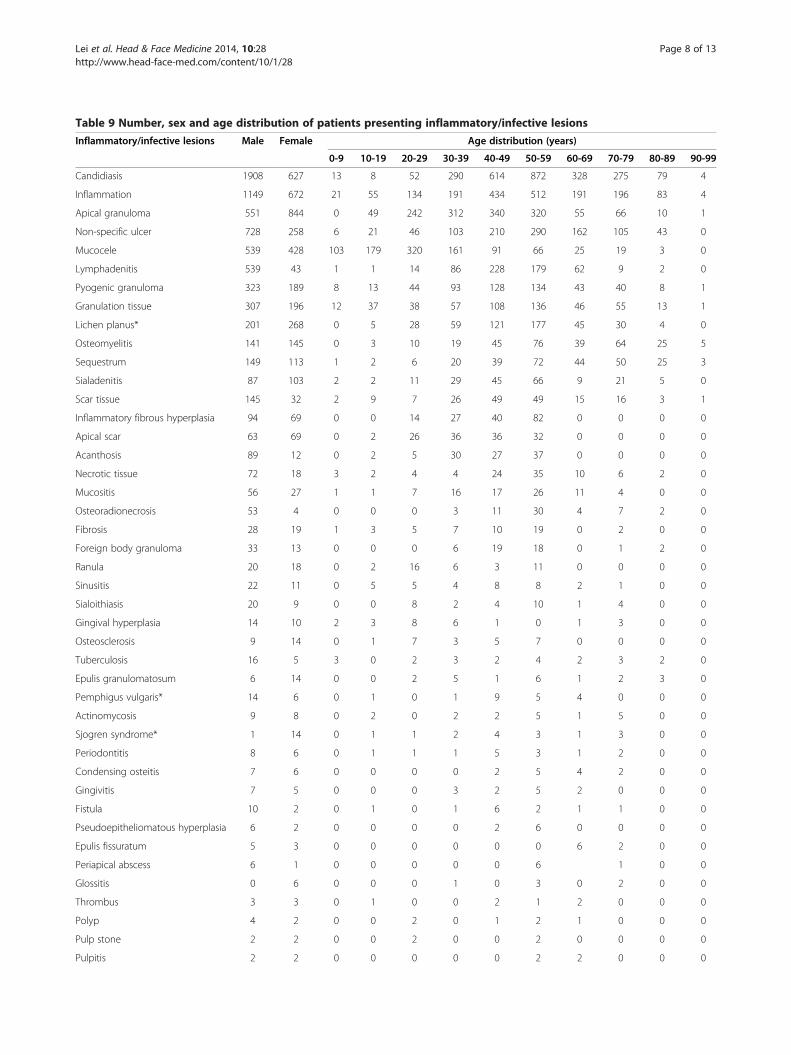
Table 9 Number, sex and age distribution of patients presenting inflammatory/infective lesions
Inflammatory/infective lesions Male Female Age distribution (years)
0-9 10-19 20-29 30-39 40-49 50-59 60-69 70-79 80-89 90-99
Candidiasis 1908 627 13 8 52 290 614 872 328 275 79 4
Inflammation 1149 672 21 55 134 191 434 512 191 196 83 4
Apical granuloma 551 844 0 49 242 312 340 320 55 66 10 1
Non-specific ulcer 728 258 6 21 46 103 210 290 162 105 43 0
Mucocele 539 428 103 179 320 161 91 66 25 19 3 0
Lymphadenitis 539 43 1 1 14 86 228 179 62 9 2 0
Pyogenic granuloma 323 189 8 13 44 93 128 134 43 40 8 1
Granulation tissue 307 196 12 37 38 57 108 136 46 55 13 1
Lichen planus* 201 268 0 5 28 59 121 177 45 30 4 0
Osteomyelitis 141 145 0 3 10 19 45 76 39 64 25 5
Sequestrum 149 113 1 2 6 20 39 72 44 50 25 3
Sialadenitis 87 103 2 2 11 29 45 66 9 21 5 0
Scar tissue 145 32 2 9 7 26 49 49 15 16 3 1
Inflammatory fibrous hyperplasia 94 69 0 0 14 27 40 82 0 0 0 0
Apical scar 63 69 0 2 26 36 36 32 0 0 0 0
Acanthosis 89 12 0 2 5 30 27 37 0 0 0 0
Necrotic tissue 72 18 3 2 4 4 24 35 10 6 2 0
Mucositis 56 27 1 1 7 16 17 26 11 4 0 0
Osteoradionecrosis 53 4 0 0 0 3 11 30 4 7 2 0
Fibrosis 28 19 1 3 5 7 10 19 0 2 0 0
Foreign body granuloma 33 13 0 0 0 6 19 18 0 1 2 0
Ranula 20 18 0 2 16 6 3 11 0 0 0 0
Sinusitis 22 11 0 5 5 4 8 8 2 1 0 0
Sialoithiasis 20 9 0 0 8 2 4 10 1 4 0 0
Gingival hyperplasia 14 10 2 3 8 6 1 0 1 3 0 0
Osteosclerosis 9 14 0 1 7 3 5 7 0 0 0 0
Tuberculosis 16 5 3 0 2 3 2 4 2 3 2 0
Epulis granulomatosum 6 14 0 0 2 5 1 6 1 2 3 0
Pemphigus vulgaris* 14 6 0 1 0 1 9 5 4 0 0 0
Actinomycosis 9 8 0 2 0 2 2 5 1 5 0 0
Sjogren syndrome* 1 14 0 1 1 2 4 3 1 3 0 0
Periodontitis 8 6 0 1 1 1 5 3 1 2 0 0
Condensing osteitis 7 6 0 0 0 0 2 5 4 2 0 0
Gingivitis 7 5 0 0 0 3 2 5 2 0 0 0
Fistula 10 2 0 1 0 1 6 2 1 1 0 0
Pseudoepitheliomatous hyperplasia 6 2 0 0 0 0 2 6 0 0 0 0
Epulis fissuratum 5 3 0 0 0 0 0 0 6 2 0 0
Periapical abscess 6 1 0 0 0 0 0 6 1 0 0
Glossitis 0 6 0 0 0 1 0 3 0 2 0 0
Thrombus 3 3 0 1 0 0 2 1 2 0 0 0
Polyp 4 2 0 0 2 0 1 2 1 0 0 0
Pulp stone 2 2 0 0 2 0 0 2 0 0 0 0
Pulpitis 2 2 0 0 0 0 0 2 2 0 0 0
Lei et al. Head & Face Medicine 2014, 10:28 Page 8 of 13http://www.head-face-med.com/content/10/1/28
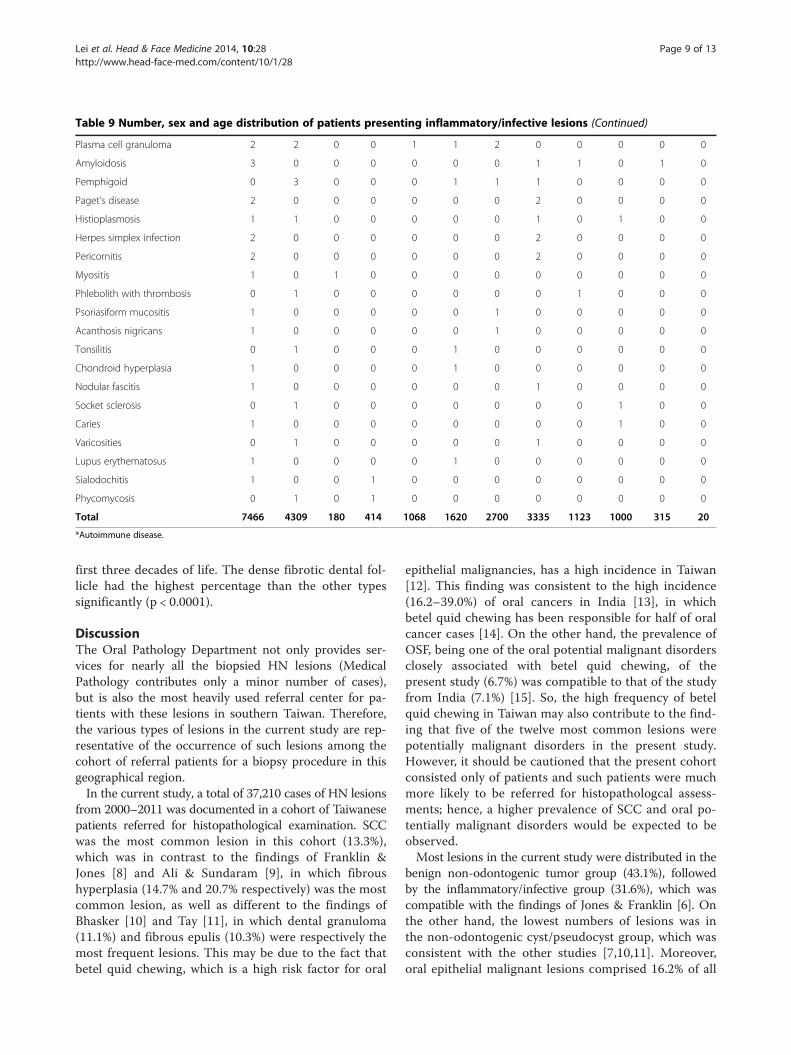
Table 9 Number, sex and age distribution of patients presenting inflammatory/infective lesions (Continued)
Plasma cell granuloma 2 2 0 0 1 1 2 0 0 0 0 0
Amyloidosis 3 0 0 0 0 0 0 1 1 0 1 0
Pemphigoid 0 3 0 0 0 1 1 1 0 0 0 0
Paget's disease 2 0 0 0 0 0 0 2 0 0 0 0
Histioplasmosis 1 1 0 0 0 0 0 1 0 1 0 0
Herpes simplex infection 2 0 0 0 0 0 0 2 0 0 0 0
Pericornitis 2 0 0 0 0 0 0 2 0 0 0 0
Myositis 1 0 1 0 0 0 0 0 0 0 0 0
Phlebolith with thrombosis 0 1 0 0 0 0 0 0 1 0 0 0
Psoriasiform mucositis 1 0 0 0 0 0 1 0 0 0 0 0
Acanthosis nigricans 1 0 0 0 0 0 1 0 0 0 0 0
Tonsilitis 0 1 0 0 0 1 0 0 0 0 0 0
Chondroid hyperplasia 1 0 0 0 0 1 0 0 0 0 0 0
Nodular fascitis 1 0 0 0 0 0 0 1 0 0 0 0
Socket sclerosis 0 1 0 0 0 0 0 0 0 1 0 0
Caries 1 0 0 0 0 0 0 0 0 1 0 0
Varicosities 0 1 0 0 0 0 0 1 0 0 0 0
Lupus erythematosus 1 0 0 0 0 1 0 0 0 0 0 0
Sialodochitis 1 0 0 1 0 0 0 0 0 0 0 0
Phycomycosis 0 1 0 1 0 0 0 0 0 0 0 0
Total 7466 4309 180 414 1068 1620 2700 3335 1123 1000 315 20
*Autoimmune disease.
Lei et al. Head & Face Medicine 2014, 10:28 Page 9 of 13http://www.head-face-med.com/content/10/1/28
first three decades of life. The dense fibrotic dental fol-licle had the highest percentage than the other typessignificantly (p < 0.0001).
DiscussionThe Oral Pathology Department not only provides ser-vices for nearly all the biopsied HN lesions (MedicalPathology contributes only a minor number of cases),but is also the most heavily used referral center for pa-tients with these lesions in southern Taiwan. Therefore,the various types of lesions in the current study are rep-resentative of the occurrence of such lesions among thecohort of referral patients for a biopsy procedure in thisgeographical region.In the current study, a total of 37,210 cases of HN lesions
from 2000–2011 was documented in a cohort of Taiwanesepatients referred for histopathological examination. SCCwas the most common lesion in this cohort (13.3%),which was in contrast to the findings of Franklin &Jones [8] and Ali & Sundaram [9], in which fibroushyperplasia (14.7% and 20.7% respectively) was the mostcommon lesion, as well as different to the findings ofBhasker [10] and Tay [11], in which dental granuloma(11.1%) and fibrous epulis (10.3%) were respectively themost frequent lesions. This may be due to the fact thatbetel quid chewing, which is a high risk factor for oral
epithelial malignancies, has a high incidence in Taiwan[12]. This finding was consistent to the high incidence(16.2–39.0%) of oral cancers in India [13], in whichbetel quid chewing has been responsible for half of oralcancer cases [14]. On the other hand, the prevalence ofOSF, being one of the oral potential malignant disordersclosely associated with betel quid chewing, of thepresent study (6.7%) was compatible to that of the studyfrom India (7.1%) [15]. So, the high frequency of betelquid chewing in Taiwan may also contribute to the find-ing that five of the twelve most common lesions werepotentially malignant disorders in the present study.However, it should be cautioned that the present cohortconsisted only of patients and such patients were muchmore likely to be referred for histopathologcal assess-ments; hence, a higher prevalence of SCC and oral po-tentially malignant disorders would be expected to beobserved.Most lesions in the current study were distributed in the
benign non-odontogenic tumor group (43.1%), followedby the inflammatory/infective group (31.6%), which wascompatible with the findings of Jones & Franklin [6]. Onthe other hand, the lowest numbers of lesions was inthe non-odontogenic cyst/pseudocyst group, which wasconsistent with the other studies [7,10,11]. Moreover,oral epithelial malignant lesions comprised 16.2% of all
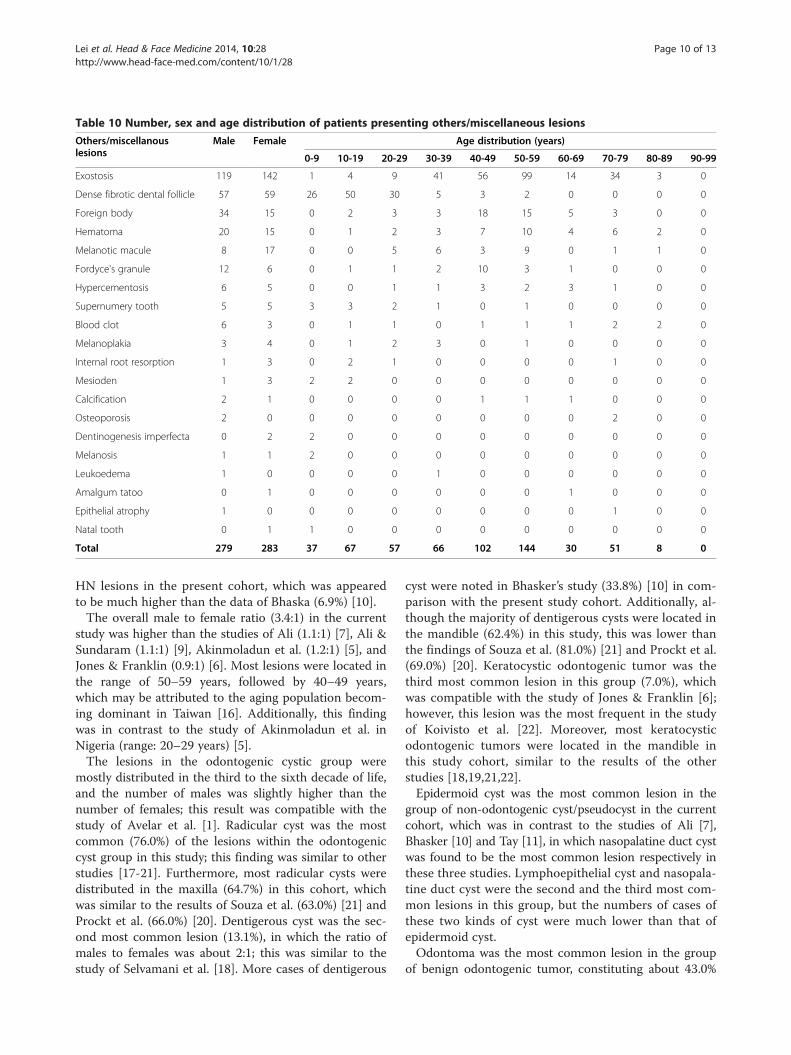
Table 10 Number, sex and age distribution of patients presenting others/miscellaneous lesions
Others/miscellanouslesions
Male Female Age distribution (years)
0-9 10-19 20-29 30-39 40-49 50-59 60-69 70-79 80-89 90-99
Exostosis 119 142 1 4 9 41 56 99 14 34 3 0
Dense fibrotic dental follicle 57 59 26 50 30 5 3 2 0 0 0 0
Foreign body 34 15 0 2 3 3 18 15 5 3 0 0
Hematoma 20 15 0 1 2 3 7 10 4 6 2 0
Melanotic macule 8 17 0 0 5 6 3 9 0 1 1 0
Fordyce's granule 12 6 0 1 1 2 10 3 1 0 0 0
Hypercementosis 6 5 0 0 1 1 3 2 3 1 0 0
Supernumery tooth 5 5 3 3 2 1 0 1 0 0 0 0
Blood clot 6 3 0 1 1 0 1 1 1 2 2 0
Melanoplakia 3 4 0 1 2 3 0 1 0 0 0 0
Internal root resorption 1 3 0 2 1 0 0 0 0 1 0 0
Mesioden 1 3 2 2 0 0 0 0 0 0 0 0
Calcification 2 1 0 0 0 0 1 1 1 0 0 0
Osteoporosis 2 0 0 0 0 0 0 0 0 2 0 0
Dentinogenesis imperfecta 0 2 2 0 0 0 0 0 0 0 0 0
Melanosis 1 1 2 0 0 0 0 0 0 0 0 0
Leukoedema 1 0 0 0 0 1 0 0 0 0 0 0
Amalgum tatoo 0 1 0 0 0 0 0 0 1 0 0 0
Epithelial atrophy 1 0 0 0 0 0 0 0 0 1 0 0
Natal tooth 0 1 1 0 0 0 0 0 0 0 0 0
Total 279 283 37 67 57 66 102 144 30 51 8 0
Lei et al. Head & Face Medicine 2014, 10:28 Page 10 of 13http://www.head-face-med.com/content/10/1/28
HN lesions in the present cohort, which was appearedto be much higher than the data of Bhaska (6.9%) [10].The overall male to female ratio (3.4:1) in the current
study was higher than the studies of Ali (1.1:1) [7], Ali &Sundaram (1.1:1) [9], Akinmoladun et al. (1.2:1) [5], andJones & Franklin (0.9:1) [6]. Most lesions were located inthe range of 50–59 years, followed by 40–49 years,which may be attributed to the aging population becom-ing dominant in Taiwan [16]. Additionally, this findingwas in contrast to the study of Akinmoladun et al. inNigeria (range: 20–29 years) [5].The lesions in the odontogenic cystic group were
mostly distributed in the third to the sixth decade of life,and the number of males was slightly higher than thenumber of females; this result was compatible with thestudy of Avelar et al. [1]. Radicular cyst was the mostcommon (76.0%) of the lesions within the odontogeniccyst group in this study; this finding was similar to otherstudies [17-21]. Furthermore, most radicular cysts weredistributed in the maxilla (64.7%) in this cohort, whichwas similar to the results of Souza et al. (63.0%) [21] andProckt et al. (66.0%) [20]. Dentigerous cyst was the sec-ond most common lesion (13.1%), in which the ratio ofmales to females was about 2:1; this was similar to thestudy of Selvamani et al. [18]. More cases of dentigerous
cyst were noted in Bhasker’s study (33.8%) [10] in com-parison with the present study cohort. Additionally, al-though the majority of dentigerous cysts were located inthe mandible (62.4%) in this study, this was lower thanthe findings of Souza et al. (81.0%) [21] and Prockt et al.(69.0%) [20]. Keratocystic odontogenic tumor was thethird most common lesion in this group (7.0%), whichwas compatible with the study of Jones & Franklin [6];however, this lesion was the most frequent in the studyof Koivisto et al. [22]. Moreover, most keratocysticodontogenic tumors were located in the mandible inthis study cohort, similar to the results of the otherstudies [18,19,21,22].Epidermoid cyst was the most common lesion in the
group of non-odontogenic cyst/pseudocyst in the currentcohort, which was in contrast to the studies of Ali [7],Bhasker [10] and Tay [11], in which nasopalatine duct cystwas found to be the most common lesion respectively inthese three studies. Lymphoepithelial cyst and nasopala-tine duct cyst were the second and the third most com-mon lesions in this group, but the numbers of cases ofthese two kinds of cyst were much lower than that ofepidermoid cyst.Odontoma was the most common lesion in the group
of benign odontogenic tumor, constituting about 43.0%
Lei et al. Head & Face Medicine 2014, 10:28 Page 11 of 13http://www.head-face-med.com/content/10/1/28
of the lesions, which was in contrast to the study of Ali[7]. The ratio of compound to complex odontomas inthe current study (1.8:1) was compatible with the re-sults of Bhaskar (2.1:1) [10] and Tay (2.4:1) [11] but incontrast to the data of Jones & Franklin (1:1.6) [6] andLuo & Li (1:1.4) [23]. Furthermore, most of the odonto-mas were diagnosed in the second decade of life in thestudy, which was the same as the result of Luo & Li [23].Although the majority of odontomas in the present studywere located in maxilla (56.5%), this was lower than theresults of Servato et al. (66.6%) [2] and Luo & Li (66.0%)[23]. Ameloblastoma was the second most common lesionin the study, with a male to female ratio of 1.37:1, whichwas compatible with the study of Siriwardena et al.(1.03:1) [24], who reported the average age to be 37.5 years,which was also compatible with the study (36.6 years).Additionally, similar to the other studies [2,24-26], mostameloblastomas in the present study were located in themandible. Odontogenic fibroma was the third most com-mon lesion in this group, which was different to the stud-ies of Bhaskar [10] and Tay [11], who reported that it wasthe most common lesion. Most of the odontogenic fibro-mas in our cohort were diagnosed in the third decade oflife, which was the same as the studies of Luo & Li [23]and Servato et al. [2].Pleomorphic adenoma (67.0%) and Warthin’s tumor
(12.5%) were the two most common lesions in the salivarygland subgroup, which was compatible with the results ofJaafari-Ashkavandi et al. (80.2% and 10.5%, respectively)[27] and Wang et al. (52.7% and 17.4%, respectively) [28].Most pleomorphic adenomas in the present study werelocated in the palate (60.0%), followed by the parotidgland (30.0%), which was different to the studies ofJaafari-Ashkavandi et al. [27] and Wang et al. [28], inwhich most cases were located in the parotid gland(52.2% and 52.7%, respectively). Additionally, the maleto female ratio of the cases of pleomorphic adenomawas almost 1:1 in the study, which was compatible withthe report of Jaafari-Ashkavandi et al. (1.26:1) [27]. Onthe other hand, same as the study of Wang et al. [28],most Warthin’s tumors in the present cohort were lo-cated in the parotid gland. The male to female ratio ofWarthin’s tumors in the cohort was 5:1, which washigher than the data of Wang et al. [28].Fibroma was the most common lesion (69.4%) in the
soft tissue subgroup, which was compatible with thestudies of Ali & Sundaram [9] and Jones & Franklin [6].Most of the fibromas in the current study were foundin the buccal mucosa; however, they most commonlyoccurred in the gingiva/alveolar ridge in the study ofAli & Sundaram [9]. Hemangioma was the second mostcommon lesion in the study, comprising cavernous(60.0%) and capillary (40%) types, which was compatiblewith the results of Jones & Franklin (62.0% and 38.0%,
respectively) [6]. Furthermore, most of the hemangiomasin the study were noted in the tongue, but no specificlocation has been documented in other studies [5-11].In the current study, the number of female patients
was about three times higher than that of male patients(1 : 3) in the bone subgroup, which was similar to the re-sult of Ali (1:8) [7]. Cemento-ossifying fibroma was themost common lesion within this subgroup, which was incontrast to the results of Ali [7], who reported centralgiant cell granuloma to be the most common lesion. Mostcemento-ossifying fibromas were located in the mandible,and were diagnosed most frequently in the fourth decadeof life in the current study, which was the same as the dataof MacDonald-Jankowski [29]. Cemento-osseous dysplasiawas the second most common lesion, most documentedin the fifth and sixth decades of life, and mostly in females;all these findings were compatible with the study ofAlsufyani & Lam [30]. Additionally, most of these le-sions were located in the mandible (83.0%), which wassimilar to the study of Alsufyani & Lam (81.4%) [30].The lesions within the epithelial subgroup comprised
about 39.0% of all HN lesions in the present cohort,which was much higher than the result of Amarasingheet al. (11.3%) in Sri Lanka [31]. Furthermore, the numberof males was much greater than that of females in ourstudy, which was compatible with the reports of Ali &Sundaram [9] and Thomas et al. [32]; however, an almostequal sex distribution was reported in the study of Jones &Franklin [6]. Worthy of note, five of the seven types oflesions in this subgroup were potentially malignant dis-orders, and were also categorized within the 12 mostcommon lesions; this may be due to the high frequencyof oral habits related to risk of oral malignancy inTaiwan. Most of these five potentially malignant disor-ders were documented in the fifth and sixth decades oflife, and most were found in the buccal mucosa, whichwas compatible with the study of Thomas et al. [32].HK was the most common lesion in the epithelial sub-group, followed by ED in the current study, which wascompatible with the report of Jones & Franklin [6].Compatible with the study of Ali [7], the number of le-
sions in the bone subgroup in this study was low, osteosar-coma being the most common lesion, but only nine caseswere documented. On the other hand, only 0.7% of lesionswere noted in the hematologic subgroup, which was lowerthan the study of Jones & Franklin [6].Mucoepidermoid carcinoma and adenoid cystic carcin-
oma were the two most common malignant lesions in thesalivary gland subgroup, which was similar to the resultsof Bradley & McGurk [33] and Wang et al. [28] but incontrast with the findings of Jaafari-Ashkavandi et al.[27]. The male to female ratio (1.6:1) in this subgroupwas compatible with the results of Zohreh et al. (1.2:1)[27] and Wang et al. (1.2:1) [28]. Most mucoepidermoid
Lei et al. Head & Face Medicine 2014, 10:28 Page 12 of 13http://www.head-face-med.com/content/10/1/28
carcinomas were located in the hard palate and softpalate, which was different to other studies [27,28,33].Additionally, the mean age at which mucoepidermoidcarcinoma was diagnosed in our study (37.6 years) wascompatible with the study of Wang et al. (39.5 years)[28]. On the other hand, most of the adenoid cystic car-cinomas in our cohort were located in the submandibu-lar gland, which was similar to the studies of Bradleyet al. [33] and Wang et al. [28]. Moreover, the mean age(60.5 years) at which adenoid cystic carcinoma was di-agnosed in the present study was seemed to be greaterthan the result of Wang et al. (46 years) [28].SCC was the most common HN lesion (13.3%) and
also the most frequent lesion in the epithelial subgroupof malignant non-odontogenic tumors, which was ap-peared to be higher than the findings of Jones & Franklin[6] and Tay (3.5%) [11]. Most of the oral epithelial ma-lignant lesions in the current study were located in thebuccal mucosa, which was different to the results ofHernandez-Guerrero et al. [34] from Mexico, in whichtongue cancer was the most commonly documentedmalignant lesion. The ratio of males to females in thecohort was 13.9:1, which was seemed to be much higherthan the findings of the Internal Agency for ResearchOn Cancer (3.3: 1) [35], Hernandez-Guerrero et al. (1.4 : 1)[34] and Ferlay et al. [36]. Most of the SCCs in the studywere distributed in the fifth and sixth decades of life,and the average age was 51.2 years; this result waslargely compatible with the seventh and eighth decadesof life reported in a North American population [37,38].The proportion of SCC in patients less than 40 years ofage was about 11% in this study, which was compatiblewith the finding in Indians [39]; moreover, the trend ofpatients of a younger age with oral cancer has also beendocumented in the studies from Scotland [40] and theUK [41].Candidiasis comprised 6.8% of all HN lesions, which
was appeared to be higher than the result of Jones &Franklin (1.0%) [6]. The male to female ratio of this le-sion (3:1) in the cohort was seemed to be higher thanthat of Jones & Franklin (1.69:1) [6]. Moreover, mostcases of candidiasis were located in the buccal mucosain the current study, followed by the tongue, which wasthe same as the study of Ali & Sundaram [9]. Inflamma-tion comprised 4.9% of all HN lesions, which was ap-peared to be greater than the studies of Tay (3.6%) [11]and Jones & Franklin (1.2%) [6]. Apical granuloma com-prised 3.7% of all lesions, which was lower than the re-sults of Bhaskar (12.0%) [10] and Tay (8.8%) [11]. Mostapical granulomas in the current cohort were located inthe maxilla, but no specific location has been reportedin other studies [5-11]. Exostosis and dense fibrotic den-tal follicles were the two most common lesions in theothers/miscellaneous group, which mostly occurred in
the maxilla and were distributed in the sixth and seconddecades of life.
ConclusionThe present study described in detail the frequency, ageand sex distribution in a cohort of Taiwanese patients re-ferred for histopathological examination. It showed trendssimilar to previous reports from other countries; however,some detailed information was different, perhaps due tothe different criteria and different geographic distribution.Moreover, oral SCC and oral potentially malignant dis-orders comprised high percentages of all HN lesions inthe cohort; nevertheless it should be cautioned that thesample being non-epidemiologic and would probably begreatly askew to a high rate of malignant/potentiallymalignant lesions when compared to an epidemiologicalsample.
AbbreviationsHN: Head & neck; OMF: Oral and maxillofacial; SCC: Squamous cellcarcinoma; HK: Hyperkeratosis; ED: Epithelial dysplasia; OSF: Oral submucousfibrosis; EH: Epithelial hyperplasia; ENT: Ear, nose & throat.
Competing interestsThe authors declare that they have no competing interests.
Authors’ contributionsFL, KYH, and YKC are the primary writers of the manuscript and participatedin the study implementing. YKC conceived of the study, and had madesubstantial contributions to conception and design, and revised themanuscript critically for important intellectual content. PHC implements allthe required statistical analyses. WCW, LML, HCH, and JYC assisted ininterpretation of data. CHC, and YKC are the principal investigators of clinicalstudies in this project. All authors read and approved the final manuscript.
AcknowledgementsWe are grateful to health and welfare surcharge of tobacco products, theMinistry of Health and Welfare, Taiwan, Republic of China (MOHW103-TD-B-111-05).
Author details1Division of Periodontology, Kaohsiung Medical University Hospital,Kaohsiung, Taiwan. 2School of Dentistry, College of Dental Medicine,Kaohsiung Medical University, Kaohsiung, Taiwan. 3Division of Oral Pathology& Maxillofacial Radiology, Kaohsiung Medical University Hospital, Kaohsiung,Taiwan. 4Oral & Maxillofacial Imaging Center, College of Dental Medicine,Kaohsiung Medical University, Kaohsiung, Taiwan. 5Division of Oral &Maxillofacial Surgery, Kaohsiung Medical University Hospital, Kaohsiung,Taiwan.
Received: 27 April 2014 Accepted: 17 July 2014Published: 21 July 2014
References1. Avelar RL, Antunes AA, Carvalho RW, Bezerra PG, Oliveira Neto PJ, Andrade
ES: Odontogenic cysts: a clinicopathological study of 507 cases. J Oral Sci2009, 51:581–586.
2. Servato JP, de Souza PE, Horta MC, Ribeiro DC, de Aguiar MC, de Faria PR,Cardoso SV, Loyola AM: Odontogenic tumours in children andadolescents: a collaborative study of 431 cases. Int J Oral Maxillofac Surg2012, 41:768–773.
3. Zuniga MD, Mendez CR, Kauterich RR, Paniagua DC: Paediatric oralpathology in a Chilean population: a 15-year review. Int J Paediatr Dent2013, 23:346–351.
Lei et al. Head & Face Medicine 2014, 10:28 Page 13 of 13http://www.head-face-med.com/content/10/1/28
4. Correa L, Frigerio ML, Sousa SC, Novelli MD: Oral lesions in elderlypopulation: a biopsy survey using 2250 histopathological records.Gerodontology 2006, 23:48–54.
5. Akinmoladun VI, Akintububo OB, Adisa AO, Ojo EO, Ayuba D: Evaluation ofthe histopathology of orofacial lesions in a North-East Nigerian tertiarycentre. Ann Afr Med 2013, 12:105–109.
6. Jones AV, Franklin CD: An analysis of oral and maxillofacial pathologyfound in adults over a 30-year period. J Oral Pathol Med 2006, 35:392–401.
7. Ali MA: Biopsied jaw lesions in Kuwait: a six-year retrospective analysis.Med Princ Pract 2011, 20:550–555.
8. Franklin CD, Jones AV: A survey of oral and maxillofacial pathologyspecimens submitted by general dental practitioners over a 30-yearperiod. Br Dent J 2006, 200:447–450.
9. Ali M, Sundaram D: Biopsied oral soft tissue lesions in Kuwait: a six-yearretrospective analysis. Ann Afr Med 2012, 21:569–575.
10. Bhaskar SN: Oral pathology in the dental office: survey of 20,575 biopsyspecimens. J Am Dent Assoc 1968, 76:761–766.
11. Tay AB: A 5-year survey of oral biopsies in an oral surgical unit inSingapore: 1993–1997. Ann Acad Med Singapore 1999, 28:665–671.
12. Chung CH, Yang YH, Wang TY, Shieh TY, Warnakulasuriya S: Oralprecancerous disorders associated with areca quid chewing, smoking,and alcohol drinking in southern Taiwan. J Oral Pathol Med 2005,34:460–466.
13. Ramachandra NB: The hierarchy of oral cancer in India. Int J Head NeckSurg 2012, 3:143–146.
14. Travasso C: Betel quid chewing is responsible for half of oral cancercases in India, finds study. BMJ 2013, 347:f7536.
15. Patil PB, Bathi R, Chaudhari S: Prevalence of oral mucosal lesions in dentalpatients with tobacco smoking, chewing, and mixed habits: A cross-sectional study in South India. J Family Commun Med 2013, 20:130–135.
16. Yang TT, Wang CY, Jeng JH, Lin CP, Tsai YL: Geriatric oral health care inTaiwan: What do we need? J Dent Sci 2007, 2:59–64.
17. Johnson NR, Savage NW, Kazoullis S, Batstone MD: A prospectiveepidemiological study for odontogenic and non-odontogenic lesions ofthe maxilla and mandible in Queensland. Oral Surg Oral Med Oral PatholOral Radiol 2013, 115:515–522.
18. Selvamani M, Donoghue M, Basandi PS: Analysis of 153 cases ofodontogenic cysts in a South Indian sample population: a retrospectivestudy over a decade. Braz Oral Res 2012, 26:330–334.
19. Sharifian MJ, Khalili M: Odontogenic cysts: a retrospective study of 1227cases in an Iranian population from 1987 to 2007. J Oral Sci 2011,53:361–367.
20. Prockt AP, Schebela CR, Maito FD, Sant'Ana-Filho M, Rados PV:Odontogenic cysts: analysis of 680 cases in Brazil. Head Neck Pathol 2008,2:150–156.
21. de Souza LB, Gordon-Nunez MA, Nonaka CF, de Medeiros MC, Torres TF,Emiliano GB: Odontogenic cysts: demographic profile in a Brazilianpopulation over a 38-year period. Med Oral Patol Oral Cir Bucal 2010,15:e583–e590.
22. Koivisto T, Bowles WR, Rohrer M: Frequency and distribution ofradiolucent jaw lesions: a retrospective analysis of 9,723 cases. J Endod2012, 38:729–732.
23. Luo HY, Li TJ: Odontogenic tumors: a study of 1309 cases in a Chinesepopulation. Oral Oncol 2009, 45:706–711.
24. Siriwardena BS, Tennakoon TM, Tilakaratne WM: Relative frequency ofodontogenic tumors in Sri Lanka: Analysis of 1677 cases. Pathol Res Pract2012, 208:225–230.
25. Siar CH, Lau SH, Ng KH: Ameloblastoma of the jaws: a retrospectiveanalysis of 340 cases in a Malaysian population. J Oral & Maxillofac Surg2012, 70:608–615.
26. Saghravanian N, Jafarzadeh H, Bashardoost N, Pahlavan N, Shirinbak I:Odontogenic tumors in an Iranian population: a 30-year evaluation.J Oral Sci 2010, 52:391–396.
27. Jaafari-Ashkavandi Z, Ashraf MJ, Moshaverinia M: Salivary gland tumors: aclinicopathologic study of 366 cases in southern Iran. Asian Pac J CancerPrev 2013, 14:27–30.
28. Wang YL, Zhu YX, Chen TZ, Wang Y, Sun GH, Zhang L, Huang CP, Wang ZY,Shen Q, Li DS, Wu Y, Ji QH: Clinicopathologic study of 1176 salivary glandtumors in a Chinese population: experience of one cancer center1997–2007. Acta Otolaryngol 2012, 132:879–886.
29. MacDonald-Jankowski DS: Ossifying fibroma: a systematic review.Dentomaxillofac Radiol 2009, 38:495–513.
30. Alsufyani NA, Lam EW: Osseous (cemento-osseous) dysplasia of the jaws:clinical and radiographic analysis. J Can Dent Assoc 2011, 77:b70.
31. Amarasinghe HK, Usgodaarachchi US, Johnson NW, Lalloo R,Warnakulasuriya S: Betel-quid chewing with or without tobacco is a majorrisk factor for oral potentially malignant disorders in Sri Lanka: a case–control study. Oral Oncol 2010, 46:297–301.
32. Thomas SJ, Harris R, Ness AR, Taulo J, Maclennan R, Howes N, Bain CJ: Betelquid not containing tobacco and oral leukoplakia: a report on a cross-sectional study in Papua New Guinea and a meta-analysis of currentevidence. Int J Cancer 2008, 123:1871–1876.
33. Bradley PJ, McGurk M: Incidence of salivary gland neoplasms in a definedUK population. Br J Oral & Maxillofac Surg 2013, 51:399–403.
34. Hernandez-Guerrero JC, Jacinto-Aleman LF, Jimenez-Farfan MD, Macario-Hernandez A, Hernandez-Flores F, Alcantara-Vazquez A: Prevalence trendsof oral squamous cell carcinoma. Mexico City's General Hospitalexperience. Med Oral Patol Oral Cir Bucal 2013, 18:e306–e311.
35. Ferlay J, Shin HR, Bray F, Forman D, Mathers C, Parkin DM: Estimates ofworldwide burden of cancer in 2008: GLOBOCAN 2008. Int J Cancer 2010,127:2893–2917.
36. Ferlay J, Parkin DM, Steliarova-Foucher E: Estimates of cancer incidenceand mortality in Europe in 2008. Eur J Cancer 2010, 46:765–781.
37. Chhetri DK, Rawnsley JD, Calcaterra TC: Carcinoma of the buccal mucosa.Otolaryngol Head Neck Surg 2000, 123:566–571.
38. Diaz EM Jr, Holsinger FC, Zuniga ER, Roberts DB, Sorensen DM: Squamouscell carcinoma of the buccal mucosa: one institution's experience with119 previously untreated patients. Head Neck 2003, 25:267–273.
39. Elango JK, Gangadharan P, Sumithra S, Kuriakose MA: Trends of head andneck cancers in urban and rural India. Asian Pac J Cancer Prev 2006,7:108–112.
40. Robinson KL, Macfarlane GJ: Oropharyngeal cancer incidence andmortality in Scotland: are rates still increasing? Oral Oncol 2003, 39:31–36.
41. Warnakulasuriya S, Mak V, Moller H: Oral cancer survival in young peoplein South East England. Oral Oncol 2007, 43:982–986.
doi:10.1186/1746-160X-10-28Cite this article as: Lei et al.: Retrospective study of biopsied head andneck lesions in a cohort of referral Taiwanese patients. Head & FaceMedicine 2014 10:28.
Submit your next manuscript to BioMed Centraland take full advantage of:
• Convenient online submission
• Thorough peer review
• No space constraints or color figure charges
• Immediate publication on acceptance
• Inclusion in PubMed, CAS, Scopus and Google Scholar
• Research which is freely available for redistribution
Submit your manuscript at www.biomedcentral.com/submit