retrospective analysis of the palmer drought severity index in the semi-arid pampas region,...
TRANSCRIPT
INTERNATIONAL JOURNAL OF CLIMATOLOGY, VOL. 17, 313–322 (1997)
RETROSPECTIVE ANALYSIS OF THE PALMER DROUGHT SEVERITYINDEX IN THE SEMI-ARID PAMPAS REGION, ARGENTINA
B. SCIAN AND M. DONNARI
Agronomy Department. Universidad Nacional del Sur, 8000 Bahia Blanca, Argentinaemail: [email protected]
Received 3 October 1995Revised 20 April 1996Accepted 20 May 1996
ABSTRACT
The semi-arid Pampas region of Argentina is economically important, generating a considerable proportion of the country’swheat production. The region suffers frequent drought periods, being climatically semi-arid and dry subhumid. Precipitation isscarce and erratic and the soils are generally shallow, with a low soil-water holding capacity.
The Palmer drought severity index (PDSI) was applied to evaluate the historical sequence of wet and dry periods since thebeginning of the century. Data for this study cover the period 1912–1990, though several locations have longer records. Theregion has dry, wet, and normal periods during 38 per cent, 32 per cent and 30 per cent of the time, respectively. Extremeintensity monthly values of PDSI (more than�4 and less thanÿ4) occur in episodes of more than a year’s length.
Return periods of 20 years were calculated for the extreme drought (ÿ4) from the series of minimum annual PDSI values.Extreme wet intensity, such as that registered in 1986 (�7) has a recurrence interval of 50 years.
Correlation coefficients for the PDSI indicate a good association between station pairs, increasing as separation distancesdecrease. Another feature of the coefficients is scattering, which may be related to precipitation gradients.
From principal components analysis of monthly PDSI it is concluded that the locations selected are fairly well associatedand correspond to a homogeneous region from a climatic view point.
KEY WORDS: semi-arid Pampas region; Palmer drought severity index (PDSI); dry and wet episodes; return period; Argentina.
INTRODUCTION
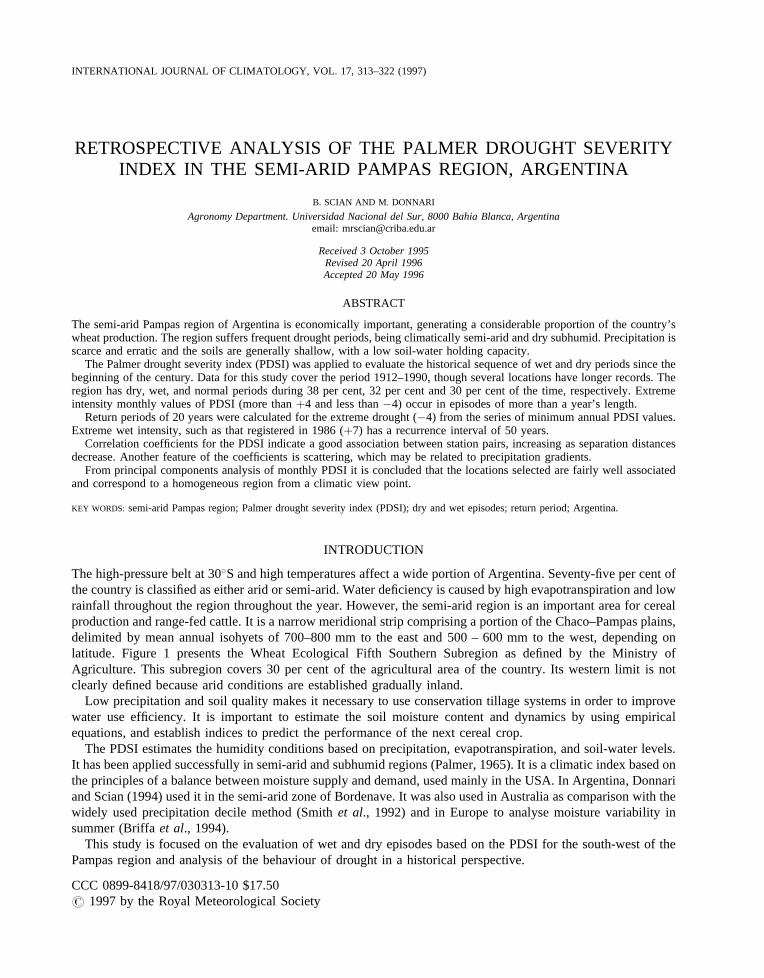
The high-pressure belt at 30�S and high temperatures affect a wide portion of Argentina. Seventy-five per cent ofthe country is classified as either arid or semi-arid. Water deficiency is caused by high evapotranspiration and lowrainfall throughout the region throughout the year. However, the semi-arid region is an important area for cerealproduction and range-fed cattle. It is a narrow meridional strip comprising a portion of the Chaco–Pampas plains,delimited by mean annual isohyets of 700–800 mm to the east and 500 – 600 mm to the west, depending onlatitude. Figure 1 presents the Wheat Ecological Fifth Southern Subregion as defined by the Ministry ofAgriculture. This subregion covers 30 per cent of the agricultural area of the country. Its western limit is notclearly defined because arid conditions are established gradually inland.
Low precipitation and soil quality makes it necessary to use conservation tillage systems in order to improvewater use efficiency. It is important to estimate the soil moisture content and dynamics by using empiricalequations, and establish indices to predict the performance of the next cereal crop.
The PDSI estimates the humidity conditions based on precipitation, evapotranspiration, and soil-water levels.It has been applied successfully in semi-arid and subhumid regions (Palmer, 1965). It is a climatic index based onthe principles of a balance between moisture supply and demand, used mainly in the USA. In Argentina, Donnariand Scian (1994) used it in the semi-arid zone of Bordenave. It was also used in Australia as comparison with thewidely used precipitation decile method (Smithet al., 1992) and in Europe to analyse moisture variability insummer (Briffaet al., 1994).
This study is focused on the evaluation of wet and dry episodes based on the PDSI for the south-west of thePampas region and analysis of the behaviour of drought in a historical perspective.
CCC 0899-8418/97/030313-10 $17.50# 1997 by the Royal Meteorological Society
REGIONAL CHARACTERISTICS
Climatic identification
A climatic aridity index defined by UNESCO (1977) as the ratio between precipitation (P) and potentialevapotranspiration (ETP), from the Penman model, was selected to identify the area of study. Four classes of aridzones were defined (Hatfield, 1990):
Figure 1. Argentine wheat region and ecologic subregions. Approximate crop boundary (dotted line), Thornthwaite climatic indexÿ20 and 0(thick full line) and UNESCO desertification index 0�5 (thin full line)
314 B. SCIAN AND M. DONNARI
(i) hyperarid zone (P/ETP< 0�03)(ii) arid zone (0�03<P/ETP< 0�20)
(iii) semi-arid zone (0�20<P/ETP< 0�50)(iv) subhumid zone (0�50<P/ETP< 0�75)
Table 1 presents the climatic aridity index for several stations within the semi-arid Pampas region. TheP/ETPratio shows an increase from the historical values (1912–1990) to the 1961–1990 values; as shown by the 0�5isoline (thin full lines in Figure 1) that separates subhumid and semi-arid climatic conditions. Accordingly, thenorth-eastern part of the region is subhumid and the south-western part is semi-arid.
Thornthwaites’s climatic classification includes the relative value of rainfall through the ETP term.When applied to the Fifth Southern Wheat Region it results as a dry subhumid climatic type, with valuesbetween 0 andÿ20, as shown in Figure 1 (thick full lines). The same region is classified as semi-arid by Prohaska(1961).
Precipitation
Agriculture productivity is greatly influenced by precipitation. Characteristic rainfall features of the semi-aridPampas include high variability in annual and monthly values and wide variation in areal distribution. Annualprecipitation distribution depicts two different seasons: the rainy season in summer, from October to March, andthe dry winter season, from April to September.
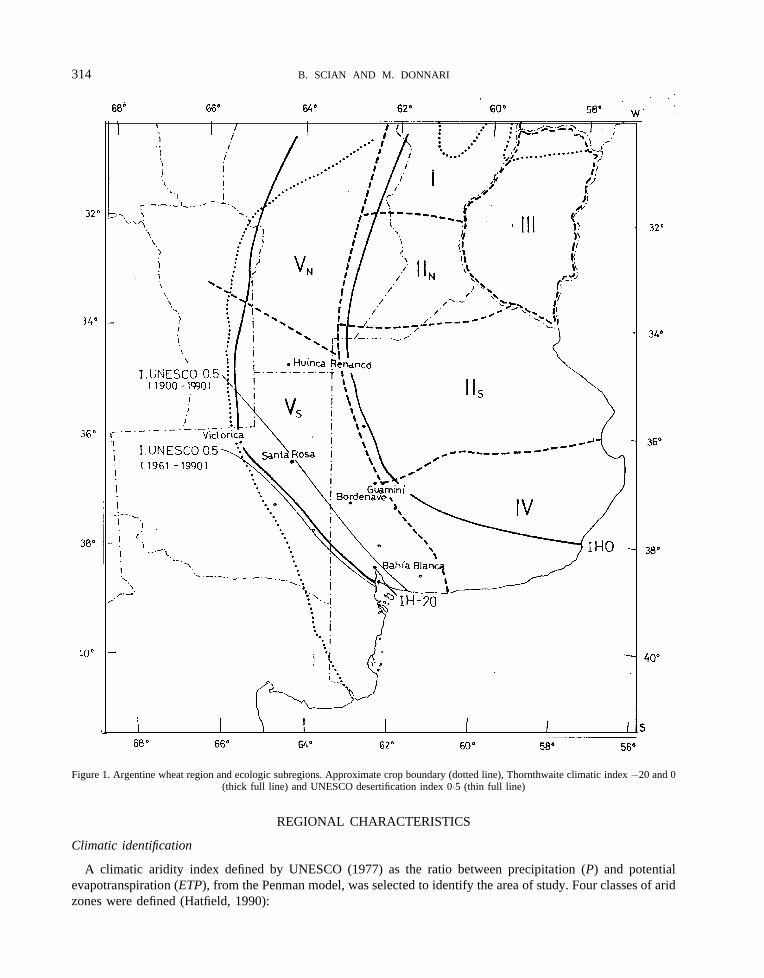
Monthly rainfall data for six stations were analysed for the period 1912–1990 and the mean annual arealprecipitation series together with the 11-year low-pass filter are shown in Figure 2. The precipitation mean value(P) is 629 mm, with a standard deviation (s) of � 141 mm. Regional annual precipitation of 1916, 1924, 1929,1935, 1937, 1949, 1962, and 1965 were lower than 488 mm (P7 s); on the contrary the years 1914, 1919, 1926,1939, 1946, 1957, 1963, 1976, 1978, and 1985 showed rainfall higher than 760 mm (P� s).
It was observed that at the beginning of the century there were mainly humid periods and a continuousdecrease in rainfall, followed by minimum precipitation periods in the 1950s. The region experienced the greatestpositive departure from the long-term mean in the 1970s. The same behaviour for this decade was observed inother parts of the country except in Misiones and Formosa (north national limit) (Hoffmann, 1988). Other authorshave found the same tendency for the Pampas region (Forte Layet al, 1984; Burgos, 1986). Lucero andRodrıguez (1991) observed that 1916 presented a rainfall deficit covering almost all the country, despite being ina wet cycle.
Table I. Station, location, mean annual precipitation (P), potential evapotranspitation (ETP) (both 1912–1990), andP/ETPratios for the periods 1912–1990 and 1961–1990
P/ETPLatitude (�S) P ETP
Station Longitude (�W) (mm) (mm) 1912–1990 1961–1990
H. Renanco´ 34�830 64�270 662 1243 0�53 0�53T. Lauquen 35�580 62�440 743 1181 0�63 0�68Victorica 36�220 65�430 519 1141 0�45 0�55Sta. Rosa 36�620 64�320 600 1220 0�49 0�53Guaminı´ 37�050 62�400 699 1080 0�65 0�73Gral. Acha 37�370 64�920 491 1169 0�42 0�45Bordenave 37�510 63�010 638 936 0�63 0�74Suarez 37�520 61�920 702 979 0�72 0�82Bernasconi 37�920 63�750 540 1172 0�46 0�50Dorrego 38�020 61�270 646 1141 0�56 0�60Tornquist 38�080 62�220 634 1038 0�61 0�72B. Blanca 38�730 62�250 531 1212 0�44 0�53
DROUGHT IN ARGENTINIAN PAMPAS 315
Soils
The soils of the region are Mollisols. They have developed on loessic parent materials of variable depth,having mainly fine sandy loam textures. A typical limitation of the regional agricultural soils is the presence of acaliche (calcareous–siliceous) layer near the upper horizons. This layer limits the depth and the water holdingcapacity (1�2 mm of water per centimetre depth) of the soils. Another important limitation is the low organicmatter content, which creates conditions prone to hydric and wind erosion.
MATERIALS AND METHODS
To obtain the PDSI the following parameters were utilized:
(i) monthly precipitation for the 1912–1990 period (source:Servicio Meteorolo´gico Nacional)(ii) Penman monthly climaticETP (Damario and Catta´neo, 1982)
(iii) regional soil-water holding capacity estimated in 100 mm (Burgos, 1978)
Palmer’s model was utilized to calculate the drought severity index. The computer procedure, the sensitivity ofsome variables, and the limitations of the PDSI are discussed by Karl (1983, 1986) and Alley (1984). Practicalguidance for computational steps is given by OMM (1975). The procedure, designed for a PC, follows two stages:the Palmer water balance and the moisture anomaly index,Z, and the drought severity index,X. From anagronomic view point, and studying the crop behaviour in response to moisture, the moisture anomaly index ismore adequate for establishing the crop water requirements than the PDSI (Sakamoto, 1978). This was confirmedby a crop yield model developed for the region (Scian and Donnari, 1994).
The model was run locally and climatic coefficients were obtained for a calibration period based on the wholedata record (Karl, 1986).
Differences of the slope of the fitting lines for the Palmer equation and that of the region studied wereobserved. This line represents the accumulated indexes during the driest periods of various lengths and itdetermines extreme drought. Palmer took data for two climatically dissimilar areas, western Kansas and centralIowa, in order to include conditions of semi-arid to moist subhumid climatic regions. The results for the semi-aridPampas indicate that the water deficiencies accumulated for long periods are larger than those of Palmer. Theoriginal Palmer’s equation was finally used allowing comparisons of drought categories.
Palmer defines index values between�4 andÿ4, with the following categories of drought: extreme (indexlower or equal toÿ4), severe (ÿ3 toÿ3�9), moderate (ÿ2 toÿ2�9), mild (ÿ1 toÿ1�9), incipient (ÿ0�5 toÿ0�9)and near normal (ÿ0�49 to�0�49). Similar characterization is given to wet periods (positive indexes).
Figure 2. Time series of areal annual precipitation and smoothed values for a 11-year low-pass filter. The continuous straight line is the meanregional precipitation for the base period 1912 – 1990.
316 B. SCIAN AND M. DONNARI
In this study a consecutive monthly index greater than 1 is defined as a wet episode and values lower thanÿ1constitute a dry episode. Normal months (between�1 andÿ1) within either a dry or wet period are automaticallyincluded in the running episode.
RESULTS AND DISCUSSION
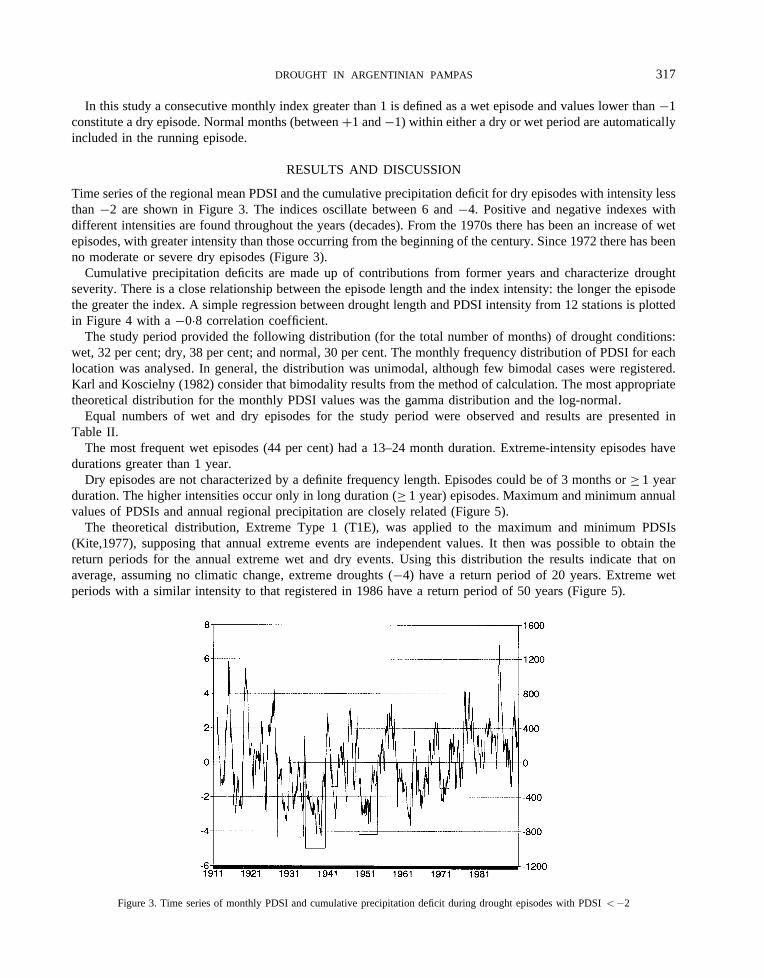
Time series of the regional mean PDSI and the cumulative precipitation deficit for dry episodes with intensity lessthanÿ2 are shown in Figure 3. The indices oscillate between 6 andÿ4. Positive and negative indexes withdifferent intensities are found throughout the years (decades). From the 1970s there has been an increase of wetepisodes, with greater intensity than those occurring from the beginning of the century. Since 1972 there has beenno moderate or severe dry episodes (Figure 3).
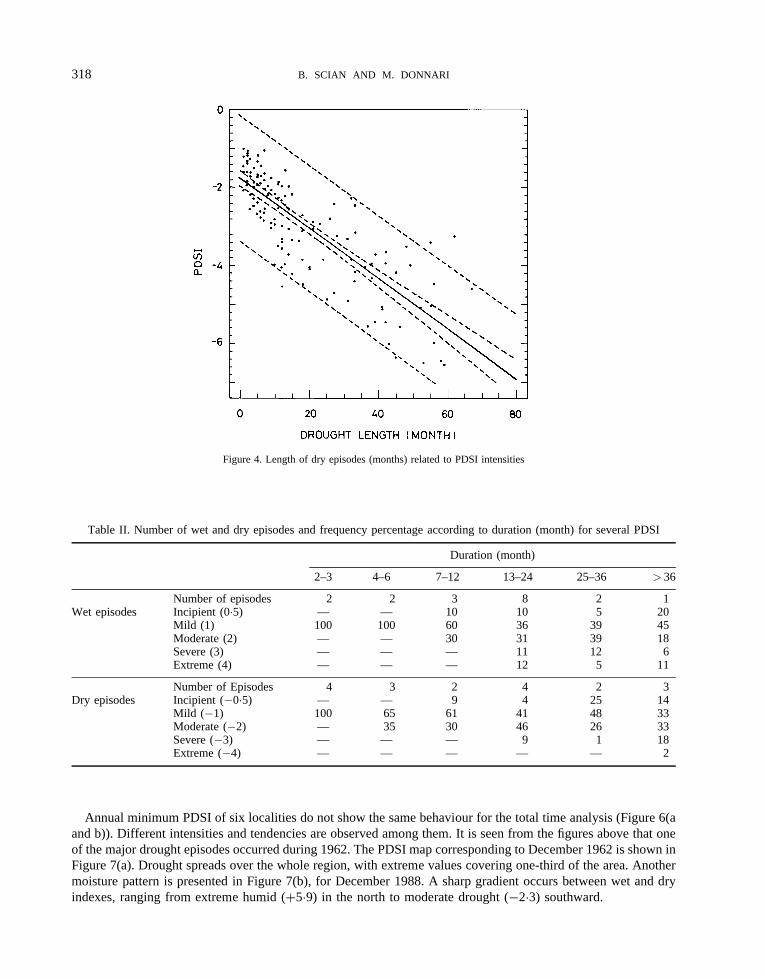
Cumulative precipitation deficits are made up of contributions from former years and characterize droughtseverity. There is a close relationship between the episode length and the index intensity: the longer the episodethe greater the index. A simple regression between drought length and PDSI intensity from 12 stations is plottedin Figure 4 with aÿ0�8 correlation coefficient.
The study period provided the following distribution (for the total number of months) of drought conditions:wet, 32 per cent; dry, 38 per cent; and normal, 30 per cent. The monthly frequency distribution of PDSI for eachlocation was analysed. In general, the distribution was unimodal, although few bimodal cases were registered.Karl and Koscielny (1982) consider that bimodality results from the method of calculation. The most appropriatetheoretical distribution for the monthly PDSI values was the gamma distribution and the log-normal.
Equal numbers of wet and dry episodes for the study period were observed and results are presented inTable II.
The most frequent wet episodes (44 per cent) had a 13–24 month duration. Extreme-intensity episodes havedurations greater than 1 year.
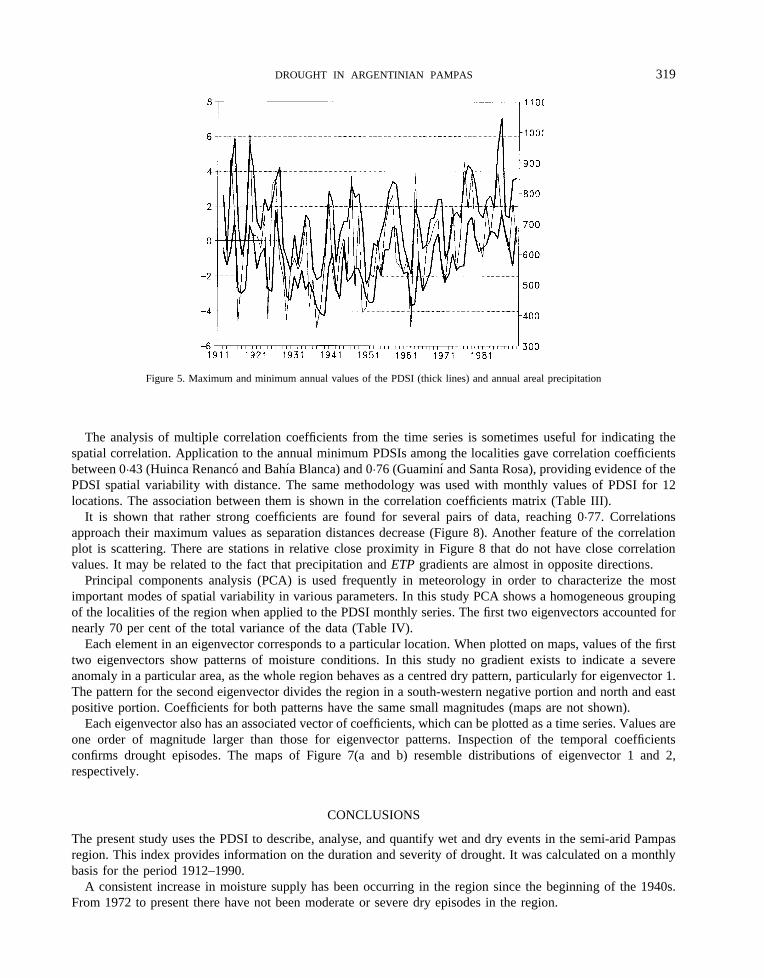
Dry episodes are not characterized by a definite frequency length. Episodes could be of 3 months or�1 yearduration. The higher intensities occur only in long duration (� 1 year) episodes. Maximum and minimum annualvalues of PDSIs and annual regional precipitation are closely related (Figure 5).
The theoretical distribution, Extreme Type 1 (T1E), was applied to the maximum and minimum PDSIs(Kite,1977), supposing that annual extreme events are independent values. It then was possible to obtain thereturn periods for the annual extreme wet and dry events. Using this distribution the results indicate that onaverage, assuming no climatic change, extreme droughts (ÿ4) have a return period of 20 years. Extreme wetperiods with a similar intensity to that registered in 1986 have a return period of 50 years (Figure 5).
Figure 3. Time series of monthly PDSI and cumulative precipitation deficit during drought episodes with PDSI<ÿ2
DROUGHT IN ARGENTINIAN PAMPAS 317
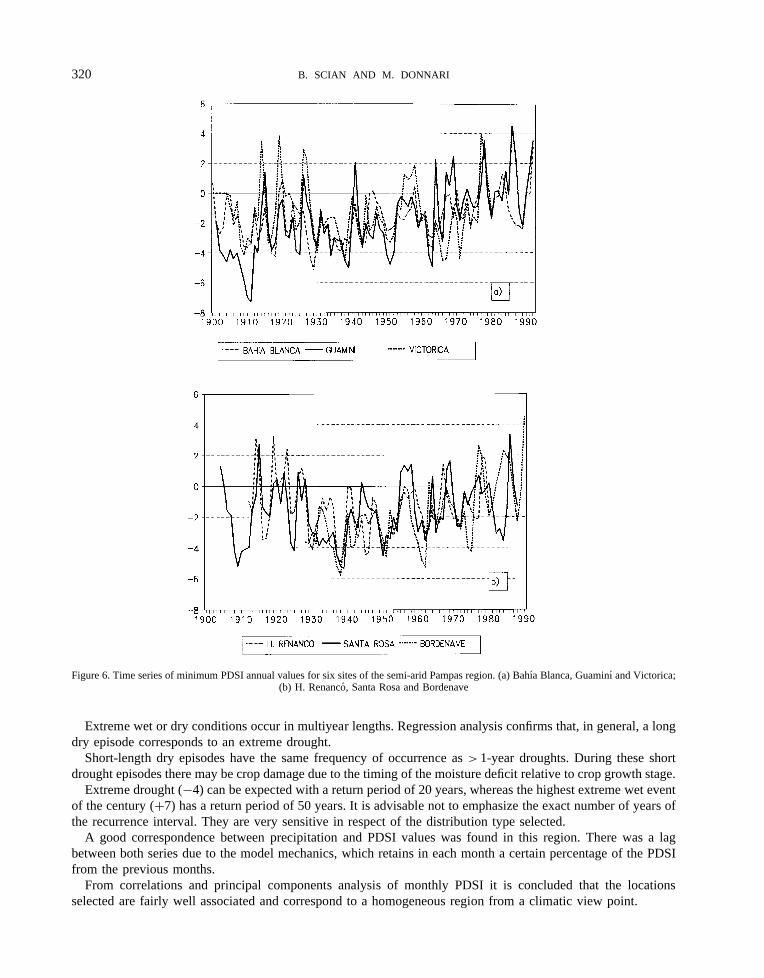
Annual minimum PDSI of six localities do not show the same behaviour for the total time analysis (Figure 6(aand b)). Different intensities and tendencies are observed among them. It is seen from the figures above that oneof the major drought episodes occurred during 1962. The PDSI map corresponding to December 1962 is shown inFigure 7(a). Drought spreads over the whole region, with extreme values covering one-third of the area. Anothermoisture pattern is presented in Figure 7(b), for December 1988. A sharp gradient occurs between wet and dryindexes, ranging from extreme humid (�5�9) in the north to moderate drought (ÿ2�3) southward.
Table II. Number of wet and dry episodes and frequency percentage according to duration (month) for several PDSI
Duration (month)
2–3 4–6 7–12 13–24 25–36 >36
Number of episodes 2 2 3 8 2 1Wet episodes Incipient (0�5) — — 10 10 5 20
Mild (1) 100 100 60 36 39 45Moderate (2) — — 30 31 39 18Severe (3) — — — 11 12 6Extreme (4) — — — 12 5 11
Number of Episodes 4 3 2 4 2 3Dry episodes Incipient (ÿ0�5) — — 9 4 25 14
Mild (ÿ1) 100 65 61 41 48 33Moderate (ÿ2) — 35 30 46 26 33Severe (ÿ3) — — — 9 1 18Extreme (ÿ4) — — — — — 2
Figure 4. Length of dry episodes (months) related to PDSI intensities
318 B. SCIAN AND M. DONNARI
The analysis of multiple correlation coefficients from the time series is sometimes useful for indicating thespatial correlation. Application to the annual minimum PDSIs among the localities gave correlation coefficientsbetween 0�43 (Huinca Renanco´ and Bahı´a Blanca) and 0�76 (Guaminı´ and Santa Rosa), providing evidence of thePDSI spatial variability with distance. The same methodology was used with monthly values of PDSI for 12locations. The association between them is shown in the correlation coefficients matrix (Table III).
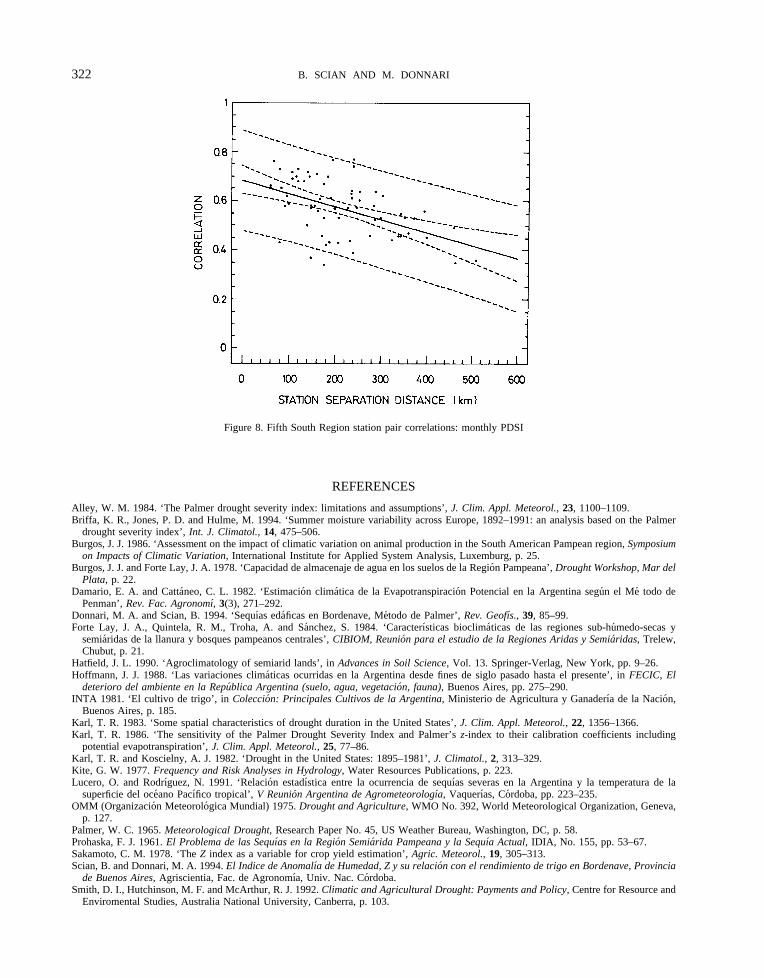
It is shown that rather strong coefficients are found for several pairs of data, reaching 0�77. Correlationsapproach their maximum values as separation distances decrease (Figure 8). Another feature of the correlationplot is scattering. There are stations in relative close proximity in Figure 8 that do not have close correlationvalues. It may be related to the fact that precipitation andETP gradients are almost in opposite directions.
Principal components analysis (PCA) is used frequently in meteorology in order to characterize the mostimportant modes of spatial variability in various parameters. In this study PCA shows a homogeneous groupingof the localities of the region when applied to the PDSI monthly series. The first two eigenvectors accounted fornearly 70 per cent of the total variance of the data (Table IV).
Each element in an eigenvector corresponds to a particular location. When plotted on maps, values of the firsttwo eigenvectors show patterns of moisture conditions. In this study no gradient exists to indicate a severeanomaly in a particular area, as the whole region behaves as a centred dry pattern, particularly for eigenvector 1.The pattern for the second eigenvector divides the region in a south-western negative portion and north and eastpositive portion. Coefficients for both patterns have the same small magnitudes (maps are not shown).
Each eigenvector also has an associated vector of coefficients, which can be plotted as a time series. Values areone order of magnitude larger than those for eigenvector patterns. Inspection of the temporal coefficientsconfirms drought episodes. The maps of Figure 7(a and b) resemble distributions of eigenvector 1 and 2,respectively.
CONCLUSIONS
The present study uses the PDSI to describe, analyse, and quantify wet and dry events in the semi-arid Pampasregion. This index provides information on the duration and severity of drought. It was calculated on a monthlybasis for the period 1912–1990.
A consistent increase in moisture supply has been occurring in the region since the beginning of the 1940s.From 1972 to present there have not been moderate or severe dry episodes in the region.
Figure 5. Maximum and minimum annual values of the PDSI (thick lines) and annual areal precipitation
DROUGHT IN ARGENTINIAN PAMPAS 319
Extreme wet or dry conditions occur in multiyear lengths. Regression analysis confirms that, in general, a longdry episode corresponds to an extreme drought.
Short-length dry episodes have the same frequency of occurrence as> 1-year droughts. During these shortdrought episodes there may be crop damage due to the timing of the moisture deficit relative to crop growth stage.
Extreme drought (ÿ4) can be expected with a return period of 20 years, whereas the highest extreme wet eventof the century (�7) has a return period of 50 years. It is advisable not to emphasize the exact number of years ofthe recurrence interval. They are very sensitive in respect of the distribution type selected.
A good correspondence between precipitation and PDSI values was found in this region. There was a lagbetween both series due to the model mechanics, which retains in each month a certain percentage of the PDSIfrom the previous months.
From correlations and principal components analysis of monthly PDSI it is concluded that the locationsselected are fairly well associated and correspond to a homogeneous region from a climatic view point.
Figure 6. Time series of minimum PDSI annual values for six sites of the semi-arid Pampas region. (a) Bahı´a Blanca, Guaminı´ and Victorica;(b) H. Renanco´, Santa Rosa and Bordenave
320 B. SCIAN AND M. DONNARI
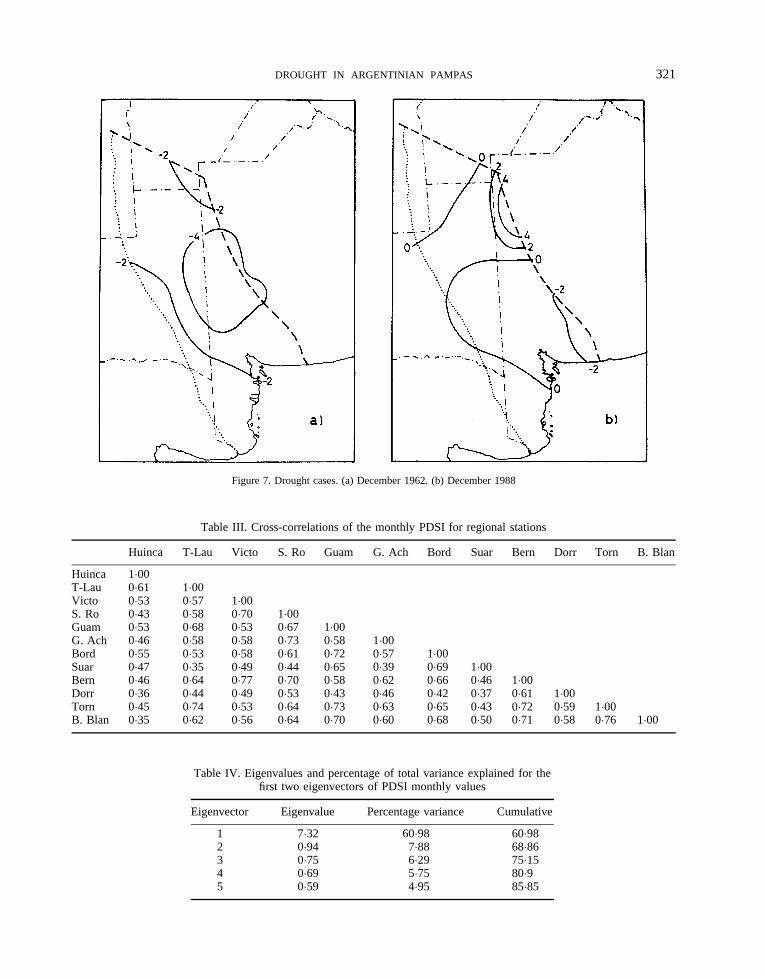
Figure 7. Drought cases. (a) December 1962. (b) December 1988
Table III. Cross-correlations of the monthly PDSI for regional stations
Huinca T-Lau Victo S. Ro Guam G. Ach Bord Suar Bern Dorr Torn B. Blan
Huinca 1�00T-Lau 0�61 1�00Victo 0�53 0�57 1�00S. Ro 0�43 0�58 0�70 1�00Guam 0�53 0�68 0�53 0�67 1�00G. Ach 0�46 0�58 0�58 0�73 0�58 1�00Bord 0�55 0�53 0�58 0�61 0�72 0�57 1�00Suar 0�47 0�35 0�49 0�44 0�65 0�39 0�69 1�00Bern 0�46 0�64 0�77 0�70 0�58 0�62 0�66 0�46 1�00Dorr 0�36 0�44 0�49 0�53 0�43 0�46 0�42 0�37 0�61 1�00Torn 0�45 0�74 0�53 0�64 0�73 0�63 0�65 0�43 0�72 0�59 1�00B. Blan 0�35 0�62 0�56 0�64 0�70 0�60 0�68 0�50 0�71 0�58 0�76 1�00
Table IV. Eigenvalues and percentage of total variance explained for thefirst two eigenvectors of PDSI monthly values
Eigenvector Eigenvalue Percentage variance Cumulative
1 7�32 60�98 60�982 0�94 7�88 68�863 0�75 6�29 75�154 0�69 5�75 80�95 0�59 4�95 85�85
DROUGHT IN ARGENTINIAN PAMPAS 321
REFERENCES
Alley, W. M. 1984. ‘The Palmer drought severity index: limitations and assumptions’,J. Clim. Appl. Meteorol., 23, 1100–1109.Briffa, K. R., Jones, P. D. and Hulme, M. 1994. ‘Summer moisture variability across Europe, 1892–1991: an analysis based on the Palmer
drought severity index’,Int. J. Climatol., 14, 475–506.Burgos, J. J. 1986. ‘Assessment on the impact of climatic variation on animal production in the South American Pampean region,Symposium
on Impacts of Climatic Variation, International Institute for Applied System Analysis, Luxemburg, p. 25.Burgos, J. J. and Forte Lay, J. A. 1978. ‘Capacidad de almacenaje de agua en los suelos de la Regio´n Pampeana’,Drought Workshop, Mar del
Plata, p. 22.Damario, E. A. and Catta´neo, C. L. 1982. ‘Estimacio´n climatica de la Evapotranspiracio´n Potencial en la Argentina segu´n el Me todo de
Penman’,Rev. Fac. Agronomı´, 3(3), 271–292.Donnari, M. A. and Scian, B. 1994. ‘Sequı´as eda´ficas en Bordenave, Me´todo de Palmer’,Rev. Geofı´s., 39, 85–99.Forte Lay, J. A., Quintela, R. M., Troha, A. and Sa´nchez, S. 1984. ‘Caracterı´sticas bioclima´ticas de las regiones sub-hu´medo-secas y
semiaridas de la llanura y bosques pampeanos centrales’,CIBIOM, Reunio´n para el estudio de la Regiones Aridas y Semia´ridas, Trelew,Chubut, p. 21.
Hatfield, J. L. 1990. ‘Agroclimatology of semiarid lands’, inAdvances in Soil Science, Vol. 13. Springer-Verlag, New York, pp. 9–26.Hoffmann, J. J. 1988. ‘Las variaciones clima´ticas ocurridas en la Argentina desde fines de siglo pasado hasta el presente’, inFECIC, El
deterioro del ambiente en la Repu´blica Argentina (suelo, agua, vegetacio´n, fauna), Buenos Aires, pp. 275–290.INTA 1981. ‘El cultivo de trigo’, inColeccion: Principales Cultivos de la Argentina, Ministerio de Agricultura y Ganaderı´a de la Nacio´n,
Buenos Aires, p. 185.Karl, T. R. 1983. ‘Some spatial characteristics of drought duration in the United States’,J. Clim. Appl. Meteorol., 22, 1356–1366.Karl, T. R. 1986. ‘The sensitivity of the Palmer Drought Severity Index and Palmer’sz-index to their calibration coefficients including
potential evapotranspiration’,J. Clim. Appl. Meteorol., 25, 77–86.Karl, T. R. and Koscielny, A. J. 1982. ‘Drought in the United States: 1895–1981’,J. Climatol., 2, 313–329.Kite, G. W. 1977.Frequency and Risk Analyses in Hydrology, Water Resources Publications, p. 223.Lucero, O. and Rodrı´guez, N. 1991. ‘Relacio´n estadı´stica entre la ocurrencia de sequı´as severas en la Argentina y la temperatura de la
superficie del oce´ano Pacı´fico tropical’, V Reunio´n Argentina de Agrometeorologı´a, Vaquerı´as, Cordoba, pp. 223–235.OMM (Organizacion Meteorologica Mundial) 1975.Drought and Agriculture, WMO No. 392, World Meteorological Organization, Geneva,
p. 127.Palmer, W. C. 1965.Meteorological Drought, Research Paper No. 45, US Weather Bureau, Washington, DC, p. 58.Prohaska, F. J. 1961.El Problema de las Sequı´as en la Regio´n Semia´rida Pampeana y la Sequı´a Actual, IDIA, No. 155, pp. 53–67.Sakamoto, C. M. 1978. ‘TheZ index as a variable for crop yield estimation’,Agric. Meteorol., 19, 305–313.Scian, B. and Donnari, M. A. 1994.El Indice de Anomalı´a de Humedad, Z y su relacio´n con el rendimiento de trigo en Bordenave, Provincia
de Buenos Aires, Agriscientia, Fac. de Agronomı´a, Univ. Nac. Co´rdoba.Smith, D. I., Hutchinson, M. F. and McArthur, R. J. 1992.Climatic and Agricultural Drought: Payments and Policy, Centre for Resource and
Enviromental Studies, Australia National University, Canberra, p. 103.
Figure 8. Fifth South Region station pair correlations: monthly PDSI
322 B. SCIAN AND M. DONNARI