retail pharmacy financial analysis
TRANSCRIPT
Walgreens vs CVS Caremark Financial Analysis
By: Sunil Motwani
Introduction
The two corporations I will be comparing in this financial analysis are the two
largest pharmacy retailers in the drug store industry, Walgreens (WAG) and CVS
Caremark (CVS). Both companies provide high quality pharmacy health care while
serving as a convince store for everyday items. The main goal for each business is to
help their patients and customers by enhancing access to care, lowering costs, and
improving overall health outcomes. They do this by having a store on every corner to
succeed in making sure all customers can conveniently and easily get the medication
needed for their health.
The analysis will first look at the history, as well as any recent news stories for
each company. Next, a table will be shown of the Income Statement and Balance Sheet
for each company in order to show the real difference in how each company allocates
their money. This will also illustrate to us which of the two companies has more revenue
and net profit within the drug store industry. Line graphs of the most recent five year
stock prices will also be shown as well as each companies returns compared to the S&P
500 index. The true financial analysis of whether or not the company is worth investing
in comes next with the financial ratios. The ratios will include liquidity ratios, debt
management ratios, asset management ratios, profitability ratios, and market valuation
ratios. After the ratios, we will close up with the DuPont analysis which helps determine
how well each company creates value and makes it simple for an analyst, and even a
simple investor, to compare the valuation and returns with each other and within the
industry as a whole.
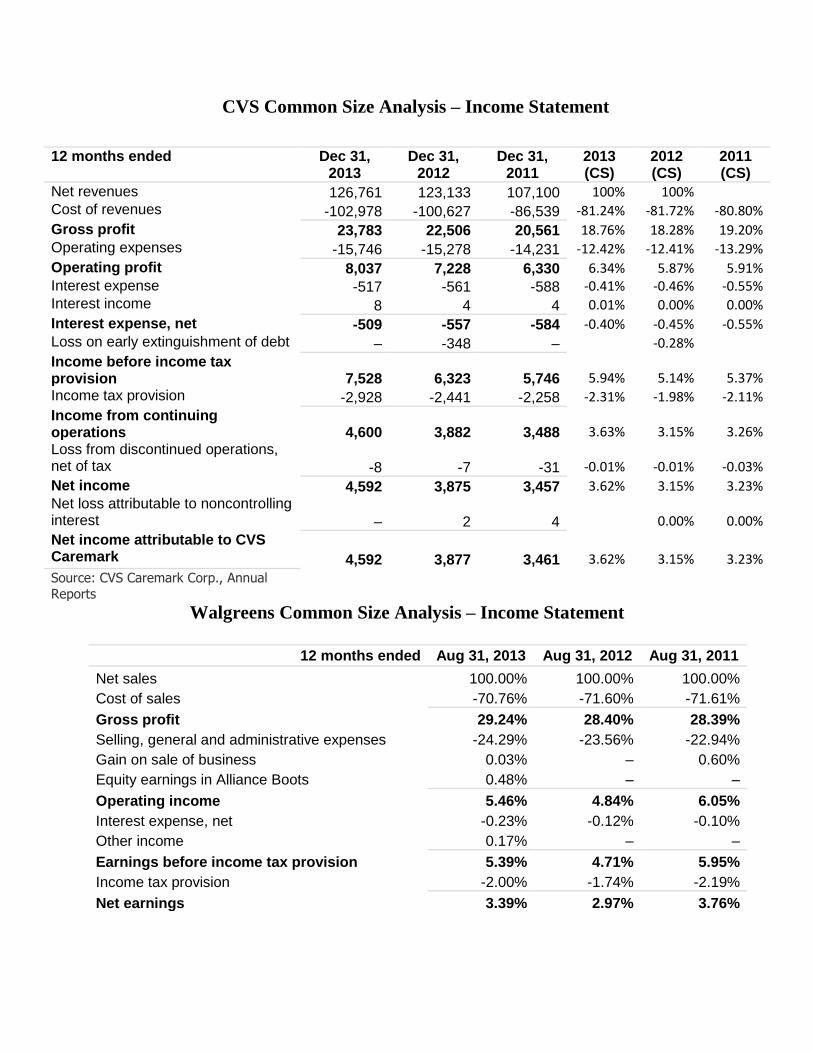
CVS Common Size Analysis – Income Statement
Walgreens Common Size Analysis – Income Statement
12 months ended Aug 31, 2013 Aug 31, 2012 Aug 31, 2011
Net sales 100.00% 100.00% 100.00%
Cost of sales -70.76% -71.60% -71.61%
Gross profit 29.24% 28.40% 28.39%
Selling, general and administrative expenses -24.29% -23.56% -22.94%
Gain on sale of business 0.03% – 0.60%
Equity earnings in Alliance Boots 0.48% – –
Operating income 5.46% 4.84% 6.05%
Interest expense, net -0.23% -0.12% -0.10%
Other income 0.17% – –
Earnings before income tax provision 5.39% 4.71% 5.95%
Income tax provision -2.00% -1.74% -2.19%
Net earnings 3.39% 2.97% 3.76%
12 months ended Dec 31, 2013
Dec 31, 2012
Dec 31, 2011
2013 (CS)
2012 (CS)
2011 (CS)
Net revenues 126,761 123,133 107,100 100% 100% Cost of revenues -102,978 -100,627 -86,539 -81.24% -81.72% -80.80%
Gross profit 23,783 22,506 20,561 18.76% 18.28% 19.20% Operating expenses -15,746 -15,278 -14,231 -12.42% -12.41% -13.29%
Operating profit 8,037 7,228 6,330 6.34% 5.87% 5.91% Interest expense -517 -561 -588 -0.41% -0.46% -0.55% Interest income 8 4 4 0.01% 0.00% 0.00%
Interest expense, net -509 -557 -584 -0.40% -0.45% -0.55% Loss on early extinguishment of debt – -348 –
-0.28% Income before income tax
provision 7,528 6,323 5,746 5.94% 5.14% 5.37% Income tax provision -2,928 -2,441 -2,258 -2.31% -1.98% -2.11%
Income from continuing operations 4,600 3,882 3,488 3.63% 3.15% 3.26% Loss from discontinued operations, net of tax -8 -7 -31 -0.01% -0.01% -0.03%
Net income 4,592 3,875 3,457 3.62% 3.15% 3.23% Net loss attributable to noncontrolling interest – 2 4
0.00% 0.00%
Net income attributable to CVS Caremark 4,592 3,877 3,461 3.62% 3.15% 3.23%
Source: CVS Caremark Corp., Annual
Reports
Walgreens History
Beginning in 1901, Walgreens opened its first store in the city of Chicago on the
intersection of Bowen Avenue and Cottage Grove. The store was run by Charles R.
Walgreen and about 15 years later in 1915, the city had five stores with more every year.
The 1920s was a very busy time for the chain as hundreds of locations were being built
all over the United States. Popularity increased tremendously when Walgreen invented
the malted milkshake. Another reason the 20s was a very successful year for the
company is due to the fact that in 1927 Walgreen Co. stock went public and by 1930 they
had about 400 locations with annual sales above $4,000,000. As more stores were being
built, in 1950 the company began to build self-service stores and by 1953 they were the
largest self-service retailer in the country. The 60s were a proud decade for Walgreens,
by the beginning of the decade they entered into the Puerto Rican market and filled their
100 millionth prescription. They also became the first major drug chain to put the
prescriptions into child resistant containers even though it wasn't required by the federal
government yet. In the year 1975, the company reached a milestone of $1 billion in
sales. With the 80s and 90s being so focused on computer technology, they started to
install intercom computers in all Walgreens so they could connect to every pharmacy via
satellite. They even offered next day photofinishing by 1982 and by 1984 they opened
their 1000th store. The 90s brought more technology to the company when they added
point of sale scanning to speed checkouts. Due to this they even opened a drive-thru
pharmacy by 1992. By 1994 the company had reached 2000 stores. Walgreens was
ahead of the game with the .com boom in the 2000s and by 1999 they launched
walgreens.com allowing customers to view their prescriptions safely online. 10 years
later they made a presence in all 50 states when opening their first pharmacy in Alaska.
Today, Walgreens has over 7,000 stores nationwide and to keep up with government
regulations and their social responsibility, they have started putting solar panels on the
roofs of their stores and are planning to add thousands of charging stations for electric
cars.
CVS Caremark History
CVS was and currently still is the fasted growing pharmacy retailer to exist. Even though
Walgreens has been around for over 100 years, CVS has a little over 40 years in the business and
with the same amount of stores. The first store opened in 1963 in the city of Lowell, MA. In the
year 1996 the company Melville Corporation took the CVS Caremark symbol to the stock
market and made it public. From the 80s till today it has been buying over local small pharmacy
chains in order to build its name and value. By 2000, CVS had over 4000 stores nationwide.
2006 was a big year for the company as they announced their MinuteClinic. This made CVS the
first ever retail store to offer certified doctors to customers for a routine checkup and they could
be prescribed their medication right in the store. CVS has been a big game changer ever since it
first started and they have no signs of disappearing. With over 7,400 stores the chain has grew
and taken over all competitions expect Walgreens and a little bit of Rite Aid. This pharmacy
retailer is also a big seller in cosmetics and in 2008 they started another store which they have
been putting right next to all CVS’s as part of their beauty campaign.
Walgreens Recent Developments
In March of 2008 Walgreens had to settle a lawsuit with the Equal Employment
Opportunity Commission due to the alleged accusations that the company discriminated against
African Americans. The settlement was for $24 Million and was split among 10,000 Afrian
American employees of the company. Walgreens did not plead guilty. In the same year in June,
Walgreens was accused of switching the dosage forms on three medications prescribed for
Medicaid patients without doctor approvals in order to boost profits. The company had to pay
$35 million to the federal government because all the Medicaid programs nationwide had to pay
much more than they normally would have to. In 2012, Walgreens was in trouble with the DEA
for not following the rules of transportation of Oxycodone. The retailer caused thousands of pills
to be misplaced causing the DEA and public to fear they are now being sold on the streets of the
black market. Finally, Walgreens would not stop the sale of Tabacco products as they made a
big profit from it while their competitor CVS banned tabcacco products from their stores.
CVS Recent Developments
CVS has had their shares of trouble. From 2000-2003 CVS execs were charged with
bribery by the federal grand jury for paying a state senator to act as a consultant for the company
and paid him $1000 a month which he would spend on his travel and golf outings. Like every
company nowadays, CVS was sued in 2007 for illegally dumping confidential patient
information and settled with $315,000 to the state. The biggest lawsuit came in 2008 for
deceptive business practices when the company tried telling insurance companies to cover the
brand name medications which would bring almost double the money to CVS while costing the
consumer the same amount. They settled for a whopping $39 million. But that’s not their
biggest, CVS had to pay up $77.6 million in fines due to the improper control in the sale of an
ingredient used to make methamphetamine. Lastly some good news, CVS announced in 2014
they will not sell any more tobacco products which takes away $1.5 billion in revenue a year for
the company.
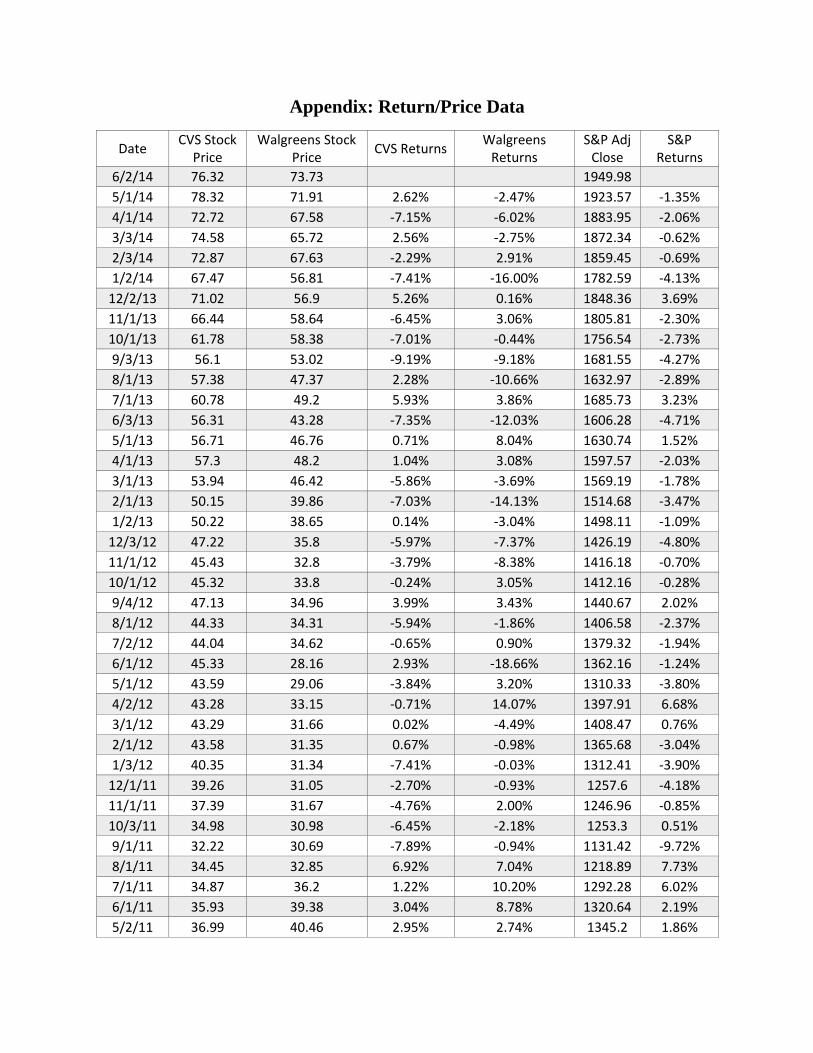
Appendix: Return/Price Data
Date CVS Stock
Price Walgreens Stock
Price CVS Returns
Walgreens Returns
S&P Adj Close
S&P Returns
6/2/14 76.32 73.73 1949.98
5/1/14 78.32 71.91 2.62% -2.47% 1923.57 -1.35%
4/1/14 72.72 67.58 -7.15% -6.02% 1883.95 -2.06%
3/3/14 74.58 65.72 2.56% -2.75% 1872.34 -0.62%
2/3/14 72.87 67.63 -2.29% 2.91% 1859.45 -0.69%
1/2/14 67.47 56.81 -7.41% -16.00% 1782.59 -4.13%
12/2/13 71.02 56.9 5.26% 0.16% 1848.36 3.69%
11/1/13 66.44 58.64 -6.45% 3.06% 1805.81 -2.30%
10/1/13 61.78 58.38 -7.01% -0.44% 1756.54 -2.73%
9/3/13 56.1 53.02 -9.19% -9.18% 1681.55 -4.27%
8/1/13 57.38 47.37 2.28% -10.66% 1632.97 -2.89%
7/1/13 60.78 49.2 5.93% 3.86% 1685.73 3.23%
6/3/13 56.31 43.28 -7.35% -12.03% 1606.28 -4.71%
5/1/13 56.71 46.76 0.71% 8.04% 1630.74 1.52%
4/1/13 57.3 48.2 1.04% 3.08% 1597.57 -2.03%
3/1/13 53.94 46.42 -5.86% -3.69% 1569.19 -1.78%
2/1/13 50.15 39.86 -7.03% -14.13% 1514.68 -3.47%
1/2/13 50.22 38.65 0.14% -3.04% 1498.11 -1.09%
12/3/12 47.22 35.8 -5.97% -7.37% 1426.19 -4.80%
11/1/12 45.43 32.8 -3.79% -8.38% 1416.18 -0.70%
10/1/12 45.32 33.8 -0.24% 3.05% 1412.16 -0.28%
9/4/12 47.13 34.96 3.99% 3.43% 1440.67 2.02%
8/1/12 44.33 34.31 -5.94% -1.86% 1406.58 -2.37%
7/2/12 44.04 34.62 -0.65% 0.90% 1379.32 -1.94%
6/1/12 45.33 28.16 2.93% -18.66% 1362.16 -1.24%
5/1/12 43.59 29.06 -3.84% 3.20% 1310.33 -3.80%
4/2/12 43.28 33.15 -0.71% 14.07% 1397.91 6.68%
3/1/12 43.29 31.66 0.02% -4.49% 1408.47 0.76%
2/1/12 43.58 31.35 0.67% -0.98% 1365.68 -3.04%
1/3/12 40.35 31.34 -7.41% -0.03% 1312.41 -3.90%
12/1/11 39.26 31.05 -2.70% -0.93% 1257.6 -4.18%
11/1/11 37.39 31.67 -4.76% 2.00% 1246.96 -0.85%
10/3/11 34.98 30.98 -6.45% -2.18% 1253.3 0.51%
9/1/11 32.22 30.69 -7.89% -0.94% 1131.42 -9.72%
8/1/11 34.45 32.85 6.92% 7.04% 1218.89 7.73%
7/1/11 34.87 36.2 1.22% 10.20% 1292.28 6.02%
6/1/11 35.93 39.38 3.04% 8.78% 1320.64 2.19%
5/2/11 36.99 40.46 2.95% 2.74% 1345.2 1.86%
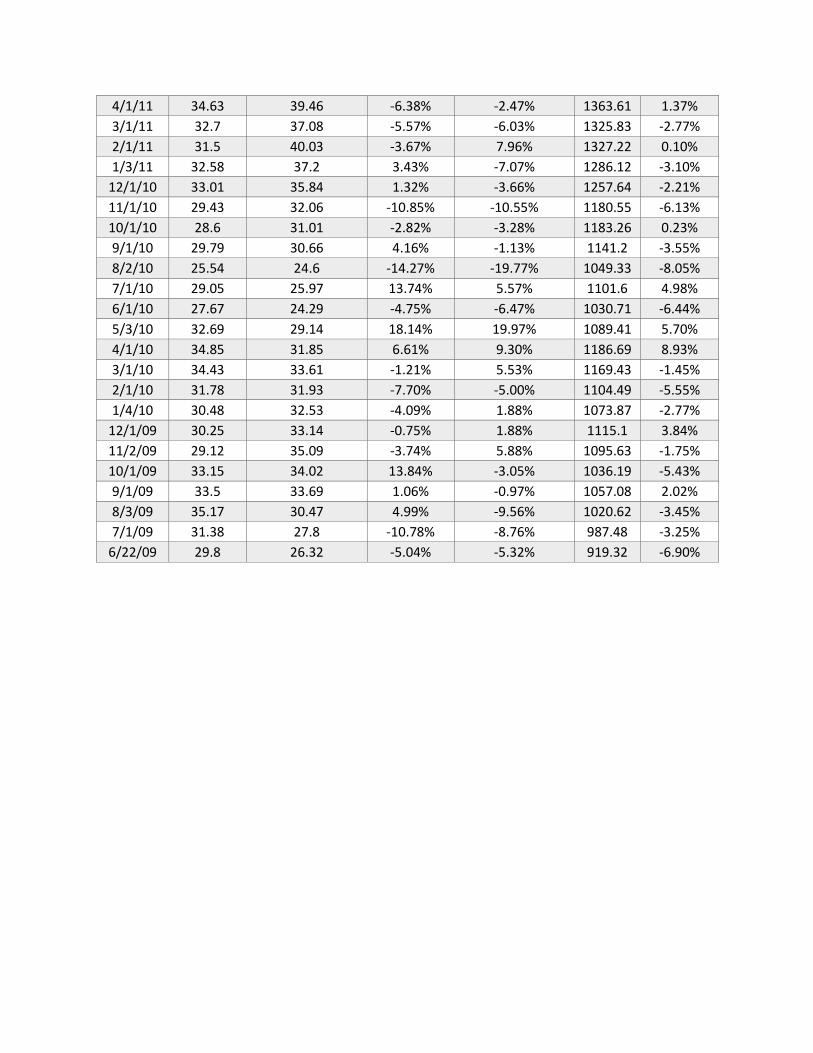
4/1/11 34.63 39.46 -6.38% -2.47% 1363.61 1.37%
3/1/11 32.7 37.08 -5.57% -6.03% 1325.83 -2.77%
2/1/11 31.5 40.03 -3.67% 7.96% 1327.22 0.10%
1/3/11 32.58 37.2 3.43% -7.07% 1286.12 -3.10%
12/1/10 33.01 35.84 1.32% -3.66% 1257.64 -2.21%
11/1/10 29.43 32.06 -10.85% -10.55% 1180.55 -6.13%
10/1/10 28.6 31.01 -2.82% -3.28% 1183.26 0.23%
9/1/10 29.79 30.66 4.16% -1.13% 1141.2 -3.55%
8/2/10 25.54 24.6 -14.27% -19.77% 1049.33 -8.05%
7/1/10 29.05 25.97 13.74% 5.57% 1101.6 4.98%
6/1/10 27.67 24.29 -4.75% -6.47% 1030.71 -6.44%
5/3/10 32.69 29.14 18.14% 19.97% 1089.41 5.70%
4/1/10 34.85 31.85 6.61% 9.30% 1186.69 8.93%
3/1/10 34.43 33.61 -1.21% 5.53% 1169.43 -1.45%
2/1/10 31.78 31.93 -7.70% -5.00% 1104.49 -5.55%
1/4/10 30.48 32.53 -4.09% 1.88% 1073.87 -2.77%
12/1/09 30.25 33.14 -0.75% 1.88% 1115.1 3.84%
11/2/09 29.12 35.09 -3.74% 5.88% 1095.63 -1.75%
10/1/09 33.15 34.02 13.84% -3.05% 1036.19 -5.43%
9/1/09 33.5 33.69 1.06% -0.97% 1057.08 2.02%
8/3/09 35.17 30.47 4.99% -9.56% 1020.62 -3.45%
7/1/09 31.38 27.8 -10.78% -8.76% 987.48 -3.25%
6/22/09 29.8 26.32 -5.04% -5.32% 919.32 -6.90%
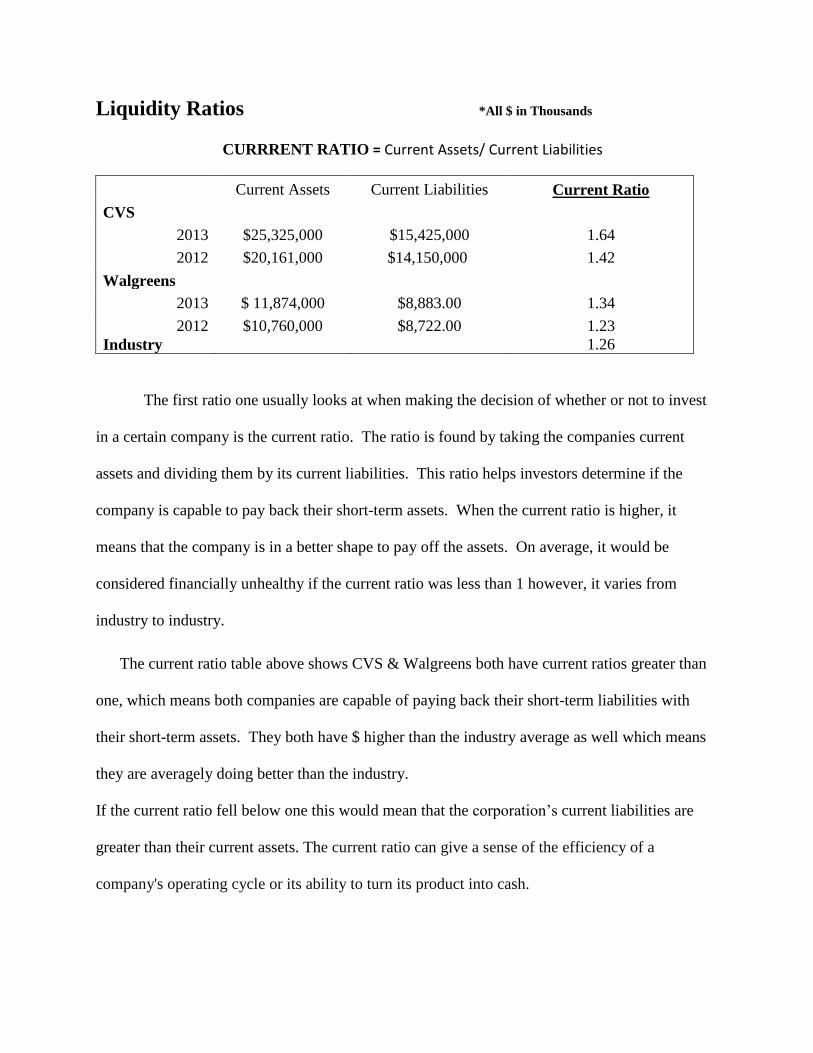
Liquidity Ratios *All $ in Thousands
CURRRENT RATIO = Current Assets/ Current Liabilities
Current Assets Current Liabilities Current Ratio
CVS
2013 $25,325,000 $15,425,000 1.64
2012 $20,161,000 $14,150,000 1.42
Walgreens
2013 $ 11,874,000 $8,883.00 1.34
2012 $10,760,000 $8,722.00 1.23
Industry 1.26
The first ratio one usually looks at when making the decision of whether or not to invest
in a certain company is the current ratio. The ratio is found by taking the companies current
assets and dividing them by its current liabilities. This ratio helps investors determine if the
company is capable to pay back their short-term assets. When the current ratio is higher, it
means that the company is in a better shape to pay off the assets. On average, it would be
considered financially unhealthy if the current ratio was less than 1 however, it varies from
industry to industry.
The current ratio table above shows CVS & Walgreens both have current ratios greater than
one, which means both companies are capable of paying back their short-term liabilities with
their short-term assets. They both have $ higher than the industry average as well which means
they are averagely doing better than the industry.
If the current ratio fell below one this would mean that the corporation’s current liabilities are
greater than their current assets. The current ratio can give a sense of the efficiency of a
company's operating cycle or its ability to turn its product into cash.

Liquidity Ratios *All $ in Thousands
QUICK RATIO = (Current Assets – Inventories) / Current Liabilities
Similar to the current ratio, the quick ratio also gives us an idea of the company’s short-
term liquidity. The main difference between the two is that the quick ratio has now subtracted
the inventories so the number we receive is the company’s ability to meet their short term
payments with their most liquid assets. It tells us the dollar amount of liquid assets available for
each dollar of current liabilities. In the year 2012, CVS had a quick ratio of .65 while Walgreens
had one of .43, this illustrates that CVS had 65 cents of liquid assets currently to cover each $1
of current liabilities and Walgreens had 43 cents for every dollar. One year later CVS jumped to
a much higher quick ratio due to their increase in assets was much higher than the increase of
liabilities. With 93 cents of liquid assets to cover every $1 of current liabilities they blew the
competition of Walgreens away because they only had a quick ratio of .57.
Thus, currently CVS wins the Liquidity ratios because the higher the quick ratio is, the
better the company’s liquidity position
Current Assets Current Liabilities Inventory Quick Ratio
CVS
2013 $25,325,000 $15,425,000 $11,045,000 0.93
2012 $20,161,000 $14,150,000 $11,032,000 0.65
Walgreens
2013 $11,874.00 $8,883.00 $6,852.00 0.57
2012 $10,760.00 $8,722.00 $7,036.00 0.43
Industry 0.83
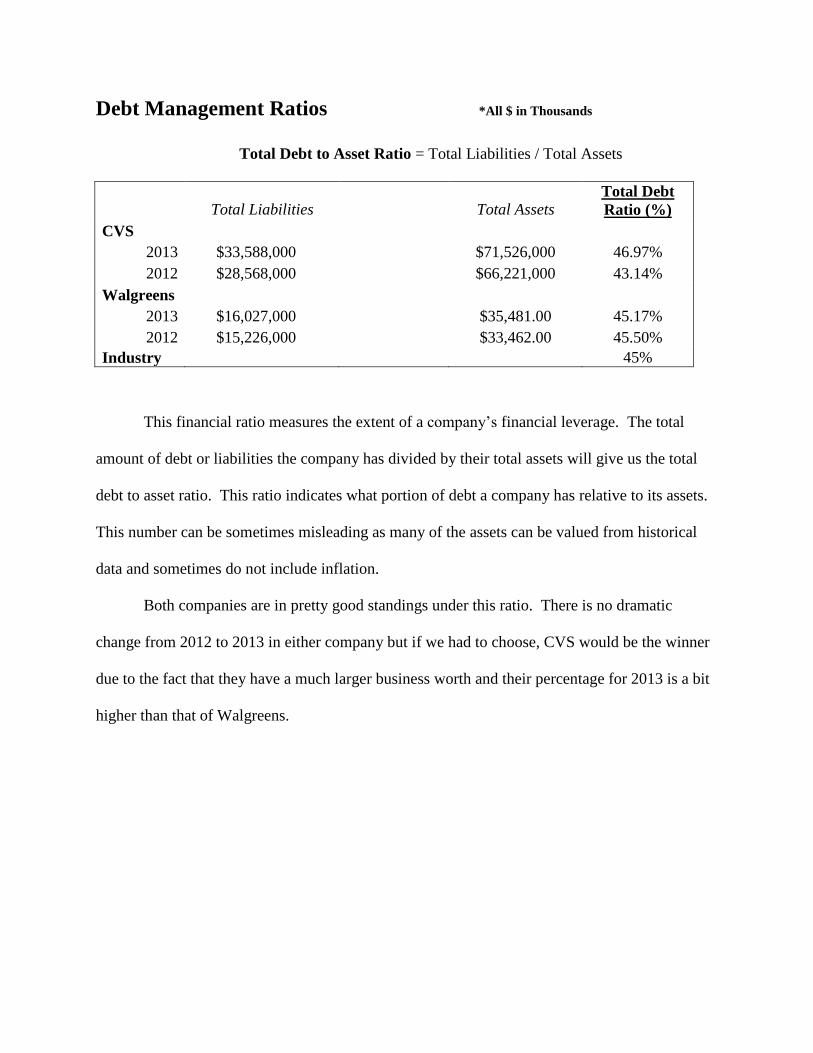
Debt Management Ratios *All $ in Thousands
Total Debt to Asset Ratio = Total Liabilities / Total Assets
Total Liabilities Total Assets Total Debt
Ratio (%)
CVS
2013 $33,588,000 $71,526,000 46.97%
2012 $28,568,000 $66,221,000 43.14%
Walgreens
2013 $16,027,000 $35,481.00 45.17%
2012 $15,226,000 $33,462.00 45.50%
Industry 45%
This financial ratio measures the extent of a company’s financial leverage. The total
amount of debt or liabilities the company has divided by their total assets will give us the total
debt to asset ratio. This ratio indicates what portion of debt a company has relative to its assets.
This number can be sometimes misleading as many of the assets can be valued from historical
data and sometimes do not include inflation.
Both companies are in pretty good standings under this ratio. There is no dramatic
change from 2012 to 2013 in either company but if we had to choose, CVS would be the winner
due to the fact that they have a much larger business worth and their percentage for 2013 is a bit
higher than that of Walgreens.
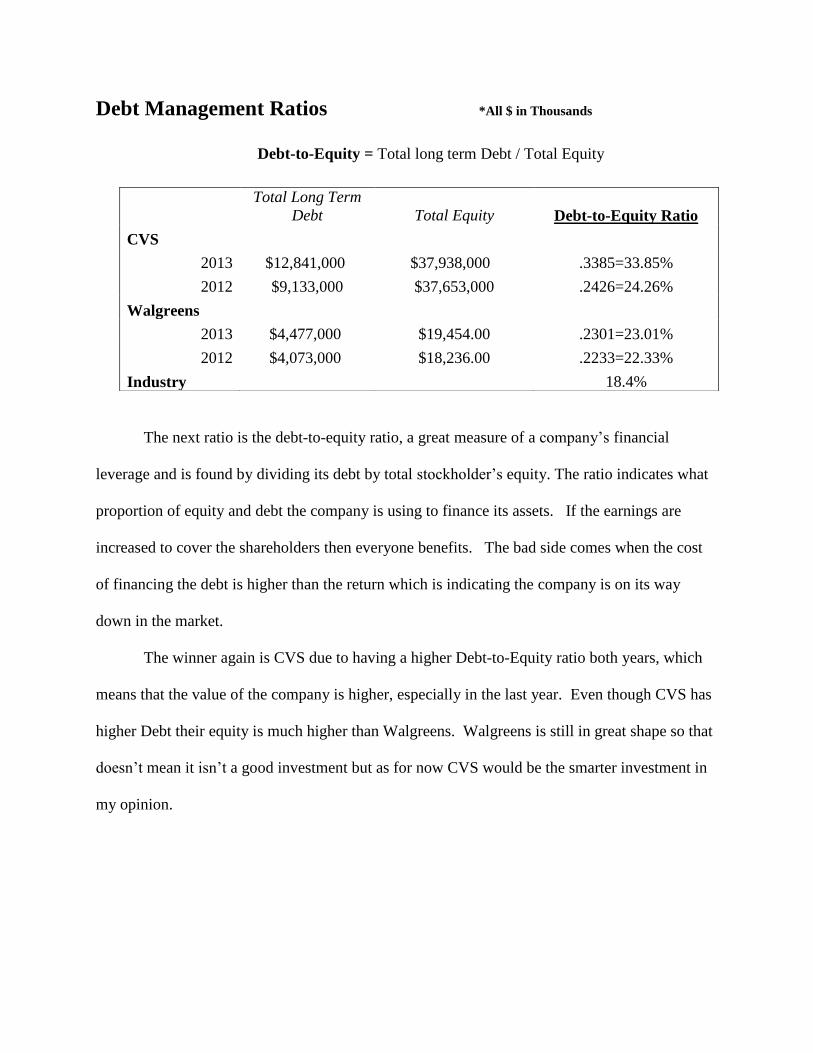
Debt Management Ratios *All $ in Thousands
Debt-to-Equity = Total long term Debt / Total Equity
The next ratio is the debt-to-equity ratio, a great measure of a company’s financial
leverage and is found by dividing its debt by total stockholder’s equity. The ratio indicates what
proportion of equity and debt the company is using to finance its assets. If the earnings are
increased to cover the shareholders then everyone benefits. The bad side comes when the cost
of financing the debt is higher than the return which is indicating the company is on its way
down in the market.
The winner again is CVS due to having a higher Debt-to-Equity ratio both years, which
means that the value of the company is higher, especially in the last year. Even though CVS has
higher Debt their equity is much higher than Walgreens. Walgreens is still in great shape so that
doesn’t mean it isn’t a good investment but as for now CVS would be the smarter investment in
my opinion.
Total Long Term
Debt Total Equity Debt-to-Equity Ratio
CVS
2013 $12,841,000 $37,938,000 .3385=33.85%
2012 $9,133,000 $37,653,000 .2426=24.26%
Walgreens
2013 $4,477,000 $19,454.00 .2301=23.01%
2012 $4,073,000 $18,236.00 .2233=22.33%
Industry 18.4%
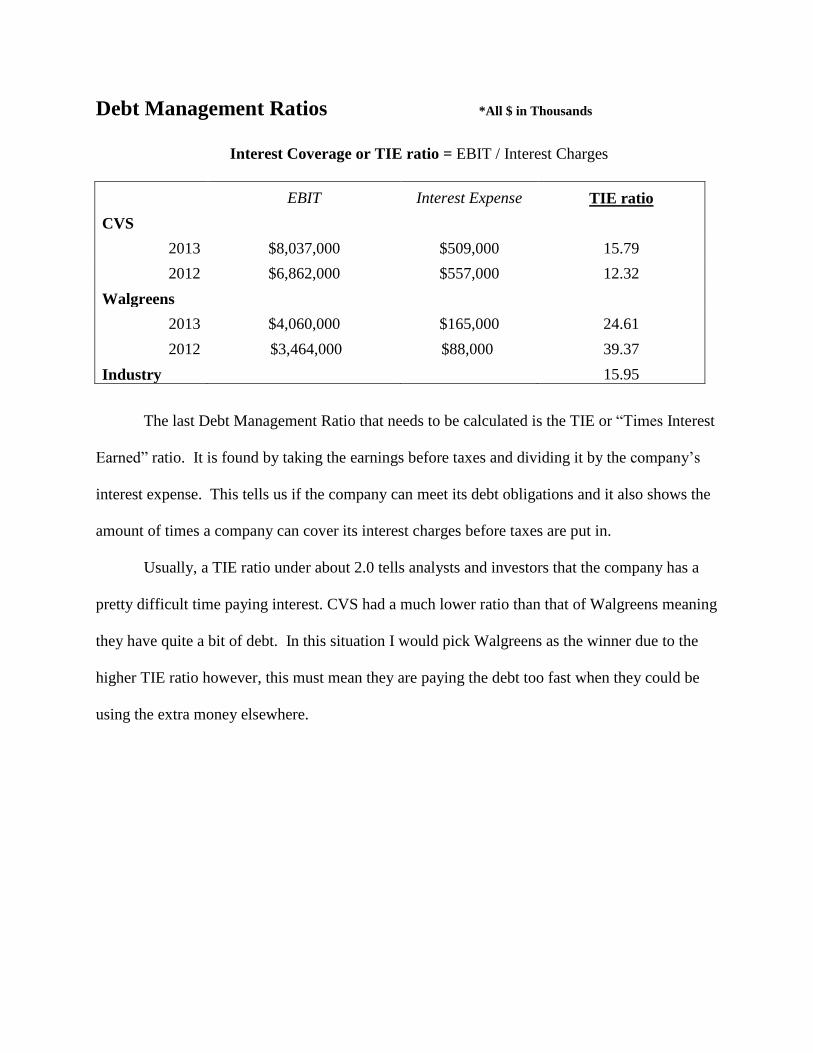
Debt Management Ratios *All $ in Thousands
Interest Coverage or TIE ratio = EBIT / Interest Charges
EBIT Interest Expense TIE ratio
CVS
2013 $8,037,000 $509,000 15.79
2012 $6,862,000 $557,000 12.32
Walgreens
2013 $4,060,000 $165,000 24.61
2012 $3,464,000 $88,000 39.37
Industry 15.95
The last Debt Management Ratio that needs to be calculated is the TIE or “Times Interest
Earned” ratio. It is found by taking the earnings before taxes and dividing it by the company’s
interest expense. This tells us if the company can meet its debt obligations and it also shows the
amount of times a company can cover its interest charges before taxes are put in.
Usually, a TIE ratio under about 2.0 tells analysts and investors that the company has a
pretty difficult time paying interest. CVS had a much lower ratio than that of Walgreens meaning
they have quite a bit of debt. In this situation I would pick Walgreens as the winner due to the
higher TIE ratio however, this must mean they are paying the debt too fast when they could be
using the extra money elsewhere.
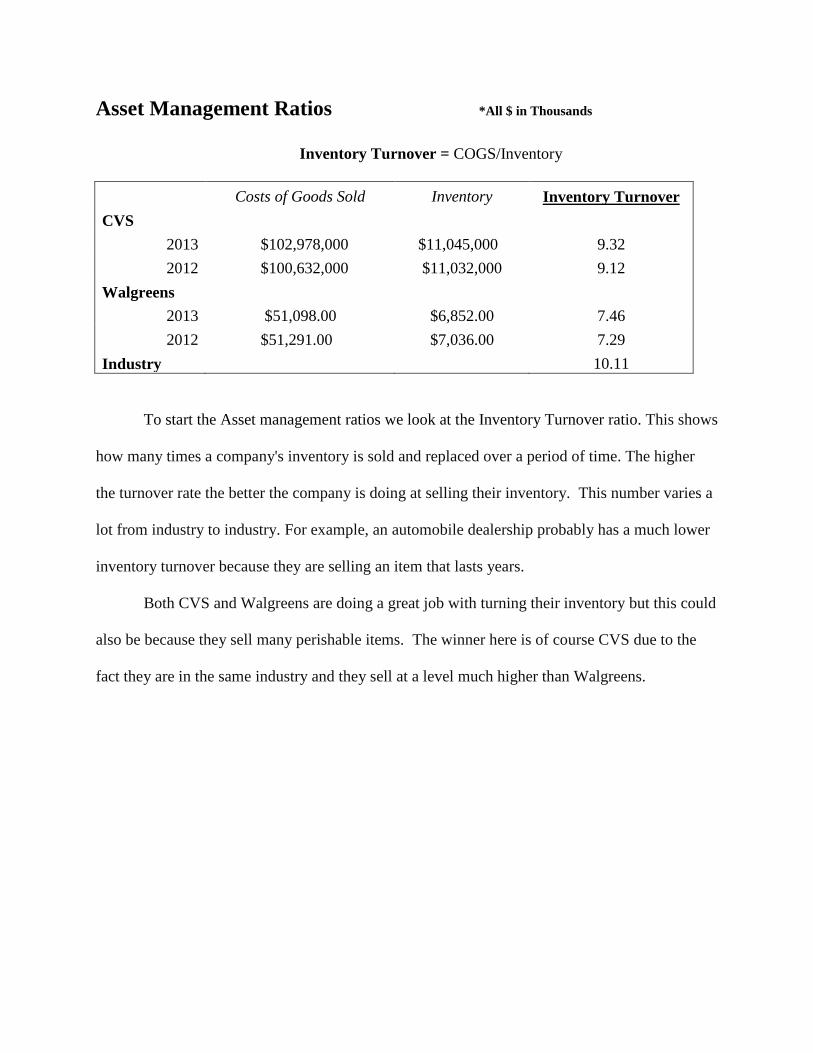
Asset Management Ratios *All $ in Thousands
Inventory Turnover = COGS/Inventory
Costs of Goods Sold Inventory Inventory Turnover
CVS
2013 $102,978,000 $11,045,000 9.32
2012 $100,632,000 $11,032,000 9.12
Walgreens
2013 $51,098.00 $6,852.00 7.46
2012 $51,291.00 $7,036.00 7.29
Industry 10.11
To start the Asset management ratios we look at the Inventory Turnover ratio. This shows
how many times a company's inventory is sold and replaced over a period of time. The higher
the turnover rate the better the company is doing at selling their inventory. This number varies a
lot from industry to industry. For example, an automobile dealership probably has a much lower
inventory turnover because they are selling an item that lasts years.
Both CVS and Walgreens are doing a great job with turning their inventory but this could
also be because they sell many perishable items. The winner here is of course CVS due to the
fact they are in the same industry and they sell at a level much higher than Walgreens.
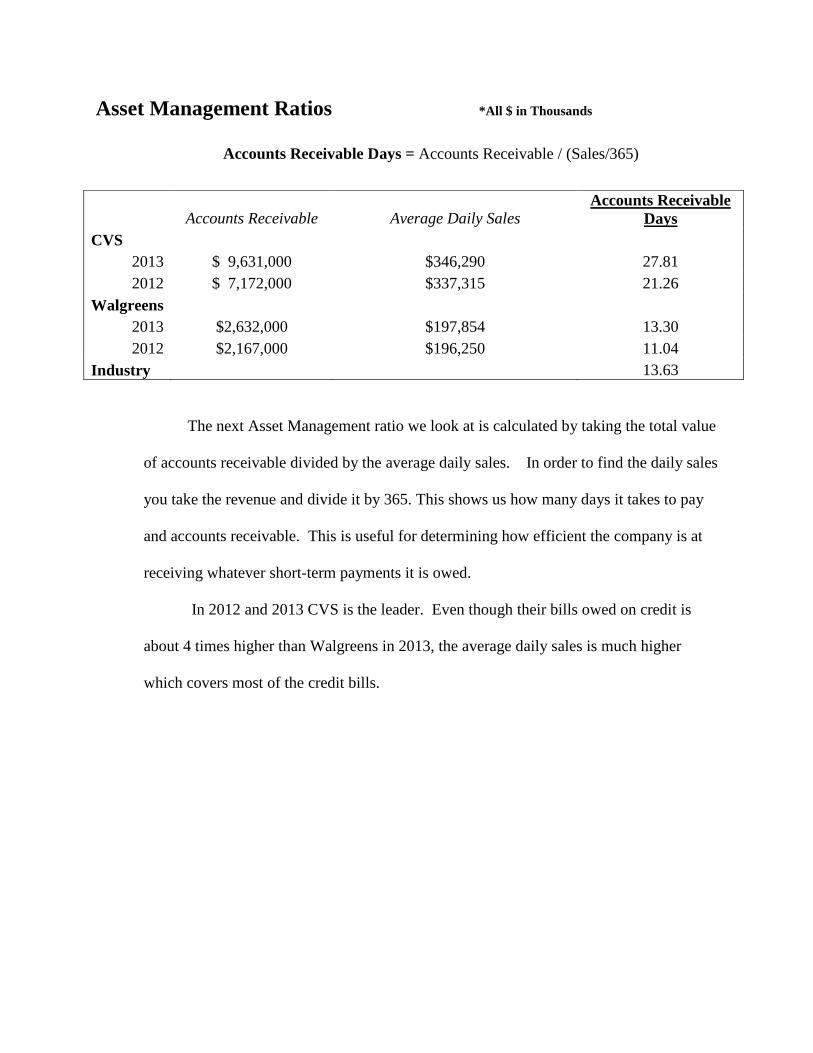
Asset Management Ratios *All $ in Thousands
Accounts Receivable Days = Accounts Receivable / (Sales/365)
The next Asset Management ratio we look at is calculated by taking the total value
of accounts receivable divided by the average daily sales. In order to find the daily sales
you take the revenue and divide it by 365. This shows us how many days it takes to pay
and accounts receivable. This is useful for determining how efficient the company is at
receiving whatever short-term payments it is owed.
In 2012 and 2013 CVS is the leader. Even though their bills owed on credit is
about 4 times higher than Walgreens in 2013, the average daily sales is much higher
which covers most of the credit bills.
Accounts Receivable Average Daily Sales Accounts Receivable
Days
CVS
2013 $ 9,631,000 $346,290 27.81
2012 $ 7,172,000 $337,315 21.26
Walgreens
2013 $2,632,000 $197,854 13.30
2012 $2,167,000 $196,250 11.04
Industry 13.63

Asset Management Ratios *All $ in Thousands
Total Asset Turnover = Sales / Total Assets
Sales Total Assets Total Assets Turnover
CVS
2013 $ 126,761,000 $ 71,526,000 1.77
2012 $ 123,120,000 $ 66,221,000 1.86
Walgreens
2013 $72,217,000 $35,481,000 2.04
2012 $71,633,000 $33,462,000 2.14
Industry 2.18
The last Asset Management Ratio is the Total asset turnover ratio. It is defined as the
amount of sales generated per $1 of assets. This can show an investor the level of efficiency a
company has. The reason CVS has a lower ratio number is because they more than double the
worth of assets compared to Walgreens.
Walgreens is the winner here because according to the numbers their total asset turnover
is higher for both years and that is most likely due to the conservative space and management in
each chain.
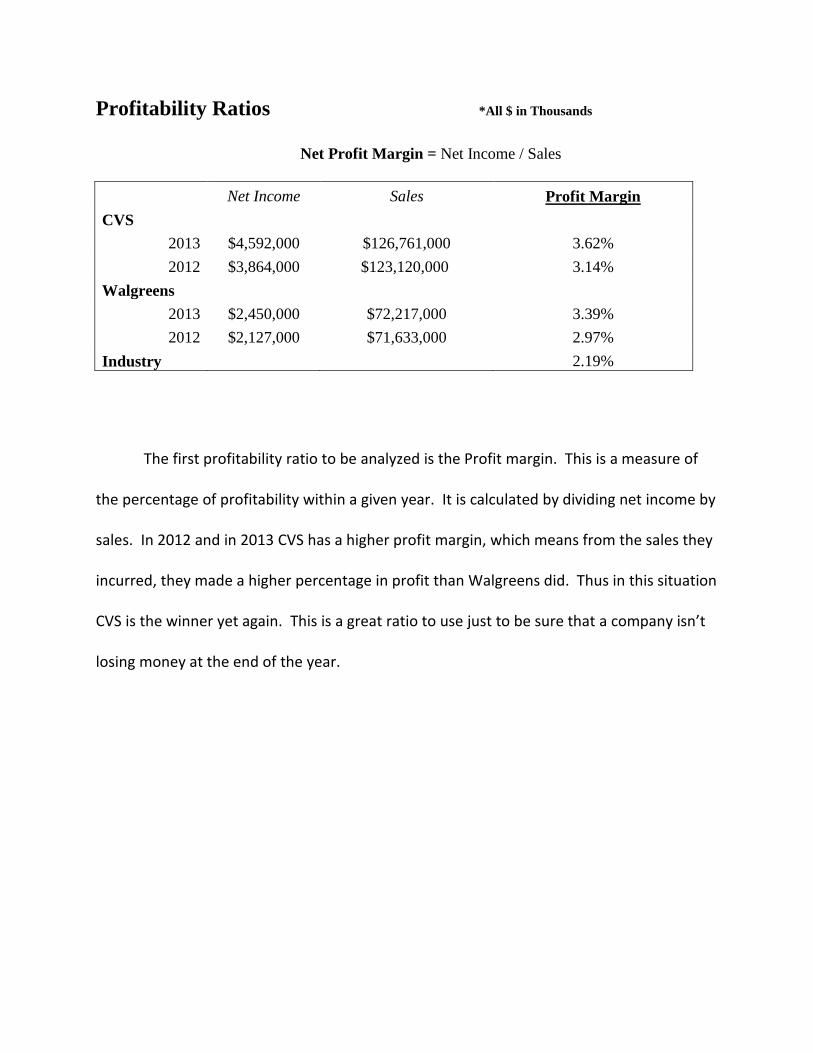
Profitability Ratios *All $ in Thousands
Net Profit Margin = Net Income / Sales
Net Income Sales Profit Margin
CVS
2013 $4,592,000 $126,761,000 3.62%
2012 $3,864,000 $123,120,000 3.14%
Walgreens
2013 $2,450,000 $72,217,000 3.39%
2012 $2,127,000 $71,633,000 2.97%
Industry 2.19%
The first profitability ratio to be analyzed is the Profit margin. This is a measure of
the percentage of profitability within a given year. It is calculated by dividing net income by
sales. In 2012 and in 2013 CVS has a higher profit margin, which means from the sales they
incurred, they made a higher percentage in profit than Walgreens did. Thus in this situation
CVS is the winner yet again. This is a great ratio to use just to be sure that a company isn’t
losing money at the end of the year.
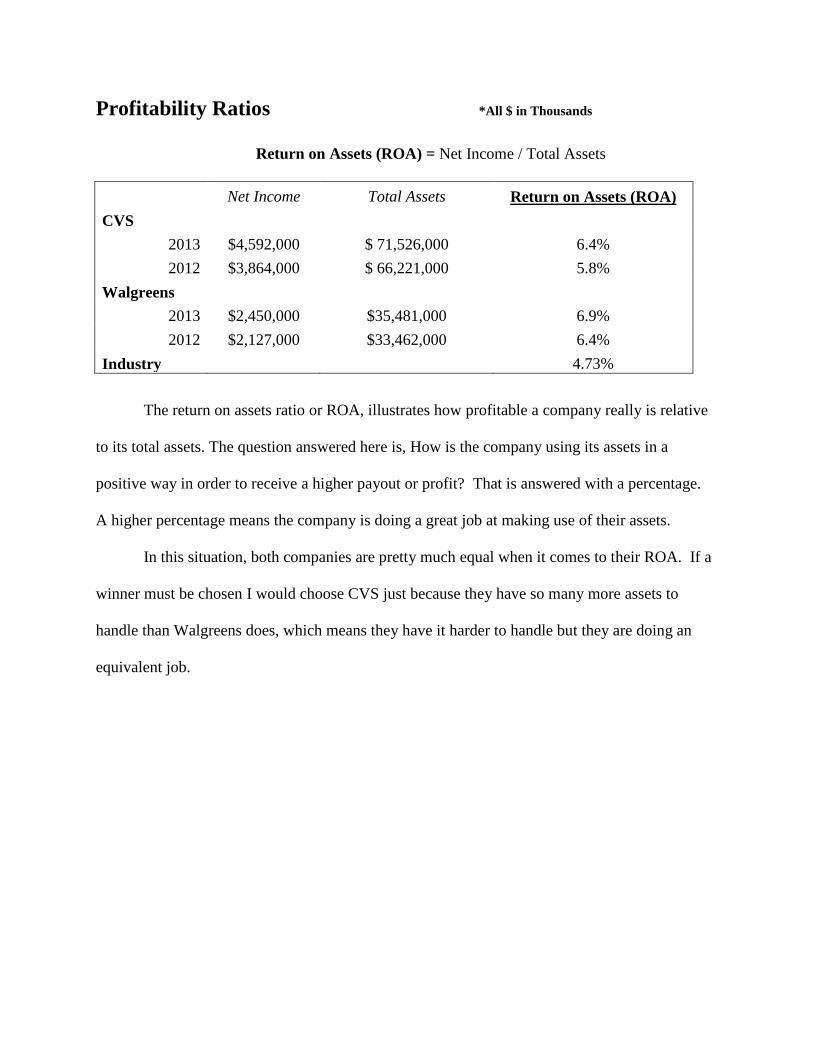
Profitability Ratios *All $ in Thousands
Return on Assets (ROA) = Net Income / Total Assets
Net Income Total Assets Return on Assets (ROA)
CVS
2013 $4,592,000 $ 71,526,000 6.4%
2012 $3,864,000 $ 66,221,000 5.8%
Walgreens
2013 $2,450,000 $35,481,000 6.9%
2012 $2,127,000 $33,462,000 6.4%
Industry 4.73%
The return on assets ratio or ROA, illustrates how profitable a company really is relative
to its total assets. The question answered here is, How is the company using its assets in a
positive way in order to receive a higher payout or profit? That is answered with a percentage.
A higher percentage means the company is doing a great job at making use of their assets.
In this situation, both companies are pretty much equal when it comes to their ROA. If a
winner must be chosen I would choose CVS just because they have so many more assets to
handle than Walgreens does, which means they have it harder to handle but they are doing an
equivalent job.
Profitability Ratios *All $ in Thousands
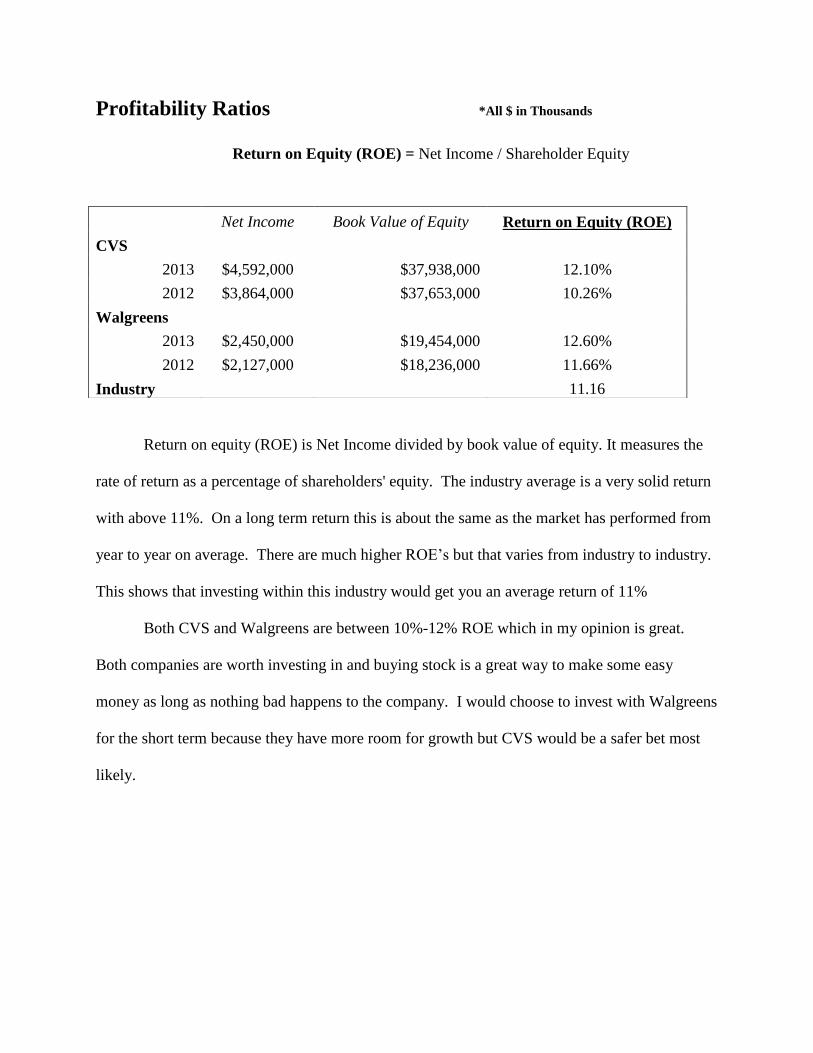
Return on Equity (ROE) = Net Income / Shareholder Equity
Return on equity (ROE) is Net Income divided by book value of equity. It measures the
rate of return as a percentage of shareholders' equity. The industry average is a very solid return
with above 11%. On a long term return this is about the same as the market has performed from
year to year on average. There are much higher ROE’s but that varies from industry to industry.
This shows that investing within this industry would get you an average return of 11%
Both CVS and Walgreens are between 10%-12% ROE which in my opinion is great.
Both companies are worth investing in and buying stock is a great way to make some easy
money as long as nothing bad happens to the company. I would choose to invest with Walgreens
for the short term because they have more room for growth but CVS would be a safer bet most
likely.
Net Income Book Value of Equity Return on Equity (ROE)
CVS
2013 $4,592,000 $37,938,000 12.10%
2012 $3,864,000 $37,653,000 10.26%
Walgreens
2013 $2,450,000 $19,454,000 12.60%
2012 $2,127,000 $18,236,000 11.66%
Industry 11.16

Market Valuation Ratios *All $ in Thousands
Price-To-Earnings Ratio (P/E) = Market Price Per Share / Earnings Per Share
The Price-Earnings ration or P/E Ratio, is calculated by market cap divided by net
income. It can also be calculated by taking the Market Price per share and dividing it by
Earnings per share. Usually, a higher P/E ratio shows that predictions being made expect a
higher earnings growth in the future compared to that with a lower one.
In 2013 Walgreens market cap skyrocketed and the P/E ratio went up with it.
Having a higher P/E ratio than CVS investors might now sell their shares in CVS and start
buying Walgreens as people might see more room for growth and higher earnings in the
future.
Market Cap Net Income P/E Ratio
CVS
2013 $75,510,000 $4,592,000 16.43
2012 $61,204,960 $3,864,000 15.82
Walgreens
2013 $68,080,000 $2,450,000 27.78
2012 $29,473,750 $2,127,000 13.85
Industry 16.93
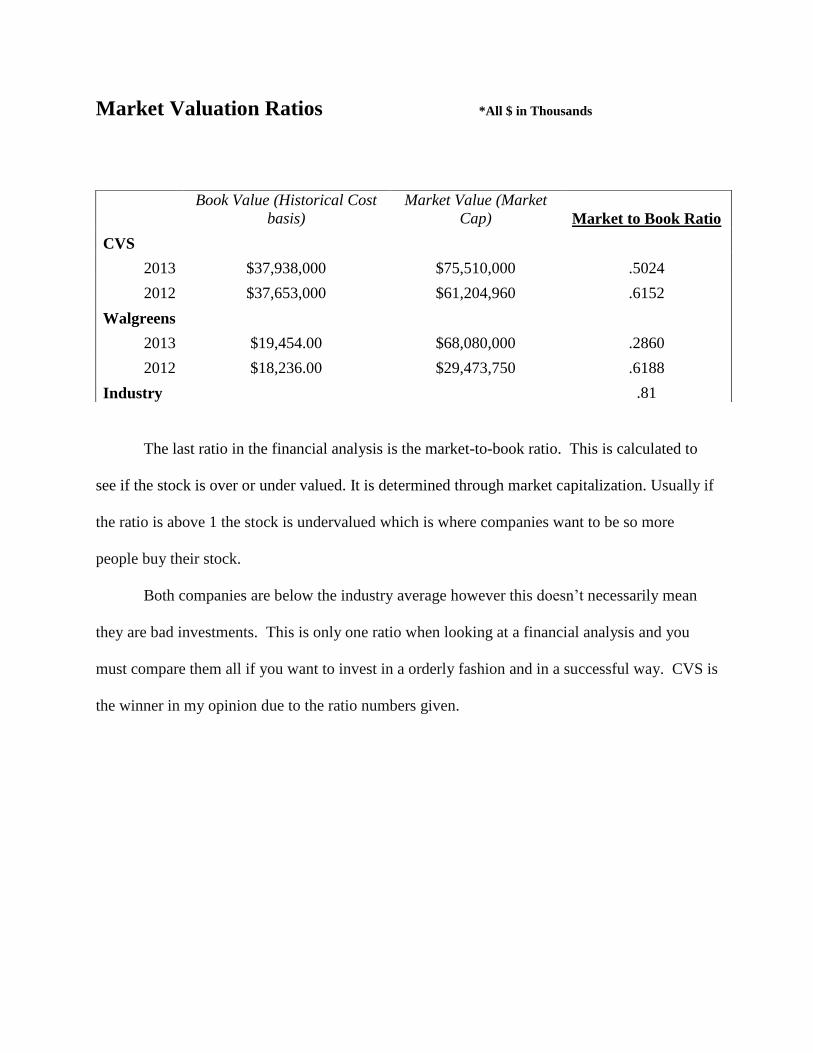
Market Valuation Ratios *All $ in Thousands
The last ratio in the financial analysis is the market-to-book ratio. This is calculated to
see if the stock is over or under valued. It is determined through market capitalization. Usually if
the ratio is above 1 the stock is undervalued which is where companies want to be so more
people buy their stock.
Both companies are below the industry average however this doesn’t necessarily mean
they are bad investments. This is only one ratio when looking at a financial analysis and you
must compare them all if you want to invest in a orderly fashion and in a successful way. CVS is
the winner in my opinion due to the ratio numbers given.
Book Value (Historical Cost
basis)
Market Value (Market
Cap) Market to Book Ratio
CVS
2013 $37,938,000 $75,510,000 .5024
2012 $37,653,000 $61,204,960 .6152
Walgreens
2013 $19,454.00 $68,080,000 .2860
2012 $18,236.00 $29,473,750 .6188
Industry .81
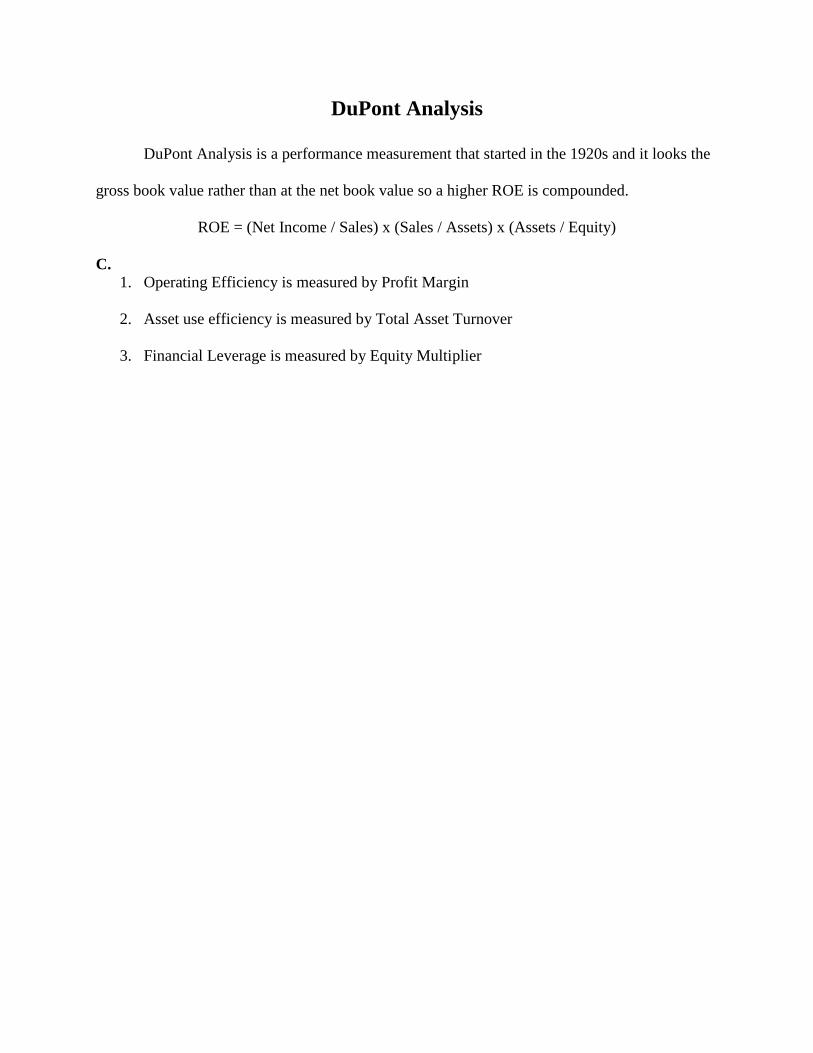
DuPont Analysis
DuPont Analysis is a performance measurement that started in the 1920s and it looks the
gross book value rather than at the net book value so a higher ROE is compounded.
ROE = (Net Income / Sales) x (Sales / Assets) x (Assets / Equity)
C.
1. Operating Efficiency is measured by Profit Margin
2. Asset use efficiency is measured by Total Asset Turnover
3. Financial Leverage is measured by Equity Multiplier
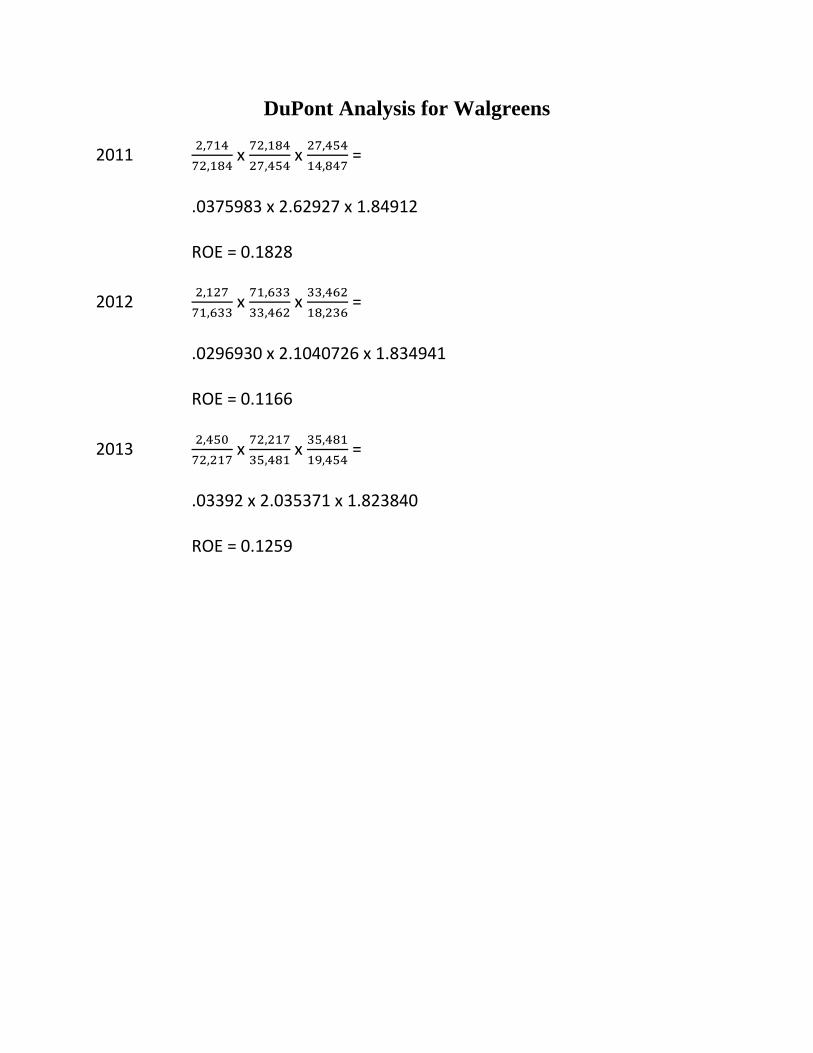
DuPont Analysis for Walgreens
2011 2,714
72,184 x
72,184
27,454 x
27,454
14,847 =
.0375983 x 2.62927 x 1.84912
ROE = 0.1828
2012 2,127
71,633 x
71,633
33,462 x
33,462
18,236 =
.0296930 x 2.1040726 x 1.834941
ROE = 0.1166
2013 2,450
72,217 x
72,217
35,481 x
35,481
19,454 =
.03392 x 2.035371 x 1.823840
ROE = 0.1259

DuPont Analysis for CVS
2011 𝟑,𝟒𝟔𝟐
𝟏𝟎𝟕,𝟎𝟖𝟎 x
𝟏𝟎𝟕,𝟎𝟖𝟎
𝟔𝟒,𝟓𝟒𝟑 x
𝟔𝟒,𝟓𝟒𝟑
𝟑𝟖,𝟎𝟓𝟏 =
.03233 x 1.6590 x 1.6962
ROE = 0.09098
2012 𝟑,𝟖𝟔𝟒
𝟏𝟐𝟑,𝟏𝟐𝟎 x
𝟏𝟐𝟑𝟏𝟐𝟎
𝟔𝟔,𝟐𝟐𝟏 x
66221
𝟑𝟕,𝟔𝟓𝟑 =
.03138 x 1.8592 x 1.7587
ROE = 0.1026
2013 4,592
𝟏𝟐𝟔,𝟕𝟔𝟏 x
𝟏𝟐𝟔,𝟕𝟔𝟏
𝟕𝟏,𝟓𝟐𝟔 x
𝟕𝟏,𝟓𝟐𝟔
𝟑𝟕,𝟗𝟑𝟖 =
.03623 x 1.7722 x 1.8853
ROE = 0.1211
0
0.005
0.01
0.015
0.02
0.025
0.03
0.035
0.04
CVS Profit Margin Walgreens Profit Margin
Profit Margin
2011 2012 2013
DuPont Analysis Graphs
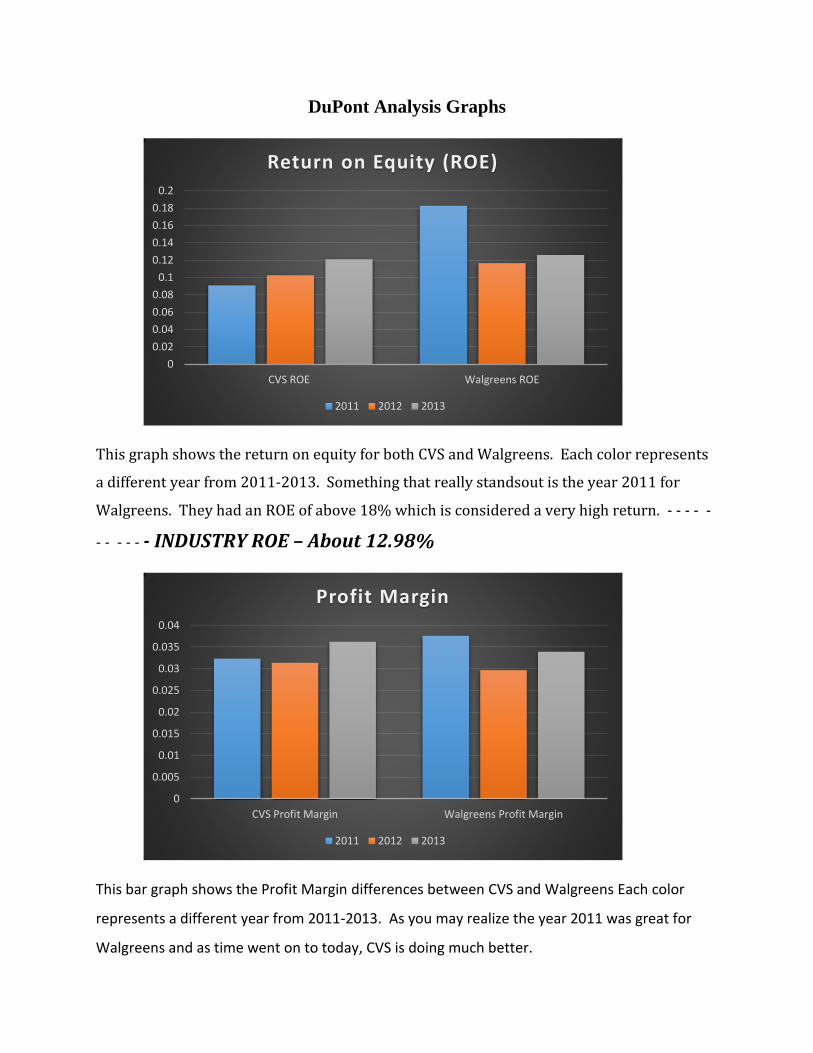
This graph shows the return on equity for both CVS and Walgreens. Each color represents
a different year from 2011-2013. Something that really standsout is the year 2011 for
Walgreens. They had an ROE of above 18% which is considered a very high return. - - - - -
- - - - - - INDUSTRY ROE – About 12.98%
This bar graph shows the Profit Margin differences between CVS and Walgreens Each color
represents a different year from 2011-2013. As you may realize the year 2011 was great for
Walgreens and as time went on to today, CVS is doing much better.
0
0.02
0.04
0.06
0.08
0.1
0.12
0.14
0.16
0.18
0.2
CVS ROE Walgreens ROE
Return on Equity (ROE)
2011 2012 2013
1.6
1.65
1.7
1.75
1.8
1.85
1.9
CVS Equity Multiplier Walgreens Equity Multiplier
Equity Multiplier
2011 2012 2013
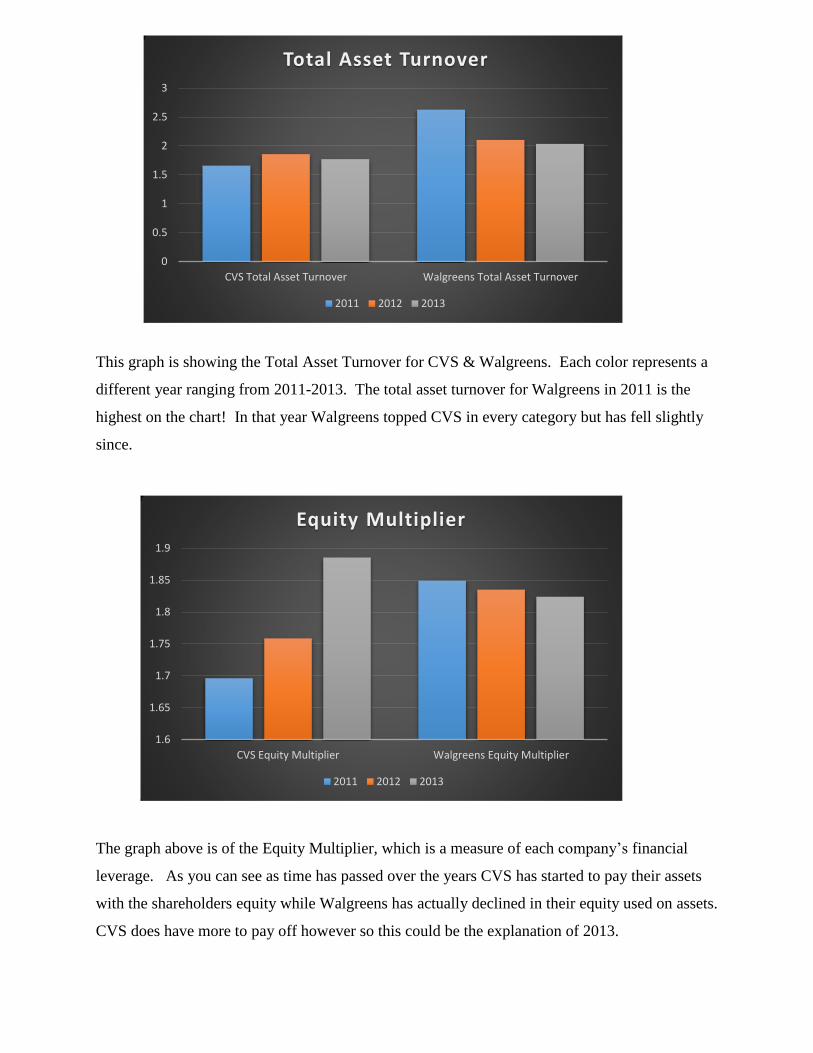
This graph is showing the Total Asset Turnover for CVS & Walgreens. Each color represents a
different year ranging from 2011-2013. The total asset turnover for Walgreens in 2011 is the
highest on the chart! In that year Walgreens topped CVS in every category but has fell slightly
since.
The graph above is of the Equity Multiplier, which is a measure of each company’s financial
leverage. As you can see as time has passed over the years CVS has started to pay their assets
with the shareholders equity while Walgreens has actually declined in their equity used on assets.
CVS does have more to pay off however so this could be the explanation of 2013.
0
0.5
1
1.5
2
2.5
3
CVS Total Asset Turnover Walgreens Total Asset Turnover
Total Asset Turnover
2011 2012 2013
References
1. http://finance.yahoo.com/q/is?s=WBA+Income+Statement&annual
2. http://www.walgreens.com/topic/about/companyhistory.jsp
3. http://finance.yahoo.com/q/is?s=CVS+Income+Statement&annual
4. https://cvshealth.com/about/company-history