restoration project final report (restoration project …...exxon valdez oil spill restoration...
TRANSCRIPT
Exxon Valdez Oil SpillRestoration Project Final Report
Update on the Status of Subsistence Uses in Exxon Valdez Oil Spill Area Communities, 2014
Restoration Project 15150122
James A. FallGarrett Zimpelman
Alaska Department of Fish and GameDivision of Subsistence
333 Raspberry RoadAnchorage, AK 99518
June 2016

The Exxon Valdez Oil Spill Trustee Council administers all programs and activities free from discrimination based on race, color, national origin, age, sex, religion, marital status, pregnancy, parenthood, or disability. The Council administers all programs and activities in compliance with Title VI of the Civil Rights Act of 1964, Section 504 of the Rehabilitation Act of 1973, Title II of the Americans with Disabilities Action of 1990, the Age Discrimination Act of 1975, and Title IX of the Education Amendments of 1972. If you believe you have been discriminated against in any program, activity, or facility, or if you desire further information, please write to: EVOS Trustee Council, 4210 University Dr., Anchorage, Alaska 99508-4626, or [email protected]; or O.E.O. U.S. Department of the Interior, Washington, D.C. 20240.
Exxon Valdez Oil SpillRestoration Project Final Report
Update on the Status of Subsistence Uses in Exxon Valdez Oil Spill Area Communities, 2014
Restoration Project 15150122
James A. FallGarrett Zimpelman
Alaska Department of Fish and GameDivision of Subsistence
333 Raspberry RoadAnchorage, AK 99518
June 2016
Update on the Status of Subsistence Uses in Exxon Valdez Oil Spill Area Communities, 2014
Restoration Project 15150122
Final Report
Study History: The study was undertaken to update data on subsistence harvests and uses in Exxon Valdez oil spill area communities last collected for study year 2014 under Restoration Project 15150122. Project goals, objectives, and methods were developed in response to Exxon Valdez Oil Spill Trustee Council recovery objectives for subsistence uses, an injured natural resource service, which were updated in November 2014.
Abstract: The project updated information about subsistence harvests in three Prince William Sound communities (Chenega Bay, Tatitlek, and Cordova) to evaluate the status of this injured natural resource. Information for two lower Cook Inlet communities (Nanwalek and Port Graham) collected through another project was included in the final chapter for comparative purposes. Data were collected during systematic household surveys with a randomly-selected sample in Cordova and a census sample in the other communities. Subsistence harvests in 2014 ranged from 116 pounds per capita in Cordova to 255 pounds per capita in Chenega Bay and 294 pounds per capita in Tatitlek. Harvests included a diverse range of resources, and most households used, harvested, and shared wild foods. Subsistence harvests in the study communities in 2014 were lower and less diverse than in most post-spill years. Respondents offered a range of cultural, economic, and environmental explanations for changing subsistence harvests and uses; some of these are linked to the oil spill but many are not. While a strong majority of respondents expressed confidence that subsistence foods are safe to eat, most said that natural resource populations and the subsistence way of life have not fully recovered from the effects of the spill.
Key Words: Alaska, Chenega Bay, Cordova, Exxon Valdez oil spill, food safety, Prince William Sound, subsistence harvests, Tatitlek, technological disasters.
Project Data: Description of data—data were collected during systematic, face-to-face interviews with residents of the study communities. Data include demographic and employment characteristics, individual participation in harvesting and processing of wild resources, characteristics of resource harvests and uses and locations where resources are collected, the sharing of wild foods, food security, harvest and use trends over time, and evaluations of food safety, resource status and recovery, whether youth are learning subsistence skills, the role of elders, and the recovery of the subsistence way of life. Format—all data were entered into a database within a Microsoft SQL Server. Custodian—much of the harvest and use data are available in the Community Subsistence Information System (http://www.adfg.alaska.gov/sb/CSIS/); additionally, contact Megan Hellenthal, Division of Subsistence, Alaska Department of Fish and Game, 333 Raspberry Road, Anchorage, AK 99518; 907-267-2371; [email protected].

Citation:
Fall, J. A. and G. Zimpelman, editors. 2016. Update on the Status of Subsistence Uses in Exxon Valdez Oil Spill Area Communities, 2014. Exxon Valdez Oil Spill Restoration Project Final Report (Restoration Project 15150112), Alaska Department of Fish and Game, Division of Subsistence, Technical Paper No. 412, Anchorage, Alaska.
i
List of Tables .......................................................................................................................................v
List of Figures ................................................................................................................................... xi
List of Plates ................................................................................................................................... xvi
List of Appendices ......................................................................................................................... xvii
Executive Summary ..................................................................................................................... xviii
1. Introduction ....................................................................................................................................1Project Background ......................................................................................................................1Regulatory Context ......................................................................................................................2Study Goals and Objectives .........................................................................................................2Research Methods ........................................................................................................................8
Ethical Principles for the Conduct of Research .......................................................................8Project Planning and Approvals ...............................................................................................8Systematic Household Surveys and Sample Achievement ....................................................10Mapping Locations of Subsistence Hunting, Fishing, and Gathering Activities ...................11Key Respondent Interviews ...................................................................................................12
Data Analysis and Review .........................................................................................................12Survey Data Entry and Analysis ............................................................................................12Population Estimates and Other Demographic Information ..................................................14Map Data Entry and Analysis ................................................................................................14Food Security Analysis ..........................................................................................................14Community Review Meetings ...............................................................................................15
Final Report Organization ..........................................................................................................16
2. Chenega Bay .................................................................................................................................19Community Background ............................................................................................................19Household Survey Implementation ............................................................................................19Population Estimates and Demographic Information ................................................................19Income and Cash Employment ..................................................................................................24Food Security .............................................................................................................................29Summary of Harvest and Use Patterns ......................................................................................33
Individual Participation in the Harvesting and Processing of Wild Resources .....................33Harvest and Use of Wild Resources at the Household Level ................................................33
Harvest Quantities and Composition .........................................................................................35Use and Harvest Characteristics by Resource Category ............................................................43
Salmon ...................................................................................................................................45Nonsalmon Fish .....................................................................................................................51
TABLE OF CONTENTS
ii
Large Land Mammals ............................................................................................................59Small Land Mammals/Furbearers ..........................................................................................62Marine Mammals ...................................................................................................................63Birds and Eggs .......................................................................................................................67Marine Invertebrates ..............................................................................................................68Vegetation ..............................................................................................................................72
Comparing Harvests and Uses in 2014 with Previous Years .....................................................73Harvest Assessments ..............................................................................................................73Harvest Data ...........................................................................................................................83Natural Resource Conditions .................................................................................................88
Food Safety ..................................................................................................................................... 88Status of Resource Populations ...................................................................................................... 88
Social and Economic Conditions ...........................................................................................93Young Adults’ Involvement in Subsistence Activities ...................................................................... 93Elders’ Influence ............................................................................................................................. 99Status of the Traditional Way of Life .............................................................................................. 99
Acknowledgments ..........................................................................................................................103
3. Tatitlek ........................................................................................................................................104Community Background ..........................................................................................................104Household Survey Implementation ..........................................................................................104Population Estimates and Demographic Information ..............................................................104Income and Cash Employment ................................................................................................110Food Security ...........................................................................................................................116Summary of Harvest and Use Patterns ....................................................................................117
Individual Participation in the Harvesting and Processing of Wild Resources ...................117Harvest and Use of Wild Resources at the Household Level ..............................................119
Harvest Quantities and Composition .......................................................................................120Use and Harvest Characteristics by Resource Category ..........................................................128
Salmon .................................................................................................................................132Nonsalmon Fish ...................................................................................................................136Large Land Mammals ..........................................................................................................143Small Land Mammals/Furbearers ........................................................................................145Marine Mammals .................................................................................................................146Birds and Eggs .....................................................................................................................149Marine Invertebrates ............................................................................................................150Vegetation ............................................................................................................................154
Comparing Harvests and Uses in 2014 with Previous Years ...................................................155Harvest Assessments ............................................................................................................155Harvest Data .........................................................................................................................166Natural Resource Conditions ...............................................................................................170
TABLE OF CONTENTS, CONTINUED

iii
Food Safety ................................................................................................................................... 170Status of Resource Populations .................................................................................................... 170
Social and Economic Conditions .........................................................................................177Young Adults’ Involvement in Subsistence Activities .................................................................... 177Elders’ Influence ........................................................................................................................... 177Status of the Traditional Way of Life ............................................................................................ 182
Acknowledgments ..........................................................................................................................185
4. Cordova .......................................................................................................................................186Community Background ..........................................................................................................186Household Survey Implementation ..........................................................................................187Population Estimates and Demographic Information ..............................................................187Income and Cash Employment ................................................................................................193Food Security ...........................................................................................................................199Summary of Harvest and Use Patterns ....................................................................................201
Individual Participation in the Harvesting and Processing of Wild Resources ...................201Harvest and Use of Wild Resources at the Household Level ..............................................204
Harvest Quantities and Composition .......................................................................................205Use and Harvest Characteristics by Resource Category ..........................................................214
Salmon .................................................................................................................................218Nonsalmon Fish ...................................................................................................................225Large Land Mammals ..........................................................................................................233Small Land Mammals/Furbearers ........................................................................................236Marine Mammals .................................................................................................................239Birds and Eggs .....................................................................................................................239Marine Invertebrates ............................................................................................................243Vegetation ............................................................................................................................246
Comparing Harvests and Uses in 2014 with Previous Years ...................................................249Harvest Assessments ............................................................................................................249Harvest Data .........................................................................................................................260Natural Resource Conditions ...............................................................................................266
Food Safety ................................................................................................................................... 266Status of Resource Populations .................................................................................................... 269
Social and Economic Conditions .........................................................................................274Young Adults’ Involvement in Subsistence Activities .................................................................... 274Elders’ Influence ........................................................................................................................... 274Status of the Traditional Way of Life ............................................................................................ 280
Acknowledgments ..........................................................................................................................283
5. Discussion and Conclusions ......................................................................................................284Overview of Findings for the Study Communities, 2014 ........................................................284
TABLE OF CONTENTS, CONTINUED

iv
TABLE OF CONTENTS, CONTINUEDAddressing the Recovery Objective .....................................................................................284Demography .........................................................................................................................285Trends in Subsistence Harvests and Uses ............................................................................285Assessments of Natural Resource Conditions .....................................................................302Subsistence Food Safety ......................................................................................................307Assessments of Social and Economic Conditions ...............................................................309
Conclusions: The Status of the Recovery of Subsistence Uses in 2014 ..................................325Question One: Are resources used for subsistence purposes healthy, and are their popula-tions at pre-spill levels? .....................................................................................................325Question Two: Are people confident that resources are safe to eat? ..................................333Question Three: Have the cultural values associated with subsistence uses been reintegrated into community life? ..........................................................................................................334
Conclusions ..............................................................................................................................334
References Cited .............................................................................................................................336

v
Table1-1.–Species used by study communities, 2014. .................................................................................41-2.–Project staff. .................................................................................................................................91-3.–Community scoping meetings, study communities, 2014. ........................................................101-4.–Estimated households and sample achievement, study communities, 2014. .............................111-5.–Survey duration, study communities, 2014. ..............................................................................111-6.–Community review meetings, study communities, 2014. .........................................................161-7.–Selected community study findings for comparison, study communities, 2014. ......................171-8.–Estimated harvests of Pacific halibut based upon subsistence and sport harvests reported
on SHARCs, study communities in EVOS area, 2003–2012, and 2014. ..............................182-1.–Population estimates, Chenega Bay, 2010 and 2014. ................................................................202-2.–Sample and demographic characteristics, Chenega Bay, 2014. ................................................222-3.–Population profile, Chenega Bay, 2014. ....................................................................................232-4.–Birthplaces of household heads, Chenega Bay, 2014. ...............................................................242-5.–Birthplaces of population, Chenega Bay, 2014. ........................................................................242-6.–Estimated earned and other income, Chenega Bay, 2014. .........................................................252-7.–Employment by industry, Chenega Bay, 2014...........................................................................262-8.–Comparison of median income estimates, Chenega Bay, 2014. ................................................272-9.–Employment characteristics, Chenega Bay, 2014. ....................................................................282-10.–Reported job schedules, Chenega Bay, 2014. ..........................................................................292-11.–Individual participation in subsistence harvesting and processing activities,
Chenega Bay, 2014. ..............................................................................................................342-12.–Resource harvest and use characteristics, Chenega Bay, 2014. ...............................................362-13.–Estimated uses and harvests of fish, game, and vegetation resources, Chenega Bay,
2014........................................................................................................................................372-14.–Top ranked resources used by households, Chenega Bay, 2014. .............................................452-15.–Estimated percentages of salmon harvested by gear type, resource, and total salmon
harvest, Chenega Bay, 2014. ..................................................................................................482-16.–Estimated percentages of nonsalmon fish harvested by gear type, resource, and total
nonsalmon fish harvest, Chenega Bay, 2014. ........................................................................532-17.–Estimated large land mammal harvests by month and sex, Chenega Bay, 2014. ....................602-18.–Estimated small land mammal/furbearer harvests by month, Chenega Bay, 2014. ................632-19.–Estimated marine mammal harvests by month and sex, Chenega Bay, 2014. ........................652-20.–Estimated bird harvests by season, Chenega Bay, 2014. .........................................................68
LIST OF TABLES

vi
Table 2-21.–Use of firewood for home heating in sampled households, Chenega Bay, 2014. ...................732-22.–Changes in household uses of resources compared to recent years, Chenega Bay, 2014. ......752-23.–Reasons for less household uses of resources compared to recent years, Chenega Bay,
2014........................................................................................................................................782-24.–Reported impact to households reporting that they did not get enough of a type of
resource, Chenega Bay, 2014. ................................................................................................802-25.–Reasons for more household uses of resources compared to recent years, Chenega Bay,
2014........................................................................................................................................822-26.–Resources that households reported needing, Chenega Bay, 2014. .........................................832-27.–Estimated per capita harvests in pounds usable weight by resource category, Chenega
Bay, 1984, 1985, 1989, 1990, 1991, 1992, 1997, 2003, and 2014. ........................................852-28.–Comparison of harvest composition by resource category, Chenega Bay, 1984, 1985,
1989, 1990, 1991, 1992, 1997, 2003, and 2014. ....................................................................872-29.–Household assessments of the safety of eating Pacific herring, harbor seals, chitons,
and clams harvested in traditional locations, Chenega Bay, 2014. ........................................892-30.–Reasons why Pacific herring, harbor seals, chitons, and clams are not safe to eat, Chenega
Bay, 2014. ..............................................................................................................................892-31.–Household assessments of the recovery of subsistence resources since the oil spill,
Chenega Bay, 2014. ...............................................................................................................902-32.–Household assessments of what should be done to help with the recovery of subsistence
resources, Chenega Bay, 2014. ..............................................................................................912-33.–Household assessments of change in resource availability compared to 10 years ago,
Chenega Bay, 2014. ...............................................................................................................922-34.–Reasons for more resource availability compared to 10 years ago, Chenega Bay, 2014. .......942-35.–Reasons for less resource availability compared to 10 years ago, Chenega Bay, 2014. .........952-36.–Household assessments of whether young adults learn enough subsistence skills,
Chenega Bay, 2014. ...............................................................................................................962-37.–Reasons why young adults are not learning enough subsistence skills, Chenega Bay,
2014........................................................................................................................................972-38.–Ways that young adults are learning subsistence skills, Chenega Bay, 2014. .........................982-39.–Household assessments of change in elders’ influence in the last 10 years, Chenega Bay,
2014......................................................................................................................................1002-40.–Reasons for decreased influence of elders in the last 10 years, Chenega Bay, 2014. ............100
LIST OF TABLES, CONTINUED

vii
Table 2-41.–Household assessments of the oil spill’s effect on the traditional way of life, Chenega
Bay, 2014. ............................................................................................................................1012-42.–Household assessments of the recovery of the traditional way of life since the oil spill,
Chenega Bay, 2014. .............................................................................................................1012-43.–Household assessments for ways to help the recovery of the traditional way of life,
Chenega Bay, 2014. .............................................................................................................1023-1.–Population estimates, Tatitlek, 2010 and 2014. .......................................................................1053-2.–Sample and demographic characteristics, Tatitlek, 2014. ........................................................1073-3.–Population profile, Tatitlek, 2014. ...........................................................................................1083-4.–Birthplaces of household heads, Tatitlek, 2014. ......................................................................1093-5.–Birthplaces of population, Tatitlek, 2014. ...............................................................................1093-6.–Estimated earned and other income, Tatitlek, 2014. ................................................................1113-7.–Employment by industry, Tatitlek, 2014. .................................................................................1123-8.–Comparison of median income estimates, Tatitlek, 2014. .......................................................1133-9.–Employment characteristics, Tatitlek, 2014. ............................................................................1143-10.–Reported job schedules, Tatitlek, 2014. .................................................................................1153-11.–Individual participation in subsistence harvesting and processing activities, Tatitlek,
2014. ....................................................................................................................................1183-12.–Resource harvest and use characteristics, Tatitlek, 2014. ......................................................1213-13.–Estimated uses and harvests of fish, game, and vegetation resources, Tatitlek, 2014. ..........1223-14.–Top ranked resources used by households, Tatitlek, 2014. ....................................................1303-15.–Estimated percentages of salmon harvested by gear type, resource, and total salmon
harvest, Tatitlek, 2014. .........................................................................................................1343-16.–Estimated percentages of nonsalmon fish harvested by gear type, resource, and total
nonsalmon fish harvest, Tatitlek, 2014. ................................................................................1373-17.–Estimated large land mammal harvests by month and sex, Tatitlek, 2014. ...........................1433-18.–Estimated marine mammal harvests by month and sex, Tatitlek, 2014. ................................1473-19.–Estimated bird harvests by season, Tatitlek, 2014. ................................................................1503-20.–Use of firewood for home heating in sampled households, Tatitlek, 2014. ...........................1553-21.–Changes in household uses of resources compared to recent years, Tatitlek, 2014. .............1573-22.–Reported impact to households reporting that they did not get enough of a type of
resource, Tatitlek, 2014. .......................................................................................................1603-23.–Reasons for less household uses of resources compared to recent years, Tatitlek, 2014. .....1623-24.–Reasons for more household uses of resources compared to recent years, Tatitlek, 2014. ...164
LIST OF TABLES, CONTINUED

viii
Table 3-25.–Resources that households reported needing, Tatitlek, 2014. ................................................1653-26.–Estimated per capita harvests in pounds usable weight by resource category, Tatitlek,
1987, 1988, 1989, 1990, 1991, 1993, 1997, 2003, and 2014. ..............................................1683-27.–Comparison of harvest composition by resource category, Tatitlek, 1987, 1988, 1989,
1990, 1991, 1993, 1997, 2003, and 2014. ............................................................................1683-28.–Household assessments of the safety of eating Pacific herring, harbor seals, chitons,
and clams harvested in traditional locations, Tatitlek, 2014. ...............................................1713-29.–Reasons why Pacific herring, harbor seals, chitons, and clams are not safe to eat,
Tatitlek, 2014. ......................................................................................................................1713-30.–Household assessments of the recovery of subsistence resources since the oil spill,
Tatitlek, 2014. ......................................................................................................................1723-31.–Household assessments of what should be done to help with the recovery of subsistence
resources, Tatitlek, 2014. .....................................................................................................1733-32.–Household assessments of change in resource availability compared to 10 years ago,
Tatitlek, 2014. ......................................................................................................................1743-33.–Reasons for less resource availability compared to 10 years ago, Tatitlek, 2014. ................1753-34.–Reasons for more resource availability compared to 10 years ago, Tatitlek, 2014. ..............1763-35.–Household assessments of whether young adults learn enough subsistence skills,
Tatitlek, 2014. ......................................................................................................................1783-36.–Reasons why young adults are not learning enough subsistence skills, Tatitlek, 2014. ........1793-37.–Ways that young adults are learning subsistence skills, Tatitlek, 2014. ................................1803-38.–Household assessments of change in elders’ influence in the last 10 years, Tatitlek,
2014......................................................................................................................................1803-39.–Reasons for decreased influence of elders in the last 10 years, Tatitlek, 2014. .....................1813-40.–Household assessments of the oil spill’s effect on the traditional way of life, Tatitlek,
2014......................................................................................................................................1833-41.–Household assessments of the recovery of the traditional way of life since the oil spill,
Tatitlek, 2014. ......................................................................................................................1833-42.–Household assessments for ways to help the recovery of the traditional way of life,
Tatitlek, 2014. ......................................................................................................................1844-1.–Population estimates, Cordova, 2010 and 2014. .....................................................................1884-2.–Sample and demographic characteristics, Cordova, 2014. ......................................................1904-3.–Population profile, Cordova, 2014. ..........................................................................................1914-4.–Birthplaces of household heads, Cordova, 2014. ....................................................................192
LIST OF TABLES, CONTINUED

ix
Table 4-5.–Birthplaces of population, Cordova, 2014. ..............................................................................1924-6.–Estimated earned and other income, Cordova, 2014. ..............................................................1944-7.–Comparison of median income estimates, Cordova, 2014. .....................................................1954-8.–Employment by industry, Cordova, 2014. ...............................................................................1964-9.–Employment characteristics, Cordova, 2014. ..........................................................................1984-10.–Reported job schedules, Cordova, 2014. ...............................................................................1994-11.–Individual participation in subsistence harvesting and processing activities, Cordova,
2014. ....................................................................................................................................2034-12.–Resource harvest and use characteristics, Cordova, 2014. ....................................................2064-13.–Estimated uses and harvests of fish, game, and vegetation resources, Cordova, 2014. ........2074-14.–Top ranked resources used by households, Cordova, 2014. ..................................................2164-15.–Estimated percentages of salmon harvested by gear type, resource, and total salmon
harvest, Cordova, 2014. .......................................................................................................2214-16.–Estimated percentages of nonsalmon fish harvested by gear type, resource, and total
nonsalmon fish harvest, Cordova, 2014. ..............................................................................2274-17.–Estimated large land mammal harvests by month and sex, Cordova, 2014. .........................2344-18.–Estimated small land mammal/furbearer harvests by month, Cordova, 2014. ......................2374-19.–Estimated bird harvests by season, Cordova, 2014. ..............................................................2414-20.–Use of firewood for home heating in sampled households, Cordova, 2014. .........................2474-21.–Changes in household uses of resources compared to recent years, Cordova, 2014. ............2504-22.–Reasons for less household uses of resources compared to recent years, Cordova,
2014......................................................................................................................................2534-23.–Reasons for more household uses of resources compared to recent years, Cordova,
2014......................................................................................................................................2554-24.–Reported impact to households reporting that they did not get enough of a type of
resource, Cordova, 2014. .....................................................................................................2564-25.–Resources that households reported needing, Cordova, 2014. ..............................................2574-26.–Estimated per capita harvests in pounds usable weight by resource category, Cordova,
1985, 1988, 1991, 1992, 1993, 1997, 2003, and 2014. ........................................................2634-27.–Comparison of harvest composition by resource category, Cordova, 1985, 1988, 1991,
1992, 1993, 1997, 2003, and 2014. ......................................................................................2654-28.–Household assessments of the safety of eating Pacific herring, harbor seals, chitons,
and clams harvested in traditional locations, Cordova, 2014. .............................................268
LIST OF TABLES, CONTINUED
x
Table 4-29.–Reasons why Pacific herring, harbor seals, chitons, and clams are not safe to eat,
Cordova, 2014. .....................................................................................................................2684-30.–Household assessments of the recovery of subsistence resources since the oil spill,
Cordova, 2014. .....................................................................................................................2704-31.–Household assessments of what should be done to help with the recovery of subsistence
resources, Cordova, 2014. ....................................................................................................2714-32.–Household assessments of change in resource availability compared to 10 years ago,
Cordova, 2014. .....................................................................................................................2724-33.–Reasons for less resource availability compared to 10 years ago, Cordova, 2014. ...............2734-34.–Reasons for more resource availability compared to 10 years ago, Cordova, 2014. .............2754-35.–Household assessments of whether young adults learn enough subsistence skills,
Cordova, 2014. .....................................................................................................................2764-36.–Ways that young adults are learning subsistence skills, Cordova, 2014. ..............................2764-37.–Reasons why young adults are not learning enough subsistence skills, Cordova, 2014. ......2774-38.–Household assessments of change in elders’ influence in the last 10 years, Cordova,
2014......................................................................................................................................2784-39.–Reasons for decreased influence of elders in the last 10 years, Cordova, 2014. ...................2784-40.–Reasons for increased influence of elders in the last 10 years, Cordova, 2014. ....................2794-41.–Household assessments of the oil spill’s effect on the traditional way of life, Cordova,
2014......................................................................................................................................2814-42.–Household assessments of the recovery of the traditional way of life since the oil spill,
Cordova, 2014. .....................................................................................................................2814-43.–Household assessments for ways to help the recovery of the traditional way of life,
Cordova, 2014. .....................................................................................................................2825-1.–Status of injured resources and services, 2014. .......................................................................3065-2.–Assessments of less resource availability to harvest, by percentage of respondents, study
communities, 2003 and 2014. ..............................................................................................309
LIST OF TABLES, CONTINUED
xi
Figure1-1.–Map of study communities, 2014. ...............................................................................................32-1.–Alaska Native and overall population estimates, Chenega Bay, 2010 and 2014. ......................202-2.–Historical population estimates, Chenega Bay, 1950–2014. .....................................................212-3.–Population profile, Chenega Bay, 2014. ....................................................................................232-4.–Top income sources, Chenega Bay, 2014. .................................................................................272-5.–Responses to questions about food insecure conditions, Chenega Bay, 2014. ..........................302-6.–Comparison of food security categories, Chenega Bay, Alaska, and United States, 2014. .......312-7.–Mean number of food insecure conditions by month and by household food security
category, Chenega Bay, 2014. ................................................................................................322-8.–Comparison of months when food did not last, Chenega Bay, 2014. ........................................322-9.–Percentages of households using, attempting to harvest, and harvesting wild resources,
by resource category, Chenega Bay, 2014. ............................................................................352-10.–Composition of harvest by resource category in pounds usable weight, Chenega Bay,
2014........................................................................................................................................432-11.–Wild resource search and harvest areas, Chenega Bay, 2014. .................................................442-12.–Top species harvested by percentage of total harvest in pounds usable weight, Chenega
Bay, 2014. ..............................................................................................................................462-13.–Composition of salmon harvest in pounds usable weight, Chenega Bay, 2014. .....................472-14.–Fishing and harvest locations of chum, coho, Chinook, pink, and sockeye salmon,
Chenega Bay, 2014. ...............................................................................................................492-15.–Composition of nonsalmon fish harvest in pounds usable weight, Chenega Bay, 2014. ........512-16.–Fishing and harvest locations of all nonsalmon fish resources, Chenega Bay, 2014. .............582-17.–Composition of large land mammal harvest in pounds usable weight, Chenega Bay, 2
014..........................................................................................................................................592-18.–Hunting locations of black bear and deer, Chenega Bay, 2014. ..............................................612-19.–Composition of small land mammal/furbearer harvest by individual animals harvested,
Chenega Bay, 2014. ...............................................................................................................622-20.–Hunting and trapping locations of small land mammals/furbearers, Chenega Bay, 2014. ......642-21.–Hunting locations of harbor seals and sea otters, Chenega Bay, 2014. ...................................662-22.–Composition of bird and bird egg harvest in pounds usable weight, Chenega Bay, 2014. .....672-23.–Hunting and harvest locations of bird eggs, migratory waterfowl, and grouse, Chenega
Bay, 2014. ..............................................................................................................................692-24.–Composition of marine invertebrates harvest in pounds usable weight, Chenega Bay,
2014........................................................................................................................................70
LIST OF FIGURES

xii
Figure2-25.–Fishing and harvest locations of marine invertebrates, Chenega Bay, 2014. ..........................712-26.–Composition of vegetation harvest by type and pounds usable weight, Chenega Bay,
2014........................................................................................................................................722-27.–Gathering and harvest locations of berries and plants, greens, and mushrooms,
Chenega Bay, 2014. ...............................................................................................................742-28.–Changes in household uses of resources compared to recent years, Chenega Bay,
2014........................................................................................................................................762-29.–Percentage of sampled households reporting whether they had enough resources, by
resource category, Chenega Bay, 2014. .................................................................................772-30.–Estimated per capita harvests in pounds usable weight, Chenega Bay, 1984, 1985, 1989,
1990, 1991, 1992, 1993, 1997, 2003, and 2014. ....................................................................842-31.–Estimated per capita harvests in pounds usable weight by resource category, Chenega
Bay, 1984, 1985, 1989, 1990, 1991, 1992, 1997, 2003, and 2014. ........................................863-1.–Alaska Native and overall population estimates, Tatitlek, 2010 and 2014. .............................1063-2.–Historical population estimates, Tatitlek, 1950–2014. ............................................................1063-3.–Population profile, Tatitlek, 2014. ...........................................................................................1083-4.–Top income sources, Tatitlek, 2014. ........................................................................................1133-5.–Responses to questions about food insecure conditions, Tatitlek, 2014. .................................1163-6.–Comparison of food security categories, Tatitlek, Alaska, and United States, 2014. ..............1173-7.–Percentages of households using, attempting to harvest, and harvesting wild resources,
by resource category, Tatitlek, 2014. ...................................................................................1193-8.–Composition of harvest by resource category in pounds usable weight, Tatitlek, 2014. ........1283-9.–Wild resource search and harvest areas, Tatitlek, 2014. ..........................................................1293-10.–Top species harvested by percentage of total harvest in pounds usable weight, Tatitlek,
2014......................................................................................................................................1313-11.–Composition of salmon harvest in pounds usable weight, Tatitlek, 2014. ............................1323-12.–Fishing and harvest locations of chum, coho, Chinook, pink, and sockeye salmon,
Tatitlek, 2014. ......................................................................................................................1353-13.–Composition of nonsalmon fish harvest in pounds usable weight, Tatitlek, 2014. ...............1363-14.–Fishing and harvest locations of all nonsalmon fish resources, Tatitlek, 2014. .....................1423-15.–Hunting locations of deer, Tatitlek, 2014...............................................................................1443-16.–Composition of marine mammal harvest in pounds usable weight, Tatitlek, 2014. ..............1463-17.–Hunting and harvest locations of marine mammals, Tatitlek, 2014. .....................................1483-18.–Composition of bird and bird egg harvest in pounds usable weight, Tatitlek, 2014. ............149
LIST OF FIGURES, CONTINUED
xiii
LIST OF FIGURES, CONTINUEDFigure3-19.–Hunting and harvest locations of bird eggs, migratory waterfowl, and grouse, Tatitlek,
2014......................................................................................................................................1513-20.–Composition of marine invertebrates harvest in pounds usable weight, Tatitlek, 2014. .......1523-21.–Fishing and harvest locations of marine invertebrates, Tatitlek, 2014. .................................1533-22.–Composition of vegetation harvest by type and pounds usable weight, Tatitlek, 2014. ........1543-23.–Gathering and harvest locations of berries, plants, and greens, Tatitlek, 2014. ....................1563-24.–Changes in household uses of resources compared to recent years, Tatitlek, 2014. .............1583-25.–Percentage of sampled households reporting whether they had enough resources,
by resource category, Tatitlek, 2014. ...................................................................................1593-26.–Estimated per capita harvests in pounds usable weight, Tatitlek, 1987, 1988, 1989,
1990, 1991, 1993, 1997, 2003, and 2014. ............................................................................1673-27.–Estimated per capita harvests in pounds usable weight by resource category, Tatitlek,
1987, 1988, 1989, 1990, 1991, 1993, 1997, 2003, and 2014. ..............................................1694-1.–Alaska Native and overall population estimates, Cordova, 2010 and 2014. ...........................1884-2.–Historical population estimates, Cordova, 1950–2014. ...........................................................1894-3.–Population profile, Cordova, 2014. ..........................................................................................1914-4.–Top income sources, Cordova, 2014. ......................................................................................1934-5.–Responses to questions about food insecure conditions, Cordova, 2014. ...............................2004-6.–Comparison of food security categories, Cordova, Alaska, and United States, 2014. ............2014-7.–Mean number of food insecure conditions by month and by household food security
category, Cordova, 2014. .....................................................................................................2024-8.–Comparison of months when food did not last, Cordova, 2014. .............................................2024-9.–Percentages of households using, attempting to harvest, and harvesting wild resources,
by resource category, Cordova, 2014. ..................................................................................2054-10.–Composition of harvest by resource category in pounds usable weight, Cordova, 2014. .....2144-11.–Wild resource search and harvest areas, Cordova, 2014. ......................................................2154-12.–Top species harvested by percentage of total harvest in pounds usable weight,
Cordova, 2014. .....................................................................................................................2174-13.–Composition of salmon harvest in pounds usable weight, Cordova, 2014. ...........................2184-14.–Fishing and harvest locations of chum, coho, Chinook, pink, and sockeye salmon,
Cordova, 2014. .....................................................................................................................2234-15.–Composition of nonsalmon fish harvest in pounds usable weight, Cordova, 2014. ..............2254-16.–Fishing and harvest locations of all nonsalmon fish resources, Cordova, 2014. ...................2324-17.–Composition of large land mammal harvest in pounds usable weight, Cordova, 2014. .......233

xiv
Figure4-18.–Hunting locations of black bear, Dall sheep, deer, moose, and mountain goat, Cordova,
2014......................................................................................................................................2354-19.–Composition of small land mammal/furbearer harvest by individual animals harvested,
Cordova, 2014. .....................................................................................................................2364-20.–Hunting and trapping locations of small land mammals/furbearers, Cordova, 2014. ...........2384-21.–Composition of bird and bird egg harvest in pounds usable weight, Cordova, 2014. ...........2404-22.–Hunting and harvest locations of bird eggs, migratory waterfowl, and ptarmigan and
grouse, Cordova, 2014. ........................................................................................................2424-23.–Composition of marine invertebrates harvest in pounds usable weight, Cordova,
2014......................................................................................................................................2434-24.–Fishing and harvest locations of marine invertebrates, Cordova, 2014. ................................2454-25.–Composition of vegetation harvest by type and pounds usable weight, Cordova,
2014......................................................................................................................................2464-26.–Gathering and harvest locations of berries and plants, greens, and mushrooms,
Cordova, 2014. .....................................................................................................................2484-27.–Changes in household uses of resources compared to recent years, Cordova, 2014. ............2514-28.–Percentage of sampled households reporting whether they had enough resources,
by resource category, Cordova, 2014. ..................................................................................2524-29.–Estimated per capita harvests in pounds usable weight, Cordova, 1985, 1988, 1991,
1992, 1993, 1997, 2003, and 2014. ......................................................................................2624-30.–Estimated per capita harvests in pounds usable weight by resource category, Cordova,
1985, 1988, 1991, 1992, 1993, 1997, 2003, and 2014. ........................................................2645-1.–Change of population from 2003 to 2014, study communities. ..............................................2865-2.–Change of population from 1980–1990, 1990–2000, 2000–2010, and 2010–2015,
study communities. .............................................................................................................2875-3.–Percentage of population that is male, study communities, 2003 and 2014. ...........................2885-4.–Median age of population, study communities, 2003 and 2014. .............................................2895-5.–Percentage of population participating in harvest and processing activities,
study communities, 2003 and 2014. ....................................................................................2905-6.–Comparisons of estimated 2014 per capita harvest with previous estimated per capita
harvests, study communities. ..............................................................................................2925-7.–Estimated per capita harvests in pounds usable weight, study communities,
pre-spill average, 1989–1993, 1997, 2003, and 2014. .........................................................293
LIST OF FIGURES, CONTINUED

xv
Figure5-8.–Average number of resources used per household, study communities, pre-spill average,
1989–1993, 1997, 2003, and 2014. ......................................................................................2945-9.–Number of resources used by 50% or more households, study communities, 2003 and
2014......................................................................................................................................2955-10.–Comparison of use of the 25 resources used by the most households in 2003 and use
of the same resources in 2014. Nanwalek. ...........................................................................2965-11.–Comparison of use of the 25 resources used by the most households in 2003 and use
of the same resources in 2014. Tatitlek. ...............................................................................2975-12.–Comparison of use of the 25 resources used by the most households in 2003 and use
of the same resources in 2014. Port Graham. ......................................................................2985-13.–Comparison of use of the 25 resources used by the most households in 2003 and use
of the same resources in 2014. Chenega Bay. ......................................................................2995-14.–Comparison of use of the 25 resources used by the most households in 2003 and use
of the same resources in 2014. Cordova. .............................................................................3005-15.–Percentage of households receiving resources and giving away resources, study
communities, 2003 and 2014. ..............................................................................................3015-16.–Average number of resources received and given away per household, study
communities, 2003 and 2014. ..............................................................................................3035-17.–Assessments of uses of all resources compared to recent years, study communities,
2014......................................................................................................................................3045-18.–Reasons for less use of resources overall, and less use of any resource category,
study communities combined, 2014. ...................................................................................3055-19.–Assessments of less resource availability to harvest, by percentage of respondents,
study communities, 2014. ....................................................................................................3085-20.–Assessments of less harbor seal availability to harvest, by percentage of respondents,
study communities, 2003 and 2014. ....................................................................................3105-21.–Reasons for less resource availability to harvest, study communities combined,
2014......................................................................................................................................3115-22.–Percentage of households that reported resources have not recovered since the oil spill,
study communities, 1997, 2003, and 2014. .........................................................................3125-23.–Suggestions for helping the recovery of subsistence resources, study communities,
combined, 2003 and 2014. ...................................................................................................3135-24.–Assessments of safety to eat clams, study communities, 2014. ............................................3145-25.–Assessments of safety to eat chitons, study communities, 2014. ..........................................315
LIST OF FIGURES, CONTINUED
xvi
Figure5-26.–Assessments of safety to eat Pacific herring, study communities, 2014. ..............................3165-27.–Assessments of safety to eat harbor seals, study communities, 2014. ...................................3175-28.–Households that reported clams are safe to eat, study communities, 1991–1993,
1997, 2003, and 2014. ..........................................................................................................3185-29.–Households that reported harbor seals are safe to eat, study communities, 1991–1993,
1997, 2003, and 2014. ..........................................................................................................3195-30.–Households that reported Pacific herring are safe to eat, study communities, 2003 and
2014......................................................................................................................................3205-31.–Households that reported chitons are safe to eat, study communities, 2003 and 2014. ........3215-32.–Percentage of households that reported resource was not safe to eat, and the percentage
that attributed lack of food safety to oil spill contamination, study communities combined, 2014. ...................................................................................................................322
5-33.–Households that reported young adults are learning enough subsistence skills, study communities, 1991, 1997, 2003, and 2014. ...............................................................323
5-34.–Reasons why young adults are not learning enough subsistence skills, study communities combined, 2003 and 2014. .............................................................................324
5-35.–Assessments of the influence of elders, study communities, 2014. .......................................3265-36.–Households that reported influence of elders decreased, study communities, 2003 and
2014......................................................................................................................................3275-37.–Reasons why the influence of elders decreased, study communities combined, 2003 and
2014......................................................................................................................................3285-38.–Assessments that the traditional way of life was affected by the oil spill, study
communities, 1997, 2003, and 2014. ...................................................................................3295-39.–Assessments that the traditional way of life has not recovered from the effects of the
oil spill, study communities, 1997, 2003, and 2014. ...........................................................3305-40.–Suggestions for helping the recovery of the traditional way of life, study communities
combined, 2003 and 2014. ...................................................................................................331
LIST OF FIGURES, CONTINUED
LIST OF PLATES
PlatesPlate 4-1.–Channels and islands in the Copper River and Bering River districts. ..........................224

xvii
LIST OF APPENDICESAppendix
A–Survey Instrument (Tatitlek) ...................................................................................................340
B–Conversion Factors ...................................................................................................................375
C–Project Summary ......................................................................................................................396

xviii
EXECUTIVE SUMMARY
The goal of this project was to collect, analyze, and report information about subsistence uses of fish and wildlife in the 3 Exxon Valdez oil spill area communities of Cordova, Tatitlek, and Chenega Bay in 2014 that is comparable with previous research results and that can be applied to evaluate the status of subsistence uses in light of the Exxon Valdez Oil Spill Trustee Council’s (EVOSTC) recovery objective. The 2014 update of the Injured Resources and Services List, adopted by the EVOSTC as part of the 1994 Restoration Plan, lists subsistence as an injured natural resource service that is “recovering.” The plan defines the following restoration objective for subsistence:
Subsistence will have recovered when injured resources used for subsistence are healthy and productive and exist at pre-spill levels. In addition, there is recognition that people must be confident that the resources are safe to eat and that the cultural values provided by gathering, preparing, and sharing food need to be reintegrated into community life.
Evaluating progress toward the EVOSTC’s recovery objective for subsistence entails addressing 3 questions:
1. Are resources used for subsistence purposes healthy, and are their populations at pre-spill levels?
2. Are people confident that resources are safe to eat?
3. Have the cultural values associated with subsistence uses been reintegrated into community life?Assessing the recovery of subsistence uses also includes the difficult task of separating the potential lingering effects of the oil spill from other concurrent environmental, economic, social, and cultural factors. Study objectives included the following for a census survey of households in Chenega Bay and Tatitlek, and a random sample of households in Cordova, supplemented by key respondent interviews in each study community.
1. Provide estimates of harvests of fish and wildlife resources for home use and participation rates in 2014;
2. Provide supporting demographic and employment data;
3. Assess harvests and uses in comparison to other years;
4. Provide maps of harvest areas and evaluation of changes in these areas;
5. Evaluate food safety and resource availability (to address questions 1 and 2, above);
6. Provide information on qualitative aspects of subsistence uses (e.g., involvement of children, role of elders that assist in evaluating integration of subsistence back into community life [to address question 3, above]); and
7. Obtain a community review and discussion of study findings.Review and approval of the research plan was obtained for each study community. Sample achievement was 71% of year-round households in Chenega Bay and 78% in Tatitlek, and a random sample of 19% of households in Cordova. Data review meetings took place in each community. Study findings for Nanwalek and Port Graham, 2 lower Cook Inlet communities in the spill area for which research was funded from another source, were included in the discussion to broaden comparisons across study years and subareas. The report includes chapters with study findings for Chenega Bay, Tatitlek, and Cordova. The chapters include descriptions of harvests and uses in 2014 compared to other years, and discussions of factors shaping patterns of subsistence uses, including resource conditions, food safety, the role of elders, the teaching of youth, and the status of the traditional way of life. The final chapter summarizes study findings in light of the EVOSTC’s recovery objective.
xix
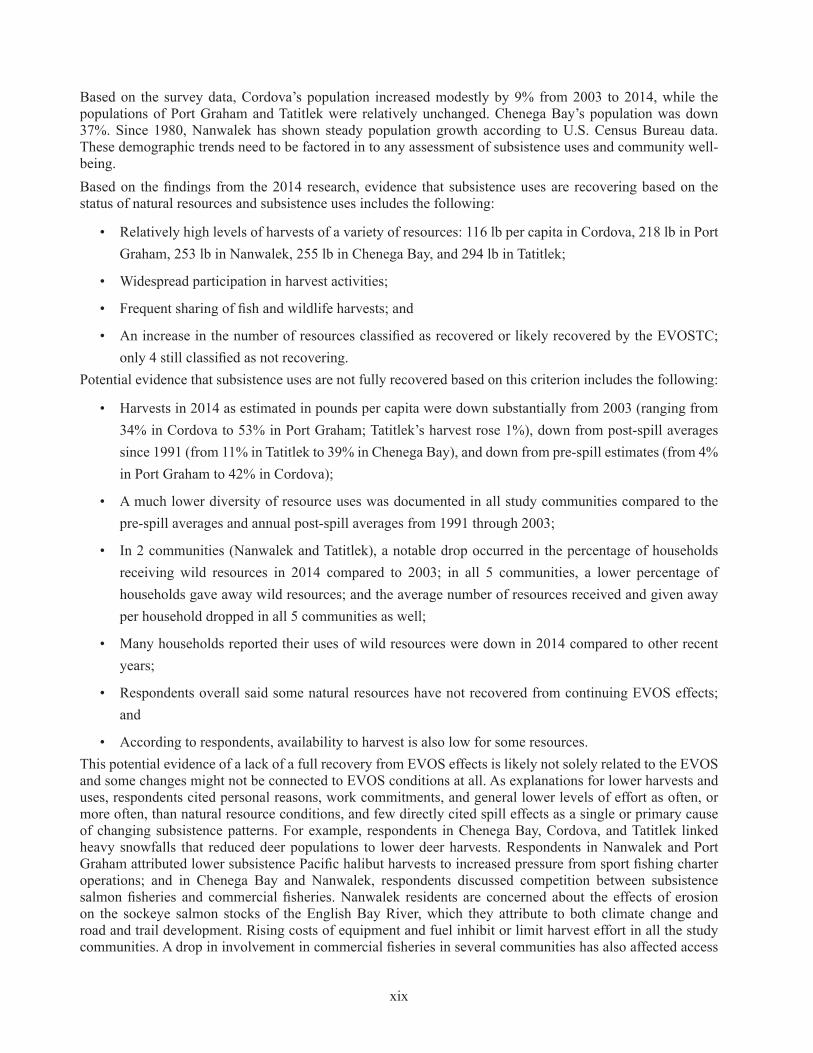
Based on the survey data, Cordova’s population increased modestly by 9% from 2003 to 2014, while the populations of Port Graham and Tatitlek were relatively unchanged. Chenega Bay’s population was down 37%. Since 1980, Nanwalek has shown steady population growth according to U.S. Census Bureau data. These demographic trends need to be factored in to any assessment of subsistence uses and community well-being.Based on the findings from the 2014 research, evidence that subsistence uses are recovering based on the status of natural resources and subsistence uses includes the following:
• Relatively high levels of harvests of a variety of resources: 116 lb per capita in Cordova, 218 lb in Port Graham, 253 lb in Nanwalek, 255 lb in Chenega Bay, and 294 lb in Tatitlek;
• Widespread participation in harvest activities;
• Frequent sharing of fish and wildlife harvests; and
• An increase in the number of resources classified as recovered or likely recovered by the EVOSTC; only 4 still classified as not recovering.
Potential evidence that subsistence uses are not fully recovered based on this criterion includes the following:
• Harvests in 2014 as estimated in pounds per capita were down substantially from 2003 (ranging from 34% in Cordova to 53% in Port Graham; Tatitlek’s harvest rose 1%), down from post-spill averages since 1991 (from 11% in Tatitlek to 39% in Chenega Bay), and down from pre-spill estimates (from 4% in Port Graham to 42% in Cordova);
• A much lower diversity of resource uses was documented in all study communities compared to the pre-spill averages and annual post-spill averages from 1991 through 2003;
• In 2 communities (Nanwalek and Tatitlek), a notable drop occurred in the percentage of households receiving wild resources in 2014 compared to 2003; in all 5 communities, a lower percentage of households gave away wild resources; and the average number of resources received and given away per household dropped in all 5 communities as well;
• Many households reported their uses of wild resources were down in 2014 compared to other recent years;
• Respondents overall said some natural resources have not recovered from continuing EVOS effects; and
• According to respondents, availability to harvest is also low for some resources.This potential evidence of a lack of a full recovery from EVOS effects is likely not solely related to the EVOS and some changes might not be connected to EVOS conditions at all. As explanations for lower harvests and uses, respondents cited personal reasons, work commitments, and general lower levels of effort as often, or more often, than natural resource conditions, and few directly cited spill effects as a single or primary cause of changing subsistence patterns. For example, respondents in Chenega Bay, Cordova, and Tatitlek linked heavy snowfalls that reduced deer populations to lower deer harvests. Respondents in Nanwalek and Port Graham attributed lower subsistence Pacific halibut harvests to increased pressure from sport fishing charter operations; and in Chenega Bay and Nanwalek, respondents discussed competition between subsistence salmon fisheries and commercial fisheries. Nanwalek residents are concerned about the effects of erosion on the sockeye salmon stocks of the English Bay River, which they attribute to both climate change and road and trail development. Rising costs of equipment and fuel inhibit or limit harvest effort in all the study communities. A drop in involvement in commercial fisheries in several communities has also affected access

xx
to harvest areas and equipment as well as a source of cash income linked to local resources. Respondents in Nanwalek and Port Graham discussed an overall decline in populations of marine invertebrates that they attributed to a variety of factors, including commercial overharvests, sea otter predation, local overharvests, water pollution, and warming water temperatures.In several communities, respondents linked lower and less diverse subsistence harvests and uses to a lack of interest and effort on the part of younger generations. These observations illustrate how changes initiated or exacerbated by the EVOS have in subsequent decades intertwined with other causes of change. Based on the findings from the 2014 survey, evidence that subsistence uses are recovering based on food safety issues includes the following:
• Most respondents expressed confidence in the safety of using subsistence foods, and this level of confidence has increased; and
• Few respondents pointed to EVOS contamination as a source of concern about food safety.Potential evidence that subsistence uses are not fully recovered based on this criterion includes the following:
• Small but notable portions of respondents expressed concerns about food safety, especially related to Pacific herring and clams;
• Some key respondents wondered if lingering EVOS-contamination concerns were not voiced due to a strong preference for eating traditional foods (such as clams); and
• EVOS contamination was commonly cited as a cause of food safety issues among those who did express a concern.
Also, community residents are aware of pockets of residual oil within their traditional use areas. Respondents also expressed broader concerns about potential food safety issues, such as radiation contamination on fish from the Fukushima Daiichi nuclear accident in Japan and the effects of warming ocean temperatures on bivalves. Based on the findings from 2014, evidence that subsistence uses are recovering based upon reintegration of cultural values connected to subsistence uses into community life includes the following:
• Majorities of respondents in some communities reporting youth are learning subsistence skills; and
• Most households received and gave away wild resources.Potential evidence that subsistence uses are not fully recovered based on this criterion includes the following:
• Many survey respondents stated that youth are not learning subsistence skills;
• Many respondents said elders’ influence continues to decline; and
• Few respondents said the traditional way of life has recovered.In summary, the study results point to the same conclusion as in 2003, in supporting the EVOSTC’s assessment that subsistence uses are “recovering” but not fully recovered. While most injured natural resources have recovered or are recovering from the conditions created by the EVOS, cultural recovery in the communities of the spill area is ongoing, and takes place within a broad array of other sociocultural and environmental factors.
The last overview of subsistence uses in EVOS area communities, pertaining to the 2003 study year, concluded that
Conditions in the natural, economic, and social environments have changed significantly for the residents of the area affects by the spill since 1989. Some of these changes are direct consequences of the oil spill, while the link for others is less certain. This study has shown

xxi
that despite these changes, subsistence uses of natural resources remain key to the health and well-being of these communities.
The same conclusion applies to the finding for 2014. Subsistence harvests remain an important source of food in the study communities, include a wide range of species, are frequently shared, and provide a context for expressing and sharing the skills and values intimately linked to centuries-old traditions and future cultural survival.However, the study also documented relatively low harvests compared to other post-spill years. Subsistence uses were also less diverse in 2014 than in any study year except for the first 2 years after the spill. Many respondents stated that youth are not learning subsistence skills, elders are not engaged in transmitting essential knowledge and values, many natural resource populations have declined or are difficult to access, and the traditional way of life has not recovered from the effects of the EVOS. Subsistence harvests vary from year to year for a variety of reasons. However, lower and less diverse harvests occurred in all 5 study communities in 2014 and were generally consistent with respondents’ evaluations. Respondents cited a range of explanations for changing subsistence uses. The oil spill initiated or contributed to a set of environmental, economic, and sociocultural conditions to which each study community must adapt. It is not possible nor necessary to completely factor out EVOS effects from this broader set of conditions. As the study for 2003 concluded, a return to pre-spill conditions is impossible for spill-area communities and is not the appropriate measure of recovery. A viable future for these communities will be based on meaningful involvement in natural resource management, opportunities in the cash and subsistence sectors of the local economies, and the transmission of skills and knowledge across generations.The report ends with suggestions for potential actions to include local communities in post-EVOS restoration efforts as well as strengthen communities for their future. These recommendations include support for cultural camps and other ways to engage elders with youth, programs to assist community residents to participate in fishing, hunting, and gathering activities, and long-term monitoring of natural resource populations as well as the effected human populations.
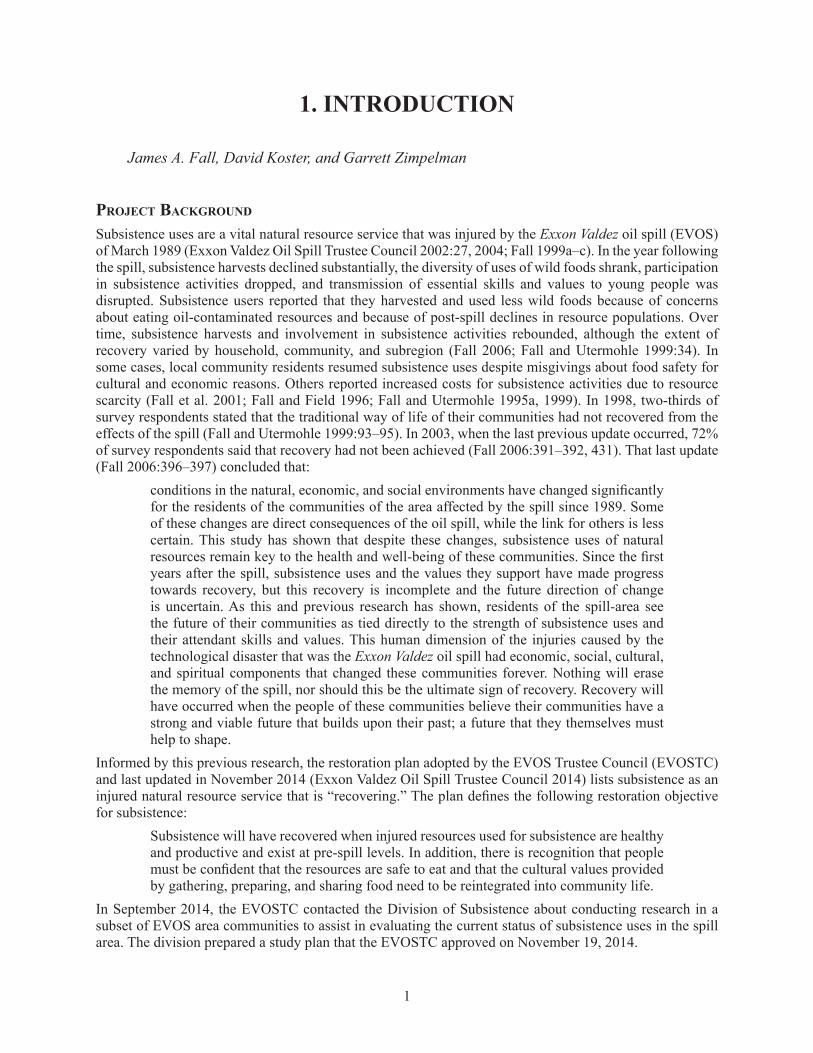
1. INTRODUCTION
James A. Fall, David Koster, and Garrett Zimpelman
Project Background
Subsistence uses are a vital natural resource service that was injured by the Exxon Valdez oil spill (EVOS) of March 1989 (Exxon Valdez Oil Spill Trustee Council 2002:27, 2004; Fall 1999a–c). In the year following the spill, subsistence harvests declined substantially, the diversity of uses of wild foods shrank, participation in subsistence activities dropped, and transmission of essential skills and values to young people was disrupted. Subsistence users reported that they harvested and used less wild foods because of concerns about eating oil-contaminated resources and because of post-spill declines in resource populations. Over time, subsistence harvests and involvement in subsistence activities rebounded, although the extent of recovery varied by household, community, and subregion (Fall 2006; Fall and Utermohle 1999:34). In some cases, local community residents resumed subsistence uses despite misgivings about food safety for cultural and economic reasons. Others reported increased costs for subsistence activities due to resource scarcity (Fall et al. 2001; Fall and Field 1996; Fall and Utermohle 1995a, 1999). In 1998, two-thirds of survey respondents stated that the traditional way of life of their communities had not recovered from the effects of the spill (Fall and Utermohle 1999:93–95). In 2003, when the last previous update occurred, 72% of survey respondents said that recovery had not been achieved (Fall 2006:391–392, 431). That last update (Fall 2006:396–397) concluded that:
conditions in the natural, economic, and social environments have changed significantly for the residents of the communities of the area affected by the spill since 1989. Some of these changes are direct consequences of the oil spill, while the link for others is less certain. This study has shown that despite these changes, subsistence uses of natural resources remain key to the health and well-being of these communities. Since the first years after the spill, subsistence uses and the values they support have made progress towards recovery, but this recovery is incomplete and the future direction of change is uncertain. As this and previous research has shown, residents of the spill-area see the future of their communities as tied directly to the strength of subsistence uses and their attendant skills and values. This human dimension of the injuries caused by the technological disaster that was the Exxon Valdez oil spill had economic, social, cultural, and spiritual components that changed these communities forever. Nothing will erase the memory of the spill, nor should this be the ultimate sign of recovery. Recovery will have occurred when the people of these communities believe their communities have a strong and viable future that builds upon their past; a future that they themselves must help to shape.
Informed by this previous research, the restoration plan adopted by the EVOS Trustee Council (EVOSTC) and last updated in November 2014 (Exxon Valdez Oil Spill Trustee Council 2014) lists subsistence as an injured natural resource service that is “recovering.” The plan defines the following restoration objective for subsistence:
Subsistence will have recovered when injured resources used for subsistence are healthy and productive and exist at pre-spill levels. In addition, there is recognition that people must be confident that the resources are safe to eat and that the cultural values provided by gathering, preparing, and sharing food need to be reintegrated into community life.
In September 2014, the EVOSTC contacted the Division of Subsistence about conducting research in a subset of EVOS area communities to assist in evaluating the current status of subsistence uses in the spill area. The division prepared a study plan that the EVOSTC approved on November 19, 2014.
1

The purpose of this project was to collect, analyze, and report information about current subsistence uses of fish and wildlife in 3 EVOS area communities that is comparable with previous research results and that can be applied to evaluate the status of subsistence uses in light of the EVOSTC recovery objective. The study communities were Chenega Bay (population 57 in 2014), Tatitlek (98), and Cordova (2,286), all of which are in Prince William Sound (Figure 1-1) (Alaska Department of Labor and Workforce Development 2015). In a separate study (not funded by the EVOSTC), surveys using the same instrument were conducted in the lower Cook Inlet communities of Nanwalek, Port Graham, and Seldovia. Principal data collection methods were a systematic household survey and key respondent interviews. Table 1-1 presents a list, including the Linnaean taxonomic names, of wild resources included in the survey to document harvests and uses by the study communities in 2014.
regulatory context
The 3 study communities are within the Prince William Sound fisheries management area. State and federal regulations provide subsistence fishing opportunities. Subsistence fishing for salmon, crab, and shrimp requires a permit. Residents of the 3 communities are also eligible for participation in the federally managed subsistence Pacific halibut fishery after obtaining a Subsistence Halibut Registration Certificate.State and federal regulations provide hunting opportunities under subsistence or general hunting regulations in Game Management Unit 6 for moose, mountain goat, deer, black bear, and small game. Study community residents are also eligible to participate in spring and summer subsistence hunting for migratory waterfowl and collection of eggs under the revised federal Migratory Bird Treaty Act. Alaska Native residents of the study communities may hunt marine mammals for subsistence uses under the provisions of the federal Marine Mammal Protection Act.
Study goalS and oBjectiveS
The purpose of the project was to collect, analyze, and report information about subsistence uses of fish and wildlife in 2014 in a subset of 3 EVOS area communities that is comparable with previous research results and that can be applied to evaluate the status of subsistence uses in light of the EVOSTC recovery objective. Evaluating progress toward the EVOSTC’s recovery objective for subsistence entails addressing 3 questions:
1. Are resources used for subsistence purposes healthy, and are their populations at pre-spill levels?
2. Are people confident that resources are safe to eat?
3. Have the cultural values associated with subsistence uses been reintegrated into community life?
Also, although these 3 questions frame consideration of the status of subsistence uses in oil spill communities, evaluation of the post-spill recovery of subsistence uses must also be informed by other factors that are deemed important by local community residents, such as: harvest levels; the diversity of species used; and changing environmental, economic, demographic, political, and sociocultural conditions that have shaped subsistence hunting and fishing during the last 15 years.Further, assessing the recovery of subsistence uses requires the difficult task of separating the lingering effects of the oil spill from other factors that are concurrently occurring—what has been called “the total environment of change” (Moerlein and Carothers 2012). These factors include environmental, economic, social, and cultural changes resulting from other processes that are active in the communities. In some cases, such as global climate change, these other conditions have no link to the oil spill. In others, such as the changing role of commercial fishing, spill and non-spill factors may be intertwined. In still others, the role of the oil spill in changing fundamental environmental or social conditions is a point of contention. The link between paralytic shellfish poisoning (PSP) and the oil spill is an example; another may be the perception
2

Figure 1-1.–Map of study communities, 2014.
Cordova
Tatitlek
Chenega Bay
Legend
Study communities
Roads
0 1,600800
Miles
EVOS AREA STUDY COMMUNITIES, 2015
3

Table 1-1.–Species used by study communities, 2014.
Resource Scientific nameChum salmon Oncorhynchus ketaCoho salmon Oncorhynchus kisutchChinook salmon Oncorhynchus tshawytschaPink salmon Oncorhynchus gorbuschaSockeye salmon Oncorhynchus nerkaLandlocked salmon Oncorhynchus spp.Unknown salmon Oncorhynchus spp.Pacific herring Clupea pallasiPacific herring roe/unspecified Clupea pallasiPacific herring sac roe Clupea pallasiPacific herring spawn on kelp Clupea pallasiEulachon (hooligan, candlefish) Thaleichthys pacificusUnknown smeltSea bassPacific (gray) cod Gadus macrocephalusPacific tomcod Microgadus proximusWalleye pollock (whiting) Theragra chalcogrammaEelStarry flounder Platichthys stellatusUnknown flounderLingcod Ophiodon elongatusUnknown greenlingPacific halibut Hippoglossus stenolepisBlack rockfish Sebastes melanopsRed rockfishYelloweye rockfish Sebastes ruberrimusQuillback rockfish Sebastes maligerDusky rockfish Sebastes ciliatusCopper rockfish Sebastes caurinusTiger rockfish Sebastes nigrocinctusChina rockfish Sebastes nebulosusNorthern rockfish Sebastes polyspinisBoccaccio rockfish Sebastes paucispinisRougheye rockfish Sebastes aleutianusUnknown rockfishSablefish (black cod) Anoplopoma fimbriaUnknown Irish lordUnknown sculpinUnknown sharkSkatesUnknown soleWolffish Anarhichas spp.Dolly Varden Salvelinus malmaLake trout Salvelinus namaycushArctic grayling Thymallus arcticusNorthern pike Esox luciusUnknown sturgeon Acipenser spp.Cutthroat trout Oncorhynchus clarkii
-continued-
4
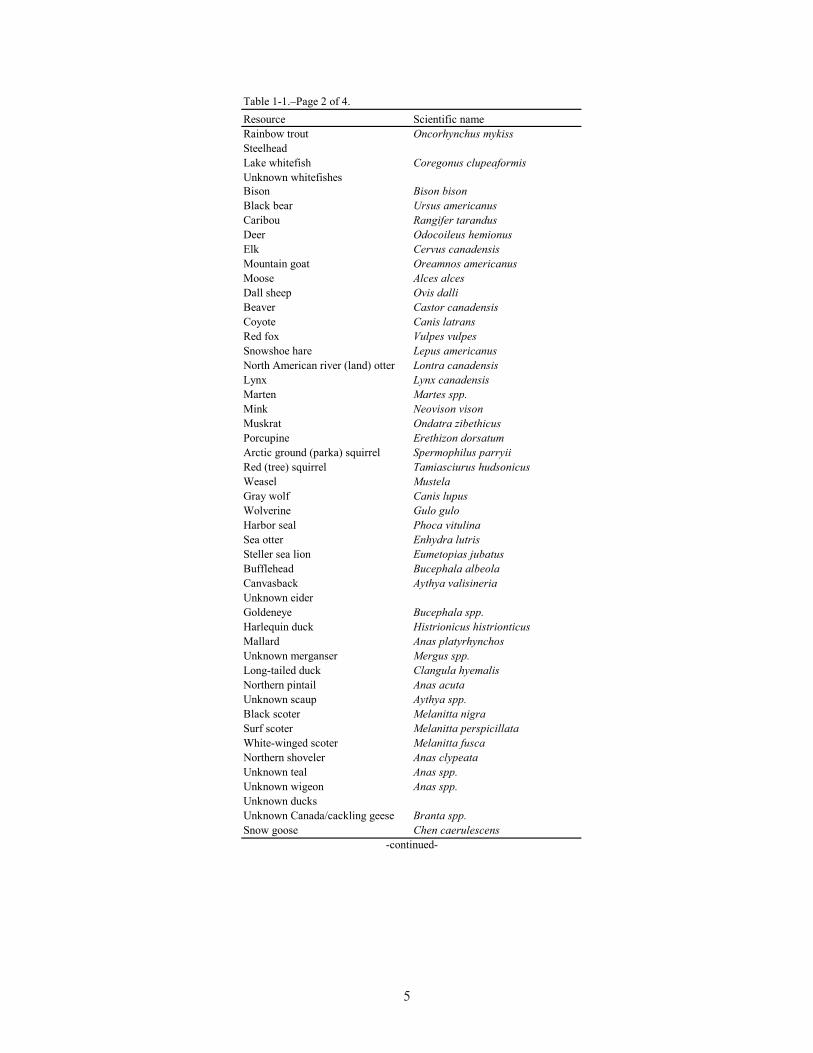
Resource Scientific nameRainbow trout Oncorhynchus mykissSteelheadLake whitefish Coregonus clupeaformisUnknown whitefishesBison Bison bisonBlack bear Ursus americanusCaribou Rangifer tarandusDeer Odocoileus hemionusElk Cervus canadensisMountain goat Oreamnos americanusMoose Alces alcesDall sheep Ovis dalliBeaver Castor canadensisCoyote Canis latransRed fox Vulpes vulpesSnowshoe hare Lepus americanusNorth American river (land) otter Lontra canadensisLynx Lynx canadensisMarten Martes spp.Mink Neovison visonMuskrat Ondatra zibethicusPorcupine Erethizon dorsatumArctic ground (parka) squirrel Spermophilus parryiiRed (tree) squirrel Tamiasciurus hudsonicusWeasel MustelaGray wolf Canis lupusWolverine Gulo guloHarbor seal Phoca vitulinaSea otter Enhydra lutrisSteller sea lion Eumetopias jubatusBufflehead Bucephala albeolaCanvasback Aythya valisineriaUnknown eiderGoldeneye Bucephala spp.Harlequin duck Histrionicus histrionticusMallard Anas platyrhynchosUnknown merganser Mergus spp.Long-tailed duck Clangula hyemalisNorthern pintail Anas acutaUnknown scaup Aythya spp.Black scoter Melanitta nigraSurf scoter Melanitta perspicillataWhite-winged scoter Melanitta fuscaNorthern shoveler Anas clypeataUnknown teal Anas spp.Unknown wigeon Anas spp.Unknown ducksUnknown Canada/cackling geese Branta spp.Snow goose Chen caerulescens
-continued-
Table 1-1.–Page 2 of 4.
5
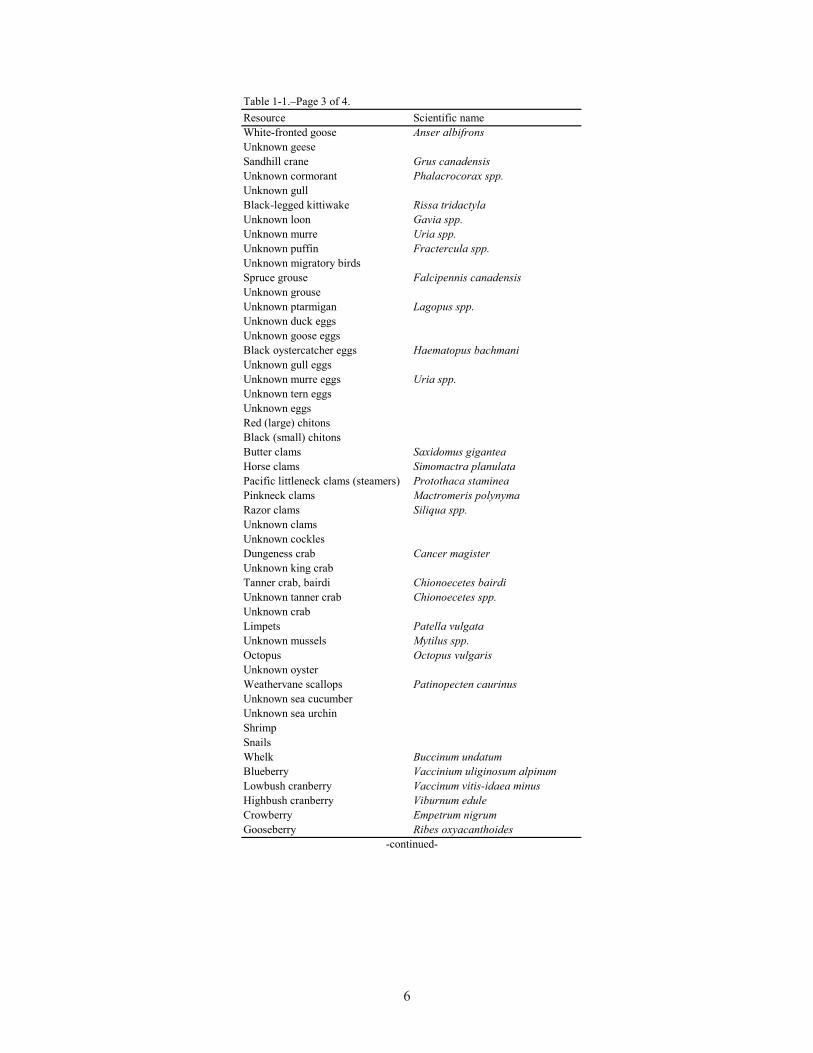
Resource Scientific nameWhite-fronted goose Anser albifronsUnknown geeseSandhill crane Grus canadensisUnknown cormorant Phalacrocorax spp.Unknown gullBlack-legged kittiwake Rissa tridactylaUnknown loon Gavia spp.Unknown murre Uria spp.Unknown puffin Fractercula spp.Unknown migratory birdsSpruce grouse Falcipennis canadensisUnknown grouseUnknown ptarmigan Lagopus spp.Unknown duck eggsUnknown goose eggsBlack oystercatcher eggs Haematopus bachmaniUnknown gull eggsUnknown murre eggs Uria spp.Unknown tern eggsUnknown eggsRed (large) chitonsBlack (small) chitonsButter clams Saxidomus giganteaHorse clams Simomactra planulataPacific littleneck clams (steamers) Protothaca stamineaPinkneck clams Mactromeris polynymaRazor clams Siliqua spp.Unknown clamsUnknown cocklesDungeness crab Cancer magisterUnknown king crabTanner crab, bairdi Chionoecetes bairdiUnknown tanner crab Chionoecetes spp.Unknown crabLimpets Patella vulgataUnknown mussels Mytilus spp.Octopus Octopus vulgarisUnknown oysterWeathervane scallops Patinopecten caurinusUnknown sea cucumberUnknown sea urchinShrimpSnailsWhelk Buccinum undatumBlueberry Vaccinium uliginosum alpinumLowbush cranberry Vaccinum vitis-idaea minusHighbush cranberry Viburnum eduleCrowberry Empetrum nigrumGooseberry Ribes oxyacanthoides
-continued-
Table 1-1.–Page 3 of 4.
6
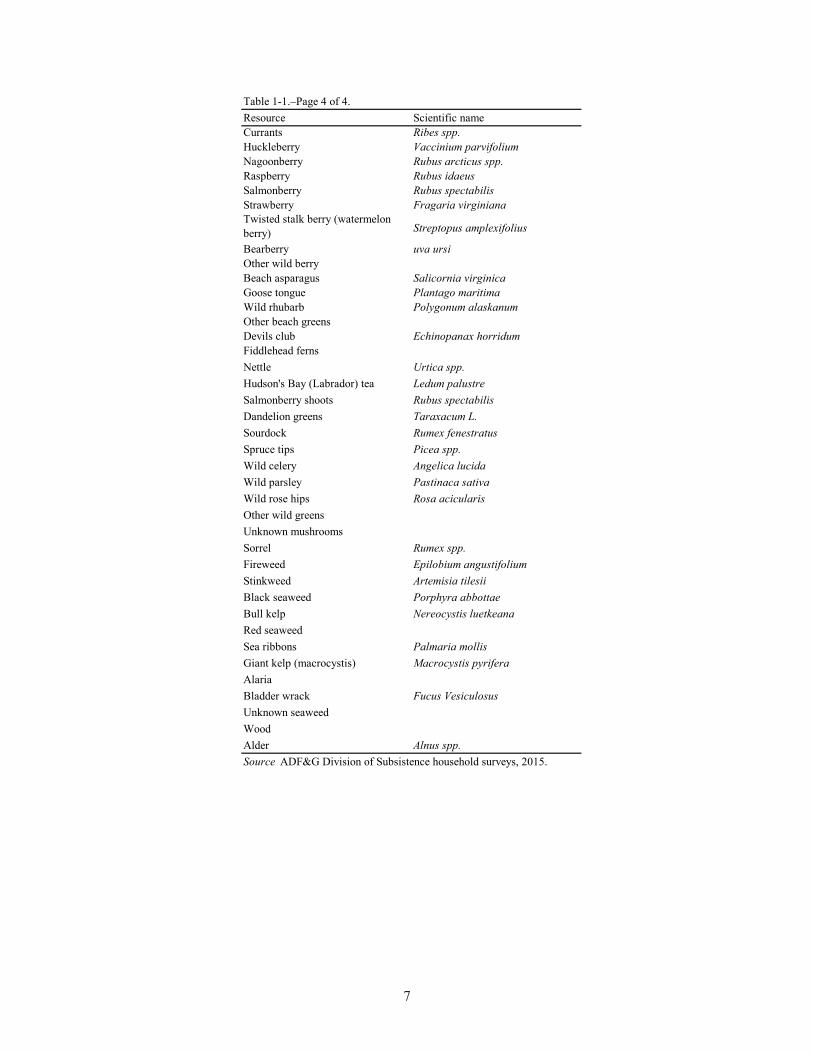
Resource Scientific nameCurrants Ribes spp.Huckleberry Vaccinium parvifoliumNagoonberry Rubus arcticus spp.Raspberry Rubus idaeusSalmonberry Rubus spectabilisStrawberry Fragaria virginianaTwisted stalk berry (watermelon berry) Streptopus amplexifolius
Bearberry uva ursiOther wild berryBeach asparagus Salicornia virginicaGoose tongue Plantago maritimaWild rhubarb Polygonum alaskanumOther beach greensDevils club Echinopanax horridumFiddlehead fernsNettle Urtica spp.Hudson's Bay (Labrador) tea Ledum palustreSalmonberry shoots Rubus spectabilisDandelion greens Taraxacum L.Sourdock Rumex fenestratusSpruce tips Picea spp.Wild celery Angelica lucidaWild parsley Pastinaca sativaWild rose hips Rosa acicularisOther wild greensUnknown mushroomsSorrel Rumex spp.Fireweed Epilobium angustifoliumStinkweed Artemisia tilesiiBlack seaweed Porphyra abbottaeBull kelp Nereocystis luetkeanaRed seaweedSea ribbons Palmaria mollisGiant kelp (macrocystis) Macrocystis pyriferaAlariaBladder wrack Fucus VesiculosusUnknown seaweedWoodAlder Alnus spp.Source ADF&G Division of Subsistence household surveys, 2015.
Table 1-1.–Page 4 of 4.
7

on the part of many survey respondents that young people no longer have an interest in subsistence hunting and fishing.To address this broad sociocultural, economic, and environmental context, study objectives included the following for a census survey of households in Chenega Bay and Tatitlek, and a random sample of 150 households in Cordova, supplemented by approximately 5 key respondent interviews in each study community.
1. Provide estimates of harvests of fish and wildlife resources for home use and participation rates in 2014;
2. Provide supporting demographic and employment data;
3. Assess harvests and uses in comparison to other years;
4. Provide maps of harvest areas and evaluation of changes in these areas;
5. Evaluate food safety and resource availability (to address questions 1 and 2, above);
6. Provide information on qualitative aspects of subsistence uses (e.g., involvement of children, role of elders that assist in evaluating integration of subsistence back into community life (to address question 3, above); and
7. Obtain a community review and discussion of study findings.
reSearch MethodS
Ethical Principles for the Conduct of ResearchThe project was guided by the research principles outlined in the Alaska Federation of Natives Guidelines for Research1 and by the National Science Foundation, Office of Polar Programs in its Principles for the Conduct of Research in the Arctic2, the Ethical Principles for the Conduct of Research in the North (Association of Canadian Universities for Northern Studies 2003), as well as the Alaska confidentiality statute (AS 16.05.815). These principles stress community approval of research designs, informed consent, anonymity or confidentiality of study participants, community review of draft study findings, and the provision of study findings to each study community upon completion of the research.
Project Planning and ApprovalsContact with Chenega Bay was initiated by ADF&G staff member Davin Holen in November 2014 (Table 1-2). Holen communicated with the Chenega IRA Council to garner support for the proposed project. In January 2015, Holen assigned ADF&G staff member Rosalie Grant as the community lead researcher. Grant continued to work with the IRA council and identified George Elashansky as the official contact and local research assistant. In February 2015, Chenega Bay was reassigned to ADF&G staff member Joshua Ream. Ream then coordinated with George Elashansky to arrange fieldwork for March 2015. Ream and ADF&G intern Erica Mitchell met with a tribal council representative prior to the start of fieldwork on March 13, 2015.
1. Alaska Federation of Natives. 2013. “Alaska Federation of Natives Guidelines for Research.” Alaska Native Knowledge Net-work. Accessed October 15, 2015. http://www.ankn.uaf.edu/IKS/afnguide.html.2. National Science Foundation Interagency Social Science Task Force. 2012. “Principles for the Conduct of Research in the Arctic.” Accessed October 15, 2015. http://www.nsf.gov/od/opp/arctic/conduct.jsp.
8

Table 1-2.–Project staff.Task Name OrganizationProject design and management James A. Fall, Davin Holen ADF&G Division of SubsistenceProject lead Davin Holen ADF&G Division of SubsistenceData management lead Dave Koster ADF&G Division of SubsistenceChenega Bay research lead Joshua T. Ream ADF&G Division of SubsistenceTatitlek research lead Sarah M. Hazell and Bronwyn Jones ADF&G Division of SubsistenceCordova research lead Roselie Grant and Malla Kukkonen ADF&G Division of SubsistenceAdministrative support Maegan Smith ADF&G Division of Subsistence
Theresa Quiner ADF&G Division of SubsistenceProgrammer Dave Koster ADF&G Division of SubsistenceData entry Margaret Cunningham ADF&G Division of Subsistence
Theresa Quiner ADF&G Division of SubsistenceBarbara Dodson ADF&G Division of SubsistenceZayleen Kalalo ADF&G Division of SubsistenceNicholas Jackson ADF&G Division of SubsistenceKayla Schommer ADF&G Division of Subsistence
Data cleaning/validation Dave Koster ADF&G Division of SubsistenceGarrett Zimpelman ADF&G Division of SubsistenceMargaret Cunningham ADF&G Division of Subsistence
Data analysis Dave Koster ADF&G Division of SubsistenceGarrett Zimpelman ADF&G Division of SubsistenceErica Mitchell ADF&G Division of Subsistence
Cartography Terri Lemons ADF&G Division of SubsistenceMargaret Cunningham ADF&G Division of SubsistenceJoshua T. Ream ADF&G Division of Subsistence
Mapping application development Michael Davis HDR Alaska, Inc.Editorial review lead Mary Lamb ADF&G Division of SubsistenceField research staff Roselie Grant ADF&G Division of Subsistence
Malla Kukkonen ADF&G Division of SubsistenceHannah Z. Johnson ADF&G Division of SubsistenceMeredith A. Marchioni ADF&G Division of SubsistenceJoshua T. Ream ADF&G Division of SubsistenceEric Schacht ADF&G Division of SubsistenceErica Mitchell ADF&G Division of SubsistenceDustin Murray ADF&G Division of SubsistenceBronwyn Jones ADF&G Division of SubsistenceDavin Holen ADF&G Division of Subsistence
Local research assistants George Elashansky Chenega BayKristopher Kompkoff TatitlekGeorge Vlasoff TatitlekAlvin Kuramoto CordovaEllen Americus CordovaFaith Barnes CordovaHarrison Cain CordovaJacob West CordovaJune Harrelson CordovaKenneth Eleshansky CordovaLennette Ronnegard CordovaTim Merculeif Cordova
9
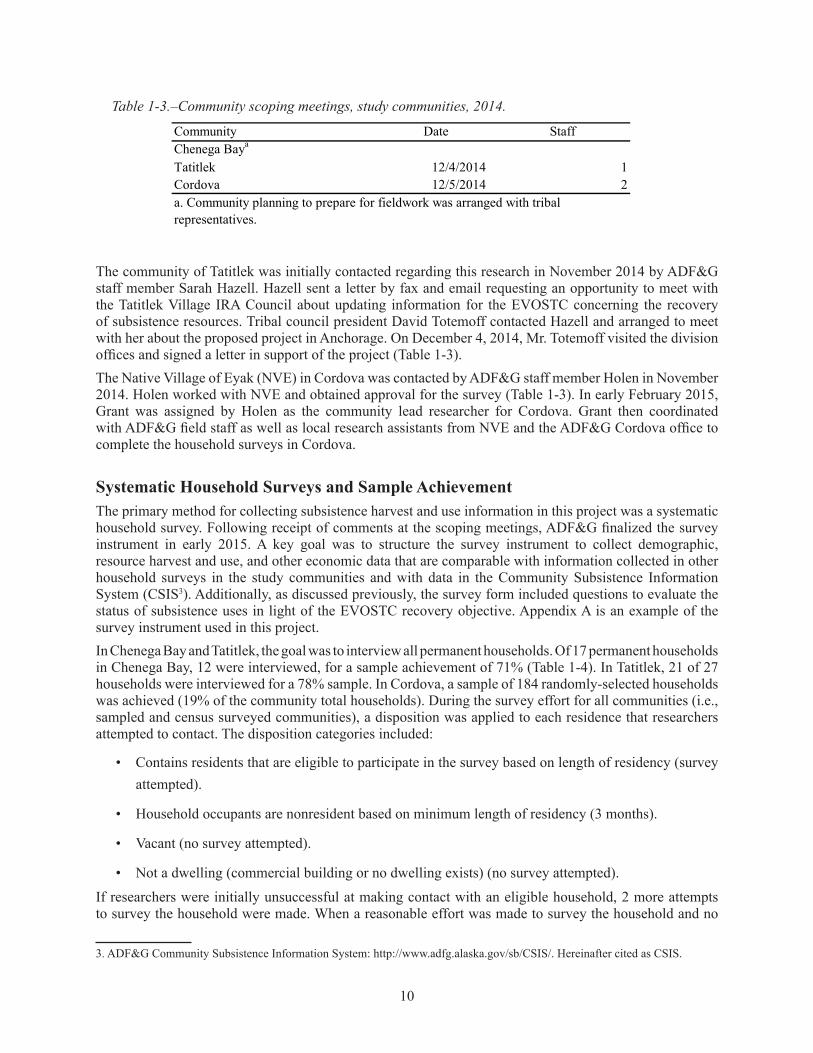
The community of Tatitlek was initially contacted regarding this research in November 2014 by ADF&G staff member Sarah Hazell. Hazell sent a letter by fax and email requesting an opportunity to meet with the Tatitlek Village IRA Council about updating information for the EVOSTC concerning the recovery of subsistence resources. Tribal council president David Totemoff contacted Hazell and arranged to meet with her about the proposed project in Anchorage. On December 4, 2014, Mr. Totemoff visited the division offices and signed a letter in support of the project (Table 1-3). The Native Village of Eyak (NVE) in Cordova was contacted by ADF&G staff member Holen in November 2014. Holen worked with NVE and obtained approval for the survey (Table 1-3). In early February 2015, Grant was assigned by Holen as the community lead researcher for Cordova. Grant then coordinated with ADF&G field staff as well as local research assistants from NVE and the ADF&G Cordova office to complete the household surveys in Cordova.
Systematic Household Surveys and Sample AchievementThe primary method for collecting subsistence harvest and use information in this project was a systematic household survey. Following receipt of comments at the scoping meetings, ADF&G finalized the survey instrument in early 2015. A key goal was to structure the survey instrument to collect demographic, resource harvest and use, and other economic data that are comparable with information collected in other household surveys in the study communities and with data in the Community Subsistence Information System (CSIS3). Additionally, as discussed previously, the survey form included questions to evaluate the status of subsistence uses in light of the EVOSTC recovery objective. Appendix A is an example of the survey instrument used in this project.In Chenega Bay and Tatitlek, the goal was to interview all permanent households. Of 17 permanent households in Chenega Bay, 12 were interviewed, for a sample achievement of 71% (Table 1-4). In Tatitlek, 21 of 27 households were interviewed for a 78% sample. In Cordova, a sample of 184 randomly-selected households was achieved (19% of the community total households). During the survey effort for all communities (i.e., sampled and census surveyed communities), a disposition was applied to each residence that researchers attempted to contact. The disposition categories included:
• Contains residents that are eligible to participate in the survey based on length of residency (survey attempted).
• Household occupants are nonresident based on minimum length of residency (3 months).
• Vacant (no survey attempted).
• Not a dwelling (commercial building or no dwelling exists) (no survey attempted).
If researchers were initially unsuccessful at making contact with an eligible household, 2 more attempts to survey the household were made. When a reasonable effort was made to survey the household and no
3. ADF&G Community Subsistence Information System: http://www.adfg.alaska.gov/sb/CSIS/. Hereinafter cited as CSIS.
Table 1-3.–Community scoping meetings, study communities, 2014.
Community Date StaffChenega Baya
Tatitlek 12/4/2014 1Cordova 12/5/2014 2a. Community planning to prepare for fieldwork was arranged with tribal representatives.
10

contact could be made, this household was assigned a “no contact” disposition. Refusal rates were 20% in Chenega Bay, 9% in Tatitlek, and 20% in Cordova.On average, surveys (including mapping of harvest areas) took 77 minutes to complete in Chenega Bay, 36 minutes in Tatitlek, and 53 minutes in Cordova (Table 1-5). Survey length ranged from about 10 minutes to about 4 hours.
Mapping Locations of Subsistence Hunting, Fishing, and Gathering ActivitiesDuring household interviews, the researchers asked respondents to indicate the locations of their fishing, hunting, and gathering activities during the study year. In addition, interviewers asked the respondents to mark on the maps the sites of each harvest, the species harvested, the amounts harvested, and the months of harvest. ADF&G staff established a standard mapping method. Features included points, polygons (shapes), and lines. Points were used to mark harvest locations and polygons (circled areas) were used to indicate harvest effort areas, such as areas searched while hunting deer. Some lines were also drawn in order to depict when the harvesting activity did not occur at a specific point; for example, lines were used to depict traplines or courses taken while trolling for fish. Harvest locations and fishing, hunting, and gathering areas were documented using an application designed on the ArcGIS Runtime SDK for iOS platform; basically a mapping data collection application for Apple
Table 1-4.–Estimated households and sample achievement, study communities, 2014.
Sample information Chenega Bay Cordova TatitlekNumber of dwelling units 18 1,489 29Interview goal 17 150 27Households interviewed 12 184 21Households failed to be contacted 2 257 4Households declined to be interviewed 3 46 2Households moved or occupied by nonresident 1 539 2Total households attempted to be interviewed 17 487 27Refusal rate 20.0% 20.0% 8.7%Final estimate of permanent households 17 950 27Percentage of total households interviewed 70.6% 19.4% 77.8%Interview weighting factor 1.42 5.16 1.29
Sampled population 25 504 58Estimated population 35.4 2,602.2 74.6
Community
Source ADF&G Division of Subsistence household surveys, 2015.
Table 1-5.–Survey duration, study communities, 2014.
Community Average Minimum MaximumChenega Bay 77 15 234Cordova 53 10 240Tatitlek 36 15 65
Interview length (in minutes)
Source ADF&G Division of Subsistence household surveys, 2015.
11

iPad.4 The point, polygon, or line was drawn on a U.S. Geological Survey topographic relief map downloaded on the iPad. The areas depicted on the maps should be understood to represent an approximation of the actual search area. The iPad allowed the user to zoom in and out to the appropriate scale, and the ability to document search and harvest activities wherever they occurred in the state of Alaska. Once a feature was accepted, an attribute box was filled out by the researcher that noted the species harvested, amount, method of access to the resource, and month(s) of harvest. The data were uploaded via Wi-Fi to a server. Once data collection was complete the data were downloaded into an ArcGIS file geodatabase. The application was developed by HDR, Inc., an environmental research firm located in Anchorage. Paper maps were also available to be used as a reference for respondents as well as by a local research assistant (LRA) when an ADF&G researcher was not available for the interview. These maps were 11x17 inches at a scale of 1:250,000 and 1:500:000 and only documented the area within the survey area. Very few paper maps were used and research staff digitized markings on paper maps using the iPad application.Once a survey was complete researchers conducted a quality control exercise by matching the map data to the survey form to ensure all map data had been documented. This was completed in the field before the surveys were submitted to the community’s lead researcher. Once the data had been uploaded, researchers also verified that the household data were logged into the server. At the end of the field season the geodatabase was turned over to ADF&G. A few remaining paper maps were digitized and then map production began. The data were first sorted by community, and then resource. Maps were then produced at the species-specific level for each community.
Key Respondent InterviewsWhile researchers were in the study communities they consulted with tribal governments, community councils, and LRAs to identify key respondents to interview. The purpose of the key respondent interviews was to provide additional context for the quantitative data and also to provide information for the community background section at the beginning of each chapter. The number of key respondent interviews varied among communities. Key respondent interviews were semi-structured and directed by a key respondent interview protocol that has proven successful on other baseline study projects. Besides gathering qualitative data through the key respondent interview protocol, ADF&G staff took notes during interviews to provide additional context for this report. Researchers analyzed key respondent interviews and interview notes in preparation for this report. Key respondents were informed that, to maintain anonymity, their names would not be included in this report.
data analySiS and review
Survey Data Entry and AnalysisAll data were coded for data entry by Division of Subsistence staff in Anchorage. Surveys were reviewed and coded only by ADF&G research staff for consistency. Responses were coded following standardized conventions used by the Division of Subsistence to facilitate data entry. Information management staff within the Division of Subsistence set up database structures within Microsoft SQL Server at ADF&G in Anchorage to hold the survey data. The database structures included rules, constraints, and referential integrity to ensure that data were entered completely and accurately. Data entry screens were available on a secured internal network. Daily incremental backups of the database occurred, and transaction logs were backed up hourly. Full backups of the database occurred twice weekly. This ensured that no more than 1 hour of data entry would be lost in the unlikely event of a catastrophic failure. All survey data were entered twice and each set compared in order to minimize data entry errors.
4. Product names are given because they are established standards for the State of Alaska or for scientific completeness; they do not constitute product endorsement.
12

Once data were entered and confirmed, information was processed with the use of Statistical Package for the Social Sciences (SPSS) software, version 20. Initial processing included the performance of standardized logic checks of the data. Logic checks are often needed in complex data sets where rules, constraints, and referential integrity do not capture all of the possible inconsistencies that may appear. Harvest data collected as numbers of animals, or in gallons or buckets, were converted to pounds usable weight using standard factors (see Appendix B for conversion factors).ADF&G staff also used SPSS for analyzing the survey information. Analyses included review of raw data frequencies, cross tabulations, table generation, estimation of population parameters, and calculation of confidence intervals for the estimates. Missing information was dealt with on a case-by-case basis according to standardized practices, such as minimal value substitution or using an averaged response for similarly-characterized households. Typically, missing data are an uncommon, randomly-occurring phenomenon in household surveys conducted by the division. In unusual cases where a substantial amount of survey information was missing, the household survey was treated as a “non-response” and not included in community estimates. ADF&G researchers documented all adjustments.Harvest estimates and responses to all questions were calculated based upon the application of weighted means (Cochran 1977). These calculations are standard methods for extrapolating sampled data. As an example, the formula for harvest expansion is
(1)
(2)
where:
the total estimated harvest (numbers of resource or pounds) for the community i,
the mean harvest of returned surveys,
the total harvest reported in returned surveys,
the number of returned surveys, and
the number of households in a community.
As an interim step, the standard deviation (SD) (or variance [V], which is the SD squared) was also calculated with the raw, unexpanded data. The standard error (SE), or SD of the mean, was also calculated for each community. This was used to estimate the relative precision of the mean, or the likelihood that an unknown value would fall within a certain distance from the mean. In this study, the relative precision of the mean is shown in the tables as a confidence limit (CL), expressed as a percentage. Once SE was calculated, the CL was determined by multiplying the SE by a constant that reflected the level of significance desired, based on a normal distribution. The value of the constant is derived from student’s t distribution, and varies slightly depending upon the size of the community. Though there are numerous ways to express the formula below, it contains the components of a SD, V, and SE:
(3)
where:
13
sample standard deviation,
sample size,
mean harvest of returned surveys,
population size, and
student’s t statistic for alpha level (α=.95) with n–1 degrees of freedom.
Small CL percentages indicate that an estimate is likely to be very close to the actual mean of the sample. Larger percentages mean that estimates could be further from the mean of the sample.The corrected final data from the household survey will be added to the Division of Subsistence CSIS. This publicly-accessible database includes community-level study findings.
Population Estimates and Other Demographic InformationAs noted above, a goal of the research was to collect demographic information for all interviewed year-round households in each study community. For this study, “year-round” was defined as being domiciled in the community when the surveys took place and for at least 3 months during the study year 2014. Because not all households were interviewed, population estimates for each community were calculated by multiplying the average household size of interviewed households by the total number of year-round households, as identified by Division of Subsistence researchers in consultation with community officials and other knowledgeable respondents. There may be several reasons for the differences among the population estimates for each community generated from the division’s surveys and other demographic data developed by the 2010 federal census (U.S. Census Bureau 2011), the U.S. Census Bureau’s American Community Survey (U.S. Census Bureau n.d.), and the Alaska Department of Labor and Workforce Development (ADLWD (Alaska Department of Labor and Workforce Development) 2015). Sampling of households, timing of survey administration, or eligibility criteria for inclusion in the survey may explain differences in the population estimates. Relevant factors are discussed in each community chapter.
Map Data Entry and AnalysisAs discussed above, maps were generated based on data collected using an iPad or on 11x17-inch paper maps. All data were entered on the iPad, whether in the field during interviews or by ADF&G research staff while coding survey data. Map features were matched to the survey form to ensure that all harvest data were recorded accurately. Once all data were entered, an ArcGIS file geodatabase was downloaded by ADF&G researchers from the server and maps showing search and harvest locations for each species was created in ArcGIS 10.3 using a standard template for reports. Maps show search and harvest locations for fish species, plants, berries, birds and bird eggs, marine mammals, marine invertebrates, small land mammals/furbearers, and search locations for large land mammals. To ensure confidentiality, harvest locations for large land mammals are not produced for the report. Maps were reviewed at a community review meeting to ensure accuracy.
Food Security AnalysisSurvey respondents were asked a set of questions intended to assess their household’s food security, defined as, “access by all people at all times to enough food for an active, healthy life” (Coleman-Jensen et al. 2012). A “food security” section of the survey used a standard national questionnaire to assess whether or not the household had enough food to eat, whether from subsistence sources or from market sources. The protocol
14
used in this survey was a modified version of the 12-month food security scale questionnaire developed by the U.S. Department of Agriculture (USDA). This questionnaire is administered nationwide each year as part of the annual Current Population Survey (CPS). In 2007, approximately 125,000 U.S. households were interviewed, including 1,653 in Alaska (Nord et al. 2008). From CPS data, the USDA prepares an annual report on food security in the United States. Food security protocols have been extensively reviewed (Coates 2004; Webb et al. 2006; Wunderlich and Norwood 2006) and have been used around the world, including in northern Burkina Faso (Frongillo and Nanama 2006), Bangladesh (Coates et al. 2006), Bolivia and the Philippines (Melgar-Quinonez et al. 2006), and Brazil (Pérez-Escamilla et al. 2004). Although there have been efforts to develop a universal food security measurement protocol (Swindale and Bilinsky 2006), researchers often modify the protocol slightly to respond to community social, cultural, and economic circumstances, as was done here.For this study, the food security protocol was modified by the addition of several questions designed to determine whether food insecurities, if any, were related to subsistence foods or store-bought foods. Additionally, the wording of some questions was changed slightly. As in Brazil (Pérez-Escamilla et al. 2004), the USDA term “balanced meals” was difficult to interpret for indigenous Alaska populations, and was replaced with the term “healthy meals” to reflect unique dietary and cultural circumstances in rural Alaska.Based on the aggregated number of affirmative responses to these questions, households were broadly categorized as being food secure or food insecure following a USDA protocol (Bickel et al. 2000). Food secure households were broken down further into 2 subcategories: high or marginal food security. Food insecure households were divided into 2 subcategories: low or very low food security.Households with a high or marginal level of food security reported 1 or 2 instances of food access problems or limitations—typically anxiety over food sufficiency or a shortage of particular foods in the house—but gave little or no indication of changes in diets or food intake. Households with low food security reported reduced quality, variety, or desirability of their diet, but they, too, gave little indication of reduced food intake. Households classified as having very low food security were those that reported multiple instances of disrupted eating patterns and reduced food intake (Coleman-Jensen et al. 2012).
Community Review MeetingsADF&G staff presented preliminary survey findings and associated search area and harvest maps at a meeting in each community. Table 1-6 shows when a community review meeting occurred in each study community and how many community residents attended.The Chenega Bay community review meeting was held on October 1, 2015, at the Chenega Bay School by ADF&G staff members Ream and Bronwyn Jones. School teachers were contacted in August for approval to use the facility and assistance with advertising the event. Students were sent home with fliers advertising the event the week prior to the meeting. The Chenega IRA Council also assisted with announcing the meeting to community members. Eight community members attended the meeting and provided valuable feedback. For the community review meeting in the community of Tatitlek, Jones and Ream traveled to the community on September 15, 2015. Two members of the Tatitlek Village IRA Council attended the meeting. The community review meeting in Cordova was held on September 21, 2015, at the U.S. Forest Service meeting room in the old courthouse building. Prior to the meeting, an invitation to the meeting was sent to the NVE. Additional advertisement for the meeting was done through informative fliers made available at the ADF&G Cordova office and other prominent locations in the community, as well as through announcements on one of the local radio stations. ADF&G staff member Malla Kukkonen and intern Hannah Johnson presented the draft data to 2 community members who attended the meeting.Due to minimal public attendance in September, a second community meeting was held in Cordova on April 5, 2016, at the U.S. Forest Service meeting room in the old courthouse building. The presentation was
15
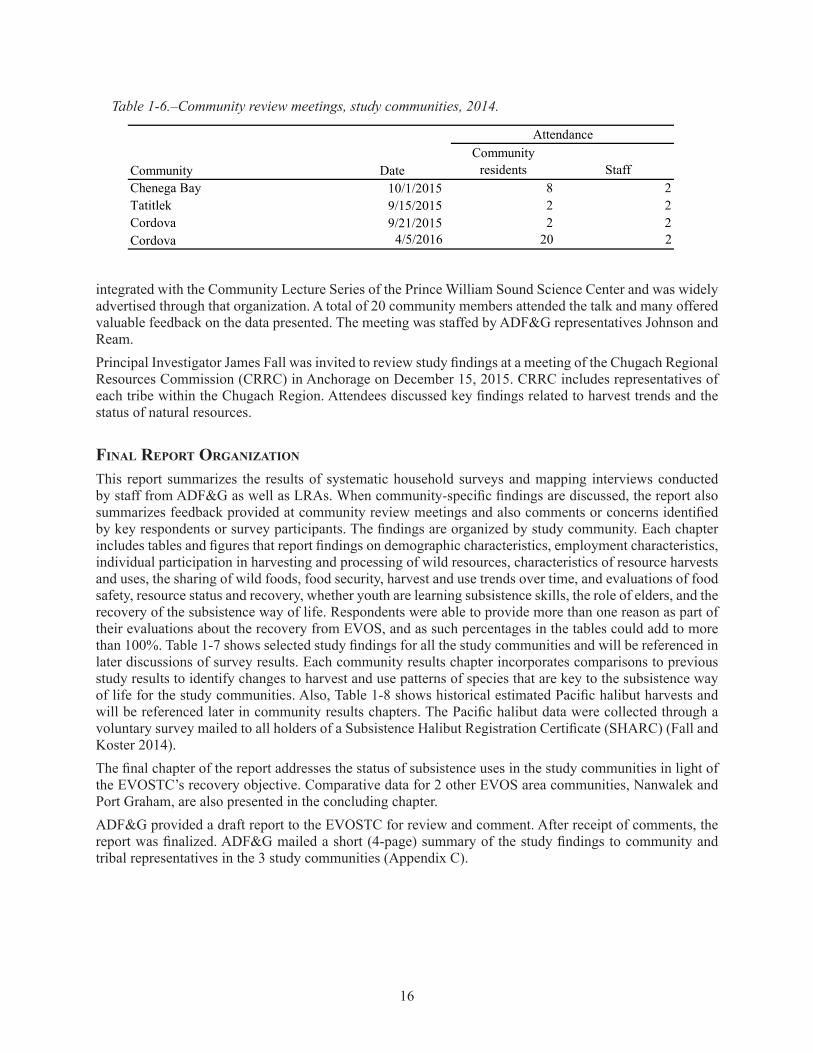
Table 1-6.–Community review meetings, study communities, 2014.
Community residents Staff
Chenega Bay 10/1/2015 8 2Tatitlek 9/15/2015 2 2Cordova 9/21/2015 2 2Cordova 4/5/2016 20 2
Community Date
Attendance
integrated with the Community Lecture Series of the Prince William Sound Science Center and was widely advertised through that organization. A total of 20 community members attended the talk and many offered valuable feedback on the data presented. The meeting was staffed by ADF&G representatives Johnson and Ream. Principal Investigator James Fall was invited to review study findings at a meeting of the Chugach Regional Resources Commission (CRRC) in Anchorage on December 15, 2015. CRRC includes representatives of each tribe within the Chugach Region. Attendees discussed key findings related to harvest trends and the status of natural resources.
Final rePort organization
This report summarizes the results of systematic household surveys and mapping interviews conducted by staff from ADF&G as well as LRAs. When community-specific findings are discussed, the report also summarizes feedback provided at community review meetings and also comments or concerns identified by key respondents or survey participants. The findings are organized by study community. Each chapter includes tables and figures that report findings on demographic characteristics, employment characteristics, individual participation in harvesting and processing of wild resources, characteristics of resource harvests and uses, the sharing of wild foods, food security, harvest and use trends over time, and evaluations of food safety, resource status and recovery, whether youth are learning subsistence skills, the role of elders, and the recovery of the subsistence way of life. Respondents were able to provide more than one reason as part of their evaluations about the recovery from EVOS, and as such percentages in the tables could add to more than 100%. Table 1-7 shows selected study findings for all the study communities and will be referenced in later discussions of survey results. Each community results chapter incorporates comparisons to previous study results to identify changes to harvest and use patterns of species that are key to the subsistence way of life for the study communities. Also, Table 1-8 shows historical estimated Pacific halibut harvests and will be referenced later in community results chapters. The Pacific halibut data were collected through a voluntary survey mailed to all holders of a Subsistence Halibut Registration Certificate (SHARC) (Fall and Koster 2014).The final chapter of the report addresses the status of subsistence uses in the study communities in light of the EVOSTC’s recovery objective. Comparative data for 2 other EVOS area communities, Nanwalek and Port Graham, are also presented in the concluding chapter.ADF&G provided a draft report to the EVOSTC for review and comment. After receipt of comments, the report was finalized. ADF&G mailed a short (4-page) summary of the study findings to community and tribal representatives in the 3 study communities (Appendix C).
16

Table 1-7.–Selected community study findings for comparison, study communities, 2014.
Chenega Bay Cordova Tatitlek
Population 35.4 2,602.2 74.6Percentage of population that is Alaska Native 64.0% 16.0% 87.9%Percentage of household heads born in Alaska 58.8% 27.2% 77.4%Average length of residency of household heads (years) 15.5 23.8 34.8
Average number of months employed 7.3 7.8 5.4Percentage of employed adults working year-round 70.0% 61.2% 63.6%Percentage of income from sources other than employment 23.9% 13.1% 65.9%Average household incomea $49,906 $86,157 $63,586Per capita incomea $23,955 $31,454 $23,023
Per capita harvest, pounds usable weight 254.6 116.2 293.5Average household harvest, pounds usable weight 530.5 318.3 810.7Number of resources used by 50% or more households 11.0 7.0 7.0Average number of resources used per household 18.0 10.4 9.8Average number of resources attempted to be harvested per household 12.7 7.7 7.4Average number of resources harvested per household 11.4 6.7 7.2Average number of resources received per household 8.1 4.8 4.5Average number of resources given away per household 5.2 3.6 4.6Percentage of total harvest taken by top 25% ranked households 80.2% 70.3% 76.2%Percentage of households that harvested 70% of harvest 16.7% 25.0% 19.0%Per capita harvest by lowest ranked 50% of households 12.4 9.2 22.1Percentage of total harvest taken by lowest ranked 50% of harvesting households 4.9% 7.9% 7.5%Average number of resources used by lowest ranked 50% of households 10.0 7.8 8.5Average number of resources used by top 25% ranked households 29.7 14.2 17.2
Source ADF&G Division of Subsistence household surveys, 2015.a. Includes income from sources other than employment.
Cash economy
DemographyCategory
Resource harvest and use
Community
17
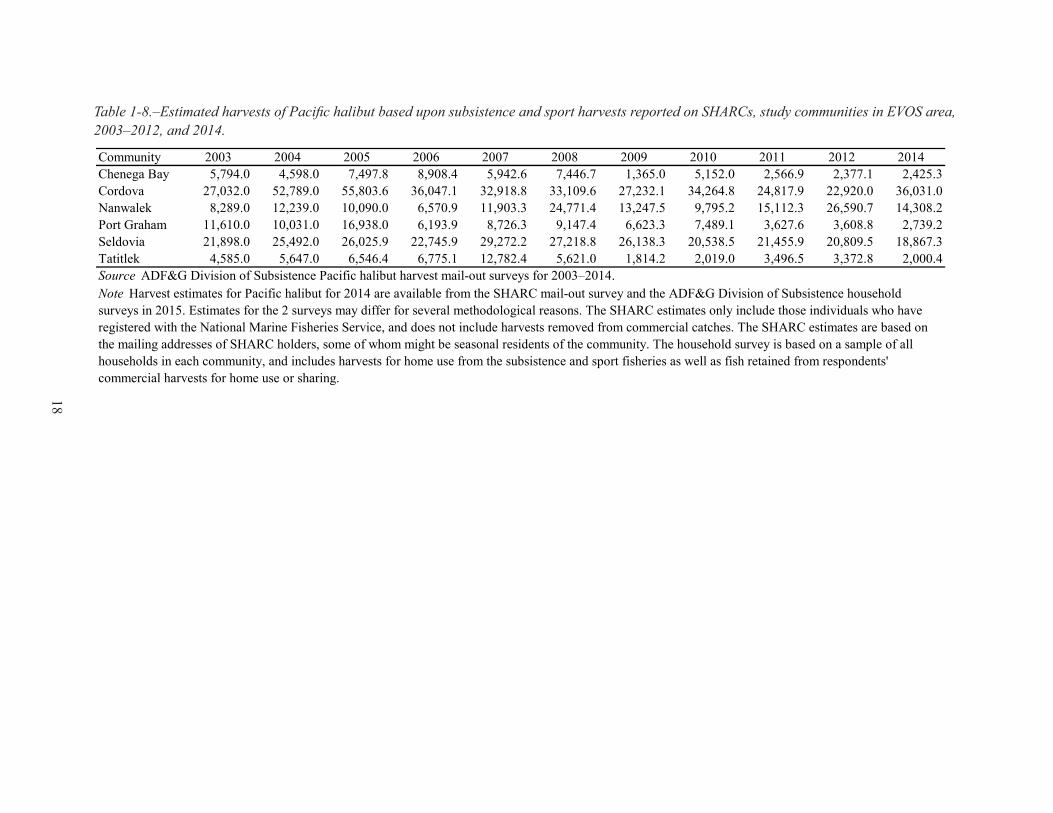
Table 1-8.–Estimated harvests of Pacific halibut based upon subsistence and sport harvests reported on SHARCs, study communities in EVOS area, 2003–2012, and 2014.
Community 2003 2004 2005 2006 2007 2008 2009 2010 2011 2012 2014Chenega Bay 5,794.0 4,598.0 7,497.8 8,908.4 5,942.6 7,446.7 1,365.0 5,152.0 2,566.9 2,377.1 2,425.3Cordova 27,032.0 52,789.0 55,803.6 36,047.1 32,918.8 33,109.6 27,232.1 34,264.8 24,817.9 22,920.0 36,031.0Nanwalek 8,289.0 12,239.0 10,090.0 6,570.9 11,903.3 24,771.4 13,247.5 9,795.2 15,112.3 26,590.7 14,308.2Port Graham 11,610.0 10,031.0 16,938.0 6,193.9 8,726.3 9,147.4 6,623.3 7,489.1 3,627.6 3,608.8 2,739.2Seldovia 21,898.0 25,492.0 26,025.9 22,745.9 29,272.2 27,218.8 26,138.3 20,538.5 21,455.9 20,809.5 18,867.3Tatitlek 4,585.0 5,647.0 6,546.4 6,775.1 12,782.4 5,621.0 1,814.2 2,019.0 3,496.5 3,372.8 2,000.4Source ADF&G Division of Subsistence Pacific halibut harvest mail-out surveys for 2003–2014.Note Harvest estimates for Pacific halibut for 2014 are available from the SHARC mail-out survey and the ADF&G Division of Subsistence household surveys in 2015. Estimates for the 2 surveys may differ for several methodological reasons. The SHARC estimates only include those individuals who have registered with the National Marine Fisheries Service, and does not include harvests removed from commercial catches. The SHARC estimates are based on the mailing addresses of SHARC holders, some of whom might be seasonal residents of the community. The household survey is based on a sample of all households in each community, and includes harvests for home use from the subsistence and sport fisheries as well as fish retained from respondents' commercial harvests for home use or sharing.
18
2. CHENEGA BAY
Joshua T. Ream and Erica Mitchell
coMMunity Background
The village of Chenega Bay is located on Crab Bay at the southern end of Evans Island in southwestern Prince William Sound. It is approximately 42 miles southeast of the road-connected community of Whittier and 104 air miles southeast of Anchorage.1 The location is protected from the open ocean to the south and west by Elrington, LaTouche, and Montague islands. Terrain on Evans Island is mountainous and forested, occurring within the maritime climate zone of southcentral Alaska.Chenega Bay is small and isolated, and is accessible only by boat and air travel. Charter airlines provide several scheduled weather-dependent trips to the community each week and the Alaska Marine Highway System provides weekly ferry service year-round. A few public facilities are present, including a school, health clinic, and post office. The Chenega IRA Council also maintains a local office and a trailer that can be rented for lodging. There is a single Village Public Safety Officer (VPSO). No stores or other services are available. There is also a small boat harbor, a Russian Orthodox Church, and a small museum with limited hours.Many Chenega Bay residents visit Anchorage regularly to obtain food supplies and other goods that are brought back to the community. Some community members maintain residences in Anchorage and divide their time between the 2 communities. Ties with other communities in Prince William Sound (Tatitlek, Cordova, and Valdez) are also maintained. The relationship with these communities was expanded between 1964 and 1984 when residents of the original Chenega village site on Chenega Island were forced to relocate following a devastating earthquake and tsunami. Further information about the community’s history is available in Stratton and Chisum (1986).
houSehold Survey iMPleMentation
The community of Chenega Bay was initially contacted regarding this research in late 2014 by Alaska Department of Fish and Game (ADF&G) staff members Davin Holen and Rosalie Grant. Coordination and project approvals were made in conjunction with the Chenega IRA Council. Two ADF&G staff members, researcher Joshua Ream and intern Erica Mitchell, traveled to Chenega Bay to conduct the research March 13–16, 2015. A local research assistant (LRA) was trained on March 13 and survey administration began immediately thereafter. All households with members present in the community were contacted, but several community members were out of town during this fieldwork. The LRA was able to conduct an additional interview the following week.
PoPulation eStiMateS and deMograPhic inForMation
This study identified 17 households and approximately 35 residents in Chenega Bay for study year 2014 (Table 2-1; Figure 2-1). This survey’s results estimated substantially fewer households and residents as compared to the 2010 federal census (31 households; 76 individuals) and the 5-year American Community Survey (ACS) average (28 households; 84 individuals). This difference may largely be attributable to differing qualifications for residency. For this study, individuals qualified as residents if they: 1) considered Chenega Bay their primary home; 2) received their mail in Chenega Bay; and 3) spent at least 3 consecutive months in Chenega Bay in 2014. Researchers found that many individuals who self-identify as residents of Chenega Bay also maintain residency in Anchorage. According to the LRA, there were 5 home structures in
1. Chenega IRA Council, “Chenega Bay – Description & Location,” Chugachmiut, http://www.chugachmiut.org/tribes/chenega.html (accessed October 2015).
19

Table 2-1.–Population estimates, Chenega Bay, 2010 and 2014.
Estimate Rangea Estimate Rangeb
Households 31 28.0 15 – 41 17.0Population 76 84.0 27 – 141 35.4 25 – 46
Population 46 47.0 11 – 83 22.7 9 – 36Percentage 60.5% 56.0% 64.0%
5-year American Community Survey
(2009–2013)
Note Chenega Bay includes Chenega census designated place (CDP).
b. No range of households is estimated for division surveys. a. ACS data range are the reported margins of error.
This study(2014)
Sources U.S. Census Bureau (2011) for 2010 estimate; U.S. Census Bureau for American Community Survey (ACS) 2013 estimate (5-year average); and ADF&G Division of Subsistence household surveys, 2015, for 2014 estimate.Note Division of Subsistence household survey elegiblity requirements differ from those used by (ACS).
Census(2010)
Total population
Alaska Native
0
20
40
60
80
100
120
140
160
2010 U.S. Census 2009–2013 American Community Survey
This study(2014)
Num
ber o
f peo
ple
Total population Alaska Native population
Figure 2-1.–Alaska Native and overall population estimates, Chenega Bay, 2010 and 2014.
20
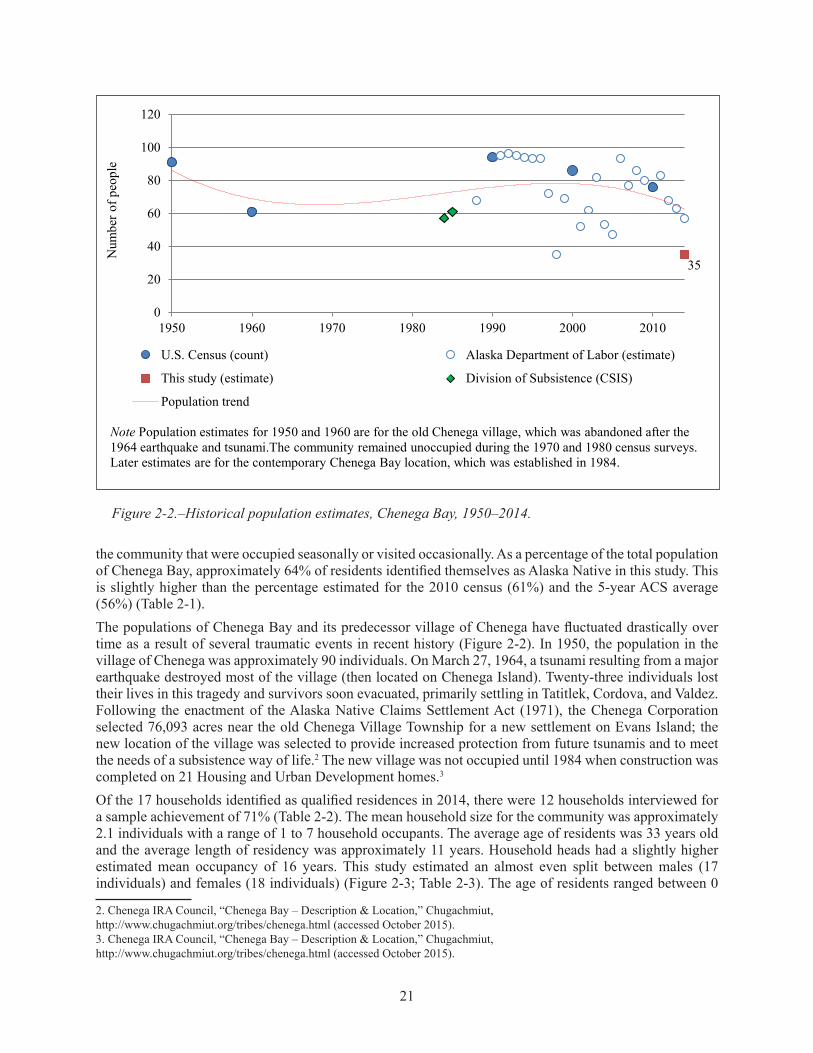
the community that were occupied seasonally or visited occasionally. As a percentage of the total population of Chenega Bay, approximately 64% of residents identified themselves as Alaska Native in this study. This is slightly higher than the percentage estimated for the 2010 census (61%) and the 5-year ACS average (56%) (Table 2-1).The populations of Chenega Bay and its predecessor village of Chenega have fluctuated drastically over time as a result of several traumatic events in recent history (Figure 2-2). In 1950, the population in the village of Chenega was approximately 90 individuals. On March 27, 1964, a tsunami resulting from a major earthquake destroyed most of the village (then located on Chenega Island). Twenty-three individuals lost their lives in this tragedy and survivors soon evacuated, primarily settling in Tatitlek, Cordova, and Valdez. Following the enactment of the Alaska Native Claims Settlement Act (1971), the Chenega Corporation selected 76,093 acres near the old Chenega Village Township for a new settlement on Evans Island; the new location of the village was selected to provide increased protection from future tsunamis and to meet the needs of a subsistence way of life.2 The new village was not occupied until 1984 when construction was completed on 21 Housing and Urban Development homes.3
Of the 17 households identified as qualified residences in 2014, there were 12 households interviewed for a sample achievement of 71% (Table 2-2). The mean household size for the community was approximately 2.1 individuals with a range of 1 to 7 household occupants. The average age of residents was 33 years old and the average length of residency was approximately 11 years. Household heads had a slightly higher estimated mean occupancy of 16 years. This study estimated an almost even split between males (17 individuals) and females (18 individuals) (Figure 2-3; Table 2-3). The age of residents ranged between 0
2. Chenega IRA Council, “Chenega Bay – Description & Location,” Chugachmiut, http://www.chugachmiut.org/tribes/chenega.html (accessed October 2015).3. Chenega IRA Council, “Chenega Bay – Description & Location,” Chugachmiut, http://www.chugachmiut.org/tribes/chenega.html (accessed October 2015).
Figure 2-2.–Historical population estimates, Chenega Bay, 1950–2014.
35
0
20
40
60
80
100
120
1950 1960 1970 1980 1990 2000 2010
Num
ber o
f peo
ple
U.S. Census (count) Alaska Department of Labor (estimate)
This study (estimate) Division of Subsistence (CSIS)
Population trend
Note Population estimates for 1950 and 1960 are for the old Chenega village, which was abandoned after the1964 earthquake and tsunami.The community remained unoccupied during the 1970 and 1980 census surveys.Later estimates are for the contemporary Chenega Bay location, which was established in 1984.
21

Table 2-2.–Sample and demographic characteristics, Chenega Bay, 2014.
CommunityChenega Bay
Sampled households 12Eligible households 17Percentage sampled 70.6%
Sampled population 25Estimated community population 35.4
Mean 2.1Minimum 1Maximum 7
32.61
7137
Total populationMean 11.2Minimuma 1Maximum 35
Heads of householdMean 15.5Minimuma 1Maximum 35
Alaska NativeEstimated householdsb
Number 9.9Percentage 58.3%
Estimated populationNumber 22.7Percentage 64.0%
Mean
Household size
Age
Characteristics
b. The estimated number of households in which at least 1 head of household is Alaska Native.
Minimuma
MaximumMedian
Length of residency
a. A minimum age of 0 (zero) is used for infants who are less than 1 year of age.
Source ADF&G Division of Subsistence household surveys, 2015.
22

5 4 3 2 1 0 1 2 3 4 5
0–45–9
10–1415–1920–2425–2930–3435–3940–4445–4950–5455–5960–6465–6970–7475–7980–8485–8990–9495–99
100–104Missing
Number of people
Female
Male
Figure 2-3.–Population profile, Chenega Bay, 2014.
Table 2-3.–Population profile, Chenega Bay, 2014.
Number PercentageCumulative percentage Number Percentage
Cumulative percentage Number Percentage
Cumulative percentage
0–4 0.0 0.0% 0.0% 4.3 23.1% 23.1% 4.3 12.0% 12.0%5–9 0.0 0.0% 0.0% 1.4 7.7% 30.8% 1.4 4.0% 16.0%
10–14 1.4 8.3% 8.3% 0.0 0.0% 30.8% 1.4 4.0% 20.0%15–19 1.4 8.3% 16.7% 1.4 7.7% 38.5% 2.8 8.0% 28.0%20–24 1.4 8.3% 25.0% 0.0 0.0% 38.5% 1.4 4.0% 32.0%25–29 1.4 8.3% 33.3% 1.4 7.7% 46.2% 2.8 8.0% 40.0%30–34 0.0 0.0% 33.3% 0.0 0.0% 46.2% 0.0 0.0% 40.0%35–39 1.4 8.3% 41.7% 1.4 7.7% 53.8% 2.8 8.0% 48.0%40–44 2.8 16.7% 58.3% 0.0 0.0% 53.8% 2.8 8.0% 56.0%45–49 1.4 8.3% 66.7% 1.4 7.7% 61.5% 2.8 8.0% 64.0%50–54 1.4 8.3% 75.0% 0.0 0.0% 61.5% 1.4 4.0% 68.0%55–59 0.0 0.0% 75.0% 1.4 7.7% 69.2% 1.4 4.0% 72.0%60–64 1.4 8.3% 83.3% 2.8 15.4% 84.6% 4.3 12.0% 84.0%65–69 1.4 8.3% 91.7% 0.0 0.0% 84.6% 1.4 4.0% 88.0%70–74 1.4 8.3% 100.0% 0.0 0.0% 84.6% 1.4 4.0% 92.0%75–79 0.0 0.0% 100.0% 0.0 0.0% 84.6% 0.0 0.0% 92.0%80–84 0.0 0.0% 100.0% 0.0 0.0% 84.6% 0.0 0.0% 92.0%85–89 0.0 0.0% 100.0% 0.0 0.0% 84.6% 0.0 0.0% 92.0%90–94 0.0 0.0% 100.0% 0.0 0.0% 84.6% 0.0 0.0% 92.0%95–99 0.0 0.0% 100.0% 0.0 0.0% 84.6% 0.0 0.0% 92.0%
100–104 0.0 0.0% 100.0% 0.0 0.0% 84.6% 0.0 0.0% 92.0%Missing 0.0 0.0% 100.0% 2.8 15.4% 100.0% 2.8 8.0% 100.0%Total 17.0 100.0% 100.0% 18.4 100.0% 100.0% 35.4 100.0% 100.0%
Source ADF&G Division of Subsistence household surveys, 2015.
Age
Male Female Total
23

and 74 years old. There are approximately 6 children under the age of 10 in the community and all were female. The birthplace of household residents in Chenega Bay included several communities within and outside of Alaska. Only 18% of household heads had parents living in Chenega Bay when they were born; another 6% of household heads were born to parents from Chenega (the old village site) (Table 2-4). A similar percentage (18%) had parents living in Cordova. More household heads (35%) indicated that their parents were living elsewhere in the United States at the time of their birth than any other birthplace. Considering all residents, 28% indicated that their parents were living elsewhere in the United States when they were born, 24% in Chenega Bay, 16% in Anchorage, and 12% in Cordova (Table 2-5).
incoMe and caSh eMPloyMent
The total estimated mean household income for Chenega Bay in 2014 was $49,906 and the estimated per capita income was $23,955 (Table 1-7). The total estimated mean household income for Chenega Bay was lower than the estimated household income in Tatitlek ($63,586) and in Cordova ($86,157) (Table 1-7). In
Table 2-4.–Birthplaces of household heads, Chenega Bay, 2014.
Table 2-5.–Birthplaces of population, Chenega Bay, 2014.
Birthplace PercentageCandle 5.9%Chenega Bay 17.6%Cordova 17.6%Seward 5.9%Tatitlek 5.9%Chenega (Old Village) 5.9%
Other U.S. 35.3%Foreign 5.9%
Note "Birthplace" means the place of residence of the parents of the individual when the individual was born.
Source ADF&G Division of Subsistence household surveys, 2015.
Birthplace PercentageAnchorage 16.0%Candle 4.0%Chenega Bay 24.0%Cordova 12.0%Seward 4.0%Tatitlek 4.0%Chenega (Old Village) 4.0%
Other U.S. 28.0%Foreign 4.0%Source ADF&G Division of Subsistence household surveys, 2015.Note "Birthplace" means the place of residence of the parents of the individual when the individual was born.
24
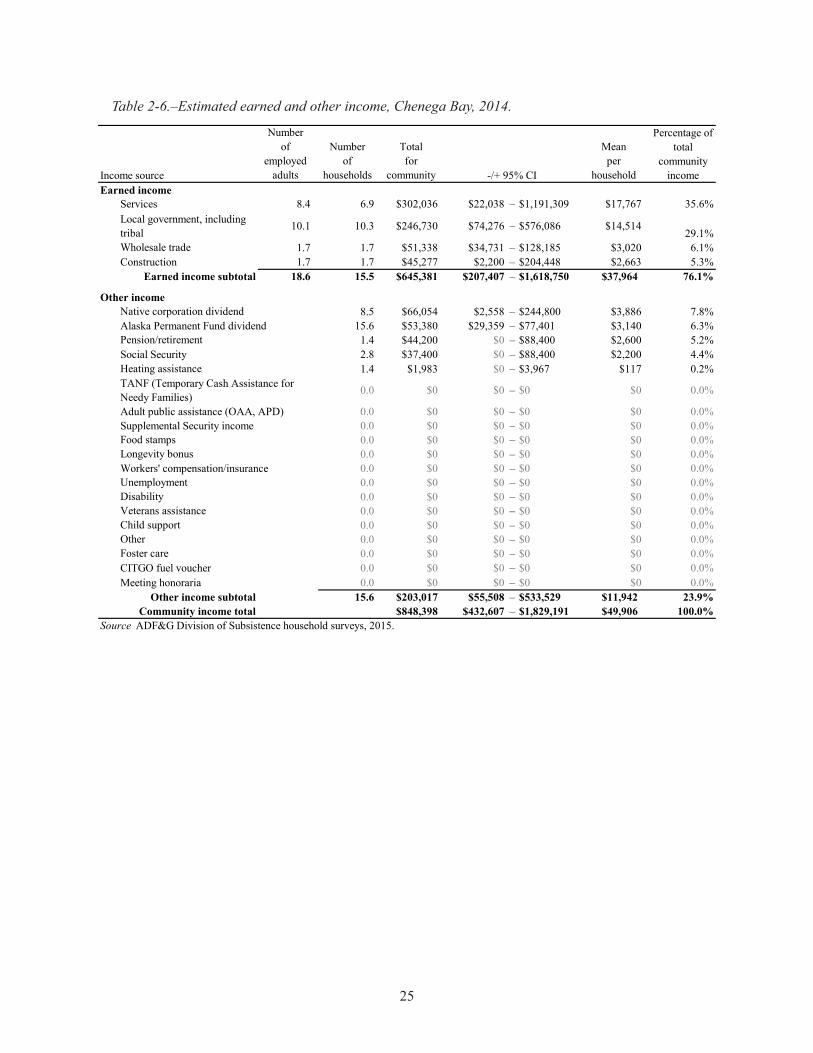
Table 2-6.–Estimated earned and other income, Chenega Bay, 2014.
Number Percentage ofof Number Total Mean total
employed of for per communityIncome source adults households community household incomeEarned income
Services 8.4 6.9 $302,036 $22,038 – $1,191,309 $17,767 35.6%Local government, including tribal 10.1 10.3 $246,730 $74,276 – $576,086 $14,514
29.1%Wholesale trade 1.7 1.7 $51,338 $34,731 – $128,185 $3,020 6.1%Construction 1.7 1.7 $45,277 $2,200 – $204,448 $2,663 5.3%
Earned income subtotal 18.6 15.5 $645,381 $207,407 – $1,618,750 $37,964 76.1%
Other incomeNative corporation dividend 8.5 $66,054 $2,558 – $244,800 $3,886 7.8%Alaska Permanent Fund dividend 15.6 $53,380 $29,359 – $77,401 $3,140 6.3%Pension/retirement 1.4 $44,200 $0 – $88,400 $2,600 5.2%Social Security 2.8 $37,400 $0 – $88,400 $2,200 4.4%Heating assistance 1.4 $1,983 $0 – $3,967 $117 0.2%
0.0 $0 $0 – $0 $0 0.0%
Adult public assistance (OAA, APD) 0.0 $0 $0 – $0 $0 0.0%Supplemental Security income 0.0 $0 $0 – $0 $0 0.0%Food stamps 0.0 $0 $0 – $0 $0 0.0%Longevity bonus 0.0 $0 $0 – $0 $0 0.0%Workers' compensation/insurance 0.0 $0 $0 – $0 $0 0.0%Unemployment 0.0 $0 $0 – $0 $0 0.0%Disability 0.0 $0 $0 – $0 $0 0.0%Veterans assistance 0.0 $0 $0 – $0 $0 0.0%Child support 0.0 $0 $0 – $0 $0 0.0%Other 0.0 $0 $0 – $0 $0 0.0%Foster care 0.0 $0 $0 – $0 $0 0.0%CITGO fuel voucher 0.0 $0 $0 – $0 $0 0.0%Meeting honoraria 0.0 $0 $0 – $0 $0 0.0%
Other income subtotal 15.6 $203,017 $55,508 – $533,529 $11,942 23.9%Community income total $848,398 $432,607 – $1,829,191 $49,906 100.0%
-/+ 95% CI
Source ADF&G Division of Subsistence household surveys, 2015.
TANF (Temporary Cash Assistance for Needy Families)
25
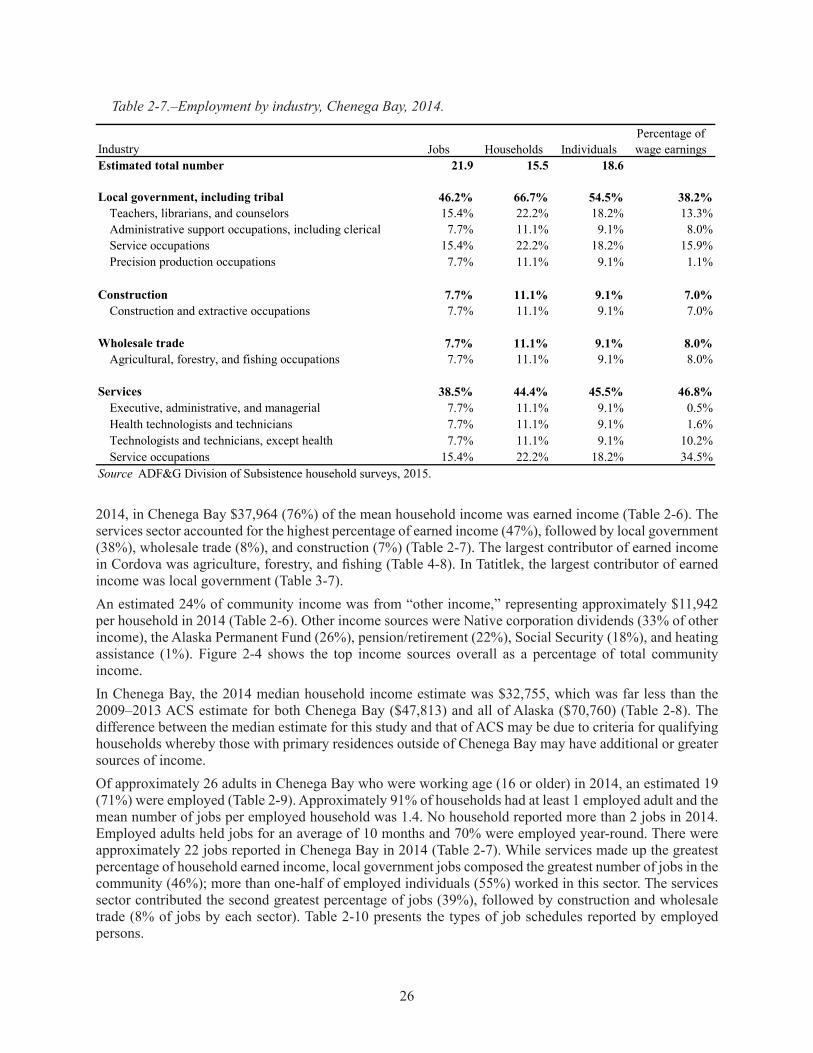
2014, in Chenega Bay $37,964 (76%) of the mean household income was earned income (Table 2-6). The services sector accounted for the highest percentage of earned income (47%), followed by local government (38%), wholesale trade (8%), and construction (7%) (Table 2-7). The largest contributor of earned income in Cordova was agriculture, forestry, and fishing (Table 4-8). In Tatitlek, the largest contributor of earned income was local government (Table 3-7).An estimated 24% of community income was from “other income,” representing approximately $11,942 per household in 2014 (Table 2-6). Other income sources were Native corporation dividends (33% of other income), the Alaska Permanent Fund (26%), pension/retirement (22%), Social Security (18%), and heating assistance (1%). Figure 2-4 shows the top income sources overall as a percentage of total community income.In Chenega Bay, the 2014 median household income estimate was $32,755, which was far less than the 2009–2013 ACS estimate for both Chenega Bay ($47,813) and all of Alaska ($70,760) (Table 2-8). The difference between the median estimate for this study and that of ACS may be due to criteria for qualifying households whereby those with primary residences outside of Chenega Bay may have additional or greater sources of income.Of approximately 26 adults in Chenega Bay who were working age (16 or older) in 2014, an estimated 19 (71%) were employed (Table 2-9). Approximately 91% of households had at least 1 employed adult and the mean number of jobs per employed household was 1.4. No household reported more than 2 jobs in 2014. Employed adults held jobs for an average of 10 months and 70% were employed year-round. There were approximately 22 jobs reported in Chenega Bay in 2014 (Table 2-7). While services made up the greatest percentage of household earned income, local government jobs composed the greatest number of jobs in the community (46%); more than one-half of employed individuals (55%) worked in this sector. The services sector contributed the second greatest percentage of jobs (39%), followed by construction and wholesale trade (8% of jobs by each sector). Table 2-10 presents the types of job schedules reported by employed persons.
Table 2-7.–Employment by industry, Chenega Bay, 2014.
Jobs Households IndividualsPercentage of wage earnings
21.9 15.5 18.6
46.2% 66.7% 54.5% 38.2%Teachers, librarians, and counselors 15.4% 22.2% 18.2% 13.3%Administrative support occupations, including clerical 7.7% 11.1% 9.1% 8.0%Service occupations 15.4% 22.2% 18.2% 15.9%Precision production occupations 7.7% 11.1% 9.1% 1.1%
7.7% 11.1% 9.1% 7.0%Construction and extractive occupations 7.7% 11.1% 9.1% 7.0%
7.7% 11.1% 9.1% 8.0%Agricultural, forestry, and fishing occupations 7.7% 11.1% 9.1% 8.0%
38.5% 44.4% 45.5% 46.8%Executive, administrative, and managerial 7.7% 11.1% 9.1% 0.5%Health technologists and technicians 7.7% 11.1% 9.1% 1.6%Technologists and technicians, except health 7.7% 11.1% 9.1% 10.2%Service occupations 15.4% 22.2% 18.2% 34.5%
Construction
Wholesale trade
Source ADF&G Division of Subsistence household surveys, 2015.
Estimated total numberIndustry
Local government, including tribal
Services
26
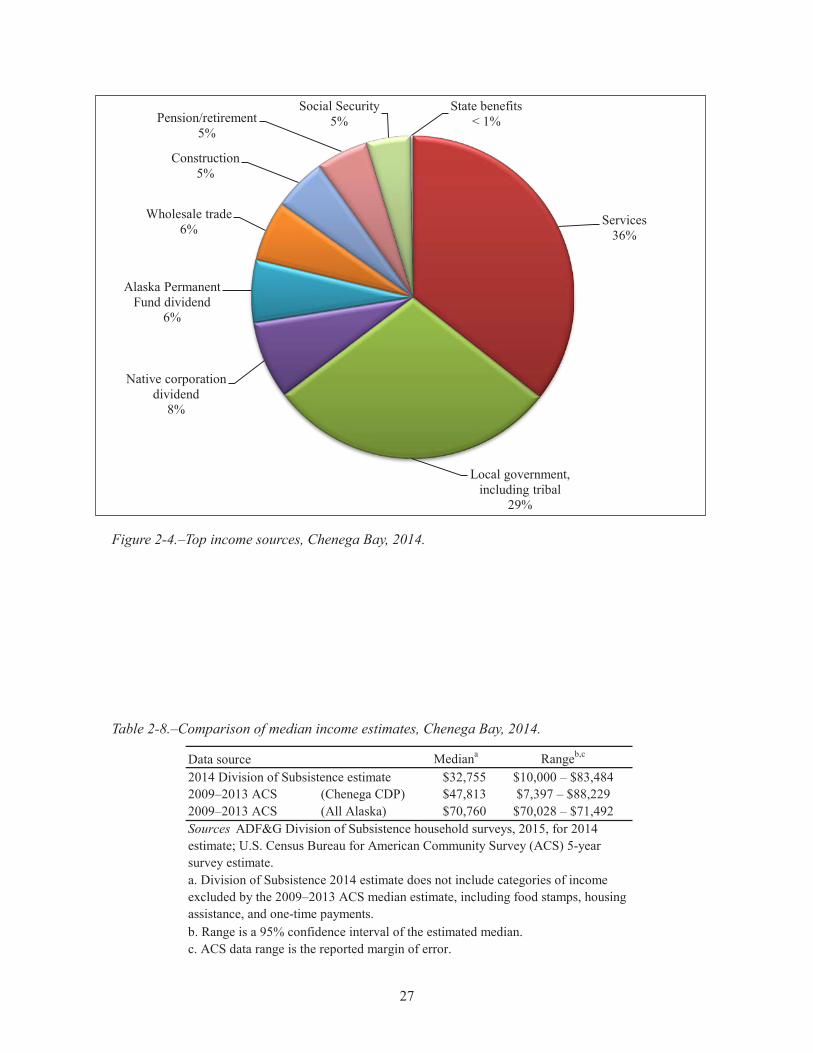
Figure 2-4.–Top income sources, Chenega Bay, 2014.
Services36%
Local government, including tribal
29%
Native corporation dividend
8%
Alaska Permanent Fund dividend
6%
Wholesale trade6%
Construction5%
Pension/retirement5%
Social Security5%
State benefits< 1%
Table 2-8.–Comparison of median income estimates, Chenega Bay, 2014.
Data source Mediana Rangeb,c
2014 Division of Subsistence estimate $32,755 $10,000 – $83,4842009–2013 ACS (Chenega CDP) $47,813 $7,397 – $88,2292009–2013 ACS (All Alaska) $70,760 $70,028 – $71,492
c. ACS data range is the reported margin of error.b. Range is a 95% confidence interval of the estimated median.
a. Division of Subsistence 2014 estimate does not include categories of income excluded by the 2009–2013 ACS median estimate, including food stamps, housing assistance, and one-time payments.
Sources ADF&G Division of Subsistence household surveys, 2015, for 2014 estimate; U.S. Census Bureau for American Community Survey (ACS) 5-year survey estimate.
27

Table 2-9.–Employment characteristics, Chenega Bay, 2014.
CommunityChenega Bay
26.231.7
18.670.9%
21.91.2
12
10.34
1270.0%
44.6
17
15.590.9%
1.412
1.21.1
12
48.7
Characteristic
Source ADF&G Division of Subsistence household surveys, 2015.
All adultsNumberMean weeks employed
Employed adultsNumber
Households
Mean
MeanMinimum
PercentageJobs per employed household
MaximumPercentage employed year-round
MaximumEmployed adults
MeanMinimum
PercentageJobs
Number
Mean person-weeks of employment
MinimumMaximum
Minimum
Total households
NumberEmployed
MeanEmployed households
Months employedMaximum
Number
Mean weeks employed
28

Respondents in Chenega Bay expressed mixed opinions about the importance of commercial fishing to the community. Few if any residents of the community participate in commercial fisheries today, though some did in the past. Many respondents expressed dismay that younger residents are not participating in the industry because they are disinterested or “lazy.” The community’s current relationship with the commercial fishing community is strained. Many residents mentioned that they were concerned about what they perceived to be negative behavior and activities of commercial fishermen, as well as litter and hazardous materials (such as sealed containers of oil) left in Chenega Bay; there is particular concern for the effects these activities could have on local children. Conversely, the arrival of commercial fishing vessels is a welcomed economic opportunity that allows for the sale of goods, lodging, and transportation.
Food Security
Survey respondents were asked a set of questions intended to assess their household’s food security, defined as, “access by all people at all times to enough food for an active, healthy life” (Coleman-Jensen et al. 2012). The food security questions were modeled after those developed by the U.S. Department of Agriculture (USDA) but modified by ADF&G to account for differences in access to subsistence and store-bought foods. Based on the aggregated number of affirmative responses to these questions, households were broadly categorized as being food secure or food insecure following a USDA protocol (Bickel et al. 2000). Food secure households were broken down further into 2 subcategories: high or marginal food security. Food insecure households were divided into 2 subcategories: low or very low food security.Households with a high or marginal level of food security reported 1 or 2 instances of food access problems or limitations—typically anxiety over food sufficiency or a shortage of particular foods in the house—but gave little or no indication of changes in diets or food intake. Households with low food security reported reduced quality, variety, or desirability of their diet, but they, too, gave little indication of reduced food intake. Households classified as having very low food security were those that reported multiple instances of disrupted eating patterns and reduced food intake (Coleman-Jensen et al. 2012).Affirmative responses from Chenega Bay residents indicating the severity of household food insecurity during 2014 are summarized in Figure 2-5. For the 2014 study year, the most frequently experienced food insecure situation was a lack of resources to get the kinds of foods respondents wanted to eat (33%). In this case, “resources” include what is needed to hunt, fish, and gather food, or the income necessary to purchase food. The next 2 most commonly experienced food insecure situations were that residents worried about having enough food (25%), and that food did not last and they could not get more (17%). Indicating a more severe level of food insecurity, equal percentages of households indicated that in 2014 household members had eaten less than they felt they should (9%), and that they were hungry but did not eat (9%).
Table 2-10.–Reported job schedules, Chenega Bay, 2014.
Number Percentage Number Percentage Number PercentageFull time 11.8 53.8% 11.8 63.6% 8.6 55.6%Part time 6.8 30.8% 6.8 36.4% 6.9 44.4%Shift 0.0 0.0% 0.0 0.0% 0.0 0.0%On-call (occasional) 1.7 7.7% 1.7 9.1% 1.7 11.1%Part-time shift 0.0 0.0% 0.0 0.0% 0.0 0.0%Schedule not reported 1.7 7.7% 1.7 9.1% 1.7 11.1%
Note Respondents who had more than 1 job in the study year could provide multiple responses, so the percentages may sum to more than 100%.
Schedule
Source ADF&G Division of Subsistence household surveys, 2015.
Jobs Employed persons Employed households
29

25%
33%
17%
0%
9%
9%
0%
0%
0%25%
0% 20% 40% 60% 80% 100%
Worried about having enough food
Lacked resources to get food
Food (subsistence) did not last
Food (store-bought) did not last
Food did not last, could not get more
Cut size of meals or skipped meals
Ate less than we felt we should
Hungry but did not eat
Lost weight, not enough food
Did not eat for a whole day
Percentage of housheolds reporting conditionResponses used to calculate households' food security category
Responses to additional questions asked in this study*
* Due to interview procedure error, not all respondents were asked the additional questions. Regarding respondents who did not experience the food insecure condition "food did not last, could not get more,"some were asked the additional questions about whether subsistence and store-bought foods did not last,
Figure 2-5.–Responses to questions about food insecure conditions, Chenega Bay, 2014.
No respondents reported cutting the size of, or skipping, meals, losing weight due to a lack of food, or not eating for a whole day, which would indicate very low food security. For this study, additional questions asked were designed to determine whether food insecurities, if any, were related to subsistence foods or store-bought foods. No households indicated that subsistence foods did not last, but 25% indicated store-bought foods did not last. Note that during survey administration, due to interviewer error, not all respondents were asked these additional questions and the responses in Figure 2-5 are not a full representation of these conditions experienced by surveyed Chenega Bay households.Overall, residents of Chenega Bay experienced high levels of food security in 2014; 92% of households were food secure (Figure 2-6). Most households responded affirmatively to experiencing 2 or fewer food insecurity situations identified in the survey. The remaining 8% of households experienced low food security, indicating that they responded affirmatively to experiencing anywhere from 2 to 5 food insecurity situations. No households indicated that they were experiencing very low food security, which would have been demonstrated by the household experiencing 6 or more food insecurity situations. Comparatively, food security is higher in Chenega Bay than for the state of Alaska and the United States as a whole (Figure 2-6). In Alaska, 84% of households from 2011–2013 experienced high or marginal levels of food security, 12% experienced low food security, and 5% experienced very low food security. The food security of households in Alaska is similar overall to households across the United States.
30

Figure 2-6.–Comparison of food security categories, Chenega Bay, Alaska, and United States, 2014.
92%84% 80%
8%12% 15%
5% 6%
0%
10%
20%
30%
40%
50%
60%
70%
80%
90%
100%
Chenega Bay2014
(this study)
Alaska 2013(USDA)*
United States2013 (USDA)
Perc
enta
ge o
f hou
seho
lds
INSECURE–Very low food security
INSECURE–Low food security
SECURE–High and marginal food security
* Average, 2011–2013.
Figure 2-7 portrays the mean number of food insecure conditions experienced per household by food security category by month. Figure 2-8 shows the months that households reported foods not lasting. Those households that experienced food insecure circumstances were asked to indicate in which months these situations applied. Those households categorized as food insecure did not experience any fluctuation in their level of food security; an average of 5 food insecure conditions were experienced throughout the entire year (Figure 2-7). Similarly, those households that experienced a shortage of store-bought foods did so throughout the year, unrelated to a particular season (Figure 2-8).There was concern among some residents regarding the availability of store-bought foods. Regional air taxi services and the Alaska Marine Highway System provide regularly scheduled flights and sailings to the community, but poor weather frequently delays these services, sometimes for many days. Many residents mentioned dismay about aerial shipping costs, and they are very appreciative of their occasional access to the ferry, which provides a cheaper alternative. For transportation purposes, the ferries are also considered more reliable. Unfortunately, residents fear an end of access to the ferry due to state budget cuts and sailing route changes. During a food shortage, many residents indicated that local wild foods would be available if necessary.
31

Figure 2-7.–Mean number of food insecure conditions by month and by household food security category, Chenega Bay, 2014.
0
1
2
3
4
5
6
Jan Feb Mar Apr May Jun Jul Aug Sep Oct Nov Dec
Mea
n co
nditi
ons p
er h
ouse
hold
Month
SECURE–High and marginal food security INSECURE–Low food security INSECURE–Very low food security
INSECURE
SECURE
Figure 2-8.–Comparison of months when food did not last, Chenega Bay, 2014.
0%2%4%6%8%
10%12%14%16%18%
Jan Feb Mar Apr May Jun Jul Aug Sep Oct Nov Dec
Perc
enta
ge o
f hou
seho
lds
Month
Any food Subsistence foods Store-bought foods
Note Data for "Any food" are not visible because values mirror data for "Store-bought foods."
32

SuMMary oF harveSt and uSe PatternS
Individual Participation in the Harvesting and Processing of Wild ResourcesTable 2-11 reports the expanded levels of individual participation in the harvest and processing of wild resources by Chenega Bay residents in 2014. Approximately 80% of individuals harvested at least 1 resource and an equal number participated in processing at least 1 resource; participation in processing resources was higher in 2014 than in 2003 when 69% of individuals processed any resource (Fall 2006:17). By category, participation in harvesting resources in 2014 was highest for vegetation (68%), followed by fish (64%), large land mammals (40%), birds and eggs (28%), small land mammals (20%), and marine mammals (8%). Some resource categories had a greater percentage of individuals participating in harvesting as compared to processing resources, including both large land mammals (40% harvesting; 32% processing) and marine mammals (8% harvesting; 4% processing). Only birds and eggs had a greater percentage of individuals processing (32%) than harvesting (28%) resources.The overall participation in attempting to harvest at least 1 resource was very similar for 2003 and 2014 (78% and 80% of individuals participated, respectively) (Table 2-11) (Fall 2006:17). However, a smaller percentage of individuals hunted and processed large land mammals in 2014 (40% and 32%, respectively) compared to the percentage that hunted and processed game in 2003 (44% and 58%). In 2003, a lower percentage of individuals attempted harvests of fish, furbearers, and plants compared to 2014. Participation in the harvest of furbearers rose more significantly than for other resource categories: in 2003 approximately 9% of individuals hunted/trapped these resources and in 2014 participation increased to 20%. Participation in hunting, fishing, and gathering may be on the rise as fears pertaining to the safety of wild food resources and the sustainability of wild food populations subside (see Table 2-29 and Table 2-31 for more information about community members’ assessments of the safety of wild food resources and recovery of population stocks).
Harvest and Use of Wild Resources at the Household LevelFigure 2-9 shows by resource category the percentages of households that used wild resources, and also attempted to harvest and harvested wild foods. Salmon, nonsalmon fish, and vegetation were used by the greatest percentage of households (92%), followed by large land mammals (75%), marine invertebrates (67%), marine mammals (50%), birds and eggs (50%), and small land mammals (17%). For all resource categories except small land mammals, the percentage of households using the resources was substantially higher than those harvesting the resources, indicating the presence of sharing networks. The resource category with the highest percentage of households harvesting the resource was vegetation (67%), followed by nonsalmon fish (58%), salmon (50%), birds and eggs (33%), marine invertebrates (33%), large land mammals (25%), small land mammals (17%), and marine mammals (8%). Not all households that attempted to harvest individual species from the resource categories were successful; this is true for salmon, large land mammals, marine mammals, and vegetation.Table 2-12 summarizes resource harvest and use characteristics for Chenega Bay in 2014 at the household level. The average harvest was 531 lb usable weight per household. During the study year, community households harvested an average of 11 kinds of resources and used an average of 18 kinds of resources; this is reduced from 2003 when households harvested an average of 13 wild resources and used 24 different resources (Fall 2006:18). The maximum number of resources used by any household in 2014 was 55. In addition, households gave away an average of 5 kinds of resources and received an average of 8 kinds of resources; this is also reduced from 2003 when an average of 13 resources were given away and 20 resources were received (Fall 2006:18). Overall, as many as 162 species were available for households to harvest in the study area in 2014; this included species that survey respondents identified but were not asked about in the survey instrument.
33
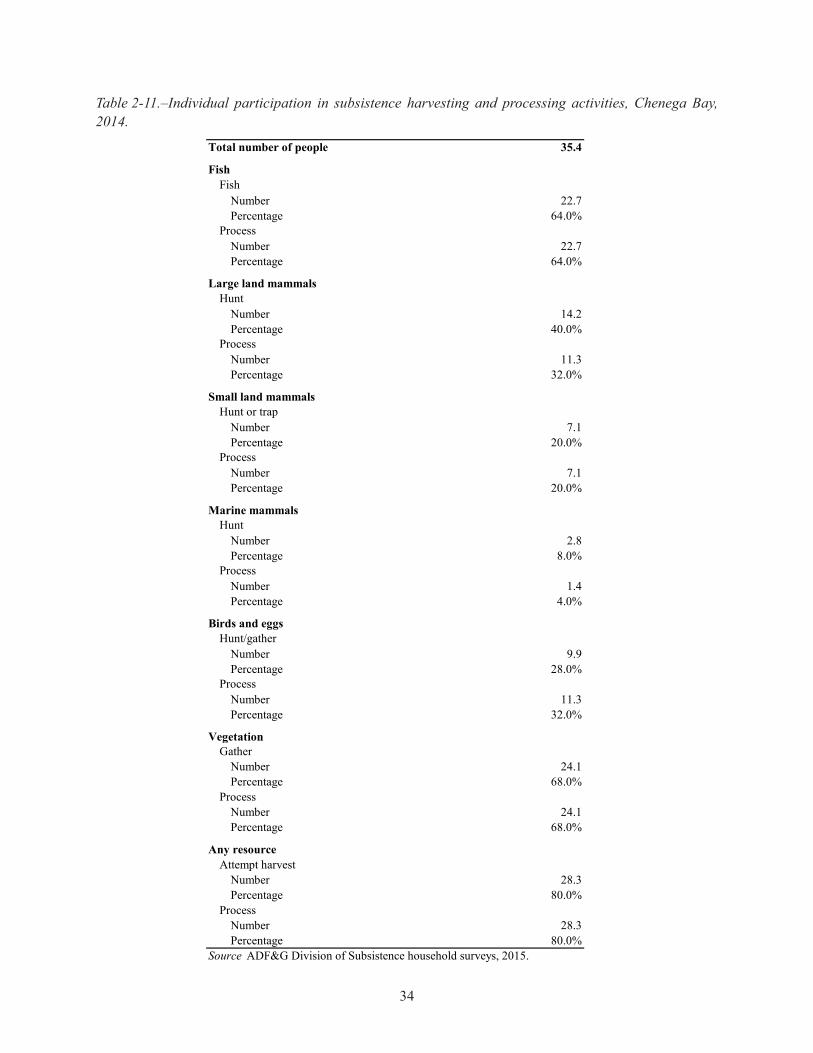
Table 2-11.–Individual participation in subsistence harvesting and processing activities, Chenega Bay, 2014.
35.4
Number 22.7Percentage 64.0%
Number 22.7Percentage 64.0%
Number 14.2Percentage 40.0%
Number 11.3Percentage 32.0%
Number 7.1Percentage 20.0%
Number 7.1Percentage 20.0%
Marine mammals
Number 2.8Percentage 8.0%
Number 1.4Percentage 4.0%
Number 9.9Percentage 28.0%
Number 11.3Percentage 32.0%
Number 24.1Percentage 68.0%
Number 24.1Percentage 68.0%
Number 28.3Percentage 80.0%
Number 28.3Percentage 80.0%
Process
Gather
Source ADF&G Division of Subsistence household surveys, 2015.
Process
Total number of people
Birds and eggs
Fish
Large land mammalsHunt
Process
Process
Attempt harvest
Small land mammals
Vegetation
Any resource
Process
Fish
Process
Hunt
Hunt/gather
Process
Hunt or trap
34

Figure 2-9.–Percentages of households using, attempting to harvest, and harvesting wild resources, by resource category, Chenega Bay, 2014.
92% 92%
75%
17%
50% 50%
67%
92%
58% 58%
33%
17%
33% 33%
75%
50%
25%
8%
67%
0%
10%
20%
30%
40%
50%
60%
70%
80%
90%
100%Pe
rcen
tage
of h
ouse
hold
s
Percent of households using Percent of households attempting harvestPercent of households harvesting
Two households (one with members identifying as Alaska Native and one with members identifying as non-Alaska Native) were identified as high subsistence harvesters in the community, and both share a considerable amount of wild foods with the community at large. Sharing of wild foods is considered important in Chenega Bay, and, for many, receipt of wild foods from these households is their primary access to local wild foods annually. Many respondents commented that subsistence resources are generally abundant in Chenega Bay but that the lack of participation among recent generations has limited the overall harvest.
harveSt QuantitieS and coMPoSition
Table 2-13 reports estimated wild resource harvests and uses by Chenega Bay residents in 2014 and is organized first by general category and then by species. All edible resources are reported in pounds usable weight (see Appendix B for conversion factors4). The harvest category includes resources harvested by any member of the surveyed household during the study year. The use category includes all resources taken, given away, or used by a household, and resources acquired from other harvesters, either as gifts, by barter or trade, through hunting partnerships, or as meat given by hunting guides and non-local hunters. Purchased foods are not included, but resources such as small land mammals collected for fur are included because they are an important part of the subsistence way of life. Differences between harvest and use percentages reflect sharing among households, which results in a wider distribution of wild foods.
4. Resources that are not eaten, such as firewood and some furbearers, are included in the table but are given a conversion factor of zero.
35

Table 2-12.–Resource harvest and use characteristics, Chenega Bay, 2014.
18.0Minimum 2Maximum 5595% confidence limit (±) 29%Median 12
12.7Minimum 0Maximum 5395% confidence limit (±) 43.4%Median 5.5
11.4Minimum 0Maximum 4995% confidence limit (±) 44.5%Median 5.5
8.1Minimum 1Maximum 2595% confidence limit (±) 28.7%Median 5
5.2Minimum 0Maximum 2795% confidence limit (±) 52.7%Median 3
Minimum 0Maximum 2,534Mean 530.5Median 146
9,018.6254.6
100.0%83.3%75.0%
100.0%66.7%
12
162
Mean number of resources used per household
Mean number of resources attempted to harvest per household
Mean number of resources harvested per household
Mean number of resources received per household
Characteristic
Percentage using any resourcePercentage attempting to harvest any resourcePercentage harvesting any resource
Mean number of resources given away per household
Source ADF&G Division of Subsistence household surveys, 2015.
Percentage receiving any resourcePercentage giving away any resourceNumber of households in sampleNumber of resources asked about and identified voluntarily by respondents
Household harvest (pounds)
Total harvest weight (lb)Community per capita harvest (lb)
36

Table 2-13.–Estimated uses and harvests of fish, game, and vegetation resources, Chenega Bay, 2014.
Use%
Attempt %
Harvest %
Receive %
Give % Total
Mean per household Per capita Total Unit
Mean per household
All resources 100.0 83.3 75.0 100.0 66.7 9,018.6 530.5 254.6 9,018.6 lb 530.5 54.5Salmon 91.7 58.3 50.0 83.3 50.0 4,489.7 264.1 126.8 4,489.7 lb 264.1 60.4
Chum salmon 50.0 41.7 41.7 8.3 8.3 1,094.4 64.4 30.9 194.1 ind 11.4 70.8 Coho salmon 75.0 50.0 50.0 41.7 33.3 566.6 33.3 16.0 93.5 ind 5.5 53.4 Chinook salmon 66.7 41.7 25.0 41.7 25.0 216.5 12.7 6.1 17.0 ind 1.0 98.6 Pink salmon 50.0 41.7 41.7 8.3 0.0 442.6 26.0 12.5 179.9 ind 10.6 65.1 Sockeye salmon 91.7 50.0 41.7 75.0 33.3 2,169.6 127.6 61.3 494.4 ind 29.1 70.9 Landlocked salmon 0.0 0.0 0.0 0.0 0.0 0.0 0.0 0.0 0.0 ind 0.0 0.0 Unknown salmon 0.0 0.0 0.0 0.0 0.0 0.0 0.0 0.0 0.0 ind 0.0 0.0
Nonsalmon fish 91.7 58.3 58.3 83.3 41.7 1,879.9 110.6 53.1 1,879.9 lb 110.6 60.0 Pacific herring 16.7 8.3 8.3 8.3 0.0 102.0 6.0 2.9 17.0 gal 1.0 119.4 Pacific herring roe/unspecified 25.0 0.0 0.0 25.0 8.3 0.0 0.0 0.0 0.0 gal 0.0 0.0
Pacific herring sac roe 0.0 0.0 0.0 0.0 0.0 0.0 0.0 0.0 0.0 gal 0.0 0.0 Pacific herring spawn on kelp
0.0 0.0 0.0 0.0 0.0 0.0 0.0 0.0 0.0 gal 0.0 0.0
Eulachon (hooligan, candlefish)
8.3 0.0 0.0 8.3 0.0 0.0 0.0 0.0 0.0 gal 0.0 0.0
Unknown smelt 0.0 0.0 0.0 0.0 0.0 0.0 0.0 0.0 0.0 gal 0.0 0.0 Sea bass 0.0 0.0 0.0 0.0 0.0 0.0 0.0 0.0 0.0 ind 0.0 0.0 Pacific (gray) cod 0.0 0.0 0.0 0.0 0.0 0.0 0.0 0.0 0.0 ind 0.0 0.0 Pacific tomcod 0.0 0.0 0.0 0.0 0.0 0.0 0.0 0.0 0.0 ind 0.0 0.0 Walleye pollock (whiting)
0.0 0.0 0.0 0.0 0.0 0.0 0.0 0.0 0.0 ind 0.0 0.0
Eel 0.0 0.0 0.0 0.0 0.0 0.0 0.0 0.0 0.0 ind 0.0 0.0 Starry flounder 0.0 0.0 0.0 0.0 0.0 0.0 0.0 0.0 0.0 ind 0.0 0.0 Unknown flounder 0.0 0.0 0.0 0.0 0.0 0.0 0.0 0.0 0.0 ind 0.0 0.0 Lingcod 16.7 8.3 8.3 8.3 8.3 34.0 2.0 1.0 8.5 ind 0.5 119.4 Unknown greenling 25.0 16.7 16.7 16.7 8.3 51.0 3.0 1.4 51.0 ind 3.0 85.7 Pacific halibut 83.3 41.7 41.7 66.7 41.7 1,055.7 62.1 29.8 1,055.7 lb 62.1 65.0 Black rockfish 33.3 25.0 25.0 16.7 16.7 255.0 15.0 7.2 170.0 ind 10.0 73.5 Red rockfish 0.0 0.0 0.0 0.0 0.0 0.0 0.0 0.0 0.0 ind 0.0 0.0 Yelloweye rockfish 16.7 8.3 8.3 8.3 8.3 113.3 6.7 3.2 28.3 ind 1.7 119.4 Quillback rockfish 25.0 16.7 16.7 16.7 8.3 119.0 7.0 3.4 29.8 ind 1.8 113.3
Percentage of households Harvest weight (lb) Harvest amount
Resource
95% confidence
limit (±)harvest
-continued-
37

Use%
Attempt %
Harvest %
Receive %
Give % Total
Mean per household Per capita Total Unit
Mean per household
Dusky rockfish 8.3 8.3 8.3 0.0 8.3 17.0 1.0 0.5 17.0 ind 1.0 119.4 Tiger rockfish 8.3 8.3 8.3 0.0 8.3 8.5 0.5 0.2 8.5 ind 0.5 119.4 China rockfish 8.3 8.3 8.3 0.0 8.3 17.0 1.0 0.5 17.0 ind 1.0 119.4 Northern rockfish 8.3 8.3 8.3 0.0 8.3 4.3 0.3 0.1 4.3 ind 0.3 119.4 Boccaccio rockfish 8.3 8.3 8.3 0.0 8.3 21.3 1.3 0.6 21.3 ind 1.3 119.4 Unknown rockfish 33.3 16.7 16.7 25.0 0.0 45.2 2.7 1.3 24.1 ind 1.4 105.0 Sablefish (black cod) 0.0 0.0 0.0 0.0 0.0 0.0 0.0 0.0 0.0 ind 0.0 0.0 Unknown Irish lord 0.0 0.0 0.0 0.0 0.0 0.0 0.0 0.0 0.0 ind 0.0 0.0 Unknown sculpin 0.0 0.0 0.0 0.0 0.0 0.0 0.0 0.0 0.0 ind 0.0 0.0 Unknown shark 0.0 0.0 0.0 0.0 0.0 0.0 0.0 0.0 0.0 ind 0.0 0.0 Skates 0.0 0.0 0.0 0.0 0.0 0.0 0.0 0.0 0.0 ind 0.0 0.0 Unknown sole 0.0 0.0 0.0 0.0 0.0 0.0 0.0 0.0 0.0 ind 0.0 0.0 Wolffish 0.0 0.0 0.0 0.0 0.0 0.0 0.0 0.0 0.0 ind 0.0 0.0 Dolly Varden 25.0 16.7 16.7 16.7 8.3 21.8 1.3 0.6 15.6 ind 0.9 89.9 Lake trout 0.0 0.0 0.0 0.0 0.0 0.0 0.0 0.0 0.0 ind 0.0 0.0 Arctic grayling 8.3 8.3 8.3 0.0 8.3 14.9 0.9 0.4 21.3 ind 1.3 119.4 Northern pike 0.0 0.0 0.0 0.0 0.0 0.0 0.0 0.0 0.0 ind 0.0 0.0 Unknown sturgeon 0.0 0.0 0.0 0.0 0.0 0.0 0.0 0.0 0.0 ind 0.0 0.0 Cutthroat trout 0.0 0.0 0.0 0.0 0.0 0.0 0.0 0.0 0.0 ind 0.0 0.0 Rainbow trout 0.0 0.0 0.0 0.0 0.0 0.0 0.0 0.0 0.0 ind 0.0 0.0 Steelhead 0.0 0.0 0.0 0.0 0.0 0.0 0.0 0.0 0.0 ind 0.0 0.0 Unknown whitefishes 0.0 0.0 0.0 0.0 0.0 0.0 0.0 0.0 0.0 ind 0.0 0.0
Large land mammals 75.0 33.3 25.0 66.7 25.0 1,378.7 81.1 38.9 1,378.7 lb 81.1 84.3 Black bear 25.0 25.0 16.7 8.3 8.3 246.5 14.5 7.0 4.3 ind 0.3 85.7 Caribou 8.3 0.0 0.0 8.3 0.0 0.0 0.0 0.0 0.0 ind 0.0 0.0 Deer 75.0 25.0 16.7 66.7 25.0 367.2 21.6 10.4 8.5 ind 0.5 80.5 Mountain goat 0.0 8.3 0.0 0.0 0.0 0.0 0.0 0.0 0.0 ind 0.0 0.0 Moose 33.3 16.7 8.3 25.0 8.3 765.0 45.0 21.6 1.4 ind 0.1 119.4 Dall sheep 0.0 8.3 0.0 0.0 0.0 0.0 0.0 0.0 0.0 ind 0.0 0.0
Table 2-13.–Page 2 of 6.
Resource
Percentage of households Harvest weight (lb) Harvest amount 95% confidence
limit (±)harvest
-continued-
Nonsalmon fish, continued
38
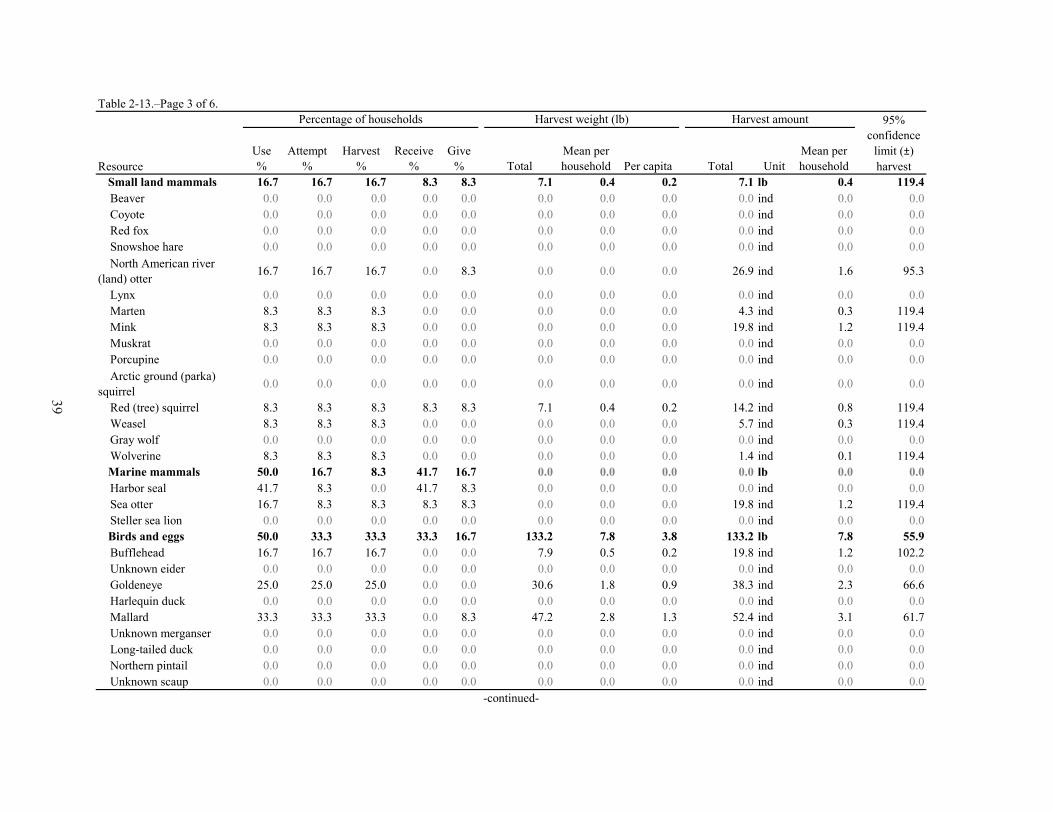
Use%
Attempt %
Harvest %
Receive %
Give % Total
Mean per household Per capita Total Unit
Mean per household
Small land mammals 16.7 16.7 16.7 8.3 8.3 7.1 0.4 0.2 7.1 lb 0.4 119.4 Beaver 0.0 0.0 0.0 0.0 0.0 0.0 0.0 0.0 0.0 ind 0.0 0.0 Coyote 0.0 0.0 0.0 0.0 0.0 0.0 0.0 0.0 0.0 ind 0.0 0.0 Red fox 0.0 0.0 0.0 0.0 0.0 0.0 0.0 0.0 0.0 ind 0.0 0.0 Snowshoe hare 0.0 0.0 0.0 0.0 0.0 0.0 0.0 0.0 0.0 ind 0.0 0.0 North American river (land) otter 16.7 16.7 16.7 0.0 8.3 0.0 0.0 0.0 26.9 ind 1.6 95.3
Lynx 0.0 0.0 0.0 0.0 0.0 0.0 0.0 0.0 0.0 ind 0.0 0.0 Marten 8.3 8.3 8.3 0.0 0.0 0.0 0.0 0.0 4.3 ind 0.3 119.4 Mink 8.3 8.3 8.3 0.0 0.0 0.0 0.0 0.0 19.8 ind 1.2 119.4 Muskrat 0.0 0.0 0.0 0.0 0.0 0.0 0.0 0.0 0.0 ind 0.0 0.0 Porcupine 0.0 0.0 0.0 0.0 0.0 0.0 0.0 0.0 0.0 ind 0.0 0.0 Arctic ground (parka) squirrel 0.0 0.0 0.0 0.0 0.0 0.0 0.0 0.0 0.0 ind 0.0 0.0
Red (tree) squirrel 8.3 8.3 8.3 8.3 8.3 7.1 0.4 0.2 14.2 ind 0.8 119.4 Weasel 8.3 8.3 8.3 0.0 0.0 0.0 0.0 0.0 5.7 ind 0.3 119.4 Gray wolf 0.0 0.0 0.0 0.0 0.0 0.0 0.0 0.0 0.0 ind 0.0 0.0 Wolverine 8.3 8.3 8.3 0.0 0.0 0.0 0.0 0.0 1.4 ind 0.1 119.4
Marine mammals 50.0 16.7 8.3 41.7 16.7 0.0 0.0 0.0 0.0 lb 0.0 0.0 Harbor seal 41.7 8.3 0.0 41.7 8.3 0.0 0.0 0.0 0.0 ind 0.0 0.0 Sea otter 16.7 8.3 8.3 8.3 8.3 0.0 0.0 0.0 19.8 ind 1.2 119.4 Steller sea lion 0.0 0.0 0.0 0.0 0.0 0.0 0.0 0.0 0.0 ind 0.0 0.0
Birds and eggs 50.0 33.3 33.3 33.3 16.7 133.2 7.8 3.8 133.2 lb 7.8 55.9 Bufflehead 16.7 16.7 16.7 0.0 0.0 7.9 0.5 0.2 19.8 ind 1.2 102.2 Unknown eider 0.0 0.0 0.0 0.0 0.0 0.0 0.0 0.0 0.0 ind 0.0 0.0 Goldeneye 25.0 25.0 25.0 0.0 0.0 30.6 1.8 0.9 38.3 ind 2.3 66.6 Harlequin duck 0.0 0.0 0.0 0.0 0.0 0.0 0.0 0.0 0.0 ind 0.0 0.0 Mallard 33.3 33.3 33.3 0.0 8.3 47.2 2.8 1.3 52.4 ind 3.1 61.7 Unknown merganser 0.0 0.0 0.0 0.0 0.0 0.0 0.0 0.0 0.0 ind 0.0 0.0 Long-tailed duck 0.0 0.0 0.0 0.0 0.0 0.0 0.0 0.0 0.0 ind 0.0 0.0 Northern pintail 0.0 0.0 0.0 0.0 0.0 0.0 0.0 0.0 0.0 ind 0.0 0.0 Unknown scaup 0.0 0.0 0.0 0.0 0.0 0.0 0.0 0.0 0.0 ind 0.0 0.0
Table 2-13.–Page 3 of 6.
Resource
Percentage of households Harvest weight (lb) Harvest amount 95% confidence
limit (±)harvest
-continued-
39

Use%
Attempt %
Harvest %
Receive %
Give % Total
Mean per household Per capita Total Unit
Mean per household
Black scoter 0.0 0.0 0.0 0.0 0.0 0.0 0.0 0.0 0.0 ind 0.0 0.0 Surf scoter 0.0 0.0 0.0 0.0 0.0 0.0 0.0 0.0 0.0 ind 0.0 0.0 White-winged scoter 0.0 0.0 0.0 0.0 0.0 0.0 0.0 0.0 0.0 ind 0.0 0.0 Northern shoveler 0.0 0.0 0.0 0.0 0.0 0.0 0.0 0.0 0.0 ind 0.0 0.0 Unknown teal 0.0 0.0 0.0 0.0 0.0 0.0 0.0 0.0 0.0 ind 0.0 0.0 Unknown wigeon 0.0 8.3 0.0 0.0 0.0 0.0 0.0 0.0 0.0 ind 0.0 0.0 Unknown ducks 8.3 8.3 8.3 0.0 8.3 16.5 1.0 0.5 21.3 ind 1.3 119.4 Unknown Canada/cackling geese 16.7 8.3 8.3 16.7 0.0 5.1 0.3 0.1 4.3 ind 0.3 119.4
White-fronted goose 8.3 8.3 8.3 0.0 0.0 6.8 0.4 0.2 2.8 ind 0.2 119.4 Sandhill crane 0.0 0.0 0.0 0.0 0.0 0.0 0.0 0.0 0.0 ind 0.0 0.0 Unknown cormorant 0.0 0.0 0.0 0.0 0.0 0.0 0.0 0.0 0.0 ind 0.0 0.0 Unknown gull 0.0 0.0 0.0 0.0 0.0 0.0 0.0 0.0 0.0 ind 0.0 0.0 Black-legged kittiwake 0.0 0.0 0.0 0.0 0.0 0.0 0.0 0.0 0.0 ind 0.0 0.0 Unknown murre 0.0 0.0 0.0 0.0 0.0 0.0 0.0 0.0 0.0 ind 0.0 0.0 Unknown puffin 0.0 0.0 0.0 0.0 0.0 0.0 0.0 0.0 0.0 ind 0.0 0.0 Spruce grouse 16.7 16.7 8.3 8.3 0.0 7.9 0.5 0.2 11.3 ind 0.7 119.4 Unknown grouse 8.3 8.3 8.3 0.0 0.0 1.0 0.1 0.0 1.4 ind 0.1 119.4 Unknown duck eggs 0.0 0.0 0.0 0.0 0.0 0.0 0.0 0.0 0.0 ind 0.0 0.0 Unknown goose eggs 16.7 8.3 8.3 8.3 0.0 5.1 0.3 0.1 17.0 ind 1.0 119.4 Black oystercatcher eggs 0.0 0.0 0.0 0.0 0.0 0.0 0.0 0.0 0.0 ind 0.0 0.0 Unknown gull eggs 33.3 8.3 8.3 25.0 0.0 5.1 0.3 0.1 17.0 ind 1.0 119.4 Unknown murre eggs 8.3 0.0 0.0 8.3 0.0 0.0 0.0 0.0 0.0 ind 0.0 0.0 Unknown tern eggs 0.0 0.0 0.0 0.0 0.0 0.0 0.0 0.0 0.0 ind 0.0 0.0 Unknown eggs 0.0 0.0 0.0 0.0 0.0 0.0 0.0 0.0 0.0 ind 0.0 0.0
Marine invertebrates 66.7 33.3 33.3 58.3 33.3 603.4 35.5 17.0 603.4 lb 35.5 56.0 Red (large) chitons 0.0 0.0 0.0 0.0 0.0 0.0 0.0 0.0 0.0 gal 0.0 0.0 Black (small) chitons 0.0 0.0 0.0 0.0 0.0 0.0 0.0 0.0 0.0 gal 0.0 0.0 Butter clams 41.7 33.3 33.3 8.3 0.0 25.8 1.5 0.7 8.6 gal 0.5 64.0 Horse clams 16.7 16.7 16.7 0.0 0.0 23.4 1.4 0.7 7.8 gal 0.5 108.1
Harvest amount 95% confidence
limit (±)harvest
Table 2-13.–Page 4 of 6.
Resource
Percentage of households Harvest weight (lb)
Birds and eggs, continued
-continued-
40
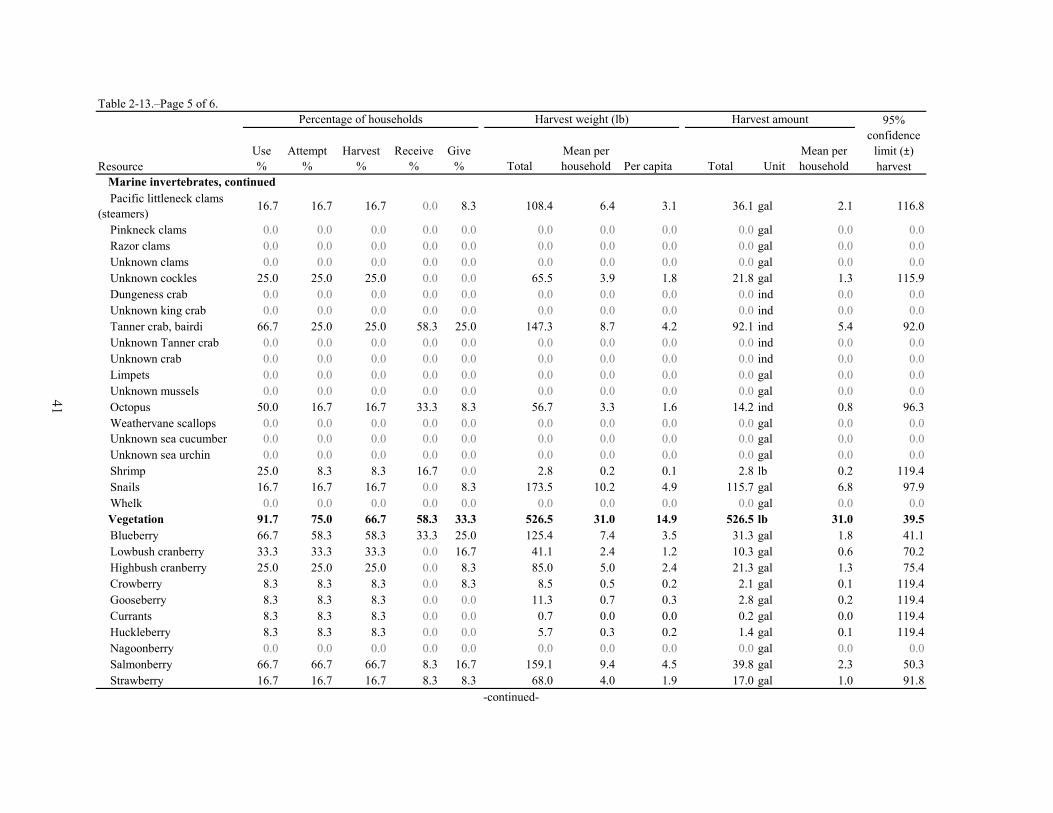
Use%
Attempt %
Harvest %
Receive %
Give % Total
Mean per household Per capita Total Unit
Mean per household
Pacific littleneck clams (steamers) 16.7 16.7 16.7 0.0 8.3 108.4 6.4 3.1 36.1 gal 2.1 116.8
Pinkneck clams 0.0 0.0 0.0 0.0 0.0 0.0 0.0 0.0 0.0 gal 0.0 0.0 Razor clams 0.0 0.0 0.0 0.0 0.0 0.0 0.0 0.0 0.0 gal 0.0 0.0 Unknown clams 0.0 0.0 0.0 0.0 0.0 0.0 0.0 0.0 0.0 gal 0.0 0.0 Unknown cockles 25.0 25.0 25.0 0.0 0.0 65.5 3.9 1.8 21.8 gal 1.3 115.9 Dungeness crab 0.0 0.0 0.0 0.0 0.0 0.0 0.0 0.0 0.0 ind 0.0 0.0 Unknown king crab 0.0 0.0 0.0 0.0 0.0 0.0 0.0 0.0 0.0 ind 0.0 0.0 Tanner crab, bairdi 66.7 25.0 25.0 58.3 25.0 147.3 8.7 4.2 92.1 ind 5.4 92.0 Unknown Tanner crab 0.0 0.0 0.0 0.0 0.0 0.0 0.0 0.0 0.0 ind 0.0 0.0 Unknown crab 0.0 0.0 0.0 0.0 0.0 0.0 0.0 0.0 0.0 ind 0.0 0.0 Limpets 0.0 0.0 0.0 0.0 0.0 0.0 0.0 0.0 0.0 gal 0.0 0.0 Unknown mussels 0.0 0.0 0.0 0.0 0.0 0.0 0.0 0.0 0.0 gal 0.0 0.0 Octopus 50.0 16.7 16.7 33.3 8.3 56.7 3.3 1.6 14.2 ind 0.8 96.3 Weathervane scallops 0.0 0.0 0.0 0.0 0.0 0.0 0.0 0.0 0.0 gal 0.0 0.0 Unknown sea cucumber 0.0 0.0 0.0 0.0 0.0 0.0 0.0 0.0 0.0 gal 0.0 0.0 Unknown sea urchin 0.0 0.0 0.0 0.0 0.0 0.0 0.0 0.0 0.0 gal 0.0 0.0 Shrimp 25.0 8.3 8.3 16.7 0.0 2.8 0.2 0.1 2.8 lb 0.2 119.4 Snails 16.7 16.7 16.7 0.0 8.3 173.5 10.2 4.9 115.7 gal 6.8 97.9 Whelk 0.0 0.0 0.0 0.0 0.0 0.0 0.0 0.0 0.0 gal 0.0 0.0
Vegetation 91.7 75.0 66.7 58.3 33.3 526.5 31.0 14.9 526.5 lb 31.0 39.5 Blueberry 66.7 58.3 58.3 33.3 25.0 125.4 7.4 3.5 31.3 gal 1.8 41.1 Lowbush cranberry 33.3 33.3 33.3 0.0 16.7 41.1 2.4 1.2 10.3 gal 0.6 70.2 Highbush cranberry 25.0 25.0 25.0 0.0 8.3 85.0 5.0 2.4 21.3 gal 1.3 75.4 Crowberry 8.3 8.3 8.3 0.0 8.3 8.5 0.5 0.2 2.1 gal 0.1 119.4 Gooseberry 8.3 8.3 8.3 0.0 0.0 11.3 0.7 0.3 2.8 gal 0.2 119.4 Currants 8.3 8.3 8.3 0.0 0.0 0.7 0.0 0.0 0.2 gal 0.0 119.4 Huckleberry 8.3 8.3 8.3 0.0 0.0 5.7 0.3 0.2 1.4 gal 0.1 119.4 Nagoonberry 0.0 0.0 0.0 0.0 0.0 0.0 0.0 0.0 0.0 gal 0.0 0.0 Salmonberry 66.7 66.7 66.7 8.3 16.7 159.1 9.4 4.5 39.8 gal 2.3 50.3 Strawberry 16.7 16.7 16.7 8.3 8.3 68.0 4.0 1.9 17.0 gal 1.0 91.8
Marine invertebrates, continued
-continued-
Table 2-13.–Page 5 of 6.
Resource
Percentage of households Harvest weight (lb) Harvest amount 95% confidence
limit (±)harvest
41
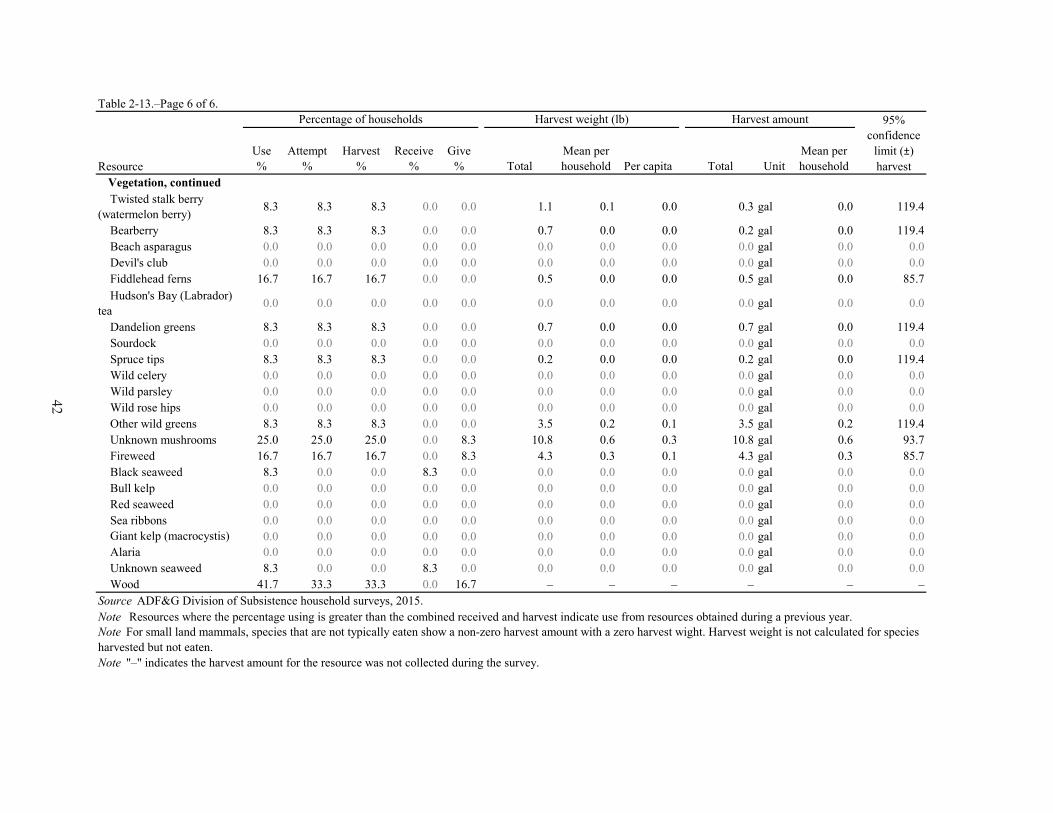
Use%
Attempt %
Harvest %
Receive %
Give % Total
Mean per household Per capita Total Unit
Mean per household
Vegetation, continued Twisted stalk berry (watermelon berry) 8.3 8.3 8.3 0.0 0.0 1.1 0.1 0.0 0.3 gal 0.0 119.4
Bearberry 8.3 8.3 8.3 0.0 0.0 0.7 0.0 0.0 0.2 gal 0.0 119.4 Beach asparagus 0.0 0.0 0.0 0.0 0.0 0.0 0.0 0.0 0.0 gal 0.0 0.0 Devil's club 0.0 0.0 0.0 0.0 0.0 0.0 0.0 0.0 0.0 gal 0.0 0.0 Fiddlehead ferns 16.7 16.7 16.7 0.0 0.0 0.5 0.0 0.0 0.5 gal 0.0 85.7 Hudson's Bay (Labrador) tea 0.0 0.0 0.0 0.0 0.0 0.0 0.0 0.0 0.0 gal 0.0 0.0
Dandelion greens 8.3 8.3 8.3 0.0 0.0 0.7 0.0 0.0 0.7 gal 0.0 119.4 Sourdock 0.0 0.0 0.0 0.0 0.0 0.0 0.0 0.0 0.0 gal 0.0 0.0 Spruce tips 8.3 8.3 8.3 0.0 0.0 0.2 0.0 0.0 0.2 gal 0.0 119.4 Wild celery 0.0 0.0 0.0 0.0 0.0 0.0 0.0 0.0 0.0 gal 0.0 0.0 Wild parsley 0.0 0.0 0.0 0.0 0.0 0.0 0.0 0.0 0.0 gal 0.0 0.0 Wild rose hips 0.0 0.0 0.0 0.0 0.0 0.0 0.0 0.0 0.0 gal 0.0 0.0 Other wild greens 8.3 8.3 8.3 0.0 0.0 3.5 0.2 0.1 3.5 gal 0.2 119.4 Unknown mushrooms 25.0 25.0 25.0 0.0 8.3 10.8 0.6 0.3 10.8 gal 0.6 93.7 Fireweed 16.7 16.7 16.7 0.0 8.3 4.3 0.3 0.1 4.3 gal 0.3 85.7 Black seaweed 8.3 0.0 0.0 8.3 0.0 0.0 0.0 0.0 0.0 gal 0.0 0.0 Bull kelp 0.0 0.0 0.0 0.0 0.0 0.0 0.0 0.0 0.0 gal 0.0 0.0 Red seaweed 0.0 0.0 0.0 0.0 0.0 0.0 0.0 0.0 0.0 gal 0.0 0.0 Sea ribbons 0.0 0.0 0.0 0.0 0.0 0.0 0.0 0.0 0.0 gal 0.0 0.0 Giant kelp (macrocystis) 0.0 0.0 0.0 0.0 0.0 0.0 0.0 0.0 0.0 gal 0.0 0.0 Alaria 0.0 0.0 0.0 0.0 0.0 0.0 0.0 0.0 0.0 gal 0.0 0.0 Unknown seaweed 8.3 0.0 0.0 8.3 0.0 0.0 0.0 0.0 0.0 gal 0.0 0.0 Wood 41.7 33.3 33.3 0.0 16.7 – – – – – –Source ADF&G Division of Subsistence household surveys, 2015.Note Resources where the percentage using is greater than the combined received and harvest indicate use from resources obtained during a previous year.Note For small land mammals, species that are not typically eaten show a non-zero harvest amount with a zero harvest wight. Harvest weight is not calculated for species harvested but not eaten.
Table 2-13.–Page 6 of 6.
Resource
Percentage of households Harvest weight (lb) Harvest amount 95% confidence
limit (±)harvest
Note "–" indicates the harvest amount for the resource was not collected during the survey.
42

The total community harvest of all wild resources in 2014 was approximately 9,019 lb, or 255 lb per capita (Table 2-13). This is much lower than 2003 when the total community harvest was 26,476 lb and the per capita harvest was 471 lb (Fall 2006:35). The resource category composing the greatest percentage of the harvest in 2014 was salmon, representing 50% of the harvest and approximately 4,490 lb (127 lb per capita) (Figure 2-10; Table 2-13). This was followed by nonsalmon fish (21%; 53 lb per capita), large land mammals (15%; 39 lb per capita), marine invertebrates (7%; 17 lb per capita), vegetation (6%; 15 lb per capita), birds and eggs (1%; 4 lb per capita), and small land mammals (less than 1 lb per capita). No marine mammals were reportedly harvested for food.Wild resources were harvested from a variety of locations in 2014 by Chenega Bay residents (Figure 2-11). While most of the resource harvests took place within 50 miles of the community, some households harvested wild foods from the Cook Inlet side of the Kenai Peninsula and near Valdez in Prince William Sound. Not all households opted to participate in mapping their wild food search and harvest locations; therefore, the maps in this report only reflect the spatial data provided, not all search and harvest locations.
uSe and harveSt characteriSticS By reSource category
Table 2-13 includes information regarding the harvest and use of each resource category in Chenega Bay in 2014, including the percentage of households sharing these resources. Considering all resource categories combined, all households received wild foods from another household and 67% gave wild foods away, representing very high levels of sharing. Salmon and nonsalmon fish were received by the greatest percentage of households (83%), followed by large land mammals (67%), marine invertebrates (58%), vegetation (58%), marine mammals (42%), birds and eggs (33%), and small land mammals (8%). Salmon were given away by the greatest percentage of households (50%), followed by nonsalmon fish (42%), marine invertebrates (33%), vegetation (33%), large land mammals (25%), marine mammals (17%), birds and eggs (17%), and small land mammals (8%).
Figure 2-10.–Composition of harvest by resource category in pounds usable weight, Chenega Bay, 2014.
Salmon50%
Nonsalmon fish21%
Large land mammals15%
Small land mammals<1%
Birds and eggs1%
Marine invertebrates7%
Vegetation6%
Note Categories having 0 lb of usable weight are not included.
43

Figure 2-11.–Wild resource search and harvest areas, Chenega Bay, 2014.
!
!
G u l f o f A l a s k a
Montague
Island
EvansIsland
LaToucheIsland
Bainbridge
Island
Prin
ceof
Wal
esPa
ssag
e
Knight
Island
Knight Island Passage
LaTo
uche
Pass
age
DangerIsland
Po
rt
Ba
inb
ri d
ge
Mo n
t ag
ue
St r
ai t
Mu mmy Bay
Icy Bay
Chenega (Old Site)
Chenega Bay
0 52.5Miles
This map depicts areas used forresource harvesting in 2014 by 8
surveyed households in Chenega Bay,Alaska. The total survey sampleincludes 12 of 17 households in
Chenega Bay (71%), so this map is apartial representation of areas used forresource harvests in 2014. Resourceharvest areas change over time, so
areas not used in 2014 might be used inother years.
Source:Alaska Department of Fish and Game(ADF&G) Division of Subsistence,
2015.North American Datum 1927.
Alaska Albers Projection.
Map created by: Terri Lemons
EVOS 2014
Chenega BayAll resources search and harvest areas
1:300,000SCALE:
147°30'W
148°W
148°W
148°30'W
148°30'W
60°N
Chenega (Old Site)
ValdezAnchorage
Whittier
Tazlina
Tatitlek
Tyonek
Chenega Bay
Prince WilliamSound!
!
!!
!
!
!
!
!
!
!!
!
!
!Kenai
148°W
148°W
60°N
44
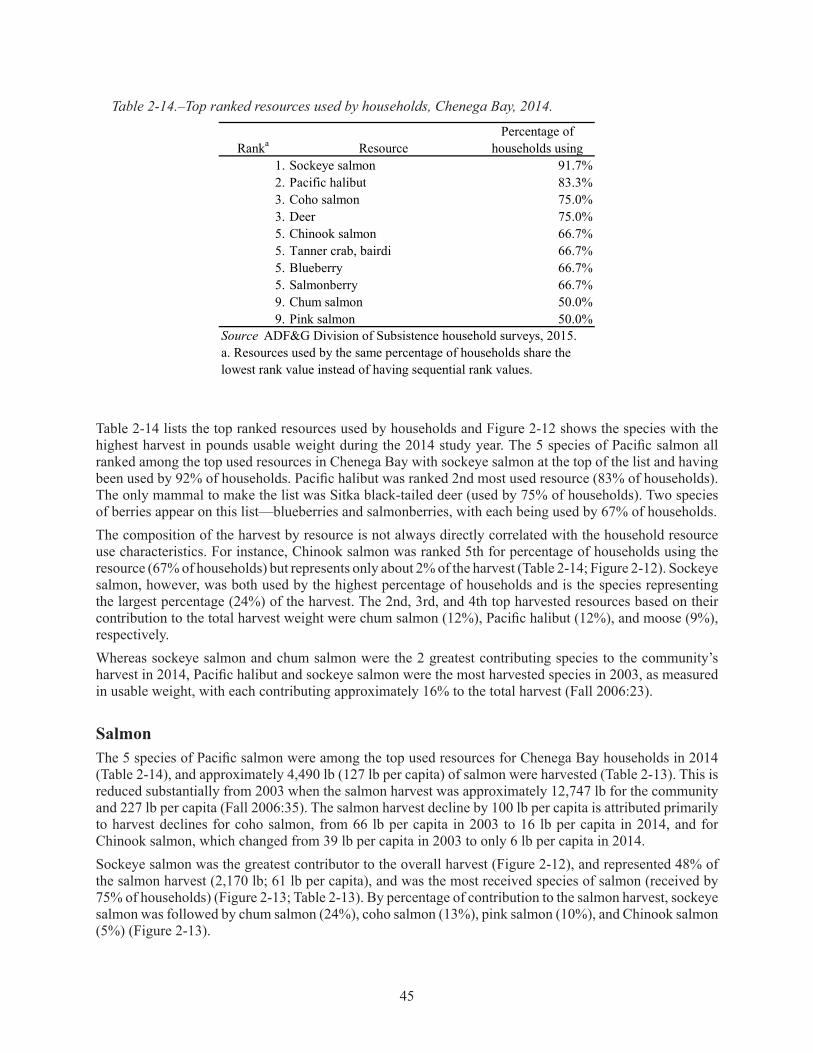
Table 2-14.–Top ranked resources used by households, Chenega Bay, 2014.
Ranka ResourcePercentage of
households using1. Sockeye salmon 91.7%2. Pacific halibut 83.3%3. Coho salmon 75.0%3. Deer 75.0%5. Chinook salmon 66.7%5. Tanner crab, bairdi 66.7%5. Blueberry 66.7%5. Salmonberry 66.7%9. Chum salmon 50.0%9. Pink salmon 50.0%
a. Resources used by the same percentage of households share the lowest rank value instead of having sequential rank values.
Source ADF&G Division of Subsistence household surveys, 2015.
Table 2-14 lists the top ranked resources used by households and Figure 2-12 shows the species with the highest harvest in pounds usable weight during the 2014 study year. The 5 species of Pacific salmon all ranked among the top used resources in Chenega Bay with sockeye salmon at the top of the list and having been used by 92% of households. Pacific halibut was ranked 2nd most used resource (83% of households). The only mammal to make the list was Sitka black-tailed deer (used by 75% of households). Two species of berries appear on this list—blueberries and salmonberries, with each being used by 67% of households. The composition of the harvest by resource is not always directly correlated with the household resource use characteristics. For instance, Chinook salmon was ranked 5th for percentage of households using the resource (67% of households) but represents only about 2% of the harvest (Table 2-14; Figure 2-12). Sockeye salmon, however, was both used by the highest percentage of households and is the species representing the largest percentage (24%) of the harvest. The 2nd, 3rd, and 4th top harvested resources based on their contribution to the total harvest weight were chum salmon (12%), Pacific halibut (12%), and moose (9%), respectively. Whereas sockeye salmon and chum salmon were the 2 greatest contributing species to the community’s harvest in 2014, Pacific halibut and sockeye salmon were the most harvested species in 2003, as measured in usable weight, with each contributing approximately 16% to the total harvest (Fall 2006:23).
SalmonThe 5 species of Pacific salmon were among the top used resources for Chenega Bay households in 2014 (Table 2-14), and approximately 4,490 lb (127 lb per capita) of salmon were harvested (Table 2-13). This is reduced substantially from 2003 when the salmon harvest was approximately 12,747 lb for the community and 227 lb per capita (Fall 2006:35). The salmon harvest decline by 100 lb per capita is attributed primarily to harvest declines for coho salmon, from 66 lb per capita in 2003 to 16 lb per capita in 2014, and for Chinook salmon, which changed from 39 lb per capita in 2003 to only 6 lb per capita in 2014.Sockeye salmon was the greatest contributor to the overall harvest (Figure 2-12), and represented 48% of the salmon harvest (2,170 lb; 61 lb per capita), and was the most received species of salmon (received by 75% of households) (Figure 2-13; Table 2-13). By percentage of contribution to the salmon harvest, sockeye salmon was followed by chum salmon (24%), coho salmon (13%), pink salmon (10%), and Chinook salmon (5%) (Figure 2-13).
45
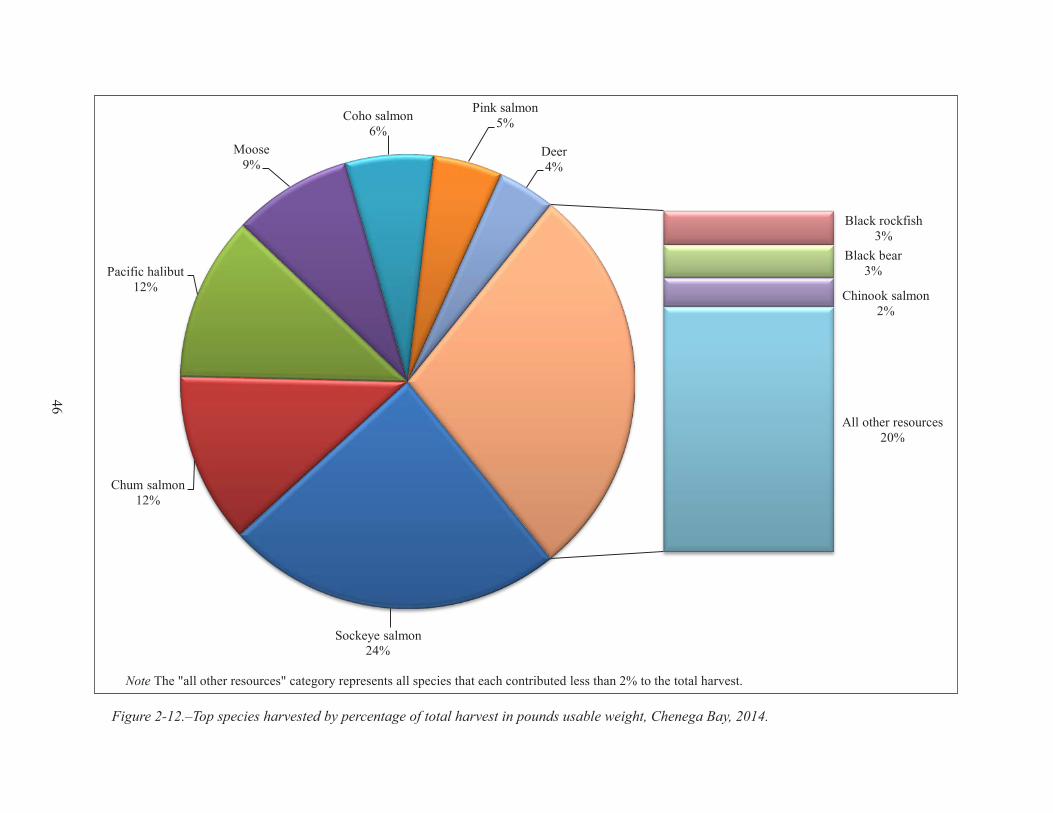
Figure 2-12.–Top species harvested by percentage of total harvest in pounds usable weight, Chenega Bay, 2014.
Sockeye salmon
Chum salmon12%
Pacific halibut12%
Moose9%
Coho salmon6%
Pink salmon5%
Deer4%
Black rockfish3%
Black bear3%
Chinook salmon2%
All other resources20%
24%
Note The "all other resources" category represents all species that each contributed less than 2% to the total harvest.
46
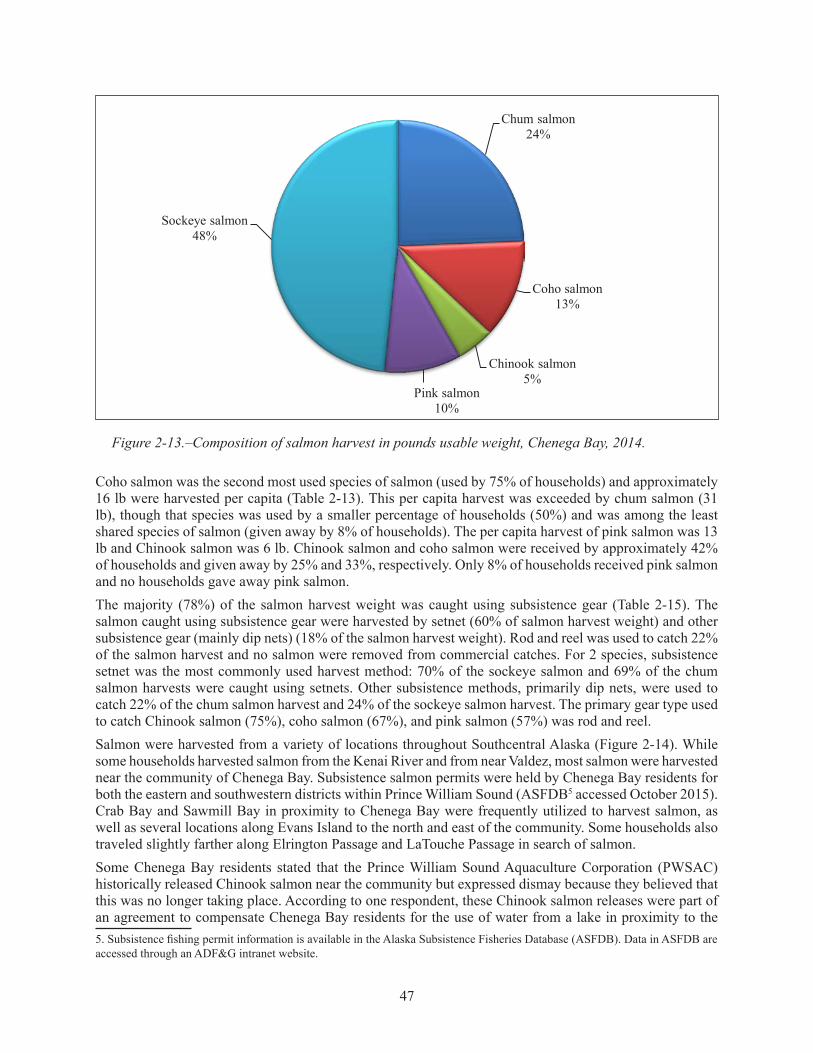
Figure 2-13.–Composition of salmon harvest in pounds usable weight, Chenega Bay, 2014.
Chum salmon24%
Coho salmon13%
Chinook salmon5%
Pink salmon10%
Sockeye salmon48%
Coho salmon was the second most used species of salmon (used by 75% of households) and approximately 16 lb were harvested per capita (Table 2-13). This per capita harvest was exceeded by chum salmon (31 lb), though that species was used by a smaller percentage of households (50%) and was among the least shared species of salmon (given away by 8% of households). The per capita harvest of pink salmon was 13 lb and Chinook salmon was 6 lb. Chinook salmon and coho salmon were received by approximately 42% of households and given away by 25% and 33%, respectively. Only 8% of households received pink salmon and no households gave away pink salmon. The majority (78%) of the salmon harvest weight was caught using subsistence gear (Table 2-15). The salmon caught using subsistence gear were harvested by setnet (60% of salmon harvest weight) and other subsistence gear (mainly dip nets) (18% of the salmon harvest weight). Rod and reel was used to catch 22% of the salmon harvest and no salmon were removed from commercial catches. For 2 species, subsistence setnet was the most commonly used harvest method: 70% of the sockeye salmon and 69% of the chum salmon harvests were caught using setnets. Other subsistence methods, primarily dip nets, were used to catch 22% of the chum salmon harvest and 24% of the sockeye salmon harvest. The primary gear type used to catch Chinook salmon (75%), coho salmon (67%), and pink salmon (57%) was rod and reel.Salmon were harvested from a variety of locations throughout Southcentral Alaska (Figure 2-14). While some households harvested salmon from the Kenai River and from near Valdez, most salmon were harvested near the community of Chenega Bay. Subsistence salmon permits were held by Chenega Bay residents for both the eastern and southwestern districts within Prince William Sound (ASFDB5 accessed October 2015). Crab Bay and Sawmill Bay in proximity to Chenega Bay were frequently utilized to harvest salmon, as well as several locations along Evans Island to the north and east of the community. Some households also traveled slightly farther along Elrington Passage and LaTouche Passage in search of salmon. Some Chenega Bay residents stated that the Prince William Sound Aquaculture Corporation (PWSAC) historically released Chinook salmon near the community but expressed dismay because they believed that this was no longer taking place. According to one respondent, these Chinook salmon releases were part of an agreement to compensate Chenega Bay residents for the use of water from a lake in proximity to the 5. Subsistence fishing permit information is available in the Alaska Subsistence Fisheries Database (ASFDB). Data in ASFDB are accessed through an ADF&G intranet website.
47

Table 2-15.–Estimated percentages of salmon harvested by gear type, resource, and total salmon harvest, Chenega Bay, 2014.
Setnet Seine Driftnet OtherSubsistence
gear, any methodPounds Pounds Pounds Pounds Pounds Pounds Pounds Pounds
Salmon Gear type 0.0% 100.0% 0.0% 0.0% 100.0% 100.0% 100.0% 100.0%Resource 0.0% 59.9% 0.0% 0.0% 17.7% 77.6% 22.4% 100.0%Total 0.0% 59.9% 0.0% 0.0% 17.7% 77.6% 22.4% 100.0%
Chum salmon Gear type 0.0% 28.2% 0.0% 0.0% 30.2% 28.7% 9.5% 24.4%Resource 0.0% 69.3% 0.0% 0.0% 21.9% 91.2% 8.8% 100.0%Total 0.0% 16.9% 0.0% 0.0% 5.3% 22.2% 2.1% 24.4%
Coho salmon Gear type 0.0% 6.7% 0.0% 0.0% 1.1% 5.4% 37.6% 12.6%Resource 0.0% 31.8% 0.0% 0.0% 1.5% 33.3% 66.7% 100.0%Total 0.0% 4.0% 0.0% 0.0% 0.2% 4.2% 8.4% 12.6%
Chinook salmon Gear type 0.0% 1.3% 0.0% 0.0% 2.3% 1.6% 16.2% 4.8%Resource 0.0% 16.7% 0.0% 0.0% 8.3% 25.0% 75.0% 100.0%Total 0.0% 0.8% 0.0% 0.0% 0.4% 1.2% 3.6% 4.8%
Pink salmon Gear type 0.0% 7.1% 0.0% 0.0% 0.0% 5.5% 25.0% 9.9%Resource 0.0% 43.3% 0.0% 0.0% 0.0% 43.3% 56.7% 100.0%Total 0.0% 4.3% 0.0% 0.0% 0.0% 4.3% 5.6% 9.9%
Sockeye salmon Gear type 0.0% 56.6% 0.0% 0.0% 66.5% 58.9% 11.8% 48.3%Resource 0.0% 70.2% 0.0% 0.0% 24.4% 94.6% 5.4% 100.0%Total 0.0% 33.9% 0.0% 0.0% 11.8% 45.7% 2.6% 48.3%
Landlocked salmon Gear type 0.0% 0.0% 0.0% 0.0% 0.0% 0.0% 0.0% 0.0%Resource 0.0% 0.0% 0.0% 0.0% 0.0% 0.0% 0.0% 0.0%Total 0.0% 0.0% 0.0% 0.0% 0.0% 0.0% 0.0% 0.0%
Unknown salmon Gear type 0.0% 0.0% 0.0% 0.0% 0.0% 0.0% 0.0% 0.0%Resource 0.0% 0.0% 0.0% 0.0% 0.0% 0.0% 0.0% 0.0%Total 0.0% 0.0% 0.0% 0.0% 0.0% 0.0% 0.0% 0.0%
ResourcePercentage base
Removed from commercial
catch
Subsistence methodsRod and
reel
Source ADF&G Division of Subsistence household surveys, 2015.
Any method
48

Figure 2-14.–Fishing and harvest locations of chum, coho, Chinook, pink, and sockeye salmon, Chenega Bay, 2014.
!
Evans
Island
LaTouche
Island
Bainbridge
Island
Prin
ceof
Wal
esPa
ssag
e
Knight Island Passage
LaTo
uche
Pass
age
Mo n
t ag
ue
St r
ai t
Elrin
gton
Pass
age
Sawmill Bay
Bainbridge
Passa
ge
Elrington
Island
CrabBayChenega Bay
0 21Miles
This map depicts areas used forresource harvesting in 2014 by 7
surveyed households in Chenega Bay,Alaska. The total survey sampleincludes 12 of 17 households in
Chenega Bay (71%), so this map is apartial representation of areas used forresource harvests in 2014. Resourceharvest areas change over time, so
areas not used in 2014 might be used inother years.
Source:Alaska Department of Fish and Game(ADF&G) Division of Subsistence,
2015.North American Datum 1927.
Alaska Albers Projection.
Map created by: Terri Lemons
EVOS 2014
Chenega BaySalmon search and harvest areas
1:150,000SCALE:
148°W
148°W
60°N
!
!!Chenega (Old Site)
ValdezAnchorage
Whittier
Tazlina
Tatitlek
Tyonek
Chenega Bay
Prince WilliamSound!
!
!!
!
!
!
!
!
!
!!
!
!
!!Kenai
148°W
148°W
60°N
!
49
Armin F. Koernig Hatchery. The belief that Chinook salmon releases have declined or ceased in the area does not concur with published documentation. According to the PWSAC’s ADF&G Fish Transport Permit and the 2015 hatchery annual management plan, Chinook salmon releases have continued to occur in the Chenega Bay area.6 Approximately 50,000 Chinook salmon eggs from Ship Creek brood stock are raised at the Wally Noerenberg hatchery annually and released in the vicinity of Chenega Bay. Perceptions of Chinook salmon declines may be due to decreased at-sea survival, failed returns, and commercial fishing interception, among other variables. Chenega Bay residents looked forward to the return of hatchery-released Chinook salmon, and some suggest that wild stocks can be hard to find in the vicinity. One respondent explained that the problem with releasing coho salmon is that the pink salmon and coho salmon return to the area at the same time. Commercial boats targeting pink salmon are said to be intercepting all of the coho salmon as an incidental harvest when targeting hatchery pink salmon, thus preventing local residents the chance to harvest the coho salmon. A respondent provided photographs of upward of 50 seine boats fishing offshore of the community during these returns.No Chenega Bay residents held commercial salmon fishing permits for Prince William Sound in 2010.7 Concerns about commercial salmon fishing in the area were two-fold, and included concerns over competition for fish in nearby waters. There was a general consensus that when the commercial boats are operating just offshore of the town, that they are harvesting most of the available salmon. Several respondents alleged that trawlers (commonly referred to locally as “draggers”), are damaging the ocean floor and leaving little of the salmon run in their wake.A specific concern related to commercial fisheries pertains to the 1-day coho (silver) salmon fishing derby administered by the Chenega IRA Council. Commercial fishing vessels are said to be active in the vicinity of the community when this is taking place, impeding the fishing activities of derby participants. One respondent noted that attempts to encourage ADF&G to delay openers on that day have consistently failed. He mentioned, too, that often no coho salmon are caught during the annual derby when seine boats are simultaneously able to harvest this species.Some respondents noted declines in Chinook salmon populations over time in the vicinity of Chenega Bay, particularly in the winter. These respondents noted that it is often necessary to travel farther in search of these resources, increasing the costs associated with fuel—an expensive commodity in the community ($7.60 per gallon in March of 2015 according to a local research assistant). They also noted concerns regarding sport fishing charters that follow local residents who are trolling with rod and reel gear for Chinook salmon. One respondent indicated that charter boats will use binoculars to find local fishermen, and then target the same areas.Some households also mentioned concerns regarding climate change and its effect on salmon. Respondents did not have details as to the effects of climate change, but were curious. A resident noted that climate change has allowed the introduction of slugs to Evans Island. She explained that until about 3 years prior to the study slugs did not occur there. The new slugs are black to gray in color, are said to be abundant, and have caused damage to leafy greens in local gardens. These slugs are presumed to be European Black Slugs that have been documented as introduced in the Cordova area.8 Subsequent conversations with a Chenega Bay key respondent suggested that the slugs arrived onboard pallets shipped from Whittier several years ago and that the slug population has exploded near the community since the arrival. During the community review meeting, one household also asked about radiation from the Fukushima Daiichi nuclear reactor meltdown in Japan and the potential for this to affect local salmon.
6. Prince William Sound Aquaculture Corporation. n.d. “2015 Annual Management Plan, Armin F. Koernig Hatchery.” http://www.adfg.alaska.gov/static/fishing/PDFs/hatcheries/annual_management_plans/2015/2015_afk_amp.pdf (accessed May 2016). 7. Alaska Commercial Fisheries Entry Commission, “Permit Holder & Crew Member Counts by Census Area & City of Resi-dence: 2003 and 2010,” data for 2014 were not available. https://www.cfec.state.ak.us/fishery_statistics/permits.htm (accessed November 13, 2015). 8. University of Alaska Anchorage, Alaska Center for Conservation Science. n.d. “Invasive Black Slug Risk Assessment.” http://accs.uaa.alaska.edu/invasive-species/black-slug-risk-assessment/ (accessed April 2016).
50

Figure 2-15.–Composition of nonsalmon fish harvest in pounds usable weight, Chenega Bay, 2014.
Nonsalmon FishConsidering the harvest of nonsalmon fish in Chenega Bay in 2014, Pacific halibut composed the largest percentage (56%) (Figure 2-15). Following this species, there were harvests of black rockfish (14%), yelloweye rockfish (6%), quillback rockfish (6%), Pacific herring (5%), greenling (3%), lingcod (2%), and unknown rockfish species (2%). Smaller percentages of other fish species made up approximately 6% of the nonsalmon fish harvest. A total of 1,880 lb of nonsalmon fish were harvested providing 53 lb per capita (Table 2-13).Pacific halibut was the most used and most shared nonsalmon fish (Table 2-13). Approximately 1,056 lb of Pacific halibut were harvested equaling 30 lb per capita. All households that attempted to harvest Pacific halibut were successful, 67% of households received this species and 42% of households gave away this species. Rockfish species made up the second largest nonsalmon fish harvest in this community, representing a total harvest of 601 lb and per capita harvest of 17 lb. All households that targeted rockfish were successful, and these species were shared by relatively few households. The Division of Subsistence distributes mail-out Pacific halibut harvest surveys to holders of Subsistence Halibut Registration Certificates, or SHARCs, and annually estimates the total Pacific halibut harvest weight based on reported harvests of returned surveys (Fall and Lemons 2016).9 Between 2003 and 2014, the Pacific halibut harvest for the community of Chenega Bay has ranged from its highest level in 2006 (8,908 lb) to its lowest level in 2009 (1,365 lb) (Table 1-8). The average community harvest during this 11-year period—excluding 2013, for which data are not available—was 4,916 lb. The steady yet slight declines
9. Pacific halibut harvest estimates based on SHARC survey results may differ from harvest estimates based on household com-prehensive subsistence surveys due to different data collection methods. The SHARC estimates only include those individuals who have registered with the National Marine Fisheries Service, and does not include harvests removed from commercial catch-es. The SHARC estimates are based on the mailing addresses of SHARC holders, some of whom might be seasonal residents of the community. The household survey is based on a sample of all households in each community, and includes harvests for home use from the subsistence and sport fisheries as well as fish retained from respondents’ commercial harvests for home use or sharing.
Pacific herring5% Lingcod
2%
Unknown greenling3%
Pacific halibut56%
Black rockfish14%
Yelloweye rockfish6%
Quillback rockfish6%
Unknown rockfish2%
Other6%
Note The "other" category represents all species that contributed 1% or less to the total nonsalmon fish harvest.
51
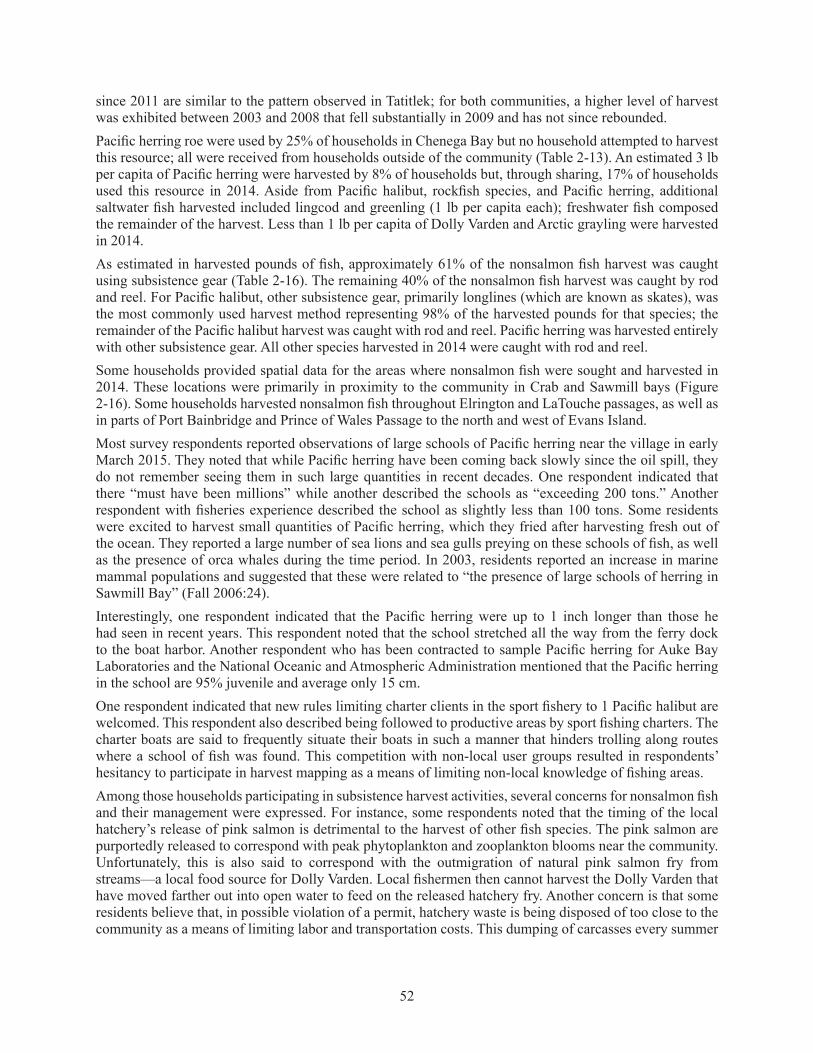
since 2011 are similar to the pattern observed in Tatitlek; for both communities, a higher level of harvest was exhibited between 2003 and 2008 that fell substantially in 2009 and has not since rebounded.Pacific herring roe were used by 25% of households in Chenega Bay but no household attempted to harvest this resource; all were received from households outside of the community (Table 2-13). An estimated 3 lb per capita of Pacific herring were harvested by 8% of households but, through sharing, 17% of households used this resource in 2014. Aside from Pacific halibut, rockfish species, and Pacific herring, additional saltwater fish harvested included lingcod and greenling (1 lb per capita each); freshwater fish composed the remainder of the harvest. Less than 1 lb per capita of Dolly Varden and Arctic grayling were harvested in 2014.As estimated in harvested pounds of fish, approximately 61% of the nonsalmon fish harvest was caught using subsistence gear (Table 2-16). The remaining 40% of the nonsalmon fish harvest was caught by rod and reel. For Pacific halibut, other subsistence gear, primarily longlines (which are known as skates), was the most commonly used harvest method representing 98% of the harvested pounds for that species; the remainder of the Pacific halibut harvest was caught with rod and reel. Pacific herring was harvested entirely with other subsistence gear. All other species harvested in 2014 were caught with rod and reel.Some households provided spatial data for the areas where nonsalmon fish were sought and harvested in 2014. These locations were primarily in proximity to the community in Crab and Sawmill bays (Figure 2-16). Some households harvested nonsalmon fish throughout Elrington and LaTouche passages, as well as in parts of Port Bainbridge and Prince of Wales Passage to the north and west of Evans Island.Most survey respondents reported observations of large schools of Pacific herring near the village in early March 2015. They noted that while Pacific herring have been coming back slowly since the oil spill, they do not remember seeing them in such large quantities in recent decades. One respondent indicated that there “must have been millions” while another described the schools as “exceeding 200 tons.” Another respondent with fisheries experience described the school as slightly less than 100 tons. Some residents were excited to harvest small quantities of Pacific herring, which they fried after harvesting fresh out of the ocean. They reported a large number of sea lions and sea gulls preying on these schools of fish, as well as the presence of orca whales during the time period. In 2003, residents reported an increase in marine mammal populations and suggested that these were related to “the presence of large schools of herring in Sawmill Bay” (Fall 2006:24).Interestingly, one respondent indicated that the Pacific herring were up to 1 inch longer than those he had seen in recent years. This respondent noted that the school stretched all the way from the ferry dock to the boat harbor. Another respondent who has been contracted to sample Pacific herring for Auke Bay Laboratories and the National Oceanic and Atmospheric Administration mentioned that the Pacific herring in the school are 95% juvenile and average only 15 cm. One respondent indicated that new rules limiting charter clients in the sport fishery to 1 Pacific halibut are welcomed. This respondent also described being followed to productive areas by sport fishing charters. The charter boats are said to frequently situate their boats in such a manner that hinders trolling along routes where a school of fish was found. This competition with non-local user groups resulted in respondents’ hesitancy to participate in harvest mapping as a means of limiting non-local knowledge of fishing areas.Among those households participating in subsistence harvest activities, several concerns for nonsalmon fish and their management were expressed. For instance, some respondents noted that the timing of the local hatchery’s release of pink salmon is detrimental to the harvest of other fish species. The pink salmon are purportedly released to correspond with peak phytoplankton and zooplankton blooms near the community. Unfortunately, this is also said to correspond with the outmigration of natural pink salmon fry from streams—a local food source for Dolly Varden. Local fishermen then cannot harvest the Dolly Varden that have moved farther out into open water to feed on the released hatchery fry. Another concern is that some residents believe that, in possible violation of a permit, hatchery waste is being disposed of too close to the community as a means of limiting labor and transportation costs. This dumping of carcasses every summer
52
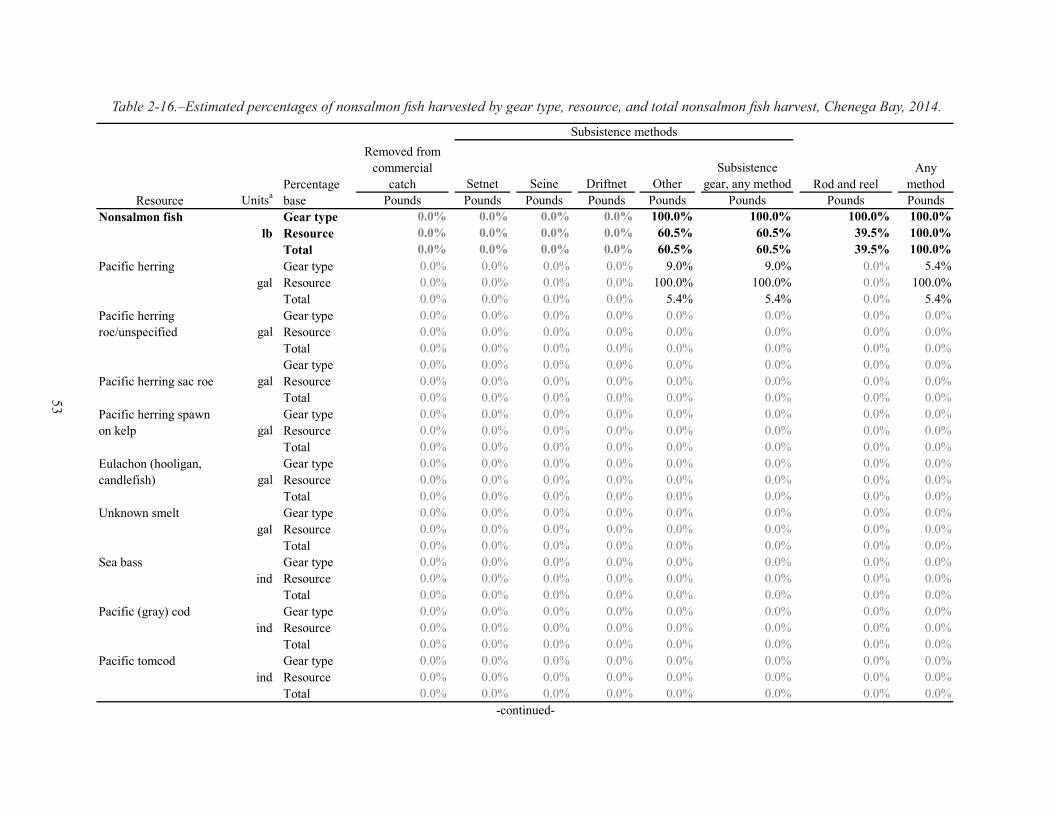
Table 2-16.–Estimated percentages of nonsalmon fish harvested by gear type, resource, and total nonsalmon fish harvest, Chenega Bay, 2014.
Setnet Seine Driftnet OtherSubsistence
gear, any methodUnitsa Pounds Pounds Pounds Pounds Pounds Pounds Pounds Pounds
Nonsalmon fish Gear type 0.0% 0.0% 0.0% 0.0% 100.0% 100.0% 100.0% 100.0%lb Resource 0.0% 0.0% 0.0% 0.0% 60.5% 60.5% 39.5% 100.0%
Total 0.0% 0.0% 0.0% 0.0% 60.5% 60.5% 39.5% 100.0%Pacific herring Gear type 0.0% 0.0% 0.0% 0.0% 9.0% 9.0% 0.0% 5.4%
gal Resource 0.0% 0.0% 0.0% 0.0% 100.0% 100.0% 0.0% 100.0%Total 0.0% 0.0% 0.0% 0.0% 5.4% 5.4% 0.0% 5.4%Gear type 0.0% 0.0% 0.0% 0.0% 0.0% 0.0% 0.0% 0.0%
gal Resource 0.0% 0.0% 0.0% 0.0% 0.0% 0.0% 0.0% 0.0%Total 0.0% 0.0% 0.0% 0.0% 0.0% 0.0% 0.0% 0.0%Gear type 0.0% 0.0% 0.0% 0.0% 0.0% 0.0% 0.0% 0.0%
gal Resource 0.0% 0.0% 0.0% 0.0% 0.0% 0.0% 0.0% 0.0%Total 0.0% 0.0% 0.0% 0.0% 0.0% 0.0% 0.0% 0.0%Gear type 0.0% 0.0% 0.0% 0.0% 0.0% 0.0% 0.0% 0.0%
gal Resource 0.0% 0.0% 0.0% 0.0% 0.0% 0.0% 0.0% 0.0%Total 0.0% 0.0% 0.0% 0.0% 0.0% 0.0% 0.0% 0.0%Gear type 0.0% 0.0% 0.0% 0.0% 0.0% 0.0% 0.0% 0.0%
gal Resource 0.0% 0.0% 0.0% 0.0% 0.0% 0.0% 0.0% 0.0%Total 0.0% 0.0% 0.0% 0.0% 0.0% 0.0% 0.0% 0.0%
Unknown smelt Gear type 0.0% 0.0% 0.0% 0.0% 0.0% 0.0% 0.0% 0.0%gal Resource 0.0% 0.0% 0.0% 0.0% 0.0% 0.0% 0.0% 0.0%
Total 0.0% 0.0% 0.0% 0.0% 0.0% 0.0% 0.0% 0.0%Sea bass Gear type 0.0% 0.0% 0.0% 0.0% 0.0% 0.0% 0.0% 0.0%
ind Resource 0.0% 0.0% 0.0% 0.0% 0.0% 0.0% 0.0% 0.0%Total 0.0% 0.0% 0.0% 0.0% 0.0% 0.0% 0.0% 0.0%
Pacific (gray) cod Gear type 0.0% 0.0% 0.0% 0.0% 0.0% 0.0% 0.0% 0.0%ind Resource 0.0% 0.0% 0.0% 0.0% 0.0% 0.0% 0.0% 0.0%
Total 0.0% 0.0% 0.0% 0.0% 0.0% 0.0% 0.0% 0.0%Pacific tomcod Gear type 0.0% 0.0% 0.0% 0.0% 0.0% 0.0% 0.0% 0.0%
ind Resource 0.0% 0.0% 0.0% 0.0% 0.0% 0.0% 0.0% 0.0%Total 0.0% 0.0% 0.0% 0.0% 0.0% 0.0% 0.0% 0.0%
Pacific herring sac roe
Any method
Pacific herring roe/unspecified
Pacific herring spawn on kelp
Eulachon (hooligan, candlefish)
-continued-
ResourcePercentage base
Removed from commercial
catch
Subsistence methods
Rod and reel
53

Setnet Seine Driftnet OtherSubsistence
gear, any methodUnitsa Pounds Pounds Pounds Pounds Pounds Pounds Pounds Pounds
Gear type 0.0% 0.0% 0.0% 0.0% 0.0% 0.0% 0.0% 0.0%ind Resource 0.0% 0.0% 0.0% 0.0% 0.0% 0.0% 0.0% 0.0%
Total 0.0% 0.0% 0.0% 0.0% 0.0% 0.0% 0.0% 0.0%Eel Gear type 0.0% 0.0% 0.0% 0.0% 0.0% 0.0% 0.0% 0.0%
ind Resource 0.0% 0.0% 0.0% 0.0% 0.0% 0.0% 0.0% 0.0%Total 0.0% 0.0% 0.0% 0.0% 0.0% 0.0% 0.0% 0.0%
Starry flounder Gear type 0.0% 0.0% 0.0% 0.0% 0.0% 0.0% 0.0% 0.0%ind Resource 0.0% 0.0% 0.0% 0.0% 0.0% 0.0% 0.0% 0.0%
Total 0.0% 0.0% 0.0% 0.0% 0.0% 0.0% 0.0% 0.0%Unknown flounder Gear type 0.0% 0.0% 0.0% 0.0% 0.0% 0.0% 0.0% 0.0%
ind Resource 0.0% 0.0% 0.0% 0.0% 0.0% 0.0% 0.0% 0.0%Total 0.0% 0.0% 0.0% 0.0% 0.0% 0.0% 0.0% 0.0%
Lingcod Gear type 0.0% 0.0% 0.0% 0.0% 0.0% 0.0% 4.6% 1.8%ind Resource 0.0% 0.0% 0.0% 0.0% 0.0% 0.0% 100.0% 100.0%
Total 0.0% 0.0% 0.0% 0.0% 0.0% 0.0% 1.8% 1.8%Unknown greenling Gear type 0.0% 0.0% 0.0% 0.0% 0.0% 0.0% 6.9% 2.7%
ind Resource 0.0% 0.0% 0.0% 0.0% 0.0% 0.0% 100.0% 100.0%Total 0.0% 0.0% 0.0% 0.0% 0.0% 0.0% 2.7% 2.7%
Pacific halibut Gear type 0.0% 0.0% 0.0% 0.0% 91.0% 91.0% 2.7% 56.2%lb Resource 0.0% 0.0% 0.0% 0.0% 98.1% 98.1% 1.9% 100.0%
Total 0.0% 0.0% 0.0% 0.0% 55.1% 55.1% 1.1% 56.2%Black rockfish Gear type 0.0% 0.0% 0.0% 0.0% 0.0% 0.0% 34.3% 13.6%
ind Resource 0.0% 0.0% 0.0% 0.0% 0.0% 0.0% 100.0% 100.0%Total 0.0% 0.0% 0.0% 0.0% 0.0% 0.0% 13.6% 13.6%
Red rockfish Gear type 0.0% 0.0% 0.0% 0.0% 0.0% 0.0% 0.0% 0.0%ind Resource 0.0% 0.0% 0.0% 0.0% 0.0% 0.0% 0.0% 0.0%
Total 0.0% 0.0% 0.0% 0.0% 0.0% 0.0% 0.0% 0.0%Yelloweye rockfish Gear type 0.0% 0.0% 0.0% 0.0% 0.0% 0.0% 15.3% 6.0%
ind Resource 0.0% 0.0% 0.0% 0.0% 0.0% 0.0% 100.0% 100.0%Total 0.0% 0.0% 0.0% 0.0% 0.0% 0.0% 6.0% 6.0%
ResourcePercentage base
Removed from commercial
catch
Subsistence methods
Rod and reelAny
method
Table 2-16.–Page 2 of 5.
-continued-
Walleye pollock (whiting)
54

Setnet Seine Driftnet OtherSubsistence
gear, any methodUnitsa Pounds Pounds Pounds Pounds Pounds Pounds Pounds Pounds
Quillback rockfish Gear type 0.0% 0.0% 0.0% 0.0% 0.0% 0.0% 16.0% 6.3%ind Resource 0.0% 0.0% 0.0% 0.0% 0.0% 0.0% 100.0% 100.0%
Total 0.0% 0.0% 0.0% 0.0% 0.0% 0.0% 6.3% 6.3%Dusky rockfish Gear type 0.0% 0.0% 0.0% 0.0% 0.0% 0.0% 2.3% 0.9%
ind Resource 0.0% 0.0% 0.0% 0.0% 0.0% 0.0% 100.0% 100.0%Total 0.0% 0.0% 0.0% 0.0% 0.0% 0.0% 0.9% 0.9%
Tiger rockfish Gear type 0.0% 0.0% 0.0% 0.0% 0.0% 0.0% 1.1% 0.5%ind Resource 0.0% 0.0% 0.0% 0.0% 0.0% 0.0% 100.0% 100.0%
Total 0.0% 0.0% 0.0% 0.0% 0.0% 0.0% 0.5% 0.5%China rockfish Gear type 0.0% 0.0% 0.0% 0.0% 0.0% 0.0% 2.3% 0.9%
ind Resource 0.0% 0.0% 0.0% 0.0% 0.0% 0.0% 100.0% 100.0%Total 0.0% 0.0% 0.0% 0.0% 0.0% 0.0% 0.9% 0.9%
Northern rockfish Gear type 0.0% 0.0% 0.0% 0.0% 0.0% 0.0% 0.6% 0.2%ind Resource 0.0% 0.0% 0.0% 0.0% 0.0% 0.0% 100.0% 100.0%
Total 0.0% 0.0% 0.0% 0.0% 0.0% 0.0% 0.2% 0.2%Boccaccio rockfish Gear type 0.0% 0.0% 0.0% 0.0% 0.0% 0.0% 2.9% 1.1%
ind Resource 0.0% 0.0% 0.0% 0.0% 0.0% 0.0% 100.0% 100.0%Total 0.0% 0.0% 0.0% 0.0% 0.0% 0.0% 1.1% 1.1%
Unknown rockfish Gear type 0.0% 0.0% 0.0% 0.0% 0.0% 0.0% 6.1% 2.4%ind Resource 0.0% 0.0% 0.0% 0.0% 0.0% 0.0% 100.0% 100.0%
Total 0.0% 0.0% 0.0% 0.0% 0.0% 0.0% 2.4% 2.4%Sablefish (black cod) Gear type 0.0% 0.0% 0.0% 0.0% 0.0% 0.0% 0.0% 0.0%
ind Resource 0.0% 0.0% 0.0% 0.0% 0.0% 0.0% 0.0% 0.0%Total 0.0% 0.0% 0.0% 0.0% 0.0% 0.0% 0.0% 0.0%
Unknown Irish lord Gear type 0.0% 0.0% 0.0% 0.0% 0.0% 0.0% 0.0% 0.0%ind Resource 0.0% 0.0% 0.0% 0.0% 0.0% 0.0% 0.0% 0.0%
Total 0.0% 0.0% 0.0% 0.0% 0.0% 0.0% 0.0% 0.0%Unknown sculpin Gear type 0.0% 0.0% 0.0% 0.0% 0.0% 0.0% 0.0% 0.0%
ind Resource 0.0% 0.0% 0.0% 0.0% 0.0% 0.0% 0.0% 0.0%Total 0.0% 0.0% 0.0% 0.0% 0.0% 0.0% 0.0% 0.0%
-continued-
Table 2-16.–Page 3 of 5.
ResourcePercentage base
Removed from commercial
catch
Subsistence methods
Rod and reelAny
method
55
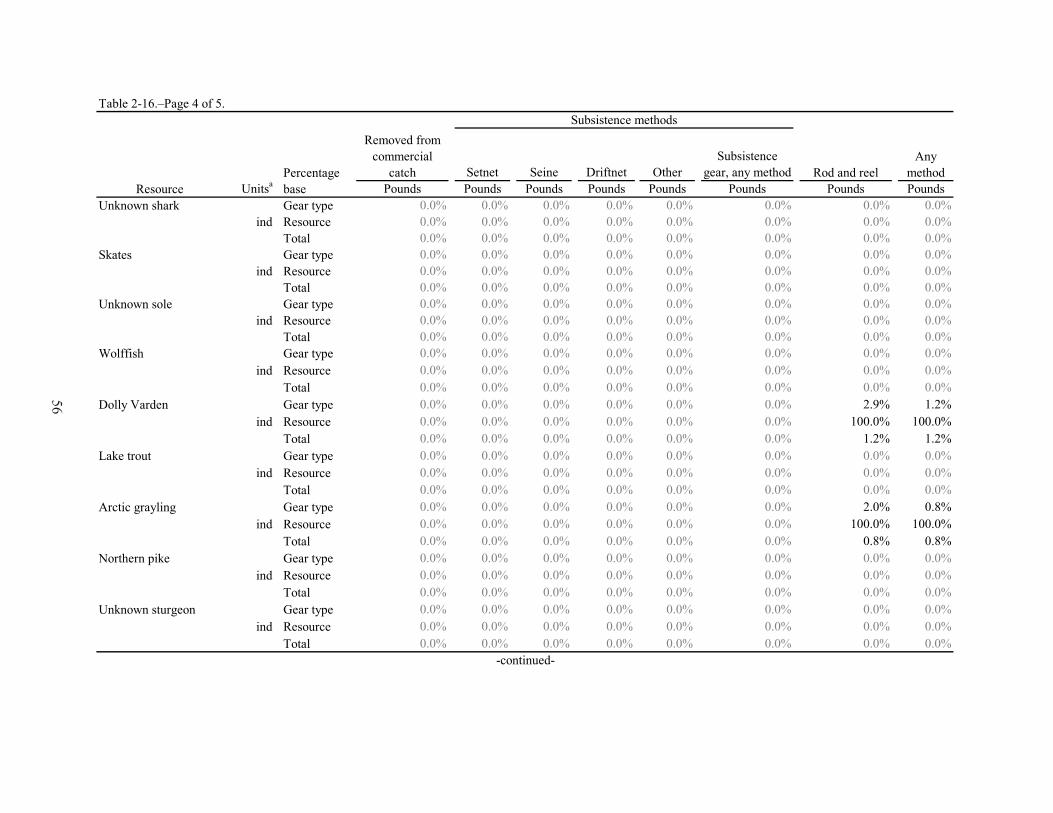
Setnet Seine Driftnet OtherSubsistence
gear, any methodUnitsa Pounds Pounds Pounds Pounds Pounds Pounds Pounds Pounds
Unknown shark Gear type 0.0% 0.0% 0.0% 0.0% 0.0% 0.0% 0.0% 0.0%ind Resource 0.0% 0.0% 0.0% 0.0% 0.0% 0.0% 0.0% 0.0%
Total 0.0% 0.0% 0.0% 0.0% 0.0% 0.0% 0.0% 0.0%Skates Gear type 0.0% 0.0% 0.0% 0.0% 0.0% 0.0% 0.0% 0.0%
ind Resource 0.0% 0.0% 0.0% 0.0% 0.0% 0.0% 0.0% 0.0%Total 0.0% 0.0% 0.0% 0.0% 0.0% 0.0% 0.0% 0.0%
Unknown sole Gear type 0.0% 0.0% 0.0% 0.0% 0.0% 0.0% 0.0% 0.0%ind Resource 0.0% 0.0% 0.0% 0.0% 0.0% 0.0% 0.0% 0.0%
Total 0.0% 0.0% 0.0% 0.0% 0.0% 0.0% 0.0% 0.0%Wolffish Gear type 0.0% 0.0% 0.0% 0.0% 0.0% 0.0% 0.0% 0.0%
ind Resource 0.0% 0.0% 0.0% 0.0% 0.0% 0.0% 0.0% 0.0%Total 0.0% 0.0% 0.0% 0.0% 0.0% 0.0% 0.0% 0.0%
Dolly Varden Gear type 0.0% 0.0% 0.0% 0.0% 0.0% 0.0% 2.9% 1.2%ind Resource 0.0% 0.0% 0.0% 0.0% 0.0% 0.0% 100.0% 100.0%
Total 0.0% 0.0% 0.0% 0.0% 0.0% 0.0% 1.2% 1.2%Lake trout Gear type 0.0% 0.0% 0.0% 0.0% 0.0% 0.0% 0.0% 0.0%
ind Resource 0.0% 0.0% 0.0% 0.0% 0.0% 0.0% 0.0% 0.0%Total 0.0% 0.0% 0.0% 0.0% 0.0% 0.0% 0.0% 0.0%
Arctic grayling Gear type 0.0% 0.0% 0.0% 0.0% 0.0% 0.0% 2.0% 0.8%ind Resource 0.0% 0.0% 0.0% 0.0% 0.0% 0.0% 100.0% 100.0%
Total 0.0% 0.0% 0.0% 0.0% 0.0% 0.0% 0.8% 0.8%Northern pike Gear type 0.0% 0.0% 0.0% 0.0% 0.0% 0.0% 0.0% 0.0%
ind Resource 0.0% 0.0% 0.0% 0.0% 0.0% 0.0% 0.0% 0.0%Total 0.0% 0.0% 0.0% 0.0% 0.0% 0.0% 0.0% 0.0%
Unknown sturgeon Gear type 0.0% 0.0% 0.0% 0.0% 0.0% 0.0% 0.0% 0.0%ind Resource 0.0% 0.0% 0.0% 0.0% 0.0% 0.0% 0.0% 0.0%
Total 0.0% 0.0% 0.0% 0.0% 0.0% 0.0% 0.0% 0.0%
Table 2-16.–Page 4 of 5.
ResourcePercentage base
Removed from commercial
catch
Subsistence methods
Rod and reelAny
method
-continued-
56

Setnet Seine Driftnet OtherSubsistence
gear, any methodUnitsa Pounds Pounds Pounds Pounds Pounds Pounds Pounds Pounds
Cutthroat trout Gear type 0.0% 0.0% 0.0% 0.0% 0.0% 0.0% 0.0% 0.0%ind Resource 0.0% 0.0% 0.0% 0.0% 0.0% 0.0% 0.0% 0.0%
Total 0.0% 0.0% 0.0% 0.0% 0.0% 0.0% 0.0% 0.0%Rainbow trout Gear type 0.0% 0.0% 0.0% 0.0% 0.0% 0.0% 0.0% 0.0%
ind Resource 0.0% 0.0% 0.0% 0.0% 0.0% 0.0% 0.0% 0.0%Total 0.0% 0.0% 0.0% 0.0% 0.0% 0.0% 0.0% 0.0%
Steelhead Gear type 0.0% 0.0% 0.0% 0.0% 0.0% 0.0% 0.0% 0.0%ind Resource 0.0% 0.0% 0.0% 0.0% 0.0% 0.0% 0.0% 0.0%
Total 0.0% 0.0% 0.0% 0.0% 0.0% 0.0% 0.0% 0.0%Unknown whitefishes Gear type 0.0% 0.0% 0.0% 0.0% 0.0% 0.0% 0.0% 0.0%
ind Resource 0.0% 0.0% 0.0% 0.0% 0.0% 0.0% 0.0% 0.0%Total 0.0% 0.0% 0.0% 0.0% 0.0% 0.0% 0.0% 0.0%
Any method
a. The harvested number of each resource is measured by the unit in which the resource harvest information was collected; the unit of measurement is provided foreach resource.
Source ADF&G Division of Subsistence household surveys, 2015.
Table 2-16.–Page 5 of 5.
ResourcePercentage base
Removed from commercial
catch
Subsistence methods
Rod and reel
57

Figure 2-16.–Fishing and harvest locations of all nonsalmon fish resources, Chenega Bay, 2014.
G u l f o f A l a s k a
Evans
Island
LaTouche
Island
Bainbridge
Island
Prin
ceof
Wal
esPa
ssag
e
Knight Island Passage
LaTo
uche
Pass
age
Po
rt
Ba
i nb
r id
ge
Mo n
t ag
ue
St r
ai t
Elringto
n Passage
Sawmill Bay
Bainbr
idge
Pass
age
CrabBay
Chenega Bay!
0 42Miles
This map depicts areas used forresource harvesting in 2014 by 7
surveyed households in Chenega Bay,Alaska. The total survey sampleincludes 12 of 17 households in
Chenega Bay (71%), so this map is apartial representation of areas used forresource harvests in 2014. Resourceharvest areas change over time, so
areas not used in 2014 might be used inother years.
Source:Alaska Department of Fish and Game(ADF&G) Division of Subsistence,
2015.North American Datum 1927.
Alaska Albers Projection.
Map created by: Terri Lemons
EVOS 2014
Chenega Bay
!Nonsalmon fishsearch and harvest areas
1:200,000SCALE:
147°45'W
147°45'W
148°W
148°W
148°15'W
148°15'W
60°N
58

Figure 2-17.–Composition of large land mammal harvest in pounds usable weight, Chenega Bay, 2014.
in the bay is thought to produce anaerobic environments that discourage the presence of Pacific halibut, rockfish, crabs, and shrimp. This concern was brought up again during the community review meeting. Two households mentioned concerns regarding the federal subsistence Pacific halibut program. While the program seems to be appreciated by much of the community, some recommendations were made. First, at least 1 household has had problems acquiring the SHARC because of the timing of an address change. He said that communication about the problem has not lead to a resolution. Another household head mentioned that he would like to be able to help his spouse to fish under this program. He said that the spouse of a SHARC holder should be able to at least help to reel the fish in, regardless of his/her status as a tribal member or duration of residency in the community.
Large Land MammalsLarge land mammals made up approximately 15% of the overall wild food harvest in Chenega Bay in 2014 (Figure 2-10). The community harvested approximately 1,379 lb of large land mammals, or about 39 lb per capita (Table 2-13). These species were used by 75% of households. Moose made up the greatest percentage of the large land mammal harvest (55%), followed by Sitka black-tailed deer (27%), and black bear (18%) (Figure 2-17). Only 8% of households used caribou (not available locally) and no households used mountain goats (Table 2-13); use of these 2 species is reduced substantially from 2003 when 38% of households used caribou and 25% used mountain goats (Fall 2006:36). Deer was the most frequently shared large land mammal species in the community with 67% of households receiving it and 25% giving it away. The per capita harvest of moose was approximately 22 lb and this resource was used by 33% of households (Table 2-13). This species has a very limited range locally. Only 17% of households attempted to harvest moose and 8% of Chenega Bay households harvested moose in 2014. Moose was received by 25% of households. Though the per capita harvest of deer was less than moose (10 lb), it was used by a much larger percentage of households (75%). Approximately 25% of households attempted to harvest deer and 17% of Chenega Bay households harvested deer in 2014. The harvest weight for 2014 is reduced significantly compared to 2003 when 2,160 lb were harvested for the community, or 38 lb per capita (Fall 2006:36). The 2003 per capita harvest was an estimated 32% less than it was in the 1997 study year (survey period spanned
Black bear18%
Deer27%
Moose55%
59

Table 2-17.–Estimated large land mammal harvests by month and sex, Chenega Bay, 2014.
Jan Feb Mar Apr May Jun Jul Aug Sep Oct Nov Dec UnkAll large land mammals 0.0 0.0 0.0 1.4 0.0 0.0 2.8 4.3 0.0 0.0 4.3 1.4 0.0 14.2
Black bear 0.0 0.0 0.0 1.4 0.0 0.0 2.8 0.0 0.0 0.0 0.0 0.0 0.0 4.3Caribou 0.0 0.0 0.0 0.0 0.0 0.0 0.0 0.0 0.0 0.0 0.0 0.0 0.0 0.0
Caribou, male 0.0 0.0 0.0 0.0 0.0 0.0 0.0 0.0 0.0 0.0 0.0 0.0 0.0 0.0Caribou, female 0.0 0.0 0.0 0.0 0.0 0.0 0.0 0.0 0.0 0.0 0.0 0.0 0.0 0.0Caribou, unknown sex 0.0 0.0 0.0 0.0 0.0 0.0 0.0 0.0 0.0 0.0 0.0 0.0 0.0 0.0
Deer 0.0 0.0 0.0 0.0 0.0 0.0 0.0 2.8 0.0 0.0 4.3 1.4 0.0 8.5Mountain goat 0.0 0.0 0.0 0.0 0.0 0.0 0.0 0.0 0.0 0.0 0.0 0.0 0.0 0.0Moose 0.0 0.0 0.0 0.0 0.0 0.0 0.0 1.4 0.0 0.0 0.0 0.0 0.0 1.4
Moose, bull 0.0 0.0 0.0 0.0 0.0 0.0 0.0 1.4 0.0 0.0 0.0 0.0 0.0 1.4Moose, cow 0.0 0.0 0.0 0.0 0.0 0.0 0.0 0.0 0.0 0.0 0.0 0.0 0.0 0.0Moose, unknown sex 0.0 0.0 0.0 0.0 0.0 0.0 0.0 0.0 0.0 0.0 0.0 0.0 0.0 0.0
Dall sheep 0.0 0.0 0.0 0.0 0.0 0.0 0.0 0.0 0.0 0.0 0.0 0.0 0.0 0.0Dall sheep, unknown sex 0.0 0.0 0.0 0.0 0.0 0.0 0.0 0.0 0.0 0.0 0.0 0.0 0.0 0.0Source ADF&G Division of Subsistence household surveys, 2015.
ResourceEstimated harvest by month
Total
October 1997–September 1998) (Fall and Utermohle 1999:N-5). This downward trend in deer harvests is likely due to several factors, including most recently the record-breaking snowfalls of 2011–2012, which decimated deer populations in many areas.10
Black bear was the third most used large mammal resource in 2014 with a per capita harvest of approximately 7 lb (Table 2-13). There were approximately 25% of households that attempted to harvest black bears and 17% of Chenega Bay households harvested this species. The resource was shared minimally with only 8% of households receiving or giving it away. Caribou was also used by 8% of households but no household attempted to harvest it; the resource was received. Mountain goat and Dall sheep harvests were attempted by 8% of households but these were not successful and no household reported use of these species; these 2 species do not occur in the vicinity of Evans Island. A total of approximately 14 individual large land mammals were harvested in 2014. Black bears were harvested in April and July (Table 2-17). Moose were harvested in August and only bulls were targeted. Deer were harvested in August, November, and December, with the majority (4) taken in November. The results of this study suggested the harvest of a single moose in Chenega Bay in 2014, though this was expanded to 1.4 moose to account for households that were not surveyed. This correlates with the reported moose harvest from returned harvest tickets that are collected by ADF&G Division of Wildlife Conservation and recorded in the WinfoNet11 database (accessed October 2015). Deer harvest surveys were not required prior to 2011, and the harvest ticket record for 2014 (4 deer harvested) is only one-half of the deer harvest estimate based on this survey (8 deer harvested). Interestingly, analysis for this survey effort estimated that approximately 3 households of 12 surveyed (25%) attempted to harvest deer but the harvest tickets indicate 6 households attempted to harvest deer. These ambiguities may be related to expansion factors, unsurveyed households, and underreporting. No mountain goats were reportedly harvested in both this study and on returned harvest tickets.Large land mammals were primarily hunted near the community of Chenega Bay on Evans Island (Figure 2-18). While at least 1 moose was harvested by a Chenega Bay household in 2014, respondents declined to map the search and harvest locations. Deer were hunted to the north and east of the community, including along the road leading to the airport. Black bears were hunted opportunistically in this area as well, but also
10. Jennifer Gibbins, “Brutal winter puts hurt on deer population of Prince William Sound,” Alaska Dispatch News, December 4, 2012. http://www.adn.com/article/brutal-winter-puts-hurt-deer-population-prince-william-sound (accessed on November 13, 2015). 11. The ADF&G maintains a record of hunters’ and trappers’ reported wildlife harvests and related information in a database known as the Wildlife Information Network (WinfoNet). Data in WinfoNet are accessed through an ADF&G intranet website. Some harvests of large land mammals and furbearers are required by regulation to be reported to the Division of Wildlife Conser-vation in the form of a general hunt harvest ticket or a harvest report from a registration, drawing, Tier I, or Tier II hunt permit, or by having furs of certain species sealed by ADF&G or a certified fur sealer (5 AAC 92.010; 5 AAC 92.170).
60
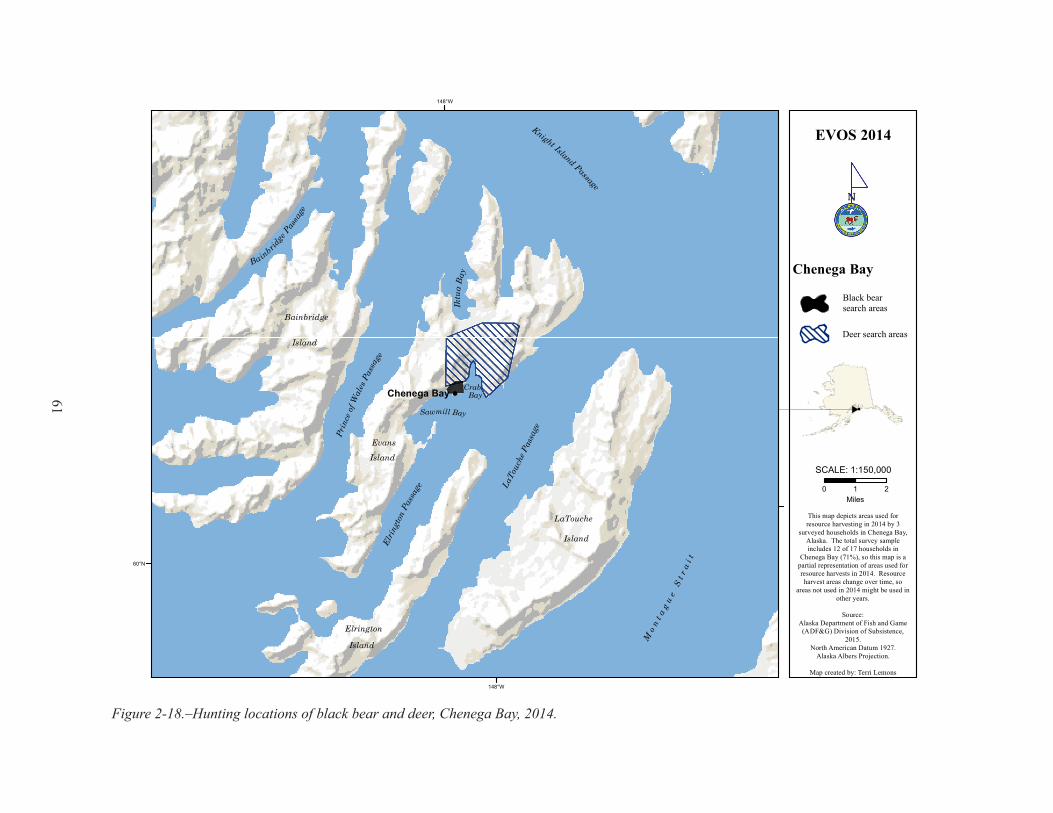
Figure 2-18.–Hunting locations of black bear and deer, Chenega Bay, 2014.
!
Evans
Island
LaTouche
Island
Bainbridge
IslandPr
ince
ofW
ales
Pass
age
Knight Island Passage
LaTo
uche
Pass
age
Mo n
t ag
ue
St r
ai t
Elrin
gton
Pass
age
Sawmill Bay
Bainbridge
Passa
ge
Elrington
Island
CrabBay
Iktu
aB
ay
Chenega Bay
0 21Miles
This map depicts areas used forresource harvesting in 2014 by 3
surveyed households in Chenega Bay,Alaska. The total survey sampleincludes 12 of 17 households in
Chenega Bay (71%), so this map is apartial representation of areas used forresource harvests in 2014. Resourceharvest areas change over time, so
areas not used in 2014 might be used inother years.
Source:Alaska Department of Fish and Game(ADF&G) Division of Subsistence,
2015.North American Datum 1927.
Alaska Albers Projection.
Map created by: Terri Lemons
EVOS 2014
Chenega Bay
Black bear search areas
1:150,000SCALE:
Deer search areas
148°W
148°W
60°N
61
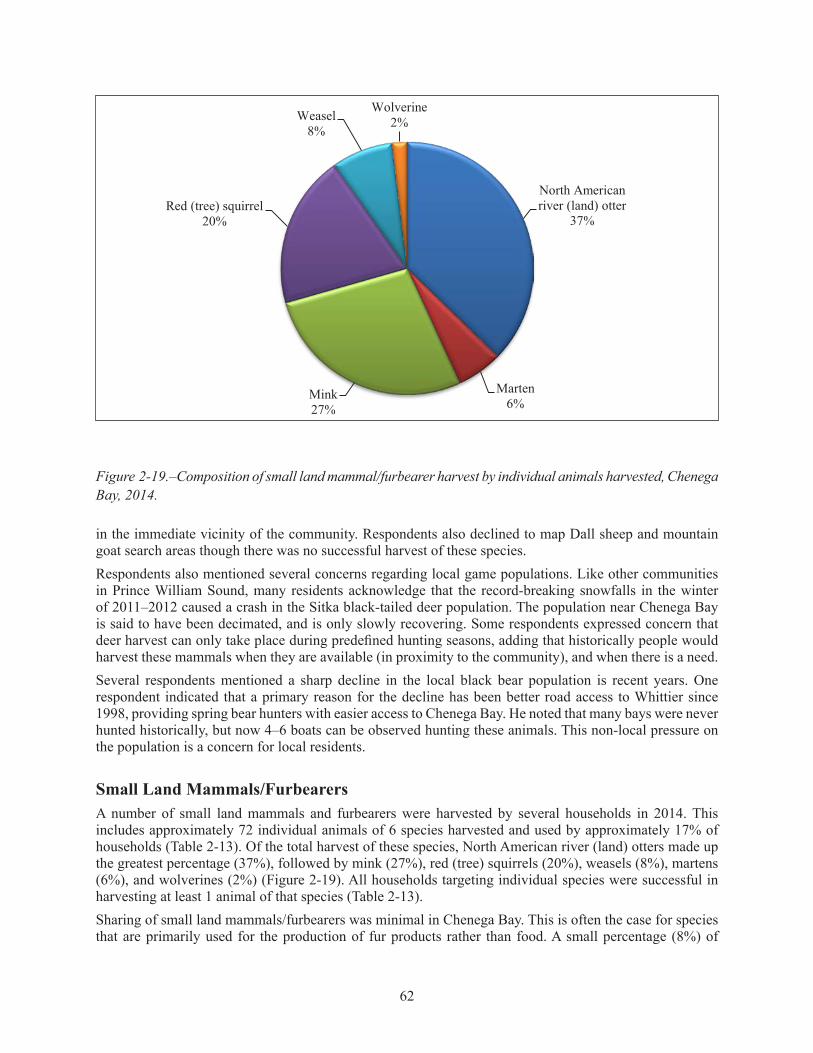
Figure 2-19.–Composition of small land mammal/furbearer harvest by individual animals harvested, Chenega Bay, 2014.
in the immediate vicinity of the community. Respondents also declined to map Dall sheep and mountain goat search areas though there was no successful harvest of these species.Respondents also mentioned several concerns regarding local game populations. Like other communities in Prince William Sound, many residents acknowledge that the record-breaking snowfalls in the winter of 2011–2012 caused a crash in the Sitka black-tailed deer population. The population near Chenega Bay is said to have been decimated, and is only slowly recovering. Some respondents expressed concern that deer harvest can only take place during predefined hunting seasons, adding that historically people would harvest these mammals when they are available (in proximity to the community), and when there is a need. Several respondents mentioned a sharp decline in the local black bear population is recent years. One respondent indicated that a primary reason for the decline has been better road access to Whittier since 1998, providing spring bear hunters with easier access to Chenega Bay. He noted that many bays were never hunted historically, but now 4–6 boats can be observed hunting these animals. This non-local pressure on the population is a concern for local residents.
Small Land Mammals/FurbearersA number of small land mammals and furbearers were harvested by several households in 2014. This includes approximately 72 individual animals of 6 species harvested and used by approximately 17% of households (Table 2-13). Of the total harvest of these species, North American river (land) otters made up the greatest percentage (37%), followed by mink (27%), red (tree) squirrels (20%), weasels (8%), martens (6%), and wolverines (2%) (Figure 2-19). All households targeting individual species were successful in harvesting at least 1 animal of that species (Table 2-13). Sharing of small land mammals/furbearers was minimal in Chenega Bay. This is often the case for species that are primarily used for the production of fur products rather than food. A small percentage (8%) of
North American river (land) otter
37%
Marten6%
Mink27%
Red (tree) squirrel20%
Weasel8%
Wolverine2%
62

Table 2-18.–Estimated small land mammal/furbearer harvests by month, Chenega Bay, 2014.
Jan Feb Mar Apr May Jun Jul Aug Sep Oct Nov Dec UnkAll small land mammals 32.6 0.0 0.0 0.0 0.0 0.0 0.0 7.1 7.1 0.0 5.7 5.7 14.2 72.3
Beaver 0.0 0.0 0.0 0.0 0.0 0.0 0.0 0.0 0.0 0.0 0.0 0.0 0.0 0.0Coyote 0.0 0.0 0.0 0.0 0.0 0.0 0.0 0.0 0.0 0.0 0.0 0.0 0.0 0.0Red fox 0.0 0.0 0.0 0.0 0.0 0.0 0.0 0.0 0.0 0.0 0.0 0.0 0.0 0.0Snowshoe hare 0.0 0.0 0.0 0.0 0.0 0.0 0.0 0.0 0.0 0.0 0.0 0.0 0.0 0.0North american river (land) otter 7.1 0.0 0.0 0.0 0.0 0.0 0.0 0.0 0.0 0.0 5.7 0.0 14.2 26.9
Lynx 0.0 0.0 0.0 0.0 0.0 0.0 0.0 0.0 0.0 0.0 0.0 0.0 0.0 0.0Marten 1.4 0.0 0.0 0.0 0.0 0.0 0.0 0.0 0.0 0.0 0.0 2.8 0.0 4.3Mink 19.8 0.0 0.0 0.0 0.0 0.0 0.0 0.0 0.0 0.0 0.0 0.0 0.0 19.8Muskrat 0.0 0.0 0.0 0.0 0.0 0.0 0.0 0.0 0.0 0.0 0.0 0.0 0.0 0.0Porcupine 0.0 0.0 0.0 0.0 0.0 0.0 0.0 0.0 0.0 0.0 0.0 0.0 0.0 0.0Arctic ground (parka) squirrel 0.0 0.0 0.0 0.0 0.0 0.0 0.0 0.0 0.0 0.0 0.0 0.0 0.0 0.0
Red (tree) squirrel 0.0 0.0 0.0 0.0 0.0 0.0 0.0 7.1 7.1 0.0 0.0 0.0 0.0 14.2Weasel 2.8 0.0 0.0 0.0 0.0 0.0 0.0 0.0 0.0 0.0 0.0 2.8 0.0 5.7Gray wolf 0.0 0.0 0.0 0.0 0.0 0.0 0.0 0.0 0.0 0.0 0.0 0.0 0.0 0.0Wolverine 1.4 0.0 0.0 0.0 0.0 0.0 0.0 0.0 0.0 0.0 0.0 0.0 0.0 1.4
Estimated harvest by month
Source ADF&G Division of Subsistence household surveys, 2015.
Resource Total
households gave away river otters and red squirrels, and 8% of households received red squirrels (Table 2-13). Most small land mammals were harvested in the winter months between November and January, with 45% harvested in January alone (Table 2-18). Only red squirrels were harvested outside of that range in August and September. Approximately 14 river otters were harvested in unknown months, indicating that harvesting households did not recall the exact months of harvest.Few households harvesting small land mammals/furbearers opted to provide spatial harvest data. These species were primarily harvested in the immediate vicinity of the community (Figure 2-20). Respondents indicated that squirrels are not present on Evans Island. Squirrels were hunted on the mainland, but the precise locations were not specified. A trapper in Chenega Bay mentioned concerns regarding the mink population during the winter of 2014–2015. He said that this is the first year that he has expended the same efforts as in the previous 2 decades but has trapped only 5% of the normal amount of mink that he typically would harvest. He found this particularly alarming and said that he would have “bet practically anything” that he would be successful in trapping this species since he has been for many years. He would like to know more about the cause of this drastic decline and presumes a disease like parvovirus or distemper has taken a toll on mink numbers in the surrounding islands.
Marine MammalsHarbor seal and sea otter were the only 2 marine mammal species used in Chenega Bay during 2014 (Table 2-13). Only sea otters were harvested by surveyed community members, and those were used primarily for fur rather than consumption. The harvest totaled 20 animals harvested during the winter months of December and January (Table 2-19). All harbor seal resources used in the community were received, although attempts were made to harvest locally (Table 2-13). Both harbor seals and sea otters were shared by 8% of households; sea otters were used by 17% of households and harbor seals were used by 42%.
63
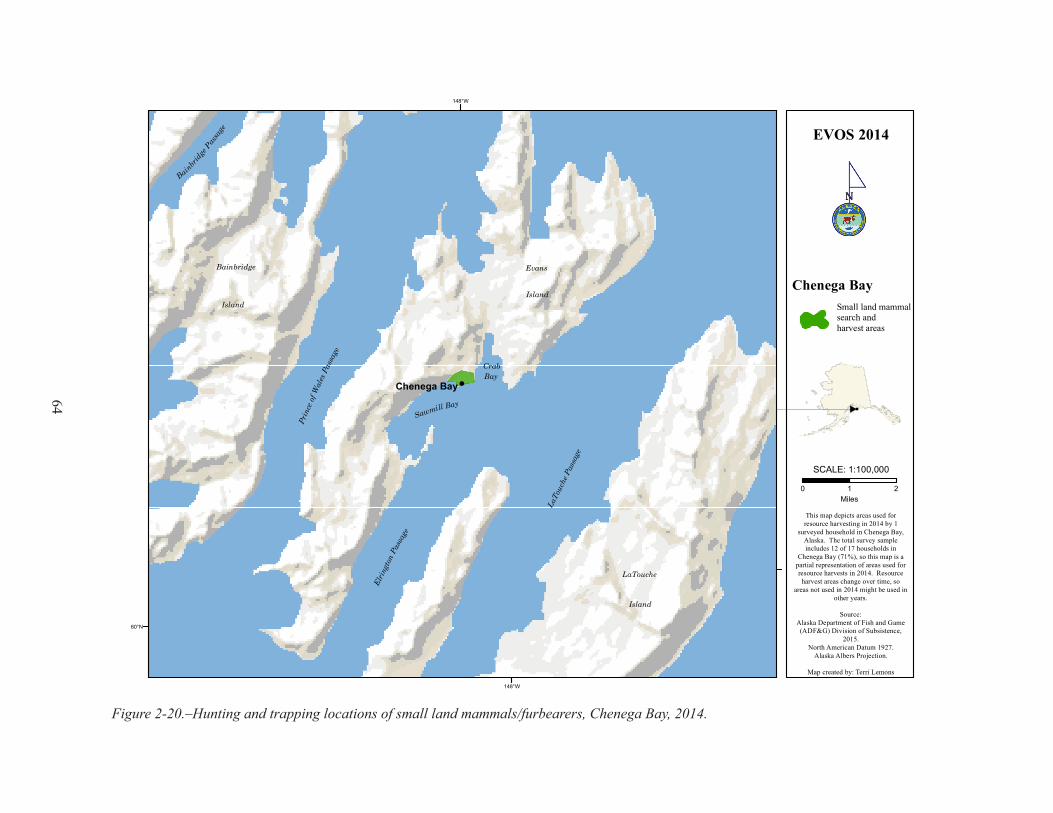
Figure 2-20.–Hunting and trapping locations of small land mammals/furbearers, Chenega Bay, 2014.
!
Evans
Island
LaTouche
Island
Bainbridge
IslandPr
ince
ofW
ales
Pass
age
LaTo
uche
Pass
age
Elrin
gton
Pass
age
Sawmill Bay
Bainbr
idge Pas
sage
CrabBay
Chenega Bay
0 21Miles
This map depicts areas used forresource harvesting in 2014 by 1
surveyed household in Chenega Bay,Alaska. The total survey sampleincludes 12 of 17 households in
Chenega Bay (71%), so this map is apartial representation of areas used forresource harvests in 2014. Resourceharvest areas change over time, so
areas not used in 2014 might be used inother years.
Source:Alaska Department of Fish and Game(ADF&G) Division of Subsistence,
2015.North American Datum 1927.
Alaska Albers Projection.
Map created by: Terri Lemons
EVOS 2014
Chenega BaySmall land mammal search and harvest areas
1:100,000SCALE:
148°W
148°W
60°N
64

Table 2-19.–Estimated marine mammal harvests by month and sex, Chenega Bay, 2014.
Jan Feb Mar Apr May Jun Jul Aug Sep Oct Nov Dec UnkAll marine mammals 9.9 0.0 0.0 0.0 0.0 0.0 0.0 0.0 0.0 0.0 0.0 9.9 0.0 19.8
Harbor seal 0.0 0.0 0.0 0.0 0.0 0.0 0.0 0.0 0.0 0.0 0.0 0.0 0.0 0.0Harbor seal, male 0.0 0.0 0.0 0.0 0.0 0.0 0.0 0.0 0.0 0.0 0.0 0.0 0.0 0.0Harbor seal, female 0.0 0.0 0.0 0.0 0.0 0.0 0.0 0.0 0.0 0.0 0.0 0.0 0.0 0.0Harbor seal, unknown sex 0.0 0.0 0.0 0.0 0.0 0.0 0.0 0.0 0.0 0.0 0.0 0.0 0.0 0.0
Sea otter 9.9 0.0 0.0 0.0 0.0 0.0 0.0 0.0 0.0 0.0 0.0 9.9 0.0 19.8Steller sea lion 0.0 0.0 0.0 0.0 0.0 0.0 0.0 0.0 0.0 0.0 0.0 0.0 0.0 0.0
Steller sea lion, male 0.0 0.0 0.0 0.0 0.0 0.0 0.0 0.0 0.0 0.0 0.0 0.0 0.0 0.0Steller sea lion, female 0.0 0.0 0.0 0.0 0.0 0.0 0.0 0.0 0.0 0.0 0.0 0.0 0.0 0.0Steller sea lion, unknown sex 0.0 0.0 0.0 0.0 0.0 0.0 0.0 0.0 0.0 0.0 0.0 0.0 0.0 0.0
Source ADF&G Division of Subsistence household surveys, 2015.
Estimated harvest by monthResource Total
This marine mammal harvest amount differs from previous harvest study results in Chenega Bay. In 2003, community members reported harvesting only harbor seal, taking 2,590 lb (46 lb per capita) (Fall 2006:36); the 2003 per capita harvest was 207% more compared to the 1997 harvest amount of 868 lb (15 lb per capita) (Fall and Utermohle 1999:N-5). In the 1997 study year, 40% of households harvested marine mammals, compared to a slightly higher 44% in 2003. During the 2003 survey, Chenega Bay residents reported that marine mammal populations had decreased in the past 5 years (1998–2003) but the arrival of Pacific herring near the community attracted marine mammal species (Fall 2006:A-110, 24). During the study year of 2014, large amounts of Pacific herring also arrived in the vicinity of the community according to survey respondents’ observations. Although residents reported seeing other marine mammal populations feeding on the fish, the harbor seal harvest amounts did not appear to be affected.Results from harvest surveys conducted by the Alaska Native Harbor Seal Commission (ANHSC) differ slightly from this study in that 4 individual harbor seals were reported harvested in 2014 (Bernadine Erickson, Alaska Native Harbor Seal Commission Project Coordinator, Anchorage, personal communication, July 2015). This difference may be due to recording a harvest by a household that was not surveyed in this study. The resultant per capita harvest of harbor seals according to the ANHSC was only 0.09 lb. Harvest data for sea lions and harbor seals were also collected by ADF&G and ANHSC for all years between 1992 and 2008, except 1999 (Wolfe et al. 2009). According to these data, sea lion harvests dropped substantially throughout this period, with a high harvest of 18 individuals in 1993 and a low harvest of 0 individuals by 2008. The trend was similar for the harvest of harbor seals, though there were spikes in harvest in both 2003 (60 individuals harvested) and 2007 (40 individuals harvested). The highest harvest of harbor seals during this period occurred in 1993 (63 individuals harvested). Marine mammal search and harvest areas for Chenega Bay were reported in western Prince William Sound (Figure 2-21). Seals were hunted near Chenega Island in the vicinity of the old Chenega village site. Sea otters were hunted in proximity to the Evans and LaTouche islands. No other marine mammal search and harvest areas were reported.
65

Figure 2-21.–Hunting locations of harbor seals and sea otters, Chenega Bay, 2014.
!
!
Evans
Island
LaTouche
Island
Bainbridge
Island
Prin
ceof
Wal
esPa
ssag
e
Knight
Island
Knight Island Passage
LaTo
uche
Pass
age
Po
rt
Ba
i nb
r id
ge
Mo n
t ag
ue
St r
ai t
IcyBay
Elrin
gton
Passa
ge
Sawmill Bay
HorseshoeBay
Wha
leBa
y
Bainbr
idge
Pass
age
Chenega
Island
Chenega (Old Site)
Chenega Bay
0 42Miles
This map depicts areas used forresource harvesting in 2014 by 2
surveyed households in Chenega Bay,Alaska. The total survey sampleincludes 12 of 17 households in
Chenega Bay (71%), so this map is apartial representation of areas used forresource harvests in 2014. Resourceharvest areas change over time, so
areas not used in 2014 might be used inother years.
Source:Alaska Department of Fish and Game(ADF&G) Division of Subsistence,
2015.North American Datum 1927.
Alaska Albers Projection.
Map created by: Terri Lemons
EVOS 2014
Chenega BayMarine mammalsearch and harvest areas
1:200,000SCALE:
147°45'W
147°45'W
148°W
148°W
148°15'W
148°15'W
60°15'N
66

Figure 2-22.–Composition of bird and bird egg harvest in pounds usable weight, Chenega Bay, 2014.
Bufflehead6%
Goldeneye23%
Mallard35%
Unknown ducks12%
Unknown Canada/cackling
geese4%
White-fronted goose5%
Spruce grouse6%
Unknown grouse1%
Unknown goose eggs4%
Unknown gull eggs4%
Birds and EggsFive known bird species composed the majority of the Chenega Bay birds and eggs harvest in 2014: mallard (35%), goldeneye (23%), bufflehead (6%), spruce grouse (6%), and white-fronted goose (5%) (Figure 2-22). Unknown ducks, geese, and grouse species were also included in this harvest, making up 12%, 4%, and 1% of the harvest, respectively. Unknown gull eggs (4%) and unknown goose eggs (4%) were also estimated as part of the birds and eggs harvest. Altogether, this accounted for 1% of the total wild food harvest amount, at 133 lb (4 lb per capita) (Figure 2-10; Table 2-13). Birds and eggs were used by 50% of households, with 33% of households harvesting and 17% of households giving these resources away (Table 2-13). The majority of birds were harvested during fall months, with some harvested in the summer and a few in the winter (Table 2-20).While the harvest of birds and eggs by Chenega Bay residents in 2003 was less than one-half of what was harvested in the 1997 study year, the amounts harvested remained relatively stable between 2003 (3 lb per capita) and 2014 (4 lb per capita) (Fall 2006:24) (Table 2-13). There is only a small difference between the 2014 birds and eggs harvest of 133 lb and the 2003 harvest amount of 140 lb, which are down from 369 lb (6 lb per capita) in 1997 harvested by 53% of households (Fall and Utermohle 1999:N-6). In 2003, just over 60% of households used birds and eggs, while 44% harvested, compared to 50% of households using and 33% harvesting in 2014. Some bird populations were perceived to be declining due to overharvesting in the past few years. However, the small populations of harlequin ducks were considered to be still recovering from the oil spill.According to several respondents, spruce grouse populations in the vicinity of Chenega Bay have also been depressed for several years. Some respondents attribute this to an overharvest by local residents several years ago. Most respondents mentioned a desire to see this species recover locally, and they appear to be doing so, albeit slowly. One respondent noted severe declines of ptarmigan on nearby LaTouche Island. He explained that LaTouche Island was once one of the best places in the state to hunt this species, but that now
67

Table 2-20.–Estimated bird harvests by season, Chenega Bay, 2014.
Spring Summer Fall WinterSeason
unknownAll birds 0.0 43.9 104.8 2.8 0.0 151.6
Bufflehead 0.0 0.0 19.8 0.0 0.0 19.8Unknown eider 0.0 0.0 0.0 0.0 0.0 0.0Goldeneye 0.0 0.0 38.3 0.0 0.0 38.3Harlequin duck 0.0 0.0 0.0 0.0 0.0 0.0Mallard 0.0 11.3 41.1 0.0 0.0 52.4Unknown merganser 0.0 0.0 0.0 0.0 0.0 0.0Long-tailed duck 0.0 0.0 0.0 0.0 0.0 0.0Northern pintail 0.0 0.0 0.0 0.0 0.0 0.0Unknown scaup 0.0 0.0 0.0 0.0 0.0 0.0Black scoter 0.0 0.0 0.0 0.0 0.0 0.0Surf scoter 0.0 0.0 0.0 0.0 0.0 0.0White-winged scoter 0.0 0.0 0.0 0.0 0.0 0.0Northern shoveler 0.0 0.0 0.0 0.0 0.0 0.0Unknown teal 0.0 0.0 0.0 0.0 0.0 0.0Unknown wigeon 0.0 0.0 0.0 0.0 0.0 0.0Unknown ducks 0.0 21.3 0.0 0.0 0.0 21.3Unknown Canada/cackling geese 0.0 0.0 1.4 2.8 0.0 4.3White-fronted goose 0.0 0.0 2.8 0.0 0.0 2.8Sandhill crane 0.0 0.0 0.0 0.0 0.0 0.0Unknown cormorant 0.0 0.0 0.0 0.0 0.0 0.0Unknown gull 0.0 0.0 0.0 0.0 0.0 0.0Black-legged kittiwake 0.0 0.0 0.0 0.0 0.0 0.0Unknown murre 0.0 0.0 0.0 0.0 0.0 0.0Unknown puffin 0.0 0.0 0.0 0.0 0.0 0.0Spruce grouse 0.0 11.3 0.0 0.0 0.0 11.3Unknown grouse 0.0 0.0 1.4 0.0 0.0 1.4Source ADF&G Division of Subsistence household surveys, 2015.
Estimated harvest by season
TotalResource
he only sees 2 or 3 of the birds annually. Overharvesting was also suggested as a reason for local declines in harlequin ducks and pigeon guillemots.Bird eggs were sought and harvested in 2 primary locations in Prince William Sound (Figure 2-23). Gull eggs were sought near Iktua Rocks to the north of Evans Island. Goose eggs were sought near Danger Island, which is to the southwest of LaTouche Island. Migratory waterfowl and grouse were hunted in proximity to Chenega Bay; migratory birds were hunted in both Crab and Sawmill bays.
Marine InvertebratesApproximately 600 lb of marine invertebrates were harvested in 2014, making up 7% of the total harvest (Table 2-13; Figure 2-10). This harvest included snails (29%), Tanner crabs (24%), Pacific littleneck clams (18%), cockles (11%), octopuses (9%), horse clams (4%), butter clams (4%), and shrimp (1%) (Figure 2-24). These were harvested by 33% of households in Chenega Bay, and used by 67% (Table 2-13). Of the species used, Pacific littleneck clams, Tanner crabs, octopuses, and snails were given away.There was a significant drop in the percentage of households harvesting marine invertebrates between 1997 and 2003. In 1997, there were 781 lb (13 lb per capita) of marine invertebrates harvested by 73% of the households (Fall and Utermohle 1999:N-8). In 2003, there were 966 lb (17 lb per capita) harvested by 50%
68
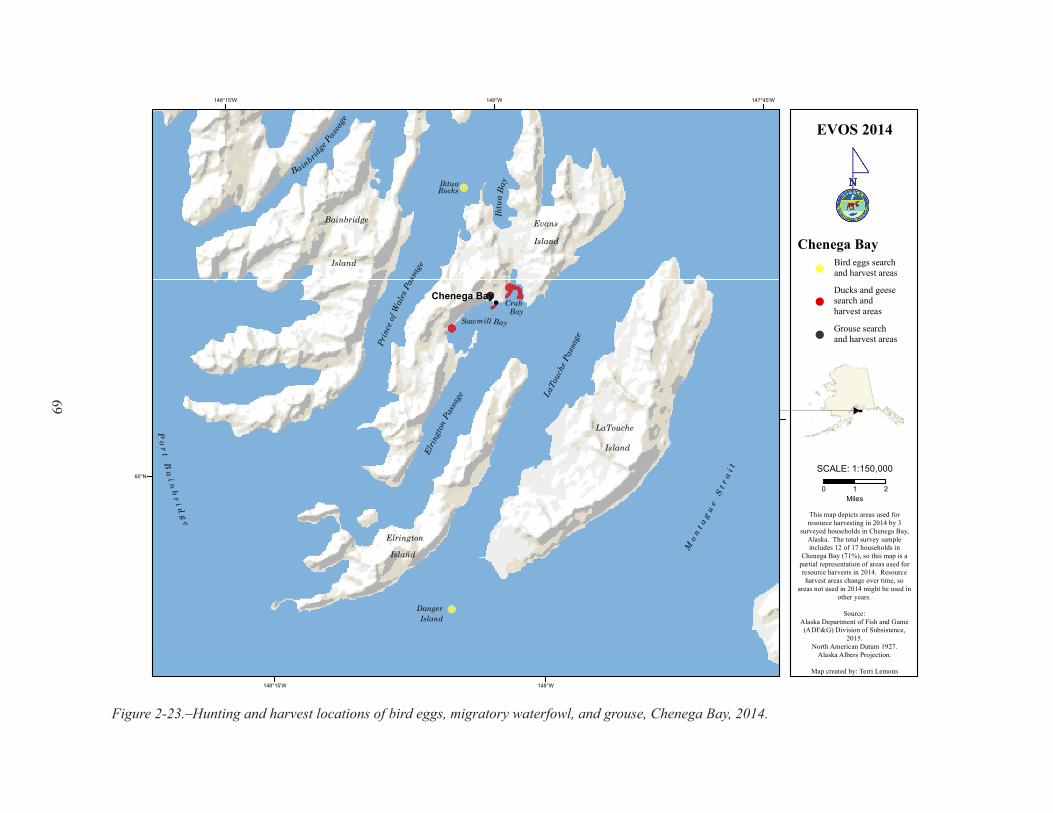
Figure 2-23.–Hunting and harvest locations of bird eggs, migratory waterfowl, and grouse, Chenega Bay, 2014.
!
Evans
Island
LaTouche
Island
Bainbridge
Island
Prin
ceof
Wal
esPa
ssag
e
LaTo
uche
Pass
age
Mo n
t ag
ue
St r
ai t
Elrin
gton
Pass
age
Sawmill Bay
Ba inbridge
Passa
ge
Elrington
Island
Po
rt
Ba
i nb
ri d
ge
CrabBay
Iktu
aB
ayIktuaRocks
DangerIsland
Chenega Bay
0 21Miles
This map depicts areas used forresource harvesting in 2014 by 3
surveyed households in Chenega Bay,Alaska. The total survey sampleincludes 12 of 17 households in
Chenega Bay (71%), so this map is apartial representation of areas used forresource harvests in 2014. Resourceharvest areas change over time, so
areas not used in 2014 might be used inother years.
Source:Alaska Department of Fish and Game(ADF&G) Division of Subsistence,
2015.North American Datum 1927.
Alaska Albers Projection.
Map created by: Terri Lemons
EVOS 2014
Chenega Bay
!
!
!
Bird eggs search and harvest areas
1:150,000SCALE:
147°45'W
148°W
148°W
148°15'W
148°15'W
60°N
Ducks and geesesearch and harvest areas
Grouse search and harvest areas
69
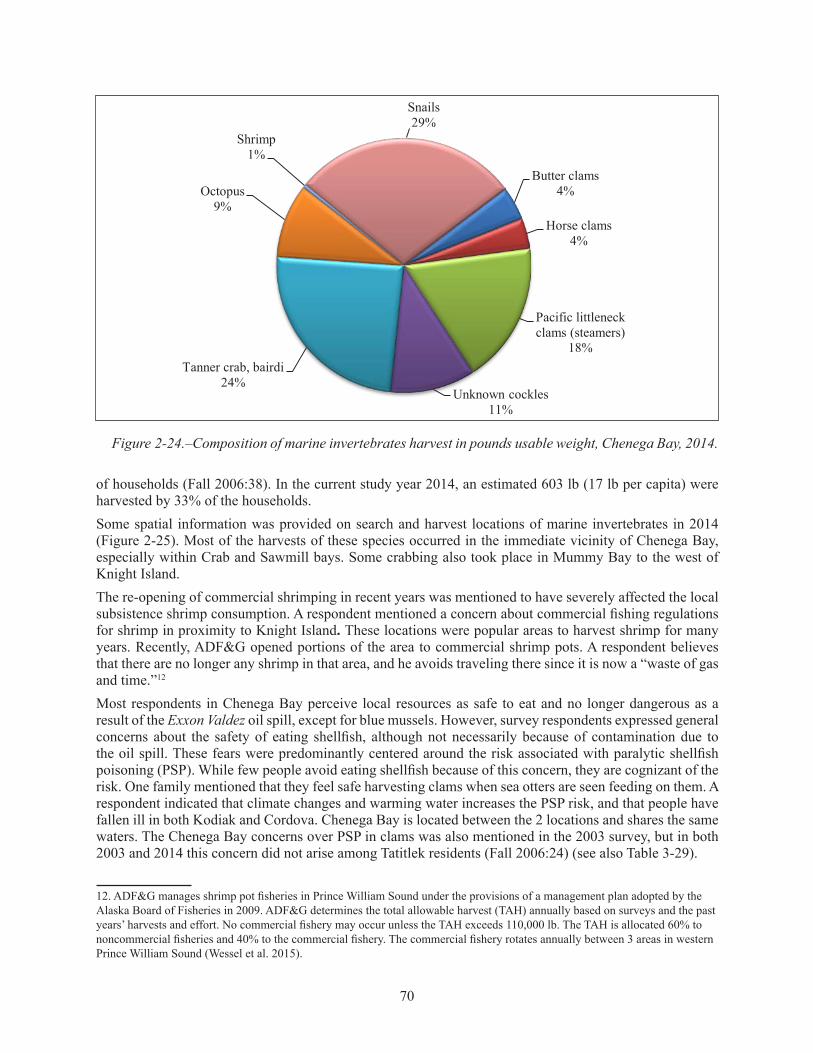
Figure 2-24.–Composition of marine invertebrates harvest in pounds usable weight, Chenega Bay, 2014.
Butter clams4%
Horse clams4%
Pacific littleneck clams (steamers)
18%
Unknown cockles11%
Tanner crab, bairdi24%
Octopus9%
Shrimp1%
Snails29%
of households (Fall 2006:38). In the current study year 2014, an estimated 603 lb (17 lb per capita) were harvested by 33% of the households.Some spatial information was provided on search and harvest locations of marine invertebrates in 2014 (Figure 2-25). Most of the harvests of these species occurred in the immediate vicinity of Chenega Bay, especially within Crab and Sawmill bays. Some crabbing also took place in Mummy Bay to the west of Knight Island. The re-opening of commercial shrimping in recent years was mentioned to have severely affected the local subsistence shrimp consumption. A respondent mentioned a concern about commercial fishing regulations for shrimp in proximity to Knight Island. These locations were popular areas to harvest shrimp for many years. Recently, ADF&G opened portions of the area to commercial shrimp pots. A respondent believes that there are no longer any shrimp in that area, and he avoids traveling there since it is now a “waste of gas and time.”12
Most respondents in Chenega Bay perceive local resources as safe to eat and no longer dangerous as a result of the Exxon Valdez oil spill, except for blue mussels. However, survey respondents expressed general concerns about the safety of eating shellfish, although not necessarily because of contamination due to the oil spill. These fears were predominantly centered around the risk associated with paralytic shellfish poisoning (PSP). While few people avoid eating shellfish because of this concern, they are cognizant of the risk. One family mentioned that they feel safe harvesting clams when sea otters are seen feeding on them. A respondent indicated that climate changes and warming water increases the PSP risk, and that people have fallen ill in both Kodiak and Cordova. Chenega Bay is located between the 2 locations and shares the same waters. The Chenega Bay concerns over PSP in clams was also mentioned in the 2003 survey, but in both 2003 and 2014 this concern did not arise among Tatitlek residents (Fall 2006:24) (see also Table 3-29).
12. ADF&G manages shrimp pot fisheries in Prince William Sound under the provisions of a management plan adopted by the Alaska Board of Fisheries in 2009. ADF&G determines the total allowable harvest (TAH) annually based on surveys and the past years’ harvests and effort. No commercial fishery may occur unless the TAH exceeds 110,000 lb. The TAH is allocated 60% to noncommercial fisheries and 40% to the commercial fishery. The commercial fishery rotates annually between 3 areas in western Prince William Sound (Wessel et al. 2015).
70
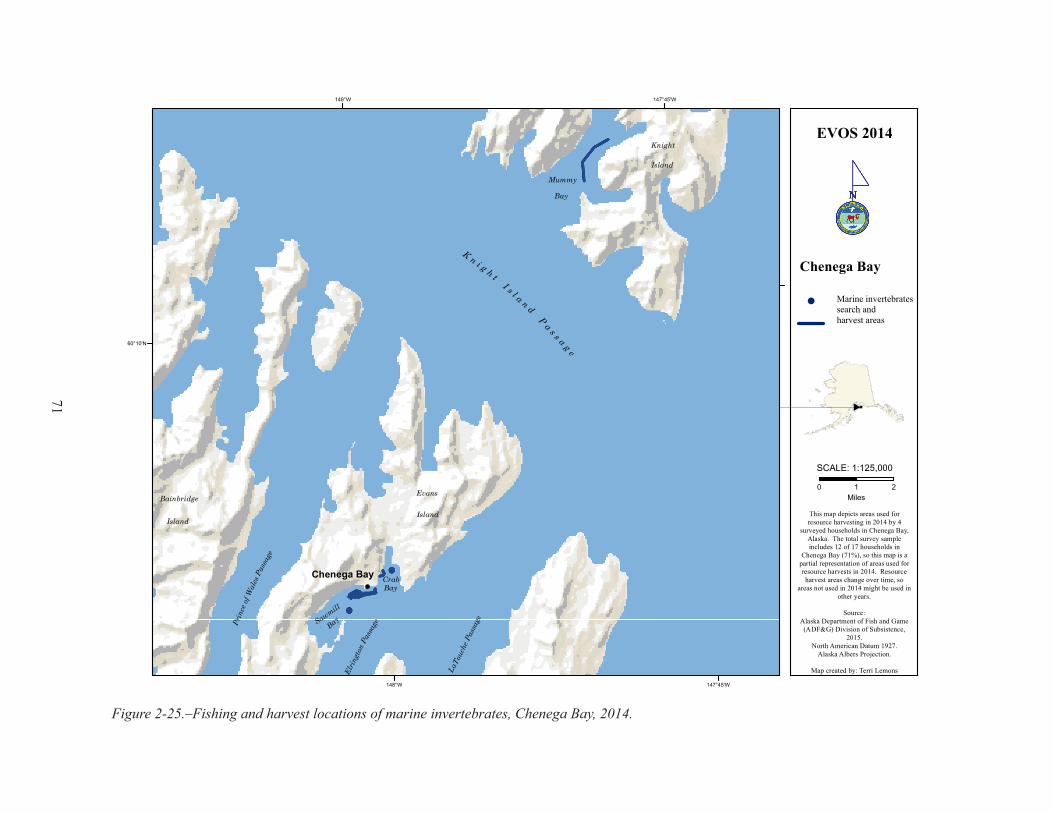
Figure 2-25.–Fishing and harvest locations of marine invertebrates, Chenega Bay, 2014.
!
Evans
Island
Bainbridge
Island
Prin
ceof
Wal
esPa
ssag
e
Knight
Island
K n i g h tI s l a n d
P a s s a g e
LaTo
uche
Pass
age
Elrin
gton
Pass
age
CrabBay
Mummy
Bay
Sawmill
Bay
Chenega Bay
0 21Miles
This map depicts areas used forresource harvesting in 2014 by 4
surveyed households in Chenega Bay,Alaska. The total survey sampleincludes 12 of 17 households in
Chenega Bay (71%), so this map is apartial representation of areas used forresource harvests in 2014. Resourceharvest areas change over time, so
areas not used in 2014 might be used inother years.
Source:Alaska Department of Fish and Game(ADF&G) Division of Subsistence,
2015.North American Datum 1927.
Alaska Albers Projection.
Map created by: Terri Lemons
EVOS 2014
Chenega Bay
! Marine invertebratessearch and harvest areas
1:125,000SCALE:
147°45'W
147°45'W
148°W
148°W
60°10'N
71

Figure 2-26.–Composition of vegetation harvest by type and pounds usable weight, Chenega Bay, 2014.
VegetationNearly 70% of individuals in Chenega Bay gathered and processed vegetation in 2014 (Table 2-11). This 527 lb harvest (15 lb per capita) included a variety of berries (96% of vegetation harvest total), plants and greens (2%) such as fiddlehead ferns, dandelion greens, spruce tips, and fireweed, as well as mushrooms (2%) (Figure 2-26). Together these made up 6% of the total wild food harvest for the community (Figure 2-10). Vegetation use was estimated in 92% of households, with 75% attempting to harvest, 67% of Chenega Bay households harvesting vegetation successfully, and 33% giving some away (Table 2-13). This harvest amount is consistent with the 1997 study year harvest of 851 lb (15 lb per capita) of vegetation, but reduced from 510 lb (9 lb per capita) harvested in 2003. Between 67–93% of households successfully harvested vegetation during these 3 study years.Approximately 42% of households in Chenega Bay used firewood and 33% harvested firewood (Table 2-13). Firewood was reportedly harvested by 1 household just east of the community of Talkeetna. Firewood harvest location information was not shared by other households. Survey respondents were asked to estimate the percentage of home heating that is derived from firewood (Table 2-21). Of households responding to this question, 67% indicated that they do not use firewood for this purpose. Seventeen percent of households indicated that 76–99% of their household heat comes from firewood and 17% indicated that all of their household heat comes from firewood. The locations of vegetation harvests were readily provided by many Chenega Bay households. Much of the vegetation harvests occurred in the immediate vicinity of the community on Evans Island (Figure 2-27). Blueberries were sought a bit farther from town, too, including along the airport road and north of the airport. Berries were also harvested from the northwestern corner of LaTouche Island, as well as from around downtown Palmer on the mainland.
Berries96%
Plants and greens2%
Mushrooms2%
Note Seaweed is not included because there was 0 lb of usable weight harvested.
72

Table 2-21.–Use of firewood for home heating in sampled households, Chenega Bay, 2014.
Percentage of home heating from firewood
Number of households
Percentage of households
0% 8 67%1-25% 0 0%26-50% 0 0%51-75% 0 0%76-99% 2 17%100% 2 17%Source ADF&G Division of Subsistence household surveys, 2015.
coMParing harveStS and uSeS in 2014 with PreviouS yearS
Harvest AssessmentsResearchers asked respondents to assess their own harvests in 2 ways: whether they got more, less, or about the same amount of 9 resource categories in 2014 as in the past 5 years, and whether they got “enough” of each of the 9 resource categories. Households also were asked to provide reasons if their use was different or if they were unable to get enough of a resource. If they did not get enough of a resource, they were asked to evaluate the severity of the impact to their household as a result of not getting enough. This section discusses responses to those questions.Together, Table 2-22 and Figure 2-28 and Figure 2-29 provide a broad overview of households’ assessments of their uses of harvests in 2014. Because not everyone uses all resource categories, some households did not respond to the assessment questions. Additionally, some households that do typically use a resource category simply did not answer questions. Salmon is the most harvested of all subsistence resource categories used by Chenega Bay households. Of households reporting use (11 households), 91% (10 households) explained that they used the same amount of salmon in 2014 as they did in previous years, 9% (1 household) reported less use, and no households used more (Table 2-22). When asked why they used less, the only responding household reported that they did so due to salmon being less available (Table 2-23). In Chenega Bay, there were no households indicating that they did not get enough salmon (Figure 2-29).Nonsalmon fish was the second most frequently harvested resource category in this community. Approximately 75% of households reported using the same amount of nonsalmon fish as compared to recent years with the remaining 25% of households reporting less use (Table 2-22; Figure 2-28). Only 1 household provided reasons for using less nonsalmon fish and these included that the resource was less available and their harvest attempts were unsuccessful (Table 2-23). When asked if they got enough nonsalmon fish in the study year, 92% of households indicated that they did and 8% indicated that they did not (Figure 2-29). The single household indicating that they did not get enough nonsalmon fish reported that the impact of this was minor (Table 2-24).Approximately 73% of households responding to the assessment questions (8 of 11 households) indicated use of large land mammals (Table 2-22). Of those 8 households, 63% (5 households) reported using the same amount of large mammals in 2014 as compared to recent years and 38% (3 households) reported using less. No households reported using more. The reported reasons for using less included lack of effort (2 households), family or personal reasons (1 household), and other reasons (1 household) (Table 2-23). When
73
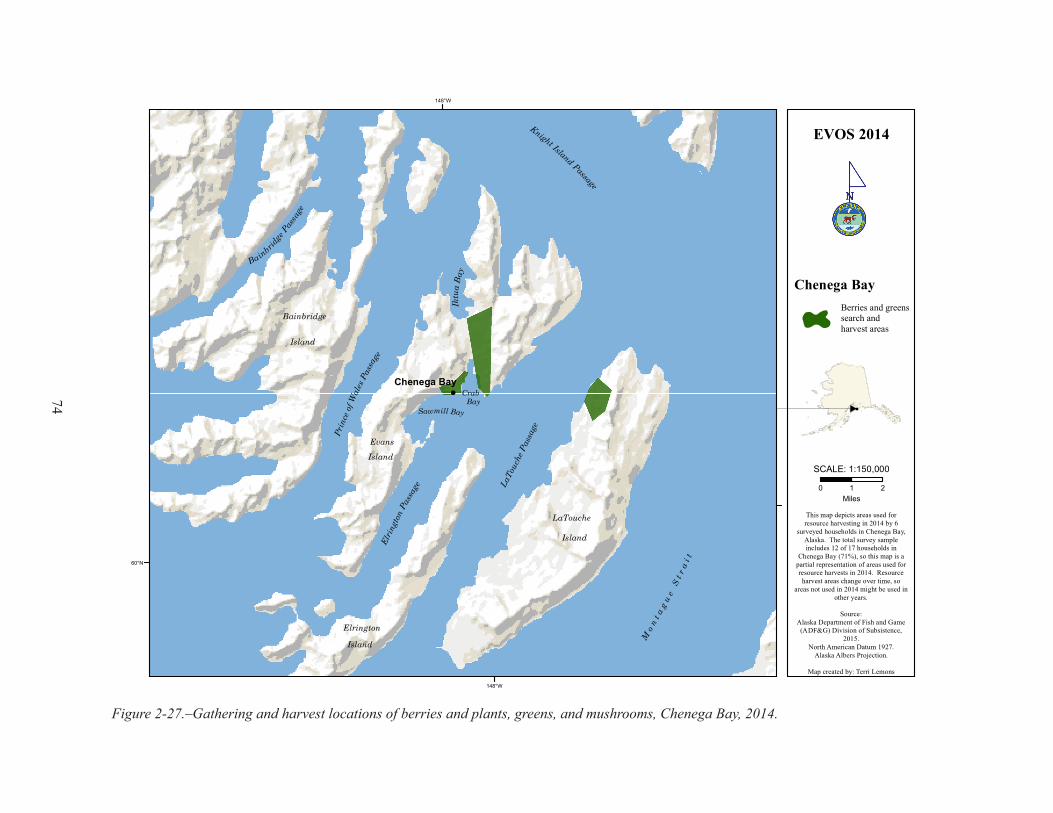
Figure 2-27.–Gathering and harvest locations of berries and plants, greens, and mushrooms, Chenega Bay, 2014.
!
Evans
Island
LaTouche
Island
Bainbridge
IslandPr
ince
ofW
ales
Pass
age
Knight Island Passage
LaTo
uche
Pass
age
Mo n
t ag
ue
St r
ai t
Elrin
gton
Pass
age
Sawmill Bay
Bainbridge
Passa
ge
Elrington
Island
CrabBay
Iktu
aB
ay
Chenega Bay
0 21Miles
This map depicts areas used forresource harvesting in 2014 by 6
surveyed households in Chenega Bay,Alaska. The total survey sampleincludes 12 of 17 households in
Chenega Bay (71%), so this map is apartial representation of areas used forresource harvests in 2014. Resourceharvest areas change over time, so
areas not used in 2014 might be used inother years.
Source:Alaska Department of Fish and Game(ADF&G) Division of Subsistence,
2015.North American Datum 1927.
Alaska Albers Projection.
Map created by: Terri Lemons
EVOS 2014
Chenega BayBerries and greenssearch and harvest areas
1:150,000SCALE:
148°W
148°W
60°N
74
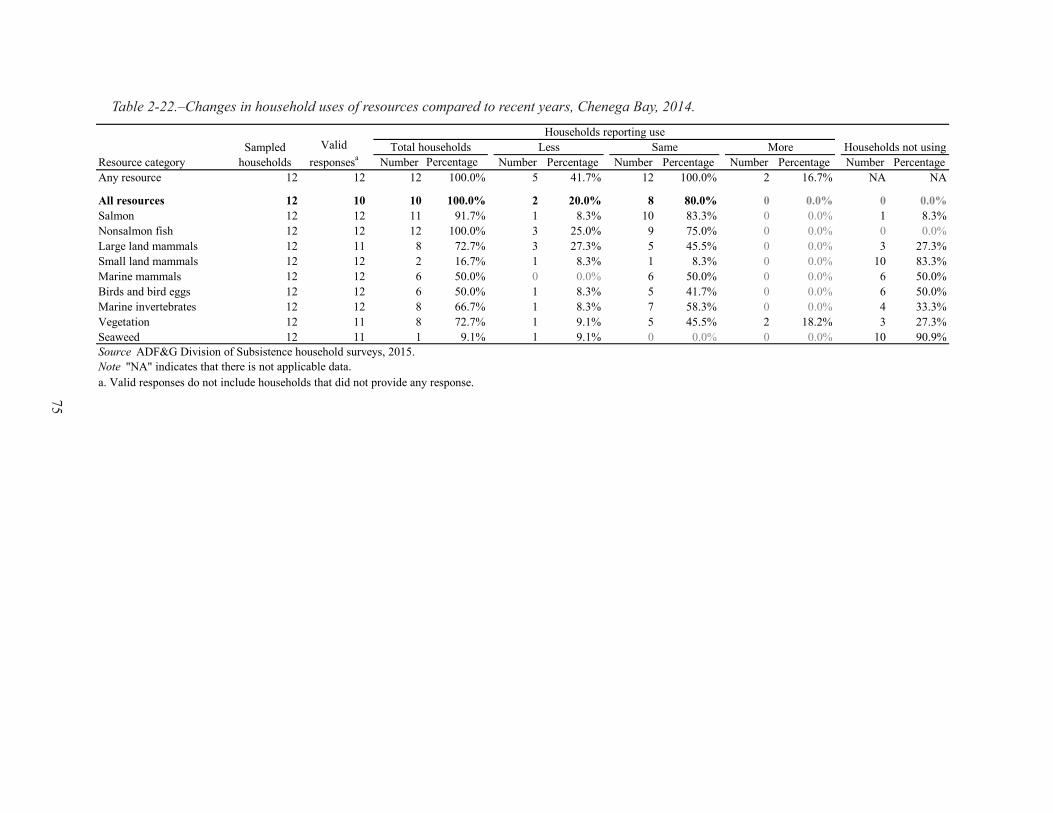
Table 2-22.–Changes in household uses of resources compared to recent years, Chenega Bay, 2014.
Number Percentage Number Percentage Number Percentage Number Percentage Number PercentageAny resource 12 12 12 100.0% 5 41.7% 12 100.0% 2 16.7% NA NA
All resources 12 10 10 100.0% 2 20.0% 8 80.0% 0 0.0% 0 0.0%Salmon 12 12 11 91.7% 1 8.3% 10 83.3% 0 0.0% 1 8.3%Nonsalmon fish 12 12 12 100.0% 3 25.0% 9 75.0% 0 0.0% 0 0.0%Large land mammals 12 11 8 72.7% 3 27.3% 5 45.5% 0 0.0% 3 27.3%Small land mammals 12 12 2 16.7% 1 8.3% 1 8.3% 0 0.0% 10 83.3%Marine mammals 12 12 6 50.0% 0 0.0% 6 50.0% 0 0.0% 6 50.0%Birds and bird eggs 12 12 6 50.0% 1 8.3% 5 41.7% 0 0.0% 6 50.0%Marine invertebrates 12 12 8 66.7% 1 8.3% 7 58.3% 0 0.0% 4 33.3%Vegetation 12 11 8 72.7% 1 9.1% 5 45.5% 2 18.2% 3 27.3%Seaweed 12 11 1 9.1% 1 9.1% 0 0.0% 0 0.0% 10 90.9%
a. Valid responses do not include households that did not provide any response.
Source ADF&G Division of Subsistence household surveys, 2015.Note "NA" indicates that there is not applicable data.
Households not usingSampled householdsResource category
MoreSameLessValid responsesa
Total householdsHouseholds reporting use
75

Figure 2-28.–Changes in household uses of resources compared to recent years, Chenega Bay, 2014.
8%
25%
27%
8%
8%
8%
9%
9%
8%
27%
83%
50%
50%
33%
27%
91%
18%
83%
75%
45%
8%
50%
42%
58%
45%
0% 10% 20% 30% 40% 50% 60% 70% 80% 90% 100%
Salmon
Nonsalmon fish
Large land mammals
Small land mammals
Marine mammals
Birds and bird eggs
Marine invertebrates
Vegetation
Seaweed
Percentage of surveyed households providing a valid response, unlabeled percentages are less than 5%.
Households used LESS in 2014 Households used SAME in 2014 Households used MORE in 2014 Households normally do not use
76

Figure 2-29.–Percentage of sampled households reporting whether they had enough resources, by resource category, Chenega Bay, 2014.
8%
8%
8%
17%
17%
8%
25%
83%
50%
50%
33%
25%
92%
92%
92%
67%
8%
50%
50%
50%
58%
8%
0% 10% 20% 30% 40% 50% 60% 70% 80% 90% 100%
Salmon
Nonsalmon fish
Large landmammals
Small landmammals
Marine mammals
Birds and bird eggs
Marineinvertebrates
Vegetation
Seaweed
Percentage of sampled households, unlabeled percentages are less than 5%.
Household did not get enough in 2014 Household got enough of resource in 2014 Household does not use resource
77

Table 2-23.–Reasons for less household uses of resources compared to recent years, Chenega Bay, 2014.
Number Percentage Number Percentage Number Percentage Number Percentage Number Percentage Number PercentageAny resource 12 5 1 20.0% 3 60.0% 0 0.0% 0 0.0% 2 40.0% 2 40.0%
All resources 10 2 0 0.0% 1 50.0% 0 0.0% 0 0.0% 1 50.0% 0 0.0%Salmon 12 1 0 0.0% 1 100.0% 0 0.0% 0 0.0% 0 0.0% 0 0.0%Nonsalmon fish 12 1 0 0.0% 1 100.0% 0 0.0% 0 0.0% 0 0.0% 0 0.0%Large land mammals 12 3 1 33.3% 0 0.0% 0 0.0% 0 0.0% 0 0.0% 2 66.7%Small land mammals 11 3 1 33.3% 2 66.7% 0 0.0% 0 0.0% 0 0.0% 0 0.0%Marine mammals 12 0 0 0.0% 0 0.0% 0 0.0% 0 0.0% 0 0.0% 0 0.0%Birds and bird eggs 12 1 0 0.0% 0 0.0% 0 0.0% 0 0.0% 0 0.0% 1 100.0%Marine invertebrates 12 1 0 0.0% 0 0.0% 0 0.0% 0 0.0% 0 0.0% 1 100.0%Vegetation 11 1 0 0.0% 1 100.0% 0 0.0% 0 0.0% 0 0.0% 0 0.0%Seaweed 11 1 0 0.0% 0 0.0% 0 0.0% 0 0.0% 1 100.0% 0 0.0%
Table 2-23.–Continued.
Number Percentage Number Percentage Number Percentage Number Percentage Number Percentage Number PercentageAny resource 12 5 2 40.0% 0 0.0% 1 20.0% 1 20.0% 0 0.0% 1 20.0%
All resources 10 2 0 0.0% 0 0.0% 0 0.0% 0 0.0% 0 0.0% 1 50.0%Salmon 12 1 0 0.0% 0 0.0% 0 0.0% 0 0.0% 0 0.0% 0 0.0%Nonsalmon fish 12 1 1 100.0% 0 0.0% 0 0.0% 0 0.0% 0 0.0% 0 0.0%Large land mammals 12 3 0 0.0% 0 0.0% 1 33.3% 0 0.0% 0 0.0% 0 0.0%Small land mammals 11 3 1 33.3% 0 0.0% 0 0.0% 1 33.3% 0 0.0% 1 33.3%Marine mammals 12 0 0 0.0% 0 0.0% 0 0.0% 0 0.0% 0 0.0% 0 0.0%Birds and bird eggs 12 1 0 0.0% 0 0.0% 0 0.0% 0 0.0% 0 0.0% 0 0.0%Marine invertebrates 12 1 0 0.0% 0 0.0% 0 0.0% 0 0.0% 0 0.0% 0 0.0%Vegetation 11 1 0 0.0% 0 0.0% 0 0.0% 0 0.0% 0 0.0% 0 0.0%Seaweed 11 1 0 0.0% 0 0.0% 0 0.0% 0 0.0% 0 0.0% 0 0.0%
RegulationsSmall/
diseased animals
Family/personal
Resources less available Too far to travel
Resource category
Resource categoryValid
responsesa
Households reporting
reasons for less use
Households reporting
reasons for less use
Valid responsesa
Less sharing
-continued-
-continued-
Lack of effort
UnsuccessfulWeather/
environment Other reasonsWorking/no time
Lack of equipment
78

Table 2-23.–Page 2 of 2.
Number Percentage Number Percentage Number Percentage Number Percentage Number PercentageAny resource 12 5 0 0.0% 0 0.0% 0 0.0% 0 0.0% 0 0.0%
All resources 10 2 0 0.0% 0 0.0% 0 0.0% 0 0.0% 0 0.0%Salmon 12 1 0 0.0% 0 0.0% 0 0.0% 0 0.0% 0 0.0%Nonsalmon fish 12 1 0 0.0% 0 0.0% 0 0.0% 0 0.0% 0 0.0%Large land mammals 12 2 0 0.0% 0 0.0% 0 0.0% 0 0.0% 0 0.0%Small land mammals 11 2 0 0.0% 0 0.0% 0 0.0% 0 0.0% 0 0.0%Marine mammals 12 0 0 0.0% 0 0.0% 0 0.0% 0 0.0% 0 0.0%Birds and bird eggs 12 1 0 0.0% 0 0.0% 0 0.0% 0 0.0% 0 0.0%Marine invertebrates 12 1 0 0.0% 0 0.0% 0 0.0% 0 0.0% 0 0.0%Vegetation 11 1 0 0.0% 0 0.0% 0 0.0% 0 0.0% 0 0.0%Seaweed 11 1 0 0.0% 0 0.0% 0 0.0% 0 0.0% 0 0.0%
Did not get enough
Source ADF&G Division of Subsistence household surveys, 2015.a. Valid responses do not include households that did not provide any response and households reporting never using the resource.
Did not needEquipment/fuel expense
Resource categoryValid
responsesa
Households reporting
reasons for less use
Competition Used other resources
79

Table 2-24.–Reported impact to households reporting that they did not get enough of a type of resource, Chenega Bay, 2014.
Number Percentage Number Percentage Number Percentage Number Percentage Number Percentage Number Percentage Number PercentageAll resources 12 10 83.3% 0 0.0% 0 0.0% 0 0.0% 0 0.0% 0 0.0% 0 0.0%Salmon 12 11 91.7% 0 0.0% 0 0.0% 0 0.0% 0 0.0% 0 0.0% 0 0.0%Nonsalmon fish 12 12 100.0% 1 8.3% 0 0.0% 0 0.0% 1 100.0% 0 0.0% 0 0.0%Large land mammals 12 9 75.0% 1 11.1% 0 0.0% 0 0.0% 0 0.0% 0 0.0% 1 100.0%Small land mammals 12 2 16.7% 1 50.0% 0 0.0% 0 0.0% 0 0.0% 0 0.0% 1 100.0%Marine mammals 12 6 50.0% 0 0.0% 0 0.0% 0 0.0% 0 0.0% 0 0.0% 0 0.0%Birds and bird eggs 12 6 50.0% 0 0.0% 0 0.0% 0 0.0% 0 0.0% 0 0.0% 0 0.0%Marine invertebrates 12 8 66.7% 2 25.0% 0 0.0% 0 0.0% 0 0.0% 2 100.0% 0 0.0%Vegetation 12 9 75.0% 2 22.2% 0 0.0% 0 0.0% 0 0.0% 2 100.0% 0 0.0%Seaweed 12 1 8.3% 0 0.0% 0 0.0% 0 0.0% 0 0.0% 0 0.0% 0 0.0%
a. Valid responses do not include households failing to respond to the question and those households that never used the resource.Source ADF&G Division of Subsistence household surveys, 2015.
Resource categorySample
households
Households not getting enough _______ . Impact to those not getting enough ______ .Valid responsesa Did not get enough No response Not noticeable Minor Major Severe
80

asked if they got enough large land mammals, only 1 household indicated that they did not and the impact of this was reportedly severe (Table 2-24).When compared to responses for large land mammals, an equal number of households (73%) responding to the assessment questions reported use of vegetation in 2014 (Table 2-22; Figure 2-28). Of the 8 households that used vegetation, most (63%; 5 households) reported using the same amount of vegetation as compared to recent years, and 1 household indicated using less. This is the only resource category for which households (25%; 2 households) indicated that they used more than in recent years; this was reportedly due to increased effort (Table 2-25). The only reported reason for using less was that the resource was less available (Table 2-23). Only 22% of responding households reported not getting enough vegetation and these households reported the impact as major (Table 2-24).The next most frequently used resource category was marine invertebrates with 67% of households (8 households) reporting use on the assessment questions (Table 2-22). Of these, 88% (7 households) indicated that they used the same amount in 2014 as in recent years and 13% indicated less use. The only reason given for harvesting less was a lack of effort (Table 2-23). About 25% of households that responded to the question indicated they did not get enough marine invertebrates and all of these indicated that the impact was major (Table 2-24). Both birds/bird eggs and marine mammals were reportedly used by 50% of households (6 households) (Table 2-22). Of those households reporting use of marine mammals, all indicated that they used the same amount of this resource in 2014 as in recent years (Figure 2-28). For households reporting use of birds and bird eggs, 83% (5 households) indicated the same amount of use and 17% (1 household) indicated less use (Table 2-22). Lack of effort was the only reason given for less use of birds or bird eggs (Table 2-23). For both of these resource categories, no household reported not getting enough in 2014 (Figure 2-29). Only 17% of households reported using small land mammals (Table 2-22). Of those households using small land mammals (2 households), 50% indicated that they used the same amount in 2014 as in recent years and 50% indicated less use (Table 2-22; Figure 2-28). For seaweed, 1 household reported use of this resource and indicated less use in 2014. The most cited reason for harvesting less small land mammals was that the resource was less available, and for seaweed the only reason given was less sharing (Table 2-23). No household reported not getting enough seaweed (Figure 2-29). A single household reported not getting enough small land mammals and the reported impact of this was severe (Table 2-24). Considering all resources combined, most households (80%) of those households responding to the assessment questions indicated the same or similar use in 2014 as compared to recent years (Table 2-22). Only 20% of households reported less use and this was attributed to resources being less available, less sharing, and small or diseased animals (Table 2-23). No household reported not getting enough when considering all resources combined (Table 2-24). Very few households indicated specific species that they could have used more of in 2014 (Table 2-26). Two households indicated needing more blueberries. Only one household each indicated needing more Pacific halibut, deer, elk, mountain goat, mink, butter clams, and shrimp. The overall assessment of the harvest and use of wild resources as compared to recent years is somewhat different from that which was recorded for 2003 when only 64% of households indicated that their harvest and use was the same as 5 years prior (Fall 2006:25). At that time, only for marine invertebrates had harvest and use declined for a majority of respondents during the 5-year period preceding the 2003 study year (Fall 2006:A-23). Respondent households attributed this to resource availability and fear of residual oil.
81

Table 2-25.–Reasons for more household uses of resources compared to recent years, Chenega Bay, 2014.
Number Percentage Number Percentage Number Percentage Number Percentage Number Percentage Number Percentage Number PercentageAny resource 12 2 0 0.0% 0 0.0% 0 0.0% 0 0.0% 0 0.0% 2 100.0% 0 0.0%
All resources 10 0 0 0.0% 0 0.0% 0 0.0% 0 0.0% 0 0.0% 0 0.0% 0 0.0%Salmon 12 0 0 0.0% 0 0.0% 0 0.0% 0 0.0% 0 0.0% 0 0.0% 0 0.0%Nonsalmon fish 12 0 0 0.0% 0 0.0% 0 0.0% 0 0.0% 0 0.0% 0 0.0% 0 0.0%Large land mammals 12 0 0 0.0% 0 0.0% 0 0.0% 0 0.0% 0 0.0% 0 0.0% 0 0.0%Small land mammals 11 0 0 0.0% 0 0.0% 0 0.0% 0 0.0% 0 0.0% 0 0.0% 0 0.0%Marine mammals 12 0 0 0.0% 0 0.0% 0 0.0% 0 0.0% 0 0.0% 0 0.0% 0 0.0%Birds and bird eggs 12 0 0 0.0% 0 0.0% 0 0.0% 0 0.0% 0 0.0% 0 0.0% 0 0.0%Marine invertebrates 12 0 0 0.0% 0 0.0% 0 0.0% 0 0.0% 0 0.0% 0 0.0% 0 0.0%Vegetation 11 2 0 0.0% 0 0.0% 0 0.0% 0 0.0% 0 0.0% 2 100.0% 0 0.0%Seaweed 11 0 0 0.0% 0 0.0% 0 0.0% 0 0.0% 0 0.0% 0 0.0% 0 0.0%
Number Percentage Number Percentage Number Percentage Number Percentage Number Percentage Number Percentage Number PercentageAny resource 12 2 0 0.0% 0 0.0% 0 0.0% 0 0.0% 0 0.0% 0 0.0% 0 0.0%
All resources 10 0 0 0.0% 0 0.0% 0 0.0% 0 0.0% 0 0.0% 0 0.0% 0 0.0%Salmon 12 0 0 0.0% 0 0.0% 0 0.0% 0 0.0% 0 0.0% 0 0.0% 0 0.0%Nonsalmon fish 12 0 0 0.0% 0 0.0% 0 0.0% 0 0.0% 0 0.0% 0 0.0% 0 0.0%Large land mammals 12 0 0 0.0% 0 0.0% 0 0.0% 0 0.0% 0 0.0% 0 0.0% 0 0.0%Small land mammals 11 0 0 0.0% 0 0.0% 0 0.0% 0 0.0% 0 0.0% 0 0.0% 0 0.0%Marine mammals 12 0 0 0.0% 0 0.0% 0 0.0% 0 0.0% 0 0.0% 0 0.0% 0 0.0%Birds and bird eggs 12 0 0 0.0% 0 0.0% 0 0.0% 0 0.0% 0 0.0% 0 0.0% 0 0.0%Marine invertebrates 12 0 0 0.0% 0 0.0% 0 0.0% 0 0.0% 0 0.0% 0 0.0% 0 0.0%Vegetation 11 2 0 0.0% 0 0.0% 0 0.0% 0 0.0% 0 0.0% 0 0.0% 0 0.0%Seaweed 11 0 0 0.0% 0 0.0% 0 0.0% 0 0.0% 0 0.0% 0 0.0% 0 0.0%
Table 2-25.–Continued.
Households reporting
reasons for more use
Increased availability Had more helpNeeded more Increased effort
Used other resources Favorable weather
Traveled farther More success Needed less
Source ADF&G Division of Subsistence household surveys, 2015.
Other
-continued-
a. Valid responses do not include households that did not provide any response and households reporting never use.
Store-bought expense
Got/fixed equipment
Resource categoryValid
responsesa
Households reporting
reasons for more use
Regulations
Received moreResource category
Valid responsesa
82

Table 2-26.–Resources that households reported needing, Chenega Bay, 2014.
Pacific halibut 1 8.3%Deer 1 8.3%Elk 1 8.3%Mountain goat 1 8.3%Mink 1 8.3%Butter clams 1 8.3%Shrimp 1 8.3%Blueberry 2 16.7%
Households needing
Percentage of households Resource
Source ADF&G Division of Subsistence household surveys, 2015.
Harvest DataChanges in the harvest of resources by Chenega Bay residents can also be discerned through comparisons with findings from other study years. Comprehensive subsistence harvest surveys were conducted in Chenega Bay for study years 1984, 1985, 1989, 1990, 1991, 1992, 1993, 1997, 2003, and 2014. Marine mammal harvests were also recorded for all study years between 1992 and 2008, except for 1999, as well as in 2014 as part of this survey.13
The pounds usable weight harvested per capita has fluctuated between 1984 and 2014 (Figure 2-30). The lowest estimated per capita harvests during these years were 148 lb in 1989 and 139 lb in 1990, immediately following the Exxon Valdez oil spill (EVOS). The highest per capita harvest was recorded in 1997 at 577 lb, dropping to the second highest estimated per capita harvest of 471 lb in 2003.Post oil spill per capita harvests for all resources combined appear to have rebounded to at least pre-spill harvest estimates in many years. However, the composition of the harvest is changed. While this change in composition may reflect the adaptive capacity of community residents, it does not necessarily indicate a lack of cultural repercussions pertaining to changing resource availability and health. Many ecologic, anthropologic, and sociologic factors can lead to changes in resource harvest composition. The harvests of salmon and nonsalmon fish have increased substantially since EVOS (Table 2-27; Figure 2-31). In 1989, the per capita salmon and nonsalmon fish harvests were 93 lb and 26 lb, respectively. In 2003, the per capita salmon and nonsalmon fish harvests were 227 lb and 117 lb, respectively. This is likely due to stronger salmon runs, regulations permitting subsistence harvest of Pacific halibut, and an active effort to harvest alternative subsistence foods to meet resident needs. The harvests of marine invertebrates and vegetation have also increased since the spill.The harvest of marine mammals never reached pre-spill levels following EVOS. The pre-spill harvest of marine mammals was approximately 150 lb per capita in 1984 and 140 lb per capita in 1985, which composed 47% and 38% of the overall harvests, respectively (Table 2-28). No marine mammals were reportedly harvested in 2014 in this study, though a survey by the ANHSC indicated a harvest of 4 harbor seals and a per capita harvest weight of 0.09 lb (Bernadine Erickson, Alaska Native Harbor Seal Commission Project Coordinator, Anchorage, personal communication, July 2015). It is possible that these seals were harvested
13. Results for both comprehensive and marine mammal subsistence harvest surveys are available in the CSIS. The survey months for each study year are noted in the CSIS project year “Methods” section. Additionally, comprehensive subsistence survey results for selected study years are reported in Fall (1997, 2006), Fall et al. (1996), Fall and Utermohle (1995b, 1999), and Stratton and Chisum (1986); the marine mammal subsistence harvest results for 1994 are not available in the CSIS but are published in Wolfe and Mishler (1995).
83

Figure 2-30.–Estimated per capita harvests in pounds usable weight, Chenega Bay, 1984, 1985, 1989, 1990, 1991, 1992, 1993, 1997, 2003, and 2014.
0
100
200
300
400
500
600
700
1984 1985 1989 1990 1991 1992 1993 1997 2003 2014
Poun
ds u
sabl
e w
eigh
t per
cap
ita
Study year
84
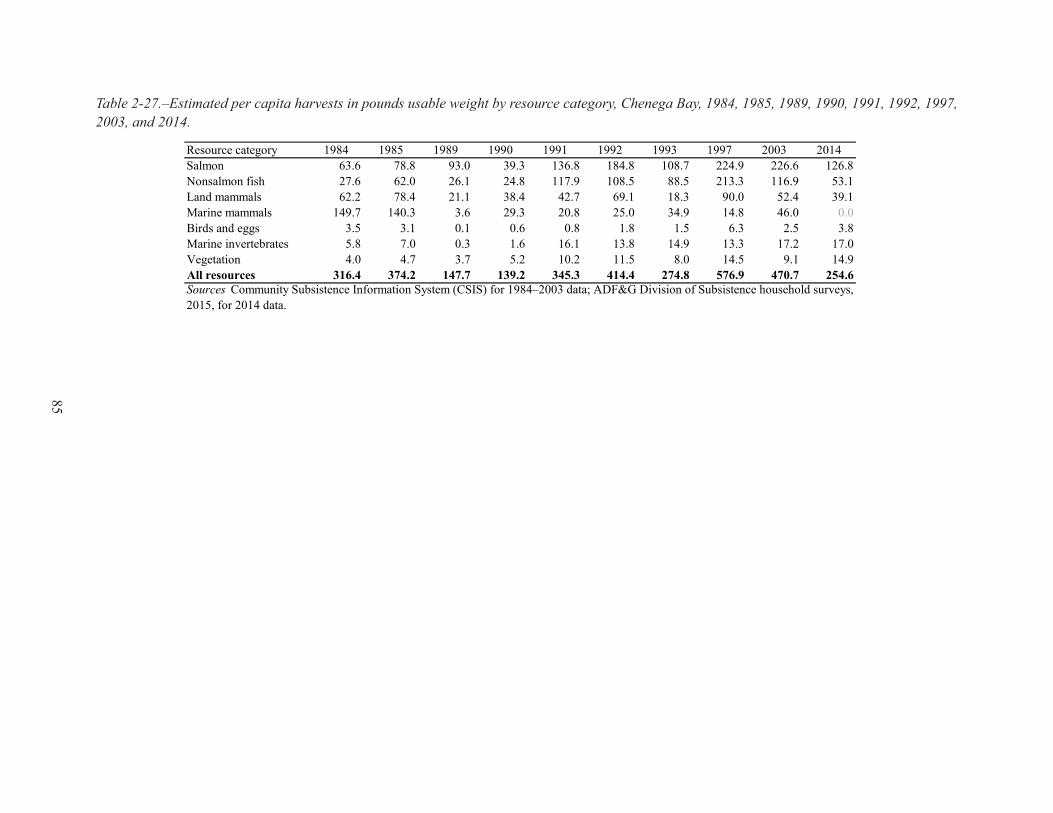
Resource category 1984 1985 1989 1990 1991 1992 1993 1997 2003 2014Salmon 63.6 78.8 93.0 39.3 136.8 184.8 108.7 224.9 226.6 126.8Nonsalmon fish 27.6 62.0 26.1 24.8 117.9 108.5 88.5 213.3 116.9 53.1Land mammals 62.2 78.4 21.1 38.4 42.7 69.1 18.3 90.0 52.4 39.1Marine mammals 149.7 140.3 3.6 29.3 20.8 25.0 34.9 14.8 46.0 0.0Birds and eggs 3.5 3.1 0.1 0.6 0.8 1.8 1.5 6.3 2.5 3.8Marine invertebrates 5.8 7.0 0.3 1.6 16.1 13.8 14.9 13.3 17.2 17.0Vegetation 4.0 4.7 3.7 5.2 10.2 11.5 8.0 14.5 9.1 14.9All resources 316.4 374.2 147.7 139.2 345.3 414.4 274.8 576.9 470.7 254.6Sources Community Subsistence Information System (CSIS) for 1984–2003 data; ADF&G Division of Subsistence household surveys, 2015, for 2014 data.
Table 2-27.–Estimated per capita harvests in pounds usable weight by resource category, Chenega Bay, 1984, 1985, 1989, 1990, 1991, 1992, 1997, 2003, and 2014.
85

Figure 2-31.–Estimated per capita harvests in pounds usable weight by resource category, Chenega Bay, 1984, 1985, 1989, 1990, 1991, 1992, 1997, 2003, and 2014.
0
50
100
150
200
250
Salmon Nonsalmon fish Land mammals Marine mammals Birds and eggs Marine invertebrates Vegetation
Poun
ds u
sabl
e w
eigh
t per
cap
ita
Resource category1984 1985 1989 1990 1991 1992 1993 1997 2003 2014
86

Table 2-28.–Comparison of harvest composition by resource category, Chenega Bay, 1984, 1985, 1989, 1990, 1991, 1992, 1997, 2003, and 2014.
Resource category 1984 1985 1989 1990 1991 1992 1993 1997 2003 2014Salmon 20.1% 21.1% 62.9% 28.2% 39.6% 44.6% 39.6% 39.0% 48.1% 49.8%Nonsalmon fish 8.7% 16.6% 17.6% 17.8% 34.2% 26.2% 32.2% 37.0% 24.8% 20.8%Land mammals 19.7% 20.9% 14.3% 27.6% 12.4% 16.7% 6.6% 15.6% 11.1% 15.4%Marine mammals 47.3% 37.5% 2.4% 21.1% 6.0% 6.0% 12.7% 2.6% 9.8% 0.0%Birds and eggs 1.1% 0.8% 0.0% 0.4% 0.2% 0.4% 0.5% 1.1% 0.5% 1.5%Marine invertebrates 1.8% 1.9% 0.2% 1.1% 4.7% 3.3% 5.4% 2.3% 3.6% 6.7%Vegetation 1.3% 1.3% 2.5% 3.7% 3.0% 2.8% 2.9% 2.5% 1.9% 5.8%Sources Community Subsistence Information System (CSIS) for 1984–2003 data; ADF&G Division of Subsistence household surveys, 2015, for 2014 data.
87
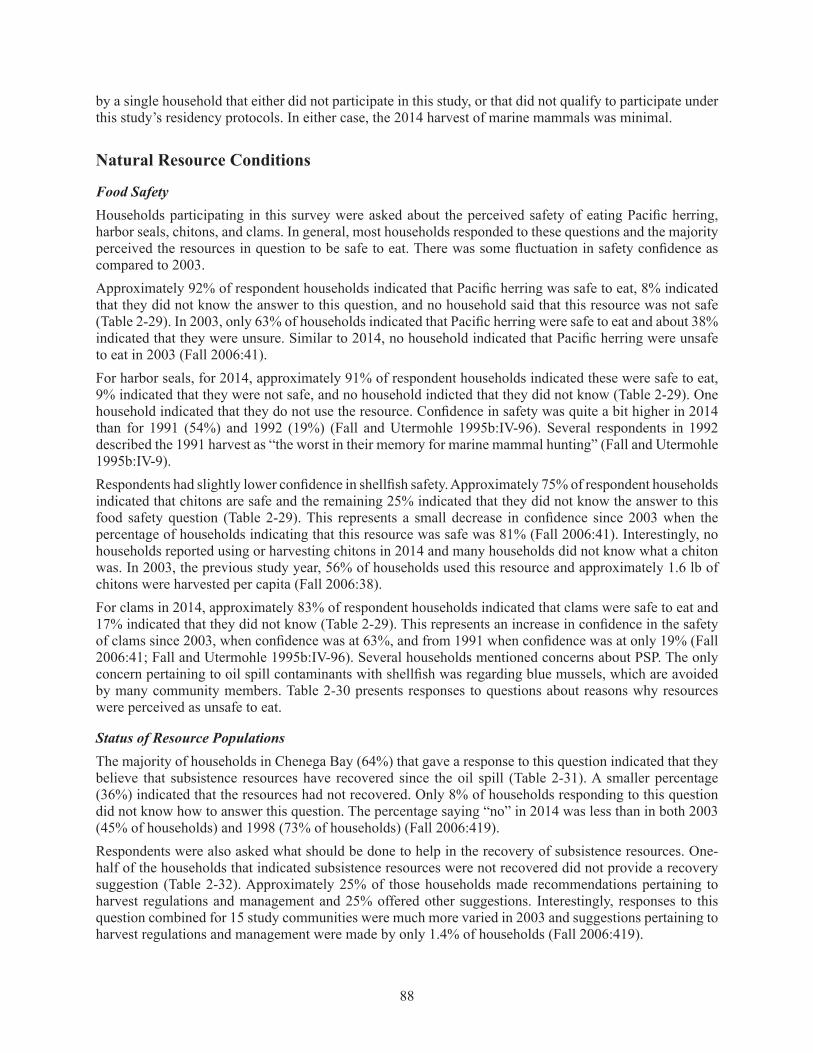
by a single household that either did not participate in this study, or that did not qualify to participate under this study’s residency protocols. In either case, the 2014 harvest of marine mammals was minimal.
Natural Resource Conditions
Food SafetyHouseholds participating in this survey were asked about the perceived safety of eating Pacific herring, harbor seals, chitons, and clams. In general, most households responded to these questions and the majority perceived the resources in question to be safe to eat. There was some fluctuation in safety confidence as compared to 2003.Approximately 92% of respondent households indicated that Pacific herring was safe to eat, 8% indicated that they did not know the answer to this question, and no household said that this resource was not safe (Table 2-29). In 2003, only 63% of households indicated that Pacific herring were safe to eat and about 38% indicated that they were unsure. Similar to 2014, no household indicated that Pacific herring were unsafe to eat in 2003 (Fall 2006:41).For harbor seals, for 2014, approximately 91% of respondent households indicated these were safe to eat, 9% indicated that they were not safe, and no household indicted that they did not know (Table 2-29). One household indicated that they do not use the resource. Confidence in safety was quite a bit higher in 2014 than for 1991 (54%) and 1992 (19%) (Fall and Utermohle 1995b:IV-96). Several respondents in 1992 described the 1991 harvest as “the worst in their memory for marine mammal hunting” (Fall and Utermohle 1995b:IV-9).Respondents had slightly lower confidence in shellfish safety. Approximately 75% of respondent households indicated that chitons are safe and the remaining 25% indicated that they did not know the answer to this food safety question (Table 2-29). This represents a small decrease in confidence since 2003 when the percentage of households indicating that this resource was safe was 81% (Fall 2006:41). Interestingly, no households reported using or harvesting chitons in 2014 and many households did not know what a chiton was. In 2003, the previous study year, 56% of households used this resource and approximately 1.6 lb of chitons were harvested per capita (Fall 2006:38).For clams in 2014, approximately 83% of respondent households indicated that clams were safe to eat and 17% indicated that they did not know (Table 2-29). This represents an increase in confidence in the safety of clams since 2003, when confidence was at 63%, and from 1991 when confidence was at only 19% (Fall 2006:41; Fall and Utermohle 1995b:IV-96). Several households mentioned concerns about PSP. The only concern pertaining to oil spill contaminants with shellfish was regarding blue mussels, which are avoided by many community members. Table 2-30 presents responses to questions about reasons why resources were perceived as unsafe to eat.
Status of Resource PopulationsThe majority of households in Chenega Bay (64%) that gave a response to this question indicated that they believe that subsistence resources have recovered since the oil spill (Table 2-31). A smaller percentage (36%) indicated that the resources had not recovered. Only 8% of households responding to this question did not know how to answer this question. The percentage saying “no” in 2014 was less than in both 2003 (45% of households) and 1998 (73% of households) (Fall 2006:419). Respondents were also asked what should be done to help in the recovery of subsistence resources. One-half of the households that indicated subsistence resources were not recovered did not provide a recovery suggestion (Table 2-32). Approximately 25% of those households made recommendations pertaining to harvest regulations and management and 25% offered other suggestions. Interestingly, responses to this question combined for 15 study communities were much more varied in 2003 and suggestions pertaining to harvest regulations and management were made by only 1.4% of households (Fall 2006:419).
88
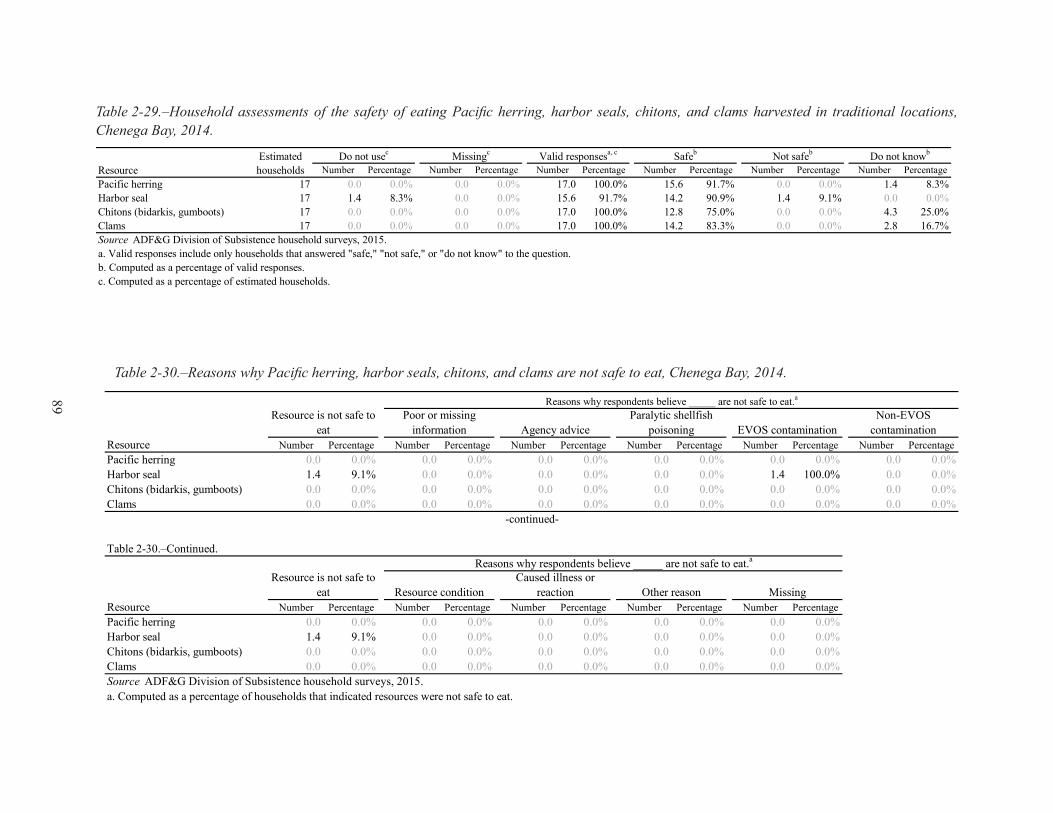
Table 2-29.–Household assessments of the safety of eating Pacific herring, harbor seals, chitons, and clams harvested in traditional locations, Chenega Bay, 2014.
Number Percentage Number Percentage Number Percentage Number Percentage Number Percentage Number PercentagePacific herring 17 0.0 0.0% 0.0 0.0% 17.0 100.0% 15.6 91.7% 0.0 0.0% 1.4 8.3%Harbor seal 17 1.4 8.3% 0.0 0.0% 15.6 91.7% 14.2 90.9% 1.4 9.1% 0.0 0.0%Chitons (bidarkis, gumboots) 17 0.0 0.0% 0.0 0.0% 17.0 100.0% 12.8 75.0% 0.0 0.0% 4.3 25.0%Clams 17 0.0 0.0% 0.0 0.0% 17.0 100.0% 14.2 83.3% 0.0 0.0% 2.8 16.7%
a. Valid responses include only households that answered "safe," "not safe," or "do not know" to the question.b. Computed as a percentage of valid responses.c. Computed as a percentage of estimated households.
Do not knowbNot safebSafebValid responsesa, cMissingcDo not usecEstimated householdsResource
Source ADF&G Division of Subsistence household surveys, 2015.
Table 2-30.–Reasons why Pacific herring, harbor seals, chitons, and clams are not safe to eat, Chenega Bay, 2014.
Number Percentage Number Percentage Number Percentage Number Percentage Number Percentage Number PercentagePacific herring 0.0 0.0% 0.0 0.0% 0.0 0.0% 0.0 0.0% 0.0 0.0% 0.0 0.0%Harbor seal 1.4 9.1% 0.0 0.0% 0.0 0.0% 0.0 0.0% 1.4 100.0% 0.0 0.0%Chitons (bidarkis, gumboots) 0.0 0.0% 0.0 0.0% 0.0 0.0% 0.0 0.0% 0.0 0.0% 0.0 0.0%Clams 0.0 0.0% 0.0 0.0% 0.0 0.0% 0.0 0.0% 0.0 0.0% 0.0 0.0%
Number Percentage Number Percentage Number Percentage Number Percentage Number PercentagePacific herring 0.0 0.0% 0.0 0.0% 0.0 0.0% 0.0 0.0% 0.0 0.0%Harbor seal 1.4 9.1% 0.0 0.0% 0.0 0.0% 0.0 0.0% 0.0 0.0%Chitons (bidarkis, gumboots) 0.0 0.0% 0.0 0.0% 0.0 0.0% 0.0 0.0% 0.0 0.0%Clams 0.0 0.0% 0.0 0.0% 0.0 0.0% 0.0 0.0% 0.0 0.0%Source ADF&G Division of Subsistence household surveys, 2015.a. Computed as a percentage of households that indicated resources were not safe to eat.
Caused illness or reaction Other reason Missing
Resource
Resource is not safe to eat Resource condition
Resource
Resource is not safe to eat
-continued-
Table 2-30.–Continued.Reasons why respondents believe _____ are not safe to eat.a
Paralytic shellfish poisoningAgency advice
Poor or missing information
Non-EVOS contaminationEVOS contamination
Reasons why respondents believe _____ are not safe to eat.a89

Table 2-31.–Household assessments of the recovery of subsistence resources since the oil spill, Chenega Bay, 2014.
Number Percentage Number Percentage Number Percentage Number Percentage Number Percentage
Chenega Bay 17 0.0 0.0% 1.4 8.3% 15.6 91.7% 9.9 63.6% 5.7 36.4%
Have subsistence resources recovered since the Exxon Valdez oil spill?
Missinga Do not knowa Yesb NobValid responsesa, c
CommunityCommunity households
a. Computed as a percentage of estimated community households.
Prince William Sound
Source ADF&G Division of Subsistence household surveys, 2015.
b. Computed as a percentage of valid responses.c. Valid responses include only households that gave a "yes" or "no" response to the question.
90

Table 2-32.–Household assessments of what should be done to help with the recovery of subsistence resources, Chenega Bay, 2014.
Number Percentage Number Percentage Number Percentage Number Percentage Number Percentage Number Percentage
Chenega Bay 15.6 5.7 36.4% 2.8 50.0% 0.0 0.0% 0.0 0.0% 0.0 0.0% 1.4 25.0%
Number Percentage Number Percentage Number Percentage Number Percentage Number Percentage
Chenega Bay 15.6 5.7 36.4% 0.0 0.0% 0.0 0.0% 0.0 0.0% 0.0 0.0%
Number Percentage Number Percentage Number Percentage Number Percentage Number Percentage
Chenega Bay 15.6 5.7 36.4% 0.0 0.0% 0.0 0.0% 1.4 25.0% 0.0 0.0%
Validresponsesc
Subsistence resources have not recovereda
Prince William SoundCommunity
No recovery suggestion provided Do not know
What should be done to help in the recovery of subsistence resources?b
More clean up
More studying and monitoring of populations
Harvest regulation and management
Restoration and enhancement
projects
What should be done to help in the recovery of subsistence resources?b
-continued-
CommunityValid
responsesc
Subsistence resources have not recovereda
Table 2-32.–Continued.
TimeEducation about
spill effects
Administrative, legal, and political
action
Prince William Sound
Predator controlReduce or eliminate oil pollution sources
-continued-
Table 2-32.–Continued.
CommunityValid
responsesc
Subsistence resources have not recovereda Other suggestion Nothing can be done
What should be done to help in the recovery of subsistence resources?b
Source ADF&G Division of Subsistence household surveys, 2015.a. Computed as a percentage of valid responses.b. Computed as a percentage of households that indicated that subsistence resources have not recovered.c. Valid responses include only households that gave a "yes" or "no" response to the question: "Have subsistence resources recovered since the Exxon Valdez oil spill?"
Prince William Sound
91

Table 2-33.–Household assessments of change in resource availability compared to 10 years ago, Chenega Bay, 2014.
Number Percentage Number Percentage Number Percentage Number PercentagePacific herring 17 7.1 41.7% 4.3 25.0% 12.8 75.0% 5.7 44.4%Pacific halibut 17 7.1 41.7% 4.3 25.0% 12.8 75.0% 5.7 44.4%Harbor seal 17 5.7 33.3% 4.3 25.0% 12.8 75.0% 7.1 55.6%Ducks 17 7.1 41.7% 4.3 25.0% 12.8 75.0% 5.7 44.4%Chitons (bidarkis, gumboots) 17 11.3 66.7% 4.3 25.0% 12.8 75.0% 1.4 11.1%Clams 17 4.3 25.0% 4.3 25.0% 12.8 75.0% 8.5 66.7%
Number Percentage Number Percentage Number PercentagePacific herring 17 1.4 25.0% 0.0 0.0% 4.3 75.0%Pacific halibut 17 1.4 25.0% 2.8 50.0% 1.4 25.0%Harbor seal 17 1.4 20.0% 4.3 60.0% 1.4 20.0%Ducks 17 1.4 25.0% 2.8 50.0% 1.4 25.0%Chitons (bidarkis, gumboots) 17 0.0 0.0% 1.4 100.0% 0.0 0.0%Clams 17 2.8 33.3% 5.7 66.7% 0.0 0.0%
Estimated householdsResource
-continued-
Estimated householdsResource
Table 2-33.–Continued.
Valid responsesb, dNot in communityaNo responsea In communitya
b. Computed as a percentage of households that were in the community 10 years ago.c. Computed as a percentage of valid responses.d. Valid responses include only those households that were in the community 10 years ago and that responded that resource availability was either less, the same, or more compared to 10 years ago.
Lessc Samec Morec
Source ADF&G Division of Subsistence household surveys, 2015.a. Computed as a percentage of estimated households.
92

The survey included questions regarding household assessment of change in resource availability as compared to 10 years ago for several species (Table 2-33). For Pacific herring, 75% of households offering valid responses indicated that there are more Pacific herring today as compared to 10 years ago, 25% indicated less resource availability, and no household indicated that conditions are the same. Of the households indicating that Pacific herring are more available, 67% indicated that this is due to stock or population status (Table 2-34). The only reason given for lower availability was EVOS contamination (Table 2-35).For Pacific halibut, 50% of households offering valid responses indicated that availability is the same, 25% indicated that it has increased, and 25% responded that it has decreased (Table 2-33). Stock or population status was the only reason given for an increase in availability of Pacific halibut (Table 2-34). The only reason given for a decrease in availability was competition or overharvest (Table 2-35). Approximately 60% of households providing valid responses indicated that harbor seal availability is the same as compared to 10 years ago, 20% indicated harbor seals are less available, and 20% indicated that they are more available (Table 2-33). Stock or population status was the only reason given for decreased availability of harbor seals (Table 2-35). No reason was listed for an increase in availability (Table 2-34). Most households (50%) offering a valid response indicated that duck availability has remained the same (Table 2-33). Only 25% indicated that ducks are more available and 25% also indicated that they are less available. Stock or population status and general or other reasons were given for a decline in availability of ducks (Table 2-35). No reason was given for an increase in availability (Table 2-34). Few households (approximately 1.4 when extrapolated) answered the resource availability question regarding chitons (Table 2-33). These households perceived availability to be the same today as compared to 10 years ago. For clams, 67% of households offering a valid response indicated that this resource is equally available today as compared to 10 years ago (Table 2-33). Another 33% of responding households perceived clam availability as being less, and no household indicated that clams were more abundant. Reasons given for a decline in clam availability include stock or population status and environmental conditions or predation (Table 2-35).
Social and Economic Conditions
Young Adults’ Involvement in Subsistence ActivitiesThis survey sought to understand if young adults are perceived as learning enough hunting, fishing, and processing skills. All households responded to this question (Table 2-36). Approximately 67% of households indicated that they do not believe young adults are learning enough about these skills and 33% indicated that youth are learning subsistence skills. This is a significant change from 1998 and 2003 when approximately 67% and 60% of Chenega Bay households, respectively, indicated that young adults were learning enough (Fall 2006:426). For 2014, several reasons were given by households that indicated youth are not learning enough about the subsistence way of life for why young adults are not learning enough hunting, fishing, and processing skills (Table 2-37). These included changes in community way of life (38% of households), lack of teachers (38%), technology and modernization (25%), economics (13%), no interest (13%) and other reasons (13%). For the 2003 study year, a lack of interest was cited most often (39% of households), followed by a lack of teachers (19%,) and changes in the community way of life (13%) (Fall 2006:426). While lack of interest decreased as a response, responses indicating a lack of teachers and changes to the community way of life have increased.For the 33% of households indicating that young adults were learning enough subsistence activities, 3 reasons were given for how the young adults are learning these skills (Table 2-38). Households indicated that young adults were learning subsistence skills from: other community members (50%), family members (25%), and elders (25%). In 2003, the ways of learning were attributed to family members (41%), followed
93
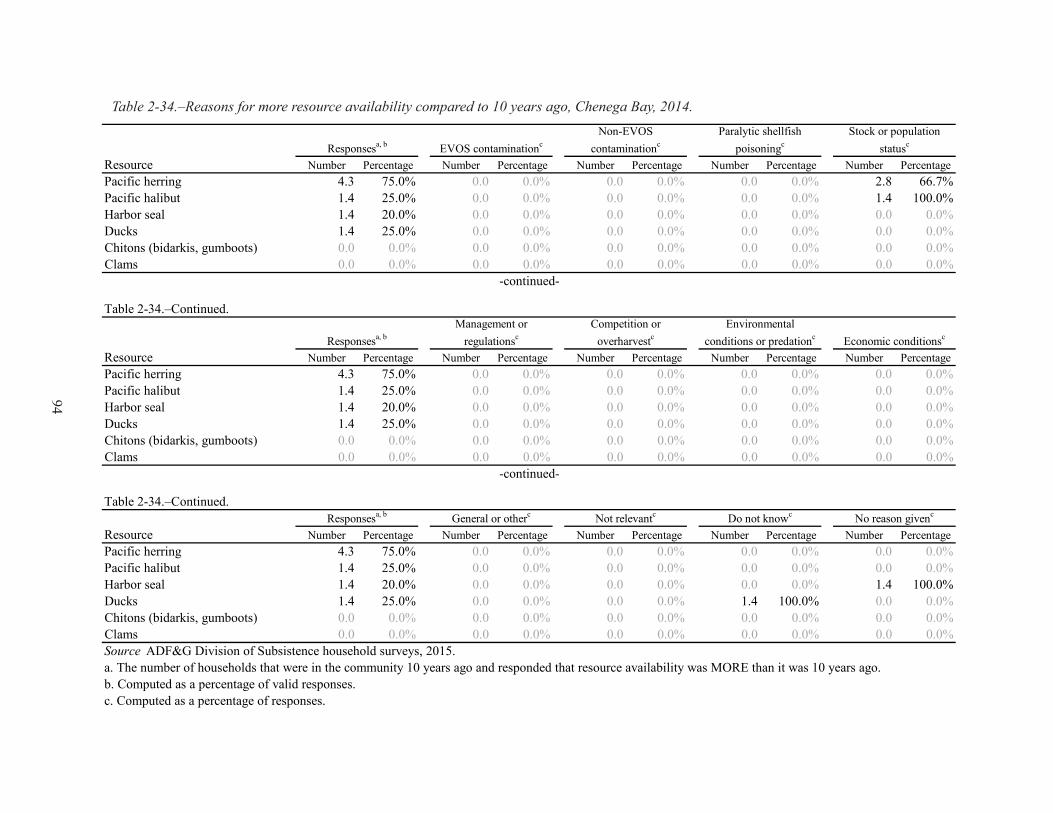
Table 2-34.–Reasons for more resource availability compared to 10 years ago, Chenega Bay, 2014.
Number Percentage Number Percentage Number Percentage Number Percentage Number PercentagePacific herring 4.3 75.0% 0.0 0.0% 0.0 0.0% 0.0 0.0% 2.8 66.7%Pacific halibut 1.4 25.0% 0.0 0.0% 0.0 0.0% 0.0 0.0% 1.4 100.0%Harbor seal 1.4 20.0% 0.0 0.0% 0.0 0.0% 0.0 0.0% 0.0 0.0%Ducks 1.4 25.0% 0.0 0.0% 0.0 0.0% 0.0 0.0% 0.0 0.0%Chitons (bidarkis, gumboots) 0.0 0.0% 0.0 0.0% 0.0 0.0% 0.0 0.0% 0.0 0.0%Clams 0.0 0.0% 0.0 0.0% 0.0 0.0% 0.0 0.0% 0.0 0.0%
Number Percentage Number Percentage Number Percentage Number Percentage Number PercentagePacific herring 4.3 75.0% 0.0 0.0% 0.0 0.0% 0.0 0.0% 0.0 0.0%Pacific halibut 1.4 25.0% 0.0 0.0% 0.0 0.0% 0.0 0.0% 0.0 0.0%Harbor seal 1.4 20.0% 0.0 0.0% 0.0 0.0% 0.0 0.0% 0.0 0.0%Ducks 1.4 25.0% 0.0 0.0% 0.0 0.0% 0.0 0.0% 0.0 0.0%Chitons (bidarkis, gumboots) 0.0 0.0% 0.0 0.0% 0.0 0.0% 0.0 0.0% 0.0 0.0%Clams 0.0 0.0% 0.0 0.0% 0.0 0.0% 0.0 0.0% 0.0 0.0%
Number Percentage Number Percentage Number Percentage Number Percentage Number PercentagePacific herring 4.3 75.0% 0.0 0.0% 0.0 0.0% 0.0 0.0% 0.0 0.0%Pacific halibut 1.4 25.0% 0.0 0.0% 0.0 0.0% 0.0 0.0% 0.0 0.0%Harbor seal 1.4 20.0% 0.0 0.0% 0.0 0.0% 0.0 0.0% 1.4 100.0%Ducks 1.4 25.0% 0.0 0.0% 0.0 0.0% 1.4 100.0% 0.0 0.0%Chitons (bidarkis, gumboots) 0.0 0.0% 0.0 0.0% 0.0 0.0% 0.0 0.0% 0.0 0.0%Clams 0.0 0.0% 0.0 0.0% 0.0 0.0% 0.0 0.0% 0.0 0.0%
ResourceResponsesa, b EVOS contaminationc
Non-EVOS contaminationc
Paralytic shellfish poisoningc
Stock or population statusc
-continued-
Economic conditionsc
Table 2-34.–Continued.
-continued-
Source ADF&G Division of Subsistence household surveys, 2015.a. The number of households that were in the community 10 years ago and responded that resource availability was MORE than it was 10 years ago.
ResourceResponsesa, b
Management or regulationsc
Competition or overharvestc
Environmental conditions or predationc
b. Computed as a percentage of valid responses.c. Computed as a percentage of responses.
Table 2-34.–Continued.
ResourceResponsesa, b General or otherc Not relevantc Do not knowc No reason givenc
94
Table 2-35.–Reasons for less resource availability compared to 10 years ago, Chenega Bay, 2014.
Number Percentage Number Percentage Number Percentage Number Percentage Number PercentagePacific herring 1.4 25.0% 1.4 100.0% 0.0 0.0% 0.0 0.0% 0.0 0.0%Pacific halibut 1.4 25.0% 0.0 0.0% 0.0 0.0% 0.0 0.0% 0.0 0.0%Harbor seal 1.4 20.0% 0.0 0.0% 0.0 0.0% 0.0 0.0% 1.4 100.0%Ducks 1.4 25.0% 0.0 0.0% 0.0 0.0% 0.0 0.0% 1.4 100.0%Chitons (bidarkis, gumboots) 0.0 0.0% 0.0 0.0% 0.0 0.0% 0.0 0.0% 0.0 0.0%Clams 2.8 33.3% 0.0 0.0% 0.0 0.0% 0.0 0.0% 1.4 50.0%
Number Percentage Number Percentage Number Percentage Number Percentage Number PercentagePacific herring 1.4 25.0% 0.0 0.0% 0.0 0.0% 0.0 0.0% 0.0 0.0%Pacific halibut 1.4 25.0% 0.0 0.0% 1.4 100.0% 0.0 0.0% 0.0 0.0%Harbor seal 1.4 20.0% 0.0 0.0% 0.0 0.0% 0.0 0.0% 0.0 0.0%Ducks 1.4 25.0% 0.0 0.0% 0.0 0.0% 0.0 0.0% 0.0 0.0%Chitons (bidarkis, gumboots) 0.0 0.0% 0.0 0.0% 0.0 0.0% 0.0 0.0% 0.0 0.0%Clams 2.8 33.3% 0.0 0.0% 0.0 0.0% 1.4 50.0% 0.0 0.0%
Number Percentage Number Percentage Number Percentage Number Percentage Number PercentagePacific herring 1.4 25.0% 0.0 0.0% 0.0 0.0% 0.0 0.0% 0.0 0.0%Pacific halibut 1.4 25.0% 0.0 0.0% 0.0 0.0% 0.0 0.0% 0.0 0.0%Harbor seal 1.4 20.0% 0.0 0.0% 0.0 0.0% 0.0 0.0% 0.0 0.0%Ducks 1.4 25.0% 1.4 100.0% 0.0 0.0% 0.0 0.0% 0.0 0.0%Chitons (bidarkis, gumboots) 0.0 0.0% 0.0 0.0% 0.0 0.0% 0.0 0.0% 0.0 0.0%Clams 2.8 33.3% 0.0 0.0% 0.0 0.0% 0.0 0.0% 0.0 0.0%Source ADF&G Division of Subsistence household surveys, 2015.a. The number of households that were in the community 10 years ago and responded that resource availability was LESS than it was 10 years ago.b. Computed as a percentage of valid responses.c. Computed as a percentage of responses.
Responsesa, b
-continued-
Stock or population statusc
Paralytic shellfish poisoningc
Non-EVOS contaminationcEVOS contaminationc
Resource
Economic conditionscResponsesa, b
Resource
-continued-
Table 2-35.–Continued.Management or
regulationscCompetition or
overharvestcEnvironmental
conditions or predationc
Table 2-35.–Continued.Responsesa, b
ResourceGeneral or otherc Not relevantc Do not knowc No reason givenc
95

Table 2-36.–Household assessments of whether young adults learn enough subsistence skills, Chenega Bay, 2014.
Number Percentage Number Percentage Number Percentage Number Percentage Number Percentage
Chenega Bay 17 0.0 0.0% 0.0 0.0% 17.0 100.0% 5.7 33.3% 11.3 66.7%
Are young adults learning enough hunting, fishing, and processing skills?
Missinga Valid responsea, c Yesb NobDo not knowa
CommunityCommunity households
c. Valid resonses include only households that responded "yes" or "no" to the question.
a. Computed as a percentage of estimated community households.
Prince William Sound
Source ADF&G Division of Subsistence household surveys, 2015.
b. Computed as a percentage of valid responses.
96
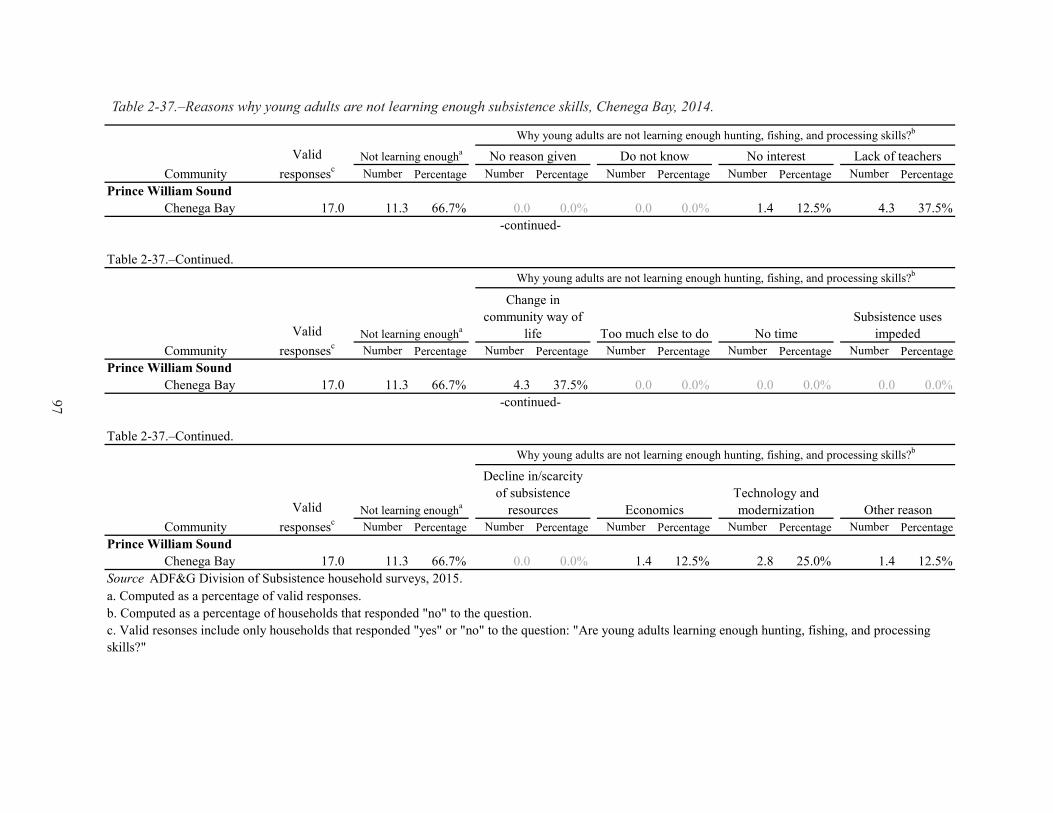
Table 2-37.–Reasons why young adults are not learning enough subsistence skills, Chenega Bay, 2014.
Number Percentage Number Percentage Number Percentage Number Percentage Number Percentage
Chenega Bay 17.0 11.3 66.7% 0.0 0.0% 0.0 0.0% 1.4 12.5% 4.3 37.5%
Community Number Percentage Number Percentage Number Percentage Number Percentage Number PercentagePrince William Sound
Chenega Bay 17.0 11.3 66.7% 4.3 37.5% 0.0 0.0% 0.0 0.0% 0.0 0.0%
Community Number Percentage Number Percentage Number Percentage Number Percentage Number PercentagePrince William Sound
Chenega Bay 17.0 11.3 66.7% 0.0 0.0% 1.4 12.5% 2.8 25.0% 1.4 12.5%Source ADF&G Division of Subsistence household surveys, 2015.a. Computed as a percentage of valid responses.b. Computed as a percentage of households that responded "no" to the question.c. Valid resonses include only households that responded "yes" or "no" to the question: "Are young adults learning enough hunting, fishing, and processingskills?"
-continued-
Table 2-37.–Continued.
Not learning enougha
Why young adults are not learning enough hunting, fishing, and processing skills?b
Valid responsesc
Decline in/scarcity of subsistence
resources EconomicsTechnology and modernization Other reason
-continued-
Table 2-37.–Continued.Why young adults are not learning enough hunting, fishing, and processing skills?b
Change in community way of
life Too much else to do No timeSubsistence uses
impededNot learning enoughaValid responsesc
Prince William Sound
Why young adults are not learning enough hunting, fishing, and processing skills?b
Community Valid
responsescNo reason given No interestNot learning enougha Lack of teachersDo not know
97

Table 2-38.–Ways that young adults are learning subsistence skills, Chenega Bay, 2014.
Community Number Percentage Number Percentage Number Percentage Number Percentage Number Percentage Number Percentage
Chenega Bay 17.0 5.7 33.3% 0.0 0.0% 0.0 0.0% 1.4 25.0% 1.4 25.0% 1.4 25.0%
Number Percentage Number Percentage Number Percentage Number Percentage Number Percentage
Chenega Bay 17.0 5.7 33.3% 0.0 0.0% 0.0 0.0% 2.8 50.0% 0.0 0.0%
Involvement in activitiesEldersFamily membersDo not knowNo reason given
How young adults are learning hunting, fishing, and processing skills?b
Valid responsesc
Yes, learning enougha
Source ADF&G Division of Subsistence household surveys, 2015.
-continued-
Table 2-38.–Continued.
Prince William Sound
a. Computed as a percentage of valid responses.b. Computed as a percentage of households that responded "yes" to the question.c. Valid resonses include only households that responded "yes" or "no" to the question: "Are young adults learning enough hunting, fishing, and processing skills?"
CommunityValid
responsescYes, learning enougha
How young adults are learning hunting, fishing, and processing skills?b
School programs
Other community members and
friends Other
Prince William Sound
Spirit camps and Native programs
98

by school programs (21%), other community members (14%), elders (10%), involvement in activities (7%), and spirit camps and Native programs (5.4%) (Fall 2006:427).
Elders’ InfluenceOf the households in Chenega Bay that gave a valid response for this question, most (91%) believed that the influence of elders has declined in the community as compared to 10 years ago (Table 2-39). Only 9% of respondents indicated that the influence has remained the same. No household indicated that the influence of elders has increased. Of those households that indicated that the influence of elders is less, 70% reported that this was due to demographic reasons, 20% reported that this was due to cultural reasons, and 20% reported that this is due to something else that was unspecified (Table 2-40). An additional 10% of households did not provide a reason for a decrease in elder influence. There is an apparent decline in perceptions of elder influence since 2003. In that year, only 31% indicated that elder influence in teaching subsistence skills had declined compared to 5 years prior (Fall 2006:427). Some households (25%) indicated that elder influence had increased and 44% indicated that influence had remained the same. The recent change in perceptions about elder influence may be due to a larger generational gap and having fewer elders present in the community (Figure 2-3; Table 2-3).
Status of the Traditional Way of LifeIn 2014, all Chenega Bay households indicated that the community’s traditional way of life was affected by the Exxon Valdez oil spill (Table 2-41). The majority of households (58%) indicated that the traditional way of life has not fully recovered, 25% indicated that it has, and 17% indicated that they did not know the answer to this question (Table 2-42). Approximately one-half of the households that indicated the subsistence way of life had not recovered offered suggestions on what should be done to help in the recovery of the traditional way of life (Table 2-43). These suggestions included increasing resource populations and responding to social disruptions. Another 14% of households indicated that nothing can be done to help.
99

Table 2-40.–Reasons for decreased influence of elders in the last 10 years, Chenega Bay, 2014.
Number Percentage Number Percentage Number Percentage Number Percentage Number Percentage
Chenega Bay 14 1.4 10.0% 9.9 70.0% 2.8 20.0% 0.0 0.0% 0.0 0.0%
Number Percentage Number Percentage Number Percentage Number Percentage
Chenega Bay 14 0.0 0.0% 0.0 0.0% 0.0 0.0% 2.8 20.0%
Reasons for decreased influence of elders compared to 10 years ago (2004)Elders more activeDemographic
Prince William Sound
Missing Elders less activeCulturalInfluence decreasedCommunity
-continued-
Prince William Sound
Social/political Economic Non-specific OtherReasons for decreased influence of elders compared to 10 years ago (2004)
Source ADF&G Division of Subsistence household surveys, 2015.Note Only households responding that the influence of elders has decreased are included.
Table 2-40.–Continued.
CommunityInfluence decreased
Table 2-39.–Household assessments of change in elders’ influence in the last 10 years, Chenega Bay, 2014.
Number Percentage Number Percentage Number Percentage Number Percentage Number Percentage
Chenega Bay 17 1.4 8.3% 15.6 91.7% 14.2 90.9% 1.4 9.1% 0.0 0.0%
Note The "missing" and "valid response" categories are computed as percentages of estimated community households. All other categories are calculated as percentages of valid responses.
Missing Valid responses
Prince William Sound
Same IncreasedDecreasedCommunityhouseholdsCommunity
Source ADF&G Division of Subsistence household surveys, 2015.
Change in elders' influence compared to 10 years ago (2004)
100

Table 2-41.–Household assessments of the oil spill’s effect on the traditional way of life, Chenega Bay, 2014.
Number Percentage Number Percentage Number Percentage Number Percentage Number Percentage
Chenega Bay 17 0.0 0.0% 17.0 100.0% 0.0 0.0% 0.0 0.0% 17.0 100.0%
a. Computed as a percentage of community households.b. Computed as a percentage of valid responses.c. Valid responses include only households that responded "yes," "no," or "do not know" to the question.
Source ADF&G Division of Subsistence household surveys, 2015.
CommunityCommunity households
Do not knowb
Prince William Sound
Was the traditional way of life affected by the Exxon Valdez oil spill?
Missinga Valid responsesa, c Not affectedb Affectedb
Table 2-42.–Household assessments of the recovery of the traditional way of life since the oil spill, Chenega Bay, 2014.
Number Percentage Number Percentage Number Percentage Number Percentage Number Percentage
Chenega Bay 17.0 0.0 0.0% 17.0 100.0% 2.8 16.7% 9.9 58.3% 4.3 25.0%
c. Valid responses include only households that responded "yes," "no," or "do not know" to the question.
CommunityYes, way of life affected
Has the traditional way of life recovered from the Exxon Valdez oil spill?
Missinga Valid responsesa, c Do not knowb Not recoveredb Recoveredb
Prince William Sound
Source ADF&G Division of Subsistence household surveys, 2015.a. Computed as a percentage of households that responded "yes" to the question: "Was the traditional way of life affected by the Exxon Valdez oil spill?"b. Computed as a percentage of valid responses.
101

Table 2-43.–Household assessments for ways to help the recovery of the traditional way of life, Chenega Bay, 2014.
Number Percentage Number Percentage Number Percentage Number Percentage Number Percentage Number PercentagePrince William Sound
Chenega Bay 17.0 9.9 58.3% 4.3 42.9% 1.4 14.3% 1.4 14.3% 1.4 14.3% 0.0 0.0%
Number Percentage Number Percentage Number Percentage Number Percentage Number Percentage Number PercentagePrince William Sound
Chenega Bay 17.0 9.9 58.3% 0.0 0.0% 0.0 0.0% 0.0 0.0% 0.0 0.0% 0.0 0.0%
Number Percentage Number Percentage Number Percentage Number Percentage Number PercentagePrince William Sound
Chenega Bay 17.0 9.9 58.3% 1.4 14.3% 0.0 0.0% 0.0 0.0% 0.0 0.0%
a. Computed as a percentage of households that responded "yes" to the question: "Was the traditional way of life affected by the Exxon Valdez oil spill?"b. Computed as a percentage of households that responded "no" to the question: "Has the traditional way of life recovered from the Exxon Valdez oil spill?"
Community
Yes, way of life
affected
No, way of life not recovereda Nothing can be done Time
Need to involve elders more Other suggestion
What should be done to help in the recovery of the traditional way of life?b
-continued-
Table 2-43.–Continued.
Yes, way of life
affected
No, way of life not recovereda
Source ADF&G Division of Subsistence household surveys, 2015.
-continued-
Get rid of the oilContinue studies on
effectsTake legal and political
actionStop cash distributions and dividend payments
More education and spirit camps
What should be done to help in the recovery of the traditional way of life?bTable 2-43.–Continued.
Community
No, way of life not recovereda Do not knowMissing
What should be done to help in the recovery of the traditional way of life?b
Yes, way of life
affectedCommunity
Create new jobs and new sources of income
Respond to social disruptions
Increase resource populations
102

ACKNOWLEDGMENTS
We offer our sincere gratitude to the Chenega IRA Council and to our local research assistant George Elashansky for helping to make this work possible. We also thank the McLaughlin family for their contributions to this project as well as Charlie Ridinger and Sarah Jones at the Chenega Bay school for generously offering facilities for public meetings.
103

3. TATITLEK
Bronwyn Jones and Erica Mitchell
coMMunity Background
Tatitlek is an Alutiiq village located in northern Prince William Sound, approximately 30 miles from Valdez. The village is positioned on a 1-mile flat strip of land between Galena Bay and Boulder Bay at the base of Copper Mountain. To the north, the landscape is part of the Chugach National Forest and is a mountainous terrain that is composed of thick stands of western hemlock–Sitka spruce and abundant freshwater systems. In all other directions, the marine waters of Prince William Sound offer opportunity for travel by boat to numerous islands near Tatitlek and to larger hubs such as Valdez, Cordova, and Whittier.Before the 20th century, the people of Tatitlek were 1 of 8 groups of Alutiiq who inhabited Prince William Sound. Contemporarily, Tatitlek and Chenega Bay are the only 2 Alutiiq communities that remain. Tatitlek (Titiglikskoe) is mentioned in the Russian American Company records as early as 1847. Between 1847 and 1900, the village moved at least 3 times. In 1858, Tatitlek was described as lying on a cape, and in 1880 it was shown on the southern end of Boulder Bay. The village was relocated to its present location on Tatitlek Narrows in 1900 (Fall 2006).Today, access to the community is limited to boat, plane, and the state-operated ferry. The community is governed by an Indian Reorganization Act (IRA) council—a tribal organization that provides many different services for Tatitlek residents. The services include operation and maintenance of the water, sewer, solid waste, and electrical systems. In 2014, Tatitlek had a full-service school for kindergarten through grade 12 students. There was also a post office, health clinic, community center, church, and small store located inside a private residence. In addition to some existing homes that were built on private property, there have been several major housing projects in Tatitlek. In 1964, the Bureau of Indian Affairs (BIA) provided housing in response to the 1964 earthquake and in 1982, 18 Housing and Urban Development (HUD) homes were built.
houSehold Survey iMPleMentation
The community of Tatitlek was initially contacted regarding this research in November 2015 by Alaska Department of Fish and Game (ADF&G) staff member Sarah Hazell. Hazell sent a letter by fax and email requesting an opportunity to meet with the Tatitlek Village IRA Council about updating information for the Exxon Valdez Oil Spill Trustee Council concerning the recovery of subsistence resources. Tribal council president David Totemoff contacted Hazell and arranged to meet in Anchorage about the proposed project. On December 4, 2014, Mr. Totemoff visited the division offices and signed a letter in support of the project.Hazell and 2 Division of Subsistence volunteers, Cameron Welch and Jessie Merriam, traveled to Tatitlek between February 23 and 26, 2015, to conduct comprehensive surveys. Two local research assistants (LRAs) were hired to assist with conducting surveys. Following the survey effort and subsequent analysis of results, Division of Subsistence staff members Bronwyn Jones and Joshua Ream traveled to Tatitlek to present the study findings to members of the Tatitlek Village IRA Council on September 15, 2015. Two members of the Tatitlek Village IRA Council attended the meeting and provided researchers with feedback related to survey comments and map data.
PoPulation eStiMateS and deMograPhic inForMation
This study found an estimated population for Tatitlek in 2014 of approximately 75 individuals living in 27 households (Table 3-1). The number of individuals is less than the 2010 U.S. Census Bureau estimate of 88 individuals in 36 households. In contrast, the American Community Survey (ACS) found a 5-year (2009–
104

2013) average estimate of 62 individuals in 29 households. Figure 3-1 shows the percentage of Alaska Native residents based on this survey and as estimated by the U.S. Census Bureau and ACS. The reasons for these differing estimates may include differences in agency parameters for determining full-time residency. This study required at least 3 consecutive months of occupancy in the community for the study year (2014) and self-identification as a full-time resident.In 1989, the Division of Subsistence found the estimated population of Tatitlek to be 108 people making up 29 households (Stratton 1990). The following year, the division found 111 people living in 28 permanent households during the 1990 study year, and 28 year-round households with 124 community members the following year (1991) (Fall 1997; Fall et al. 1996). In 1998, the division found 81 Tatitlek residents living in 27 households (Fall and Utermohle 1999). In 2003, the Division of Subsistence found 73 Tatitlek residents, making up 27 households (Fall 2006).Figure 3-2 depicts Tatitlek’s historical population trend from 1950 to 2014 based on estimates by the U.S. Census Bureau and Alaska Department of Labor and Workforce Development. Various circumstances have influenced the population trend over time. The spike in population for 1970 can be attributed to an influx of Chenega Bay residents who moved to Tatitlek after the 1964 earthquake, and the decline in population by 1980 can be attributed to the exodus of Chenega Bay refugees, many of whom moved to Anchorage and Cordova according to local residents. One explanation for the increase of population in 1990, the year after the Exxon Valdez oil spill, is the influx of temporary residents who came to work on the oil spill (Fall et al. 1996:51). However, following these events, the overall population of Tatitlek has declined slightly since the mid-2000s (Figure 3-2). Several Tatitlek community members remarked that it is becoming more common for Tatitlek residents to migrate out of the community to work, but several mentioned that these people often have plans to move back to the community eventually.Of the 27 qualifying households found for the 2014 study year, 21 were successfully surveyed resulting in a sample achievement of 78% (Table 3-2). While the goal was to survey all households, a number of people were out of town during the survey effort (see Table 1-4 for additional sample achievement information). The average size of Tatitlek households was approximately 2.8 individuals (Table 3-2). This study found an estimated 88% of the population of Tatitlek to be Alaska Native.
Table 3-1.–Population estimates, Tatitlek, 2010 and 2014.
Estimate Rangea Estimate Rangeb
Households 36 29.0 16 – 42 27.0Population 88 62.0 32 – 92 74.6 64 – 85
Population 58 59.0 29 – 89 65.6 54 – 77Percentage 65.9% 95.2% 87.9%
Sources U.S. Census Bureau (2011) for 2010 estimate; U.S. Census Bureau for American Community Survey (ACS) 2013 estimate (5-year average); and ADF&G Division of Subsistence household surveys, 2015, for 2014 estimate.Note Division of Subsistence household survey elegiblity requirements differ from those used by (ACS).
Total population
Alaska Native
b. No range of households is estimated for division surveys. a. ACS data range is the reported margin of error.
Census(2010)
5-year American Community Survey
(2009–2013)This study
(2014)
Note Tatitlek includes Tatitlek census designated place (CDP) .
105

Figure 3-1.–Alaska Native and overall population estimates, Tatitlek, 2010 and 2014.
0
10
20
30
40
50
60
70
80
90
100
2010 U.S. Census 2009–2013 American Community Survey
This study(2014)
Num
ber o
f peo
ple
Total population Alaska Native population
75
0
20
40
60
80
100
120
140
1950 1960 1970 1980 1990 2000 2010
Num
ber o
f peo
ple
U.S. Census (count) Alaska Department of Labor (estimate)This study (estimate) Population trend
Figure 3-2.–Historical population estimates, Tatitlek, 1950–2014.
106

Table 3-2.–Sample and demographic characteristics, Tatitlek, 2014.
CommunityTatitlek
Sampled households 21Eligible households 27Percentage sampled 77.8%
Sampled population 58Estimated community population 74.6
Mean 2.8Minimum 1Maximum 6
35.41
7736.5
Total populationMean 23.4Minimuma 1Maximum 77
Heads of householdMean 34.8Minimuma 5Maximum 77
Alaska NativeEstimated householdsb
Number 23.1Percentage 86%
Estimated populationNumber 65.6Percentage 87.9%
b. The estimated number of households in which at least 1 head of household is Alaska Native.
Minimuma
MaximumMedian
Length of residency
a. A minimum age of 0 (zero) is used for infants who are less than 1 year of age.
Source ADF&G Division of Subsistence household surveys, 2015.
Mean
Household size
Age
Characteristics
107

Figure 3-3.–Population profile, Tatitlek, 2014.
Table 3-3.–Population profile, Tatitlek, 2014.
Number PercentageCumulative percentage Number Percentage
Cumulative percentage Number Percentage
Cumulative percentage
0–4 5.1 12.9% 12.9% 1.3 3.7% 3.7% 6.4 8.6% 8.6%5–9 2.6 6.5% 19.4% 2.6 7.4% 11.1% 5.1 6.9% 15.5%
10–14 5.1 12.9% 32.3% 2.6 7.4% 18.5% 7.7 10.3% 25.9%15–19 2.6 6.5% 38.7% 2.6 7.4% 25.9% 5.1 6.9% 32.8%20–24 3.9 9.7% 48.4% 3.9 11.1% 37.0% 7.7 10.3% 43.1%25–29 2.6 6.5% 54.8% 1.3 3.7% 40.7% 3.9 5.2% 48.3%30–34 0.0 0.0% 54.8% 0.0 0.0% 40.7% 0.0 0.0% 48.3%35–39 1.3 3.2% 58.1% 2.6 7.4% 48.1% 3.9 5.2% 53.4%40–44 2.6 6.5% 64.5% 1.3 3.7% 51.9% 3.9 5.2% 58.6%45–49 2.6 6.5% 71.0% 2.6 7.4% 59.3% 5.1 6.9% 65.5%50–54 2.6 6.5% 77.4% 6.4 18.5% 77.8% 9.0 12.1% 77.6%55–59 0.0 0.0% 77.4% 0.0 0.0% 77.8% 0.0 0.0% 77.6%60–64 5.1 12.9% 90.3% 0.0 0.0% 77.8% 5.1 6.9% 84.5%65–69 1.3 3.2% 93.5% 5.1 14.8% 92.6% 6.4 8.6% 93.1%70–74 1.3 3.2% 96.8% 2.6 7.4% 100.0% 3.9 5.2% 98.3%75–79 1.3 3.2% 100.0% 0.0 0.0% 100.0% 1.3 1.7% 100.0%80–84 0.0 0.0% 100.0% 0.0 0.0% 100.0% 0.0 0.0% 100.0%85–89 0.0 0.0% 100.0% 0.0 0.0% 100.0% 0.0 0.0% 100.0%90–94 0.0 0.0% 100.0% 0.0 0.0% 100.0% 0.0 0.0% 100.0%95–99 0.0 0.0% 100.0% 0.0 0.0% 100.0% 0.0 0.0% 100.0%
100–104 0.0 0.0% 100.0% 0.0 0.0% 100.0% 0.0 0.0% 100.0%Missing 0.0 0.0% 100.0% 0.0 0.0% 100.0% 0.0 0.0% 100.0%Total 39.9 100.0% 100.0% 34.7 100.0% 100.0% 74.6 100.0% 100.0%
Source ADF&G Division of Subsistence household surveys, 2015.
Age
Male Female Total
8 6 4 2 0 2 4 6 8
0–45–9
10–1415–1920–2425–2930–3435–3940–4445–4950–5455–5960–6465–6970–7475–7980–8485–8990–9495–99
100–104Missing
Number of people
Female
Male
108

This study found the average age of Tatitlek residents to be 35 years old, with the youngest individual being 1 year old and the oldest individual being 77 years old (Table 3-2). The largest age cohorts of males were between the ages of 0–4, 10–14, and 60–64, with each representing 13% of the male population and for females the largest age cohort was for ages of 50–54, representing 19% of the female population (Table 3-3). Overall, the 2014 population profile indicates that the ratio of females versus males is evenly distributed within many age cohorts in Tatitlek. However, there are more male than female children between the ages of 0 and 14 in the community; between the ages of 15 and 24 there is an even distribution of male and female residents; and between the ages of 25 and 74, the number of male and female individuals is relatively evenly distributed (Figure 3-3).The 2014 survey found that almost one-half of the household heads’ parents were living in Tatitlek when they were born (47%) (Table 3-4). Twenty-two percent of the household heads’ parents were living in other U.S. cities, 9% in Cordova, and 6% in Chenega (the old village site). Similarly, for the overall population, 59% of residents were born to parents who resided in Tatitlek (Table 3-5). An estimated 12% of Tatitlek residents were born in other U.S. cities, 10% were born in Anchorage, and 5% were born in Cordova.
Table 3-4.–Birthplaces of household heads, Tatitlek, 2014.
Table 3-5.–Birthplaces of population, Tatitlek, 2014.
Birthplace PercentageAnchorage 3.1%Bethel 3.1%Chenega Bay 3.1%Cordova 9.4%Homer 3.1%Tatitlek 46.9%Chenega (Old Village) 6.3%
Missing 3.1%Other U.S. 21.9%
Note "Birthplace" means the place of residence of the parents of the individual when the individual was born.
Source ADF&G Division of Subsistence household surveys, 2015.
Birthplace PercentageAnchorage 10.3%Bethel 1.7%Chenega Bay 1.7%Cordova 5.2%Homer 1.7%Port Graham 3.4%Tatitlek 58.6%Chenega (Old Village) 3.4%
Missing 1.7%Other U.S. 12.1%Source ADF&G Division of Subsistence household surveys, 2015.Note "Birthplace" means the place of residence of the parents of the individual when the individual was born.
109

incoMe and caSh eMPloyMent
The total estimated mean household income for Tatitlek in 2014 was $63,586 (Table 3-6) and the estimated per capita income was $23,023 (Table 1-7). Of the average household income in 2014, $41,887 (66%) was derived from “other income.” Pension/retirement income accounted for the highest percentage of other income (57%), followed by Native corporation dividends (23%), Alaska Permanent Fund dividends (10%), disability (6%), Social Security (4%), and heating assistance and longevity bonus incomes each contributed less than 1% to the mean household other income. The remaining 34% of average household income was from earned income ($21,699). Local government (including tribal governments) accounted for the highest percentage of earned income (68%), followed by the services sector (17%), and construction (10%) (Table 3-7). In addition, the transportation, communication, and utilities sector made up 3% of earned income, followed by agriculture, forestry, and fishing (2%), and retail trade (less than 1%). Figure 3-4 depicts the overall top sources of income in Tatitlek in 2014.The total estimated mean household income for Tatitlek ($63,586) is slightly higher than the estimated mean household income in Chenega Bay but lower than the estimated mean household income for Cordova (Table 1-7). The estimated mean household income in Cordova was $86,157 with the largest contributor of earned income being agriculture, forestry, and fishing (Table 1-7; Table 4-8). In Chenega Bay, the estimated household income was $49,906 with the largest contributor of earned income being the services sector (Table 1-7; Table 2-7).In Tatitlek, the 2014 median household income estimate was $36,180, which is slightly more than the 2009–2013 ACS estimate for Tatitlek ($35,417), and far less than the ACS estimate of all of Alaska ($70,760) (Table 3-8).There were approximately 37 jobs reported in Tatitlek in 2014 (Table 3-7). While pension/retirement made up the greatest percentage of household income during the study year (Figure 3-4), local government jobs (including tribal) composed the greatest number of jobs in the community (67%), with the majority of employed individuals (77%) working in this industry (Table 3-7). By percentage of jobs, services contributed the second greatest proportion of jobs (15%); this was followed by transportation, communication, and utilities (7%); construction (4%); agriculture, forestry, and fishing (4%); and retail trade (4%).Of approximately 54 adults who were working age (16 or older) in Tatitlek, 30 (56%) were employed in 2014 (Table 3-9). Approximately 79% of households had at least 1 employed adult during the study year. The mean number of jobs per employed household was 1.7. No household reported more than 5 jobs held by household members in 2014. Employed adults held jobs for an average of 10 months and 64% were employed year-round. During the study year, approximately 44% of jobs in Tatitlek were full time, 44% were part time, 7% were on-call, and 4% of jobs were considered shift work (Table 3-10). In terms of the percentage of working Tatitlek residents, 50% worked a full-time job, 41% worked a part-time job, 9% worked on-call positions, and 5% worked a shift schedule.
110

Table 3-6.–Estimated earned and other income, Tatitlek, 2014.Number Percentage of
of Number Total Mean totalemployed of for per community
Income source adults households community household incomeEarned income
Local government, including tribal 23.3 15.2 $397,675 $155,955 – $807,793 $14,729 23.2%
Services * * * $24,591 – $258,158 $3,666 5.8%Construction * * * $49,534 – $159,372 $2,140 3.4%Transportation, communication, and utilities
* * * $4,724 – $54,758 $666 1.0%
Agriculture, forestry, and fishing * * * $1,972 – $27,023 $357 0.6%
Retail trade * * * $3,325 – $11,062 $143 0.2%Earned income subtotal 30.1 21.3 $585,878 $334,490 – $1,073,149 $21,699 34.1%
Other incomePension/retirement * * $0 – $1,285,714 $23,810 37.4%Native corporation dividend 21.9 $260,807 $109,692 – $495,643 $9,660 15.2%Alaska Permanent Fund dividend 24.4 $111,412 $79,935 – $142,915 $4,126 6.5%Disability * * $2,700 – $165,812 $2,320 3.6%Social Security 6.4 $48,458 $8,775 – $111,729 $1,795 2.8%Heating assistance * * $0 – $8,743 $105 0.2%Longevity bonus * * $0 – $3,857 $71 0.1%
0.0 $0 $0 – $0 $0 0.0%
Adult public assistance (OAA, APD) 0.0 $0 $0 – $0 $0 0.0%Supplemental Security income 0.0 $0 $0 – $0 $0 0.0%Food stamps 0.0 $0 $0 – $0 $0 0.0%Workers' compensation/insurance 0.0 $0 $0 – $0 $0 0.0%Unemployment 0.0 $0 $0 – $0 $0 0.0%Veterans assistance 0.0 $0 $0 – $0 $0 0.0%Child support 0.0 $0 $0 – $0 $0 0.0%Other 0.0 $0 $0 – $0 $0 0.0%Foster care 0.0 $0 $0 – $0 $0 0.0%CITGO fuel voucher 0.0 $0 $0 – $0 $0 0.0%Meeting honoraria 0.0 $0 $0 – $0 $0 0.0%
Other income subtotal 25.7 $1,130,945 $323,784 – $2,698,283 $41,887 65.9%Community income total $1,716,823 $799,695 – $3,639,449 $63,586 100.0%
-/+ 95% CI
Source ADF&G Division of Subsistence household surveys, 2015.Note * indicates data redacted to protect privacy.
TANF (Temporary Cash Assistance for Needy Families)
111

Table 3-7.–Employment by industry, Tatitlek, 2014.
Jobs Households IndividualsPercentage of wage earnings
37.0 21.3 30.1
66.7% 71.4% 77.3% 67.9%Teachers, librarians, and counselors 7.4% 7.1% 9.1% 5.7%Health technologists and technicians 3.7% 7.1% 4.5% 0.3%Technologists and technicians, except health 3.7% 7.1% 4.5% 3.9%Administrative support occupations, including clerical 11.1% 21.4% 13.6% 11.0%Service occupations 18.5% 35.7% 22.7% 29.6%Transportation and material moving occupations 3.7% 7.1% 4.5% 3.9%Handlers, equipment cleaners, helpers, and laborers 18.5% 28.6% 22.7% 13.4%
3.7% 7.1% 4.5% 1.6%Agricultural, forestry, and fishing occupations 3.7% 7.1% 4.5% 1.6%
3.7% 7.1% 4.5% 9.9%Handlers, equipment cleaners, helpers, and laborers 3.7% 7.1% 4.5% 9.9%
7.4% 14.3% 9.1% 3.1%Handlers, equipment cleaners, helpers, and laborers 7.4% 14.3% 9.1% 3.1%
3.7% 7.1% 4.5% 0.7%Executive, administrative, and managerial 3.7% 7.1% 4.5% 0.7%
14.8% 28.6% 18.2% 16.9%Executive, administrative, and managerial 3.7% 7.1% 4.5% 5.5%Administrative support occupations, including clerical 3.7% 7.1% 4.5% 5.5%Handlers, equipment cleaners, helpers, and laborers 3.7% 7.1% 4.5% 0.5%Occupation not indicated 3.7% 7.1% 4.5% 5.5%
Source ADF&G Division of Subsistence household surveys, 2015.
Estimated total numberIndustry
Local government, including tribal
Agriculture, forestry, and fishing
Construction
Transportation, communication, and utilities
Retail trade
Services
112

All other sources< 1%
Pension/retirement37%
Local government, including tribal
23%
Native corporation dividend
15%
Alaska Permanent Fund dividend
6%
Services6%
Disability4%
Construction3%
Social Security3%
Transportation, communication,and
utilities 1%
Agriculture, forestry, and fishing
1%
Note The "all other sources" category includes sources providing less than 0.5% each to the overall income.
Figure 3-4.–Top income sources, Tatitlek, 2014.
Table 3-8.–Comparison of median income estimates, Tatitlek, 2014.
Data source Mediana Rangeb,c
2014 Division of Subsistence estimate $36,180 $15,745 – $59,9682009–2013 ACS (Tatitlek CDP) $35,417 $14,062 – $56,7722009–2013 ACS (All Alaska) $70,760 $70,028 – $71,492
c. ACS data range is the reported margin of error.b. Range is a 95% confidence interval of the estimated median.
a. Division of Subsistence 2014 estimate does not include categories of income excluded by the 2009–2013 ACS median estimate, including food stamps, housing assistance, and one-time payments.
Sources ADF&G Division of Subsistence household surveys, 2015, for 2014 estimate; U.S. Census Bureau for American Community Survey (ACS) 5-year survey estimate.
113

Table 3-9.–Employment characteristics, Tatitlek, 2014.
CommunityTatitlek
54.023.5
30.155.8%
37.01.2
13
9.71
1263.6%
42.2
27
21.378.9%
1.715
1.41.1
14
47.0
Characteristic
Source ADF&G Division of Subsistence household surveys, 2015.
All adultsNumberMean weeks employed
Employed adultsNumber
Households
Mean
MeanMinimum
PercentageJobs per employed household
MaximumPercentage employed year-round
MaximumEmployed adults
MeanMinimum
PercentageJobs
Number
Mean person-weeks of employment
MinimumMaximum
Minimum
Total households
NumberEmployed
MeanEmployed households
Months employedMaximum
Number
Mean weeks employed
114

Table 3-10.–Reported job schedules, Tatitlek, 2014.
Number Percentage Number Percentage Number PercentageFull time 16.4 44.4% 15.1 50.0% 15.2 71.4%Part time 16.4 44.4% 12.3 40.9% 9.1 42.9%Shift 1.4 3.7% 1.4 4.5% 1.5 7.1%On-call (occasional) 2.7 7.4% 2.7 9.1% 3.0 14.3%Part-time shift 0.0 0.0% 0.0 0.0% 0.0 0.0%Schedule not reported 0.0 0.0% 0.0 0.0% 0.0 0.0%
Note Respondents who had more than 1 job in the study year could provide multiple responses, so the percentages may sum to more than 100%.
Schedule
Source ADF&G Division of Subsistence household surveys, 2015.
Jobs Employed persons Employed households
Prior to the 1980s, the economy of Tatitlek was based around commercial fishing. Between 1978 and 1985 there were an average of 12 commercial salmon fishing permits held by Tatitlek residents; in 1986 the number of permits began to decline and by 1992 there were only 2 remaining (Simeone and Miraglia 2000:49). During that time employment in the commercial fishing industry fluctuated. Between 1987 and 1989 almost one-half of the jobs held by Tatitlek residents were in commercial fishing, but in 1989—the year of the Exxon Valdez oil spill—commercial fishing was third in terms of category of employment since most people worked on spill clean-up efforts (Simeone and Miraglia 2000:50). During the 1991 study year, commercial fishing again became the dominant form of employment, but in 1993 it accounted for only 5% of employment, and only 1 household reported income from commercial fishing, compared to 15 households in 1987 (Simeone and Miraglia 2000:50). During the 2014 study year, income from commercial fishing contributed little to the local economy (Table 3-6). According to community members, no Tatitlek residents held a commercial fishing permit in 2014, though several residents were crew members listed on other permits. Community members explained that commercial fishing slowed after the oil spill and never recovered for various reasons. Community members explained that a major reason commercial fishing has continued to decrease so significantly in Tatitlek is because permit holders are getting too old to fish and Tatitlek youths have not expressed much interest in taking over permits.
115

Figure 3-5.–Responses to questions about food insecure conditions, Tatitlek, 2014.
0%
0%
0%
0%
0%
0%
0%
0%
5%0%
0% 20% 40% 60% 80% 100%
Worried about having enough food
Lacked resources to get food
Food (subsistence) did not last
Food (store-bought) did not last
Food did not last, could not get more
Cut size of meals or skipped meals
Ate less than we felt we should
Hungry but did not eat
Lost weight, not enough food
Did not eat for a whole day
Percentage of housheolds reporting condition
Responses used to calculate households' food security category
Responses to additional questions asked in this study*
* Due to interview procedure error, not all respondents were asked the additional questions. Regarding respondents who did not experience the food insecure condition "food did not last, could not get more,"some were asked the additional questions about whether subsistence and store-bought foods did not last,but some were not asked the additional questions.
Food Security
Survey respondents were asked a set of questions intended to assess their household’s food security, defined as, “access by all people at all times to enough food for an active, healthy life” (Coleman-Jensen et al. 2012). The food security questions were modeled after those developed by the U.S. Department of Agriculture (USDA) but modified by ADF&G to account for differences in access to subsistence and store-bought foods. Based on the aggregated number of affirmative responses to these questions, households were broadly categorized as being food secure or food insecure following a USDA protocol (Bickel et al. 2000). Food secure households were broken down further into 2 subcategories: high or marginal food security. Food insecure households were divided into 2 subcategories: low or very low food security.Households with a high or marginal level of food security reported 1 or 2 instances of food access problems or limitations—typically anxiety over food sufficiency or a shortage of particular foods in the house—but gave little or no indication of changes in diets or food intake. Households with low food security reported reduced quality, variety, or desirability of their diet, but they, too, gave little indication of reduced food intake. Households classified as having very low food security were those that reported multiple instances of disrupted eating patterns and reduced food intake (Coleman-Jensen et al. 2012).Core food security condition questions and responses from Tatitlek residents summarized in Figure 3-5 indicate an overall lack of food insecurity conditions experienced by Tatitlek households. For this study, additional questions asked were designed to determine whether food insecurities, if any, were related to subsistence foods or store-bought foods. Only 5% of Tatitlek households indicated that subsistence foods did not last and that they could not get more (Figure 3-5). Note that during survey administration, due to
116
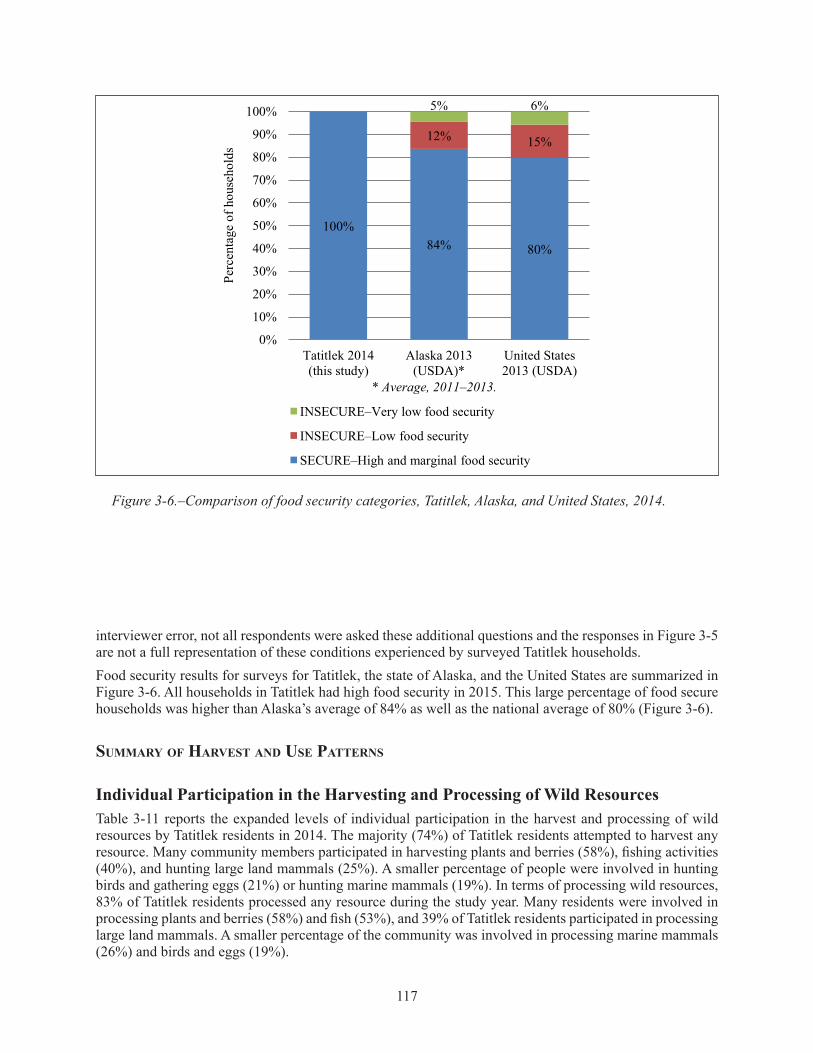
Figure 3-6.–Comparison of food security categories, Tatitlek, Alaska, and United States, 2014.
100%84% 80%
12% 15%
5% 6%
0%
10%
20%
30%
40%
50%
60%
70%
80%
90%
100%
Tatitlek 2014(this study)
Alaska 2013(USDA)*
United States2013 (USDA)
Perc
enta
ge o
f hou
seho
lds
INSECURE–Very low food security
INSECURE–Low food security
SECURE–High and marginal food security
* Average, 2011–2013.
interviewer error, not all respondents were asked these additional questions and the responses in Figure 3-5 are not a full representation of these conditions experienced by surveyed Tatitlek households.Food security results for surveys for Tatitlek, the state of Alaska, and the United States are summarized in Figure 3-6. All households in Tatitlek had high food security in 2015. This large percentage of food secure households was higher than Alaska’s average of 84% as well as the national average of 80% (Figure 3-6).
SuMMary oF harveSt and uSe PatternS
Individual Participation in the Harvesting and Processing of Wild ResourcesTable 3-11 reports the expanded levels of individual participation in the harvest and processing of wild resources by Tatitlek residents in 2014. The majority (74%) of Tatitlek residents attempted to harvest any resource. Many community members participated in harvesting plants and berries (58%), fishing activities (40%), and hunting large land mammals (25%). A smaller percentage of people were involved in hunting birds and gathering eggs (21%) or hunting marine mammals (19%). In terms of processing wild resources, 83% of Tatitlek residents processed any resource during the study year. Many residents were involved in processing plants and berries (58%) and fish (53%), and 39% of Tatitlek residents participated in processing large land mammals. A smaller percentage of the community was involved in processing marine mammals (26%) and birds and eggs (19%).
117
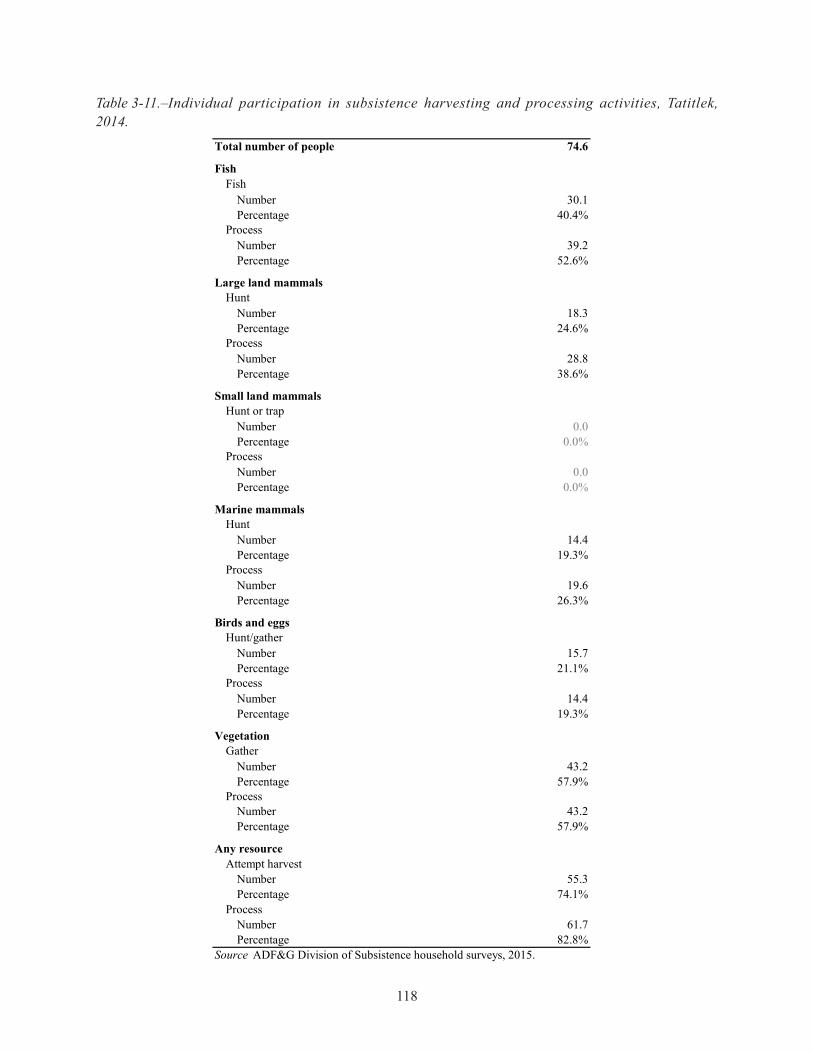
Table 3-11.–Individual participation in subsistence harvesting and processing activities, Tatitlek, 2014.
74.6
Number 30.1Percentage 40.4%
Number 39.2Percentage 52.6%
Number 18.3Percentage 24.6%
Number 28.8Percentage 38.6%
Number 0.0Percentage 0.0%
Number 0.0Percentage 0.0%
Marine mammals
Number 14.4Percentage 19.3%
Number 19.6Percentage 26.3%
Number 15.7Percentage 21.1%
Number 14.4Percentage 19.3%
Number 43.2Percentage 57.9%
Number 43.2Percentage 57.9%
Number 55.3Percentage 74.1%
Number 61.7Percentage 82.8%
Process
Fish
Process
Hunt
Hunt/gather
Process
Hunt or trap
Process
Gather
Source ADF&G Division of Subsistence household surveys, 2015.
Process
Total number of people
Birds and eggs
Fish
Large land mammalsHunt
Process
Process
Attempt harvest
Small land mammals
Vegetation
Any resource
118

Figure 3-7.–Percentages of households using, attempting to harvest, and harvesting wild resources, by resource category, Tatitlek, 2014.
90%
76%81%
0%
67%
52%
38%
81%
71%
48%
57%
38%33%
24%
76%
19%
71%
0%
10%
20%
30%
40%
50%
60%
70%
80%
90%
100%Pe
rcen
tage
of h
ouse
hold
s
Percent of households using Percent of households attempting harvest
Percent of households harvesting
Similarly to 2014, during the 2003 study year more Tatitlek community members were involved in the harvest and processing of plants and fish than in the harvest and processing of large land mammals (Table 3-11) (Fall 2006:17). However, the overall level of individual participation in the harvest and processing of wild resources by all Tatitlek residents in 2014 was less than what was identified during the 2003 study year. In 2003, an estimated 81% of Tatitlek residents attempted to harvest a wild resource during the study year, and 94% processed a wild resource (Fall 2006:17). Several survey respondents for 2014 attributed the decreased levels of individual participation in the harvest and processing of wild resources since 2003 to an aging population and a decrease in younger people’s interest and involvement in these types of activities.During the 1989 study, 66% of Tatitlek residents harvested wild resources, and according to the 1990 study findings, 63% of the community members hunted, fished, or gathered some wild resources (Fall 1997:54). Individual participation increased as the 1990s progressed: in 1991, an estimated 84% of people in Tatitlek attempted to harvest resources and 91% participated in subsistence harvest activities in 1993 (Fall and Utermohle 1995b:V-39). Participation in processing resources was similar for study years 1991, 1993, and 2014, which ranged between 82–86% of individuals.
Harvest and Use of Wild Resources at the Household LevelFigure 3-7 shows by resource category the percentages of households that used wild resources, and also attempted to harvest and harvested wild foods. Salmon was used by the greatest percentage of households (90%), followed by large land mammals and vegetation (81%), nonsalmon fish (76%), marine mammals (67%), birds and eggs (52%), and marine invertebrates (38%). For all resource categories except vegetation,
119

the percentage of households using the resources was substantially higher than those harvesting the resource, indicating the presence of sharing networks.The resource categories with the highest percentage of households harvesting the resources were salmon and vegetation (71%), followed by large land mammals (57%), nonsalmon fish (48%), marine mammals (38%), birds and eggs (33%), and marine invertebrates (19%). Not all households that attempted to harvest individual species from each resource category were successful; this is true for vegetation and marine invertebrates.Table 3-12 summarizes resource harvest and use characteristics for Tatitlek in 2014 at the household level. The average harvest was 811 lb usable weight per household. During the study year, community households harvested an average of 7 kinds of resources and used an average of 10 kinds of resources; the variety of wild resources used is reduced from 2003 when households harvested an average of 6 different wild resources and used 21 different resources (Fall 2006:64). The maximum number of resources used by any household in 2014 was 35. In addition, households gave away an average of 5 kinds of resources and received an average of 5 kinds of resources; this is also reduced from 2003 when an average of 12 resources were given away and 16 resources were received (Fall 2006:72). Overall, as many as 152 species were available for households to harvest in the study area in 2014; this included species that survey respondents identified but were not asked about in the survey instrument.Sharing of wild foods is considered important in Tatitlek. As many as 24 kinds of resources were given away by a household (Table 3-12). One household was identified as a high subsistence harvesting household in the community, and shared a considerable amount of wild foods with the community at large. This household harvested a significant amount of nonsalmon fish that was widely shared with the community. Many respondents commented that subsistence resources are generally abundant in the area, but that the lack effort to participate in subsistence activities among recent generations has limited the overall harvest. During a project review meeting with the Chugach Regional Resources Commission, the representative from Tatitlek remarked that many community households lack the necessary transportation equipment, such as boats and motors, to access subsistence resources.
harveSt QuantitieS and coMPoSition
Table 3-13 reports estimated wild resource harvests and uses by Tatitlek residents in 2014 and is organized first by general category and then by species. All edible resources are reported in pounds usable weight (see Appendix B for conversion factors1). The harvest category includes resources harvested by any member of the surveyed household during the study year. The use category includes all resources taken, given away, or used by a household, and resources acquired from other harvesters, either as gifts, by barter or trade, through hunting partnerships, or as meat given by hunting guides and non-local hunters. Purchased foods are not included. Differences between harvest and use percentages reflect sharing among households, which results in a wider distribution of wild foods.The total harvest by Tatitlek residents was 21,890 lb in 2014 (Table 3-13). The composition of the harvest is represented by salmon (35% of the total harvest), followed by marine mammals (33%), nonsalmon fish (14%), large land mammals (7%), marine invertebrates (6%), vegetation (3%), and birds and eggs (2%) (Figure 3-8). The community harvest by wild resource category in order of most to least harvest weight was: salmon (7,584 lb total, or 102 lb per capita ), marine mammals (7,262 lb total, or 97 lb per capita), nonsalmon fish (3,140 lb total, or 42 lb per capita), large land mammals (1,633 lb total, or 22 lb per capita), marine invertebrates (1,292 lb total, or 17 per capita), vegetation (593 lb total, or 8 lb per capita), and birds and eggs (386 lb, or 5 lb per capita) (Table 3-13).Tatitlek search and harvest areas for all resources occurred near the community as well as in the greater Prince William Sound and Gulf of Alaska areas. The furthest southern point Tatitlek residents traveled in search of wild resources in 2014 was Montague Island, which is near Chenega Bay. The most westward 1. Resources that are not eaten, such as firewood and some furbearers, are included in the table but are given a conversion factor of zero.
120

Table 3-12.–Resource harvest and use characteristics, Tatitlek, 2014.
9.8Minimum 3Maximum 3595% confidence limit (±) 15.5%Median 8
7.4Minimum 2Maximum 3595% confidence limit (±) 21.3%Median 5
7.2Minimum 1Maximum 3495% confidence limit (±) 21.5%Median 5
4.5Minimum 0Maximum 1395% confidence limit (±) 16.3%Median 5
4.6Minimum 0Maximum 2495% confidence limit (±) 25.9%Median 3
Minimum 5Maximum 6,499Mean 810.7Median 228
21,889.7293.5
100.0%100.0%100.0%
81.0%76.2%
21
152
Mean number of resources used per household
Mean number of resources attempted to harvest per household
Mean number of resources harvested per household
Mean number of resources received per household
Characteristic
Percentage using any resourcePercentage attempting to harvest any resourcePercentage harvesting any resource
Mean number of resources given away per household
Source ADF&G Division of Subsistence household surveys, 2015.
Percentage receiving any resourcePercentage giving away any resourceNumber of households in sampleNumber of resources asked about and identified voluntarily by respondents
Household harvest (pounds)
Total harvest weight (lb)Community per capita harvest (lb)
121
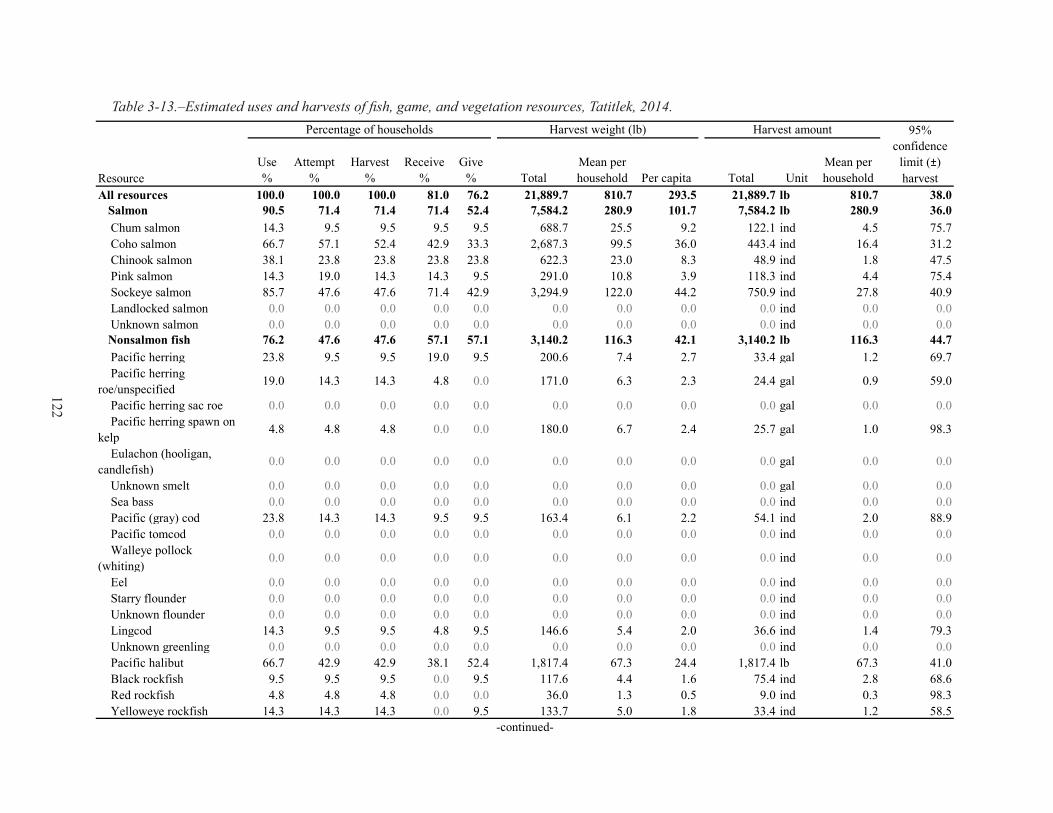
Table 3-13.–Estimated uses and harvests of fish, game, and vegetation resources, Tatitlek, 2014.
Use%
Attempt %
Harvest %
Receive %
Give % Total
Mean per household Per capita Total Unit
Mean per household
All resources 100.0 100.0 100.0 81.0 76.2 21,889.7 810.7 293.5 21,889.7 lb 810.7 38.0Salmon 90.5 71.4 71.4 71.4 52.4 7,584.2 280.9 101.7 7,584.2 lb 280.9 36.0
Chum salmon 14.3 9.5 9.5 9.5 9.5 688.7 25.5 9.2 122.1 ind 4.5 75.7 Coho salmon 66.7 57.1 52.4 42.9 33.3 2,687.3 99.5 36.0 443.4 ind 16.4 31.2 Chinook salmon 38.1 23.8 23.8 23.8 23.8 622.3 23.0 8.3 48.9 ind 1.8 47.5 Pink salmon 14.3 19.0 14.3 14.3 9.5 291.0 10.8 3.9 118.3 ind 4.4 75.4 Sockeye salmon 85.7 47.6 47.6 71.4 42.9 3,294.9 122.0 44.2 750.9 ind 27.8 40.9 Landlocked salmon 0.0 0.0 0.0 0.0 0.0 0.0 0.0 0.0 0.0 ind 0.0 0.0 Unknown salmon 0.0 0.0 0.0 0.0 0.0 0.0 0.0 0.0 0.0 ind 0.0 0.0
Nonsalmon fish 76.2 47.6 47.6 57.1 57.1 3,140.2 116.3 42.1 3,140.2 lb 116.3 44.7 Pacific herring 23.8 9.5 9.5 19.0 9.5 200.6 7.4 2.7 33.4 gal 1.2 69.7 Pacific herring roe/unspecified
19.0 14.3 14.3 4.8 0.0 171.0 6.3 2.3 24.4 gal 0.9 59.0
Pacific herring sac roe 0.0 0.0 0.0 0.0 0.0 0.0 0.0 0.0 0.0 gal 0.0 0.0 Pacific herring spawn on kelp
4.8 4.8 4.8 0.0 0.0 180.0 6.7 2.4 25.7 gal 1.0 98.3
Eulachon (hooligan, candlefish)
0.0 0.0 0.0 0.0 0.0 0.0 0.0 0.0 0.0 gal 0.0 0.0
Unknown smelt 0.0 0.0 0.0 0.0 0.0 0.0 0.0 0.0 0.0 gal 0.0 0.0 Sea bass 0.0 0.0 0.0 0.0 0.0 0.0 0.0 0.0 0.0 ind 0.0 0.0 Pacific (gray) cod 23.8 14.3 14.3 9.5 9.5 163.4 6.1 2.2 54.1 ind 2.0 88.9 Pacific tomcod 0.0 0.0 0.0 0.0 0.0 0.0 0.0 0.0 0.0 ind 0.0 0.0 Walleye pollock (whiting)
0.0 0.0 0.0 0.0 0.0 0.0 0.0 0.0 0.0 ind 0.0 0.0
Eel 0.0 0.0 0.0 0.0 0.0 0.0 0.0 0.0 0.0 ind 0.0 0.0 Starry flounder 0.0 0.0 0.0 0.0 0.0 0.0 0.0 0.0 0.0 ind 0.0 0.0 Unknown flounder 0.0 0.0 0.0 0.0 0.0 0.0 0.0 0.0 0.0 ind 0.0 0.0 Lingcod 14.3 9.5 9.5 4.8 9.5 146.6 5.4 2.0 36.6 ind 1.4 79.3 Unknown greenling 0.0 0.0 0.0 0.0 0.0 0.0 0.0 0.0 0.0 ind 0.0 0.0 Pacific halibut 66.7 42.9 42.9 38.1 52.4 1,817.4 67.3 24.4 1,817.4 lb 67.3 41.0 Black rockfish 9.5 9.5 9.5 0.0 9.5 117.6 4.4 1.6 75.4 ind 2.8 68.6 Red rockfish 4.8 4.8 4.8 0.0 0.0 36.0 1.3 0.5 9.0 ind 0.3 98.3 Yelloweye rockfish 14.3 14.3 14.3 0.0 9.5 133.7 5.0 1.8 33.4 ind 1.2 58.5
Percentage of households Harvest weight (lb) Harvest amount
Resource
95%confidence
limit (±)harvest
-continued-
122

Use%
Attempt %
Harvest %
Receive %
Give % Total
Mean per household Per capita Total Unit
Mean per household
Unknown rockfish 9.5 4.8 4.8 4.8 9.5 26.1 1.0 0.4 10.3 ind 0.4 98.3 Sablefish (black cod) 4.8 4.8 4.8 0.0 4.8 147.9 5.5 2.0 47.9 ind 1.8 98.3 Unknown Irish lord 0.0 0.0 0.0 0.0 0.0 0.0 0.0 0.0 0.0 ind 0.0 0.0 Unknown sculpin 0.0 0.0 0.0 0.0 0.0 0.0 0.0 0.0 0.0 ind 0.0 0.0 Unknown shark 0.0 0.0 0.0 0.0 0.0 0.0 0.0 0.0 0.0 ind 0.0 0.0 Skates 0.0 0.0 0.0 0.0 0.0 0.0 0.0 0.0 0.0 ind 0.0 0.0 Unknown sole 0.0 0.0 0.0 0.0 0.0 0.0 0.0 0.0 0.0 ind 0.0 0.0 Wolffish 0.0 0.0 0.0 0.0 0.0 0.0 0.0 0.0 0.0 ind 0.0 0.0 Dolly Varden 0.0 0.0 0.0 0.0 0.0 0.0 0.0 0.0 0.0 ind 0.0 0.0 Lake trout 0.0 0.0 0.0 0.0 0.0 0.0 0.0 0.0 0.0 ind 0.0 0.0 Arctic grayling 0.0 0.0 0.0 0.0 0.0 0.0 0.0 0.0 0.0 ind 0.0 0.0 Northern pike 0.0 0.0 0.0 0.0 0.0 0.0 0.0 0.0 0.0 ind 0.0 0.0 Unknown sturgeon 0.0 0.0 0.0 0.0 0.0 0.0 0.0 0.0 0.0 ind 0.0 0.0 Cutthroat trout 0.0 0.0 0.0 0.0 0.0 0.0 0.0 0.0 0.0 ind 0.0 0.0 Rainbow trout 0.0 0.0 0.0 0.0 0.0 0.0 0.0 0.0 0.0 ind 0.0 0.0 Steelhead 0.0 0.0 0.0 0.0 0.0 0.0 0.0 0.0 0.0 ind 0.0 0.0 Unknown whitefishes 0.0 0.0 0.0 0.0 0.0 0.0 0.0 0.0 0.0 ind 0.0 0.0
Large land mammals 81.0 57.1 57.1 52.4 42.9 1,633.0 60.5 21.9 1,633.0 lb 60.5 25.3 Black bear 0.0 0.0 0.0 0.0 0.0 0.0 0.0 0.0 0.0 ind 0.0 0.0 Caribou 0.0 0.0 0.0 0.0 0.0 0.0 0.0 0.0 0.0 ind 0.0 0.0 Deer 81.0 57.1 57.1 50.0 45.0 1,633.0 60.5 21.9 37.8 ind 1.4 25.6 Mountain goat 4.8 4.8 0.0 4.8 0.0 0.0 0.0 0.0 0.0 ind 0.0 0.0 Moose 9.5 4.8 0.0 9.5 0.0 0.0 0.0 0.0 0.0 ind 0.0 0.0 Dall sheep 0.0 0.0 0.0 0.0 0.0 0.0 0.0 0.0 0.0 ind 0.0 0.0
Small land mammals 0.0 0.0 0.0 0.0 0.0 0.0 0.0 0.0 0.0 lb 0.0 0.0 Beaver 0.0 0.0 0.0 0.0 0.0 0.0 0.0 0.0 0.0 ind 0.0 0.0 Coyote 0.0 0.0 0.0 0.0 0.0 0.0 0.0 0.0 0.0 ind 0.0 0.0 Red fox 0.0 0.0 0.0 0.0 0.0 0.0 0.0 0.0 0.0 ind 0.0 0.0 Snowshoe hare 0.0 0.0 0.0 0.0 0.0 0.0 0.0 0.0 0.0 ind 0.0 0.0
Harvest amount 95%confidence
limit (±)harvest
-continued-
Resource
Percentage of households Harvest weight (lb)
Nonsalmon fish, continued
Table 3-13.–Page 2 of 6.
123

Use%
Attempt %
Harvest %
Receive %
Give % Total
Mean per household Per capita Total Unit
Mean per household
North American river (land) otter 0.0 0.0 0.0 0.0 0.0 0.0 0.0 0.0 0.0 ind 0.0 0.0
Lynx 0.0 0.0 0.0 0.0 0.0 0.0 0.0 0.0 0.0 ind 0.0 0.0 Marten 0.0 0.0 0.0 0.0 0.0 0.0 0.0 0.0 0.0 ind 0.0 0.0 Mink 0.0 0.0 0.0 0.0 0.0 0.0 0.0 0.0 0.0 ind 0.0 0.0 Muskrat 0.0 0.0 0.0 0.0 0.0 0.0 0.0 0.0 0.0 ind 0.0 0.0 Porcupine 0.0 0.0 0.0 0.0 0.0 0.0 0.0 0.0 0.0 ind 0.0 0.0 Arctic ground (parka) squirrel 0.0 0.0 0.0 0.0 0.0 0.0 0.0 0.0 0.0 ind 0.0 0.0
Red (tree) squirrel 0.0 0.0 0.0 0.0 0.0 0.0 0.0 0.0 0.0 ind 0.0 0.0 Weasel 0.0 0.0 0.0 0.0 0.0 0.0 0.0 0.0 0.0 ind 0.0 0.0 Gray wolf 0.0 0.0 0.0 0.0 0.0 0.0 0.0 0.0 0.0 ind 0.0 0.0 Wolverine 0.0 0.0 0.0 0.0 0.0 0.0 0.0 0.0 0.0 ind 0.0 0.0
Marine mammals 66.7 38.1 38.1 47.6 38.1 7,262.4 269.0 97.4 7,262.4 lb 269.0 47.7 Harbor seal 66.7 38.1 38.1 47.6 33.3 5,205.2 192.8 69.8 93.0 ind 3.4 48.7 Sea otter 0.0 0.0 0.0 0.0 0.0 0.0 0.0 0.0 0.0 ind 0.0 0.0 Steller sea lion 19.0 19.0 19.0 0.0 15.0 2,057.1 76.2 27.6 10.3 ind 0.4 54.8
Birds and eggs 52.4 33.3 33.3 23.8 23.8 385.5 14.3 5.2 385.5 lb 14.3 62.7 Bufflehead 0.0 0.0 0.0 0.0 0.0 0.0 0.0 0.0 0.0 ind 0.0 0.0 Unknown eider 0.0 0.0 0.0 0.0 0.0 0.0 0.0 0.0 0.0 ind 0.0 0.0 Goldeneye 4.8 4.8 4.8 0.0 0.0 12.3 0.5 0.2 15.4 ind 0.6 98.3 Harlequin duck 0.0 0.0 0.0 0.0 0.0 0.0 0.0 0.0 0.0 ind 0.0 0.0 Mallard 9.5 9.5 9.5 0.0 4.8 17.4 0.6 0.2 19.3 ind 0.7 80.1 Unknown merganser 0.0 0.0 0.0 0.0 0.0 0.0 0.0 0.0 0.0 ind 0.0 0.0 Long-tailed duck 0.0 0.0 0.0 0.0 0.0 0.0 0.0 0.0 0.0 ind 0.0 0.0 Northern pintail 0.0 0.0 0.0 0.0 0.0 0.0 0.0 0.0 0.0 ind 0.0 0.0 Unknown scaup 0.0 0.0 0.0 0.0 0.0 0.0 0.0 0.0 0.0 ind 0.0 0.0 Black scoter 9.5 9.5 9.5 4.8 9.5 27.8 1.0 0.4 30.9 ind 1.1 67.8 Surf scoter 0.0 0.0 0.0 0.0 0.0 0.0 0.0 0.0 0.0 ind 0.0 0.0 White-winged scoter 0.0 0.0 0.0 0.0 0.0 0.0 0.0 0.0 0.0 ind 0.0 0.0
Harvest amount 95%confidence
limit (±)harvest
-continued-
Table 3-13.–Page 3 of 6.
Resource
Percentage of households Harvest weight (lb)
Small land mammals, continued
124

Use%
Attempt %
Harvest %
Receive %
Give % Total
Mean per household Per capita Total Unit
Mean per household
Northern shoveler 0.0 0.0 0.0 0.0 0.0 0.0 0.0 0.0 0.0 ind 0.0 0.0 Unknown teal 0.0 0.0 0.0 0.0 0.0 0.0 0.0 0.0 0.0 ind 0.0 0.0 Unknown wigeon 0.0 0.0 0.0 0.0 0.0 0.0 0.0 0.0 0.0 ind 0.0 0.0 Unknown ducks 4.8 4.8 4.8 0.0 4.8 9.0 0.3 0.1 10.3 ind 0.4 98.3 Unknown Canada/cackling geese 4.8 4.8 4.8 0.0 4.8 23.1 0.9 0.3 19.3 ind 0.7 98.3
Snow goose 4.8 4.8 4.8 0.0 4.8 23.1 0.9 0.3 7.7 ind 0.3 98.3 White-fronted goose 0.0 0.0 0.0 0.0 0.0 0.0 0.0 0.0 0.0 ind 0.0 0.0 Unknown geese 4.8 4.8 4.8 0.0 4.8 13.2 0.5 0.2 7.7 ind 0.3 98.3 Sandhill crane 0.0 0.0 0.0 0.0 0.0 0.0 0.0 0.0 0.0 ind 0.0 0.0 Unknown cormorant 0.0 0.0 0.0 0.0 0.0 0.0 0.0 0.0 0.0 ind 0.0 0.0 Unknown gull 0.0 0.0 0.0 0.0 0.0 0.0 0.0 0.0 0.0 ind 0.0 0.0 Black-legged kittiwake 0.0 0.0 0.0 0.0 0.0 0.0 0.0 0.0 0.0 ind 0.0 0.0 Unknown murre 0.0 0.0 0.0 0.0 0.0 0.0 0.0 0.0 0.0 ind 0.0 0.0 Unknown puffin 0.0 0.0 0.0 0.0 0.0 0.0 0.0 0.0 0.0 ind 0.0 0.0 Unknown grouse 4.8 4.8 4.8 0.0 4.8 18.0 0.7 0.2 25.7 ind 1.0 98.3 Unknown duck eggs 0.0 0.0 0.0 0.0 0.0 0.0 0.0 0.0 0.0 ind 0.0 0.0 Unknown goose eggs 4.8 4.8 4.8 0.0 0.0 13.9 0.5 0.2 46.3 ind 1.7 98.3 Black oystercatcher eggs 0.0 0.0 0.0 0.0 0.0 0.0 0.0 0.0 0.0 ind 0.0 0.0 Unknown gull eggs 47.6 28.6 28.6 19.0 19.0 225.6 8.4 3.0 752.1 ind 27.9 57.0 Unknown tern eggs 4.8 4.8 4.8 0.0 4.8 1.9 0.1 0.0 38.6 ind 1.4 98.3 Unknown eggs 0.0 0.0 0.0 0.0 0.0 0.0 0.0 0.0 0.0 ind 0.0 0.0
Marine invertebrates 38.1 23.8 19.0 23.8 14.3 1,291.6 47.8 17.3 1,291.6 lb 47.8 80.6 Red (large) chitons 0.0 0.0 0.0 0.0 0.0 0.0 0.0 0.0 0.0 gal 0.0 0.0 Black (small) chitons 14.3 9.5 9.5 4.8 9.5 30.9 1.1 0.4 7.7 gal 0.3 82.8 Butter clams 9.5 9.5 9.5 0.0 0.0 16.2 0.6 0.2 5.4 gal 0.2 74.3 Horse clams 0.0 0.0 0.0 0.0 0.0 0.0 0.0 0.0 0.0 gal 0.0 0.0 Pacific littleneck clams (steamers) 0.0 0.0 0.0 0.0 0.0 0.0 0.0 0.0 0.0 gal 0.0 0.0
Pinkneck clams 0.0 0.0 0.0 0.0 0.0 0.0 0.0 0.0 0.0 gal 0.0 0.0-continued-
Harvest amount 95%confidence
limit (±)harvest
Table 3-13.–Page 4 of 6.
Resource
Percentage of households Harvest weight (lb)
Birds and eggs, continued
125

Use%
Attempt %
Harvest %
Receive %
Give % Total
Mean per household Per capita Total Unit
Mean per household
Razor clams 0.0 0.0 0.0 0.0 0.0 0.0 0.0 0.0 0.0 gal 0.0 0.0 Unknown clams 0.0 0.0 0.0 0.0 0.0 0.0 0.0 0.0 0.0 gal 0.0 0.0 Unknown cockles 9.5 14.3 9.5 0.0 0.0 15.4 0.6 0.2 5.1 gal 0.2 76.6 Dungeness crab 0.0 0.0 0.0 0.0 0.0 0.0 0.0 0.0 0.0 ind 0.0 0.0 Unknown king crab 0.0 0.0 0.0 0.0 0.0 0.0 0.0 0.0 0.0 ind 0.0 0.0 Tanner crab, bairdi 0.0 0.0 0.0 0.0 0.0 0.0 0.0 0.0 0.0 ind 0.0 0.0 Unknown tanner crab 0.0 0.0 0.0 0.0 0.0 0.0 0.0 0.0 0.0 ind 0.0 0.0 Unknown crab 0.0 0.0 0.0 0.0 0.0 0.0 0.0 0.0 0.0 ind 0.0 0.0 Limpets 0.0 0.0 0.0 0.0 0.0 0.0 0.0 0.0 0.0 gal 0.0 0.0 Unknown mussels 0.0 0.0 0.0 0.0 0.0 0.0 0.0 0.0 0.0 gal 0.0 0.0 Octopus 38.1 19.0 19.0 23.8 14.3 1,229.1 45.5 16.5 307.3 ind 11.4 82.2 Weathervane scallops 0.0 0.0 0.0 0.0 0.0 0.0 0.0 0.0 0.0 gal 0.0 0.0 Unknown sea cucumber 0.0 0.0 0.0 0.0 0.0 0.0 0.0 0.0 0.0 gal 0.0 0.0 Unknown sea urchin 0.0 0.0 0.0 0.0 0.0 0.0 0.0 0.0 0.0 gal 0.0 0.0 Shrimp 0.0 0.0 0.0 0.0 0.0 0.0 0.0 0.0 0.0 lb 0.0 0.0 Snails 0.0 0.0 0.0 0.0 0.0 0.0 0.0 0.0 0.0 gal 0.0 0.0 Whelk 0.0 0.0 0.0 0.0 0.0 0.0 0.0 0.0 0.0 gal 0.0 0.0
Vegetation 81.0 76.2 71.4 28.6 38.1 592.9 22.0 8.0 592.9 lb 22.0 33.4 Blueberry 61.9 57.1 57.1 14.3 19.0 210.6 7.8 2.8 52.7 gal 2.0 37.9 Lowbush cranberry 4.8 4.8 4.8 0.0 0.0 10.3 0.4 0.1 2.6 gal 0.1 98.3 Highbush cranberry 19.0 19.0 19.0 0.0 4.8 54.0 2.0 0.7 13.5 gal 0.5 55.1 Gooseberry 0.0 0.0 0.0 0.0 0.0 0.0 0.0 0.0 0.0 gal 0.0 0.0 Nagoonberry 4.8 4.8 4.8 0.0 0.0 0.3 0.0 0.0 0.1 gal 0.0 98.3 Raspberry 4.8 4.8 4.8 0.0 0.0 15.4 0.6 0.2 3.9 gal 0.1 98.3 Salmonberry 76.2 71.4 71.4 14.3 14.3 237.9 8.8 3.2 59.5 gal 2.2 42.8 Strawberry 0.0 0.0 0.0 0.0 0.0 0.0 0.0 0.0 0.0 gal 0.0 0.0 Other wild berry 0.0 0.0 0.0 0.0 0.0 0.0 0.0 0.0 0.0 gal 0.0 0.0 Beach asparagus 0.0 0.0 0.0 0.0 0.0 0.0 0.0 0.0 0.0 gal 0.0 0.0 Other beach greens 4.8 4.8 4.8 0.0 0.0 32.1 1.2 0.4 32.1 gal 1.2 98.3 Devil's club 0.0 0.0 0.0 0.0 0.0 0.0 0.0 0.0 0.0 gal 0.0 0.0
Marine invertebrates, continued
-continued-
Table 3-13.–Page 5 of 6.
Resource
Percentage of households Harvest weight (lb) Harvest amount 95%confidence
limit (±)harvest
126
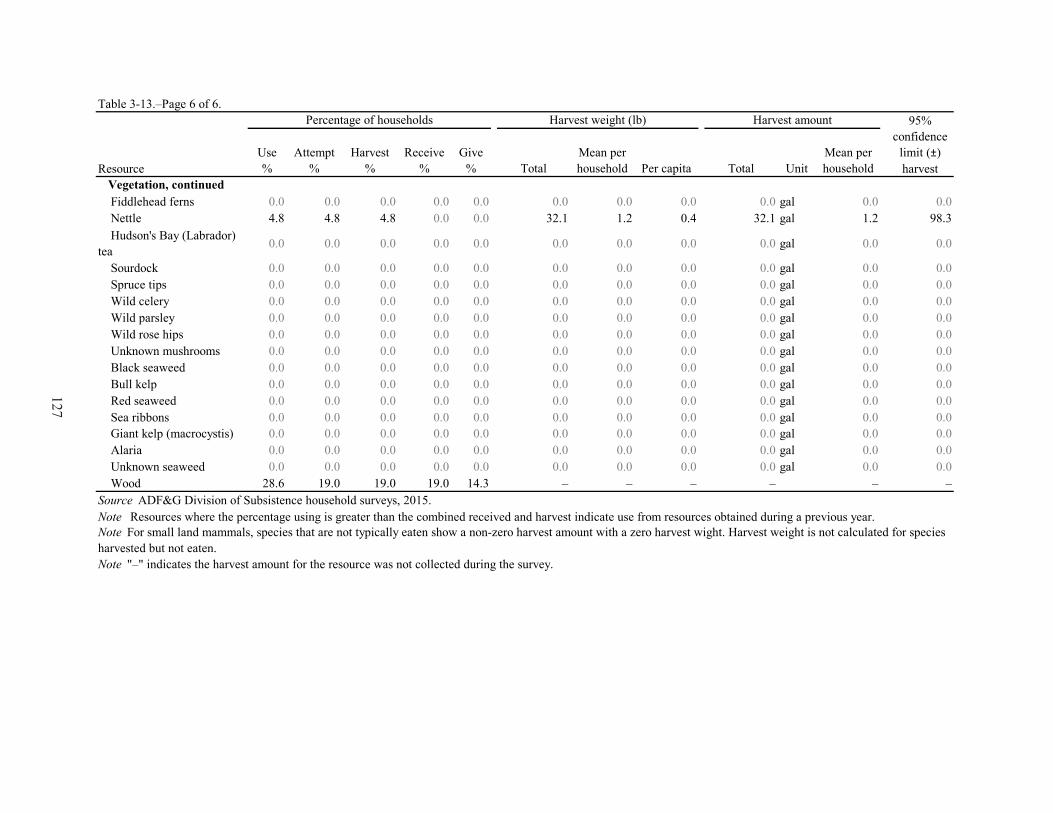
Use%
Attempt %
Harvest %
Receive %
Give % Total
Mean per household Per capita Total Unit
Mean per household
Vegetation, continued Fiddlehead ferns 0.0 0.0 0.0 0.0 0.0 0.0 0.0 0.0 0.0 gal 0.0 0.0 Nettle 4.8 4.8 4.8 0.0 0.0 32.1 1.2 0.4 32.1 gal 1.2 98.3 Hudson's Bay (Labrador) tea 0.0 0.0 0.0 0.0 0.0 0.0 0.0 0.0 0.0 gal 0.0 0.0
Sourdock 0.0 0.0 0.0 0.0 0.0 0.0 0.0 0.0 0.0 gal 0.0 0.0 Spruce tips 0.0 0.0 0.0 0.0 0.0 0.0 0.0 0.0 0.0 gal 0.0 0.0 Wild celery 0.0 0.0 0.0 0.0 0.0 0.0 0.0 0.0 0.0 gal 0.0 0.0 Wild parsley 0.0 0.0 0.0 0.0 0.0 0.0 0.0 0.0 0.0 gal 0.0 0.0 Wild rose hips 0.0 0.0 0.0 0.0 0.0 0.0 0.0 0.0 0.0 gal 0.0 0.0 Unknown mushrooms 0.0 0.0 0.0 0.0 0.0 0.0 0.0 0.0 0.0 gal 0.0 0.0 Black seaweed 0.0 0.0 0.0 0.0 0.0 0.0 0.0 0.0 0.0 gal 0.0 0.0 Bull kelp 0.0 0.0 0.0 0.0 0.0 0.0 0.0 0.0 0.0 gal 0.0 0.0 Red seaweed 0.0 0.0 0.0 0.0 0.0 0.0 0.0 0.0 0.0 gal 0.0 0.0 Sea ribbons 0.0 0.0 0.0 0.0 0.0 0.0 0.0 0.0 0.0 gal 0.0 0.0 Giant kelp (macrocystis) 0.0 0.0 0.0 0.0 0.0 0.0 0.0 0.0 0.0 gal 0.0 0.0 Alaria 0.0 0.0 0.0 0.0 0.0 0.0 0.0 0.0 0.0 gal 0.0 0.0 Unknown seaweed 0.0 0.0 0.0 0.0 0.0 0.0 0.0 0.0 0.0 gal 0.0 0.0 Wood 28.6 19.0 19.0 19.0 14.3 – – – – – –
Note "–" indicates the harvest amount for the resource was not collected during the survey.
Table 3-13.–Page 6 of 6.
Resource
Percentage of households Harvest weight (lb) Harvest amount 95%confidence
limit (±)harvest
Source ADF&G Division of Subsistence household surveys, 2015.Note Resources where the percentage using is greater than the combined received and harvest indicate use from resources obtained during a previous year.Note For small land mammals, species that are not typically eaten show a non-zero harvest amount with a zero harvest wight. Harvest weight is not calculated for species harvested but not eaten.
127

Figure 3-8.–Composition of harvest by resource category in pounds usable weight, Tatitlek, 2014.
Salmon35%
Nonsalmon fish14%
Large land mammals7%
Marine mammals33%
Birds and eggs2%
Marine invertebrates6%
Vegetation3%
Note Categories having 0 lb of usable weight are not included.
point that community members went to while attempting to gather and harvest fish, game, and vegetation resources during the study year was to Wells Passage—in between Esther Island and Culross Island. Tatitlek residents also reported traveling east to the Copper River Delta flats in the Gulf of Alaska in search of wild resources during the study year (Figure 3-9).
uSe and harveSt characteriSticS By reSource category
All Tatitlek households used and attempted to harvest wild resources in 2014, and 100% of households were successful at harvesting at least 1 resource. Table 3-13 also reports the sharing of each resource by percentage of households receiving each resource and the percentage of households giving away each resource. Considering all resources combined, sharing appears to have been an important activity for Tatitlek residents; 81% of Tatitlek households received at least 1 wild resource in 2014, and 76% of households gave away at least 1 resource.Salmon was the resource category most frequently received by Tatitlek households in 2014 (Table 3-13). An estimated 71% of community households received salmon in 2014; this was followed by receipt of nonsalmon fish (57%), large land mammals (52%), and the receipt of marine mammals (48%). Smaller percentages of Tatitlek households received vegetation (29%), birds and eggs (24%), and marine invertebrates (24%).Nonsalmon fish and salmon were the resource categories most frequently given away by households (57% of households gave away nonsalmon fish, and 52% gave away salmon). Approximately 43% of households gave away large land mammals, and 38% gave away marine mammals and vegetation. Smaller percentages of households gave away birds and eggs (24%), and marine invertebrates (14%).Table 3-14 lists the top ranked resources used by households and Figure 3-10 shows the species with the highest harvest during the 2014 study year. Sockeye salmon were used by 86% of households in the community. The rate of use of sockeye salmon was followed closely by use of deer (81% of households) and salmonberries (76%). Coho salmon, Pacific halibut, and harbor seals were each used by 67% of Tatitlek
128

Figure 3-9.–Wild resource search and harvest areas, Tatitlek, 2014.
!
!
!
!
!
!
!
G u l f o f A l a s k a
Mon
tagu
e Islan
d
Hinchinbroo
k Island
KnightIsland
P r i n c e W i l l i a m
S o u n d
Port Valdez
Port
Wel
ls
PerryIsland
Culross
Island
EstherIsland
Wells Passage
Copper
RiverDelta
Chenega (Old Site)
Chenega Bay
Cordova
Tatitlek
Valdez
Whittier
0 2010Miles
This map depicts areas used forresource harvesting in 2014 by 21surveyed households in Tatitlek,Alaska. The total survey sampleincludes 21 of 27 households in
Tatitlek (78%), so this map is a partialrepresentation of areas used for
resource harvests in 2014. Resourceharvest areas change over time, so
areas not used in 2014 might be used inother years.
Source:Alaska Department of Fish and Game(ADF&G) Division of Subsistence,
2015.North American Datum 1927.
Alaska Albers Projection.
Map created by: Terri Lemons
EVOS 2014
TatitlekAll resources search and harvest areas
1:1,250,000SCALE:
144°W
146°W
146°W
148°W
148°W
61°N
60°N
129
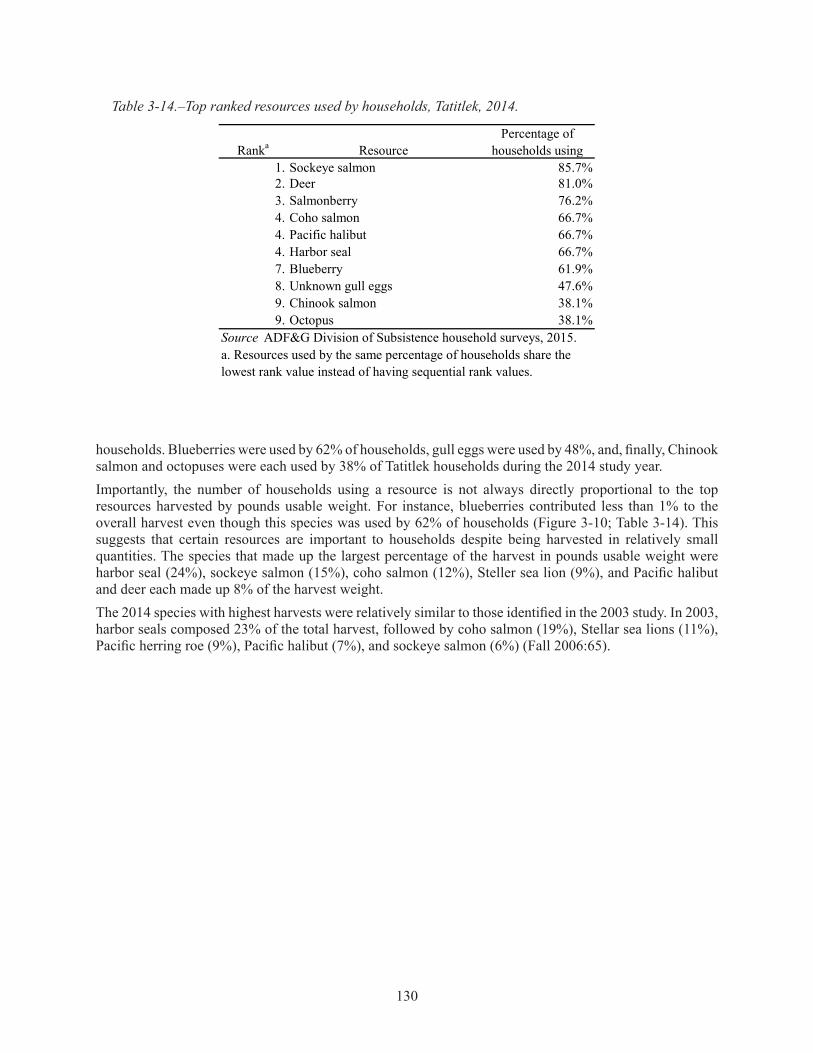
Table 3-14.–Top ranked resources used by households, Tatitlek, 2014.
Ranka ResourcePercentage of
households using1. Sockeye salmon 85.7%2. Deer 81.0%3. Salmonberry 76.2%4. Coho salmon 66.7%4. Pacific halibut 66.7%4. Harbor seal 66.7%7. Blueberry 61.9%8. Unknown gull eggs 47.6%9. Chinook salmon 38.1%9. Octopus 38.1%
a. Resources used by the same percentage of households share the lowest rank value instead of having sequential rank values.
Source ADF&G Division of Subsistence household surveys, 2015.
households. Blueberries were used by 62% of households, gull eggs were used by 48%, and, finally, Chinook salmon and octopuses were each used by 38% of Tatitlek households during the 2014 study year.Importantly, the number of households using a resource is not always directly proportional to the top resources harvested by pounds usable weight. For instance, blueberries contributed less than 1% to the overall harvest even though this species was used by 62% of households (Figure 3-10; Table 3-14). This suggests that certain resources are important to households despite being harvested in relatively small quantities. The species that made up the largest percentage of the harvest in pounds usable weight were harbor seal (24%), sockeye salmon (15%), coho salmon (12%), Steller sea lion (9%), and Pacific halibut and deer each made up 8% of the harvest weight.The 2014 species with highest harvests were relatively similar to those identified in the 2003 study. In 2003, harbor seals composed 23% of the total harvest, followed by coho salmon (19%), Stellar sea lions (11%), Pacific herring roe (9%), Pacific halibut (7%), and sockeye salmon (6%) (Fall 2006:65).
130

Figure 3-10.–Top species harvested by percentage of total harvest in pounds usable weight, Tatitlek, 2014.
Harbor seal24%
Sockeye salmon15%
Coho salmon12%
Steller sea lion9%
Pacific halibut8% Deer
8%
Octopus6%
Chum salmon3%
Chinook salmon3%
Pink salmon1%
All other resources11%
Note The "all other resources" category represents all species that contributed 1% or less to the total harvest.
131

Figure 3-11.–Composition of salmon harvest in pounds usable weight, Tatitlek, 2014.
Chum salmon9%
Coho salmon35%
Chinook salmon8%
Pink salmon4%
Sockeye salmon44%
SalmonIn 2014, salmon was the most harvested resource category and the community of Tatitlek harvested a total of 7,584 lb of salmon, or 102 lb per capita (Table 3-13). Of the total salmon harvest, 44% was sockeye salmon, followed by coho salmon (35%), chum salmon (9%), Chinook salmon (8%), and pink salmon made up the remaining 4% of the total harvest of salmon (Figure 3-11). Almost all (91%) of Tatitlek households used salmon during the study year.In 2014, sockeye salmon was the most harvested species of salmon caught by Tatitlek residents, and 86% of households used sockeye salmon during the study year; 48% of households fished for sockeye salmon, and all harvest efforts were successful during the study year (Table 3-13). In 2014, Tatitlek residents harvested 3,295 lb of sockeye salmon, or 44 lb per capita.Coho salmon were used by 67% of Tatitlek households in 2014 (Table 3-13). Fifty-seven percent of households attempted to harvest coho salmon, and 52% of all Tatitlek households successfully harvested this resource. The total coho salmon harvest in 2014 was 2,687 lb, or 36 lb per capita.Chum salmon were used by 14% of Tatitlek households in 2014, and 10% of households harvested chum salmon during the study year (Table 3-13). Chinook salmon were used by 38% of Tatitlek households in 2014, and 24% of households attempted to harvest this species; of those 24%, all were successful in harvesting Chinook salmon. During the study year, 19% of households attempted to harvest pink salmon and 14% of households in Tatitlek were successful.In respect to the harvest and use of specific salmon species, the 2014 results vary from previous patterns from division surveys. All past survey results (except for the 1987–1989 study years and 2003) indicate a higher harvest and use of coho salmon than sockeye salmon (CSIS). Historically, sockeye salmon were not abundant in the marine waters used by Tatitlek residents (Stratton 1990:38). Some Tatitlek residents noted that they believed many salmon runs have rebounded because of enhancement projects, but the natural runs remain lower than they were before the oil spill. In addition to more sockeye salmon being introduced through enhancement projects, some Tatitlek residents believe that environmental changes caused by the oil spill and the 1964 earthquake may be contributing factors to the new trend of increased harvest and use
132

of sockeye salmon. Other survey respondents explained that the salmon run varies each season and 2014 was “just a good year for sockeye.”Sharing of salmon was common in this community in 2014; all 5 species of salmon were received and given away. Seventy-one percent of households received sockeye salmon, and 43% gave this resource away. Coho salmon were received by 43% of households and 33% gave coho salmon resources away. Chinook salmon were given away by 24% of households, and 24% of households received this resource (Table 3-13).According to survey results, the majority of the salmon harvest in Tatitlek during the study year was caught using subsistence methods (Table 3-15). In 2014, Tatitlek households were issued 2 subsistence salmon fishing permits, both of which were returned (ASFDB2 accessed November 2015). The reported total salmon harvested in the Copper River District subsistence salmon fisheries by Tatitlek residents in 2014 was 30 salmon, the majority of which were sockeye salmon (23 sockeye salmon) and the remaining 7 harvested fish were Chinook salmon (ASFDB). The 2014 survey found a smaller portion of the salmon harvest was removed from commercial catches for home consumption (Table 3-15). According to the Alaska Commercial Fisheries Entry Commission, the number of commercial fishing permits held by Tatitlek residents has decreased since 2000. In 2000, there were 4 Tatitlek community members who held commercial fishing permits and 3 permit holders for 2003 through 2007, and then it dropped to 2 Tatitlek residents holding commercial fishing permits. In 2010, only 1 Tatitlek resident held a permit.3 According to community members, during the 2014 study year no Tatitlek residents had a commercial fishing permit, but several residents were crew members.As estimated in harvested pounds of salmon, 72% of the salmon harvest was caught using subsistence setnets (Table 3-15). The majority (83%) of the sockeye salmon harvest was caught using set gillnets; the remaining 17% of the harvest was removed from commercial catches or caught by another subsistence gear type (less than 1%). More than one-half (54%) of the coho salmon harvest weight was caught using set gillnets, and the remaining coho salmon harvest was either harvested using rod and reel (40%), removed from commercial catches (6%), or caught by another subsistence gear type (less than 1%). The majority of chum salmon were harvested using set gillnets (79% of harvest weight), and the remaining 21% of the harvest was removed from commercial catches. Almost all Chinook salmon were harvested using set gillnets (92% of harvest weight), the remaining 8% of the harvest was removed from commercial catches.In the 2014 study year, salmon search and harvest areas were all within Prince William Sound or the northern portion of the Gulf of Alaska along the coastline between Cordova and the Copper River Delta. Community members traveled up to 60 miles from Tatitlek in search of salmon. Many residents reported placing an emphasis on searching for this resource category in the marine waters surrounding Glacier Island. The furthest south Tatitlek residents traveled to harvest salmon in 2014 was Snug Harbor, located offshore Knight Island. To the west, community members traveled for salmon as far as Wells Passage between Esther Island and Culross Island (Figure 3-12).
2. Subsistence fishing permit information is available in the Alaska Subsistence Fisheries Database (ASFDB). Data in ASFDB are accessed through an ADF&G intranet website.3. Alaska Commercial Fisheries Entry Commission, “Permit Holder & Crew Member Counts by Census Area & City of Res-idence: 2000 and 2002–2010,” data for 2014 were not available. https://www.cfec.state.ak.us/fishery_statistics/permits.htm (accessed November 25, 2015).
133

Table 3-15.–Estimated percentages of salmon harvested by gear type, resource, and total salmon harvest, Tatitlek, 2014.
Setnet Seine Driftnet OtherSubsistence
gear, any methodPounds Pounds Pounds Pounds Pounds Pounds Pounds Pounds
Salmon Gear type 100.0% 100.0% 0.0% 0.0% 100.0% 100.0% 100.0% 100.0%Resource 12.9% 72.4% 0.0% 0.0% 0.2% 72.6% 14.5% 100.0%Total 12.9% 72.4% 0.0% 0.0% 0.2% 72.6% 14.5% 100.0%
Chum salmon Gear type 14.8% 9.9% 0.0% 0.0% 0.0% 9.9% 0.0% 9.1%Resource 21.1% 78.9% 0.0% 0.0% 0.0% 78.9% 0.0% 100.0%Total 1.9% 7.2% 0.0% 0.0% 0.0% 7.2% 0.0% 9.1%
Coho salmon Gear type 15.9% 26.5% 0.0% 0.0% 58.0% 26.6% 97.1% 35.4%Resource 5.8% 54.2% 0.0% 0.0% 0.3% 54.5% 39.7% 100.0%Total 2.1% 19.2% 0.0% 0.0% 0.1% 19.3% 14.1% 35.4%
Chinook salmon Gear type 5.0% 10.4% 0.0% 0.0% 0.0% 10.4% 0.0% 8.2%Resource 7.9% 92.1% 0.0% 0.0% 0.0% 92.1% 0.0% 100.0%Total 0.6% 7.6% 0.0% 0.0% 0.0% 7.6% 0.0% 8.2%
Pink salmon Gear type 6.5% 3.6% 0.0% 0.0% 0.0% 3.6% 2.9% 3.8%Resource 21.7% 67.4% 0.0% 0.0% 0.0% 67.4% 10.9% 100.0%Total 0.8% 2.6% 0.0% 0.0% 0.0% 2.6% 0.4% 3.8%
Sockeye salmon Gear type 57.7% 49.6% 0.0% 0.0% 42.0% 49.6% 0.0% 43.4%Resource 17.1% 82.7% 0.0% 0.0% 0.2% 82.9% 0.0% 100.0%Total 7.4% 35.9% 0.0% 0.0% 0.1% 36.0% 0.0% 43.4%
Landlocked salmon Gear type 0.0% 0.0% 0.0% 0.0% 0.0% 0.0% 0.0% 0.0%Resource 0.0% 0.0% 0.0% 0.0% 0.0% 0.0% 0.0% 0.0%Total 0.0% 0.0% 0.0% 0.0% 0.0% 0.0% 0.0% 0.0%
Unknown salmon Gear type 0.0% 0.0% 0.0% 0.0% 0.0% 0.0% 0.0% 0.0%Resource 0.0% 0.0% 0.0% 0.0% 0.0% 0.0% 0.0% 0.0%Total 0.0% 0.0% 0.0% 0.0% 0.0% 0.0% 0.0% 0.0%
ResourcePercentage base
Removed from commercial
catch
Subsistence methodsRod and
reelAny
method
Source ADF&G Division of Subsistence household surveys, 2015.
134

Figure 3-12.–Fishing and harvest locations of chum, coho, Chinook, pink, and sockeye salmon, Tatitlek, 2014.
!
!
!
!
!
G u l f o f A l a s k a
Mon
tagu
e Islan
d
Hinch
inbrook Isla
nd
KnightIsland
P r i n c e W i l l i a m
S o u n d
Port Valdez
CulrossIsland
Wells Passage
Esther
Island
Glacier
Snug
Harbo
rIsland
Valdez
Cordova
Tatitlek
Chenega Bay
Chenega (Old Site)
0 105Miles
This map depicts areas used forresource harvesting in 2014 by 13surveyed households in Tatitlek,Alaska. The total survey sampleincludes 21 of 27 households in
Tatitlek (78%), so this map is a partialrepresentation of areas used for
resource harvests in 2014. Resourceharvest areas change over time, so
areas not used in 2014 might be used inother years.
Source:Alaska Department of Fish and Game(ADF&G) Division of Subsistence,
2015.North American Datum 1927.
Alaska Albers Projection.
Map created by: Terri Lemons
EVOS 2014
Tatitlek
Salmon search and harvest areas
1:850,000SCALE:
146°W
146°W
148°W
148°W
61°N
60°N
CopperRiver Delta
135

Figure 3-13.–Composition of nonsalmon fish harvest in pounds usable weight, Tatitlek, 2014.
Pacific herring6%
Pacific herring roe/unspecified
5%Pacific herring spawn on kelp
6%Pacific (gray) cod
5%
Lingcod5%
Pacific halibut58%
Black rockfish4%
Yelloweye rockfish4%
Sablefish (black cod)5%
Other2%
Note The "other" category includes species each providing1% or less to the total nonsalmon fish harvest.
Nonsalmon FishNonsalmon fish was the third most harvested resource category, making up 14% of the overall harvest of wild resources for the community of Tatitlek in 2014 (Figure 3-8). A total of approximately 3,140 lb of nonsalmon fish were harvested in Tatitlek during the study year, equating to a per capita harvest of 42 lb (Table 3-13). A large percentage (76%) of Tatitlek households used at least 1 species of nonsalmon fish during the 2014 study year. The nonsalmon fish harvest includes a variety of species, but Pacific halibut composed the majority (58%) of the nonsalmon fish harvest (Figure 3-13). Pacific halibut were used by 67% of Tatitlek households in 2014 (Table 3-13). Forty-three percent of households attempted to harvest Pacific halibut, and all Tatitlek households that fished successfully harvested this resource. Several Tatitlek households expressed concern about overfishing of Pacific halibut within Prince William Sound by sport charters departing from Valdez. The total halibut harvest in 2014 was 1,817 lb, or 24 lb per capita. The 2014 Pacific halibut harvest was similar to the 2003 harvest of 1,389 lb (19 lb per capita) (CSIS). Both the 2003 and the 2014 study years represented an increase in the amount of Pacific halibut harvested compared to the 1990 and 1989 study years (882 lb total and 7 lb per capita; 1,355 lb total and 12 lb per capita, respectively). From 1989–1991, the average Pacific halibut harvest was 1,598 lb (CSIS).The Division of Subsistence distributes mail-out Pacific halibut harvest surveys to holders of Subsistence Halibut Registration Certificates, or SHARCs, and annually estimates the total Pacific halibut harvest weight based on reported harvests of returned surveys (Fall and Lemons 2016).4 According to Pacific halibut harvest information collected through the surveys, during 2003–2014, Tatitlek Pacific halibut harvests peaked in 2007 when a total of 12,782 lb of Pacific halibut were harvested (Table 1-8). Following 2007, the estimated total harvest of Pacific halibut by Tatitlek households declined based on reported harvests collected by the
4. Pacific halibut harvest estimates based on SHARC survey results may differ from harvest estimates based on household com-prehensive subsistence surveys due to different data collection methods. The SHARC estimates only include those individuals who have registered with the National Marine Fisheries Service, and does not include harvests removed from commercial catch-es. The SHARC estimates are based on the mailing addresses of SHARC holders, some of whom might be seasonal residents of the community. The household survey is based on a sample of all households in each community, and includes harvests for home use from the subsistence and sport fisheries as well as fish retained from respondents’ commercial harvests for home use or sharing.
136

Table 3-16.–Estimated percentages of nonsalmon fish harvested by gear type, resource, and total nonsalmon fish harvest, Tatitlek, 2014.
Setnet Seine Driftnet Other
Subsistence gear, any method
Unitsa Pounds Pounds Pounds Pounds Pounds Pounds Pounds PoundsNonsalmon fish Gear type 100.0% 100.0% 0.0% 0.0% 100.0% 100.0% 100.0% 100.0%
lb Resource 22.8% 3.9% 0.0% 0.0% 67.7% 71.6% 5.6% 100.0%Total 22.8% 3.9% 0.0% 0.0% 67.7% 71.6% 5.6% 100.0%
Pacific herring Gear type 10.8% 100.0% 0.0% 0.0% 0.0% 5.5% 0.0% 6.4%gal Resource 38.5% 61.5% 0.0% 0.0% 0.0% 61.5% 0.0% 100.0%
Total 2.5% 3.9% 0.0% 0.0% 0.0% 3.9% 0.0% 6.4%Gear type 0.0% 0.0% 0.0% 0.0% 8.0% 7.6% 0.0% 5.4%
gal Resource 0.0% 0.0% 0.0% 0.0% 100.0% 100.0% 0.0% 100.0%Total 0.0% 0.0% 0.0% 0.0% 5.4% 5.4% 0.0% 5.4%Gear type 0.0% 0.0% 0.0% 0.0% 0.0% 0.0% 0.0% 0.0%
gal Resource 0.0% 0.0% 0.0% 0.0% 0.0% 0.0% 0.0% 0.0%Total 0.0% 0.0% 0.0% 0.0% 0.0% 0.0% 0.0% 0.0%Gear type 25.2% 0.0% 0.0% 0.0% 0.0% 0.0% 0.0% 5.7%
gal Resource 100.0% 0.0% 0.0% 0.0% 0.0% 0.0% 0.0% 100.0%Total 5.7% 0.0% 0.0% 0.0% 0.0% 0.0% 0.0% 5.7%Gear type 0.0% 0.0% 0.0% 0.0% 0.0% 0.0% 0.0% 0.0%
gal Resource 0.0% 0.0% 0.0% 0.0% 0.0% 0.0% 0.0% 0.0%Total 0.0% 0.0% 0.0% 0.0% 0.0% 0.0% 0.0% 0.0%
Unknown smelt Gear type 0.0% 0.0% 0.0% 0.0% 0.0% 0.0% 0.0% 0.0%gal Resource 0.0% 0.0% 0.0% 0.0% 0.0% 0.0% 0.0% 0.0%
Total 0.0% 0.0% 0.0% 0.0% 0.0% 0.0% 0.0% 0.0%Sea bass Gear type 0.0% 0.0% 0.0% 0.0% 0.0% 0.0% 0.0% 0.0%
ind Resource 0.0% 0.0% 0.0% 0.0% 0.0% 0.0% 0.0% 0.0%Total 0.0% 0.0% 0.0% 0.0% 0.0% 0.0% 0.0% 0.0%
Pacific (gray) cod Gear type 2.7% 0.0% 0.0% 0.0% 6.8% 6.4% 0.0% 5.2%ind Resource 11.8% 0.0% 0.0% 0.0% 88.2% 88.2% 0.0% 100.0%
Total 0.6% 0.0% 0.0% 0.0% 4.6% 4.6% 0.0% 5.2%Pacific tomcod Gear type 0.0% 0.0% 0.0% 0.0% 0.0% 0.0% 0.0% 0.0%
ind Resource 0.0% 0.0% 0.0% 0.0% 0.0% 0.0% 0.0% 0.0%Total 0.0% 0.0% 0.0% 0.0% 0.0% 0.0% 0.0% 0.0%
Any method
Pacific herring roe/unspecified
Pacific herring spawn on kelp
Eulachon (hooligan, candlefish)
ResourcePercentage base
Removed from commercial
catch
Subsistence methods
Rod and reel
–continued–
Pacific herring sac roe137

Setnet Seine Driftnet Other
Subsistence gear, any method
Unitsa Pounds Pounds Pounds Pounds Pounds Pounds Pounds PoundsGear type 0.0% 0.0% 0.0% 0.0% 0.0% 0.0% 0.0% 0.0%
ind Resource 0.0% 0.0% 0.0% 0.0% 0.0% 0.0% 0.0% 0.0%Total 0.0% 0.0% 0.0% 0.0% 0.0% 0.0% 0.0% 0.0%
Eel Gear type 0.0% 0.0% 0.0% 0.0% 0.0% 0.0% 0.0% 0.0%ind Resource 0.0% 0.0% 0.0% 0.0% 0.0% 0.0% 0.0% 0.0%
Total 0.0% 0.0% 0.0% 0.0% 0.0% 0.0% 0.0% 0.0%Starry flounder Gear type 0.0% 0.0% 0.0% 0.0% 0.0% 0.0% 0.0% 0.0%
ind Resource 0.0% 0.0% 0.0% 0.0% 0.0% 0.0% 0.0% 0.0%Total 0.0% 0.0% 0.0% 0.0% 0.0% 0.0% 0.0% 0.0%
Unknown flounder Gear type 0.0% 0.0% 0.0% 0.0% 0.0% 0.0% 0.0% 0.0%ind Resource 0.0% 0.0% 0.0% 0.0% 0.0% 0.0% 0.0% 0.0%
Total 0.0% 0.0% 0.0% 0.0% 0.0% 0.0% 0.0% 0.0%Lingcod Gear type 7.2% 0.0% 0.0% 0.0% 3.0% 2.9% 17.4% 4.7%
ind Resource 35.1% 0.0% 0.0% 0.0% 43.9% 43.9% 21.1% 100.0%Total 1.6% 0.0% 0.0% 0.0% 2.0% 2.0% 1.0% 4.7%
Unknown greenling Gear type 0.0% 0.0% 0.0% 0.0% 0.0% 0.0% 0.0% 0.0%ind Resource 0.0% 0.0% 0.0% 0.0% 0.0% 0.0% 0.0% 0.0%
Total 0.0% 0.0% 0.0% 0.0% 0.0% 0.0% 0.0% 0.0%Pacific halibut Gear type 38.8% 0.0% 0.0% 0.0% 66.8% 63.1% 67.9% 57.9%
lb Resource 15.3% 0.0% 0.0% 0.0% 78.1% 78.1% 6.6% 100.0%Total 8.8% 0.0% 0.0% 0.0% 45.2% 45.2% 3.8% 57.9%
Black rockfish Gear type 2.5% 0.0% 0.0% 0.0% 4.7% 4.4% 0.0% 3.7%ind Resource 15.3% 0.0% 0.0% 0.0% 84.7% 84.7% 0.0% 100.0%
Total 0.6% 0.0% 0.0% 0.0% 3.2% 3.2% 0.0% 3.7%Red rockfish Gear type 5.0% 0.0% 0.0% 0.0% 0.0% 0.0% 0.0% 1.1%
ind Resource 100.0% 0.0% 0.0% 0.0% 0.0% 0.0% 0.0% 100.0%Total 1.1% 0.0% 0.0% 0.0% 0.0% 0.0% 0.0% 1.1%
Walleye pollock (whiting)
Table 3-16.–Page 2 of 4.
ResourcePercentage base
Removed from commercial
catch
Subsistence methods
Rod and reel
Any method
–continued–
138

Setnet Seine Driftnet Other
Subsistence gear, any method
Unitsa Pounds Pounds Pounds Pounds Pounds Pounds Pounds PoundsYelloweye rockfish Gear type 5.0% 0.0% 0.0% 0.0% 4.6% 4.3% 0.0% 4.3%
ind Resource 26.9% 0.0% 0.0% 0.0% 73.1% 73.1% 0.0% 100.0%Total 1.1% 0.0% 0.0% 0.0% 3.1% 3.1% 0.0% 4.3%
Unknown rockfish Gear type 0.0% 0.0% 0.0% 0.0% 0.0% 0.0% 14.7% 0.8%ind Resource 0.0% 0.0% 0.0% 0.0% 0.0% 0.0% 100.0% 100.0%
Total 0.0% 0.0% 0.0% 0.0% 0.0% 0.0% 0.8% 0.8%Sablefish (black cod) Gear type 2.7% 0.0% 0.0% 0.0% 6.1% 5.7% 0.0% 4.7%
ind Resource 13.0% 0.0% 0.0% 0.0% 87.0% 87.0% 0.0% 100.0%Total 0.6% 0.0% 0.0% 0.0% 4.1% 4.1% 0.0% 4.7%
Unknown Irish lord Gear type 0.0% 0.0% 0.0% 0.0% 0.0% 0.0% 0.0% 0.0%ind Resource 0.0% 0.0% 0.0% 0.0% 0.0% 0.0% 0.0% 0.0%
Total 0.0% 0.0% 0.0% 0.0% 0.0% 0.0% 0.0% 0.0%Unknown sculpin Gear type 0.0% 0.0% 0.0% 0.0% 0.0% 0.0% 0.0% 0.0%
ind Resource 0.0% 0.0% 0.0% 0.0% 0.0% 0.0% 0.0% 0.0%Total 0.0% 0.0% 0.0% 0.0% 0.0% 0.0% 0.0% 0.0%
Unknown shark Gear type 0.0% 0.0% 0.0% 0.0% 0.0% 0.0% 0.0% 0.0%ind Resource 0.0% 0.0% 0.0% 0.0% 0.0% 0.0% 0.0% 0.0%
Total 0.0% 0.0% 0.0% 0.0% 0.0% 0.0% 0.0% 0.0%Skates Gear type 0.0% 0.0% 0.0% 0.0% 0.0% 0.0% 0.0% 0.0%
ind Resource 0.0% 0.0% 0.0% 0.0% 0.0% 0.0% 0.0% 0.0%Total 0.0% 0.0% 0.0% 0.0% 0.0% 0.0% 0.0% 0.0%
Unknown sole Gear type 0.0% 0.0% 0.0% 0.0% 0.0% 0.0% 0.0% 0.0%ind Resource 0.0% 0.0% 0.0% 0.0% 0.0% 0.0% 0.0% 0.0%
Total 0.0% 0.0% 0.0% 0.0% 0.0% 0.0% 0.0% 0.0%Wolffish Gear type 0.0% 0.0% 0.0% 0.0% 0.0% 0.0% 0.0% 0.0%
ind Resource 0.0% 0.0% 0.0% 0.0% 0.0% 0.0% 0.0% 0.0%Total 0.0% 0.0% 0.0% 0.0% 0.0% 0.0% 0.0% 0.0%
Table 3-16.–Page 3 of 4.
ResourcePercentage base
Removed from commercial
catch
Subsistence methods
Rod and reel
Any method
–continued–
139

Setnet Seine Driftnet Other
Subsistence gear, any method
Unitsa Pounds Pounds Pounds Pounds Pounds Pounds Pounds PoundsDolly Varden Gear type 0.0% 0.0% 0.0% 0.0% 0.0% 0.0% 0.0% 0.0%
ind Resource 0.0% 0.0% 0.0% 0.0% 0.0% 0.0% 0.0% 0.0%Total 0.0% 0.0% 0.0% 0.0% 0.0% 0.0% 0.0% 0.0%
Lake trout Gear type 0.0% 0.0% 0.0% 0.0% 0.0% 0.0% 0.0% 0.0%ind Resource 0.0% 0.0% 0.0% 0.0% 0.0% 0.0% 0.0% 0.0%
Total 0.0% 0.0% 0.0% 0.0% 0.0% 0.0% 0.0% 0.0%Arctic grayling Gear type 0.0% 0.0% 0.0% 0.0% 0.0% 0.0% 0.0% 0.0%
ind Resource 0.0% 0.0% 0.0% 0.0% 0.0% 0.0% 0.0% 0.0%Total 0.0% 0.0% 0.0% 0.0% 0.0% 0.0% 0.0% 0.0%
Northern pike Gear type 0.0% 0.0% 0.0% 0.0% 0.0% 0.0% 0.0% 0.0%ind Resource 0.0% 0.0% 0.0% 0.0% 0.0% 0.0% 0.0% 0.0%
Total 0.0% 0.0% 0.0% 0.0% 0.0% 0.0% 0.0% 0.0%Unknown sturgeon Gear type 0.0% 0.0% 0.0% 0.0% 0.0% 0.0% 0.0% 0.0%
ind Resource 0.0% 0.0% 0.0% 0.0% 0.0% 0.0% 0.0% 0.0%Total 0.0% 0.0% 0.0% 0.0% 0.0% 0.0% 0.0% 0.0%
Cutthroat trout Gear type 0.0% 0.0% 0.0% 0.0% 0.0% 0.0% 0.0% 0.0%ind Resource 0.0% 0.0% 0.0% 0.0% 0.0% 0.0% 0.0% 0.0%
Total 0.0% 0.0% 0.0% 0.0% 0.0% 0.0% 0.0% 0.0%Rainbow trout Gear type 0.0% 0.0% 0.0% 0.0% 0.0% 0.0% 0.0% 0.0%
ind Resource 0.0% 0.0% 0.0% 0.0% 0.0% 0.0% 0.0% 0.0%Total 0.0% 0.0% 0.0% 0.0% 0.0% 0.0% 0.0% 0.0%
Steelhead Gear type 0.0% 0.0% 0.0% 0.0% 0.0% 0.0% 0.0% 0.0%ind Resource 0.0% 0.0% 0.0% 0.0% 0.0% 0.0% 0.0% 0.0%
Total 0.0% 0.0% 0.0% 0.0% 0.0% 0.0% 0.0% 0.0%Unknown whitefishes Gear type 0.0% 0.0% 0.0% 0.0% 0.0% 0.0% 0.0% 0.0%
ind Resource 0.0% 0.0% 0.0% 0.0% 0.0% 0.0% 0.0% 0.0%Total 0.0% 0.0% 0.0% 0.0% 0.0% 0.0% 0.0% 0.0%
Source ADF&G Division of Subsistence household surveys, 2015.a. The harvested number of each resource is measured by the unit in which the resource harvest information was collected; the unit of measurement is provided for each resource.
Table 3-16.–Page 4 of 4.
ResourcePercentage base
Removed from commercial
catch
Subsistence methods
Rod and reel
Any method
140

surveys. The lowest harvest of 1,814 lb recorded for Tatitlek was in 2009, which was similar to the harvest of 2,000 lb harvested in 2014.Following the Pacific halibut harvest, Pacific herring and herring spawn on kelp harvests each composed 6% of the nonsalmon fish harvest (Figure 3-13). Making up the remaining 30% of the total nonsalmon fish harvest were Pacific (gray) cod (5%), Pacific herring roe harvested by unspecified means (5%), sablefish (black cod) (5%), lingcod (5%), yelloweye rockfish (4%), and black rockfish (4%), and less than 2% of the harvest was composed of smaller harvests of varied rockfish species.Pacific herring are available locally in the marine waters of Prince William Sound, and herring were used by 24% of households; however, few households fished for and harvested Pacific herring (10%). In 2014, Tatitlek residents harvested 201 lb of Pacific herring, or 3 lb per capita (Table 3-13). Several survey respondents commented that Pacific herring recovery has slowed in the past 10 years.The total Pacific (gray) cod harvest in 2014 was 163 lb, or 2 lb per capita (Table 3-13). Pacific cod was used by 24% of Tatitlek households and 14% of this community’s households fished for and successfully harvested this nonsalmon fish species. Only 14% of Tatitlek households used lingcod in 2014. The total lingcod harvest was 147 lb, or approximately 2 lb per capita. Sablefish (black cod) was used and harvested by 5% of Tatitlek households in 2014. The total sablefish harvest was 148 lb, or 2 lb per capita. In 2014, yelloweye rockfish was used and harvested by 14% of Tatitlek households. The yelloweye rockfish harvest was 134 lb, or nearly 2 lb per capita.As estimated in pounds harvested, the majority (68%) of the nonsalmon fish harvest was caught using a subsistence gear type—typically longlines (skates); 23% of the nonsalmon fish harvest was removed from commercial catches, 6% was caught using rod and reel, and the remaining 4% was caught using subsistence setnets (Table 3-16). For Pacific halibut, 78% of this nonsalmon fish harvest was caught using a subsistence method (primarily longline), 15% was removed from commercial catches, and 7% was caught using rod and reel. In regard to Pacific herring, 62% of the harvest was accomplished with subsistence setnets, and the remaining 38% was removed from commercial catches.Tatitlek residents’ search and harvest areas for nonsalmon fish all occurred within Prince William Sound and the Gulf of Alaska. Many nonsalmon fish harvests were relatively close to Tatitlek. Community residents reported searching for and harvesting species from this resource category in the Tatitlek Narrows, as well as near Bidarka Point and into Port Fidalgo (Figure 3-14). In some cases, community members traveled up to approximately 90 miles from Tatitlek in search of nonsalmon fish during the study year. Starting from the west and moving toward the east, the nonsalmon fish search and harvest areas encompassed the marine waters from Wells Passage to the Copper River Delta flats in the Gulf of Alaska.
141
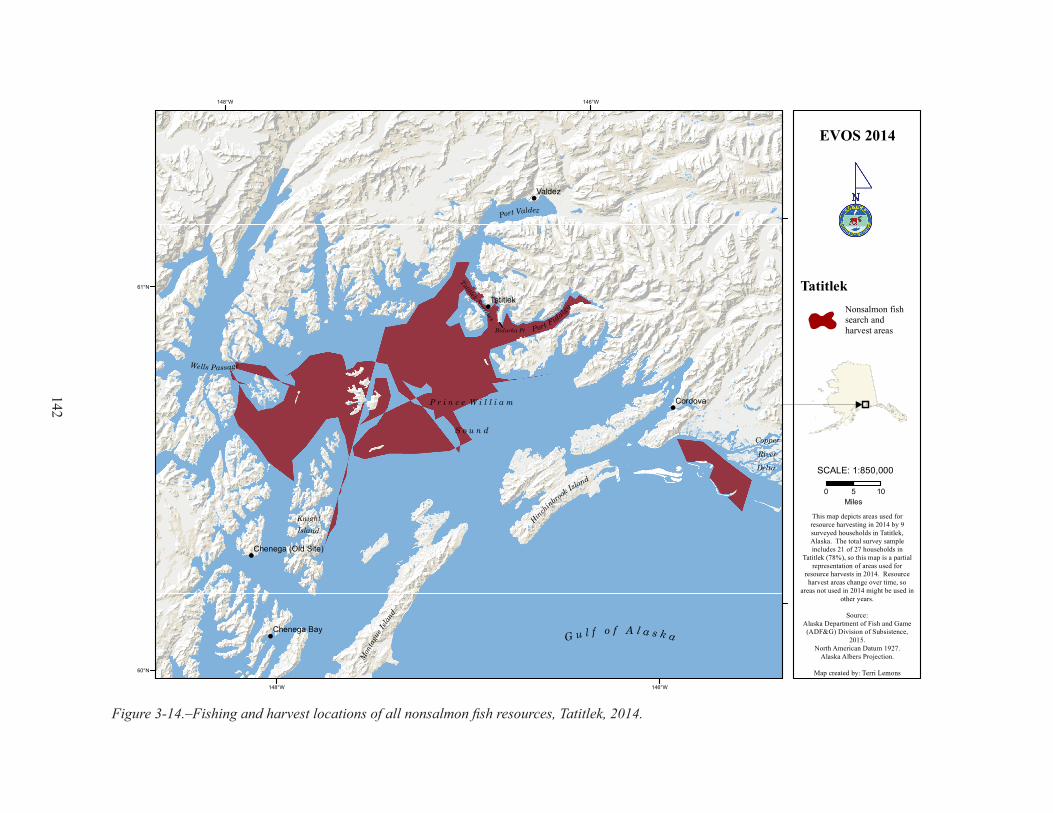
Figure 3-14.–Fishing and harvest locations of all nonsalmon fish resources, Tatitlek, 2014.
!
!
!
!
!
G u l f o f A l a s k a
Mon
tagu
e Islan
d
Hinch
inbrook Isla
nd
KnightIsland
P r i n c e W i l l i a m
S o u n d
Port Valdez
Copper
River
Delta
Wells Passage
Tatitlek Narrows
Port Fidalgo
Bidarka Pt
Valdez
Cordova
Tatitlek
Chenega Bay
Chenega (Old Site)
0 105Miles
This map depicts areas used forresource harvesting in 2014 by 9surveyed households in Tatitlek,Alaska. The total survey sampleincludes 21 of 27 households in
Tatitlek (78%), so this map is a partialrepresentation of areas used for
resource harvests in 2014. Resourceharvest areas change over time, so
areas not used in 2014 might be used inother years.
Source:Alaska Department of Fish and Game(ADF&G) Division of Subsistence,
2015.North American Datum 1927.
Alaska Albers Projection.
Map created by: Terri Lemons
EVOS 2014
TatitlekNonsalmon fish search and harvest areas
1:850,000SCALE:
146°W
146°W
148°W
148°W
61°N
60°N
142

Table 3-17.–Estimated large land mammal harvests by month and sex, Tatitlek, 2014.
Jan Feb Mar Apr May Jun Jul Aug Sep Oct Nov Dec UnkAll large land mammals 0.0 0.0 0.0 0.0 0.0 0.0 0.0 0.0 23.0 10.8 1.4 2.7 0.0 37.8
Black bear 0.0 0.0 0.0 0.0 0.0 0.0 0.0 0.0 0.0 0.0 0.0 0.0 0.0 0.0Caribou 0.0 0.0 0.0 0.0 0.0 0.0 0.0 0.0 0.0 0.0 0.0 0.0 0.0 0.0
Caribou, male 0.0 0.0 0.0 0.0 0.0 0.0 0.0 0.0 0.0 0.0 0.0 0.0 0.0 0.0Caribou, female 0.0 0.0 0.0 0.0 0.0 0.0 0.0 0.0 0.0 0.0 0.0 0.0 0.0 0.0Caribou, unknown sex 0.0 0.0 0.0 0.0 0.0 0.0 0.0 0.0 0.0 0.0 0.0 0.0 0.0 0.0
Deer 0.0 0.0 0.0 0.0 0.0 0.0 0.0 0.0 23.0 10.8 1.4 2.7 0.0 37.8Mountain goat 0.0 0.0 0.0 0.0 0.0 0.0 0.0 0.0 0.0 0.0 0.0 0.0 0.0 0.0Moose 0.0 0.0 0.0 0.0 0.0 0.0 0.0 0.0 0.0 0.0 0.0 0.0 0.0 0.0
Moose, bull 0.0 0.0 0.0 0.0 0.0 0.0 0.0 0.0 0.0 0.0 0.0 0.0 0.0 0.0Moose, cow 0.0 0.0 0.0 0.0 0.0 0.0 0.0 0.0 0.0 0.0 0.0 0.0 0.0 0.0Moose, unknown sex 0.0 0.0 0.0 0.0 0.0 0.0 0.0 0.0 0.0 0.0 0.0 0.0 0.0 0.0
Dall sheep 0.0 0.0 0.0 0.0 0.0 0.0 0.0 0.0 0.0 0.0 0.0 0.0 0.0 0.0Source ADF&G Division of Subsistence household surveys, 2015.
ResourceEstimated harvest by month
Total
Large Land MammalsVarying from the previous studies conducted by the division in Tatitlek, deer made up the entirety of Tatitlek’s large land mammal harvest in 2014 (Table 3-13; CSIS). The total deer harvest in 2014 was 1,633 lb, or 22 lb per capita. A total of 38 deer were harvested throughout the study year; 23 deer were harvested in the month of September, 11 in October, 1 in November, and 3 deer were harvested in December (Table 3-17).Deer are an important species for subsistence in Tatitlek, and in 2014 an estimated 81% of households used deer, which were hunted by 57% of households (Table 3-13). All households that hunted deer in 2014 were successful. Deer were shared widely throughout the community; 50% of households received this resource, and 45% of households gave it away in 2014.The 2014 per capita harvest of 22 lb was higher than the per capita deer harvest in the 2003 (17 lb per capita) and 1990 (17 lb per capita) study years (CSIS). However, this study year had a lower pounds per capita harvest of deer than the study years 1987 (77 lb per capita), 1988 (82 lb per capita), 1989 (45 lb per capita), 1991 (36 lb per capita), 1993 (48 lb per capita), and 1997 (41 lb per capita) (CSIS).Though no moose or mountain goats were harvested in 2014, both of these species of large land mammal were used. Approximately 10% of Tatitlek households received and used moose and 5% received and used mountain goat resources during the study year (Table 3-13). The results of this survey correlate with the ADF&G Division of Wildlife Conservation WinfoNet5 database results (accessed October 2015), which showed no moose or mountain goat permits or harvest tickets issued in Tatitlek for the study year.During the previous study years, in addition to deer, Tatitlek residents harvested moose (which are not locally available), black bears, and mountain goats (CSIS). According to the WinfoNet database, with the exception of 2007, at least 1 community member from Tatitlek received a moose hunting harvest ticket each year since 2003 and successful moose hunts occurred in 2004 (2 moose were harvested) and 2008 (1 moose was harvested). These reported data correlate with the 2003 subsistence survey estimate, when no moose harvests were reported (Fall 2006:77).In discussing game harvests with Tatitlek hunters, the majority did not express any concerns regarding the health or abundance of deer populations in and around the community. A few respondents mentioned the possibility of future deer population declines if increasing numbers of deer hunters from outside of the community begin hunting more in the search and harvest areas used by members of the community.5. The ADF&G maintains a record of hunters’ and trappers’ reported wildlife harvests and related information in a database known as the Wildlife Information Network (WinfoNet). Data in WinfoNet are accessed through an ADF&G intranet website. Some harvests of large land mammals and furbearers are required by regulation to be reported to the Division of Wildlife Conser-vation in the form of a general hunt harvest ticket or a harvest report from a registration, drawing, Tier I, or Tier II hunt permit, or by having furs of certain species sealed by ADF&G or a certified fur sealer (5 AAC 92.010; 5 AAC 92.170).
143
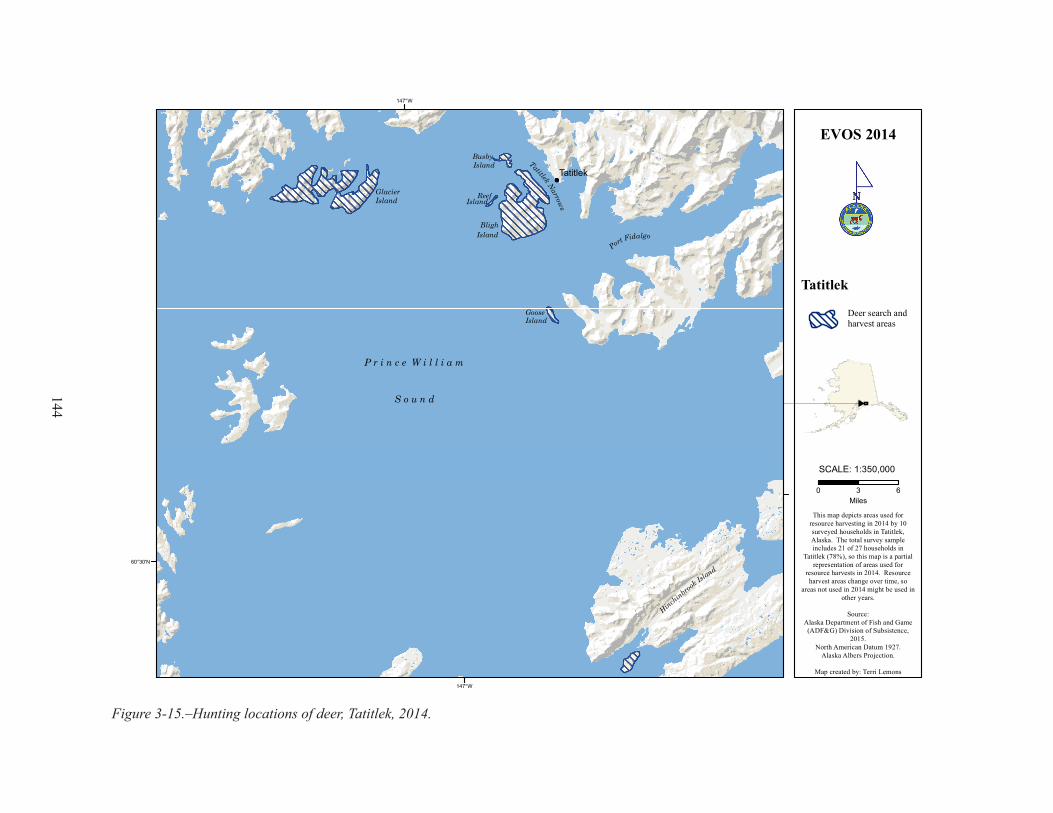
Figure 3-15.–Hunting locations of deer, Tatitlek, 2014.
Hinchinbrook Isla
nd
P r i n c e W i l l i a m
S o u n d
BlighIsland
Tatitlek Narrows
Gale na Bay
PortFidalgo
BusbyIsland
ReefIsland
GooseIsland
Tatitlek
0 63Miles
This map depicts areas used forresource harvesting in 2014 by 10surveyed households in Tatitlek,Alaska. The total survey sampleincludes 21 of 27 households in
Tatitlek (78%), so this map is a partialrepresentation of areas used for
resource harvests in 2014. Resourceharvest areas change over time, so
areas not used in 2014 might be used inother years.
Source:Alaska Department of Fish and Game(ADF&G) Division of Subsistence,
2015.North American Datum 1927.
Alaska Albers Projection.
Map created by: Terri Lemons
EVOS 2014
Tatitlek
Deer search andharvest areas
1:350,000SCALE:
147°W
147°W
60°30'N
Glacier Island
144
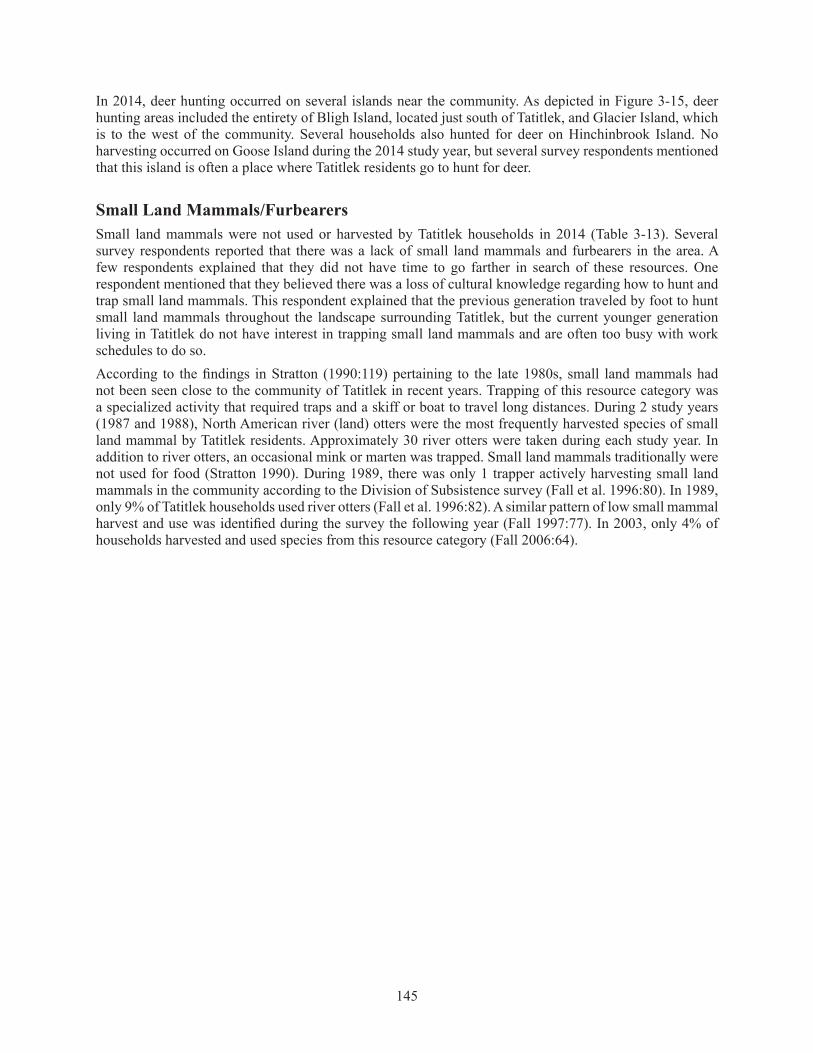
In 2014, deer hunting occurred on several islands near the community. As depicted in Figure 3-15, deer hunting areas included the entirety of Bligh Island, located just south of Tatitlek, and Glacier Island, which is to the west of the community. Several households also hunted for deer on Hinchinbrook Island. No harvesting occurred on Goose Island during the 2014 study year, but several survey respondents mentioned that this island is often a place where Tatitlek residents go to hunt for deer.
Small Land Mammals/FurbearersSmall land mammals were not used or harvested by Tatitlek households in 2014 (Table 3-13). Several survey respondents reported that there was a lack of small land mammals and furbearers in the area. A few respondents explained that they did not have time to go farther in search of these resources. One respondent mentioned that they believed there was a loss of cultural knowledge regarding how to hunt and trap small land mammals. This respondent explained that the previous generation traveled by foot to hunt small land mammals throughout the landscape surrounding Tatitlek, but the current younger generation living in Tatitlek do not have interest in trapping small land mammals and are often too busy with work schedules to do so.According to the findings in Stratton (1990:119) pertaining to the late 1980s, small land mammals had not been seen close to the community of Tatitlek in recent years. Trapping of this resource category was a specialized activity that required traps and a skiff or boat to travel long distances. During 2 study years (1987 and 1988), North American river (land) otters were the most frequently harvested species of small land mammal by Tatitlek residents. Approximately 30 river otters were taken during each study year. In addition to river otters, an occasional mink or marten was trapped. Small land mammals traditionally were not used for food (Stratton 1990). During 1989, there was only 1 trapper actively harvesting small land mammals in the community according to the Division of Subsistence survey (Fall et al. 1996:80). In 1989, only 9% of Tatitlek households used river otters (Fall et al. 1996:82). A similar pattern of low small mammal harvest and use was identified during the survey the following year (Fall 1997:77). In 2003, only 4% of households harvested and used species from this resource category (Fall 2006:64).
145

Marine MammalsA total of 7,262 lb, or 97 lb per capita, of marine mammals were harvested by Tatitlek community members in 2014 (Table 3-13). Marine mammals were used by 67% of Tatitlek households in 2014. Harbor seals composed 72% of the marine mammal harvest, and Steller sea lions made up the remaining 28% of the marine mammal harvest in 2014 (Figure 3-16).Harbor seals were used by 67% of Tatitlek households in 2014. A total of 93 harbor seals were harvested in 2014, and 38% Tatitlek of households attempted to and successfully harvested this resource. The total harbor seal harvest by weight in 2014 was 5,205 lb, or 70 lb per capita (Table 3-13).Tatitlek households reported harvesting harbor seals from March through the month of September in 2014 (Table 3-18). There were also 71 harbor seal harvests that occurred in an unknown month. Harbor seals were shared throughout the community; 48% of households received this resource, and 33% of households gave this resource away in 2014.The total Steller sea lion harvest by weight in 2014 was 2,057 lb, or 28 lb per capita (Table 3-13). A total of 10 Steller sea lions were harvested in 2014, and 19% Tatitlek of households attempted to and successfully harvested this marine resource. Tatitlek households reported harvesting 3 Steller sea lions in April, 1 in August, and 6 in an unknown month (Table 3-18). Steller sea lions were used by 19% of Tatitlek households in 2014, and 15% of households gave away this resource while no household reported receiving any Steller sea lion (Table 3-13).In 1997, Tatitlek residents harvested a total 13,372 lb (165 lb per capita) of marine mammals; the per capita harvest was approximately 60 lb per capita more than in the 2003 (7,361 lb, 100 lb per capita) and 2014 study years (CSIS). Contemporary Tatitlek hunters explained that seal and sea lion populations have not fully recovered from the oil spill, and the search and harvest areas for these 2 species are much farther from the community than they were prior to the oil spill.The Alaska Native Harbor Seal Commission (ANHSC) has collected marine mammal harvest and use information with ADF&G in various parts of Alaska for all years between 1992 and 2008, except 1999
Figure 3-16.–Composition of marine mammal harvest in pounds usable weight, Tatitlek, 2014.
Harbor seal72%
Steller sea lion28%
146
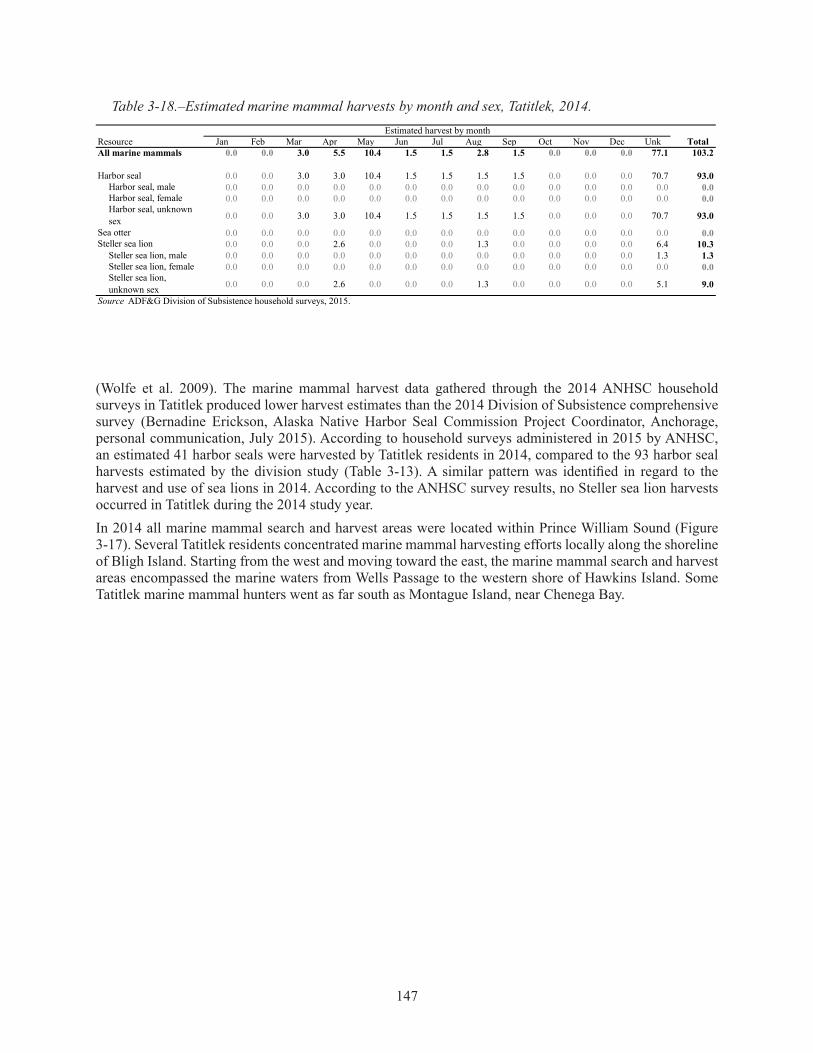
Table 3-18.–Estimated marine mammal harvests by month and sex, Tatitlek, 2014.
Jan Feb Mar Apr May Jun Jul Aug Sep Oct Nov Dec UnkAll marine mammals 0.0 0.0 3.0 5.5 10.4 1.5 1.5 2.8 1.5 0.0 0.0 0.0 77.1 103.2
Harbor seal 0.0 0.0 3.0 3.0 10.4 1.5 1.5 1.5 1.5 0.0 0.0 0.0 70.7 93.0Harbor seal, male 0.0 0.0 0.0 0.0 0.0 0.0 0.0 0.0 0.0 0.0 0.0 0.0 0.0 0.0Harbor seal, female 0.0 0.0 0.0 0.0 0.0 0.0 0.0 0.0 0.0 0.0 0.0 0.0 0.0 0.0Harbor seal, unknown sex 0.0 0.0 3.0 3.0 10.4 1.5 1.5 1.5 1.5 0.0 0.0 0.0 70.7 93.0
Sea otter 0.0 0.0 0.0 0.0 0.0 0.0 0.0 0.0 0.0 0.0 0.0 0.0 0.0 0.0Steller sea lion 0.0 0.0 0.0 2.6 0.0 0.0 0.0 1.3 0.0 0.0 0.0 0.0 6.4 10.3
Steller sea lion, male 0.0 0.0 0.0 0.0 0.0 0.0 0.0 0.0 0.0 0.0 0.0 0.0 1.3 1.3Steller sea lion, female 0.0 0.0 0.0 0.0 0.0 0.0 0.0 0.0 0.0 0.0 0.0 0.0 0.0 0.0Steller sea lion, unknown sex 0.0 0.0 0.0 2.6 0.0 0.0 0.0 1.3 0.0 0.0 0.0 0.0 5.1 9.0
Source ADF&G Division of Subsistence household surveys, 2015.
Estimated harvest by monthResource Total
(Wolfe et al. 2009). The marine mammal harvest data gathered through the 2014 ANHSC household surveys in Tatitlek produced lower harvest estimates than the 2014 Division of Subsistence comprehensive survey (Bernadine Erickson, Alaska Native Harbor Seal Commission Project Coordinator, Anchorage, personal communication, July 2015). According to household surveys administered in 2015 by ANHSC, an estimated 41 harbor seals were harvested by Tatitlek residents in 2014, compared to the 93 harbor seal harvests estimated by the division study (Table 3-13). A similar pattern was identified in regard to the harvest and use of sea lions in 2014. According to the ANHSC survey results, no Steller sea lion harvests occurred in Tatitlek during the 2014 study year.In 2014 all marine mammal search and harvest areas were located within Prince William Sound (Figure 3-17). Several Tatitlek residents concentrated marine mammal harvesting efforts locally along the shoreline of Bligh Island. Starting from the west and moving toward the east, the marine mammal search and harvest areas encompassed the marine waters from Wells Passage to the western shore of Hawkins Island. Some Tatitlek marine mammal hunters went as far south as Montague Island, near Chenega Bay.
147
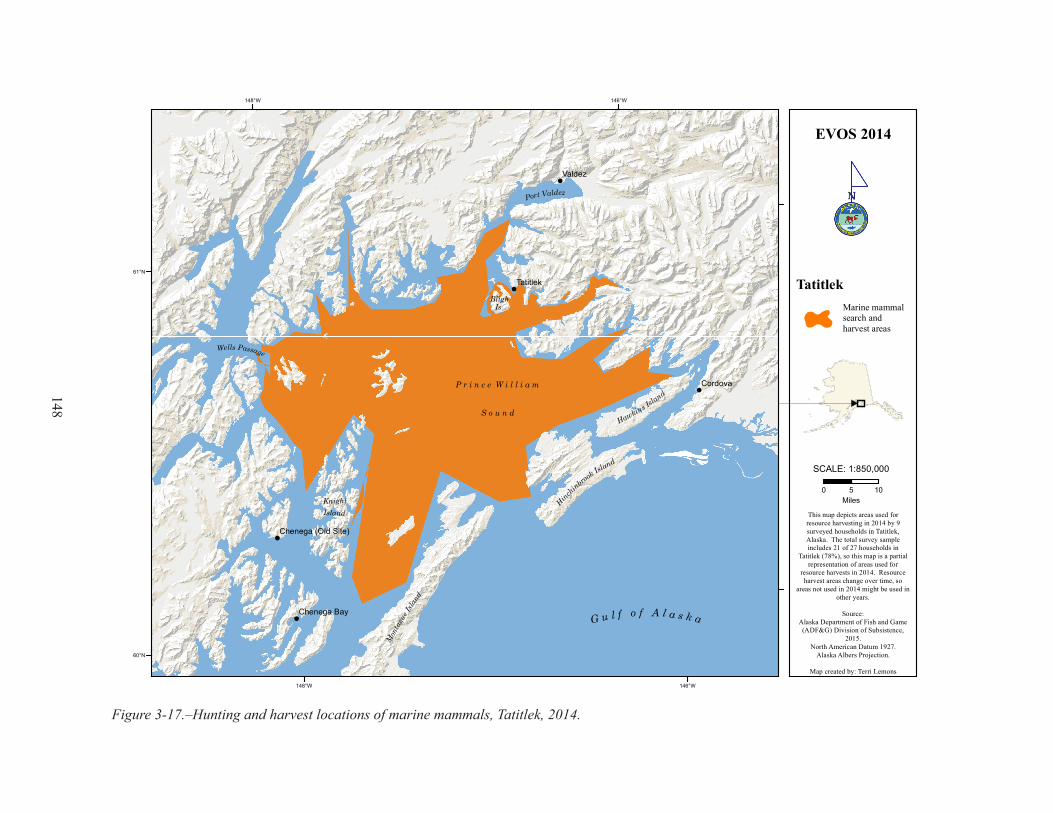
Figure 3-17.–Hunting and harvest locations of marine mammals, Tatitlek, 2014.
!
!
!
!
!
G u l f o f A l a s k a
Mon
tagu
e Isla
nd
Hinch
inbrook Isla
nd
KnightIsland
P r i n c e W i l l i a m
S o u n d
Port Valdez
BlighIs
Wells Passage
Hawkins Island
Valdez
Cordova
Tatitlek
Chenega Bay
Chenega (Old Site)
0 105Miles
This map depicts areas used forresource harvesting in 2014 by 9surveyed households in Tatitlek,Alaska. The total survey sampleincludes 21 of 27 households in
Tatitlek (78%), so this map is a partialrepresentation of areas used for
resource harvests in 2014. Resourceharvest areas change over time, so
areas not used in 2014 might be used inother years.
Source:Alaska Department of Fish and Game(ADF&G) Division of Subsistence,
2015.North American Datum 1927.
Alaska Albers Projection.
Map created by: Terri Lemons
EVOS 2014
TatitlekMarine mammal search and harvest areas
1:850,000SCALE:
146°W
146°W
148°W
148°W
61°N
60°N
148

Figure 3-18.–Composition of bird and bird egg harvest in pounds usable weight, Tatitlek, 2014.
Goldeneye3% Mallard
5% Black scoter7%
Unknown ducks2%
Unknown Canada/cackling
geese6%
Snow goose6%
Unknown geese3%
Unknown grouse5%
Unknown goose eggs4%
Unknown gull eggs59%
Unknown tern eggs< 1%
Birds and EggsBirds and eggs were used by 52% of Tatitlek households in 2014, with a total harvest of 386 lb, or approximately 5 lb per capita (Table 3-13). The per capita harvest of birds and eggs in 2014, at 5 lb, was slightly higher than the post-spill average of 4 lb per capita, but lower than the pre-spill average of 8 lb per capita (CSIS).The species of migratory waterfowl that were harvested in 2014 included unknown species of geese and ducks (11% of total bird and bird egg harvest), black scoter (7%), snow goose (6%), mallard (5%), and goldeneye (3%) (Figure 3-18). The species of upland game birds harvested by Tatitlek households in 2014 included unknown grouse species (5% of total bird and bird egg harvest). The types of eggs harvested and used in 2014 ranged from unspecified kinds of gull eggs (59% of total bird and bird egg harvest), goose eggs from unspecified kinds of geese (4%), and tern eggs (less than 1% of the category harvest).No bird species harvest totaled as much as 1 lb per capita, but unknown gull eggs contributed 3 lb per capita. In terms of bird harvest by usable weight, black scoters made up the most (28 lb) harvest weight in 2014 (Table 3-13; Figure 3-18). In 2014, an estimated 10% of Tatitlek households harvested this resource, 10% gave it away, and 5% of households received black scoters. The total harvest weight of snow geese in 2014 was 23 lb. Five percent of Tatitlek households harvested this resource during the study year, 5% gave away snow geese, and no households received any snow geese in 2014 (Table 3-13). For this study year, 18 lb of unknown grouse were harvested and used by 5% of Tatitlek households. A total of 17 lb of mallards were harvested by 10% of Tatitlek households in 2014. The total harvest weight of goldeneye ducks by Tatitlek households in 2014 was 12 lb. This resource was used and harvested by 5% of Tatitlek households and no households shared this resource during the study year.Eggs from unspecified kinds of gulls made up 59% the total bird and bird egg harvest (Figure 3-18); 48% of households used eggs from unspecified kinds of gulls, and 29% of households harvested this resource. During the study year, 19% of households gave away and received this resource (Table 3-13). Goose
149

Table 3-19.–Estimated bird harvests by season, Tatitlek, 2014.
Spring Summer Fall WinterSeason
unknownAll birds 0.0 45.0 91.3 0.0 0.0 136.3
Bufflehead 0.0 0.0 0.0 0.0 0.0 0.0Unknown eider 0.0 0.0 0.0 0.0 0.0 0.0Goldeneye 0.0 15.4 0.0 0.0 0.0 15.4Harlequin duck 0.0 0.0 0.0 0.0 0.0 0.0Mallard 0.0 3.9 15.4 0.0 0.0 19.3Unknown merganser 0.0 0.0 0.0 0.0 0.0 0.0Long-tailed duck 0.0 0.0 0.0 0.0 0.0 0.0Northern pintail 0.0 0.0 0.0 0.0 0.0 0.0Unknown scaup 0.0 0.0 0.0 0.0 0.0 0.0Black scoter 0.0 0.0 30.9 0.0 0.0 30.9Surf scoter 0.0 0.0 0.0 0.0 0.0 0.0White-winged scoter 0.0 0.0 0.0 0.0 0.0 0.0Northern shoveler 0.0 0.0 0.0 0.0 0.0 0.0Unknown teal 0.0 0.0 0.0 0.0 0.0 0.0Unknown wigeon 0.0 0.0 0.0 0.0 0.0 0.0Unknown ducks 0.0 0.0 10.3 0.0 0.0 10.3Unknown Canada/cackling geese 0.0 0.0 19.3 0.0 0.0 19.3Snow goose 0.0 0.0 7.7 0.0 0.0 7.7White-fronted goose 0.0 0.0 0.0 0.0 0.0 0.0Unknown geese 0.0 0.0 7.7 0.0 0.0 7.7Sandhill crane 0.0 0.0 0.0 0.0 0.0 0.0Unknown cormorant 0.0 0.0 0.0 0.0 0.0 0.0Unknown gull 0.0 0.0 0.0 0.0 0.0 0.0Black-legged kittiwake 0.0 0.0 0.0 0.0 0.0 0.0Unknown murre 0.0 0.0 0.0 0.0 0.0 0.0Unknown puffin 0.0 0.0 0.0 0.0 0.0 0.0Unknown grouse 0.0 25.7 0.0 0.0 0.0 25.7Source ADF&G Division of Subsistence household surveys, 2015.
Estimated harvest by season
TotalResource
eggs from unspecified kinds of geese were used and harvested by 5% of Tatitlek households, with a total community harvest of 14 lb in 2014.Table 3-19 indicates the seasons in which birds were harvested. Birds were harvested from several areas close to the community of Tatitlek (Figure 3-19). Both grouse and migratory waterfowl were hunted along the shoreline of the Tatitlek Narrows, from Black Point south to the end of the peninsula. In addition, migratory waterfowl were also hunted for on the shoreline of Boulder Bay, at the base of Copper Mountain. Tatitlek residents traveled farther in search of bird eggs than they did to harvest birds. All bird egg harvests took place in Prince William Sound within approximately 20 miles of the community. Popular bird egg search and harvest locations include the shoreline of Glacier Island, Bligh Island, and Goose Island. In addition, Tatitlek residents searched for bird eggs north of the community at Rocky Point, and in the eastern edge of Galena Bay, as well as to the east in Port Fidalgo.
Marine InvertebratesMarine invertebrates were used by 38% of Tatitlek households in 2014 (Table 3-13). The total harvest was 1,292 lb, or 17 lb per capita. In 2014, the majority of the total resource category harvest was composed of
150

Figure 3-19.–Hunting and harvest locations of bird eggs, migratory waterfowl, and grouse, Tatitlek, 2014.
!
!
P r i n c e W i l l i a m
S o u n d
Port Valdez
BlighIsland
Tatitlek Narrows
VirginBay
Gale na Bay
BoulderBay
Po
rt Fidalgo
Vald
ezAr
m
GooseIsland
GrowlerBay
GlacierIsland
Rocky Pt
Black Pt
CopperMtnTatitlek
0 52.5Miles
This map depicts areas used forresource harvesting in 2014 by 6surveyed households in Tatitlek,Alaska. The total survey sampleincludes 21 of 27 households in
Tatitlek (78%), so this map is a partialrepresentation of areas used for
resource harvests in 2014. Resourceharvest areas change over time, so
areas not used in 2014 might be used inother years.
Source:Alaska Department of Fish and Game(ADF&G) Division of Subsistence,
2015.North American Datum 1927.
Alaska Albers Projection.
Map created by: Terri Lemons
EVOS 2014
TatitlekBird eggs search and harvest areas
1:350,000SCALE:
146°W
147°W
147°W
61°N
Ducks and geese search and harvest areas
Grouse search and harvest areas
151
Figure 3-20.–Composition of marine invertebrates harvest in pounds usable weight, Tatitlek, 2014.
Black (small) chitons2%
Octopus95%
Other3%
Note The "other" category represents all species that contributed 1% or less to the total marine invertebrates harvest.
octopuses (95%), followed by black (small) chitons (2%), and butter clams and cockles (3% combined) (Figure 3-20). In 2014, an estimated 19% of Tatitlek households harvested octopuses; the total community harvest by weight was 1,229 lb, or 17 lb per capita (Table 3-13). Overall, octopuses were used by 38% of households, with 24% of households receiving octopuses, and 14% of households giving away this resource.The total harvest weight of black chitons in 2014 was 31 lb, or less than 1 lb per capita. Black chitons were used by 14% of Tatitlek households in 2014, and 10% of households attempted to harvest this species; of those 10%, all were successful. In 2014, the total weight of the harvest of butter clams was 16 lb, and the total weight of cockles harvested was 15 lb. Butter clams and cockles were both used and harvested by 10% of Tatitlek households in 2014. No households shared either of these resources in the study year.The estimated 17 lb per capita harvest of marine invertebrates indicates a large increase from the per capita harvest estimated for the 2003 study. In 2003, Tatitlek residents harvested only 61 lb of marine invertebrates, or less than 1 lb per capita. In terms of pounds of marine invertebrates harvested in 2014, the results more closely reflect the 1997 study year, when the community harvested 1,509 lb (19 lb per capita).The increased harvest of octopuses accounts for this large increase in the marine invertebrates harvest weight from the previous study year. Octopuses made up 95% of the total resource harvest by weight in 2014. A similar pattern was found in 1987 and again in 1988, when octopuses contributed the largest portion of the marine invertebrates harvest (751 lb, or 36%, in 1987 and 1,643 lb, or 35%, in 1988), and was used by 89% and 81% of households, respectively (Stratton 1990:74, 80, 82). Fifteen years later, in 2003, Tatitlek residents harvested just 0.2 lb of octopus per person. During the 2003 study year, many more households used and received octopus than harvested them, indicating that households either did not report all of their harvest, that these resources came from outside the community, or that the harvest was done by a household that was not surveyed during that study year.During the 2014 study year, Tatitlek residents searched for and harvested marine invertebrates along the beaches close to the community. Tatitlek residents also traveled north of the community in search of marine invertebrates in 2014. To the north, the shoreline along Galena Bay was reported as a popular area to search for and harvest marine invertebrates (Figure 3-21).
152

Figure 3-21.–Fishing and harvest locations of marine invertebrates, Tatitlek, 2014.
!
Bligh
Island
Tatitlek Narrows
VirginBay
Black Pt
Boulder Bay
Galena Bay
Tatitlek0 21
Miles
This map depicts areas used forresource harvesting in 2014 by 5surveyed households in Tatitlek,Alaska. The total survey sampleincludes 21 of 27 households in
Tatitlek (78%), so this map is a partialrepresentation of areas used for
resource harvests in 2014. Resourceharvest areas change over time, so
areas not used in 2014 might be used inother years.
Source:Alaska Department of Fish and Game(ADF&G) Division of Subsistence,
2015.North American Datum 1927.
Alaska Albers Projection.
Map created by: Terri Lemons
EVOS 2014
TatitlekMarine invertebrates search and harvest areas
1:100,000SCALE:
146°30'W
146°45'W
146°45'W
60°55'N
60°50'N
153

Figure 3-22.–Composition of vegetation harvest by type and pounds usable weight, Tatitlek, 2014.
VegetationVegetation was used by 81% of Tatitlek households in 2014. A total of 593 lb, or 8 lb per capita, of vegetation were harvested during the study year (Table 3-13). The vast majority of the harvest in this category was composed of berries (89%), while plants and greens made up 11% of the harvest for this category (Figure 3-22). Six species of berries were used by Tatitlek households in 2014. Salmonberries were used by 76% of Tatitlek households during the study year and 71% of households harvested this resource (Table 3-13). The total harvest of salmonberries was 238 lb, or 3 lb per capita. The second highest used (62% of households) and harvested (57% of households) berry species was blueberry; the total harvested weight of this resource was 211 lb, or 3 lb per capita. Highbush cranberries were used and harvested by 19% of Tatitlek households in 2014; Tatitlek households harvested a total of 54 lb, or less than 1 lb per capita. Lowbush cranberries, raspberries, and nagoonberries were used and harvested by 5% of Tatitlek households in the study year. Sharing of berries and berry products was less common than demonstrated in other resource categories in this community. In 2014, an estimated 14% of households gave away and received salmonberries, and 19% of households gave away blueberries and 14% received this resource. Highbush cranberries were given away by 5% of households, and no households received this type of berry.Plants were harvested, used, and shared far less frequently than berries. In 2014, an estimated 5% of Tatitlek households used and harvested both unspecified beach greens and nettle. The estimated harvest weight for both beach greens and nettle was 32 lb, or approximately 1 lb per capita each. No sharing of these plants was reported in 2014.The 2014 vegetation harvest was an increase from that found in 2003. In 2003, the total harvest of vegetation was 296 lb (4 lb per capita) (Fall 2006:80). The 2014 harvest weight more closely reflects the 1997 vegetation harvest total of 658 lb (8 lb per capita) (CSIS).
Berries89%
Plants and greens11%
Note Seaweed is not included becuase there was 0 lb of usable weight harvested.
154

This study also collected information on the harvest of wood, but the harvest amount is not included in estimated usable harvest weight calculations. Using firewood to heat homes was not a common practice for Tatitlek households. In the study year, 90% of Tatitlek households reported that 0% of their home heating came from firewood (Table 3-20). A small portion of households (5%) reported 1–25% of home heating came from firewood, while 5% of households reported 26–50% of home heating came from firewood. During the study year, 29% of Tatitlek households used wood (Table 3-13). In 2014, there were 19% of Tatitlek households that harvested wood, 19% received wood, and 14% gave it away. Vegetation was harvested from several areas close to Tatitlek. Berries were harvested within the immediate community and some berries were harvested north of Tatitlek near Black Point. Plant harvests took place on the beaches close to the community (Figure 3-23).
coMParing harveStS and uSeS in 2014 with PreviouS yearS
Harvest AssessmentsResearchers asked respondents to assess their own harvests in 2 ways: whether they got more, less, or about the same amount of 9 resource categories in 2014 as in the past 5 years, and whether they got “enough” of each of the 9 resource categories. Households also were asked to provide reasons if their use was different or if they were unable to get enough of a resource. If they did not get enough of a resource, they were asked to evaluate the severity of the impact to their household as a result of not getting enough. Together, Table 3-21 and Figure 3-24 and Figure 3-25 provide a broad overview of households’ assessments of their uses of harvests in 2014. Because not everyone uses all resource categories, some households did not respond to the assessment questions. Additionally, some households that do typically use a resource category simply did not answer questions.Salmon was the most harvested subsistence resource category used by Tatitlek households in 2014 (Figure 3-8). During the study year, 32% of responding households explained that they used the same amount of salmon in 2014 as they did in previous years, 47% reported that they used less, and 11% said they used more (Table 3-21; Figure 3-24). In Tatitlek, 19% of sampled households, or 24% of respondents, stated that they did not get enough salmon (Figure 3-25; Table 3-22). When asked to evaluate the impact of not getting enough salmon, no household described it as not noticeable, 50% described the impact as minor, 25% explained that not getting enough salmon had a major effect on their household, and 25% of households stated that the impact was severe (Table 3-22). In the study year, marine mammals was the second most harvested subsistence resource category used by Tatitlek households (Figure 3-8). In Tatitlek, 45% of responding households explained that they used the same amount of marine mammals during 2014 as they did in previous years, 10% reported that they used
Table 3-20.–Use of firewood for home heating in sampled households, Tatitlek, 2014.Percentage of home heating from firewood
Number of households
Percentage of households
0% 17 89%1-25% 1 5%26-50% 1 5%51-75% 0 0%76-99% 0 0%100% 0 0%Source ADF&G Division of Subsistence household surveys, 2015.
155

Figure 3-23.–Gathering and harvest locations of berries, plants, and greens, Tatitlek, 2014.
!
Bligh
Island
Tatitlek Narrows
VirginBay
Black Pt
Boulder BayTatitlek
0 21Miles
This map depicts areas used forresource harvesting in 2014 by 13surveyed households in Tatitlek,Alaska. The total survey sampleincludes 21 of 27 households in
Tatitlek (78%), so this map is a partialrepresentation of areas used for
resource harvests in 2014. Resourceharvest areas change over time, so
areas not used in 2014 might be used inother years.
Source:Alaska Department of Fish and Game(ADF&G) Division of Subsistence,
2015.North American Datum 1927.
Alaska Albers Projection.
Map created by: Terri Lemons
EVOS 2014
TatitlekBerries and greens search and harvest areas
1:100,000SCALE:
146°30'W
146°45'W
146°45'W
60°55'N
60°50'N
156

Table 3-21.–Changes in household uses of resources compared to recent years, Tatitlek, 2014.
Number Percentage Number Percentage Number Percentage Number Percentage Number PercentageAny resource 21 20 20 100.0% 16 80.0% 18 90.0% 7 35.0% NA NA
All resources 21 20 20 100.0% 14 70.0% 5 25.0% 1 5.0% 0 0.0%Salmon 21 19 17 89.5% 9 47.4% 6 31.6% 2 10.5% 2 10.5%Nonsalmon fish 21 20 15 75.0% 4 20.0% 9 45.0% 2 10.0% 5 25.0%Large land mammals 21 20 17 85.0% 9 45.0% 7 35.0% 1 5.0% 3 15.0%Small land mammals 21 20 0 0.0% 0 0.0% 0 0.0% 0 0.0% 20 100.0%Marine mammals 21 20 13 65.0% 2 10.0% 9 45.0% 2 10.0% 7 35.0%Birds and bird eggs 21 19 11 57.9% 2 10.5% 7 36.8% 2 10.5% 8 42.1%Marine invertebrates 21 20 9 45.0% 3 15.0% 6 30.0% 0 0.0% 11 55.0%Vegetation 21 19 16 84.2% 8 42.1% 6 31.6% 2 10.5% 3 15.8%Seaweed 21 20 0 0.0% 0 0.0% 0 0.0% 0 0.0% 20 100.0%
a. Valid responses do not include households that did not provide any response.
Source ADF&G Division of Subsistence household surveys, 2015.Note "NA" indicates that there is not applicable data.
Households not usingSampled householdsResource category
MoreSameLessValid responsesa
Total householdsHouseholds reporting use
157

Figure 3-24.–Changes in household uses of resources compared to recent years, Tatitlek, 2014.
47%
20%
45%
10%
11%
15%
42%
32%
45%
35%
45%
37%
30%
32%
11%
10%
5%
10%
11%
11%
11%
25%
15%
100%
35%
42%
55%
16%
100%
0% 10% 20% 30% 40% 50% 60% 70% 80% 90% 100%
Salmon
Nonsalmon fish
Large land mammals
Small land mammals
Marine mammals
Birds and bird eggs
Marine invertebrates
Vegetation
Seaweed
Percentage of surveyed households providing a valid response, unlabeled percentages are less than 5%.
Households used LESS in 2014 Households used SAME in 2014 Households used MORE in 2014 Households normally do not use
158
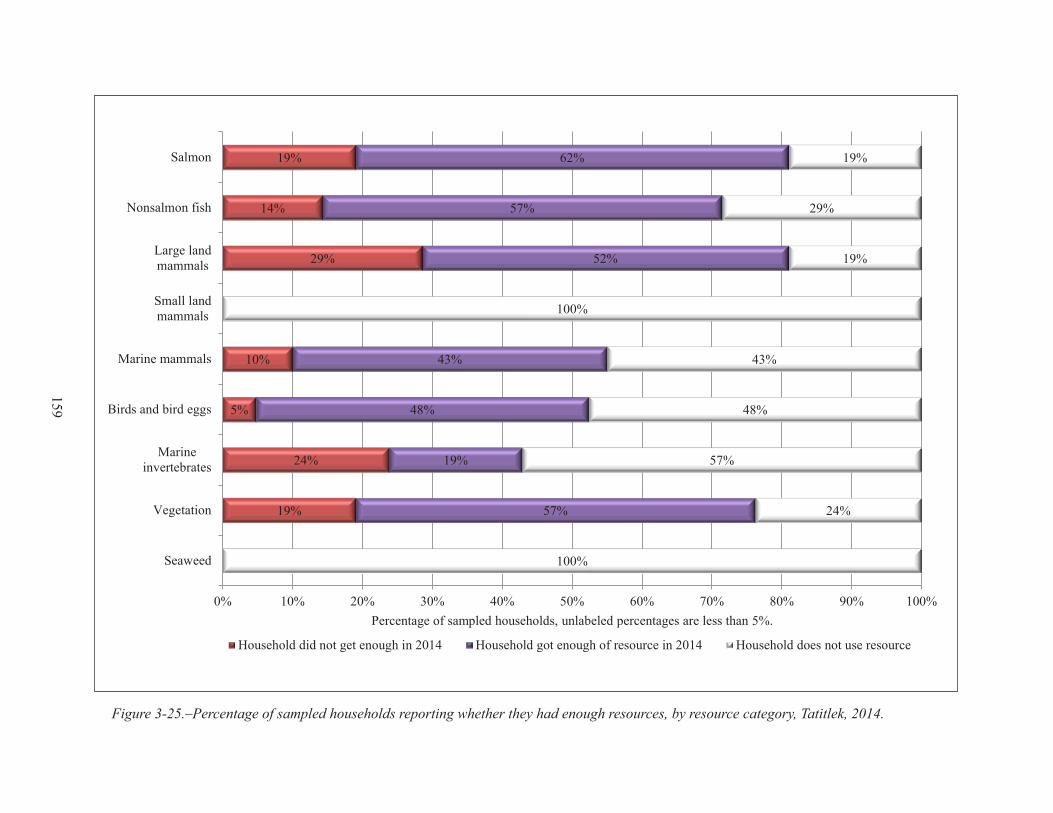
Figure 3-25.–Percentage of sampled households reporting whether they had enough resources, by resource category, Tatitlek, 2014.
19%
14%
29%
10%
5%
24%
19%
19%
29%
19%
100%
43%
48%
57%
24%
100%
62%
57%
52%
43%
48%
19%
57%
0% 10% 20% 30% 40% 50% 60% 70% 80% 90% 100%
Salmon
Nonsalmon fish
Large landmammals
Small landmammals
Marine mammals
Birds and bird eggs
Marineinvertebrates
Vegetation
Seaweed
Percentage of sampled households, unlabeled percentages are less than 5%.
Household did not get enough in 2014 Household got enough of resource in 2014 Household does not use resource
159
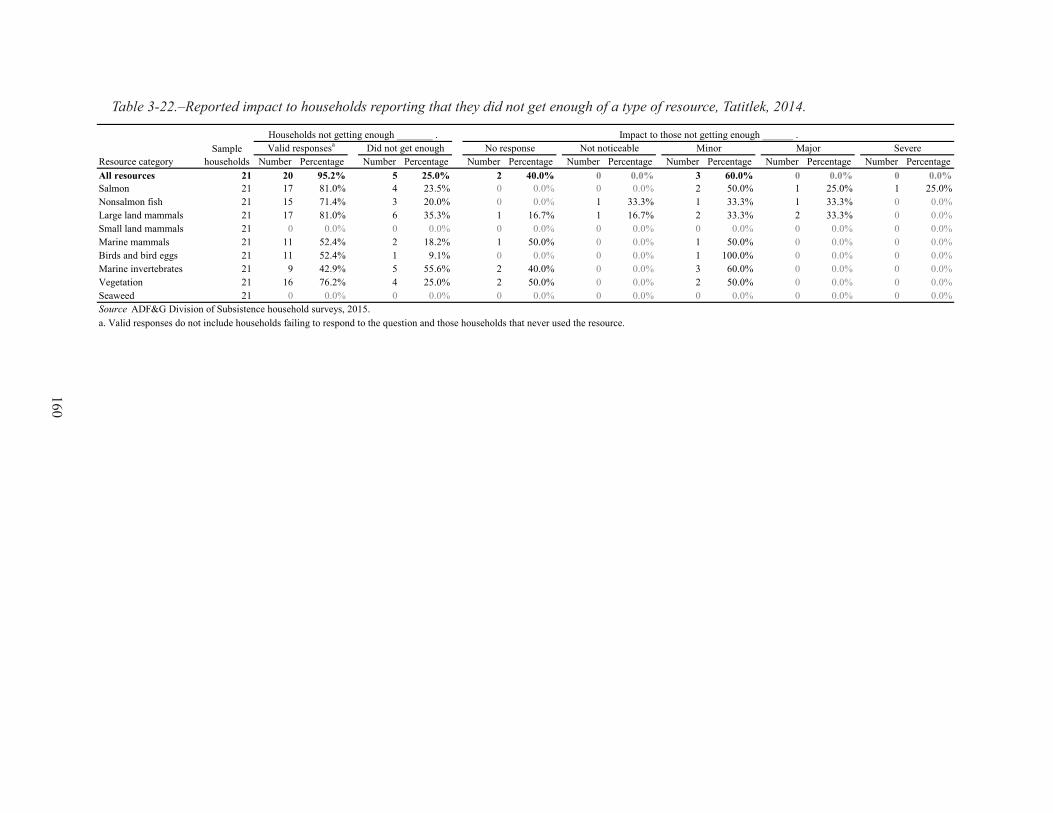
Table 3-22.–Reported impact to households reporting that they did not get enough of a type of resource, Tatitlek, 2014.
Number Percentage Number Percentage Number Percentage Number Percentage Number Percentage Number Percentage Number PercentageAll resources 21 20 95.2% 5 25.0% 2 40.0% 0 0.0% 3 60.0% 0 0.0% 0 0.0%Salmon 21 17 81.0% 4 23.5% 0 0.0% 0 0.0% 2 50.0% 1 25.0% 1 25.0%Nonsalmon fish 21 15 71.4% 3 20.0% 0 0.0% 1 33.3% 1 33.3% 1 33.3% 0 0.0%Large land mammals 21 17 81.0% 6 35.3% 1 16.7% 1 16.7% 2 33.3% 2 33.3% 0 0.0%Small land mammals 21 0 0.0% 0 0.0% 0 0.0% 0 0.0% 0 0.0% 0 0.0% 0 0.0%Marine mammals 21 11 52.4% 2 18.2% 1 50.0% 0 0.0% 1 50.0% 0 0.0% 0 0.0%Birds and bird eggs 21 11 52.4% 1 9.1% 0 0.0% 0 0.0% 1 100.0% 0 0.0% 0 0.0%Marine invertebrates 21 9 42.9% 5 55.6% 2 40.0% 0 0.0% 3 60.0% 0 0.0% 0 0.0%Vegetation 21 16 76.2% 4 25.0% 2 50.0% 0 0.0% 2 50.0% 0 0.0% 0 0.0%Seaweed 21 0 0.0% 0 0.0% 0 0.0% 0 0.0% 0 0.0% 0 0.0% 0 0.0%
a. Valid responses do not include households failing to respond to the question and those households that never used the resource.Source ADF&G Division of Subsistence household surveys, 2015.
Resource categorySample
households
Households not getting enough _______ . Impact to those not getting enough ______ .Valid responsesa Did not get enough No response Not noticeable Minor Major Severe
160
less, and 10% said they used more (Table 3-21; Figure 3-24). When asked why they used less, 50% of respondents reported that they did so due to less sharing, lack of effort, and unsuccessful harvests (Table 3-23). For those households that used more marine mammals in the study year, the reason listed was that the household received more of this kind of resource (Table 3-24). In Tatitlek, 18% of respondents giving a valid response stated that they did not get enough marine mammals (Table 3-22). When asked to evaluate the impact of not getting enough marine mammals, one-half of the households described the impact as minor. Nonsalmon fish was the third most harvested of all subsistence resource categories used by Tatitlek households in 2014 (Figure 3-8). In 2014, many responding households (45%) explained that they used the same amount of nonsalmon fish resources during the study year as they did in previous years, 10% reported that they used more, and 20% said they used less (Table 3-21; Figure 3-24). When asked why they used less, 44% of respondents reported that they did so due to less resource availability (Table 3-23). Other stated reasons for using less nonsalmon fish included lack of effort, less sharing, lack of equipment, and conflicts from work/having no time to harvest. Of those households that used more nonsalmon fish in the study year, the reason listed by a respondent was that the household received more of this resource (Table 3-24). In Tatitlek, 20% of households providing a valid response stated that they did not get enough nonsalmon (Table 3-22). When asked to evaluate the impact of not getting enough nonsalmon fish, 33% described it as not noticeable, 33% described the impact as minor, 33% explained that not getting enough nonsalmon fish had a major effect on their household, and no household stated that the impact was severe. The fourth most harvested resource category by pounds harvested per household was large land mammals (Figure 3-8). In 2014, about one-third (35%) of responding households explained that they used the same amount of large land mammals in 2014 as they did in previous years, 45% used less, and 5% used more (Table 3-21; Figure 3-24). When asked why they used less, 50% of respondents reported that they did so due to less sharing and less resource availability, and 25% of respondents reported that they used less because of lack of effort and family/personal reasons (Table 3-23). For those households that used more large land mammals in the study year, the reasons listed were that households received more and experienced more hunting success (Table 3-24). In Tatitlek, 35% of respondents giving a valid response stated that they did not get enough large land mammals (Table 3-22). When asked to evaluate the impact of not getting enough large land mammals, 33% of the households described the impact as minor and 33% described the impact as major. During the study year, 30% of responding households explained that they used the same amount of marine invertebrates in 2014 as they did in previous years, and 15% reported that they used less of these resources (Table 3-21; Figure 3-24). When asked why they used less, 67% of respondents reported that they did so due to less resource availability, and 33% of respondents reported that they used less because of less sharing and family/personal reasons (Table 3-23). In Tatitlek, 56% of respondents giving a valid response stated that they did not get enough marine invertebrates during the study year (Table 3-22). When asked to evaluate the impact of not getting enough marine invertebrates, 60% of the households described the impact as minor.In 2014, there were 42% of responding households that explained that they used less vegetation during that year as they did in previous years, 32% reported that they used the same amount of these resources, and 11% reported using more vegetation (Table 3-21; Figure 3-24). When asked why they used less vegetation, 43% of respondents reported it was associated with the weather/environment and was due to less vegetation being available, and 14% of respondents reported that they used less because of lack of effort and family/personal reasons (Table 3-23). For those households that used more vegetation in the study year, 50% of respondents reported that there was increased availability of vegetation and that they had more help (Table 3-24). In Tatitlek, 25% of respondents giving a valid response stated that they did not get enough vegetation (Table 3-22). When asked to evaluate the impact of not getting enough vegetation, 50% of the households described the impact as minor.Birds and bird eggs was the resource category with the smallest harvest by pounds per household in 2014. During the study year, approximately 37% of responding households explained that they used the same amount of birds and eggs in 2014 as they did in previous years, 11% reported that they used less of these
161

Table 3-23.–Reasons for less household uses of resources compared to recent years, Tatitlek, 2014.
Number Percentage Number Percentage Number Percentage Number Percentage Number Percentage Number PercentageAny resource 20 16 4 25.0% 10 62.5% 0 0.0% 1 6.3% 3 18.8% 4 25.0%
All resources 20 14 2 14.3% 8 57.1% 0 0.0% 0 0.0% 1 7.1% 0 0.0%Salmon 20 0 0 0.0% 0 0.0% 0 0.0% 0 0.0% 0 0.0% 0 0.0%Nonsalmon fish 19 9 0 0.0% 4 44.4% 0 0.0% 1 11.1% 1 11.1% 2 22.2%Large land mammals 20 4 1 25.0% 2 50.0% 0 0.0% 0 0.0% 2 50.0% 1 25.0%Small land mammals 20 9 2 22.2% 2 22.2% 0 0.0% 0 0.0% 2 22.2% 0 0.0%Marine mammals 20 2 0 0.0% 0 0.0% 0 0.0% 0 0.0% 1 50.0% 1 50.0%Birds and bird eggs 19 2 1 50.0% 0 0.0% 0 0.0% 0 0.0% 1 50.0% 1 50.0%Marine invertebrates 20 3 1 33.3% 2 66.7% 0 0.0% 0 0.0% 1 33.3% 0 0.0%Vegetation 19 7 1 14.3% 3 42.9% 0 0.0% 0 0.0% 0 0.0% 1 14.3%Seaweed 20 0 0 0.0% 0 0.0% 0 0.0% 0 0.0% 0 0.0% 0 0.0%
Table 3-23.–Continued.
Number Percentage Number Percentage Number Percentage Number Percentage Number Percentage Number PercentageAny resource 20 16 3 18.8% 5 31.3% 1 6.3% 5 31.3% 0 0.0% 0 0.0%
All resources 20 14 2 14.3% 2 14.3% 0 0.0% 4 28.6% 0 0.0% 0 0.0%Salmon 20 0 0 0.0% 0 0.0% 0 0.0% 0 0.0% 0 0.0% 0 0.0%Nonsalmon fish 19 9 0 0.0% 0 0.0% 0 0.0% 1 11.1% 0 0.0% 0 0.0%Large land mammals 20 4 0 0.0% 0 0.0% 0 0.0% 0 0.0% 0 0.0% 0 0.0%Small land mammals 20 9 0 0.0% 2 22.2% 1 11.1% 2 22.2% 0 0.0% 0 0.0%Marine mammals 20 2 1 50.0% 0 0.0% 0 0.0% 0 0.0% 0 0.0% 0 0.0%Birds and bird eggs 19 2 0 0.0% 0 0.0% 0 0.0% 0 0.0% 0 0.0% 0 0.0%Marine invertebrates 20 3 0 0.0% 0 0.0% 0 0.0% 0 0.0% 0 0.0% 0 0.0%Vegetation 19 7 0 0.0% 3 42.9% 0 0.0% 0 0.0% 0 0.0% 0 0.0%Seaweed 20 0 0 0.0% 0 0.0% 0 0.0% 0 0.0% 0 0.0% 0 0.0%
Lack of effort
UnsuccessfulWeather/
environment Other reasonsWorking/no time
Lack of equipment
-continued-
-continued-
Households reporting
reasons for less use
Valid responsesa
Less sharing
RegulationsSmall/
diseased animals
Family/personal
Resources less available Too far to travel
Resource category
Resource categoryValid
responsesa
Households reporting
reasons for less use
162

Table 3-23.–Page 2 of 2.
Number Percentage Number Percentage Number Percentage Number Percentage Number PercentageAny resource 20 16 0 0.0% 0 0.0% 0 0.0% 0 0.0% 0 0.0%
All resources 20 14 0 0.0% 0 0.0% 0 0.0% 0 0.0% 0 0.0%Salmon 20 0 0 0.0% 0 0.0% 0 0.0% 0 0.0% 0 0.0%Nonsalmon fish 19 9 0 0.0% 0 0.0% 0 0.0% 0 0.0% 0 0.0%Large land mammals 20 4 0 0.0% 0 0.0% 0 0.0% 0 0.0% 0 0.0%Small land mammals 20 9 0 0.0% 0 0.0% 0 0.0% 0 0.0% 0 0.0%Marine mammals 20 2 0 0.0% 0 0.0% 0 0.0% 0 0.0% 0 0.0%Birds and bird eggs 19 2 0 0.0% 0 0.0% 0 0.0% 0 0.0% 0 0.0%Marine invertebrates 20 3 0 0.0% 0 0.0% 0 0.0% 0 0.0% 0 0.0%Vegetation 19 7 0 0.0% 0 0.0% 0 0.0% 0 0.0% 0 0.0%Seaweed 20 0 0 0.0% 0 0.0% 0 0.0% 0 0.0% 0 0.0%
Resource categoryValid
responsesa
Households reporting
reasons for less use
Competition Used other resources
Source ADF&G Division of Subsistence household surveys, 2015.a. Valid responses do not include households that did not provide any response and households reporting never using the resource.
Did not needEquipment/fuel expenseDid not get enough
163
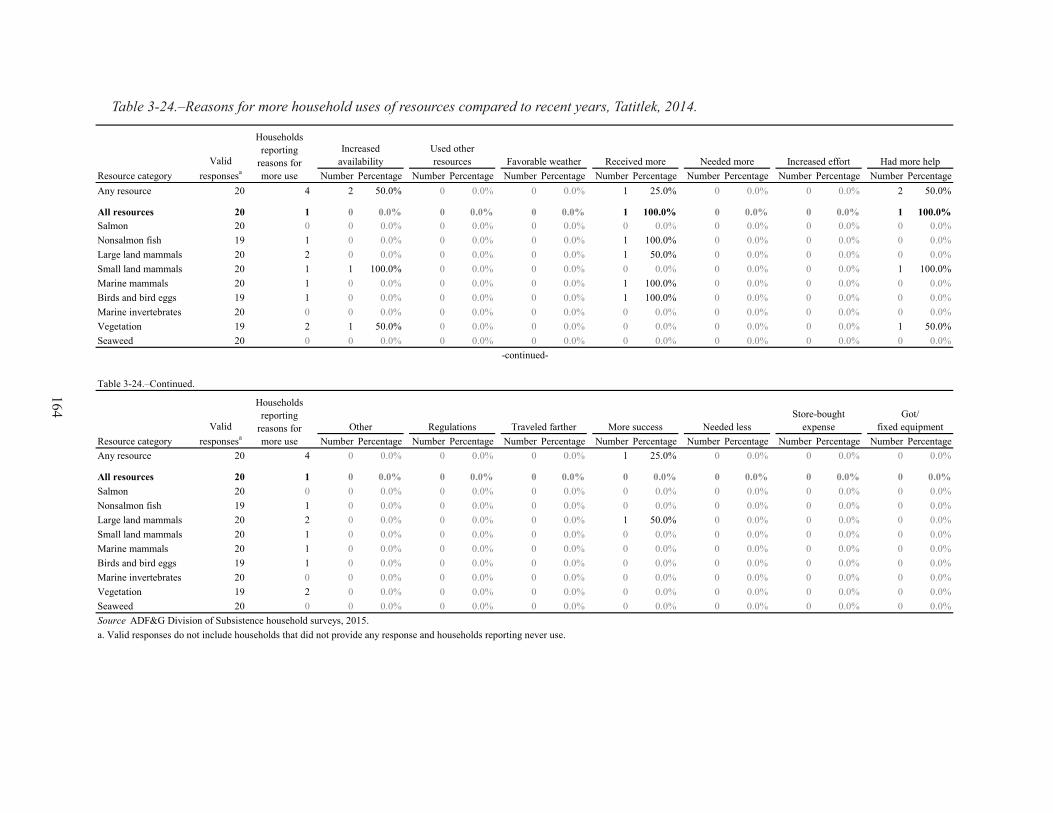
Table 3-24.–Reasons for more household uses of resources compared to recent years, Tatitlek, 2014.
Number Percentage Number Percentage Number Percentage Number Percentage Number Percentage Number Percentage Number PercentageAny resource 20 4 2 50.0% 0 0.0% 0 0.0% 1 25.0% 0 0.0% 0 0.0% 2 50.0%
All resources 20 1 0 0.0% 0 0.0% 0 0.0% 1 100.0% 0 0.0% 0 0.0% 1 100.0%Salmon 20 0 0 0.0% 0 0.0% 0 0.0% 0 0.0% 0 0.0% 0 0.0% 0 0.0%Nonsalmon fish 19 1 0 0.0% 0 0.0% 0 0.0% 1 100.0% 0 0.0% 0 0.0% 0 0.0%Large land mammals 20 2 0 0.0% 0 0.0% 0 0.0% 1 50.0% 0 0.0% 0 0.0% 0 0.0%Small land mammals 20 1 1 100.0% 0 0.0% 0 0.0% 0 0.0% 0 0.0% 0 0.0% 1 100.0%Marine mammals 20 1 0 0.0% 0 0.0% 0 0.0% 1 100.0% 0 0.0% 0 0.0% 0 0.0%Birds and bird eggs 19 1 0 0.0% 0 0.0% 0 0.0% 1 100.0% 0 0.0% 0 0.0% 0 0.0%Marine invertebrates 20 0 0 0.0% 0 0.0% 0 0.0% 0 0.0% 0 0.0% 0 0.0% 0 0.0%Vegetation 19 2 1 50.0% 0 0.0% 0 0.0% 0 0.0% 0 0.0% 0 0.0% 1 50.0%Seaweed 20 0 0 0.0% 0 0.0% 0 0.0% 0 0.0% 0 0.0% 0 0.0% 0 0.0%
Number Percentage Number Percentage Number Percentage Number Percentage Number Percentage Number Percentage Number PercentageAny resource 20 4 0 0.0% 0 0.0% 0 0.0% 1 25.0% 0 0.0% 0 0.0% 0 0.0%
All resources 20 1 0 0.0% 0 0.0% 0 0.0% 0 0.0% 0 0.0% 0 0.0% 0 0.0%Salmon 20 0 0 0.0% 0 0.0% 0 0.0% 0 0.0% 0 0.0% 0 0.0% 0 0.0%Nonsalmon fish 19 1 0 0.0% 0 0.0% 0 0.0% 0 0.0% 0 0.0% 0 0.0% 0 0.0%Large land mammals 20 2 0 0.0% 0 0.0% 0 0.0% 1 50.0% 0 0.0% 0 0.0% 0 0.0%Small land mammals 20 1 0 0.0% 0 0.0% 0 0.0% 0 0.0% 0 0.0% 0 0.0% 0 0.0%Marine mammals 20 1 0 0.0% 0 0.0% 0 0.0% 0 0.0% 0 0.0% 0 0.0% 0 0.0%Birds and bird eggs 19 1 0 0.0% 0 0.0% 0 0.0% 0 0.0% 0 0.0% 0 0.0% 0 0.0%Marine invertebrates 20 0 0 0.0% 0 0.0% 0 0.0% 0 0.0% 0 0.0% 0 0.0% 0 0.0%Vegetation 19 2 0 0.0% 0 0.0% 0 0.0% 0 0.0% 0 0.0% 0 0.0% 0 0.0%Seaweed 20 0 0 0.0% 0 0.0% 0 0.0% 0 0.0% 0 0.0% 0 0.0% 0 0.0%
-continued-
a. Valid responses do not include households that did not provide any response and households reporting never use.
Store-bought expense
Got/fixed equipment
Resource categoryValid
responsesa
Households reporting
reasons for more use
Regulations
Received moreResource category
Valid responsesa
Traveled farther More success Needed less
Source ADF&G Division of Subsistence household surveys, 2015.
Other
Needed more Increased effortUsed other resources Favorable weather
Table 3-24.–Continued.
Households reporting
reasons for more use
Increased availability Had more help
164

Table 3-25.–Resources that households reported needing, Tatitlek, 2014.
Salmon 2 9.5%Coho salmon 2 9.5%Chinook salmon 1 4.8%Sockeye salmon 3 14.3%Pacific herring 1 4.8%Pacific halibut 1 4.8%Yelloweye rockfish 1 4.8%Deer 5 23.8%Mountain goat 1 4.8%Seal 1 4.8%Steller sea lion 2 9.5%Clams 2 9.5%Cockles 2 9.5%Octopus 2 9.5%Berries 1 4.8%Blueberry 3 14.3%Highbush cranberry 1 4.8%Salmonberry 2 9.5%
Households needing
Percentage of households Resource
Source ADF&G Division of Subsistence household surveys, 2015.
resources, and 11% reported that they used more (Table 3-21; Figure 3-24). When asked why they used less, 50% of respondents reported that they did so due to less sharing, lack of effort, and family/personal reasons (Table 3-23). Of those households that used more birds and eggs in the study year, the reason listed was that household received more during the study year (Table 3-24). In Tatitlek, 9% of respondents giving a valid response stated that they did not get enough birds and eggs (Table 3-22). When asked to evaluate the impact of not getting enough birds and eggs, the household described the impact as minor.In 2014, overall for all resources, 25% of responding households explained that they used the same amount of all resources during the study year as they did in previous years, 70% reported that they used less, and 5% said they used more (Table 3-21). When asked why they used less, 57% of respondents reported that they did so because there were less resources available, 29% cited the reason to be working/no time, and 14% cited either weather/environmental, unsuccessful harvest effort, or family/personal reasons (Table 3-23). Finally, 7% of households cited less sharing as a reason for using less of all resources during the study year. The 2 reasons cited for explaining more use of resources overall were: received more resources and had more help (Table 3-24). In Tatitlek, 25% of respondents stated that they did not get enough of all resources (Table 3-22). When asked to evaluate the impact of not getting enough, more than one-half (60%) of households described the impact as minor.Tatitlek households were asked which resources they needed more of in 2014. The resource cited by the largest percentage (24%) of households was deer (Table 3-25). Following deer, approximately 14% of households said they needed both more sockeye salmon and blueberries. Next, approximately 10% of households cited needing more coho salmon, Steller sea lion, clams, cockles, octopuses, and salmonberries. Finally, 5% of households cited needing more Chinook salmon, Pacific herring, Pacific halibut, yelloweye rockfish, mountain goats, harbor seals, and highbush cranberries.
165

Harvest DataChanges in the harvest of resources by Tatitlek residents can also be discerned through comparisons with findings from other study years in which comprehensive harvest surveys were conducted in Tatitlek. Comprehensive harvest surveys were conducted in Tatitlek in 1987, 1988, 1989, 1990, 1991, 1993, 1997, 2003, and 2014. Marine mammal harvests were also estimated in all years between 1993 and 2008, except for 1999, as well as in 2014 as part of this survey.6
The pounds of usable weight harvested per capita was 352 lb in 1987 and 294 lb in 2014 (Figure 3-26; Table 3-26).The lowest recorded per capita harvest estimate between these years was 153 lb in 1990, immediately following the Exxon Valdez oil spill (EVOS). The highest per capita harvest was estimated in 1988 at 644 lb.Post-oil spill per capita annual harvests for all resources combined appear, in many years, to have generally rebounded to nearly pre-spill harvest levels (Figure 3-26); however, the composition of the harvest has changed (Table 3-27). Harvest composition change can be discerned through a comparison of the changed percentage of total harvest by resource category between the 1989 and the 2014 estimates. The most significant change in the harvest composition is that land mammals contributed only nearly 8% of the harvest in 2014 compared to approximately 11–24% of the harvest in study years during the 1980s and 1990s. The decline of the land mammal harvest as a proportion of the total harvest is offset most significantly by increased proportions of the harvest being represented by marine mammals, nonsalmon fish, and marine invertebrates (Table 3-27). Marine mammals contributed an additional 10% to the total harvest in 2014 compared to 1989, and nonsalmon fish and marine invertebrates each contributed approximately an additional 6% to the total harvest in 2014 compared to 1989. The harvest of marine mammals increased substantially since the years immediately following EVOS. In 1989, the per capita marine mammals harvest was 48 lb. In 2003, the per capita marine mammals harvest was 100 lb. Similarly, in 2014 the approximate per capita marine mammals harvest was 97 lb (Table 3-26; Figure 3-27). Up until study year 2014, nonsalmon fish harvests had, for the most part, increased annually since 1989 when the spill occurred. In 1989, the per capita harvest of nonsalmon fish was 17 lb, in 1993 it was 38 lb, in 1997 it was 66 lb, in 2003 it was 77 lb, and in 2014 the per capita harvest of nonsalmon fish dropped to 42 lb. The harvest of marine invertebrates also increased considerably. In 1989, the per capita harvest of marine invertebrates was less than 1 lb, in 1993 it was almost 10 lb, in 1997 it was approximately 19 lb, in 2003 it dropped back to less than 1 lb7, but in 2014 the per capita harvest of marine invertebrates increased to 17 lb.
6. Results for both comprehensive and marine mammal subsistence harvest surveys are available in the CSIS. The survey months for each study year are noted in the CSIS project year “Methods” section. Additionally, comprehensive subsistence survey results for selected study years are reported in Fall (1997, 2006), Fall et al. (1996), and Fall and Utermohle (1995b, 1999); the marine mammal subsistence harvest results for 1994 are not available in the CSIS but are published in Wolfe and Mishler (1995).7. According to page 67 in Fall (2006): “This decline may, in part, be an artifact of some households refusing to provide harvest data in 2003, but it is also reflects a real decline in the availability of most marine invertebrate species. In the 2003 survey, many more households reported using and receiving clams and octopuses than harvesting them, indicating that households either did not report all of their harvest or that these resources came from outside the community.”
166

Figure 3-26.–Estimated per capita harvests in pounds usable weight, Tatitlek, 1987, 1988, 1989, 1990, 1991, 1993, 1997, 2003, and 2014.
0
100
200
300
400
500
600
700
1987 1988 1989 1990 1991 1993 1997 2003 2014
Poun
ds u
sabl
e w
eigh
t per
cap
ita
Study year
167
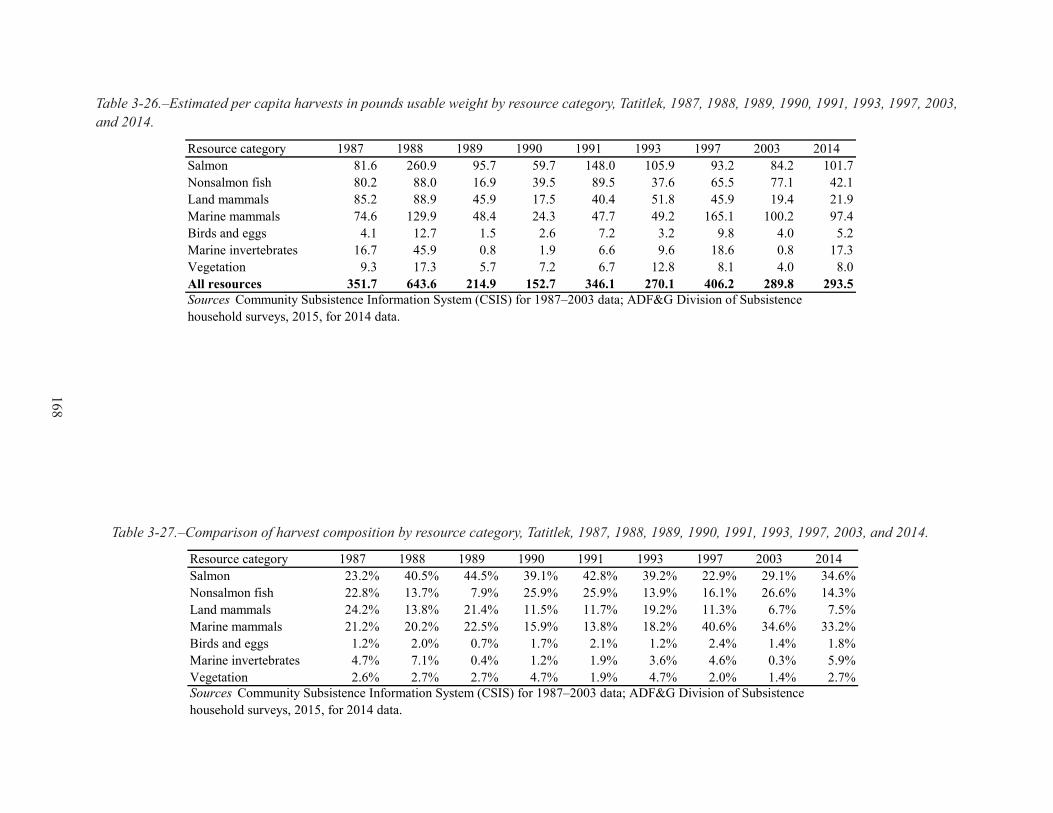
Table 3-26.–Estimated per capita harvests in pounds usable weight by resource category, Tatitlek, 1987, 1988, 1989, 1990, 1991, 1993, 1997, 2003, and 2014.
Table 3-27.–Comparison of harvest composition by resource category, Tatitlek, 1987, 1988, 1989, 1990, 1991, 1993, 1997, 2003, and 2014.
Resource category 1987 1988 1989 1990 1991 1993 1997 2003 2014Salmon 81.6 260.9 95.7 59.7 148.0 105.9 93.2 84.2 101.7Nonsalmon fish 80.2 88.0 16.9 39.5 89.5 37.6 65.5 77.1 42.1Land mammals 85.2 88.9 45.9 17.5 40.4 51.8 45.9 19.4 21.9Marine mammals 74.6 129.9 48.4 24.3 47.7 49.2 165.1 100.2 97.4Birds and eggs 4.1 12.7 1.5 2.6 7.2 3.2 9.8 4.0 5.2Marine invertebrates 16.7 45.9 0.8 1.9 6.6 9.6 18.6 0.8 17.3Vegetation 9.3 17.3 5.7 7.2 6.7 12.8 8.1 4.0 8.0All resources 351.7 643.6 214.9 152.7 346.1 270.1 406.2 289.8 293.5Sources Community Subsistence Information System (CSIS) for 1987–2003 data; ADF&G Division of Subsistence household surveys, 2015, for 2014 data.
Resource category 1987 1988 1989 1990 1991 1993 1997 2003 2014Salmon 23.2% 40.5% 44.5% 39.1% 42.8% 39.2% 22.9% 29.1% 34.6%Nonsalmon fish 22.8% 13.7% 7.9% 25.9% 25.9% 13.9% 16.1% 26.6% 14.3%Land mammals 24.2% 13.8% 21.4% 11.5% 11.7% 19.2% 11.3% 6.7% 7.5%Marine mammals 21.2% 20.2% 22.5% 15.9% 13.8% 18.2% 40.6% 34.6% 33.2%Birds and eggs 1.2% 2.0% 0.7% 1.7% 2.1% 1.2% 2.4% 1.4% 1.8%Marine invertebrates 4.7% 7.1% 0.4% 1.2% 1.9% 3.6% 4.6% 0.3% 5.9%Vegetation 2.6% 2.7% 2.7% 4.7% 1.9% 4.7% 2.0% 1.4% 2.7%Sources Community Subsistence Information System (CSIS) for 1987–2003 data; ADF&G Division of Subsistence household surveys, 2015, for 2014 data.
168
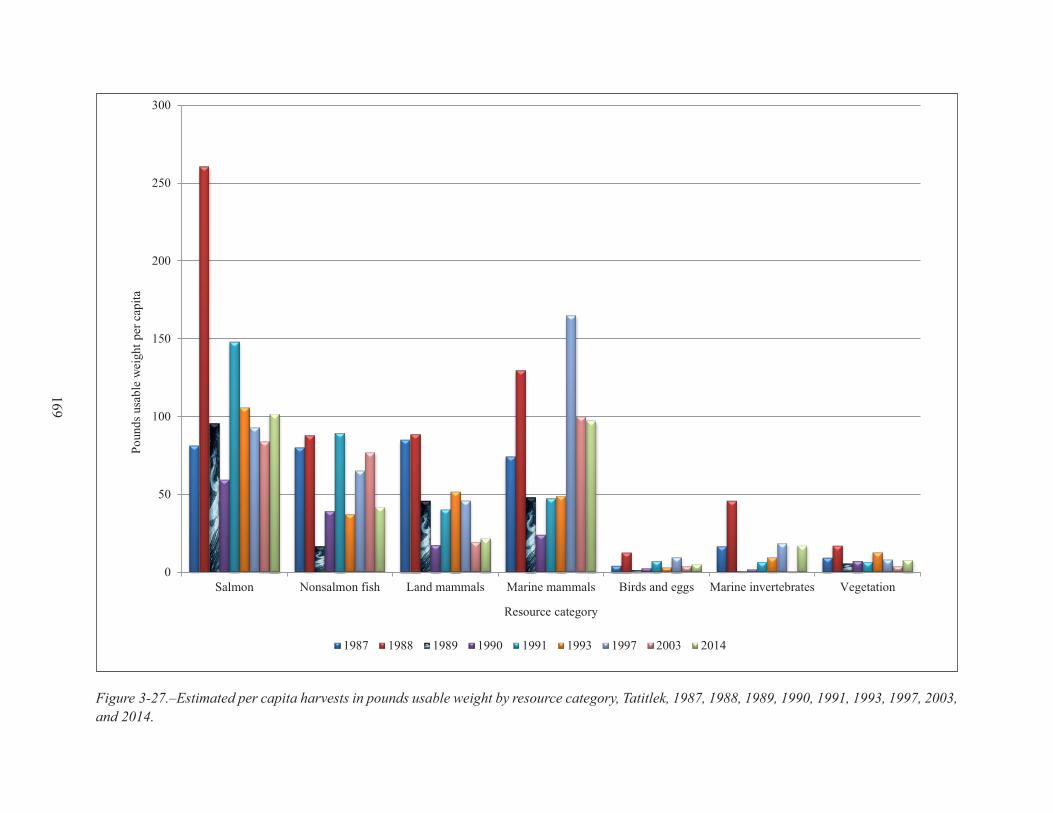
Figure 3-27.–Estimated per capita harvests in pounds usable weight by resource category, Tatitlek, 1987, 1988, 1989, 1990, 1991, 1993, 1997, 2003, and 2014.
0
50
100
150
200
250
300
Salmon Nonsalmon fish Land mammals Marine mammals Birds and eggs Marine invertebrates Vegetation
Poun
ds u
sabl
e w
eigh
t per
cap
ita
Resource category
1987 1988 1989 1990 1991 1993 1997 2003 2014
169

Natural Resource Conditions
Food SafetyHouseholds participating in this survey were asked about the perceived safety of eating Pacific herring, harbor seals, chitons, and clams. A large percentage of respondents perceived the resources to be safe to eat. More than 90% of valid responses reported harbor seals to be safe, and approximately 70% reported Pacific herring, chitons, and clams to be safe (Table 3-28). Similarly, a high level of confidence in resource safety was also expressed in study year 2003, although those percentages had decreased from a 1997 assessment (Fall and Utermohle 1999; Fall 2006:82). In 2003, approximately 80% felt that seals and chitons were safe to eat, compared to 93% and 100%, respectively, in 1997. Also, during 2003, approximately 70% felt that clams and Pacific herring were safe to eat, compared to 85% and 93%, respectively, in 1997.Confidence in the safety of these resources increased overall since 2003, but do not quite reach all confidence levels reported in 1997. In 2014, those who attended the community review meeting expressed concern regarding the 2015 west coast algal blooms and the possible effects of radiation from the Fukushima Daiichi energy accident, although these responses were not captured in the survey responses. No other reasons were given as to why some felt Pacific herring was unsafe to eat (Table 3-29).
Status of Resource PopulationsThe majority of respondents from Tatitlek reported that subsistence resources had not recovered since EVOS (Table 3-30). More than 60% of respondents felt that subsistence resources had not recovered, while nearly 40% of respondents reported that they had. The percentage of those who believe resources have not recovered has decreased from 72% in 2003 (Fall 2006:70).Those who responded that resources had not recovered suggested ideas for how resource populations can be helped to recover (Table 3-31). The most common suggestion was resources would recover with time (20%). This was followed by suggestions of additional clean-up efforts (10%), harvest regulations and management of resources (10%), restoration and enhancement projects (10%), and the reduction or elimination of oil pollution sources (10%). Others did not have any suggestions (20%), suggested something else (10%), or did not know what could help (30%). No one reported feeling as though nothing could be done. Some of the 2003 comments relating to resource recovery echo the suggestions made during the current study year, including spill prevention and additional research on species populations, among other actions.The survey included questions regarding household assessment of change in resource availability as compared to 10 years ago for several species (Table 3-32). Overall, the majority of respondents felt that resource availability has either remained the same or decreased. In 2014, the majority (58%) of Tatitlek respondents felt that the availability of Pacific herring populations decreased compared to 10 years ago; one-quarter of respondents (25%) felt that Pacific herring availability increased; and 17% of respondents thought the resource availability remained the same. Of those who considered Pacific herring to be less available compared to 10 years ago, 43% attributed the decline to stock or population status, while 14% felt this to be the result of contamination from EVOS (Table 3-33). Another reason identified by respondents for a decline in the availability of Pacific herring included general change (14% of respondents), or respondents did not know the cause (29%). Of those who felt that the availability of Pacific herring increased, 100% of respondents believed this to be due to stock or population status increase (Table 3-34). The majority (64%) of Tatitlek respondents felt that the availability of Pacific halibut remained the same in 2014 compared to 10 years ago (Table 3-32). Approximately 36% of respondents felt that Pacific halibut was less available. No one believed the availability of Pacific halibut had increased. The respondents (36%) who felt that Pacific halibut was less available thought that this was due to stock or population status (50% of respondents who thought there was less Pacific halibut), contamination from the oil spill (25%), or the result of competition or overharvest (25%) (Table 3-33).
170

Table 3-28.–Household assessments of the safety of eating Pacific herring, harbor seals, chitons, and clams harvested in traditional locations, Tatitlek, 2014.
Table 3-29.–Reasons why Pacific herring, harbor seals, chitons, and clams are not safe to eat, Tatitlek, 2014.
Number Percentage Number Percentage Number Percentage Number Percentage Number Percentage Number PercentagePacific herring 27 5.1 19.0% 3.9 14.3% 18.0 66.7% 12.9 71.4% 3.9 21.4% 1.3 7.1%Harbor seal 27 7.7 28.6% 5.1 19.0% 14.1 52.4% 12.9 90.9% 0.0 0.0% 1.3 9.1%Chitons (bidarkis, gumboots) 27 7.7 28.6% 6.4 23.8% 12.9 47.6% 9.0 70.0% 0.0 0.0% 3.9 30.0%Clams 27 7.7 28.6% 6.4 23.8% 12.9 47.6% 9.0 70.0% 0.0 0.0% 3.9 30.0%
a. Valid responses include only households that answered "safe," "not safe," or "do not know" to the question.b. Computed as a percentage of valid responses.c. Computed as a percentage of estimated households.
Do not knowbNot safebSafebValid responsesa, cMissingcDo not usecEstimated householdsResource
Source ADF&G Division of Subsistence household surveys, 2015.
Number Percentage Number Percentage Number Percentage Number Percentage Number Percentage Number PercentagePacific herring 3.9 21.4% 0.0 0.0% 0.0 0.0% 0.0 0.0% 0.0 0.0% 0.0 0.0%Harbor seal 0.0 0.0% 0.0 0.0% 0.0 0.0% 0.0 0.0% 0.0 0.0% 0.0 0.0%Chitons (bidarkis, gumboots) 0.0 0.0% 0.0 0.0% 0.0 0.0% 0.0 0.0% 0.0 0.0% 0.0 0.0%Clams 0.0 0.0% 0.0 0.0% 0.0 0.0% 0.0 0.0% 0.0 0.0% 0.0 0.0%
Number Percentage Number Percentage Number Percentage Number Percentage Number PercentagePacific herring 3.9 21.4% 0.0 0.0% 0.0 0.0% 0.0 0.0% 3.9 100.0%Harbor seal 0.0 0.0% 0.0 0.0% 0.0 0.0% 0.0 0.0% 0.0 0.0%Chitons (bidarkis, gumboots) 0.0 0.0% 0.0 0.0% 0.0 0.0% 0.0 0.0% 0.0 0.0%Clams 0.0 0.0% 0.0 0.0% 0.0 0.0% 0.0 0.0% 0.0 0.0%Source ADF&G Division of Subsistence household surveys, 2015.a. Computed as a percentage of households that indicated resources were not safe to eat.
Table 3-29.–Continued.
Resource
Resource is not safe to eat Resource condition
Caused illness or reaction Other reason
Reasons why respondents believe _____ are not safe to eat.a
Missing
Non-EVOS contamination
-continued-
Resource
Resource is not safe to eat
Poor or missing information Agency advice
Paralytic shellfish poisoning
Reasons why respondents believe _____ are not safe to eat.a
EVOS contamination
171

Table 3-30.–Household assessments of the recovery of subsistence resources since the oil spill, Tatitlek, 2014.
Number Percentage Number Percentage Number Percentage Number Percentage Number Percentage
Tatitlek 27 3.9 14.3% 2.6 9.5% 20.6 76.2% 7.7 37.5% 12.9 62.5%
Have subsistence resources recovered since the Exxon Valdez oil spill?
Missinga Do not knowa Yesb NobValid responsesa, c
CommunityCommunity households
a. Computed as a percentage of estimated community households.
Prince William Sound
Source ADF&G Division of Subsistence household surveys, 2015.
b. Computed as a percentage of valid responses.c. Valid responses include only households that gave a "yes" or "no" response to the question.
172
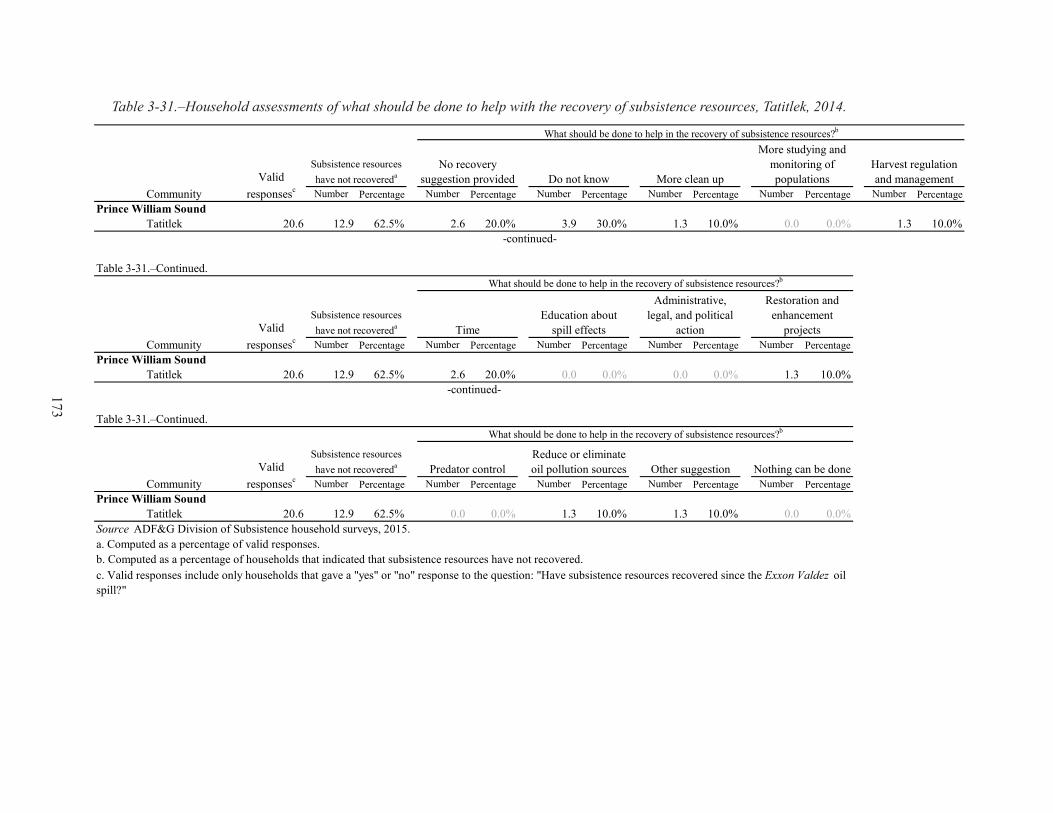
Number Percentage Number Percentage Number Percentage Number Percentage Number Percentage Number Percentage
Tatitlek 20.6 12.9 62.5% 2.6 20.0% 3.9 30.0% 1.3 10.0% 0.0 0.0% 1.3 10.0%
Number Percentage Number Percentage Number Percentage Number Percentage Number Percentage
Tatitlek 20.6 12.9 62.5% 2.6 20.0% 0.0 0.0% 0.0 0.0% 1.3 10.0%
Number Percentage Number Percentage Number Percentage Number Percentage Number Percentage
Tatitlek 20.6 12.9 62.5% 0.0 0.0% 1.3 10.0% 1.3 10.0% 0.0 0.0%Source ADF&G Division of Subsistence household surveys, 2015.a. Computed as a percentage of valid responses.b. Computed as a percentage of households that indicated that subsistence resources have not recovered.c. Valid responses include only households that gave a "yes" or "no" response to the question: "Have subsistence resources recovered since the Exxon Valdez oil spill?"
Prince William Sound
Education about spill effects
Predator controlReduce or eliminate oil pollution sources
-continued-
Table 3-31.–Continued.
CommunityValid
responsesc
Subsistence resources have not recovereda Other suggestion Nothing can be done
What should be done to help in the recovery of subsistence resources?b
-continued-
CommunityValid
responsesc
Subsistence resources have not recovereda
Administrative, legal, and political
action
Restoration and enhancement
projects
What should be done to help in the recovery of subsistence resources?bTable 3-31.–Continued.
Prince William Sound
Time
More clean up
More studying and monitoring of populations
Harvest regulation and management
What should be done to help in the recovery of subsistence resources?b
Prince William SoundCommunity
No recovery suggestion provided Do not knowValid
responsesc
Subsistence resources have not recovereda
Table 3-31.–Household assessments of what should be done to help with the recovery of subsistence resources, Tatitlek, 2014.
173

Table 3-32.–Household assessments of change in resource availability compared to 10 years ago, Tatitlek, 2014.
Number Percentage Number Percentage Number Percentage Number PercentagePacific herring 27 10.3 38.1% 1.3 4.8% 25.7 95.2% 15.4 60.0%Pacific halibut 27 11.6 42.9% 1.3 4.8% 25.7 95.2% 14.1 55.0%Harbor seal 27 16.7 61.9% 1.3 4.8% 25.7 95.2% 9.0 35.0%Ducks 27 20.6 76.2% 1.3 4.8% 25.7 95.2% 5.1 20.0%Chitons (bidarkis, gumboots) 27 20.6 76.2% 1.3 4.8% 25.7 95.2% 5.1 20.0%Clams 27 20.6 76.2% 1.3 4.8% 25.7 95.2% 5.1 20.0%
Number Percentage Number Percentage Number PercentagePacific herring 27 9.0 58.3% 2.6 16.7% 3.9 25.0%Pacific halibut 27 5.1 36.4% 9.0 63.6% 0.0 0.0%Harbor seal 27 1.3 14.3% 6.4 71.4% 1.3 14.3%Ducks 27 2.6 50.0% 2.6 50.0% 0.0 0.0%Chitons (bidarkis, gumboots) 27 0.0 0.0% 3.9 75.0% 1.3 25.0%Clams 27 2.6 50.0% 1.3 25.0% 1.3 25.0%
a. Computed as a percentage of estimated households.b. Computed as a percentage of households that were in the community 10 years ago.c. Computed as a percentage of valid responses.d. Valid responses include only those households that were in the community 10 years ago and that responded that resource availability was either less, the same, or more compared to 10 years ago.
Source ADF&G Division of Subsistence household surveys, 2015.
Estimated householdsResource
In communitya
-continued-
Estimated householdsResource
Table 3-32.–Continued.
Valid responsesb, dNot in communityaNo responsea
Lessc Samec Morec
174

Table 3-33.–Reasons for less resource availability compared to 10 years ago, Tatitlek, 2014.
Number Percentage Number Percentage Number Percentage Number Percentage Number PercentagePacific herring 9.0 58.3% 1.3 14.3% 0.0 0.0% 0.0 0.0% 3.9 42.9%Pacific halibut 5.1 36.4% 1.3 25.0% 0.0 0.0% 0.0 0.0% 2.6 50.0%Harbor seal 1.3 14.3% 0.0 0.0% 0.0 0.0% 0.0 0.0% 1.3 100.0%Ducks 2.6 50.0% 1.3 50.0% 0.0 0.0% 0.0 0.0% 1.3 50.0%Chitons (bidarkis, gumboots) 0.0 0.0% 0.0 0.0% 0.0 0.0% 0.0 0.0% 0.0 0.0%Clams 2.6 50.0% 1.3 50.0% 0.0 0.0% 0.0 0.0% 0.0 0.0%
Number Percentage Number Percentage Number Percentage Number Percentage Number PercentagePacific herring 9.0 58.3% 0.0 0.0% 0.0 0.0% 0.0 0.0% 0.0 0.0%Pacific halibut 5.1 36.4% 0.0 0.0% 1.3 25.0% 0.0 0.0% 0.0 0.0%Harbor seal 1.3 14.3% 0.0 0.0% 0.0 0.0% 0.0 0.0% 0.0 0.0%Ducks 2.6 50.0% 0.0 0.0% 0.0 0.0% 0.0 0.0% 0.0 0.0%Chitons (bidarkis, gumboots) 0.0 0.0% 0.0 0.0% 0.0 0.0% 0.0 0.0% 0.0 0.0%Clams 2.6 50.0% 0.0 0.0% 0.0 0.0% 1.3 50.0% 0.0 0.0%
Number Percentage Number Percentage Number Percentage Number Percentage Number PercentagePacific herring 9.0 58.3% 1.3 14.3% 0.0 0.0% 2.6 28.6% 0.0 0.0%Pacific halibut 5.1 36.4% 0.0 0.0% 0.0 0.0% 0.0 0.0% 0.0 0.0%Harbor seal 1.3 14.3% 0.0 0.0% 0.0 0.0% 0.0 0.0% 0.0 0.0%Ducks 2.6 50.0% 1.3 50.0% 0.0 0.0% 1.3 50.0% 0.0 0.0%Chitons (bidarkis, gumboots) 0.0 0.0% 0.0 0.0% 0.0 0.0% 0.0 0.0% 0.0 0.0%Clams 2.6 50.0% 0.0 0.0% 0.0 0.0% 0.0 0.0% 0.0 0.0%
-continued-
Table 3-33.–Continued.
Source ADF&G Division of Subsistence household surveys, 2015.a. The number of households that were in the community 10 years ago and responded that resource availability was LESS than it was 10 years ago.b. Computed as a percentage of valid responses.
Table 3-33.–Continued.
Resource
Resource
Responsesa, bManagement or
regulationscCompetition or
overharvestcEnvironmental
conditions or predationc Economic conditionsc
Stock or population statusc
Paralytic shellfish poisoningc
Non-EVOS contaminationcEVOS contaminationcResponsesa, b
-continued-
c. Computed as a percentage of responses.
Responsesa, b General or otherc Not relevantc Do not knowc No reason givenc
Resource
175

Table 3-34.–Reasons for more resource availability compared to 10 years ago, Tatitlek, 2014.
Number Percentage Number Percentage Number Percentage Number Percentage Number PercentagePacific herring 3.9 25.0% 0.0 0.0% 0.0 0.0% 0.0 0.0% 3.9 100.0%Pacific halibut 0.0 0.0% 0.0 0.0% 0.0 0.0% 0.0 0.0% 0.0 0.0%Harbor seal 1.3 14.3% 0.0 0.0% 0.0 0.0% 0.0 0.0% 1.3 100.0%Ducks 0.0 0.0% 0.0 0.0% 0.0 0.0% 0.0 0.0% 0.0 0.0%Chitons (bidarkis, gumboots) 1.3 25.0% 0.0 0.0% 0.0 0.0% 0.0 0.0% 1.3 100.0%Clams 1.3 25.0% 0.0 0.0% 0.0 0.0% 0.0 0.0% 1.3 100.0%
Number Percentage Number Percentage Number Percentage Number Percentage Number PercentagePacific herring 3.9 25.0% 0.0 0.0% 0.0 0.0% 0.0 0.0% 0.0 0.0%Pacific halibut 0.0 0.0% 0.0 0.0% 0.0 0.0% 0.0 0.0% 0.0 0.0%Harbor seal 1.3 14.3% 0.0 0.0% 0.0 0.0% 0.0 0.0% 0.0 0.0%Ducks 0.0 0.0% 0.0 0.0% 0.0 0.0% 0.0 0.0% 0.0 0.0%Chitons (bidarkis, gumboots) 1.3 25.0% 0.0 0.0% 0.0 0.0% 0.0 0.0% 0.0 0.0%Clams 1.3 25.0% 0.0 0.0% 0.0 0.0% 1.3 100.0% 0.0 0.0%
Number Percentage Number Percentage Number Percentage Number Percentage Number PercentagePacific herring 3.9 25.0% 0.0 0.0% 0.0 0.0% 0.0 0.0% 0.0 0.0%Pacific halibut 0.0 0.0% 0.0 0.0% 0.0 0.0% 0.0 0.0% 0.0 0.0%Harbor seal 1.3 14.3% 0.0 0.0% 0.0 0.0% 0.0 0.0% 0.0 0.0%Ducks 0.0 0.0% 0.0 0.0% 0.0 0.0% 0.0 0.0% 0.0 0.0%Chitons (bidarkis, gumboots) 1.3 25.0% 0.0 0.0% 0.0 0.0% 0.0 0.0% 0.0 0.0%Clams 1.3 25.0% 0.0 0.0% 0.0 0.0% 0.0 0.0% 0.0 0.0%
EVOS contaminationcNon-EVOS
contaminationcParalytic shellfish
poisoningc
-continued-
Table 3-34.–Continued.
Responsesa, b
Economic conditionsc
Stock or population statusc
Resource
-continued-
ResourceResponsesa, b
Management or regulationsc
Competition or overharvestc
Environmental conditions or predationc
c. Computed as a percentage of responses.
No reason givencTable 3-34.–Continued.
Source ADF&G Division of Subsistence household surveys, 2015.a. The number of households that were in the community 10 years ago and responded that resource availability was MORE than it was 10 years ago.b. Computed as a percentage of valid responses.
ResourceResponsesa, b General or otherc Not relevantc Do not knowc
176

In 2014, approximately 71% of respondents in Tatitlek felt that harbor seal availability remained the same compared to 10 years ago while 14% felt that their availability had increased, and 14% felt availability had decreased (Table 3-32). The increased availability of harbor seals was attributed to stock or population status (Table 3-34). The respondent who considered that the availability of harbor seals had decreased compared to 10 years ago attributed the decline to stock or population status (Table 3-33). Regarding ducks, 50% of Tatitlek respondents said that availability of ducks was the same in 2014 compared to 10 years ago, and 50% said it decreased (Table 3-32). No respondents believed the availability of ducks increased compared to the past 10 years. Even percentages of respondents believed the decline in availability was due to contamination from the oil spill (50%), stock or population status (50%), general change (50%), or indicated that they did not know the reasons for the decline (50%) (Table 3-33).The availability of chitons (also known as bidarkis or gumboots) was considered to have remained the same compared to 10 years ago by a majority (75%) of Tatitlek respondents in 2014, while 25% believed availability increased (Table 3-32). Chitons are the only species for which no respondents felt availability had declined. The belief that the availability of chitons had increased was attributed to a change in the stock or population status (Table 3-34).Regarding the availability of clams in 2014, the majority of Tatitlek respondents (50%) felt their availability had decreased, 25% felt their availability had increased, and 25% felt they had remained the same compared to 10 years ago (Table 3-32). Increased availability of clams was attributed to environmental conditions or predation (100%), and changes of the stock or population status (Table 3-34). In comparison, the respondents who felt the availability of clams had decreased believed this was due to environmental conditions or predation (50%), and contamination from the oil spill (50%) (Table 3-33).
Social and Economic Conditions
Young Adults’ Involvement in Subsistence ActivitiesPart of this survey effort was to determine if Tatitlek community members believe that young adults are learning enough hunting, fishing, and processing skills. During the 2014 survey, approximately 60% of respondents from Tatitlek believed that young adults were not learning enough hunting, fishing, and processing skills, while almost 40% felt that they were learning enough (Table 3-35). These percentages are similar to those reported in 2003 and 1997 (Fall and Utermohle 1999:84; Fall 2006:72). For 2014, those who believed young people were not learning enough of these skills were asked to provide some reasons as to why this was the case. The most commonly cited reason was lack of teachers (27%), and also that technology and modernization has caused a decrease in participation (27%) (Table 3-36). These responses were followed by perceptions that there is a general lack of interest by young people (18%), the community way of life and those values were changing (18%), and that income and other economic resources were unable to support the associated costs (9%).Those who did believe young people were learning enough of these skills felt that this was the result of family member instruction and influence (29%), involvement in subsistence activities (29%), and participation in spirit camps and Native programs (29%) or school programs (29%) (Table 3-37). Although community members expressed that the overall population of Tatitlek was aging, and there was a decrease in the number of young people, 14% of respondents who felt like young people were learning enough subsistence skills attributed this to the influence of elders.
Elders’ InfluenceOf the households that provided a response, the majority (53%) said that elders’ influence had declined compared to 10 years ago, and 47% said that it remained the same (Table 3-38). No respondents indicated that influence from elders had increased. Reasons for the decrease reported in the current study year include cultural (33%) and demographic (67%) changes, among other unspecified reasons (Table 3-39).
177
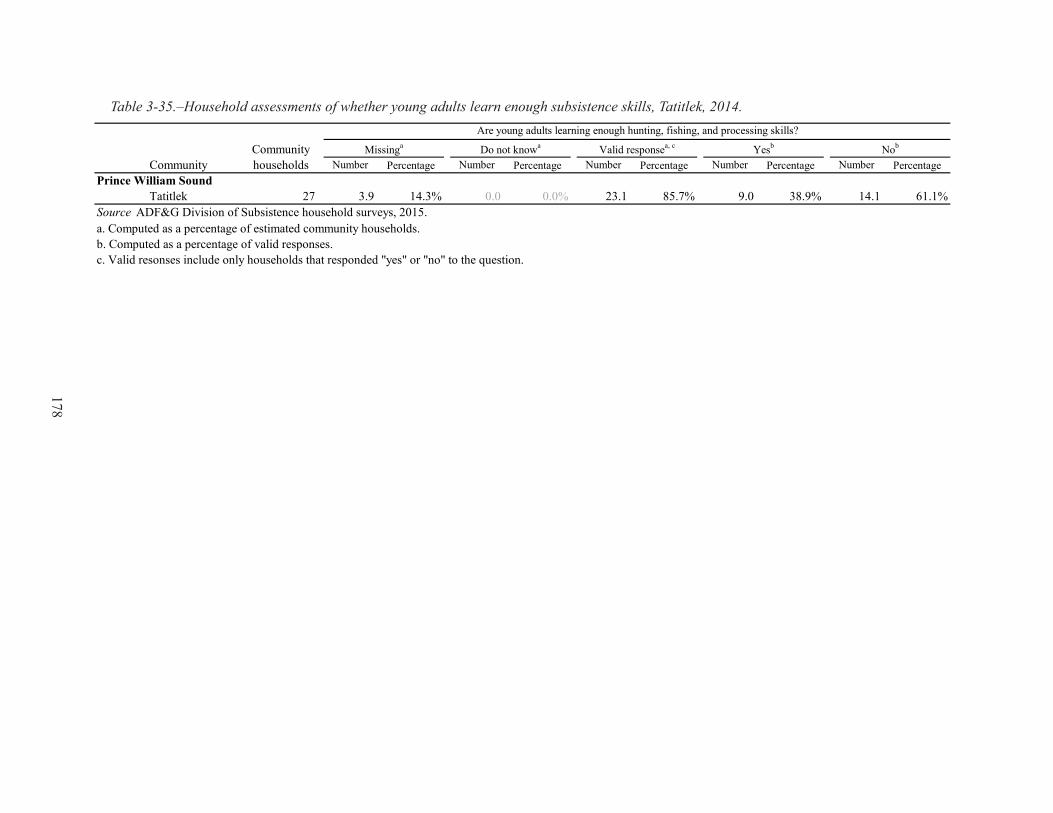
Table 3-35.–Household assessments of whether young adults learn enough subsistence skills, Tatitlek, 2014.
Number Percentage Number Percentage Number Percentage Number Percentage Number Percentage
Tatitlek 27 3.9 14.3% 0.0 0.0% 23.1 85.7% 9.0 38.9% 14.1 61.1%
Are young adults learning enough hunting, fishing, and processing skills?
Missinga Valid responsea, c Yesb NobDo not knowa
CommunityCommunity households
c. Valid resonses include only households that responded "yes" or "no" to the question.
a. Computed as a percentage of estimated community households.
Prince William Sound
Source ADF&G Division of Subsistence household surveys, 2015.
b. Computed as a percentage of valid responses.
178

Table 3-36.–Reasons why young adults are not learning enough subsistence skills, Tatitlek, 2014.
Number Percentage Number Percentage Number Percentage Number Percentage Number Percentage
Tatitlek 23.1 14.1 61.1% 0.0 0.0% 0.0 0.0% 2.6 18.2% 3.9 27.3%
Number Percentage Number Percentage Number Percentage Number Percentage Number Percentage
Tatitlek 23.1 14.1 61.1% 2.6 18.2% 0.0 0.0% 0.0 0.0% 0.0 0.0%
Number Percentage Number Percentage Number Percentage Number Percentage Number Percentage
Tatitlek 23.1 14.1 61.1% 0.0 0.0% 1.3 9.1% 3.9 27.3% 1.3 9.1%
No reason givenNot learning enougha
Prince William Sound
Too much else to do
CommunityValid
responsesc
Subsistence uses impeded
Why young adults are not learning enough hunting, fishing, and processing skills?b
Prince William Sound
No interestWhy young adults are not learning enough hunting, fishing, and processing skills?b
Lack of teachersDo not know
Valid responsesc
Source ADF&G Division of Subsistence household surveys, 2015.
-continued-
-continued-
Table 3-36.–Continued.
Table 3-36.–Continued.
Change in community way of life
CommunityValid
responsescNot learning enougha No time
a. Computed as a percentage of valid responses.b. Computed as a percentage of households that responded "no" to the question.c. Valid resonses include only households that responded "yes" or "no" to the question: "Are young adults learning enough hunting, fishing, and processing skills?"
Why young adults are not learning enough hunting, fishing, and processing skills?b
Prince William Sound
Decline in/scarcity of subsistence resources Economics
Technology and modernization Other reasonNot learning enougha
Community
179

Table 3-37.–Ways that young adults are learning subsistence skills, Tatitlek, 2014.
Table 3-38.–Household assessments of change in elders’ influence in the last 10 years, Tatitlek, 2014.
Number Percentage Number Percentage Number Percentage Number Percentage Number Percentage Number Percentage
Tatitlek 23.1 9.0 38.9% 0.0 0.0% 0.0 0.0% 2.6 28.6% 1.3 14.3% 2.6 28.6%
Number Percentage Number Percentage Number Percentage Number Percentage Number Percentage
Tatitlek 23.1 9.0 38.9% 2.6 28.6% 2.6 28.6% 0.0 0.0% 0.0 0.0%
c. Valid resonses include only households that responded "yes" or "no" to the question: "Are young adults learning enough hunting, fishing, and processing skills?"
a. Computed as a percentage of valid responses.b. Computed as a percentage of households that responded "yes" to the question.
How young adults are learning hunting, fishing, and processing skills?b
Other community members and friends Other
Source ADF&G Division of Subsistence household surveys, 2015.
Prince William Sound
Spirit camps and Native programs School programs
CommunityValid
responsescYes, learning enougha
Prince William Sound
Involvement in activitiesEldersFamily membersDo not knowNo reason given
How young adults are learning hunting, fishing, and processing skills?b
-continued-
Table 3-37.–Continued.
Valid responsescCommunity
Yes, learning enougha
Number Percentage Number Percentage Number Percentage Number Percentage Number Percentage
Tatitlek 27 5.1 19.0% 21.9 81.0% 11.6 52.9% 10.3 47.1% 0.0 0.0%Source ADF&G Division of Subsistence household surveys, 2015.
Change in elders' influence compared to 10 years ago (2004)
Note The "missing" and "valid response" categories are computed as percentages of estimated community households. All other categories are calculated as percentages of valid responses.
Missing Valid responses
Prince William Sound
Same IncreasedDecreasedCommunityhouseholdsCommunity
180
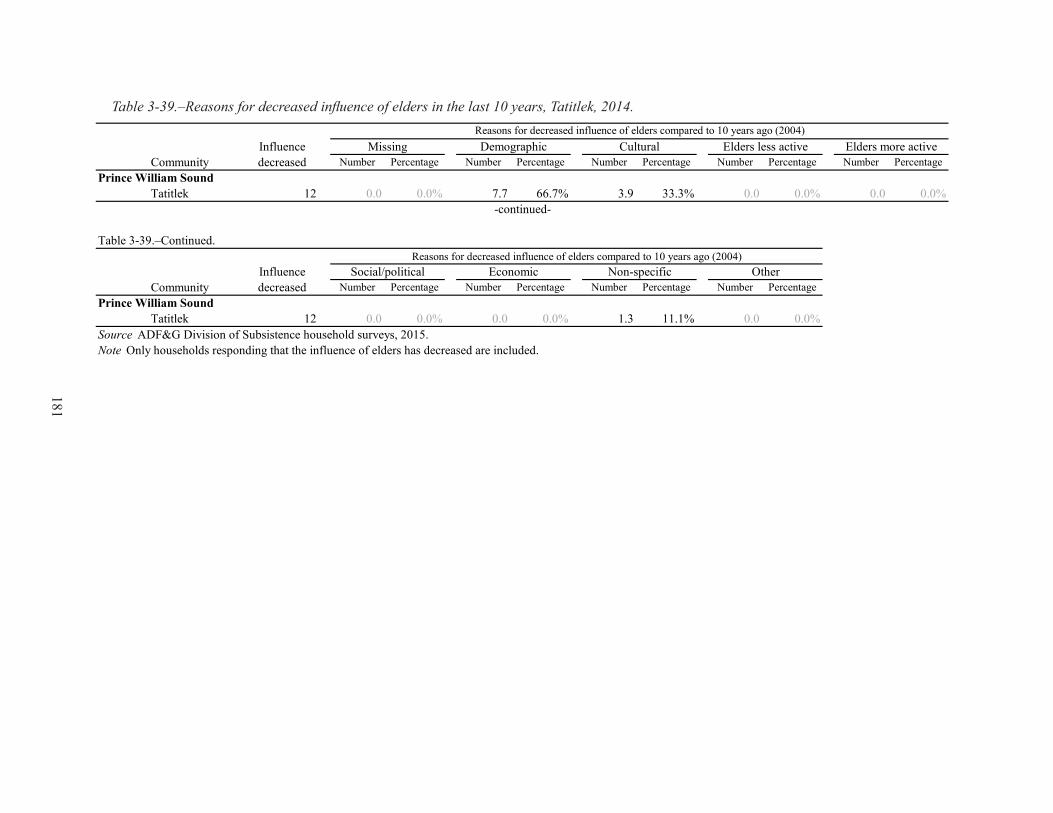
Table 3-39.–Reasons for decreased influence of elders in the last 10 years, Tatitlek, 2014.
Number Percentage Number Percentage Number Percentage Number Percentage Number Percentage
Tatitlek 12 0.0 0.0% 7.7 66.7% 3.9 33.3% 0.0 0.0% 0.0 0.0%
Number Percentage Number Percentage Number Percentage Number Percentage
Tatitlek 12 0.0 0.0% 0.0 0.0% 1.3 11.1% 0.0 0.0%
Demographic
Prince William Sound
Missing Elders less activeCulturalInfluence decreasedCommunity
Prince William Sound
Elders more active
Source ADF&G Division of Subsistence household surveys, 2015.Note Only households responding that the influence of elders has decreased are included.
Other
Reasons for decreased influence of elders compared to 10 years ago (2004)
Reasons for decreased influence of elders compared to 10 years ago (2004)
-continued-
Table 3-39.–Continued.
Social/political Economic Non-specificCommunity
Influence decreased
181

The percentage of respondents who believed that elder influence had declined remained consistent between 2014 and 2003 (Fall 2006:72). However, the 2003 survey found that 33% of respondents reported an increase in elder influence, which is a sharp contrast to the current perception. During the 1997 study year, a smaller percentage of respondents (20%) reported that there was a decrease in elders’ influence (Fall and Utermohle 1999:V-149).
Status of the Traditional Way of LifeRespondents from Tatitlek were asked to comment on whether or not the traditional way of life was affected by the Exxon Valdez oil spill. The majority of respondents (78%) believed that it had been affected, compared to 17% who believed it had not been affected, and 6% who did not know (Table 3-40). The percentage of the community respondents who believed the way of life has been affected by the oil spill is lower in 2014 compared to the percentages reported in 2003 (96%) and 1997 (100%) (Fall 2006:A-177; Fall and Utermohle 1999:V-156). Of those who currently believe the traditional way of life has been affected by the oil spill, only 21% believe it has recovered since the spill; approximately 78% believe it has not recovered (Table 3-41). From those who believed the traditional way of life has not recovered, some suggestions to help recovery included more education in the form of spirit camps and curriculum development (18%), increase resource populations (18%), and response to social disruptions (9%) (Table 3-42). However, the most responses (36%) indicated the responding household did not know what could help recover from the oil spill.
182

Table 3-40.–Household assessments of the oil spill’s effect on the traditional way of life, Tatitlek, 2014.
Number Percentage Number Percentage Number Percentage Number Percentage Number Percentage
Tatitlek 27 3.9 14.3% 23.1 85.7% 1.3 5.6% 3.9 16.7% 18.0 77.8%
a. Computed as a percentage of community households.b. Computed as a percentage of valid responses.c. Valid responses include only households that responded "yes," "no," or "do not know" to the question.
Source ADF&G Division of Subsistence household surveys, 2015.
CommunityCommunity households
Do not knowb
Prince William Sound
Was the traditional way of life affected by the Exxon Valdez oil spill?
Missinga Valid responsesa, c Not affectedb Affectedb
Table 3-41.–Household assessments of the recovery of the traditional way of life since the oil spill, Tatitlek, 2014.
Number Percentage Number Percentage Number Percentage Number Percentage Number Percentage
Tatitlek 18.0 0.0 0.0% 18.0 100.0% 0.0 0.0% 14.1 78.6% 3.9 21.4%
c. Valid responses include only households that responded "yes," "no," or "do not know" to the question.
CommunityYes, way of life affected
Has the traditional way of life recovered from the Exxon Valdez oil spill?
Missinga Valid responsesa, c Do not knowb Not recoveredb Recoveredb
Prince William Sound
Source ADF&G Division of Subsistence household surveys, 2015.a. Computed as a percentage of households that responded "yes" to the question: "Was the traditional way of life affected by the Exxon Valdez oil spill?"b. Computed as a percentage of valid responses.
183
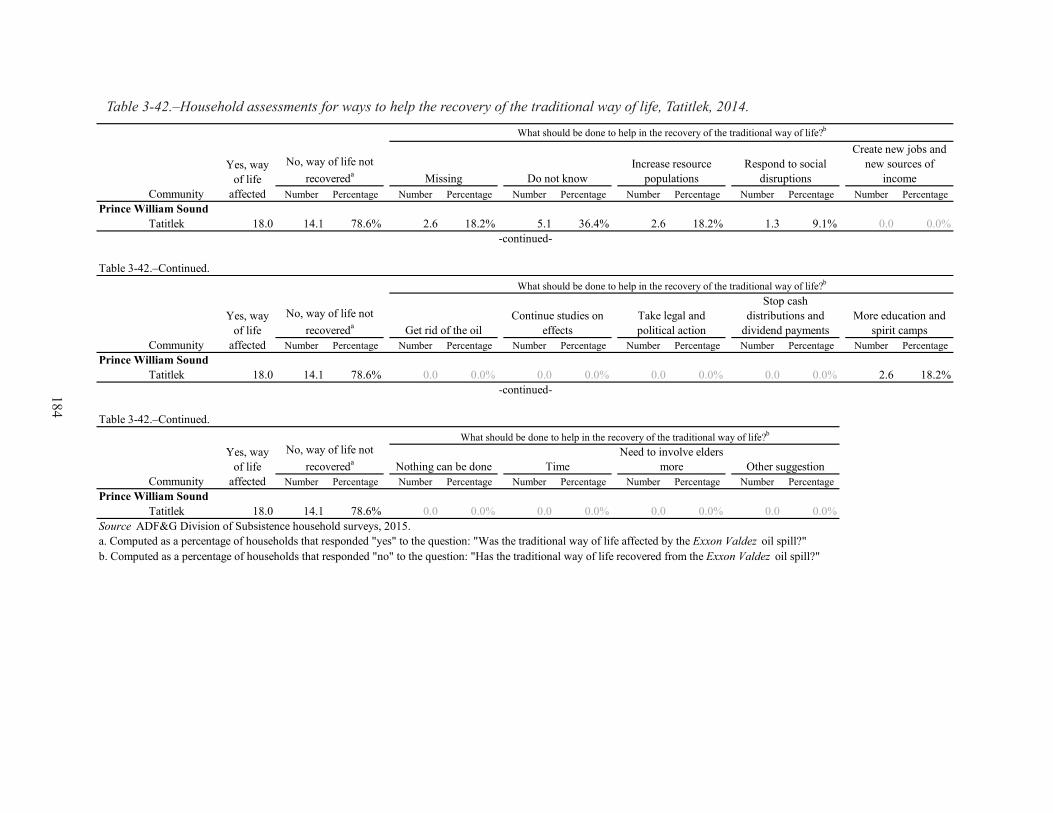
Table 3-42.–Household assessments for ways to help the recovery of the traditional way of life, Tatitlek, 2014.
Number Percentage Number Percentage Number Percentage Number Percentage Number Percentage Number PercentagePrince William Sound
Tatitlek 18.0 14.1 78.6% 2.6 18.2% 5.1 36.4% 2.6 18.2% 1.3 9.1% 0.0 0.0%
Number Percentage Number Percentage Number Percentage Number Percentage Number Percentage Number PercentagePrince William Sound
Tatitlek 18.0 14.1 78.6% 0.0 0.0% 0.0 0.0% 0.0 0.0% 0.0 0.0% 2.6 18.2%
Number Percentage Number Percentage Number Percentage Number Percentage Number PercentagePrince William Sound
Tatitlek 18.0 14.1 78.6% 0.0 0.0% 0.0 0.0% 0.0 0.0% 0.0 0.0%Source ADF&G Division of Subsistence household surveys, 2015.a. Computed as a percentage of households that responded "yes" to the question: "Was the traditional way of life affected by the Exxon Valdez oil spill?"b. Computed as a percentage of households that responded "no" to the question: "Has the traditional way of life recovered from the Exxon Valdez oil spill?"
Table 3-42.–Continued.
What should be done to help in the recovery of the traditional way of life?b
Table 3-42.–Continued.
-continued-
Community
Yes, way of life
affected
No, way of life not recovereda Nothing can be done Time
Need to involve elders more Other suggestion
-continued-
Community
Yes, way of life
affected
No, way of life not recovereda Get rid of the oil
Continue studies on effects
Take legal and political action
Stop cash distributions and
dividend paymentsMore education and
spirit camps
What should be done to help in the recovery of the traditional way of life?b
Yes, way of life
affectedCommunity
Create new jobs and new sources of
incomeRespond to social
disruptionsIncrease resource
populationsNo, way of life not
recovereda Do not knowMissing
What should be done to help in the recovery of the traditional way of life?b
184

ACKNOWLEDGMENTS
The Division of Subsistence would like to thank the residents of Tatitlek for their support and participation in the project. We are grateful to Tatitlek tribal council president David Totemoff and tribal administrator Vicky Vlasoff for their assistance working in the community. We would especially like to thank our LRAs Kristopher Kompkoff and George Vlasoff for working with us.
185
4. CORDOVA
Malla Kukkonen and Hannah Z. Johnson
coMMunity Background
Cordova’s name comes from Salvador Fidalgo, a Spanish explorer who put in at Orca Inlet in 1790 and named the anchorage Cordova. The town is nestled in Orca Inlet on the southeastern coast of Prince William Sound within the Cordova-Valdez census area. Cordova’s environmental setting is indicative of the Prince William Sound area, characterized by “numerous large forested islands and offshore islets, sea stacks, glacier-cut fiords, mist-shrouded valleys, vast glaciers, coastal wetlands, temperate rainforest, and a convoluted 2,700-mile coastline.”1 This transitional ecological zone provides for nutrient-rich waters and lands, giving rise to an array of diverse flora and fauna. Cordova itself is situated between the coast of Orca Inlet to the west and Eyak Lake to the east. The town is close to the delta of the Copper River, which sits approximately 27 miles west.Cordova’s location is a prime habitat for many species, particularly the salmon that journey up the Copper River annually. Because of this reliable resource, the Cordova area has been inhabited by people for centuries. At the time of European contact, the Cordova area was made up of multiple Eyak dAXunhyuu communities, including Alaganik, which was located near the Copper River Delta, and Eyak, which was near the mouth of Lake Eyak (Sherman 2012). The area was close to Ahtna and Chugach communities and was in close contact with Tlingit traders. The first consistent Euro-American settlement near Cordova was a trading post, Fort Constantine, built by Russians to control fur trading in 1791 (Sherman 2012). By the late 1880s, 2 canneries operated by the Pacific Packing Company and the Pacific Steam Whaling Company had opened along the Odiak Slough near Eyak Lake. Within 30 years, 50 additional canneries dotted the Copper River Delta and Prince William Sound; this established seasonal commercial fishing, clamming, and cannery work as the dominant economic resource in the area, which continues today. This economy has been punctuated by other economic upturns. In 1906, Michael J. Heney began an aggressive “railroad invasion” that would lead to the founding of Cordova as the terminus for the Kennecott mining district, located approximately 196 railroad miles northeast of Cordova. The building of the railroad and the operation of the mining district led to a population boom in Cordova. The Kennecott copper load would turn out to be the highest grade copper deposit ever found (Sherman 2012).The Kennecott mining district was played out by 1938 when the last mines closed. However, the people of Cordova continued commercial fishing for salmon, marine fish, and marine invertebrates, thus sustaining the town. By the time the mining district had closed, in addition to abundant salmon runs, Cordova was known as the Razor Clam Capital of the World (Nielsen 1984). Events such as the 1964 earthquake2 and the Exxon Valdez oil spill (EVOS) greatly affected people’s ability to participate in these commercial fisheries3; however, commercial fishing still makes up the economic lifeblood of the community.Today, in addition to commercial fishing, Cordova also houses a fairly large government sector, including the City of Cordova, Alaska Department of Fish and Game (ADF&G), the Native Village of Eyak, the Chugach National Forest Service district office, and various U.S. Coast Guard units, including the U.S.C.G. Cutter Sycamore. 1. National Wildlife Refuge Federation, “Special Ecological Sites in Alaska’s Eastern Prince William Sound and Copper River Delta,” 2005.http://www.pwsrcac.org/wp-content/uploads/filebase/programs/oil_spill_prevention_planning/special_ecological_sites.pdf (ac-cessed November 18, 2015). 2. Brooks, Kenneth M. “Suitability of Two Sand Bars Near the Native Village of Eyak for the Enhancement of Razor Clams (Siliqua patula),” 2004. https://www.adfg.alaska.gov/static/fishing/PDFs/aquaticfarming/eyak_razorclam_report.pdf (accessed November 18, 2015). 3. Exxon Valdez Oil Spill Trustee Council, “Commercial Fishing,” n.d. http://www.evostc.state.ak.us/index.cfm?FA= status.human_fishing (accessed November 18, 2015).
186

Additional community services include schools from kindergarten to 12th grade and the Prince William Sound Community College, a medical center and health clinic, a post office, 3 grocery stores, shops, and a smattering of restaurants, bars, and hotels. Cordova also has a newly completed community center that houses the Cordova Public Library, the Cordova Historical Museum, municipal administrative offices, performance/theater spaces, and conference/meeting spaces.4 For recreation, Cordova has the Ilanka Cultural Center, Bidarki Recreation Center, Prince William Sound Science Center, as well as numerous hiking or boating opportunities and the Mt. Eyak ski area.Cordova has regular air service through Alaska Airlines and Ravn Alaska, as well as year-round ferry service to and from Whittier and Valdez; the former provides access to Anchorage and the Matanuska-Susitna Valley while the latter provides access to the Copper River Valley. Cordova is also linked by ferry service to other communities within Prince William Sound.
houSehold Survey iMPleMentation
Survey implementation in Cordova included a partnership between the Division of Subsistence and Native Village of Eyak. Initial preparation occurred with help from the City of Cordova, and ongoing support was provided by the ADF&G Cordova office. The project was initially presented to the community on December 5, 2014, as part of the Prince William Science Center Tuesday night lecture series. To launch the survey effort, researchers arrived in Cordova the first week of February 2015. Prior to conducting surveys, project staff developed an initial household list based on parcel data provided by the City of Cordova. These data were depicted on community area maps and served as a starting point for the necessary ground-truthing to locate the randomly selected households for the survey. The research team quickly learned that comprehensive ground-truthing of the community maps and parcel data was required to successfully maintain an accurate and random household list for the survey sample goal. To accomplish this task, the household list was organized using Microsoft Access.5 To administer surveys, 8 local research assistants (LRAs) who were tribal members were hired in coordination with the Native Village of Eyak. One additional LRA was hired by the division. LRAs underwent a full day of survey implementation training on February 4, 2015. This training included a detailed review of the comprehensive survey form, explanation about the goals of the survey and the voluntary nature of survey participation, as well as practical tips on how to efficiently conduct a survey when interviewing a respondent. During training, LRAs were given the opportunity to ask questions about their role and pair with an ADF&G researcher to form a surveyor team. Survey implementation began the next day and continued until mid-March. The continual ground-truthing, coupled with community festivities such as the Ice Worm Festival, extended the duration of fieldwork. The length of time required to complete the fieldwork necessitated the help of many Division of Subsistence researchers (10 total) and the size of the community required the help of many LRAs (9 total).
PoPulation eStiMateS and deMograPhic inForMation
This study estimated a total of 950 households and approximately 2,602 residents in Cordova for the study year 2014 (Table 4-1). This estimate is slightly higher than those established by the American Community Survey (830 households with a range of 723–937, and 2,604 individuals with a range of 2,300–2,908) and the 2010 federal census (922 households and 2,239 individuals). This difference may largely be attributable to differing qualifications for residency. For this study, individuals qualified as residents if they considered Cordova their primary home and spent at least 3 consecutive months in Cordova in 2014. This study estimated that 16% of the population identified as Alaska Native. This is within 1% of the American Community Survey (ACS) 5-year average estimate and 2010 U.S. Census Bureau estimate (Figure 4-1). This is a significantly smaller percentage than in the 2 other study communities, where the percentage of Alaska Native residents averaged 76% of the population (Table 1-7).
4. The Cordova Center, n.d. “Design,” http://www.thecordovacenter.org/explore/design (accessed November 18, 2015).5. Product names are given because they are established standards for the State of Alaska or for scientific completeness; they do not constitute product endorsement.
187

Table 4-1.–Population estimates, Cordova, 2010 and 2014.
Estimate Rangea Estimate Rangeb
Households 922 830.0 723 – 937 950.0Population 2,239 2,604.0 2,300 – 2,908 2,602.2 2,402 – 2,802
Population 344 384.0 230 – 538 415.5 285 – 546Percentage 15.4% 14.7% 16.0%
Total population
Alaska Native
b. No range of households is estimated for division surveys. a. ACS data range is the reported margin of error.
Sources U.S. Census Bureau (2011) for 2010 estimate; U.S. Census Bureau for American Community Survey (ACS) 2013 estimate (5-year average); and ADF&G Division of Subsistence household surveys, 2015, for 2014 estimate.Note Division of Subsistence household survey elegiblity requirements differ from those used by (ACS).
Census(2010)
5-year American Community Survey
(2009–2013)This study
(2014)
Note Cordova includes Cordova census designated place (CDP).
Figure 4-1.–Alaska Native and overall population estimates, Cordova, 2010 and 2014.
0
500
1,000
1,500
2,000
2,500
3,000
3,500
2010 U.S. Census 2009–2013 American Community Survey
This study(2014)
Num
ber o
f peo
ple
Total population Alaska Native population
188

Figure 4-2.–Historical population estimates, Cordova, 1950–2014.
2,602
0
500
1,000
1,500
2,000
2,500
3,000
1950 1960 1970 1980 1990 2000 2010
Num
ber o
f peo
ple
U.S. Census (count) Alaska Department of Labor (estimate)This study (estimate) Population trend
The population estimates for 1960 and 1970 indicate little community growth in that decade; this is likely due to the community still recovering from the 1964 earthquake (Figure 4-2). The construction of the trans-Alaska pipeline in the 1970s caused a population increase in Cordova. There was another slight increase in Cordova in the 1990s. This population rise is most likely connected to the cleanup effort for the Exxon Valdez oil spill, which, at its peak, employed 10,000 people and 1,000 boats.6 Since the 2000 federal census, the population has remained relatively stable.A total of 184 households were surveyed; the sample achievement was 19% of the community’s estimated 950 households (Table 4-2). The average household size was 2.7 people, which is nearly the state average for 2009–2013 of 2.75.7 The average age of Cordova residents was 36 years old. The average length of residency was almost 19 years, with the heads of households having a longer average length of residency by 5 additional years. Approximately 48% of the population was female (Figure 4-3; Table 4-3). More than 50% of the population was over the age of 35, contributing to the community’s higher average age than the population of Alaska overall, which is 34 (Alaska Department of Labor and Workforce Development 2014).The majority of the heads of households were born outside of Alaska (60%) but the city from which most people were born in Alaska was Cordova (20%) (Table 4-4). The locally born population increases to almost 30% when looking at the entire population of Cordova (Table 4-5).
6. Exxon Valdez Oil Spill Trustee Council, “Questions and Answers about the Spill,” n.d. http://www.evostc.state.ak.us/index.cfm?FA=facts.QA (accessed November 18, 2015).7. United States Census Bureau, “State & County QuickFacts: Alaska, People QuickFacts,” 2015. http://quickfacts.census.gov/qfd/states/02000.html (accessed December 4, 2015).
189
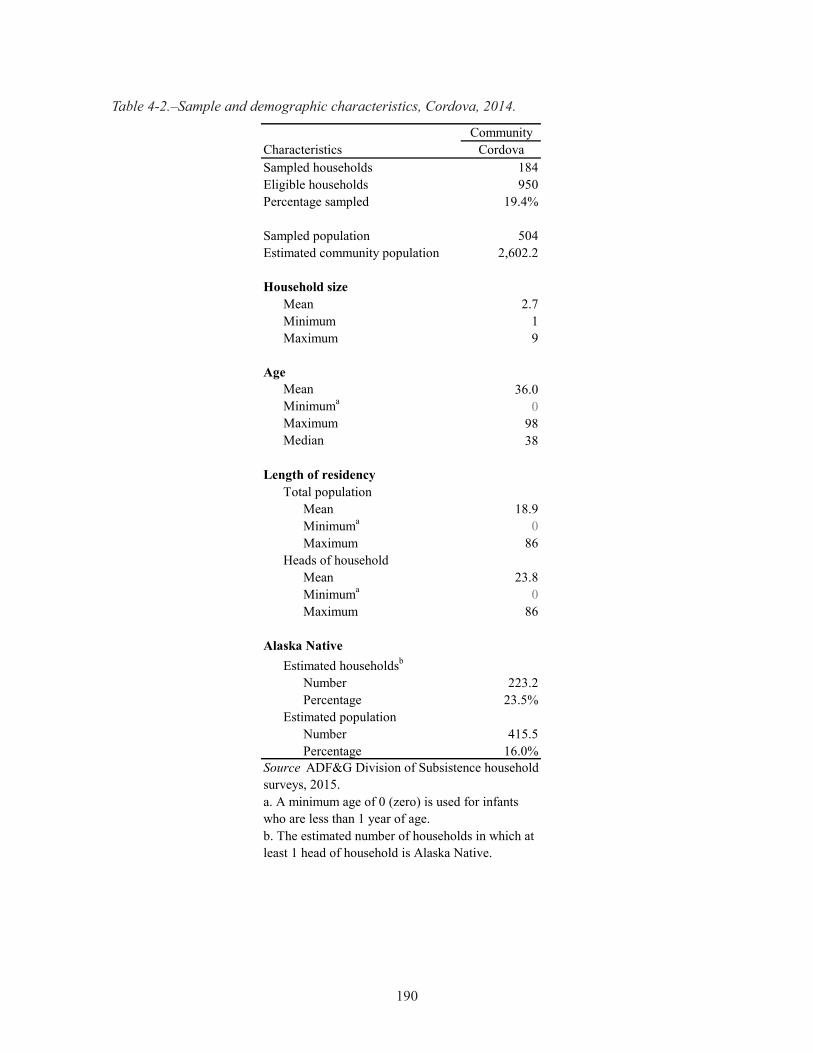
Table 4-2.–Sample and demographic characteristics, Cordova, 2014.
CommunityCordova
Sampled households 184Eligible households 950Percentage sampled 19.4%
Sampled population 504Estimated community population 2,602.2
Mean 2.7Minimum 1Maximum 9
36.00
9838
Total populationMean 18.9Minimuma 0Maximum 86
Heads of householdMean 23.8Minimuma 0Maximum 86
Alaska NativeEstimated householdsb
Number 223.2Percentage 23.5%
Estimated populationNumber 415.5Percentage 16.0%
Mean
Household size
Age
Characteristics
b. The estimated number of households in which at least 1 head of household is Alaska Native.
Minimuma
MaximumMedian
Length of residency
a. A minimum age of 0 (zero) is used for infants who are less than 1 year of age.
Source ADF&G Division of Subsistence household surveys, 2015.
190

Figure 4-3.–Population profile, Cordova, 2014.
Table 4-3.–Population profile, Cordova, 2014.
150 100 50 0 50 100 150
0–45–9
10–1415–1920–2425–2930–3435–3940–4445–4950–5455–5960–6465–6970–7475–7980–8485–8990–9495–99
100–104Missing
Number of people
Female
Male
Number PercentageCumulative percentage Number Percentage
Cumulative percentage Number Percentage
Cumulative percentage
0–4 72.4 5.3% 5.3% 67.3 5.4% 5.4% 139.7 5.4% 5.4%5–9 93.1 6.8% 12.1% 108.6 8.8% 14.2% 201.8 7.8% 13.1%
10–14 129.3 9.5% 21.6% 82.8 6.7% 20.9% 212.1 8.2% 21.3%15–19 113.8 8.3% 29.9% 62.1 5.0% 25.9% 175.9 6.8% 28.0%20–24 62.1 4.5% 34.5% 77.6 6.3% 32.2% 139.7 5.4% 33.4%25–29 87.9 6.4% 40.9% 67.3 5.4% 37.7% 155.2 6.0% 39.4%30–34 87.9 6.4% 47.3% 72.4 5.9% 43.5% 160.4 6.2% 45.5%35–39 93.1 6.8% 54.2% 103.5 8.4% 51.9% 196.6 7.6% 53.1%40–44 51.7 3.8% 58.0% 67.3 5.4% 57.3% 119.0 4.6% 57.7%45–49 82.8 6.1% 64.0% 72.4 5.9% 63.2% 155.2 6.0% 63.6%50–54 113.8 8.3% 72.3% 98.3 7.9% 71.1% 212.1 8.2% 71.8%55–59 129.3 9.5% 81.8% 129.3 10.5% 81.6% 258.7 9.9% 81.7%60–64 113.8 8.3% 90.2% 93.1 7.5% 89.1% 206.9 8.0% 89.7%65–69 46.6 3.4% 93.6% 41.4 3.3% 92.5% 87.9 3.4% 93.0%70–74 20.7 1.5% 95.1% 20.7 1.7% 94.1% 41.4 1.6% 94.6%75–79 20.7 1.5% 96.6% 20.7 1.7% 95.8% 41.4 1.6% 96.2%80–84 15.5 1.1% 97.7% 10.3 0.8% 96.7% 25.9 1.0% 97.2%85–89 5.2 0.4% 98.1% 0.0 0.0% 96.7% 5.2 0.2% 97.4%90–94 0.0 0.0% 98.1% 5.2 0.4% 97.1% 5.2 0.2% 97.6%95–99 0.0 0.0% 98.1% 10.3 0.8% 97.9% 10.3 0.4% 98.0%
100–104 0.0 0.0% 98.1% 0.0 0.0% 97.9% 0.0 0.0% 98.0%Missing 25.9 1.9% 100.0% 25.9 2.1% 100.0% 51.7 2.0% 100.0%Total 1,365.8 100.0% 100.0% 1,236.4 100.0% 100.0% 2,602.2 100.0% 100.0%
Source ADF&G Division of Subsistence household surveys, 2015.
Age
Male Female Total
191

Table 4-4.–Birthplaces of household heads, Cordova, 2014.
Table 4-5.–Birthplaces of population, Cordova, 2014.
Birthplace PercentageAnchorage 1.0%Cordova 19.6%Fairbanks 0.6%Ketchikan 0.3%Napaskiak 0.3%Nome 1.0%Palmer 1.0%Port Lions 0.3%Tatitlek 0.3%Teller 0.3%Unalaska 0.3%Wasilla 0.3%Other Alaska 1.0%
Missing 3.5%Other U.S. 60.3%Foreign 9.9%
Note "Birthplace" means the place of residence of the parents of the individual when the individual was born.
Source ADF&G Division of Subsistence household surveys, 2015.
Birthplace PercentageAnchorage 3.2%Cordova 29.8%Fairbanks 0.8%Ketchikan 0.4%Kodiak City 0.4%Napaskiak 0.2%Nome 0.6%Palmer 0.6%Port Lions 0.2%Seward 0.2%Tatitlek 0.2%Teller 0.2%Unalaska 0.2%Valdez 0.2%Wasilla 0.2%Wrangell 0.4%Eshamy Bay 0.2%Other Alaska 1.0%
Missing 3.2%Other U.S. 48.8%Foreign 9.1%Source ADF&G Division of Subsistence household surveys, 2015.Note "Birthplace" means the place of residence of the parents of the individual when the individual was born.192

Figure 4-4.–Top income sources, Cordova, 2014.
incoMe and caSh eMPloyMent
The major source of income (41%) in Cordova was commercial fishing and directly related activities (such as working on the tenders or at the cannery) (Figure 4-4). Total average earned income per household for Cordova was approximately $74,859 in 2014; the total household income for Cordova for all income sources combined was $86,157 (Table 4-6). The per capita income for 2014 was $31,454 (Table 1-7), which is roughly $20,000 less than the 2013 average Alaska per capita income of $50,150.8 Cordova’s median household income estimate was $84,420, which is about $10,000 less than the 2009–2013 ACS estimate for Cordova ($96,875), but higher than the average Alaska median income of $70,760 (Table 4-7).The second largest sector of employment was local government, including the Native Village of Eyak and the City of Cordova, which contributed 12% toward earned income (Table 4-8). Additional income sectors are indirectly related to the fishing industry, such as services (12% of earned income), retail trade (8% of earned income), and federal and state government (6% and 5%, respectively). A large source of other income includes Alaska Permanent Fund dividends (5% of total income), followed by pensions and retirement (4% of total income) (Table 4-6). However, the other income sources combined only made up 13% of total community income. The finance, insurance, and real estate sector made up the lowest portion of earned income, while investments and the women, infant, and children (WIC) program generated the least amount of other income.An estimated 80% of working age (16 or older) adults in the community were employed (Table 4-9). An estimated total of 2,234 jobs were held in 2014. The average Cordova employed adult had 1.4 jobs, with the minimum being 1 and the maximum being 6. An estimated 61% of employed adults worked year-round. 8. Alaska Department of Labor and Workforce Development, Research and Analysis Section, “Income Data for Alaska and U.S.: 2013 Per Capita Personal Income,” 2015. http://laborstats.alaska.gov/income/income.htm (accessed November 18, 2015).
All other sources6%
Agriculture, forestry, and fishing
41%
Local government, including tribal
11%
Services10%
Retail trade7%
Alaska Permanent Fund dividend
5%
Federal government5%
State government5%
Construction4%
Pension/retirement4%
Social Security2%
Note The "all other sources" category includes sourcesproviding less than 2% each to the overall income.
193
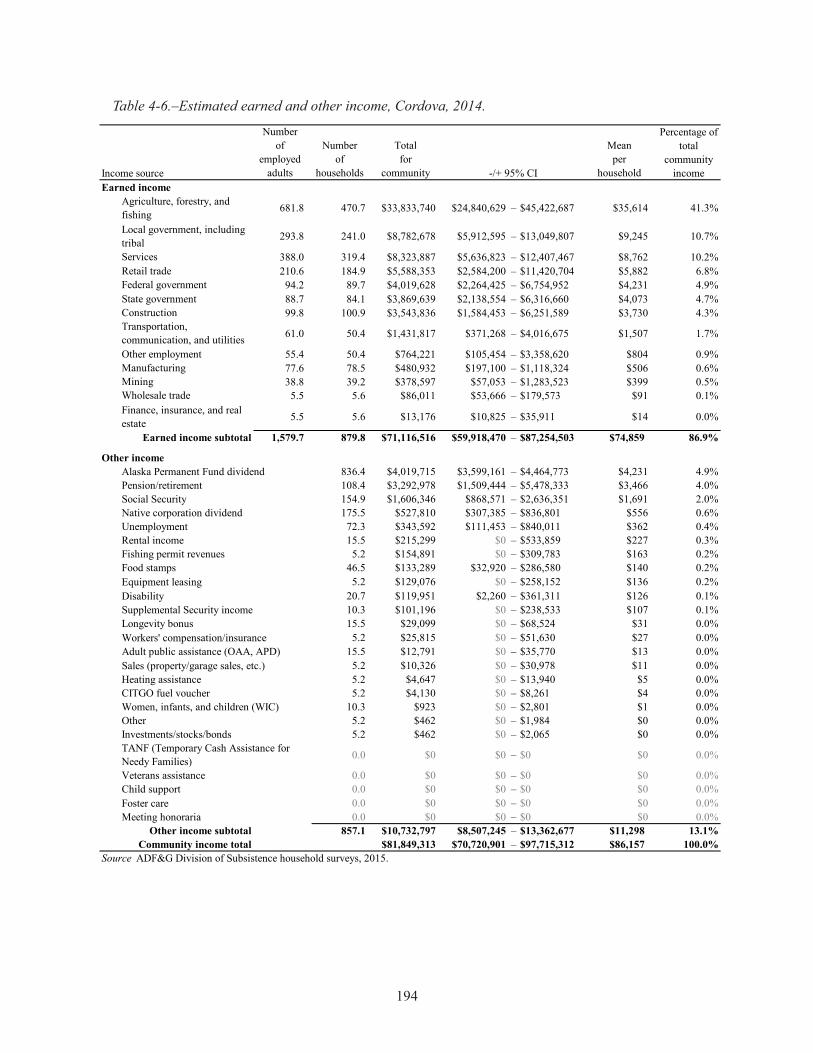
Table 4-6.–Estimated earned and other income, Cordova, 2014.
Number Percentage ofof Number Total Mean total
employed of for per communityIncome source adults households community household incomeEarned income
Agriculture, forestry, and fishing 681.8 470.7 $33,833,740 $24,840,629 – $45,422,687 $35,614 41.3%
Local government, including tribal 293.8 241.0 $8,782,678 $5,912,595 – $13,049,807 $9,245 10.7%
Services 388.0 319.4 $8,323,887 $5,636,823 – $12,407,467 $8,762 10.2%Retail trade 210.6 184.9 $5,588,353 $2,584,200 – $11,420,704 $5,882 6.8%Federal government 94.2 89.7 $4,019,628 $2,264,425 – $6,754,952 $4,231 4.9%State government 88.7 84.1 $3,869,639 $2,138,554 – $6,316,660 $4,073 4.7%Construction 99.8 100.9 $3,543,836 $1,584,453 – $6,251,589 $3,730 4.3%Transportation, communication, and utilities 61.0 50.4 $1,431,817 $371,268 – $4,016,675 $1,507 1.7%
Other employment 55.4 50.4 $764,221 $105,454 – $3,358,620 $804 0.9%Manufacturing 77.6 78.5 $480,932 $197,100 – $1,118,324 $506 0.6%Mining 38.8 39.2 $378,597 $57,053 – $1,283,523 $399 0.5%Wholesale trade 5.5 5.6 $86,011 $53,666 – $179,573 $91 0.1%Finance, insurance, and real estate 5.5 5.6 $13,176 $10,825 – $35,911 $14 0.0%
Earned income subtotal 1,579.7 879.8 $71,116,516 $59,918,470 – $87,254,503 $74,859 86.9%
Other incomeAlaska Permanent Fund dividend 836.4 $4,019,715 $3,599,161 – $4,464,773 $4,231 4.9%Pension/retirement 108.4 $3,292,978 $1,509,444 – $5,478,333 $3,466 4.0%Social Security 154.9 $1,606,346 $868,571 – $2,636,351 $1,691 2.0%Native corporation dividend 175.5 $527,810 $307,385 – $836,801 $556 0.6%Unemployment 72.3 $343,592 $111,453 – $840,011 $362 0.4%Rental income 15.5 $215,299 $0 – $533,859 $227 0.3%Fishing permit revenues 5.2 $154,891 $0 – $309,783 $163 0.2%Food stamps 46.5 $133,289 $32,920 – $286,580 $140 0.2%Equipment leasing 5.2 $129,076 $0 – $258,152 $136 0.2%Disability 20.7 $119,951 $2,260 – $361,311 $126 0.1%Supplemental Security income 10.3 $101,196 $0 – $238,533 $107 0.1%Longevity bonus 15.5 $29,099 $0 – $68,524 $31 0.0%Workers' compensation/insurance 5.2 $25,815 $0 – $51,630 $27 0.0%Adult public assistance (OAA, APD) 15.5 $12,791 $0 – $35,770 $13 0.0%Sales (property/garage sales, etc.) 5.2 $10,326 $0 – $30,978 $11 0.0%Heating assistance 5.2 $4,647 $0 – $13,940 $5 0.0%CITGO fuel voucher 5.2 $4,130 $0 – $8,261 $4 0.0%Women, infants, and children (WIC) 10.3 $923 $0 – $2,801 $1 0.0%Other 5.2 $462 $0 – $1,984 $0 0.0%Investments/stocks/bonds 5.2 $462 $0 – $2,065 $0 0.0%
0.0 $0 $0 – $0 $0 0.0%
Veterans assistance 0.0 $0 $0 – $0 $0 0.0%Child support 0.0 $0 $0 – $0 $0 0.0%Foster care 0.0 $0 $0 – $0 $0 0.0%Meeting honoraria 0.0 $0 $0 – $0 $0 0.0%
Other income subtotal 857.1 $10,732,797 $8,507,245 – $13,362,677 $11,298 13.1%Community income total $81,849,313 $70,720,901 – $97,715,312 $86,157 100.0%
-/+ 95% CI
Source ADF&G Division of Subsistence household surveys, 2015.
TANF (Temporary Cash Assistance for Needy Families)
194

Table 4-7.–Comparison of median income estimates, Cordova, 2014.
Data source Mediana Rangeb,c
2014 Division of Subsistence estimate $84,420 $69,313 – $97,1832009–2013 ACS (Cordova City) $96,875 $83,167 – $110,5832009–2013 ACS (All Alaska) $70,760 $70,028 – $71,492
c. ACS data range is the reported margin of error.b. Range is a 95% confidence interval of the estimated median.
a. Division of Subsistence 2014 estimate does not include categories of income excluded by the 2009–2013 ACS median estimate, including food stamps, housing assistance, and one-time payments.
Sources ADF&G Division of Subsistence household surveys, 2015, for 2014 estimate; U.S. Census Bureau for American Community Survey (ACS) 5-year survey estimate.
On average there were 1.7 employed adults per household and 93% of households in Cordova had at least 1 household member who was employed during 2014. Nearly one-half (49%) of jobs held by Cordova respondents were full time (Table 4-10). Part-time jobs made up 23% out of all jobs held. On-call jobs also made up a large portion of total jobs held (18%). This high on-call percentage is most likely attributed to the Ship Escort/Response Vessel System, or SERVS, program that was put in place after the Exxon Valdez oil spill as a response and support system to minimize the effects of future spills. As the above data show, commercial fishing is a crucial aspect of the Cordova community. When asked whether commercial fishing was not important, important, or very important, the vast majority of people surveyed reported that commercial fishing was very important to the local economy.
195
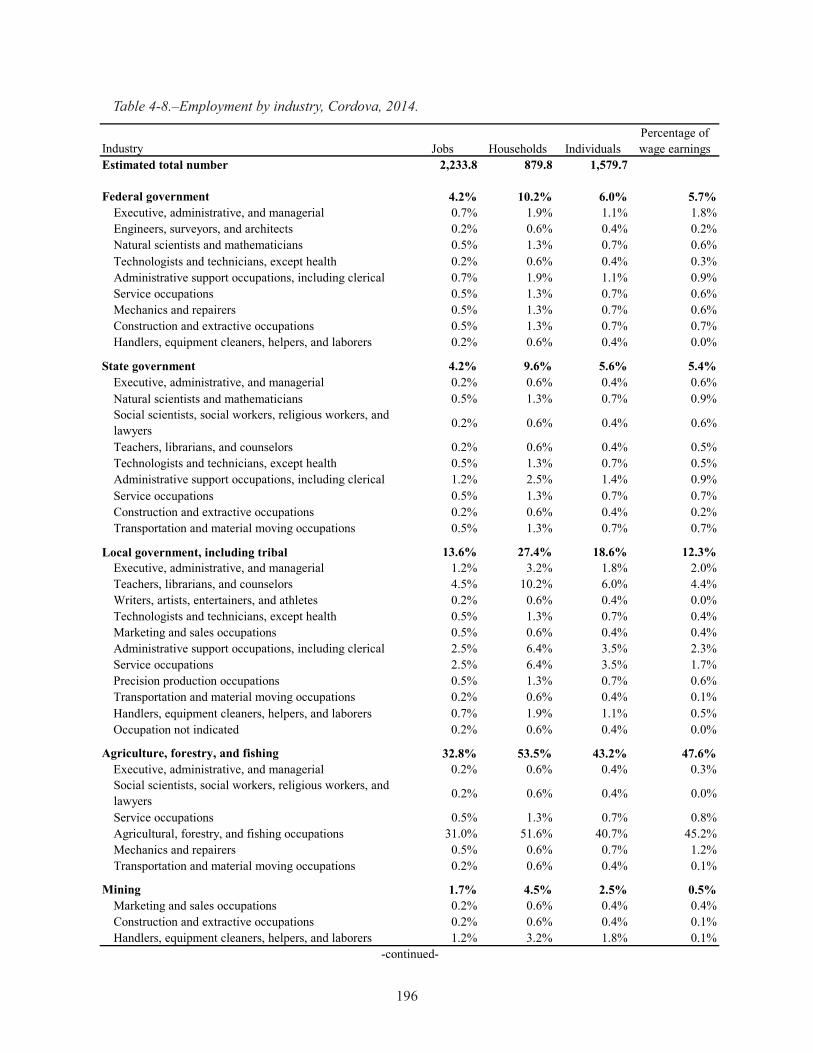
Table 4-8.–Employment by industry, Cordova, 2014.
Jobs Households IndividualsPercentage of wage earnings
2,233.8 879.8 1,579.7
Federal government 4.2% 10.2% 6.0% 5.7%Executive, administrative, and managerial 0.7% 1.9% 1.1% 1.8%Engineers, surveyors, and architects 0.2% 0.6% 0.4% 0.2%Natural scientists and mathematicians 0.5% 1.3% 0.7% 0.6%Technologists and technicians, except health 0.2% 0.6% 0.4% 0.3%Administrative support occupations, including clerical 0.7% 1.9% 1.1% 0.9%Service occupations 0.5% 1.3% 0.7% 0.6%Mechanics and repairers 0.5% 1.3% 0.7% 0.6%Construction and extractive occupations 0.5% 1.3% 0.7% 0.7%Handlers, equipment cleaners, helpers, and laborers 0.2% 0.6% 0.4% 0.0%
State government 4.2% 9.6% 5.6% 5.4%Executive, administrative, and managerial 0.2% 0.6% 0.4% 0.6%Natural scientists and mathematicians 0.5% 1.3% 0.7% 0.9%Social scientists, social workers, religious workers, and lawyers 0.2% 0.6% 0.4% 0.6%
Teachers, librarians, and counselors 0.2% 0.6% 0.4% 0.5%Technologists and technicians, except health 0.5% 1.3% 0.7% 0.5%Administrative support occupations, including clerical 1.2% 2.5% 1.4% 0.9%Service occupations 0.5% 1.3% 0.7% 0.7%Construction and extractive occupations 0.2% 0.6% 0.4% 0.2%Transportation and material moving occupations 0.5% 1.3% 0.7% 0.7%
Local government, including tribal 13.6% 27.4% 18.6% 12.3%Executive, administrative, and managerial 1.2% 3.2% 1.8% 2.0%Teachers, librarians, and counselors 4.5% 10.2% 6.0% 4.4%Writers, artists, entertainers, and athletes 0.2% 0.6% 0.4% 0.0%Technologists and technicians, except health 0.5% 1.3% 0.7% 0.4%Marketing and sales occupations 0.5% 0.6% 0.4% 0.4%Administrative support occupations, including clerical 2.5% 6.4% 3.5% 2.3%Service occupations 2.5% 6.4% 3.5% 1.7%Precision production occupations 0.5% 1.3% 0.7% 0.6%Transportation and material moving occupations 0.2% 0.6% 0.4% 0.1%Handlers, equipment cleaners, helpers, and laborers 0.7% 1.9% 1.1% 0.5%Occupation not indicated 0.2% 0.6% 0.4% 0.0%
Agriculture, forestry, and fishing 32.8% 53.5% 43.2% 47.6%Executive, administrative, and managerial 0.2% 0.6% 0.4% 0.3%Social scientists, social workers, religious workers, and lawyers 0.2% 0.6% 0.4% 0.0%
Service occupations 0.5% 1.3% 0.7% 0.8%Agricultural, forestry, and fishing occupations 31.0% 51.6% 40.7% 45.2%Mechanics and repairers 0.5% 0.6% 0.7% 1.2%Transportation and material moving occupations 0.2% 0.6% 0.4% 0.1%
Mining 1.7% 4.5% 2.5% 0.5%Marketing and sales occupations 0.2% 0.6% 0.4% 0.4%Construction and extractive occupations 0.2% 0.6% 0.4% 0.1%Handlers, equipment cleaners, helpers, and laborers 1.2% 3.2% 1.8% 0.1%
Estimated total numberIndustry
-continued-
196
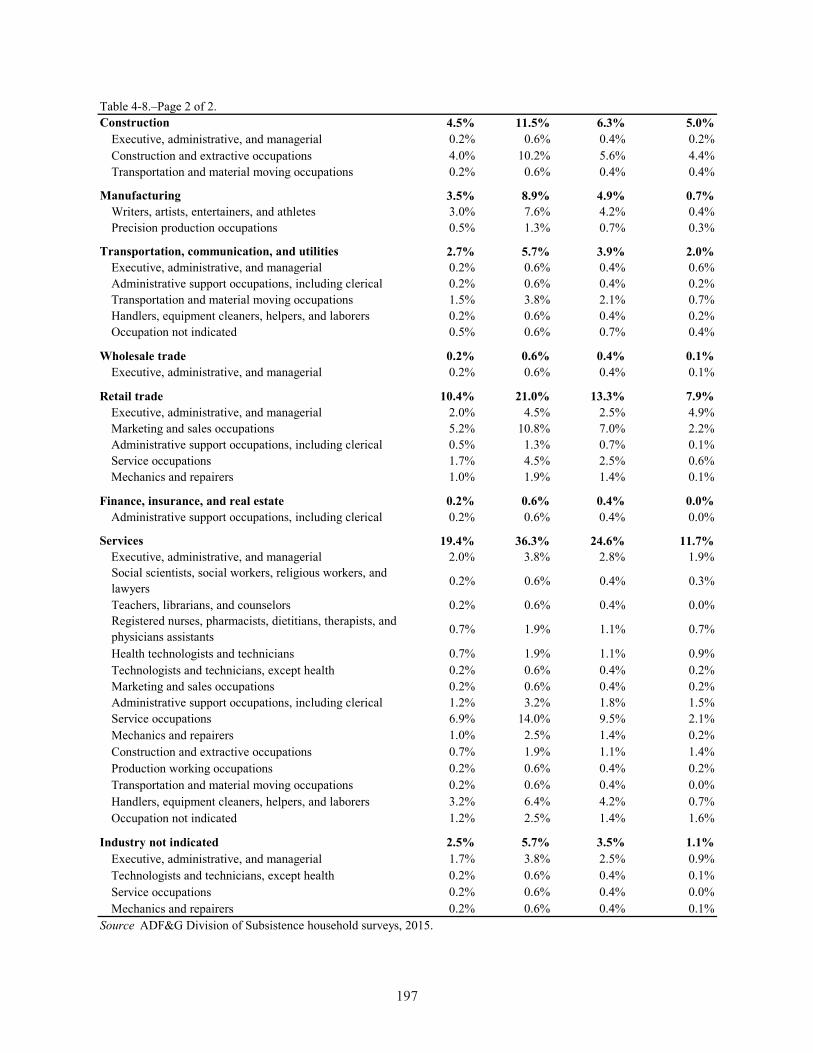
Construction 4.5% 11.5% 6.3% 5.0%Executive, administrative, and managerial 0.2% 0.6% 0.4% 0.2%Construction and extractive occupations 4.0% 10.2% 5.6% 4.4%Transportation and material moving occupations 0.2% 0.6% 0.4% 0.4%
Manufacturing 3.5% 8.9% 4.9% 0.7%Writers, artists, entertainers, and athletes 3.0% 7.6% 4.2% 0.4%Precision production occupations 0.5% 1.3% 0.7% 0.3%
Transportation, communication, and utilities 2.7% 5.7% 3.9% 2.0%Executive, administrative, and managerial 0.2% 0.6% 0.4% 0.6%Administrative support occupations, including clerical 0.2% 0.6% 0.4% 0.2%Transportation and material moving occupations 1.5% 3.8% 2.1% 0.7%Handlers, equipment cleaners, helpers, and laborers 0.2% 0.6% 0.4% 0.2%Occupation not indicated 0.5% 0.6% 0.7% 0.4%
Wholesale trade 0.2% 0.6% 0.4% 0.1%Executive, administrative, and managerial 0.2% 0.6% 0.4% 0.1%
Retail trade 10.4% 21.0% 13.3% 7.9%Executive, administrative, and managerial 2.0% 4.5% 2.5% 4.9%Marketing and sales occupations 5.2% 10.8% 7.0% 2.2%Administrative support occupations, including clerical 0.5% 1.3% 0.7% 0.1%Service occupations 1.7% 4.5% 2.5% 0.6%Mechanics and repairers 1.0% 1.9% 1.4% 0.1%
Finance, insurance, and real estate 0.2% 0.6% 0.4% 0.0%Administrative support occupations, including clerical 0.2% 0.6% 0.4% 0.0%
Services 19.4% 36.3% 24.6% 11.7%Executive, administrative, and managerial 2.0% 3.8% 2.8% 1.9%Social scientists, social workers, religious workers, and lawyers 0.2% 0.6% 0.4% 0.3%
Teachers, librarians, and counselors 0.2% 0.6% 0.4% 0.0%Registered nurses, pharmacists, dietitians, therapists, and physicians assistants 0.7% 1.9% 1.1% 0.7%
Health technologists and technicians 0.7% 1.9% 1.1% 0.9%Technologists and technicians, except health 0.2% 0.6% 0.4% 0.2%Marketing and sales occupations 0.2% 0.6% 0.4% 0.2%Administrative support occupations, including clerical 1.2% 3.2% 1.8% 1.5%Service occupations 6.9% 14.0% 9.5% 2.1%Mechanics and repairers 1.0% 2.5% 1.4% 0.2%Construction and extractive occupations 0.7% 1.9% 1.1% 1.4%Production working occupations 0.2% 0.6% 0.4% 0.2%Transportation and material moving occupations 0.2% 0.6% 0.4% 0.0%Handlers, equipment cleaners, helpers, and laborers 3.2% 6.4% 4.2% 0.7%Occupation not indicated 1.2% 2.5% 1.4% 1.6%
Industry not indicated 2.5% 5.7% 3.5% 1.1%Executive, administrative, and managerial 1.7% 3.8% 2.5% 0.9%Technologists and technicians, except health 0.2% 0.6% 0.4% 0.1%Service occupations 0.2% 0.6% 0.4% 0.0%Mechanics and repairers 0.2% 0.6% 0.4% 0.1%
Source ADF&G Division of Subsistence household surveys, 2015.
Table 4-8.–Page 2 of 2.
197
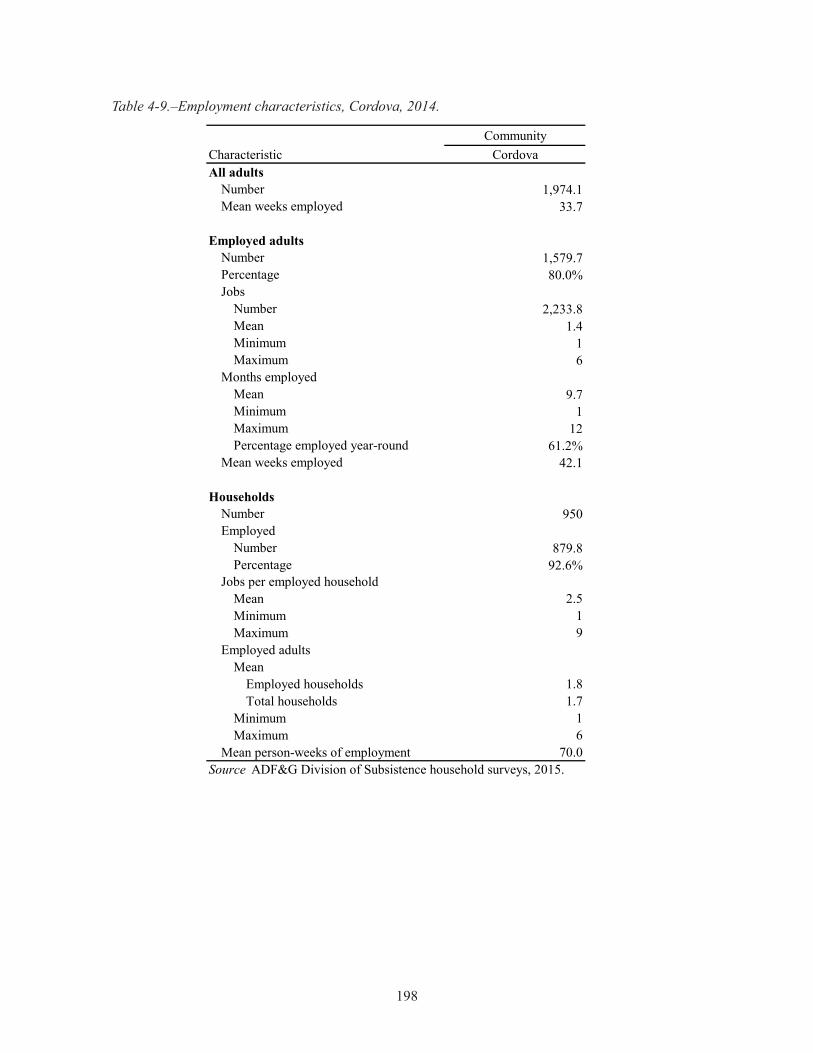
Table 4-9.–Employment characteristics, Cordova, 2014.
CommunityCordova
1,974.133.7
1,579.780.0%
2,233.81.4
16
9.71
1261.2%
42.1
950
879.892.6%
2.519
1.81.7
16
70.0
Characteristic
Source ADF&G Division of Subsistence household surveys, 2015.
All adultsNumberMean weeks employed
Employed adultsNumber
Households
Mean
MeanMinimum
PercentageJobs per employed household
MaximumPercentage employed year-round
MaximumEmployed adults
MeanMinimum
PercentageJobs
Number
Mean person-weeks of employment
MinimumMaximum
Minimum
Total households
NumberEmployed
MeanEmployed households
Months employedMaximum
Number
Mean weeks employed
198
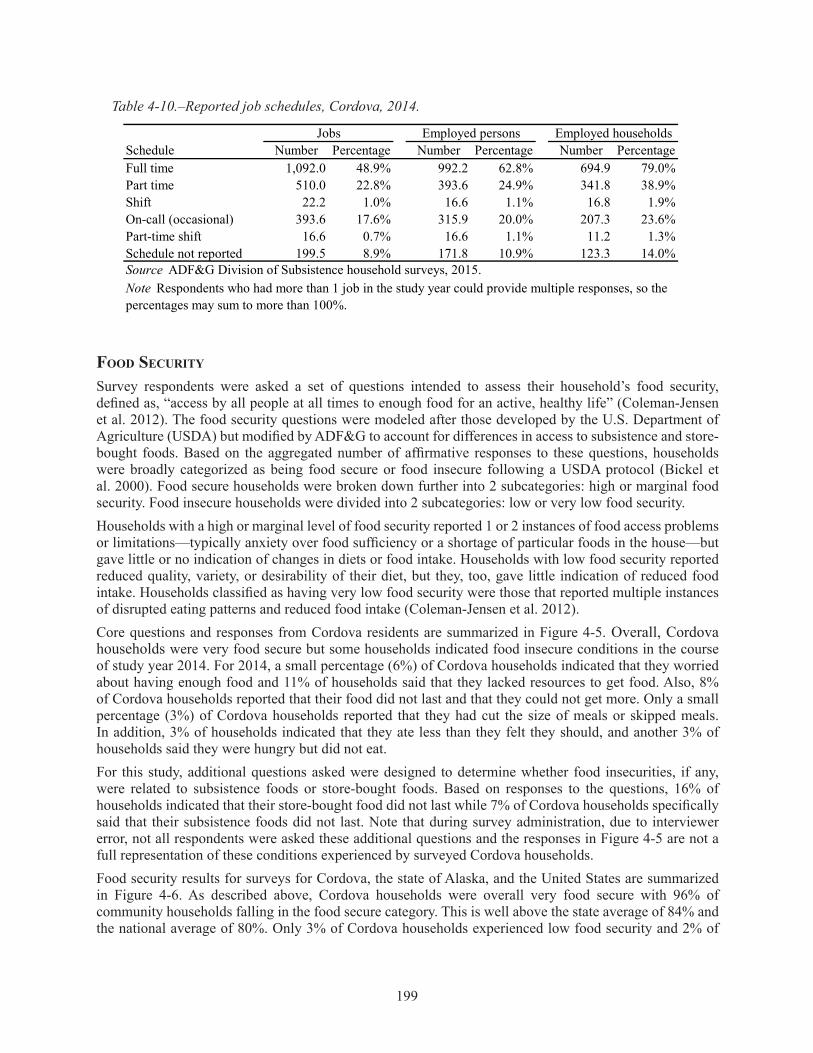
Table 4-10.–Reported job schedules, Cordova, 2014.
Food Security
Survey respondents were asked a set of questions intended to assess their household’s food security, defined as, “access by all people at all times to enough food for an active, healthy life” (Coleman-Jensen et al. 2012). The food security questions were modeled after those developed by the U.S. Department of Agriculture (USDA) but modified by ADF&G to account for differences in access to subsistence and store-bought foods. Based on the aggregated number of affirmative responses to these questions, households were broadly categorized as being food secure or food insecure following a USDA protocol (Bickel et al. 2000). Food secure households were broken down further into 2 subcategories: high or marginal food security. Food insecure households were divided into 2 subcategories: low or very low food security.Households with a high or marginal level of food security reported 1 or 2 instances of food access problems or limitations—typically anxiety over food sufficiency or a shortage of particular foods in the house—but gave little or no indication of changes in diets or food intake. Households with low food security reported reduced quality, variety, or desirability of their diet, but they, too, gave little indication of reduced food intake. Households classified as having very low food security were those that reported multiple instances of disrupted eating patterns and reduced food intake (Coleman-Jensen et al. 2012).Core questions and responses from Cordova residents are summarized in Figure 4-5. Overall, Cordova households were very food secure but some households indicated food insecure conditions in the course of study year 2014. For 2014, a small percentage (6%) of Cordova households indicated that they worried about having enough food and 11% of households said that they lacked resources to get food. Also, 8% of Cordova households reported that their food did not last and that they could not get more. Only a small percentage (3%) of Cordova households reported that they had cut the size of meals or skipped meals. In addition, 3% of households indicated that they ate less than they felt they should, and another 3% of households said they were hungry but did not eat.For this study, additional questions asked were designed to determine whether food insecurities, if any, were related to subsistence foods or store-bought foods. Based on responses to the questions, 16% of households indicated that their store-bought food did not last while 7% of Cordova households specifically said that their subsistence foods did not last. Note that during survey administration, due to interviewer error, not all respondents were asked these additional questions and the responses in Figure 4-5 are not a full representation of these conditions experienced by surveyed Cordova households.Food security results for surveys for Cordova, the state of Alaska, and the United States are summarized in Figure 4-6. As described above, Cordova households were overall very food secure with 96% of community households falling in the food secure category. This is well above the state average of 84% and the national average of 80%. Only 3% of Cordova households experienced low food security and 2% of
Number Percentage Number Percentage Number PercentageFull time 1,092.0 48.9% 992.2 62.8% 694.9 79.0%Part time 510.0 22.8% 393.6 24.9% 341.8 38.9%Shift 22.2 1.0% 16.6 1.1% 16.8 1.9%On-call (occasional) 393.6 17.6% 315.9 20.0% 207.3 23.6%Part-time shift 16.6 0.7% 16.6 1.1% 11.2 1.3%Schedule not reported 199.5 8.9% 171.8 10.9% 123.3 14.0%
Note Respondents who had more than 1 job in the study year could provide multiple responses, so the percentages may sum to more than 100%.
Schedule
Source ADF&G Division of Subsistence household surveys, 2015.
Jobs Employed persons Employed households
199
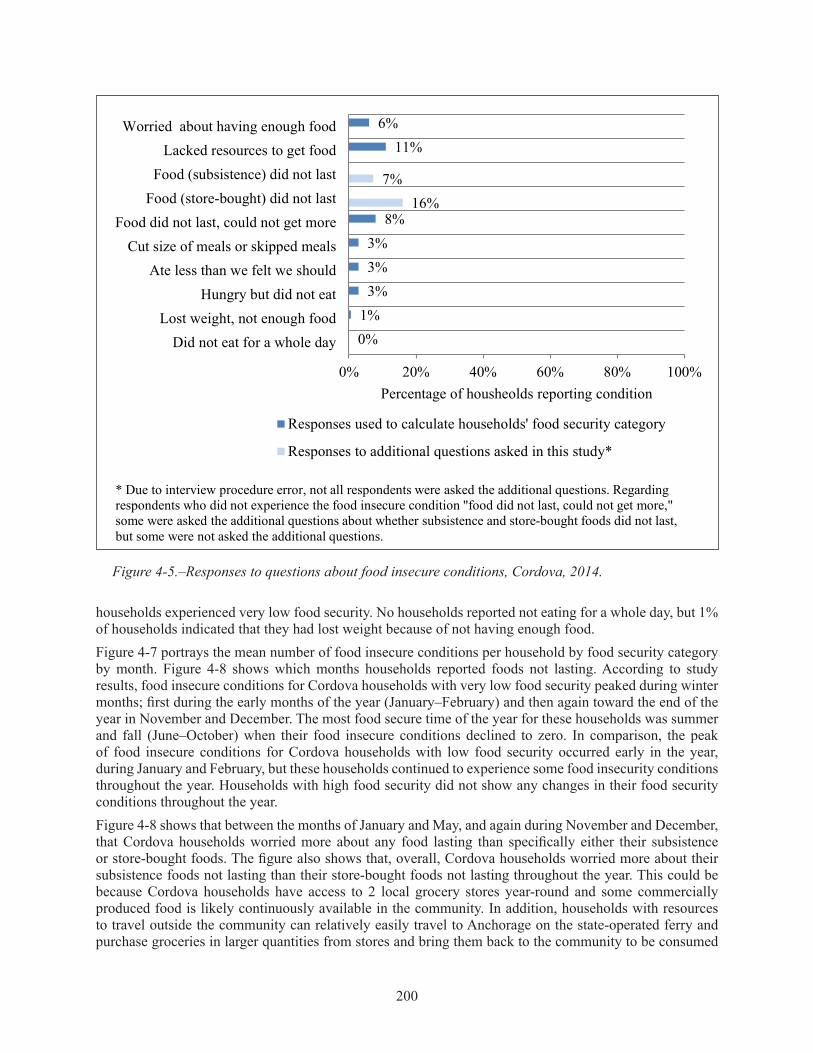
Figure 4-5.–Responses to questions about food insecure conditions, Cordova, 2014.
6%11%
8%3%3%3%
1%0%
7%16%
0% 20% 40% 60% 80% 100%
Worried about having enough foodLacked resources to get food
Food (subsistence) did not lastFood (store-bought) did not last
Food did not last, could not get moreCut size of meals or skipped meals
Ate less than we felt we shouldHungry but did not eat
Lost weight, not enough foodDid not eat for a whole day
Percentage of housheolds reporting condition
Responses used to calculate households' food security category
Responses to additional questions asked in this study*
* Due to interview procedure error, not all respondents were asked the additional questions. Regarding respondents who did not experience the food insecure condition "food did not last, could not get more,"some were asked the additional questions about whether subsistence and store-bought foods did not last,but some were not asked the additional questions.
households experienced very low food security. No households reported not eating for a whole day, but 1% of households indicated that they had lost weight because of not having enough food.Figure 4-7 portrays the mean number of food insecure conditions per household by food security category by month. Figure 4-8 shows which months households reported foods not lasting. According to study results, food insecure conditions for Cordova households with very low food security peaked during winter months; first during the early months of the year (January–February) and then again toward the end of the year in November and December. The most food secure time of the year for these households was summer and fall (June–October) when their food insecure conditions declined to zero. In comparison, the peak of food insecure conditions for Cordova households with low food security occurred early in the year, during January and February, but these households continued to experience some food insecurity conditions throughout the year. Households with high food security did not show any changes in their food security conditions throughout the year.Figure 4-8 shows that between the months of January and May, and again during November and December, that Cordova households worried more about any food lasting than specifically either their subsistence or store-bought foods. The figure also shows that, overall, Cordova households worried more about their subsistence foods not lasting than their store-bought foods not lasting throughout the year. This could be because Cordova households have access to 2 local grocery stores year-round and some commercially produced food is likely continuously available in the community. In addition, households with resources to travel outside the community can relatively easily travel to Anchorage on the state-operated ferry and purchase groceries in larger quantities from stores and bring them back to the community to be consumed
200

Figure 4-6.–Comparison of food security categories, Cordova, Alaska, and United States, 2014.
96%84% 80%
3%12% 15%
2% 5% 6%
0%
10%
20%
30%
40%
50%
60%
70%
80%
90%
100%
Cordova 2014(this study)
Alaska 2013(USDA)*
United States2013 (USDA)
Perc
enta
ge o
f hou
seho
lds
INSECURE–Very low food security
INSECURE–Low food security
SECURE–High and marginal food security
* Average, 2011–2013.
over a longer period of time. Looking at subsistence foods alone, the peak time for Cordova households to worry about their subsistence foods not lasting were during winter and early spring months (January–March) and again in December. This pattern is typical for rural Alaska communities, whose residents generally are able to begin to harvest and consume in earnest some fresh wild foods—such as migratory birds, first runs of fish, and vegetation—in late spring after winter subsides. The harvest, processing, and consumption of wild resources typically continue through the summer and fall months when more wild resources are available, which can lead to decreased levels of food insecurity.
SuMMary oF harveSt and uSe PatternS
Individual Participation in the Harvesting and Processing of Wild ResourcesTable 4-11 reports the expanded levels of individual participation in the harvest and processing of wild resources by all Cordova residents in 2014. Approximately 77% of residents participated in the harvest of wild resources. With regard to specific resource categories, 70% of residents gathered vegetation, 60% fished, 32% hunted for large land mammals, 15% hunted birds and collected eggs, and 9% hunted or trapped for small land mammals and furbearers. A slightly smaller number of residents (74%) participated in processing wild resources than harvesting some. Looking at the individual resource categories, 64% of residents processed vegetation and 37% of residents participated in processing large land mammals. The same number of individuals (15%) processed birds and eggs as went hunting or collecting. In the remaining resource categories, the individual participation in processing activities was nearly the same as harvesting; 59% processed fish, and 8% processed small land mammals and furbearers. The survey did not record any community residents hunting or processing marine mammals even though a small number of households reported using some.
201
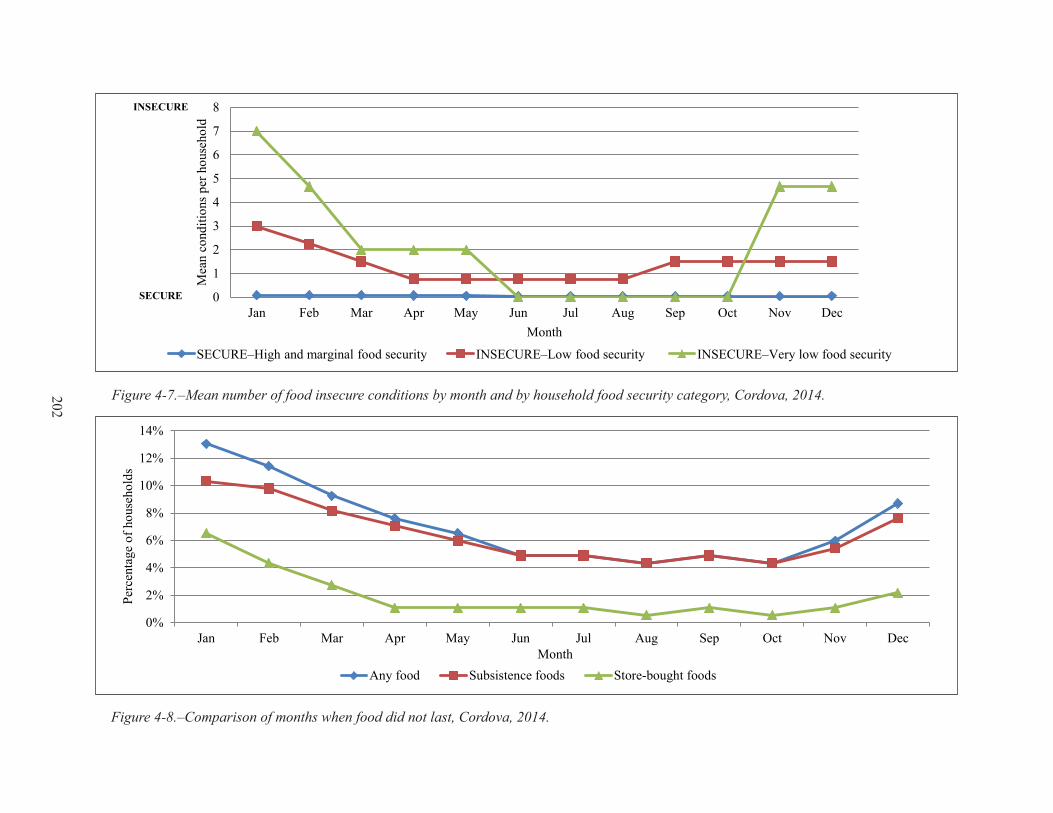
Figure 4-7.–Mean number of food insecure conditions by month and by household food security category, Cordova, 2014.
0
1
2
3
4
5
6
7
8
Jan Feb Mar Apr May Jun Jul Aug Sep Oct Nov Dec
Mea
n co
nditi
ons p
er h
ouse
hold
Month
SECURE–High and marginal food security INSECURE–Low food security INSECURE–Very low food security
INSECURE
SECURE
Figure 4-8.–Comparison of months when food did not last, Cordova, 2014.
0%
2%
4%
6%
8%
10%
12%
14%
Jan Feb Mar Apr May Jun Jul Aug Sep Oct Nov Dec
Perc
enta
ge o
f hou
seho
lds
MonthAny food Subsistence foods Store-bought foods
202

Table 4-11.–Individual participation in subsistence harvesting and processing activities, Cordova, 2014.
2,602.2
Number 1,550.5Percentage 59.6%
Number 1,526.5Percentage 58.7%
Number 825.7Percentage 31.7%
Number 960.1Percentage 36.9%
Number 244.5Percentage 9.4%
Number 206.9Percentage 7.9%
Marine mammals
Number 0.0Percentage 0.0%
Number 0.0Percentage 0.0%
Number 401.2Percentage 15.4%
Number 397.4Percentage 15.3%
Number 1,809Percentage 69.5%
Number 1,671.3Percentage 64.2%
Number 1,998Percentage 76.8%
Number 1,931Percentage 74.2%
Process
Gather
Source ADF&G Division of Subsistence household surveys, 2015.
Process
Total number of people
Birds and eggs
Fish
Large land mammalsHunt
Process
Process
Attempt harvest
Small land mammals
Vegetation
Any resource
Process
Fish
Process
Hunt
Hunt/gather
Process
Hunt or trap
203

The previous household survey from 2003 documented levels of individual participation for 4 major resource categories (game, fish, furbearers, and plants) and “any resource” (Fall 2006:17). Comparing results for these categories shows that approximately the same proportion of people in Cordova fished and processed fish in 2014 compared to 2003 when 62% of individuals fished. Study results indicate that the number of community residents involved in fish processing declined slightly in 2014 compared to 66% of individuals who processed some fish in 2003. Large game was hunted by slightly more people in 2014 (32% of individuals) than in 2003 (30%) but more individuals (42%) processed large game in 2003 than in 2014 (37% of individuals). Participation in small game harvest and processing has remained low in both study years with approximately 12% of individuals participating in hunting and trapping activities in 2003 while approximately 9% of community members did so in 2014. A similar, small decline has also happened with participation in processing activities; in 2003, approximately 12% of individuals said they processed small land mammals but in 2014 the number had declined to 8% of community members. Survey results show that more people in Cordova harvested (70%) and processed (64%) plant resources in 2014 than in 2003 when 64% of community residents gathered plant resources and 59% processed some. Regarding “any resource,” the individual levels of participation in both study years were very similar; in 2003 approximately 79% of community members harvested some wild resources and 77% did so in 2014. For processing, slightly more individuals (76% of individuals) processed resources in 2003 than in 2014 (74%). Based on previous and most recent survey data, the individual levels of participation in harvesting and processing activities overall appear to have remained stable in Cordova in the 21st century.
Harvest and Use of Wild Resources at the Household LevelFigure 4-9 shows by resource category the percentages of households that used wild resources, and also attempted to harvest and harvested wild foods. For study year 2014, salmon was the most commonly used resource in Cordova with 92% of community households using some. Vegetation was used by 88% of households, large land mammals by 79% of households, and nonsalmon fish by 76% of households. Fewer households (38%) used marine invertebrates, birds and eggs (34%), small land mammals and furbearers (11%), and marine mammals (4%). Regarding household levels of attempting to harvest and successfully harvesting wild resources, slightly more households generally attempted to harvest than actually successfully harvested resources. The category exhibiting the largest difference in the percentage of households attempting to harvest (47%) and harvesting (33% of households harvested) resources was large land mammals. No surveyed households attempted to harvest or harvested marine mammals in 2014.Table 4-12 summarizes resource harvest and use characteristics for Cordova in 2014 at the household level. The average harvest was 318 lb usable weight per household and 116 lb per capita. During the study year, community households on average attempted to harvest 8 kinds of resources, harvested an average of 7 kinds of resources, and used an average of 10 kinds of resources. The maximum number of resources used by any household was 36. In addition, households gave away an average of 4 kinds of resources. Overall, as many as 173 species were available for households to harvest in the study area; this included species that survey respondents identified but were not asked about in the survey instrument.Comparing household harvest and use characteristics of wild resources at the “all resources” level from the previous study year in 2003 to estimates for study year 2014 shows that more Cordova households used, attempted to harvest, harvested, and received wild resources in 2014 than in 2003 (Fall 2006:18) (Table 4-12). The level of sharing of wild resources was the same in both study years (84% of households gave away resources). The 2014 survey results show that Cordova households on average attempted to harvest and harvested the same amount of different kinds of resources (8 kinds), and successfully harvested the same amount of different kinds of resources (7 kinds) during 2003 and 2014. However, in 2014, the average number of resources used by Cordova households had declined to 10 from approximately 12 kinds of resources estimated in the previous study.
204
Figure 4-9.–Percentages of households using, attempting to harvest, and harvesting wild resources, by resource category, Cordova, 2014.
92%
76%79%
11%
4%
34%38%
88%
72%
53%47%
13%
0%
27%23%
83%
69%
50%
33%
10%
21% 21%
80%
0%
10%
20%
30%
40%
50%
60%
70%
80%
90%
100%Pe
rcen
tage
of h
ouse
hold
s
Percent of households using Percent of households attempting harvest
Percent of households harvesting
harveSt QuantitieS and coMPoSition
Table 4-13 reports estimated wild resource harvests and uses by Cordova residents in 2014 and is organized first by general category and then by species. All edible resources are reported in pounds usable weight (see Appendix B for conversion factors9). The harvest category includes resources harvested by any member of the surveyed household during the study year. The use category includes all resources taken, given away, or used by a household, and resources acquired from other harvesters, either as gifts, by barter or trade, through hunting partnerships, or as meat given by hunting guides and non-local hunters. Purchased foods are not included, but resources such as firewood are included because they are an important part of the subsistence way of life. Differences between harvest and use percentages reflect sharing among households, which results in a wider distribution of wild foods.In 2014, Cordova residents harvested an estimated total of 302,404 lb, or 116 lb per capita (Table 4-13). Compared to all previous study years, the total estimated harvest and the per capita harvest for study year 2014 are the lowest estimated for Cordova thus far (CSIS). In terms of pounds harvested, salmon (114,031 lb, or 38% of total harvest) and large land mammals (104,165 lb, or 35% of total harvest) made up the largest portions of the 2014 harvest (Table 4-13; Figure 4-10). In terms of per capita harvest, the salmon harvest totaled 44 lb compared to 40 lb per capita of large land mammals harvested (Table 4-13). Nonsalmon fish contributed 15% of the harvest with 46,199 lb total, or 18 lb per capita (Figure 4-10; Table 4-13). Vegetation as a category, including berries and seaweed, contributed the fourth greatest usable harvest weight to the
9. Resources that are not eaten, such as firewood and some furbearers, are included in the table but are given a conversion factor of zero.
205

Table 4-12.–Resource harvest and use characteristics, Cordova, 2014.
10.4Minimum 0Maximum 3695% confidence limit (±) 8.1%Median 9
7.7Minimum 0Maximum 3495% confidence limit (±) 10.8%Median 6
7.0Minimum 0Maximum 2995% confidence limit (±) 10.8%Median 6
4.8Minimum 0Maximum 2195% confidence limit (±) 11.1%Median 4
3.6Minimum 0Maximum 2195% confidence limit (±) 14.9%Median 2
Minimum 0Maximum 2,319Mean 318.3Median 156
302,404.3116.2
98.4%94.0%92.9%90.2%73.9%
184
173
Percentage using any resourcePercentage attempting to harvest any resourcePercentage harvesting any resource
Mean number of resources given away per household
Source ADF&G Division of Subsistence household surveys, 2015.
Percentage receiving any resourcePercentage giving away any resourceNumber of households in sampleNumber of resources asked about and identified voluntarily by respondents
Household harvest (pounds)
Total harvest weight (lb)Community per capita harvest (lb)
Mean number of resources used per household
Mean number of resources attempted to harvest per household
Mean number of resources harvested per household
Mean number of resources received per household
Characteristic
206
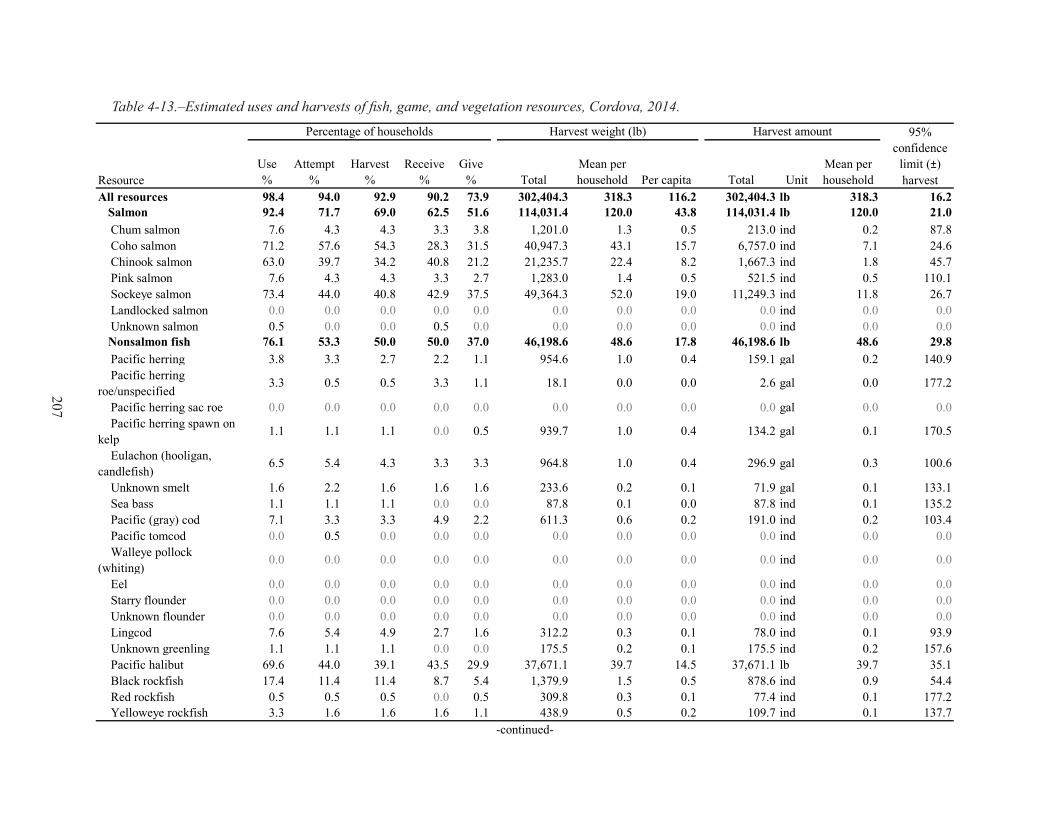
Table 4-13.–Estimated uses and harvests of fish, game, and vegetation resources, Cordova, 2014.
Use%
Attempt %
Harvest %
Receive %
Give % Total
Mean per household Per capita Total Unit
Mean per household
All resources 98.4 94.0 92.9 90.2 73.9 302,404.3 318.3 116.2 302,404.3 lb 318.3 16.2Salmon 92.4 71.7 69.0 62.5 51.6 114,031.4 120.0 43.8 114,031.4 lb 120.0 21.0
Chum salmon 7.6 4.3 4.3 3.3 3.8 1,201.0 1.3 0.5 213.0 ind 0.2 87.8 Coho salmon 71.2 57.6 54.3 28.3 31.5 40,947.3 43.1 15.7 6,757.0 ind 7.1 24.6 Chinook salmon 63.0 39.7 34.2 40.8 21.2 21,235.7 22.4 8.2 1,667.3 ind 1.8 45.7 Pink salmon 7.6 4.3 4.3 3.3 2.7 1,283.0 1.4 0.5 521.5 ind 0.5 110.1 Sockeye salmon 73.4 44.0 40.8 42.9 37.5 49,364.3 52.0 19.0 11,249.3 ind 11.8 26.7 Landlocked salmon 0.0 0.0 0.0 0.0 0.0 0.0 0.0 0.0 0.0 ind 0.0 0.0 Unknown salmon 0.5 0.0 0.0 0.5 0.0 0.0 0.0 0.0 0.0 ind 0.0 0.0
Nonsalmon fish 76.1 53.3 50.0 50.0 37.0 46,198.6 48.6 17.8 46,198.6 lb 48.6 29.8 Pacific herring 3.8 3.3 2.7 2.2 1.1 954.6 1.0 0.4 159.1 gal 0.2 140.9 Pacific herring roe/unspecified
3.3 0.5 0.5 3.3 1.1 18.1 0.0 0.0 2.6 gal 0.0 177.2
Pacific herring sac roe 0.0 0.0 0.0 0.0 0.0 0.0 0.0 0.0 0.0 gal 0.0 0.0 Pacific herring spawn on kelp
1.1 1.1 1.1 0.0 0.5 939.7 1.0 0.4 134.2 gal 0.1 170.5
Eulachon (hooligan, candlefish)
6.5 5.4 4.3 3.3 3.3 964.8 1.0 0.4 296.9 gal 0.3 100.6
Unknown smelt 1.6 2.2 1.6 1.6 1.6 233.6 0.2 0.1 71.9 gal 0.1 133.1 Sea bass 1.1 1.1 1.1 0.0 0.0 87.8 0.1 0.0 87.8 ind 0.1 135.2 Pacific (gray) cod 7.1 3.3 3.3 4.9 2.2 611.3 0.6 0.2 191.0 ind 0.2 103.4 Pacific tomcod 0.0 0.5 0.0 0.0 0.0 0.0 0.0 0.0 0.0 ind 0.0 0.0 Walleye pollock (whiting)
0.0 0.0 0.0 0.0 0.0 0.0 0.0 0.0 0.0 ind 0.0 0.0
Eel 0.0 0.0 0.0 0.0 0.0 0.0 0.0 0.0 0.0 ind 0.0 0.0 Starry flounder 0.0 0.0 0.0 0.0 0.0 0.0 0.0 0.0 0.0 ind 0.0 0.0 Unknown flounder 0.0 0.0 0.0 0.0 0.0 0.0 0.0 0.0 0.0 ind 0.0 0.0 Lingcod 7.6 5.4 4.9 2.7 1.6 312.2 0.3 0.1 78.0 ind 0.1 93.9 Unknown greenling 1.1 1.1 1.1 0.0 0.0 175.5 0.2 0.1 175.5 ind 0.2 157.6 Pacific halibut 69.6 44.0 39.1 43.5 29.9 37,671.1 39.7 14.5 37,671.1 lb 39.7 35.1 Black rockfish 17.4 11.4 11.4 8.7 5.4 1,379.9 1.5 0.5 878.6 ind 0.9 54.4 Red rockfish 0.5 0.5 0.5 0.0 0.5 309.8 0.3 0.1 77.4 ind 0.1 177.2 Yelloweye rockfish 3.3 1.6 1.6 1.6 1.1 438.9 0.5 0.2 109.7 ind 0.1 137.7
Percentage of households Harvest weight (lb) Harvest amount
Resource
95%confidence
limit (±)harvest
-continued-
207
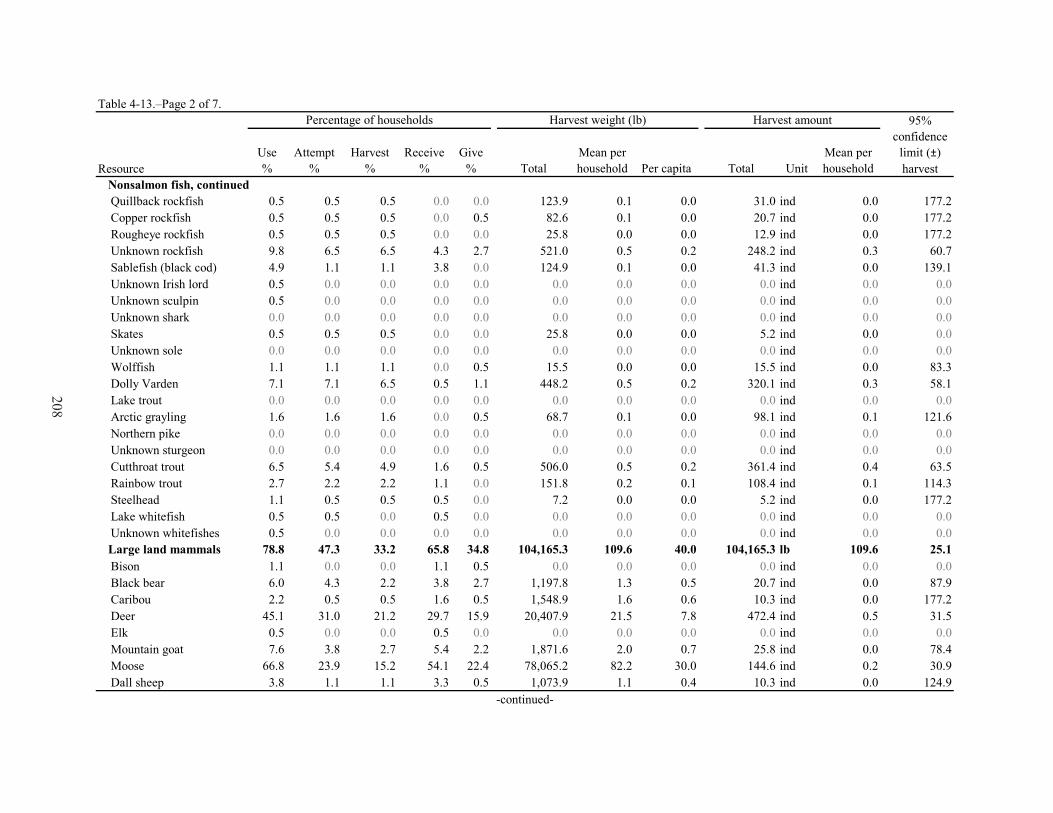
Use%
Attempt %
Harvest %
Receive %
Give % Total
Mean per household Per capita Total Unit
Mean per household
Quillback rockfish 0.5 0.5 0.5 0.0 0.0 123.9 0.1 0.0 31.0 ind 0.0 177.2 Copper rockfish 0.5 0.5 0.5 0.0 0.5 82.6 0.1 0.0 20.7 ind 0.0 177.2 Rougheye rockfish 0.5 0.5 0.5 0.0 0.0 25.8 0.0 0.0 12.9 ind 0.0 177.2 Unknown rockfish 9.8 6.5 6.5 4.3 2.7 521.0 0.5 0.2 248.2 ind 0.3 60.7 Sablefish (black cod) 4.9 1.1 1.1 3.8 0.0 124.9 0.1 0.0 41.3 ind 0.0 139.1 Unknown Irish lord 0.5 0.0 0.0 0.0 0.0 0.0 0.0 0.0 0.0 ind 0.0 0.0 Unknown sculpin 0.5 0.0 0.0 0.0 0.0 0.0 0.0 0.0 0.0 ind 0.0 0.0 Unknown shark 0.0 0.0 0.0 0.0 0.0 0.0 0.0 0.0 0.0 ind 0.0 0.0 Skates 0.5 0.5 0.5 0.0 0.0 25.8 0.0 0.0 5.2 ind 0.0 0.0 Unknown sole 0.0 0.0 0.0 0.0 0.0 0.0 0.0 0.0 0.0 ind 0.0 0.0 Wolffish 1.1 1.1 1.1 0.0 0.5 15.5 0.0 0.0 15.5 ind 0.0 83.3 Dolly Varden 7.1 7.1 6.5 0.5 1.1 448.2 0.5 0.2 320.1 ind 0.3 58.1 Lake trout 0.0 0.0 0.0 0.0 0.0 0.0 0.0 0.0 0.0 ind 0.0 0.0 Arctic grayling 1.6 1.6 1.6 0.0 0.5 68.7 0.1 0.0 98.1 ind 0.1 121.6 Northern pike 0.0 0.0 0.0 0.0 0.0 0.0 0.0 0.0 0.0 ind 0.0 0.0 Unknown sturgeon 0.0 0.0 0.0 0.0 0.0 0.0 0.0 0.0 0.0 ind 0.0 0.0 Cutthroat trout 6.5 5.4 4.9 1.6 0.5 506.0 0.5 0.2 361.4 ind 0.4 63.5 Rainbow trout 2.7 2.2 2.2 1.1 0.0 151.8 0.2 0.1 108.4 ind 0.1 114.3 Steelhead 1.1 0.5 0.5 0.5 0.0 7.2 0.0 0.0 5.2 ind 0.0 177.2 Lake whitefish 0.5 0.5 0.0 0.5 0.0 0.0 0.0 0.0 0.0 ind 0.0 0.0 Unknown whitefishes 0.5 0.0 0.0 0.0 0.0 0.0 0.0 0.0 0.0 ind 0.0 0.0
Large land mammals 78.8 47.3 33.2 65.8 34.8 104,165.3 109.6 40.0 104,165.3 lb 109.6 25.1 Bison 1.1 0.0 0.0 1.1 0.5 0.0 0.0 0.0 0.0 ind 0.0 0.0 Black bear 6.0 4.3 2.2 3.8 2.7 1,197.8 1.3 0.5 20.7 ind 0.0 87.9 Caribou 2.2 0.5 0.5 1.6 0.5 1,548.9 1.6 0.6 10.3 ind 0.0 177.2 Deer 45.1 31.0 21.2 29.7 15.9 20,407.9 21.5 7.8 472.4 ind 0.5 31.5 Elk 0.5 0.0 0.0 0.5 0.0 0.0 0.0 0.0 0.0 ind 0.0 0.0 Mountain goat 7.6 3.8 2.7 5.4 2.2 1,871.6 2.0 0.7 25.8 ind 0.0 78.4 Moose 66.8 23.9 15.2 54.1 22.4 78,065.2 82.2 30.0 144.6 ind 0.2 30.9 Dall sheep 3.8 1.1 1.1 3.3 0.5 1,073.9 1.1 0.4 10.3 ind 0.0 124.9
Nonsalmon fish, continued
Table 4-13.–Page 2 of 7.
Resource
Percentage of households Harvest weight (lb) Harvest amount 95%confidence
limit (±)harvest
-continued-
208

Use%
Attempt %
Harvest %
Receive %
Give % Total
Mean per household Per capita Total Unit
Mean per household
Small land mammals 10.9 13.0 10.3 0.5 1.1 922.7 1.0 0.4 922.7 lb 1.0 75.7 Beaver 1.6 1.6 1.6 0.0 0.0 496.9 0.5 0.2 72.3 ind 0.1 125.5 Coyote 2.2 3.3 2.2 0.0 0.0 0.0 0.0 0.0 46.5 ind 0.0 101.7 Red fox 0.0 0.0 0.0 0.0 0.0 0.0 0.0 0.0 0.0 ind 0.0 0.0 Snowshoe hare 6.0 9.2 6.0 0.0 1.1 425.8 0.4 0.2 223.2 ind 0.2 76.8 North American river (land) otter 2.2 2.2 2.2 0.0 0.0 0.0 0.0 0.0 51.6 ind 0.1 102.8
Lynx 0.0 0.5 0.0 0.0 0.0 0.0 0.0 0.0 0.0 ind 0.0 0.0 Marten 1.1 2.2 1.1 0.0 0.0 0.0 0.0 0.0 56.8 ind 0.1 161.8 Mink 2.2 2.2 2.2 0.0 0.0 0.0 0.0 0.0 56.8 ind 0.1 91.8 Muskrat 0.5 0.5 0.5 0.0 0.0 0.0 0.0 0.0 15.5 ind 0.0 177.2 Porcupine 0.5 0.5 0.0 0.5 0.0 0.0 0.0 0.0 0.0 ind 0.0 0.0 Arctic ground (parka) squirrel 0.0 0.0 0.0 0.0 0.0 0.0 0.0 0.0 0.0 ind 0.0 0.0
Red (tree) squirrel 0.0 0.0 0.0 0.0 0.0 0.0 0.0 0.0 0.0 ind 0.0 0.0 Weasel 2.2 2.2 2.2 0.0 0.0 0.0 0.0 0.0 87.8 ind 0.1 112.3 Gray wolf 0.0 1.1 0.0 0.0 0.0 0.0 0.0 0.0 0.0 ind 0.0 0.0 Wolverine 1.1 1.6 1.1 0.0 0.0 0.0 0.0 0.0 20.7 ind 0.0 139.8
Marine mammals 4.3 0.0 0.0 4.3 0.5 0.0 0.0 0.0 0.0 lb 0.0 0.0 Harbor seal 3.3 0.0 0.0 3.3 0.5 0.0 0.0 0.0 0.0 ind 0.0 0.0 Sea otter 0.5 0.0 0.0 0.5 0.0 0.0 0.0 0.0 0.0 ind 0.0 0.0 Steller sea lion 0.5 0.0 0.0 0.5 0.0 0.0 0.0 0.0 0.0 ind 0.0 0.0
Birds and eggs 33.7 26.6 21.2 17.9 9.2 3,797.8 4.0 1.5 3,797.8 lb 4.0 52.0 Bufflehead 0.5 0.5 0.5 0.5 0.0 2.1 0.0 0.0 5.2 ind 0.0 177.2 Canvasback 0.5 0.5 0.5 0.0 0.5 56.8 0.1 0.0 51.6 ind 0.1 177.2 Unknown eider 0.0 0.5 0.0 0.0 0.0 0.0 0.0 0.0 0.0 ind 0.0 0.0 Goldeneye 2.2 1.6 1.6 1.1 0.5 53.7 0.1 0.0 67.1 ind 0.1 138.8 Harlequin duck 0.0 0.0 0.0 0.0 0.0 0.0 0.0 0.0 0.0 ind 0.0 0.0 Mallard 21.2 17.4 14.1 8.7 4.9 1,442.1 1.5 0.6 1,602.3 ind 1.7 52.0 Unknown merganser 0.5 0.5 0.5 0.0 0.0 13.9 0.0 0.0 15.5 ind 0.0 177.2 Long-tailed duck 1.1 1.1 1.1 0.0 0.5 45.4 0.0 0.0 56.8 ind 0.1 161.1
Table 4-13.–Page 3 of 7.
Resource
Percentage of households Harvest weight (lb) Harvest amount 95%confidence
limit (±)harvest
-continued-
209
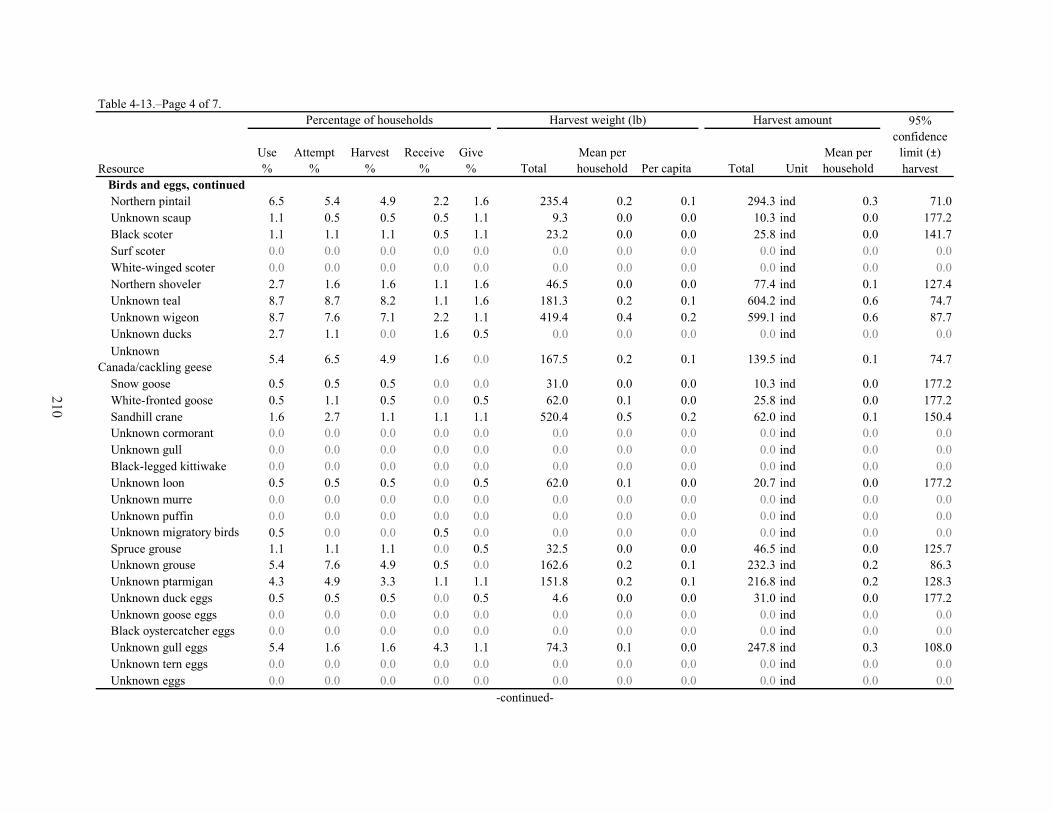
Use%
Attempt %
Harvest %
Receive %
Give % Total
Mean per household Per capita Total Unit
Mean per household
Northern pintail 6.5 5.4 4.9 2.2 1.6 235.4 0.2 0.1 294.3 ind 0.3 71.0 Unknown scaup 1.1 0.5 0.5 0.5 1.1 9.3 0.0 0.0 10.3 ind 0.0 177.2 Black scoter 1.1 1.1 1.1 0.5 1.1 23.2 0.0 0.0 25.8 ind 0.0 141.7 Surf scoter 0.0 0.0 0.0 0.0 0.0 0.0 0.0 0.0 0.0 ind 0.0 0.0 White-winged scoter 0.0 0.0 0.0 0.0 0.0 0.0 0.0 0.0 0.0 ind 0.0 0.0 Northern shoveler 2.7 1.6 1.6 1.1 1.6 46.5 0.0 0.0 77.4 ind 0.1 127.4 Unknown teal 8.7 8.7 8.2 1.1 1.6 181.3 0.2 0.1 604.2 ind 0.6 74.7 Unknown wigeon 8.7 7.6 7.1 2.2 1.1 419.4 0.4 0.2 599.1 ind 0.6 87.7 Unknown ducks 2.7 1.1 0.0 1.6 0.5 0.0 0.0 0.0 0.0 ind 0.0 0.0 Unknown Canada/cackling geese 5.4 6.5 4.9 1.6 0.0 167.5 0.2 0.1 139.5 ind 0.1 74.7
Snow goose 0.5 0.5 0.5 0.0 0.0 31.0 0.0 0.0 10.3 ind 0.0 177.2 White-fronted goose 0.5 1.1 0.5 0.0 0.5 62.0 0.1 0.0 25.8 ind 0.0 177.2 Sandhill crane 1.6 2.7 1.1 1.1 1.1 520.4 0.5 0.2 62.0 ind 0.1 150.4 Unknown cormorant 0.0 0.0 0.0 0.0 0.0 0.0 0.0 0.0 0.0 ind 0.0 0.0 Unknown gull 0.0 0.0 0.0 0.0 0.0 0.0 0.0 0.0 0.0 ind 0.0 0.0 Black-legged kittiwake 0.0 0.0 0.0 0.0 0.0 0.0 0.0 0.0 0.0 ind 0.0 0.0 Unknown loon 0.5 0.5 0.5 0.0 0.5 62.0 0.1 0.0 20.7 ind 0.0 177.2 Unknown murre 0.0 0.0 0.0 0.0 0.0 0.0 0.0 0.0 0.0 ind 0.0 0.0 Unknown puffin 0.0 0.0 0.0 0.0 0.0 0.0 0.0 0.0 0.0 ind 0.0 0.0 Unknown migratory birds 0.5 0.0 0.0 0.5 0.0 0.0 0.0 0.0 0.0 ind 0.0 0.0 Spruce grouse 1.1 1.1 1.1 0.0 0.5 32.5 0.0 0.0 46.5 ind 0.0 125.7 Unknown grouse 5.4 7.6 4.9 0.5 0.0 162.6 0.2 0.1 232.3 ind 0.2 86.3 Unknown ptarmigan 4.3 4.9 3.3 1.1 1.1 151.8 0.2 0.1 216.8 ind 0.2 128.3 Unknown duck eggs 0.5 0.5 0.5 0.0 0.5 4.6 0.0 0.0 31.0 ind 0.0 177.2 Unknown goose eggs 0.0 0.0 0.0 0.0 0.0 0.0 0.0 0.0 0.0 ind 0.0 0.0 Black oystercatcher eggs 0.0 0.0 0.0 0.0 0.0 0.0 0.0 0.0 0.0 ind 0.0 0.0 Unknown gull eggs 5.4 1.6 1.6 4.3 1.1 74.3 0.1 0.0 247.8 ind 0.3 108.0 Unknown tern eggs 0.0 0.0 0.0 0.0 0.0 0.0 0.0 0.0 0.0 ind 0.0 0.0 Unknown eggs 0.0 0.0 0.0 0.0 0.0 0.0 0.0 0.0 0.0 ind 0.0 0.0
Birds and eggs, continued
Harvest amount 95%confidence
limit (±)harvest
Table 4-13.–Page 4 of 7.
Resource
Percentage of households Harvest weight (lb)
-continued-
210
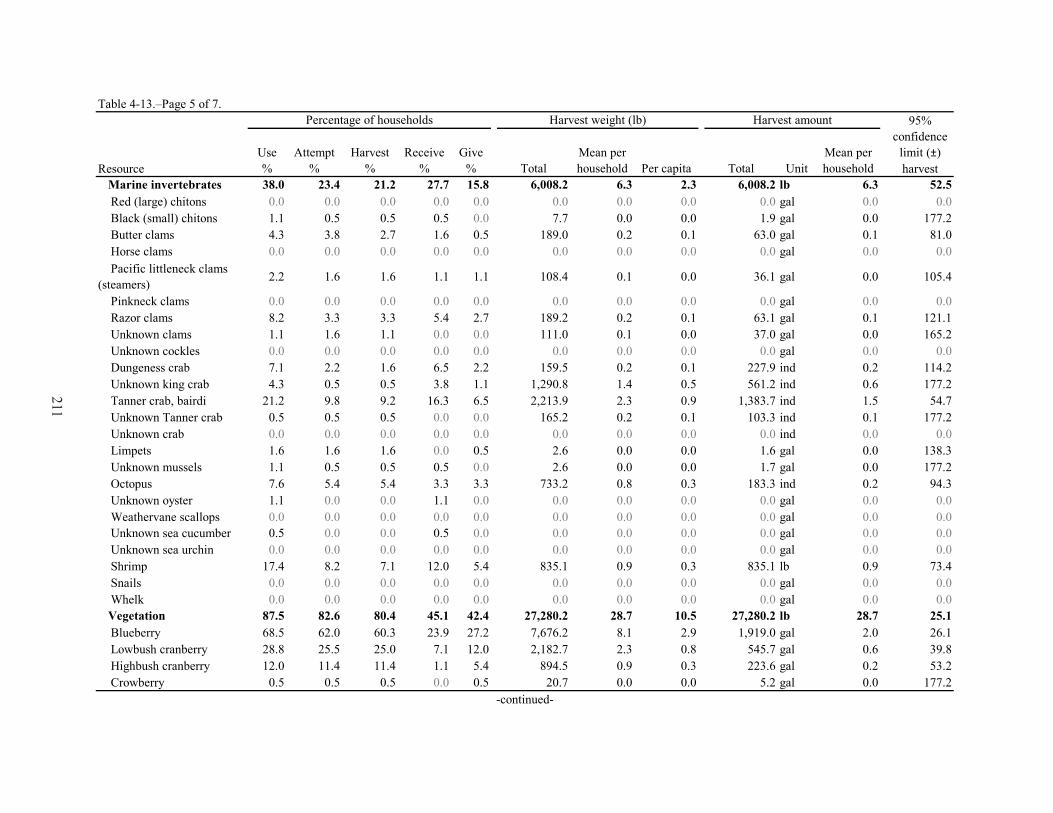
Use%
Attempt %
Harvest %
Receive %
Give % Total
Mean per household Per capita Total Unit
Mean per household
Marine invertebrates 38.0 23.4 21.2 27.7 15.8 6,008.2 6.3 2.3 6,008.2 lb 6.3 52.5 Red (large) chitons 0.0 0.0 0.0 0.0 0.0 0.0 0.0 0.0 0.0 gal 0.0 0.0 Black (small) chitons 1.1 0.5 0.5 0.5 0.0 7.7 0.0 0.0 1.9 gal 0.0 177.2 Butter clams 4.3 3.8 2.7 1.6 0.5 189.0 0.2 0.1 63.0 gal 0.1 81.0 Horse clams 0.0 0.0 0.0 0.0 0.0 0.0 0.0 0.0 0.0 gal 0.0 0.0 Pacific littleneck clams (steamers) 2.2 1.6 1.6 1.1 1.1 108.4 0.1 0.0 36.1 gal 0.0 105.4
Pinkneck clams 0.0 0.0 0.0 0.0 0.0 0.0 0.0 0.0 0.0 gal 0.0 0.0 Razor clams 8.2 3.3 3.3 5.4 2.7 189.2 0.2 0.1 63.1 gal 0.1 121.1 Unknown clams 1.1 1.6 1.1 0.0 0.0 111.0 0.1 0.0 37.0 gal 0.0 165.2 Unknown cockles 0.0 0.0 0.0 0.0 0.0 0.0 0.0 0.0 0.0 gal 0.0 0.0 Dungeness crab 7.1 2.2 1.6 6.5 2.2 159.5 0.2 0.1 227.9 ind 0.2 114.2 Unknown king crab 4.3 0.5 0.5 3.8 1.1 1,290.8 1.4 0.5 561.2 ind 0.6 177.2 Tanner crab, bairdi 21.2 9.8 9.2 16.3 6.5 2,213.9 2.3 0.9 1,383.7 ind 1.5 54.7 Unknown Tanner crab 0.5 0.5 0.5 0.0 0.0 165.2 0.2 0.1 103.3 ind 0.1 177.2 Unknown crab 0.0 0.0 0.0 0.0 0.0 0.0 0.0 0.0 0.0 ind 0.0 0.0 Limpets 1.6 1.6 1.6 0.0 0.5 2.6 0.0 0.0 1.6 gal 0.0 138.3 Unknown mussels 1.1 0.5 0.5 0.5 0.0 2.6 0.0 0.0 1.7 gal 0.0 177.2 Octopus 7.6 5.4 5.4 3.3 3.3 733.2 0.8 0.3 183.3 ind 0.2 94.3 Unknown oyster 1.1 0.0 0.0 1.1 0.0 0.0 0.0 0.0 0.0 gal 0.0 0.0 Weathervane scallops 0.0 0.0 0.0 0.0 0.0 0.0 0.0 0.0 0.0 gal 0.0 0.0 Unknown sea cucumber 0.5 0.0 0.0 0.5 0.0 0.0 0.0 0.0 0.0 gal 0.0 0.0 Unknown sea urchin 0.0 0.0 0.0 0.0 0.0 0.0 0.0 0.0 0.0 gal 0.0 0.0 Shrimp 17.4 8.2 7.1 12.0 5.4 835.1 0.9 0.3 835.1 lb 0.9 73.4 Snails 0.0 0.0 0.0 0.0 0.0 0.0 0.0 0.0 0.0 gal 0.0 0.0 Whelk 0.0 0.0 0.0 0.0 0.0 0.0 0.0 0.0 0.0 gal 0.0 0.0
Vegetation 87.5 82.6 80.4 45.1 42.4 27,280.2 28.7 10.5 27,280.2 lb 28.7 25.1 Blueberry 68.5 62.0 60.3 23.9 27.2 7,676.2 8.1 2.9 1,919.0 gal 2.0 26.1 Lowbush cranberry 28.8 25.5 25.0 7.1 12.0 2,182.7 2.3 0.8 545.7 gal 0.6 39.8 Highbush cranberry 12.0 11.4 11.4 1.1 5.4 894.5 0.9 0.3 223.6 gal 0.2 53.2 Crowberry 0.5 0.5 0.5 0.0 0.5 20.7 0.0 0.0 5.2 gal 0.0 177.2
-continued-
Table 4-13.–Page 5 of 7.
Resource
Percentage of households Harvest weight (lb) Harvest amount 95%confidence
limit (±)harvest
211
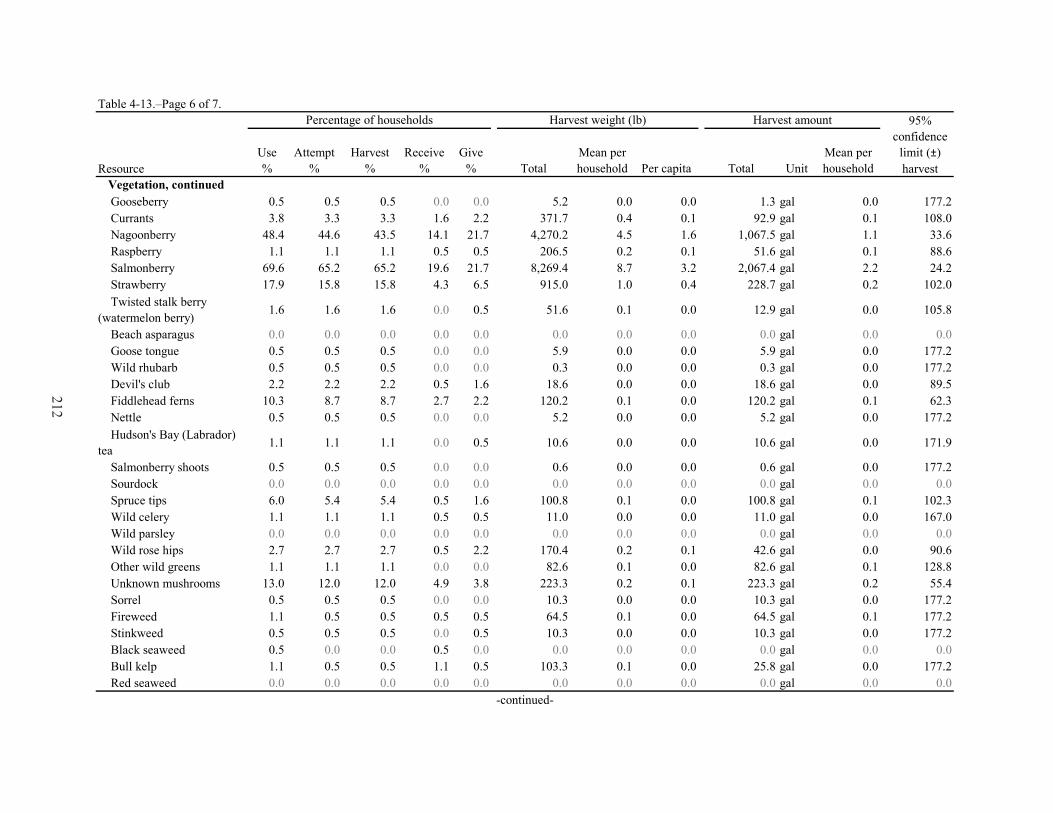
Use%
Attempt %
Harvest %
Receive %
Give % Total
Mean per household Per capita Total Unit
Mean per household
Vegetation, continued Gooseberry 0.5 0.5 0.5 0.0 0.0 5.2 0.0 0.0 1.3 gal 0.0 177.2 Currants 3.8 3.3 3.3 1.6 2.2 371.7 0.4 0.1 92.9 gal 0.1 108.0 Nagoonberry 48.4 44.6 43.5 14.1 21.7 4,270.2 4.5 1.6 1,067.5 gal 1.1 33.6 Raspberry 1.1 1.1 1.1 0.5 0.5 206.5 0.2 0.1 51.6 gal 0.1 88.6 Salmonberry 69.6 65.2 65.2 19.6 21.7 8,269.4 8.7 3.2 2,067.4 gal 2.2 24.2 Strawberry 17.9 15.8 15.8 4.3 6.5 915.0 1.0 0.4 228.7 gal 0.2 102.0 Twisted stalk berry (watermelon berry) 1.6 1.6 1.6 0.0 0.5 51.6 0.1 0.0 12.9 gal 0.0 105.8
Beach asparagus 0.0 0.0 0.0 0.0 0.0 0.0 0.0 0.0 0.0 gal 0.0 0.0 Goose tongue 0.5 0.5 0.5 0.0 0.0 5.9 0.0 0.0 5.9 gal 0.0 177.2 Wild rhubarb 0.5 0.5 0.5 0.0 0.0 0.3 0.0 0.0 0.3 gal 0.0 177.2 Devil's club 2.2 2.2 2.2 0.5 1.6 18.6 0.0 0.0 18.6 gal 0.0 89.5 Fiddlehead ferns 10.3 8.7 8.7 2.7 2.2 120.2 0.1 0.0 120.2 gal 0.1 62.3 Nettle 0.5 0.5 0.5 0.0 0.0 5.2 0.0 0.0 5.2 gal 0.0 177.2 Hudson's Bay (Labrador) tea 1.1 1.1 1.1 0.0 0.5 10.6 0.0 0.0 10.6 gal 0.0 171.9
Salmonberry shoots 0.5 0.5 0.5 0.0 0.0 0.6 0.0 0.0 0.6 gal 0.0 177.2 Sourdock 0.0 0.0 0.0 0.0 0.0 0.0 0.0 0.0 0.0 gal 0.0 0.0 Spruce tips 6.0 5.4 5.4 0.5 1.6 100.8 0.1 0.0 100.8 gal 0.1 102.3 Wild celery 1.1 1.1 1.1 0.5 0.5 11.0 0.0 0.0 11.0 gal 0.0 167.0 Wild parsley 0.0 0.0 0.0 0.0 0.0 0.0 0.0 0.0 0.0 gal 0.0 0.0 Wild rose hips 2.7 2.7 2.7 0.5 2.2 170.4 0.2 0.1 42.6 gal 0.0 90.6 Other wild greens 1.1 1.1 1.1 0.0 0.0 82.6 0.1 0.0 82.6 gal 0.1 128.8 Unknown mushrooms 13.0 12.0 12.0 4.9 3.8 223.3 0.2 0.1 223.3 gal 0.2 55.4 Sorrel 0.5 0.5 0.5 0.0 0.0 10.3 0.0 0.0 10.3 gal 0.0 177.2 Fireweed 1.1 0.5 0.5 0.5 0.5 64.5 0.1 0.0 64.5 gal 0.1 177.2 Stinkweed 0.5 0.5 0.5 0.0 0.5 10.3 0.0 0.0 10.3 gal 0.0 177.2 Black seaweed 0.5 0.0 0.0 0.5 0.0 0.0 0.0 0.0 0.0 gal 0.0 0.0 Bull kelp 1.1 0.5 0.5 1.1 0.5 103.3 0.1 0.0 25.8 gal 0.0 177.2 Red seaweed 0.0 0.0 0.0 0.0 0.0 0.0 0.0 0.0 0.0 gal 0.0 0.0
Table 4-13.–Page 6 of 7.
Resource
Harvest amount
-continued-
95%confidence
limit (±)harvest
Percentage of households Harvest weight (lb)
212

Use%
Attempt %
Harvest %
Receive %
Give % Total
Mean per household Per capita Total Unit
Mean per household
Vegetation, continued Sea ribbons 0.5 0.0 0.0 0.5 0.0 0.0 0.0 0.0 0.0 gal 0.0 0.0 Giant kelp (macrocystis) 0.0 0.0 0.0 0.0 0.0 0.0 0.0 0.0 0.0 gal 0.0 0.0 Alaria 0.0 0.0 0.0 0.0 0.0 0.0 0.0 0.0 0.0 gal 0.0 0.0 Bladder wrack 1.1 1.1 1.1 0.0 0.0 1,135.9 1.2 0.4 284.0 gal 0.3 148.3 Unknown seaweed 2.2 2.2 2.2 1.1 0.5 342.6 0.4 0.1 85.7 gal 0.1 160.5 Wood 34.8 27.7 27.7 8.7 7.1 – – – – – – Alder 0.5 0.5 0.5 0.0 0.5 – – – – – –Source ADF&G Division of Subsistence household surveys, 2015.Note Resources where the percentage using is greater than the combined received and harvest indicate use from resources obtained during a previous year.Note For small land mammals, species that are not typically eaten show a non-zero harvest amount with a zero harvest wight. Harvest weight is not calculated for species harvested but not eaten.
Table 4-13.–Page 7 of 7.
Note "–" indicates the harvest amount for the resource was not collected during the survey.
Harvest amount 95%confidence
limit (±)harvest
Harvest weight (lb)
Resource
Percentage of households
213

Figure 4-10.–Composition of harvest by resource category in pounds usable weight, Cordova, 2014.
2014 harvest with 27,280 lb total, or 11 lb per capita. The community harvested approximately 6,008 lb of marine invertebrates, or 2 lb per capita. Birds and eggs made up 1% of the harvest while small land mammals/furbearers contributed approximately less than 1% of the total harvest (Figure 4-10). In 2014, Cordova households harvested wild resources mostly in Prince William Sound (Figure 4-11). While the waters and land areas close to the community, such as Orca Inlet, Orca Bay, and Hinchinbrook and Hawkins islands, as well waters around them, were commonly used to harvest a variety of resources, some households traveled substantial distances in Prince William Sound to search for and harvest wild resources. The most distant search and harvest areas for individual resources were recorded north of Cordova in Copper River Basin (rose hips), southeast of Cordova in Southeast Alaska (Pacific halibut), west of Cordova in Cook Inlet (clams and rose hips), and northwest of Cordova in the Chugach Mountains (Dall sheep). It is important to note that due to the limited road access, and the need to travel at least some distance on marine waters to harvest many wild resources, the costs associated with the purchase, maintenance, and fueling of motorized equipment used to search for and harvest wild resources are often substantial for Cordova households.
uSe and harveSt characteriSticS By reSource category
Table 4-13 helps identify the roles sharing and receiving resources play in use patterns of resources harvested in 2014. According to survey results, approximately 90% of Cordova households received wild resources from other households and 74% gave resources away. Salmon, vegetation, and nonsalmon fish were most commonly shared resources. Salmon were used by 92% of households (the most of any resource category), given away by 52% of households, and received by 63% of households. Vegetation was used by 88% of households, given away by 42% of households, and received by 45% of households. Nonsalmon fish were used by 76% of households, shared by 37% of households, and received by 50% of Cordova households. Interestingly, large land mammals were received (66% of households) and used (79%) by more
Salmon38%
Nonsalmon fish15%
Large land mammals35%
Small land mammals<1%
Birds and eggs1%
Marine invertebrates2%
Vegetation9%
Note Categories having 0 lb of usable weight are not included.
214

Figure 4-11.–Wild resource search and harvest areas, Cordova, 2014.
!
!
!
!
!
!
!
!
!
!
!!
!
!
!
!
!
!
!
!
!
!
!
!
!
G u l f o f A l a s k a
Mon
tagu
e Islan
d
Hinchinbroo
k Island
KnightIsland
P r i n c e W i l l i a m
S o u n dVa
ldez
Arm
Port
Wel
ls
ControllerBay
Hawkins Island
CopperRiverDelta
C h u g a c h M o u n t a i n s
Orca Bay
Orca
Inlet
Chenega (Old Site)
Chenega Bay
Cordova
Tatitlek
Valdez
Chitina
Copper CenterTazlina
Anchorage
Whittier
Seward
WasillaPalmer
Girdwood
Glennallen
0 2512.5Miles
This map depicts areas used forresource harvesting in 2014 by 107surveyed households in Cordova,Alaska. The total survey sample
includes 184 of 950 households inCordova (19%), so this map is a partial
representation of areas used forresource harvests in 2014. Resourceharvest areas change over time, so
areas not used in 2014 might be used inother years.
Source:Alaska Department of Fish and Game(ADF&G) Division of Subsistence,
2015.North American Datum 1927.
Alaska Albers Projection.
Map created by: Terri Lemons
EVOS 2014
CordovaAll resources search and harvest areas
1:1,600,000SCALE:
Road
144°W
146°W
146°W
148°W
148°W
150°W
62°N
61°N
60°N
!
!!
!
!!!!
!
!
!
!
!
!
!!!
!!
!!!!!
!
!
!!!!!
!!
!!
!!!!!!!!!!!!!!!!!!!!!
!
!!!!!!!!!
!
!!!!!!!!!!!!!!
!
!
!!
!!!!!
!!!!!!!!!!!!!!!!!!!!!!!!!!!!!!!!!!!!!!!!!
!!!!!!!!!!!!!!!!!!!!
!
!
!
!
!
!
!
Kenai
Tyonek
Nikiski
Kasilof
Clam Gulch
152°W
152°W
61°N
Cook Inlet
215
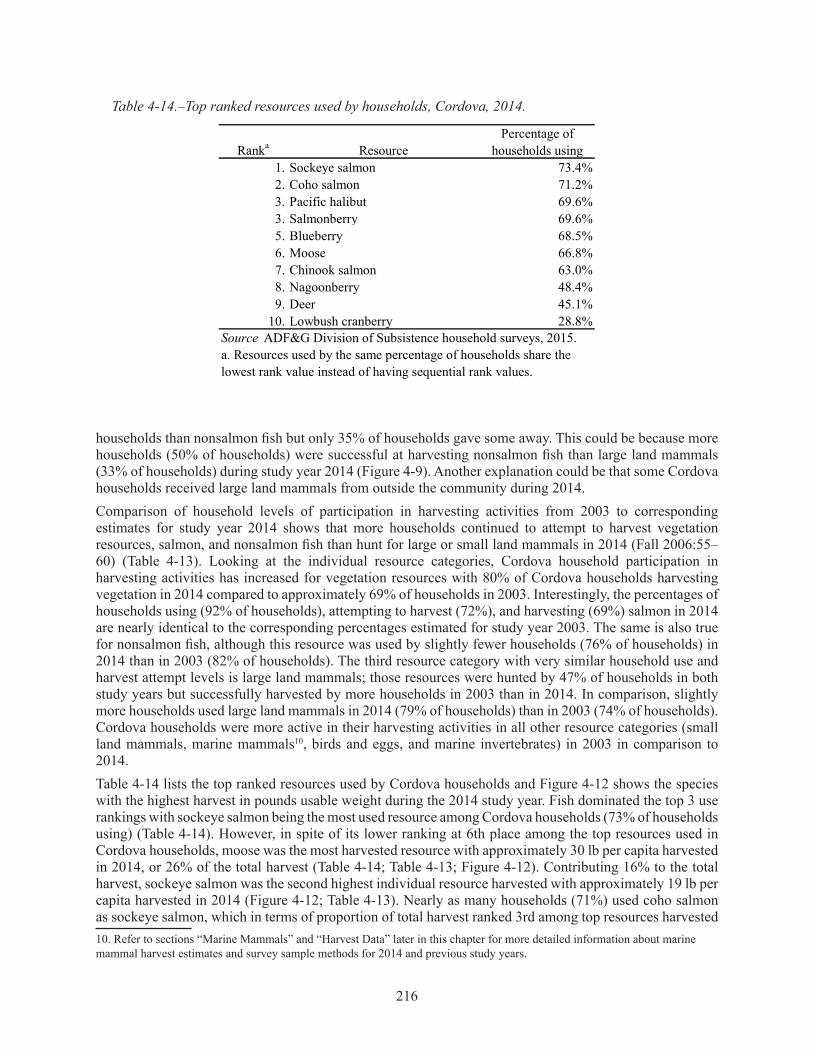
Table 4-14.–Top ranked resources used by households, Cordova, 2014.
Ranka ResourcePercentage of
households using1. Sockeye salmon 73.4%2. Coho salmon 71.2%3. Pacific halibut 69.6%3. Salmonberry 69.6%5. Blueberry 68.5%6. Moose 66.8%7. Chinook salmon 63.0%8. Nagoonberry 48.4%9. Deer 45.1%
10. Lowbush cranberry 28.8%
a. Resources used by the same percentage of households share the lowest rank value instead of having sequential rank values.
Source ADF&G Division of Subsistence household surveys, 2015.
households than nonsalmon fish but only 35% of households gave some away. This could be because more households (50% of households) were successful at harvesting nonsalmon fish than large land mammals (33% of households) during study year 2014 (Figure 4-9). Another explanation could be that some Cordova households received large land mammals from outside the community during 2014.Comparison of household levels of participation in harvesting activities from 2003 to corresponding estimates for study year 2014 shows that more households continued to attempt to harvest vegetation resources, salmon, and nonsalmon fish than hunt for large or small land mammals in 2014 (Fall 2006:55–60) (Table 4-13). Looking at the individual resource categories, Cordova household participation in harvesting activities has increased for vegetation resources with 80% of Cordova households harvesting vegetation in 2014 compared to approximately 69% of households in 2003. Interestingly, the percentages of households using (92% of households), attempting to harvest (72%), and harvesting (69%) salmon in 2014 are nearly identical to the corresponding percentages estimated for study year 2003. The same is also true for nonsalmon fish, although this resource was used by slightly fewer households (76% of households) in 2014 than in 2003 (82% of households). The third resource category with very similar household use and harvest attempt levels is large land mammals; those resources were hunted by 47% of households in both study years but successfully harvested by more households in 2003 than in 2014. In comparison, slightly more households used large land mammals in 2014 (79% of households) than in 2003 (74% of households). Cordova households were more active in their harvesting activities in all other resource categories (small land mammals, marine mammals10, birds and eggs, and marine invertebrates) in 2003 in comparison to 2014. Table 4-14 lists the top ranked resources used by Cordova households and Figure 4-12 shows the species with the highest harvest in pounds usable weight during the 2014 study year. Fish dominated the top 3 use rankings with sockeye salmon being the most used resource among Cordova households (73% of households using) (Table 4-14). However, in spite of its lower ranking at 6th place among the top resources used in Cordova households, moose was the most harvested resource with approximately 30 lb per capita harvested in 2014, or 26% of the total harvest (Table 4-14; Table 4-13; Figure 4-12). Contributing 16% to the total harvest, sockeye salmon was the second highest individual resource harvested with approximately 19 lb per capita harvested in 2014 (Figure 4-12; Table 4-13). Nearly as many households (71%) used coho salmon as sockeye salmon, which in terms of proportion of total harvest ranked 3rd among top resources harvested 10. Refer to sections “Marine Mammals” and “Harvest Data” later in this chapter for more detailed information about marine mammal harvest estimates and survey sample methods for 2014 and previous study years.
216
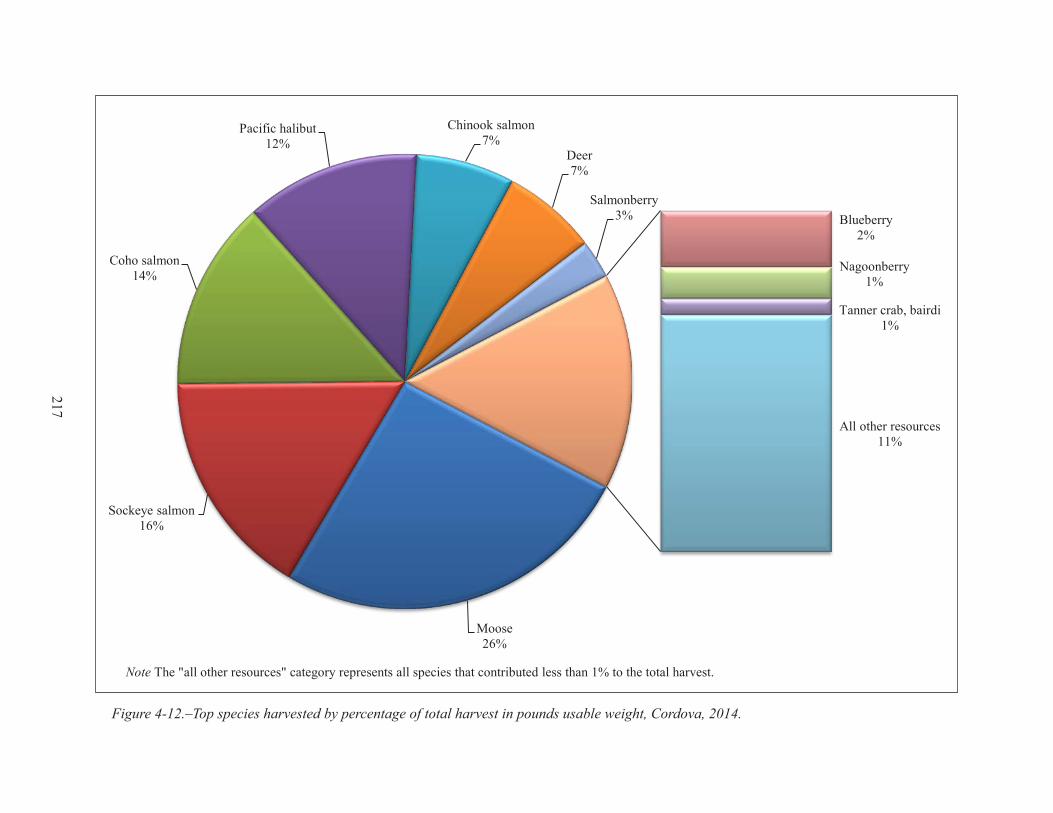
Figure 4-12.–Top species harvested by percentage of total harvest in pounds usable weight, Cordova, 2014.
Moose26%
Sockeye salmon16%
Coho salmon14%
Pacific halibut12%
Chinook salmon7%
Deer7%
Salmonberry3% Blueberry
2%
Nagoonberry1%
Tanner crab, bairdi1%
All other resources11%
Note The "all other resources" category represents all species that contributed less than 1% to the total harvest.
217

Figure 4-13.–Composition of salmon harvest in pounds usable weight, Cordova, 2014.
(approximately 16 lb per capita) (Table 4-14; Figure 4-12; Table 4-13). Pacific halibut and salmonberries shared 3rd place with 70% of households using each resource (Table 4-14). In terms of harvest weight, Pacific halibut ranked 4th most harvested resource (totaled 15 lb per capita) (Figure 4-12; Table 4-13). In comparison, the per capita harvest of salmonberries was approximately 3 lb, which placed 7th in the harvest composition (Table 4-13; Figure 4-12).In addition to salmonberries, other vegetation resources were among the top most used resources by Cordova households: blueberries ranked 5th place (69% of households using), nagoonberries ranked 8th place (48% of households using), and lowbush cranberries ranked 10th place (29% of households using) (Table 4-14). However, none of the other berry species were harvested in as large quantities as salmonberry (Figure 4-12). Resources other than fish and berries that were top resources used by Cordova households were moose, ranked 6th place (67% of households using); Chinook salmon, ranked 7th place (63% of households using); and deer, ranked 9th place (45% of households using) (Table 4-14). In terms of per capita harvest, both Chinook salmon and deer (each totaling approximately 8 lb per capita) were harvested less than sockeye and coho salmon as well as Pacific halibut (Table 4-13; Figure 4-12).
SalmonIn 2014, salmon composed 38% of the wild resource harvest in Cordova (Figure 4-10). The salmon harvest totaled approximately 114,031 lb, or 120 lb per household and 44 lb per capita (Table 4-13). The study year 2014 estimated mean household harvest of salmon (120 lb) and per capita harvest (44 lb) were both the lowest estimated for Cordova since 1985 (Table 4-13; CSIS). The largest portion (43%) of the salmon harvest in 2014 was sockeye salmon with a total harvest of 49,364 lb, or 19 lb per capita (Figure 4-13; Table 4-13). The remaining salmon harvest was mostly composed of coho salmon (36% of usable pounds totaling 40,947 lb total, or 16 lb per capita) and Chinook salmon (19% of usable pounds totaling 21,236 lb, or 8 lb per capita). The harvests of chum and pink salmon made up approximately 2% of the total salmon harvest with less than 1 lb of each species harvested per capita.Both sockeye and coho salmon were used in more households than Chinook salmon; 73% of Cordova households used sockeye salmon, 71% used coho salmon, and 63% used Chinook salmon (Table 4-13).
Coho salmon36%
Chinook salmon19%
Sockeye salmon43%
Other2%
Note The "other" category represents all species that contributed 1% or less to the total salmon harvest.
218

Regarding sharing and receiving, sockeye salmon was also the most shared (38% of households) and received (43% of households) salmon species. In comparison, more households gave away coho salmon (32% of households) than Chinook salmon (21% of households), yet more households (41% of households) received Chinook salmon than coho salmon (28% of households).Subsistence salmon fishing under state regulations is open to all Alaska residents and is managed by the Division of Commercial Fisheries out of the ADF&G Cordova office. One permit is required per household and the harvest limits for subsistence fishers are 15 fish for a single-person household, 30 fish for a 2-person household, and 10 fish for every additional person in the household. The annual limit for Chinook salmon on any permit is 5 fish. The state subsistence fisheries for Prince William Sound occur in saltwater and include, depending upon the district, purse seine nets (seine), set gillnets (setnet), and drift gillnets (driftnet). The state subsistence fishery most used by Cordova households in 2014 was the driftnet fishery, which occurs in the Copper River and Bering River districts.11 The federal subsistence fisheries are only open to qualified federal subsistence users within the Prince Willian Sound Area12 and are managed by the U.S. Forest Service from the Ranger District office located in Cordova. The harvest limits of a federal subsistence salmon harvest permit are the same as the state subsistence gillnet salmon harvest limits (see above). Additional federal subsistence salmon fishing regulations pertain to freshwaters in the Copper River Delta. The federal subsistence fishery in freshwaters provides for higher harvest limits and allows the use of additional gear types (including rod and reel, dip net, gaff, and spear according to the federal permit) compared to the state sport fishery.13 Regardless of the type of fishery, the Copper River and its tributaries below Haley Creek (which includes all of the Copper River that is accessible by road from Cordova) is closed to fishing.In addition to these fisheries, Cordova residents can harvest salmon under state sport and commercial fishing regulations; commercial salmon harvests can be retained for home use.The state subsistence driftnet fishery follows the state commercial fishing regulations for the Copper River and Bering River districts and is only open during commercial fishing openers, which are announced by Emergency Order (EO) from the ADF&G Cordova office. Because commercial and subsistence salmon fishery openers are usually identical for most of the fishing season (5 AAC 01.610(g)), respondents said participation in subsistence salmon fishing, particularly of Chinook14 and sockeye salmon, using a gillnet was challenging for households. To participate, commercial fishers need to change out their commercial-length nets for legal subsistence nets that measure no more than 50 fathoms, which requires a minimum of boating 2 or more hours round-trip from a commercial fishing location back to the harbor and out again before being able to participate in subsistence fishing. This is a financial and temporal burden on a fisher. Because of this, a substantial percentage of Cordova households obtain salmon for home use from their commercial catches (Fall and Utermohle 1995b; Stratton 1989, 1992).In 2014, Cordova households were issued 246 state subsistence salmon fishing permits, out of which 234 were returned (ASFDB15 accessed October 2015). In comparison, according to the Alaska Commercial Fisheries Entry Commission, there were 294 Cordova residents holding 345 commercial salmon fishing
11. Map Alaska Department of Fish and Game. n.d. “Commercial Fisheries: Copper River and Bering River Salmon Districts.” http://www.adfg.alaska.gov/index.cfm?adfg=CommercialByFisherySalmon.salmonmaps_districts_copperriver (accessed June 2016). 12. Map Office of Subsistence Management. n.d. “Management Regulations for the Subsistence Harvest of Fish and Shellfish on Federal Public Lands and Waters in Alaska: Effective 1 April 2013–31 May 2015,” Anchorage: 63.13. For sport harvest limits, see the Prince William Sound section: Alaska Department of Fish and Game, n.d. “Southcentral Alas-ka Sport Fishing Regulations Summary: 2014.” ADF&G Division of Sport Fish, Anchorage: 80–83.14. It is important to note that Chinook salmon do not run up the road-accessible freshwater streams near Cordova, and local residents without access to the state-managed subsistence fisheries in marine waters do not effectively have access to Chinook salmon harvesting opportunities. 15. Subsistence fishing permit information is available in the Alaska Subsistence Fisheries Database (ASFDB). Data in ASFDB are accessed through an ADF&G intranet website.
219

permits in 201416, which has remained stable since 200317 when a total of 361 commercial salmon fishing permits were held by 293 Cordova residents. At the same time, the number of active commercial salmon fishermen increased from 264 in 2003 to 276 fishermen in 2014. The number of commercial salmon fishing permits actively fished also increased from 288 permits in 2003 to 305 permits in 2014.18 The estimated total salmon harvested in the Copper River District subsistence salmon fisheries by Cordova residents in 2014 was 1,694 salmon, the majority of which were sockeye salmon (ASFDB). Compared to other fishing methods, survey results show that salmon removed from commercial catches continued to be how most of the salmon harvest was obtained in 2014; commercial removals made up 43% of the estimated salmon harvest weight (Table 4-15). It is also noteworthy that in 2014, approximately 27% of the total salmon harvest weight was composed of sockeye salmon harvested with commercial gear. In addition to the majority (63%) of the sockeye salmon harvest being removed from commercial catches, 64% of the chum salmon harvest weight and 47% of the Chinook salmon harvest weight were caught using commercial gear, which for both species is how most of these harvests were caught. Additionally, whereas combined subsistence fishing methods were used to achieve 42% of the pink salmon harvest, commercial catches contributed 33% of the pink salmon harvest.The 2014 study recorded households participating in the federal subsistence fishery using rod and reel (which in Table 4-15 is included in the “rod and reel” category that also includes sport harvests) and dip net (which composes 100% of the harvest by “other” subsistence gear). The most commonly used gear type for harvesting salmon, other than commercial catch removal, was rod and reel, which made up 38% of Cordova’s total salmon harvest by weight. Nineteen percent of the salmon harvest was caught using subsistence gear (Table 4-15). The next paragraph highlights by species the proportion of the harvests caught using these gear types under state sport and state and federal subsistence regulations.Subsistence methods were used to catch 27% of the sockeye salmon harvest, and most of that was caught by driftnet (25%) in 2014 (Table 4-15). Sockeye salmon contributed most of the driftnet harvest (62%). Access to sockeye salmon in freshwaters near Cordova is limited; only 10% of the harvest was caught by rod and reel. Rod and reel was the most commonly used harvest method for coho salmon (82% of coho salmon harvest) (Table 4-15). Coho salmon was the second most harvested species of salmon by harvest weight (Figure 4-13), reflecting a large fishing effort on the part of local Cordova residents who do not have access to the state subsistence driftnet fishery. As in previous study years 1991, 1992, and 1993, coho salmon was the only species that was harvested more with rod and reel than removed from commercial catches for home use (Fall and Utermohle 1995b:II-67, II-80). Thirty percent of the Chinook salmon harvest was caught with subsistence methods, with driftnet again being the dominant subsistence gear type used (29% of Chinook salmon harvest weight). Survey respondents commented that their subsistence fishing opportunities are very limited because many community residents are engaged in commercial fisheries for their livelihoods and have to focus on commercial fishing effort during fishing openers. Numerous Cordova residents expressed the need for additional subsistence salmon fishing opportunity because under the current regulatory framework community households may not have any opportunity to subsistence salmon fish. In addition to the problems related to the timing of subsistence and commercial fishing openings, survey respondents noted that many community households cannot go subsistence salmon fishing because of a lack of appropriate motorized transportation, the need to work at the time of fishery openings (which during the 2014 study year occurred almost exclusively on weekdays19), or because of the increasing costs of gas and boat maintenance. 16. Alaska Commercial Fisheries Entry Commission, “Permit & Fishing activity by Year, State, Census area, or City: State or Census Area: Valdez-Cordova CA, City: Cordova: Fishery Group Salmon 2014,” https://www.cfec.state.ak.us/gpby-cen/2014/261507.htm (accessed May 16, 2016).17. Alaska Commercial Fisheries Entry Commission, “Permit & Fishing activity by Year, State, Census area, or City: State or Census Area: Valdez-Cordova CA, City: Cordova: Fishery Group Salmon 2003,” https://www.cfec.state.ak.us/gpby-cen/2003/261507.htm (accessed May 16, 2016).18. Since 2002, a commercial fisherman may hold more than 1 permit in the same salmon fishery group. 19. Alaska Department of Fish and Game. “Regulation Announcements, News Releases, and Updates: Commercial, Subsistence, and Personal Use Fishing,” select results for 2014 (effective year), commercial fishing (activity), salmon (species group), Prince William Sound (management area), gillnet (gear class). http://www.adfg.alaska.gov/index.cfm?adfg=cfnews.main (accessed June
220
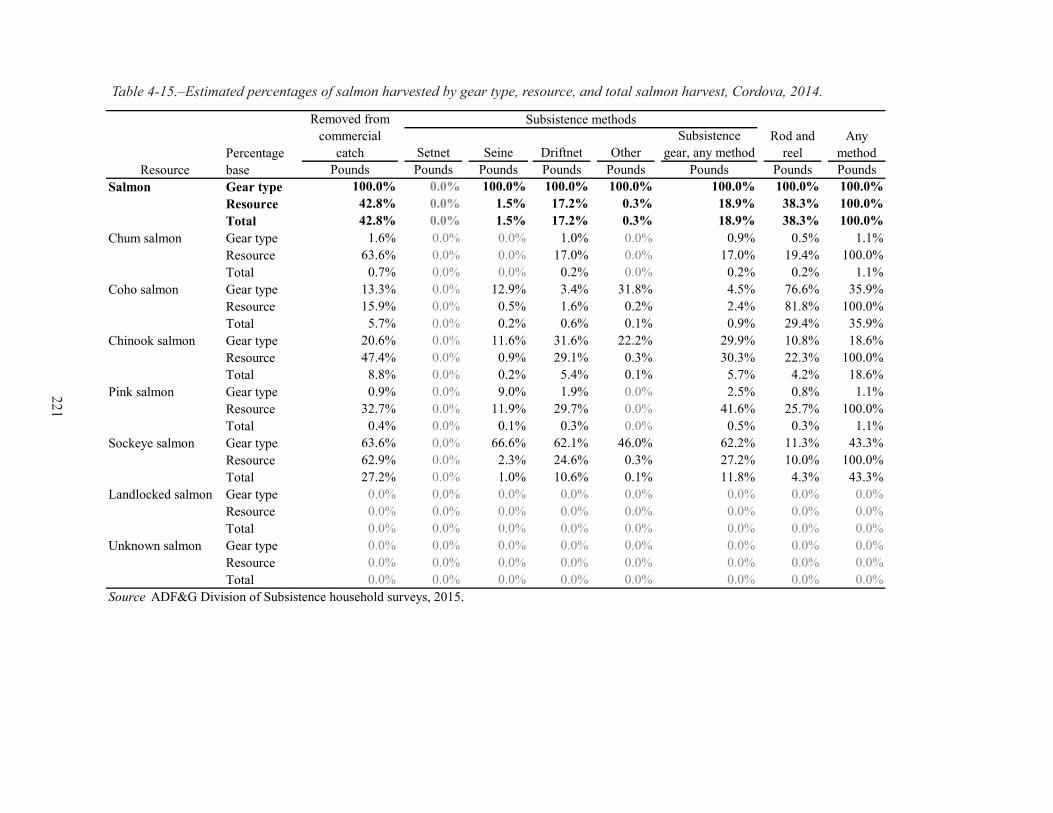
Table 4-15.–Estimated percentages of salmon harvested by gear type, resource, and total salmon harvest, Cordova, 2014.
Setnet Seine Driftnet OtherSubsistence
gear, any methodPounds Pounds Pounds Pounds Pounds Pounds Pounds Pounds
Salmon Gear type 100.0% 0.0% 100.0% 100.0% 100.0% 100.0% 100.0% 100.0%Resource 42.8% 0.0% 1.5% 17.2% 0.3% 18.9% 38.3% 100.0%Total 42.8% 0.0% 1.5% 17.2% 0.3% 18.9% 38.3% 100.0%
Chum salmon Gear type 1.6% 0.0% 0.0% 1.0% 0.0% 0.9% 0.5% 1.1%Resource 63.6% 0.0% 0.0% 17.0% 0.0% 17.0% 19.4% 100.0%Total 0.7% 0.0% 0.0% 0.2% 0.0% 0.2% 0.2% 1.1%
Coho salmon Gear type 13.3% 0.0% 12.9% 3.4% 31.8% 4.5% 76.6% 35.9%Resource 15.9% 0.0% 0.5% 1.6% 0.2% 2.4% 81.8% 100.0%Total 5.7% 0.0% 0.2% 0.6% 0.1% 0.9% 29.4% 35.9%
Chinook salmon Gear type 20.6% 0.0% 11.6% 31.6% 22.2% 29.9% 10.8% 18.6%Resource 47.4% 0.0% 0.9% 29.1% 0.3% 30.3% 22.3% 100.0%Total 8.8% 0.0% 0.2% 5.4% 0.1% 5.7% 4.2% 18.6%
Pink salmon Gear type 0.9% 0.0% 9.0% 1.9% 0.0% 2.5% 0.8% 1.1%Resource 32.7% 0.0% 11.9% 29.7% 0.0% 41.6% 25.7% 100.0%Total 0.4% 0.0% 0.1% 0.3% 0.0% 0.5% 0.3% 1.1%
Sockeye salmon Gear type 63.6% 0.0% 66.6% 62.1% 46.0% 62.2% 11.3% 43.3%Resource 62.9% 0.0% 2.3% 24.6% 0.3% 27.2% 10.0% 100.0%Total 27.2% 0.0% 1.0% 10.6% 0.1% 11.8% 4.3% 43.3%
Landlocked salmon Gear type 0.0% 0.0% 0.0% 0.0% 0.0% 0.0% 0.0% 0.0%Resource 0.0% 0.0% 0.0% 0.0% 0.0% 0.0% 0.0% 0.0%Total 0.0% 0.0% 0.0% 0.0% 0.0% 0.0% 0.0% 0.0%
Unknown salmon Gear type 0.0% 0.0% 0.0% 0.0% 0.0% 0.0% 0.0% 0.0%Resource 0.0% 0.0% 0.0% 0.0% 0.0% 0.0% 0.0% 0.0%Total 0.0% 0.0% 0.0% 0.0% 0.0% 0.0% 0.0% 0.0%
ResourcePercentage base
Removed from commercial
catch
Subsistence methodsRod and
reel
Source ADF&G Division of Subsistence household surveys, 2015.
Any method
221

Furthermore, survey respondents pointed out that when planning their marine water subsistence salmon fishing, they also need to take into consideration the weather and tides; if these are not conducive for fishing at a time when all the other factors are positively lined up, they are not be able to go subsistence salmon fishing. Because of the reasons described above, the overall sentiment in the community is that current fishing regulations are not working and that more subsistence opportunity, separate from the commercial opportunity, is needed.Survey respondents commented that they have seen a decline in Chinook salmon abundance as well as in their size. Many community residents also expressed their concern for the increased participation in the fall coho salmon fishery, which largely takes place along Ibeck Creek. According to survey respondents, the popularity of the fishery has increased substantially during the past 5 years; in addition to an increase in local fishermen, the number of non-local sport fishermen targeting the fall coho salmon run has increased. A few respondents called for increased research and management efforts to better manage the fall coho salmon run. Other additional concerns expressed by Cordova residents included a call for improved enforcement of harvest limits in the Upper Copper River District personal use and subsistence dip net fisheries because residents are concerned about fishers participating in these fisheries taking more than their allowed limit and wasting the fish they harvest through a lack of care. Another concern was focused on overescapment of Copper River sockeye salmon due to a lack of fish counters at the mouth of the Copper River. Currently the sonar used to develop preliminary Upper Copper River District inseason escapement estimates is located at the mouth of Miles Lake, approximately 33 miles north of the mouth of the Copper River at mile 48 of the Copper River Highway.20
In 2014, Cordova households harvested salmon in both fresh and marine waters. The commercial and subsistence fisheries overlap in the Copper River District. Because of this, some of the mapped areas in Figure 4-14 reflect areas where sockeye salmon and Chinook salmon were harvested in a subsistence fishery and also where salmon were removed from commercial harvests for home use. Due to fuel cost, boat size, and dangerous conditions that exist at the mouth of the Copper River, most subsistence fishers stay near the west side of the delta near the Eyak River and Alaganik Slough terminuses and in Egg Island Channel (Plate 4-1). Commercial fishermen often fish closer to the mouth of the Copper River and to the eastern side of the river, fishing closer to the Softuk area where the majority of the river currently discharges. Few subsistence fishers would be able to access these areas with their skiffs or small boats. The federal subsistence and state sport rod and reel fisheries are especially important to Cordova residents because they are accessible by road and include the heavily used Ibeck Creek (where the majority of coho salmon were harvested using rod and reel), Alaganik Slough, and Eyak River south of the Copper River Highway. Most of the rod and reel Chinook salmon harvests occurred in the sport marine troll fishery that occurs in the coastal waters outside Cordova. In 2014, this included the marine waters of Orca Inlet and northwest of Hawkins Island, the salmon search and harvest areas closest to the community. The tidal mudflats in the Copper River Delta search and harvest area located south of the community was used by the driftnet fishery participants (Figure 4-14). The most distant salmon search and harvest areas were recorded around Controller Bay, however these data were questioned as inaccurate during the community review meeting and removed from Figure 4-14. Also, harvests were recorded in the northern waters of the Gulf of Alaska.
2016). 20. Alaska Department of Fish and Game, Sonar Programs: Sites, “Copper River: Site and River,”http://www.adfg.alaska.gov/index.cfm?adfg=sonar.site_info&site=10 (accessed November 16, 2015).
222
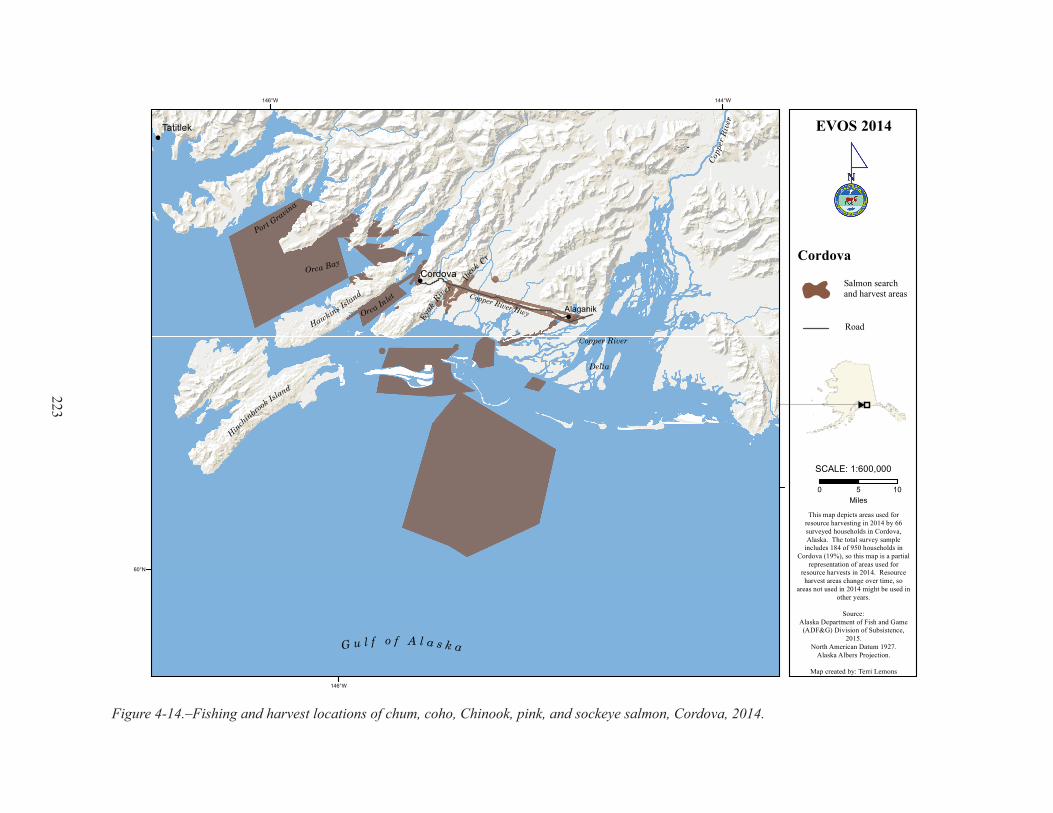
Figure 4-14.–Fishing and harvest locations of chum, coho, Chinook, pink, and sockeye salmon, Cordova, 2014.
!
!
!
G u l f o f A l a s k a
Hinchinbroo
k Island
Hawkins Island
Orca Bay
Port Gravina
Copper River
Delta
Orca Inlet Copper River Hwy
Copp
erR
iver
Ibeck
Cr
Eyak
River
Cordova
Tatitlek
Alaganik
0 105Miles
This map depicts areas used forresource harvesting in 2014 by 66surveyed households in Cordova,Alaska. The total survey sample
includes 184 of 950 households inCordova (19%), so this map is a partial
representation of areas used forresource harvests in 2014. Resourceharvest areas change over time, so
areas not used in 2014 might be used inother years.
Source:Alaska Department of Fish and Game(ADF&G) Division of Subsistence,
2015.North American Datum 1927.
Alaska Albers Projection.
Map created by: Terri Lemons
EVOS 2014
Cordova
1:600,000SCALE:
Salmon search and harvest areas
144°W
146°W
146°W
60°N
Road
223
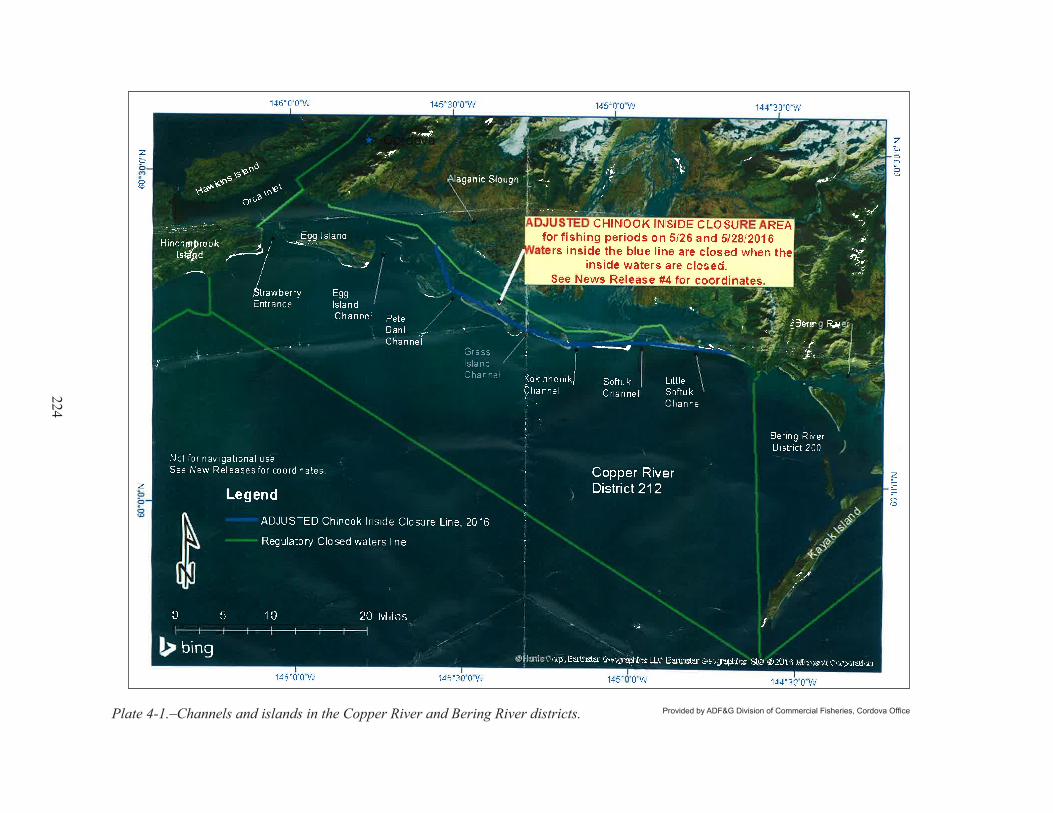
Plate 4-1.–Channels and islands in the Copper River and Bering River districts. Provided by ADF&G Division of Commercial Fisheries, Cordova Office
224
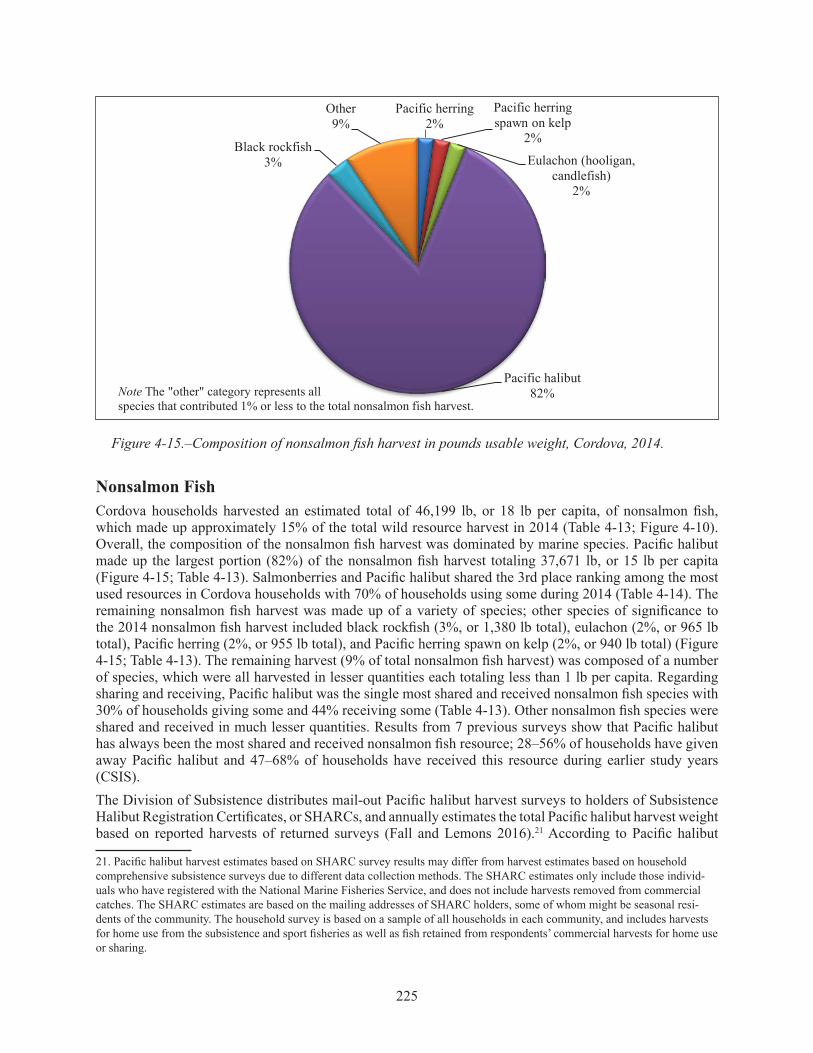
Figure 4-15.–Composition of nonsalmon fish harvest in pounds usable weight, Cordova, 2014.
Nonsalmon FishCordova households harvested an estimated total of 46,199 lb, or 18 lb per capita, of nonsalmon fish, which made up approximately 15% of the total wild resource harvest in 2014 (Table 4-13; Figure 4-10). Overall, the composition of the nonsalmon fish harvest was dominated by marine species. Pacific halibut made up the largest portion (82%) of the nonsalmon fish harvest totaling 37,671 lb, or 15 lb per capita (Figure 4-15; Table 4-13). Salmonberries and Pacific halibut shared the 3rd place ranking among the most used resources in Cordova households with 70% of households using some during 2014 (Table 4-14). The remaining nonsalmon fish harvest was made up of a variety of species; other species of significance to the 2014 nonsalmon fish harvest included black rockfish (3%, or 1,380 lb total), eulachon (2%, or 965 lb total), Pacific herring (2%, or 955 lb total), and Pacific herring spawn on kelp (2%, or 940 lb total) (Figure 4-15; Table 4-13). The remaining harvest (9% of total nonsalmon fish harvest) was composed of a number of species, which were all harvested in lesser quantities each totaling less than 1 lb per capita. Regarding sharing and receiving, Pacific halibut was the single most shared and received nonsalmon fish species with 30% of households giving some and 44% receiving some (Table 4-13). Other nonsalmon fish species were shared and received in much lesser quantities. Results from 7 previous surveys show that Pacific halibut has always been the most shared and received nonsalmon fish resource; 28–56% of households have given away Pacific halibut and 47–68% of households have received this resource during earlier study years (CSIS).The Division of Subsistence distributes mail-out Pacific halibut harvest surveys to holders of Subsistence Halibut Registration Certificates, or SHARCs, and annually estimates the total Pacific halibut harvest weight based on reported harvests of returned surveys (Fall and Lemons 2016).21 According to Pacific halibut
21. Pacific halibut harvest estimates based on SHARC survey results may differ from harvest estimates based on household comprehensive subsistence surveys due to different data collection methods. The SHARC estimates only include those individ-uals who have registered with the National Marine Fisheries Service, and does not include harvests removed from commercial catches. The SHARC estimates are based on the mailing addresses of SHARC holders, some of whom might be seasonal resi-dents of the community. The household survey is based on a sample of all households in each community, and includes harvests for home use from the subsistence and sport fisheries as well as fish retained from respondents’ commercial harvests for home use or sharing.
Pacific herring2%
Pacific herring spawn on kelp
2%
Eulachon (hooligan, candlefish)
2%
Pacific halibut82%
Black rockfish3%
Other9%
Note The "other" category represents all species that contributed 1% or less to the total nonsalmon fish harvest.
225

harvest information collected through the mail-out survey, during 2003–2014, Cordova Pacific halibut harvests peaked in 2005 when a total of 55,804 lb of Pacific halibut were harvested (Table 1-8). During 2006–2014, the estimated total harvest weight of Pacific halibut caught by Cordova residents has fluctuated between a maximum total of approximately 36,000 lb harvested in 2006 and 2014 to a low total estimated harvest of 22,920 lb in 2012. The 2012 estimated total Pacific halibut harvest is also the lowest estimated for Cordova during 2003–2014 (Table 1-8). No data are available for 2013, but according to results from returned mail-out surveys, the 2014 estimated Pacific halibut harvest was the highest since 2006.Cordova residents commented that the abundance of Pacific halibut has declined in the past few years and that the size of the Pacific halibut caught is getting smaller. According to the National Oceanic and Atmospheric Administration (NOAA), the reasons for the approximately decade-long decline in the size and abundance of Pacific halibut in different parts of the North Pacific vary.22 A key respondent interviewed for this project provided comments based on discussions he has had with local residents; the respondent indicated that many residents think that the use of set longlines—where multiple hooks are placed in the water simultaneously—for subsistence fishing has increased pressure on the Pacific halibut stock in the Cordova area. The key respondent continued by saying that most people he has talked with also think that harvesting Pacific halibut with sport fishing gear, where no more than 2 hooks are in the water at a given time, is an inefficient method of harvesting Pacific halibut in the Cordova area. The key respondent also pointed out that with the use of set longline gear, Cordova households may be able to subsistence harvest approximately the same total harvest amount of Pacific halibut as they did in previous years in spite of the decline in abundance and size of the fish because they can have more hooks in the water. The 2014 survey results show that the estimated total Pacific halibut harvest weight by Cordova residents in 2003 and 2014 are very similar (35,001 lb and 37,671 lb, respectively) (CSIS; Table 4-13). Additional comments provided by survey respondents suggested that there should be increased monitoring of the guided Pacific halibut sport fishery, or that a separate harvest quota be set for the charter operators to limit total Pacific halibut harvests in the sport fishery.As estimated in total pounds harvested, approximately 51% of the nonsalmon fish harvest was caught using rod and reel, 46% was caught with subsistence gear, and approximately 3% of the nonsalmon fish harvest was removed from commercial harvests for home use (Table 4-16). Looking at the species contributing the most to the total harvest by weight, rod and reel was the most commonly used harvest method for Pacific halibut (49% of harvested pounds), black rockfish (54% of harvested pounds), and Pacific herring (90% of harvested pounds). Interestingly, the harvest of Pacific halibut was split nearly evenly between subsistence methods (50%) and rod and reel (49%). Subsistence methods were used for harvesting Pacific herring spawn on kelp, and also for harvesting eulachon, which was primarily harvested with dip nets. Survey respondents commented that if a big school of Pacific herring is around, it is not uncommon to see people quickly harvest a good amount of Pacific herring with a rod and reel right off the docks in the Cordova harbor. These fish are often used as bait for other harvesting activities. Other Pacific herring-related comments collected during the survey effort emphasized Cordova residents’ continuous frustration and concern about the future of the Pacific herring fishery since the commercial Pacific herring fishery provided substantial income to local residents prior to the oil spill. According to one survey respondent, approximately one-third of the income for some Cordova households made in commercial fisheries prior to the spill came from Pacific herring harvests. Income from the commercial Pacific herring fishery has been nonexistent for decades due to continuous fishery closures after the crash of the Pacific herring population in the early 1990s (Botz et al. 2014).In 2014, Cordova households fished for and harvested nonsalmon fish in local fresh and marine waters close to the community, but residents also traveled to other areas in Prince William Sound to harvest these resources in marine waters (Figure 4-16). The waters around Hinchinbrook and Hawkins islands were commonly used to search for and harvest marine species such as Pacific halibut and rockfish. Additional large harvest areas for marine species were also recorded elsewhere in the sound; for example, west of Cordova around Perry Island and in the southernmost areas of the Copper River Delta. Community residents 22. National Oceanic and Atmospheric Administration, Fishwatch, U.S Seafood Facts [database]. “Halibut: The Science, Popula-tion Status,” updated October 23, 2015. http://www.fishwatch.gov/profiles/pacific-halibut (accessed November 24, 2015).
226
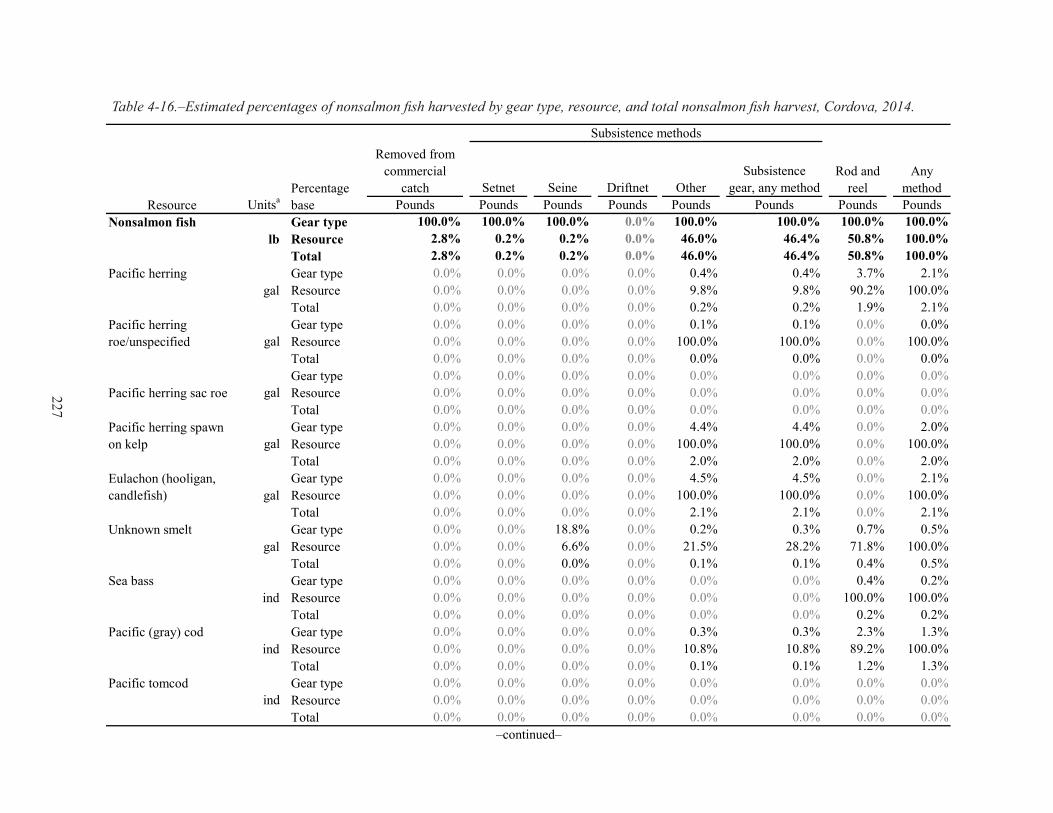
Table 4-16.–Estimated percentages of nonsalmon fish harvested by gear type, resource, and total nonsalmon fish harvest, Cordova, 2014.
Setnet Seine Driftnet OtherSubsistence
gear, any methodUnitsa Pounds Pounds Pounds Pounds Pounds Pounds Pounds Pounds
Nonsalmon fish Gear type 100.0% 100.0% 100.0% 0.0% 100.0% 100.0% 100.0% 100.0%lb Resource 2.8% 0.2% 0.2% 0.0% 46.0% 46.4% 50.8% 100.0%
Total 2.8% 0.2% 0.2% 0.0% 46.0% 46.4% 50.8% 100.0%Pacific herring Gear type 0.0% 0.0% 0.0% 0.0% 0.4% 0.4% 3.7% 2.1%
gal Resource 0.0% 0.0% 0.0% 0.0% 9.8% 9.8% 90.2% 100.0%Total 0.0% 0.0% 0.0% 0.0% 0.2% 0.2% 1.9% 2.1%Gear type 0.0% 0.0% 0.0% 0.0% 0.1% 0.1% 0.0% 0.0%
gal Resource 0.0% 0.0% 0.0% 0.0% 100.0% 100.0% 0.0% 100.0%Total 0.0% 0.0% 0.0% 0.0% 0.0% 0.0% 0.0% 0.0%Gear type 0.0% 0.0% 0.0% 0.0% 0.0% 0.0% 0.0% 0.0%
gal Resource 0.0% 0.0% 0.0% 0.0% 0.0% 0.0% 0.0% 0.0%Total 0.0% 0.0% 0.0% 0.0% 0.0% 0.0% 0.0% 0.0%Gear type 0.0% 0.0% 0.0% 0.0% 4.4% 4.4% 0.0% 2.0%
gal Resource 0.0% 0.0% 0.0% 0.0% 100.0% 100.0% 0.0% 100.0%Total 0.0% 0.0% 0.0% 0.0% 2.0% 2.0% 0.0% 2.0%Gear type 0.0% 0.0% 0.0% 0.0% 4.5% 4.5% 0.0% 2.1%
gal Resource 0.0% 0.0% 0.0% 0.0% 100.0% 100.0% 0.0% 100.0%Total 0.0% 0.0% 0.0% 0.0% 2.1% 2.1% 0.0% 2.1%
Unknown smelt Gear type 0.0% 0.0% 18.8% 0.0% 0.2% 0.3% 0.7% 0.5%gal Resource 0.0% 0.0% 6.6% 0.0% 21.5% 28.2% 71.8% 100.0%
Total 0.0% 0.0% 0.0% 0.0% 0.1% 0.1% 0.4% 0.5%Sea bass Gear type 0.0% 0.0% 0.0% 0.0% 0.0% 0.0% 0.4% 0.2%
ind Resource 0.0% 0.0% 0.0% 0.0% 0.0% 0.0% 100.0% 100.0%Total 0.0% 0.0% 0.0% 0.0% 0.0% 0.0% 0.2% 0.2%
Pacific (gray) cod Gear type 0.0% 0.0% 0.0% 0.0% 0.3% 0.3% 2.3% 1.3%ind Resource 0.0% 0.0% 0.0% 0.0% 10.8% 10.8% 89.2% 100.0%
Total 0.0% 0.0% 0.0% 0.0% 0.1% 0.1% 1.2% 1.3%Pacific tomcod Gear type 0.0% 0.0% 0.0% 0.0% 0.0% 0.0% 0.0% 0.0%
ind Resource 0.0% 0.0% 0.0% 0.0% 0.0% 0.0% 0.0% 0.0%Total 0.0% 0.0% 0.0% 0.0% 0.0% 0.0% 0.0% 0.0%
Eulachon (hooligan, candlefish)
–continued–
ResourcePercentage base
Removed from commercial
catch
Subsistence methods
Rod and reel
Pacific herring spawn on kelp
Pacific herring sac roe
Any method
Pacific herring roe/unspecified
227

Setnet Seine Driftnet OtherSubsistence
gear, any methodUnitsa Pounds Pounds Pounds Pounds Pounds Pounds Pounds Pounds
Gear type 0.0% 0.0% 0.0% 0.0% 0.0% 0.0% 0.0% 0.0%ind Resource 0.0% 0.0% 0.0% 0.0% 0.0% 0.0% 0.0% 0.0%
Total 0.0% 0.0% 0.0% 0.0% 0.0% 0.0% 0.0% 0.0%Eel Gear type 0.0% 0.0% 0.0% 0.0% 0.0% 0.0% 0.0% 0.0%
ind Resource 0.0% 0.0% 0.0% 0.0% 0.0% 0.0% 0.0% 0.0%Total 0.0% 0.0% 0.0% 0.0% 0.0% 0.0% 0.0% 0.0%
Starry flounder Gear type 0.0% 0.0% 0.0% 0.0% 0.0% 0.0% 0.0% 0.0%ind Resource 0.0% 0.0% 0.0% 0.0% 0.0% 0.0% 0.0% 0.0%
Total 0.0% 0.0% 0.0% 0.0% 0.0% 0.0% 0.0% 0.0%Unknown flounder Gear type 0.0% 0.0% 0.0% 0.0% 0.0% 0.0% 0.0% 0.0%
ind Resource 0.0% 0.0% 0.0% 0.0% 0.0% 0.0% 0.0% 0.0%Total 0.0% 0.0% 0.0% 0.0% 0.0% 0.0% 0.0% 0.0%
Lingcod Gear type 1.6% 0.0% 25.0% 0.0% 0.7% 0.8% 0.5% 0.7%ind Resource 6.6% 0.0% 6.6% 0.0% 47.1% 53.7% 39.7% 100.0%
Total 0.0% 0.0% 0.0% 0.0% 0.3% 0.4% 0.3% 0.7%Unknown greenling Gear type 0.0% 0.0% 0.0% 0.0% 0.0% 0.0% 0.7% 0.4%
ind Resource 0.0% 0.0% 0.0% 0.0% 0.0% 0.0% 100.0% 100.0%Total 0.0% 0.0% 0.0% 0.0% 0.0% 0.0% 0.4% 0.4%
Pacific halibut Gear type 34.8% 0.0% 0.0% 0.0% 87.9% 87.2% 79.0% 81.5%lb Resource 1.2% 0.0% 0.0% 0.0% 49.6% 49.6% 49.2% 100.0%
Total 1.0% 0.0% 0.0% 0.0% 40.5% 40.5% 40.1% 81.5%Black rockfish Gear type 19.2% 92.8% 56.3% 0.0% 1.2% 1.8% 3.2% 3.0%
ind Resource 18.0% 6.7% 3.4% 0.0% 18.1% 28.2% 53.9% 100.0%Total 0.5% 0.2% 0.1% 0.0% 0.5% 0.8% 1.6% 3.0%
Red rockfish Gear type 24.1% 0.0% 0.0% 0.0% 0.0% 0.0% 0.0% 0.7%ind Resource 100.0% 0.0% 0.0% 0.0% 0.0% 0.0% 0.0% 100.0%
Total 0.7% 0.0% 0.0% 0.0% 0.0% 0.0% 0.0% 0.7%–continued–
Walleye pollock (whiting)
Table 4-16.–Page 2 of 5.
ResourcePercentage base
Removed from commercial
catch
Subsistence methods
Rod and reel
Any method
228
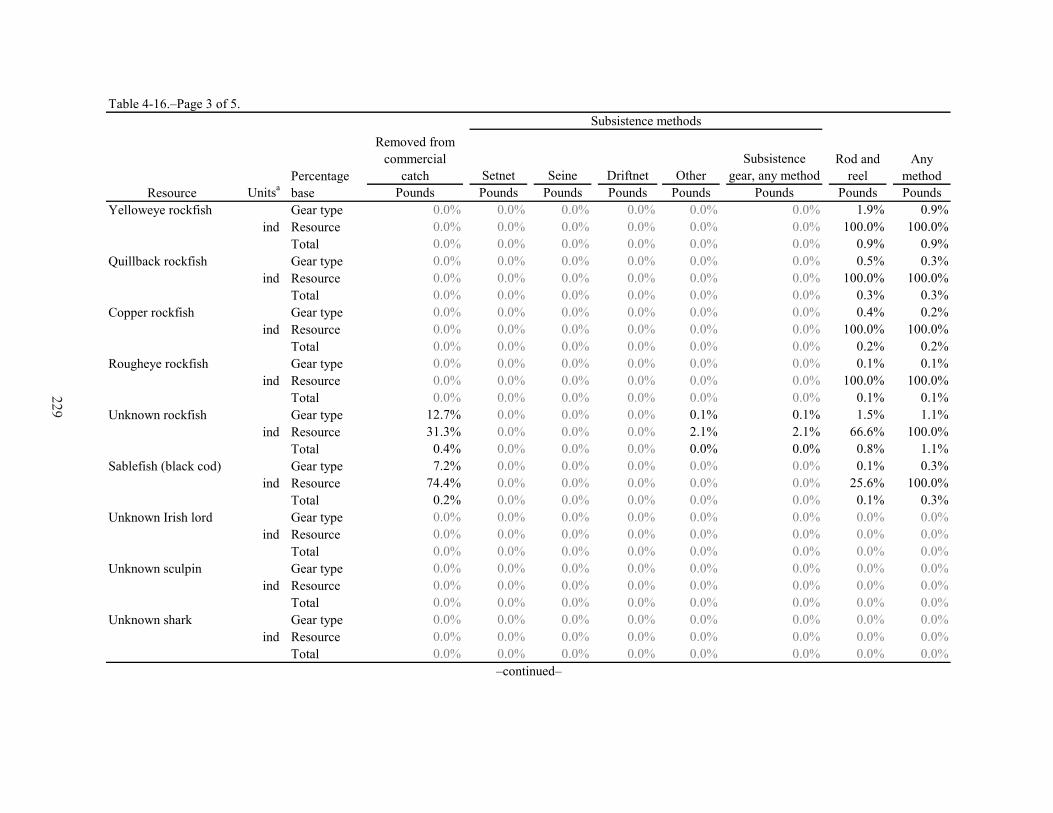
Setnet Seine Driftnet OtherSubsistence
gear, any methodUnitsa Pounds Pounds Pounds Pounds Pounds Pounds Pounds Pounds
Yelloweye rockfish Gear type 0.0% 0.0% 0.0% 0.0% 0.0% 0.0% 1.9% 0.9%ind Resource 0.0% 0.0% 0.0% 0.0% 0.0% 0.0% 100.0% 100.0%
Total 0.0% 0.0% 0.0% 0.0% 0.0% 0.0% 0.9% 0.9%Quillback rockfish Gear type 0.0% 0.0% 0.0% 0.0% 0.0% 0.0% 0.5% 0.3%
ind Resource 0.0% 0.0% 0.0% 0.0% 0.0% 0.0% 100.0% 100.0%Total 0.0% 0.0% 0.0% 0.0% 0.0% 0.0% 0.3% 0.3%
Copper rockfish Gear type 0.0% 0.0% 0.0% 0.0% 0.0% 0.0% 0.4% 0.2%ind Resource 0.0% 0.0% 0.0% 0.0% 0.0% 0.0% 100.0% 100.0%
Total 0.0% 0.0% 0.0% 0.0% 0.0% 0.0% 0.2% 0.2%Rougheye rockfish Gear type 0.0% 0.0% 0.0% 0.0% 0.0% 0.0% 0.1% 0.1%
ind Resource 0.0% 0.0% 0.0% 0.0% 0.0% 0.0% 100.0% 100.0%Total 0.0% 0.0% 0.0% 0.0% 0.0% 0.0% 0.1% 0.1%
Unknown rockfish Gear type 12.7% 0.0% 0.0% 0.0% 0.1% 0.1% 1.5% 1.1%ind Resource 31.3% 0.0% 0.0% 0.0% 2.1% 2.1% 66.6% 100.0%
Total 0.4% 0.0% 0.0% 0.0% 0.0% 0.0% 0.8% 1.1%Sablefish (black cod) Gear type 7.2% 0.0% 0.0% 0.0% 0.0% 0.0% 0.1% 0.3%
ind Resource 74.4% 0.0% 0.0% 0.0% 0.0% 0.0% 25.6% 100.0%Total 0.2% 0.0% 0.0% 0.0% 0.0% 0.0% 0.1% 0.3%
Unknown Irish lord Gear type 0.0% 0.0% 0.0% 0.0% 0.0% 0.0% 0.0% 0.0%ind Resource 0.0% 0.0% 0.0% 0.0% 0.0% 0.0% 0.0% 0.0%
Total 0.0% 0.0% 0.0% 0.0% 0.0% 0.0% 0.0% 0.0%Unknown sculpin Gear type 0.0% 0.0% 0.0% 0.0% 0.0% 0.0% 0.0% 0.0%
ind Resource 0.0% 0.0% 0.0% 0.0% 0.0% 0.0% 0.0% 0.0%Total 0.0% 0.0% 0.0% 0.0% 0.0% 0.0% 0.0% 0.0%
Unknown shark Gear type 0.0% 0.0% 0.0% 0.0% 0.0% 0.0% 0.0% 0.0%ind Resource 0.0% 0.0% 0.0% 0.0% 0.0% 0.0% 0.0% 0.0%
Total 0.0% 0.0% 0.0% 0.0% 0.0% 0.0% 0.0% 0.0%
Table 4-16.–Page 3 of 5.
ResourcePercentage base
Removed from commercial
catch
Subsistence methods
Rod and reel
Any method
–continued–
229
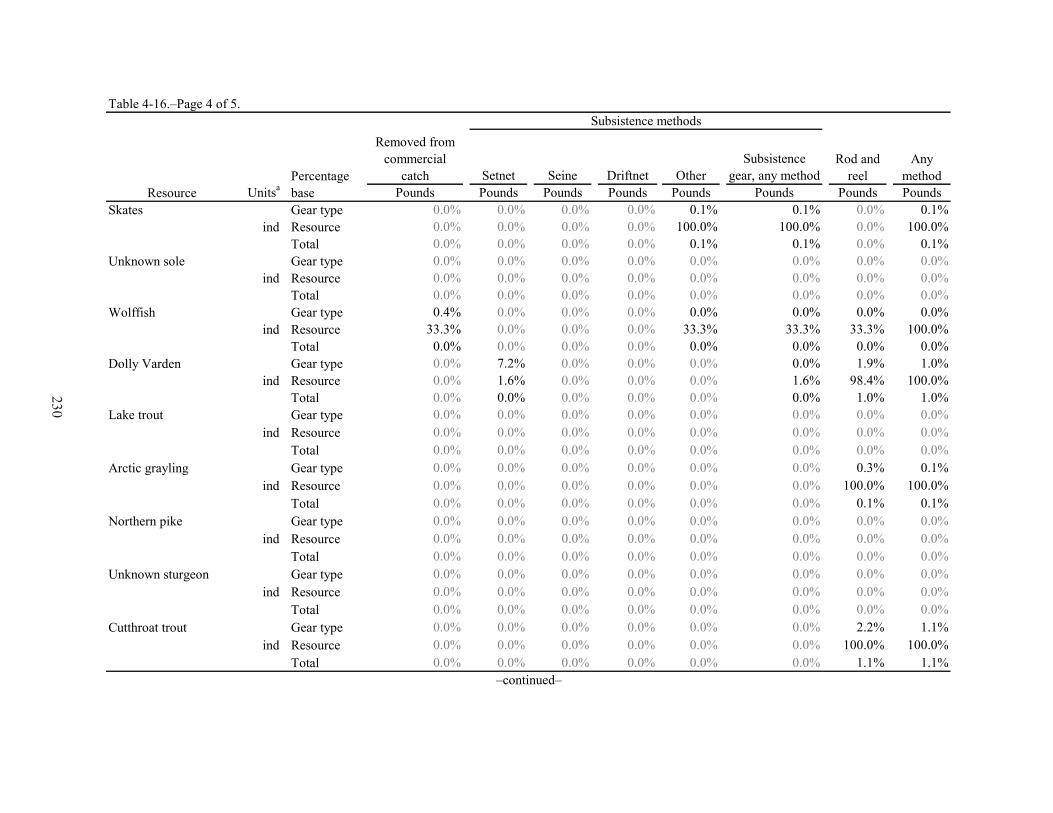
Setnet Seine Driftnet OtherSubsistence
gear, any methodUnitsa Pounds Pounds Pounds Pounds Pounds Pounds Pounds Pounds
Skates Gear type 0.0% 0.0% 0.0% 0.0% 0.1% 0.1% 0.0% 0.1%ind Resource 0.0% 0.0% 0.0% 0.0% 100.0% 100.0% 0.0% 100.0%
Total 0.0% 0.0% 0.0% 0.0% 0.1% 0.1% 0.0% 0.1%Unknown sole Gear type 0.0% 0.0% 0.0% 0.0% 0.0% 0.0% 0.0% 0.0%
ind Resource 0.0% 0.0% 0.0% 0.0% 0.0% 0.0% 0.0% 0.0%Total 0.0% 0.0% 0.0% 0.0% 0.0% 0.0% 0.0% 0.0%
Wolffish Gear type 0.4% 0.0% 0.0% 0.0% 0.0% 0.0% 0.0% 0.0%ind Resource 33.3% 0.0% 0.0% 0.0% 33.3% 33.3% 33.3% 100.0%
Total 0.0% 0.0% 0.0% 0.0% 0.0% 0.0% 0.0% 0.0%Dolly Varden Gear type 0.0% 7.2% 0.0% 0.0% 0.0% 0.0% 1.9% 1.0%
ind Resource 0.0% 1.6% 0.0% 0.0% 0.0% 1.6% 98.4% 100.0%Total 0.0% 0.0% 0.0% 0.0% 0.0% 0.0% 1.0% 1.0%
Lake trout Gear type 0.0% 0.0% 0.0% 0.0% 0.0% 0.0% 0.0% 0.0%ind Resource 0.0% 0.0% 0.0% 0.0% 0.0% 0.0% 0.0% 0.0%
Total 0.0% 0.0% 0.0% 0.0% 0.0% 0.0% 0.0% 0.0%Arctic grayling Gear type 0.0% 0.0% 0.0% 0.0% 0.0% 0.0% 0.3% 0.1%
ind Resource 0.0% 0.0% 0.0% 0.0% 0.0% 0.0% 100.0% 100.0%Total 0.0% 0.0% 0.0% 0.0% 0.0% 0.0% 0.1% 0.1%
Northern pike Gear type 0.0% 0.0% 0.0% 0.0% 0.0% 0.0% 0.0% 0.0%ind Resource 0.0% 0.0% 0.0% 0.0% 0.0% 0.0% 0.0% 0.0%
Total 0.0% 0.0% 0.0% 0.0% 0.0% 0.0% 0.0% 0.0%Unknown sturgeon Gear type 0.0% 0.0% 0.0% 0.0% 0.0% 0.0% 0.0% 0.0%
ind Resource 0.0% 0.0% 0.0% 0.0% 0.0% 0.0% 0.0% 0.0%Total 0.0% 0.0% 0.0% 0.0% 0.0% 0.0% 0.0% 0.0%
Cutthroat trout Gear type 0.0% 0.0% 0.0% 0.0% 0.0% 0.0% 2.2% 1.1%ind Resource 0.0% 0.0% 0.0% 0.0% 0.0% 0.0% 100.0% 100.0%
Total 0.0% 0.0% 0.0% 0.0% 0.0% 0.0% 1.1% 1.1%
Any method
–continued–
Subsistence methods
Rod and reel
Table 4-16.–Page 4 of 5.
ResourcePercentage base
Removed from commercial
catch
230
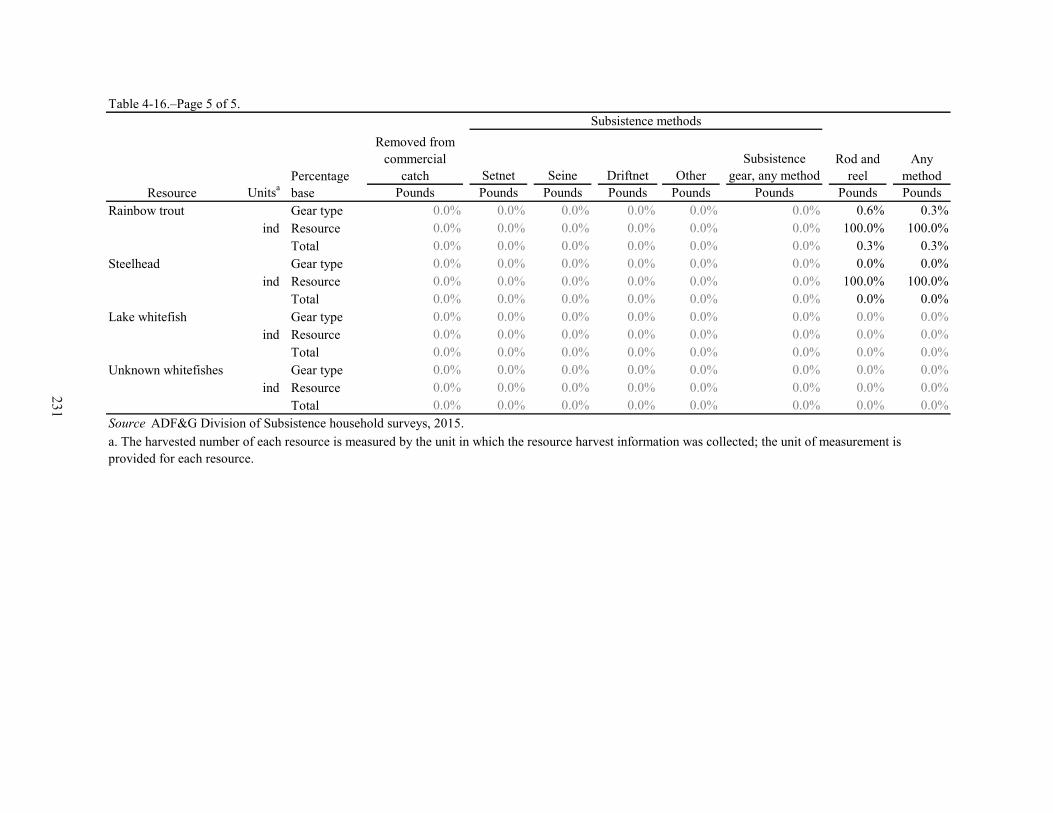
Setnet Seine Driftnet OtherSubsistence
gear, any methodUnitsa Pounds Pounds Pounds Pounds Pounds Pounds Pounds Pounds
Rainbow trout Gear type 0.0% 0.0% 0.0% 0.0% 0.0% 0.0% 0.6% 0.3%ind Resource 0.0% 0.0% 0.0% 0.0% 0.0% 0.0% 100.0% 100.0%
Total 0.0% 0.0% 0.0% 0.0% 0.0% 0.0% 0.3% 0.3%Steelhead Gear type 0.0% 0.0% 0.0% 0.0% 0.0% 0.0% 0.0% 0.0%
ind Resource 0.0% 0.0% 0.0% 0.0% 0.0% 0.0% 100.0% 100.0%Total 0.0% 0.0% 0.0% 0.0% 0.0% 0.0% 0.0% 0.0%
Lake whitefish Gear type 0.0% 0.0% 0.0% 0.0% 0.0% 0.0% 0.0% 0.0%ind Resource 0.0% 0.0% 0.0% 0.0% 0.0% 0.0% 0.0% 0.0%
Total 0.0% 0.0% 0.0% 0.0% 0.0% 0.0% 0.0% 0.0%Unknown whitefishes Gear type 0.0% 0.0% 0.0% 0.0% 0.0% 0.0% 0.0% 0.0%
ind Resource 0.0% 0.0% 0.0% 0.0% 0.0% 0.0% 0.0% 0.0%Total 0.0% 0.0% 0.0% 0.0% 0.0% 0.0% 0.0% 0.0%
Any method
Subsistence methods
Rod and reel
ResourcePercentage base
Removed from commercial
catch
Table 4-16.–Page 5 of 5.
a. The harvested number of each resource is measured by the unit in which the resource harvest information was collected; the unit of measurement is provided for each resource.
Source ADF&G Division of Subsistence household surveys, 2015.
231

Figure 4-16.–Fishing and harvest locations of all nonsalmon fish resources, Cordova, 2014.
!
!
!
!
!
!
Chenega (Old Site)
Chenega Bay
Cordova
Tatitlek
Valdez
G u l f o f A l a s k aMon
tagu
e Isla
nd
Hinchinbroo
k Island
KnightIsland
P r i n c e W i l l i a m
S o u n dPo
rtVa
ldez
Port
Wel
ls
Hawkins Island
Orca BayPerry
Island
Knight Island Passage
Port Gravina
Copper River
Delta
ElringtonIsland
Copper River Hwy
Richardson Hwy
Ib
eck
Cr
0 2010Miles
This map depicts areas used forresource harvesting in 2014 by 57surveyed households in Cordova,Alaska. The total survey sample
includes 184 of 950 households inCordova (19%), so this map is a partial
representation of areas used forresource harvests in 2014. Resourceharvest areas change over time, so
areas not used in 2014 might be used inother years.
Source:Alaska Department of Fish and Game(ADF&G) Division of Subsistence,
2015.North American Datum 1927.
Alaska Albers Projection.
Map created by: Terri Lemons
EVOS 2014
CordovaNonsalmon fish search and harvest areas
1:1,000,000SCALE:
146°W
146°W
148°W
148°W
61°N
60°N
Road
232

Figure 4-17.–Composition of large land mammal harvest in pounds usable weight, Cordova, 2014.
also attempted to harvest and harvested nonsalmon fish in the Copper River Delta, particularly in waters southwest of the easternmost turn of the Copper River Highway. Freshwater harvest areas for non-marine species, such as cutthroat trout, were located along Ibeck Creek. The most distant nonsalmon fish search and harvest area documented in the survey was located in southeast Alaska, around Wrangell.
Large Land MammalsIn 2014, large land mammals made up 35% of the Cordova wild resource harvest by weight, contributing 104,165 lb, or 40 lb per capita, to the total wild resource harvest (Figure 4-10; Table 4-13). The largest portion (75%) of the large land mammal harvest was composed of moose, totaling 78,065 lb, or 30 lb per capita; deer contributed 19% of the harvested weight, totaling 20,408 lb, or 8 lb per capita; and mountain goat was the last single species that contributed a notable portion to the harvest (2%, or 1,872 lb total usable weight) (Figure 4-17; Table 4-13). Other large land mammal species contributing to the 2014 harvest were caribou (total harvest 1,549 lb), black bear (total harvest 1,198 lb), and Dall sheep (1,074 lb total) (Table 4-13). A small number of Cordova households shared, received, and used some bison in 2014. In addition, a small number of Cordova households received and used elk during the study year. Moose and deer were the only 2 large land mammal species that appeared on the top used resources list with 67% of Cordova households using moose and 45% of households using deer (Table 4-14). Interestingly, more households attempted to harvest and harvested deer than moose (31% of households attempted to harvest deer and 24% of households hunted moose; 21% of households harvested deer and 15% of households harvested moose), yet more households shared and received moose than deer (22% of households shared moose and 16% of households shared deer; 54% of households received moose and 30% of households received deer) (Table 4-13). All other large land mammal species were received, shared, and used by less than 10% of community households.Compared to the previous study in 2003, slightly more Cordova households used large land mammals in 2014 than in 2003 (79% of households using in 2014 compared to 74% of households in 2003) (Table 4-13) (Fall 2006:56). Looking at the percentages of households attempting to harvest and actually harvesting large land mammals shows that nearly the same percentage of Cordova households attempted to harvest
Deer19%
Mountain goat2%
Moose75%
Other4%
Note The "other" category represents allspecies that contributed 1% or less to the total large land mammal harvest.
233
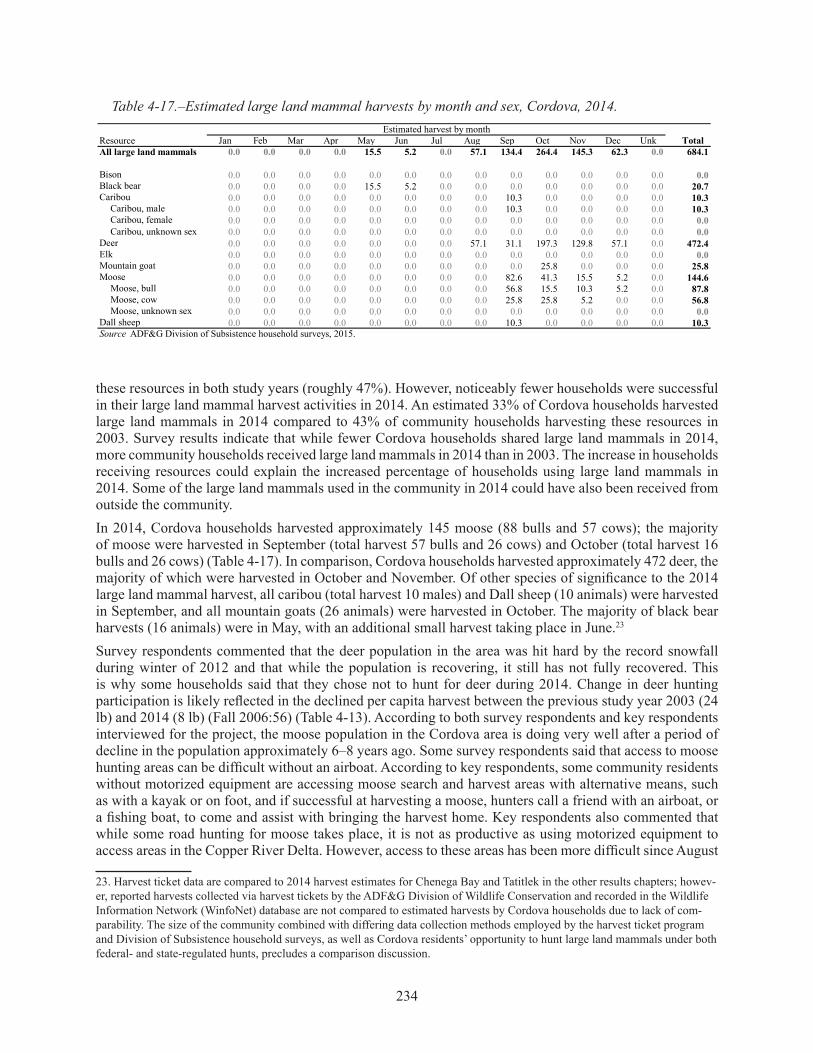
Table 4-17.–Estimated large land mammal harvests by month and sex, Cordova, 2014.
Jan Feb Mar Apr May Jun Jul Aug Sep Oct Nov Dec UnkAll large land mammals 0.0 0.0 0.0 0.0 15.5 5.2 0.0 57.1 134.4 264.4 145.3 62.3 0.0 684.1
Bison 0.0 0.0 0.0 0.0 0.0 0.0 0.0 0.0 0.0 0.0 0.0 0.0 0.0 0.0Black bear 0.0 0.0 0.0 0.0 15.5 5.2 0.0 0.0 0.0 0.0 0.0 0.0 0.0 20.7Caribou 0.0 0.0 0.0 0.0 0.0 0.0 0.0 0.0 10.3 0.0 0.0 0.0 0.0 10.3
Caribou, male 0.0 0.0 0.0 0.0 0.0 0.0 0.0 0.0 10.3 0.0 0.0 0.0 0.0 10.3Caribou, female 0.0 0.0 0.0 0.0 0.0 0.0 0.0 0.0 0.0 0.0 0.0 0.0 0.0 0.0Caribou, unknown sex 0.0 0.0 0.0 0.0 0.0 0.0 0.0 0.0 0.0 0.0 0.0 0.0 0.0 0.0
Deer 0.0 0.0 0.0 0.0 0.0 0.0 0.0 57.1 31.1 197.3 129.8 57.1 0.0 472.4Elk 0.0 0.0 0.0 0.0 0.0 0.0 0.0 0.0 0.0 0.0 0.0 0.0 0.0 0.0Mountain goat 0.0 0.0 0.0 0.0 0.0 0.0 0.0 0.0 0.0 25.8 0.0 0.0 0.0 25.8Moose 0.0 0.0 0.0 0.0 0.0 0.0 0.0 0.0 82.6 41.3 15.5 5.2 0.0 144.6
Moose, bull 0.0 0.0 0.0 0.0 0.0 0.0 0.0 0.0 56.8 15.5 10.3 5.2 0.0 87.8Moose, cow 0.0 0.0 0.0 0.0 0.0 0.0 0.0 0.0 25.8 25.8 5.2 0.0 0.0 56.8Moose, unknown sex 0.0 0.0 0.0 0.0 0.0 0.0 0.0 0.0 0.0 0.0 0.0 0.0 0.0 0.0
Dall sheep 0.0 0.0 0.0 0.0 0.0 0.0 0.0 0.0 10.3 0.0 0.0 0.0 0.0 10.3Source ADF&G Division of Subsistence household surveys, 2015.
ResourceEstimated harvest by month
Total
these resources in both study years (roughly 47%). However, noticeably fewer households were successful in their large land mammal harvest activities in 2014. An estimated 33% of Cordova households harvested large land mammals in 2014 compared to 43% of community households harvesting these resources in 2003. Survey results indicate that while fewer Cordova households shared large land mammals in 2014, more community households received large land mammals in 2014 than in 2003. The increase in households receiving resources could explain the increased percentage of households using large land mammals in 2014. Some of the large land mammals used in the community in 2014 could have also been received from outside the community. In 2014, Cordova households harvested approximately 145 moose (88 bulls and 57 cows); the majority of moose were harvested in September (total harvest 57 bulls and 26 cows) and October (total harvest 16 bulls and 26 cows) (Table 4-17). In comparison, Cordova households harvested approximately 472 deer, the majority of which were harvested in October and November. Of other species of significance to the 2014 large land mammal harvest, all caribou (total harvest 10 males) and Dall sheep (10 animals) were harvested in September, and all mountain goats (26 animals) were harvested in October. The majority of black bear harvests (16 animals) were in May, with an additional small harvest taking place in June.23
Survey respondents commented that the deer population in the area was hit hard by the record snowfall during winter of 2012 and that while the population is recovering, it still has not fully recovered. This is why some households said that they chose not to hunt for deer during 2014. Change in deer hunting participation is likely reflected in the declined per capita harvest between the previous study year 2003 (24 lb) and 2014 (8 lb) (Fall 2006:56) (Table 4-13). According to both survey respondents and key respondents interviewed for the project, the moose population in the Cordova area is doing very well after a period of decline in the population approximately 6–8 years ago. Some survey respondents said that access to moose hunting areas can be difficult without an airboat. According to key respondents, some community residents without motorized equipment are accessing moose search and harvest areas with alternative means, such as with a kayak or on foot, and if successful at harvesting a moose, hunters call a friend with an airboat, or a fishing boat, to come and assist with bringing the harvest home. Key respondents also commented that while some road hunting for moose takes place, it is not as productive as using motorized equipment to access areas in the Copper River Delta. However, access to these areas has been more difficult since August
23. Harvest ticket data are compared to 2014 harvest estimates for Chenega Bay and Tatitlek in the other results chapters; howev-er, reported harvests collected via harvest tickets by the ADF&G Division of Wildlife Conservation and recorded in the Wildlife Information Network (WinfoNet) database are not compared to estimated harvests by Cordova households due to lack of com-parability. The size of the community combined with differing data collection methods employed by the harvest ticket program and Division of Subsistence household surveys, as well as Cordova residents’ opportunity to hunt large land mammals under both federal- and state-regulated hunts, precludes a comparison discussion.
234

Figure 4-18.–Hunting locations of black bear, Dall sheep, deer, moose, and mountain goat, Cordova, 2014.
!
!
!
!
!
!
G u l f o f A l a s k a
Mon
tagu
e Islan
d
Hinchinbroo
k Island
KnightIsland
P r i n c e W i l l i a m
S o u n dPo
rtVa
ldez
Port
Well
s
Kayak
Islan
d
ControllerBay
Copper River
Delta
Rich
ardson Hwy
C h u g a c hM o u n t a i n
s
Hawkins Island
Copper River Hwy Martin River
Chenega (Old Site)
Chenega Bay
Cordova
Tatitlek
Valdez
0 2010Miles
This map depicts areas used forresource harvesting in 2014 by 46surveyed households in Cordova,Alaska. The total survey sample
includes 184 of 950 households inCordova (19%), so this map is a partial
representation of areas used forresource harvests in 2014. Resourceharvest areas change over time, so
areas not used in 2014 might be used inother years.
Source:Alaska Department of Fish and Game(ADF&G) Division of Subsistence,
2015.North American Datum 1927.
Alaska Albers Projection.
Map created by: Terri Lemons
EVOS 2014
CordovaBlack bear search and harvest areas
1:1,250,000SCALE:
Dall sheep search and harvest areas
Deer search and harvest areas
Mountain goat search and harvest areas
Moose search and harvest areas
Road
144°W
146°W
146°W
148°W
148°W
61°N
60°N
235

Figure 4-19.–Composition of small land mammal/furbearer harvest by individual animals harvested, Cordova, 2014.
2011 when the Alaska Department of Transportation and Public Facilities closed Bridge No. 339 at mile 36 of the Copper River Highway indefinitely due to safety concerns.24 Key respondents commented that the loss of use of the bridge has made it more challenging for local residents to access previously commonly used fishing and hunting areas beyond the bridge. Due to the indefinite closure of the bridge, some residents have continued to use boats to access areas past the damaged bridge and continue to use, for example, the Martin River area for moose hunting.In 2014, Cordova residents searched for and harvested large land mammals mostly locally; only one distant search and harvest area for Dall sheep was recorded northeast of Port Wells in the Chugach Mountains (Figure 4-18). Community residents searched for and harvested mountain goats mostly north of the Copper River Highway while deer search and harvest areas extended to both Hawkins and Hinchinbrook islands. Black bears were hunted along the Copper River Highway as well as north of Cordova. Moose search and harvest areas were the most widespread, including large areas along the Copper River Highway and extending up the Copper River Delta. Additional moose hunting areas were recorded on Hinchinbrook Island southwest of Cordova and north of Controller Bay, which is a substantial distance southeast from Cordova. It needs to be noted that project key respondents commented that an important and commonly used moose hunting area not as well documented during the household survey effort is the Martin River drainage, which is located a substantial distance southeast of the community and commonly accessed with an airboat or a fishing boat.
Small Land Mammals/FurbearersIn 2014, the harvest of small land mammals consumed as food made up less than 1% (or 923 lb total) of the total harvest weight by Cordova households (Figure 4-10; Table 4-13). The animals used for food as
24. United States Department of Agriculture, Forest Service, Chugach National Forest, “Copper River Highway Closure at mile 36 to Last Several Years,” news release, April 9, 2012. http://www.fs.usda.gov/detail/chugach/news-events?cid=STEL-PRDB5361008 (accessed October 21, 2015).
Beaver12%
Coyote7%
Snowshoe hare35%North American
river (land) otter8%
Marten9%
Mink9%
Muskrat3%
Weasel14%
Wolverine3%
236

Table 4-18.–Estimated small land mammal/furbearer harvests by month, Cordova, 2014.
Jan Feb Mar Apr May Jun Jul Aug Sep Oct Nov Dec UnkAll small land mammals 36.2 5.2 0.0 5.2 0.0 0.0 0.0 0.0 0.0 67.6 263.7 98.5 154.9 631.1
Beaver 0.0 0.0 0.0 0.0 0.0 0.0 0.0 0.0 0.0 0.0 56.8 0.0 15.5 72.3Coyote 5.2 0.0 0.0 5.2 0.0 0.0 0.0 0.0 0.0 0.0 15.5 0.0 20.7 46.5Red fox 0.0 0.0 0.0 0.0 0.0 0.0 0.0 0.0 0.0 0.0 0.0 0.0 0.0 0.0Snowshoe hare 5.2 0.0 0.0 0.0 0.0 0.0 0.0 0.0 0.0 67.6 57.2 57.2 36.1 223.2North american river (land) otter 10.3 0.0 0.0 0.0 0.0 0.0 0.0 0.0 0.0 0.0 15.5 15.5 10.3 51.6
Lynx 0.0 0.0 0.0 0.0 0.0 0.0 0.0 0.0 0.0 0.0 0.0 0.0 0.0 0.0Marten 0.0 5.2 0.0 0.0 0.0 0.0 0.0 0.0 0.0 0.0 51.6 0.0 0.0 56.8Mink 10.3 0.0 0.0 0.0 0.0 0.0 0.0 0.0 0.0 0.0 10.3 15.5 20.7 56.8Muskrat 0.0 0.0 0.0 0.0 0.0 0.0 0.0 0.0 0.0 0.0 0.0 0.0 15.5 15.5Porcupine 0.0 0.0 0.0 0.0 0.0 0.0 0.0 0.0 0.0 0.0 0.0 0.0 0.0 0.0Arctic ground (parka) squirrel 0.0 0.0 0.0 0.0 0.0 0.0 0.0 0.0 0.0 0.0 0.0 0.0 0.0 0.0
Red (tree) squirrel 0.0 0.0 0.0 0.0 0.0 0.0 0.0 0.0 0.0 0.0 0.0 0.0 0.0 0.0Weasel 5.2 0.0 0.0 0.0 0.0 0.0 0.0 0.0 0.0 0.0 51.6 10.3 20.7 87.8Gray wolf 0.0 0.0 0.0 0.0 0.0 0.0 0.0 0.0 0.0 0.0 0.0 0.0 0.0 0.0Wolverine 0.0 0.0 0.0 0.0 0.0 0.0 0.0 0.0 0.0 0.0 5.2 0.0 15.5 20.7
Estimated harvest by month
Source ADF&G Division of Subsistence household surveys, 2015.
Resource Total
well as for their fur include beaver (497 lb total) and snowshoe hare (426 lb) (Table 4-13). However, most furbearers (weasels, minks, martens, muskrats, North American river otters, coyotes, and wolverines,) were harvested for their fur only. Figure 4-19 portrays the harvest composition of small land mammals hunted or trapped in 2014 in numbers of individual animals harvested, and Table 4-18 describes the harvest of small land mammals by month. In numbers of animals harvested, the majority of the small land mammal harvest was composed of snowshoe hares (35% of harvest, or 223 animals), weasels (14% of harvest, or 88 animals), and beavers (12% of harvest, or 72 animals) (Figure 4-18; Table 4-13). Furthermore, minks and martens both made up 9% of the harvest (or 57 animals each), followed by river otters (8% of harvest, or 52 animals). Most of the furbearer harvest follows a standard trapping season, which usually starts in November and continues through February or March. For study year 2014, the most harvests took place in November with an estimated total of 264 animals hunted or trapped that month (Table 4-18). Smaller amounts of animals were harvested in December (a total of 99 animals) and in January (a total of 36 animals). It is noteworthy that approximately 155 animals, many of which were snowshoe hares (36 animals), were taken at an unknown time during study year 2014. Only a small number of Cordova households continue to trap or hunt small land mammals, and therefore use of these resources was limited to a small portion of the community. Only 11% of households used and 10% of households harvested some small land mammals (Table 4-13). Compared to results from the previous study year, the harvest and use of small land mammals by Cordova households has further declined since 2003. In 2003, approximately 20% of community households used small land mammals and 17% of households harvested these species (Fall 2006:57).In study year 2014, Cordova households attempted to harvest and harvested small land mammals locally but also in locations farther away from the community (Figure 4-20). The local trapping and hunting areas were located just north of the Copper River Highway as well as along the highway. Additional trapping and hunting areas were documented north of Milton Lake, on the west side of Nelson Bay, as well as on the west side of Heney Range. The farthest trapping and hunting area recorded during the household surveys was located northeast of Controller Bay, which is a substantial distance southeast from the community.
237
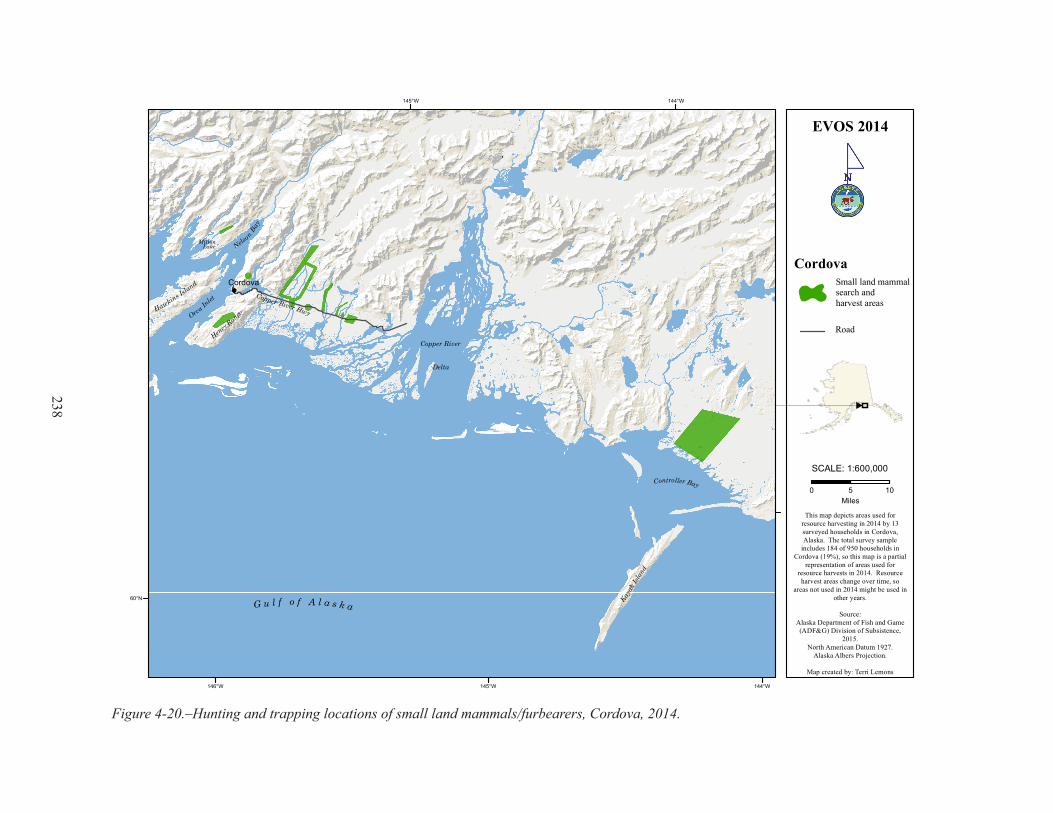
Figure 4-20.–Hunting and trapping locations of small land mammals/furbearers, Cordova, 2014.
!
G u l f o f A l a s k aKay
akIs
land
Hawkins Island
Copper River
Delta
OrcaInlet
Copper River Hwy
Controller Bay
Nelson
Bay
HeneyRang
e
MiltonLake
Cordova
0 105Miles
This map depicts areas used forresource harvesting in 2014 by 13surveyed households in Cordova,Alaska. The total survey sample
includes 184 of 950 households inCordova (19%), so this map is a partial
representation of areas used forresource harvests in 2014. Resourceharvest areas change over time, so
areas not used in 2014 might be used inother years.
Source:Alaska Department of Fish and Game(ADF&G) Division of Subsistence,
2015.North American Datum 1927.
Alaska Albers Projection.
Map created by: Terri Lemons
EVOS 2014
Cordova
1:600,000SCALE:
Small land mammalsearch and harvest areas
Road
144°W
144°W
145°W
145°W
146°W
60°N
238

Marine MammalsAs noted earlier in Chapter 1 “Introduction” in the regulatory context overview, only Alaska Natives are allowed to hunt marine mammals. According to survey results, there was no harvest of marine mammals by Cordova households in 2014 (Table 4-13). These results differ from another survey conducted by the Alaska Native Harbor Seal Commission (ANHSC), which estimated a take of 62 harbor seals, including 7 struck and lost by Cordova households in 2014 (Bernadine Erickson, Alaska Native Harbor Seal Commission Project Coordinator, Anchorage, personal communication, July 2015). In addition, the ANHSC survey estimated the take of 3 Steller sea lions. The ANHSC survey was conducted with a chain referral method and surveyed a sample of Alaska Native households in Cordova with household members who actively engaged in marine mammal harvesting. The estimated number of harbor seals and Steller sea lions taken is an expanded total based on reported harvests by a 73% household sample (8 of 11 households).According to this study, approximately 4% of Cordova households received and used marine mammals during 2014 (Table 4-13). The majority of this use was of harbor seal. Since an even smaller number (less than 1%) of community households shared some marine mammals, it is possible that some of the marine mammals used in Cordova in 2014 came from outside of the community, or that households were using resources harvested in the previous year.During the community review meeting a participant commented that even though no attempted harvest or harvest of seas otters were documented in the 2014 survey, there are a few key individuals in Cordova who harvest a number of seas otters annually. According to sea otter sealing data collected by the U.S. Fish & Wildlife Service, a total of 215 sea otters were harvested by Cordova residents in 2014 (Forrest Hannan, Natural Resource Specialist, Marine Mammals Management, U.S. Fish &Wildlife Service, Anchorage, personal communication, November 10, 2015). In addition, a few survey participants mentioned that in their view, the area sea otter population is getting rather large and that they would like to see increased management of the population overall. No particular concerns or comments related to harbor seals or sea lions were recorded during the survey effort, nor in discussions with project key respondents.
Birds and EggsIn 2014, Cordova households hunted birds and gathered bird eggs for an estimated total harvest of 3,798 lb, or approximately 2 lb per capita (Table 4-13). While the total harvest of birds and eggs only contributed 1% to the total wild resource harvest of the community in 2014, birds and eggs were hunted by 26% of households, harvested by 21% of households, and used by 34% of community households (Figure 4-10; Table 4-13). More households received (18% of households) birds and eggs than shared any (9% of households) (Table 4-13). Based on the larger number of households receiving birds and eggs than sharing some, it is possible that some of these resources were received from outside the community. Another possibility is that a small number of Cordova households shared their birds and eggs harvest with more than 1 household in the community.Compared to study findings from 2003, the harvest and use of birds and eggs in Cordova has declined. In 2003, approximately 43% of community households used birds and eggs compared to 34% of households in 2014 (Fall 2006:57). Interestingly, household participation in harvesting activities and successfully harvesting these resources has only declined slightly since 2003 when 30% of community households attempted to harvest and 29% harvested some bird and eggs.In terms of harvest weight, mallards accounted for 38% (or 1,442 lb total) of the birds and eggs harvest, followed by sandhill cranes (14%, or 520 lb total), and wigeons (11%, or 419 lb total) (Figure 4-21; Table 4-13). Overall, upland game birds were harvested in lesser quantities than migratory birds. Both ptarmigan and unspecified grouse species each contributed 4% to the birds and eggs harvest in 2014 (Figure 4-21). The harvest of eggs was largely made up of gull eggs and contributed 2% (approximately 74 lb, or 248 eggs total) to the total birds and eggs harvest in 2014 (Figure 4-21; Table 4-13). In addition, a very small number (less than 1%) of Cordova households harvested and used eggs from unspecified duck species (Table 4-13).
239

After a successful request by the Native Village of Eyak in 2012, the early spring hunt of migratory waterfowl during April 2–30 and subsistence gathering of gull eggs during the month of May in a limited area within GMU 6B and 6C were legalized for Cordova residents under federal regulations starting in 2014.25 The majority of Cordova households’ bird harvests took place during fall months; 3,397 of the estimated 4,164 birds were harvested during this time (Table 4-19). The second most productive season was summer, with an estimated total of 658 birds harvested.The Copper River Delta and the vast tidal flats and wetlands bordering the ocean in the delta are an annual resting and refueling area for millions of migratory birds during spring and fall migrations. Those Cordova households that engage in hunting migratory birds and gathering eggs commonly use these areas for harvesting these resources. In 2014, Cordova households mostly utilized the wetlands as well as a number of islands located along the chain of small islands south of the community to attempt to harvest and harvest migratory birds and eggs (Figure 4-22). Some harvests also took place along the road corridor east of the Cordova airport. For study year 2014, the easternmost migratory bird search and harvest area was documented northeast of Controller Bay. In comparison, the westernmost harvest and search areas were documented on Hinchinbrook Island and northwest of Hinchinbrook Island in the waters of Prince William Sound. Upland game birds, which were harvested in substantially less quantity, were searched for and harvested along the north side of the Copper River Highway road corridor leading east of the Cordova airport all the way to approximately Flag Point, where the road currently ends. A project key respondent commented that an additional, commonly used migratory bird harvest area, which was not well documented during the survey effort, is located south of the Eyak River; the area has several small cabins locally called “duck cabins” that residents like to use when hunting for ducks.
25. United States Department of the Interior, Fish and Wildlife Service, Final rule, “Migratory Bird Subsistence Harvest in Alaska; Harvest Regulations for Migratory Birds in Alaska During the 2014 Season,” Federal Register 79, no. 67 (April 8, 2014): 19454–19460. http://www.fws.gov/alaska/ambcc/Regs/2014-07824.pdf (accessed October 16, 2015).
Figure 4-21.–Composition of bird and bird egg harvest in pounds usable weight, Cordova, 2014.
Mallard38%
Northern pintail6%
Unknown teal5%
Unknown wigeon11%
Unknown Canada/cackling
geese4%
White-fronted goose2%
Sandhill crane14%
Unknown loon2%
Unknown grouse4%
Unknown ptarmigan4%
Unknown gull eggs2%
Other8%
Note The "other" category represents all species that contributed 1.5% or less to the total birds and bird eggs harvest.
240

Table 4-19.–Estimated bird harvests by season, Cordova, 2014.
Spring Summer Fall WinterSeason
unknownAll birds 25.8 657.9 3,397.3 62.0 20.7 4,163.6
Bufflehead 0.0 0.0 5.2 0.0 0.0 5.2Canvasback 0.0 0.0 51.6 0.0 0.0 51.6Unknown eider 0.0 0.0 0.0 0.0 0.0 0.0Goldeneye 0.0 5.2 62.0 0.0 0.0 67.1Harlequin duck 0.0 0.0 0.0 0.0 0.0 0.0Mallard 0.0 332.2 1,239.1 31.0 0.0 1,602.3Unknown merganser 0.0 0.0 15.5 0.0 0.0 15.5Long-tailed duck 5.2 0.0 51.6 0.0 0.0 56.8Northern pintail 0.0 20.7 273.6 0.0 0.0 294.3Unknown scaup 10.3 0.0 0.0 0.0 0.0 10.3Black scoter 5.2 0.0 20.7 0.0 0.0 25.8Surf scoter 0.0 0.0 0.0 0.0 0.0 0.0White-winged scoter 0.0 0.0 0.0 0.0 0.0 0.0Northern shoveler 0.0 0.0 77.4 0.0 0.0 77.4Unknown teal 0.0 20.8 583.4 0.0 0.0 604.2Unknown wigeon 0.0 31.1 567.9 0.0 0.0 599.1Unknown ducks 0.0 0.0 0.0 0.0 0.0 0.0Unknown Canada/cackling geese 0.0 26.0 108.4 5.2 0.0 139.5Snow goose 0.0 0.0 0.0 10.3 0.0 10.3White-fronted goose 0.0 25.8 0.0 0.0 0.0 25.8Sandhill crane 0.0 62.0 0.0 0.0 0.0 62.0Unknown cormorant 0.0 0.0 0.0 0.0 0.0 0.0Unknown gull 0.0 0.0 0.0 0.0 0.0 0.0Black-legged kittiwake 0.0 0.0 0.0 0.0 0.0 0.0Unknown loon 0.0 0.0 0.0 0.0 20.7 20.7Unknown murre 0.0 0.0 0.0 0.0 0.0 0.0Unknown puffin 0.0 0.0 0.0 0.0 0.0 0.0Unknown migratory birds 0.0 0.0 0.0 0.0 0.0 0.0Spruce grouse 0.0 0.0 46.5 0.0 0.0 46.5Unknown grouse 5.2 118.8 108.4 0.0 0.0 232.3Unknown ptarmigan 0.0 15.5 185.9 15.5 0.0 216.8Source ADF&G Division of Subsistence household surveys, 2015.
Estimated harvest by season
TotalResource
241
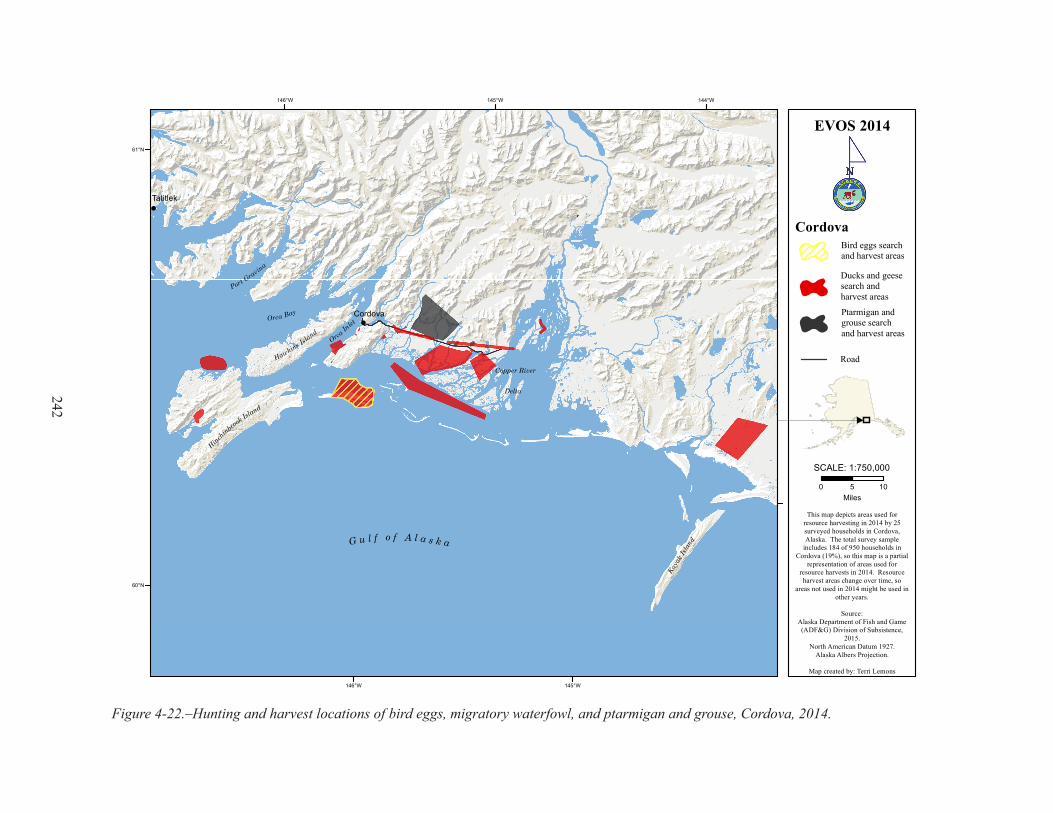
Figure 4-22.–Hunting and harvest locations of bird eggs, migratory waterfowl, and ptarmigan and grouse, Cordova, 2014.
!
!
G u l f o f A l a s k a
Hinchinbro
ok Island
Kayak
Isla
nd
Hawkins Island
Orca Bay
Port Gravina
Copper River
Delta
OrcaInlet
Cordova
Tatitlek
0 105Miles
This map depicts areas used forresource harvesting in 2014 by 25surveyed households in Cordova,Alaska. The total survey sample
includes 184 of 950 households inCordova (19%), so this map is a partial
representation of areas used forresource harvests in 2014. Resourceharvest areas change over time, so
areas not used in 2014 might be used inother years.
Source:Alaska Department of Fish and Game(ADF&G) Division of Subsistence,
2015.North American Datum 1927.
Alaska Albers Projection.
Map created by: Terri Lemons
EVOS 2014
CordovaBird eggs search and harvest areas
1:750,000SCALE:
Ducks and geese search and harvest areas
Ptarmigan and grouse search and harvest areas
Road
144°W
145°W
145°W
146°W
146°W
61°N
60°N
242

Figure 4-23.–Composition of marine invertebrates harvest in pounds usable weight, Cordova, 2014.
Marine Invertebrates
In 2014, Cordova households harvested an estimated total of 6,008 lb, or 2 lb per capita, of marine invertebrates (Table 4-13). Compared to previous survey results from 2003, during both study years, the total harvest of marine invertebrates contributed approximately 2% to the total wild resource harvest (Figure 4-10) (Fall 2006). In 2014, Cordova households reported harvesting a large variety of marine invertebrates; all types of Tanner crab made up the largest portion of the harvest (40%) totaling 2,379 lb, or 1 lb per capita (Figure 4-23; Table 4-13). It was also the most commonly used marine invertebrate species with 21% of Cordova households using Tanner crab (bairdi) (Table 4-13). Unspecified king crab contributed 21% of the marine invertebrates harvest (or 1,291 lb total), followed by shrimp (14% of harvest, or 835 lb total), and octopus (12% of harvest, or 733 lb total). The remaining marine invertebrates harvest was made up of Dungeness crab (3% of harvest), and 3 different kinds of clams as well as unspecified species of clams (razor clams [3%], butter clams [3%], Pacific littleneck clams [2%], and unspecified clams [2%]). Overall, 23% of Cordova households attempted to harvest marine invertebrates and 21% harvested these resources (Table 4-13). Also, 28% of community households received and 16% of households shared some marine invertebrates. Compared to the 2003 study year, fewer Cordova households used, attempted to harvest, and harvested marine invertebrates in 2014; the same is also true for sharing and receiving of marine invertebrates (Fall 2006:59) (Table 4-13). Project key respondents commented that, for example, shrimp are more abundant in western parts of Prince William Sound, which makes harvesting them more challenging for households lacking appropriate transportation or necessary financial resources to pay for the gas to travel in the sound. Regarding razor clams, it is acknowledged by area management biologists that environmental changes, such as the siltation event from the Copper River in 1958, and the habitat changes caused by the 1964 Good Friday earthquake, resulted in negative outcomes for the Prince William Sound area clam populations (Wessel et al. 2012). Survey respondents provided additional observations regarding clams and the fact that oil can still be found under rocks at some beaches in the sound; sometimes oil is only 5 inches down from the surface. According
Butter clams3%
Pacific littleneck clams (steamers)
2%
Razor clams3%
Unknown clams2%
Dungeness crab3%
Unknown king crab21%
Tanner crab, bairdi37%
UnknownTanner crab
3%
Octopus12%
Shrimp14%
Other<1%
Note The "other" category represents all species that contributed 1% or less to the total marine invertebrates harvest.
243

to one respondent, oil is still found in Bay of Isles and on all bays on the west side of Knight Island. Because of the oil, residents continue to be unable to harvest clams from this area. The same respondent also commented that fresh oil can be found in the Latouche–Sleepy Bay area on the west side of Latouche Island. In addition, several survey respondents expressed their concerns about the safety of seafood harvested in the area, largely due to the lingering oil residue from the oil spilled over 25 years ago (see Table 4-28 and Table 4-29 for more information about community members’ assessments of the safety of wild food resources). Cordova households use large areas around Prince William Sound to harvest marine invertebrates (Figure 4-24). While several bays (Port Gravina, Port Fidalgo, Galena Bay, and Port Valdez) northwest of Cordova are closed to subsistence Tanner and king crab fishing, the waters closest to the community around Hawkins and Hinchinbrook islands are commonly used to attempt to harvest and harvest a variety of marine invertebrates, including crabs, shrimp, clams, and octopuses. For study year 2014, additional marine invertebrates search and harvest areas in Prince William Sound were recorded in Unakwik Inlet, Port Wells, and around Eshamy Bay and Main Bay southeast of Port Nellie Juan. Furthermore, a separate clam search and harvest area was documented on the Kenai Peninsula along the shores of Cook Inlet. A key respondent commented that another popular area not well documented during the survey effort that was used for searching for and harvesting marine invertebrates is Hook Point on Hinchinbrook Island.
244
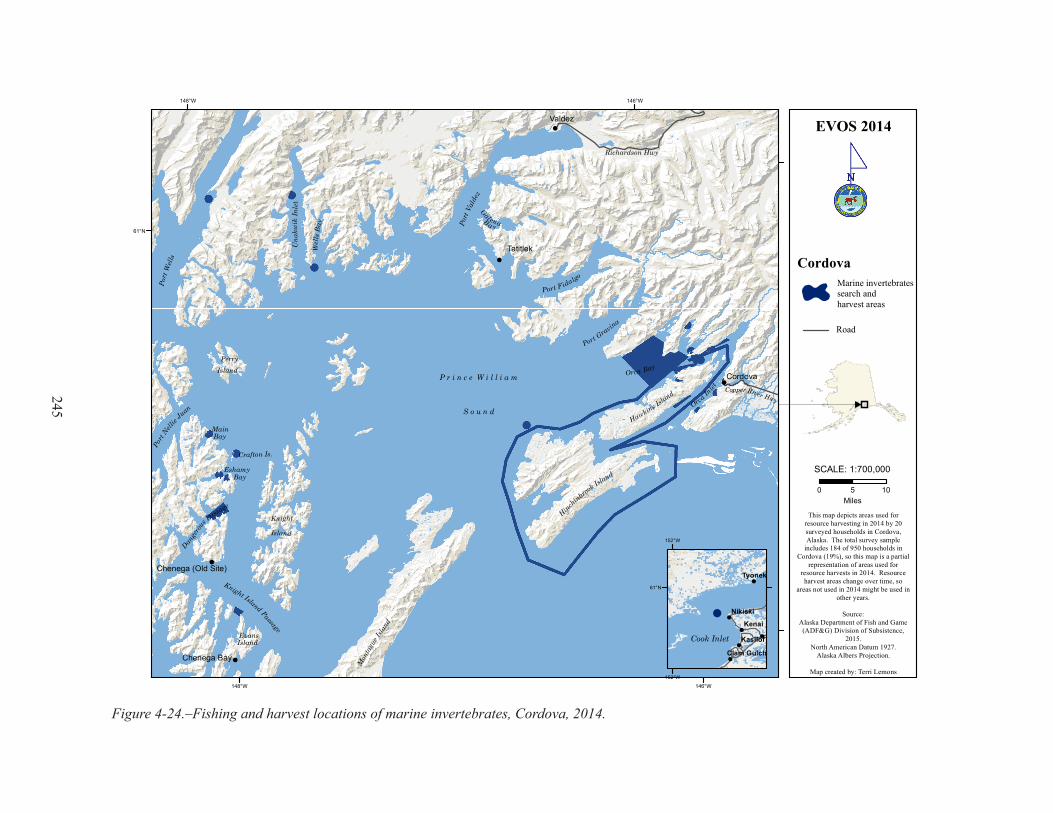
Figure 4-24.–Fishing and harvest locations of marine invertebrates, Cordova, 2014.
!
!
!
!
!
Mon
tagu
e Islan
d
Hinchinbroo
k Island
Knight
Island
P r i n c e W i l l i a m
S o u n d
Port
Vald
ez
Port
Wel
ls
Hawkins Island
Orca BayPerry
Island
Knight Island Passage
Port Gravina
Orca
In
let
EvansIsland
Dange
rous
Passage
MainBay
EshamyBay
Crafton Is.
Una
kwik
Inl e
t
Wel
l sB
ay
Copper River Hwy
Richardson Hwy
Port Fidalgo
Gal enaB a y
Port
Nellie
Juan
Chenega (Old Site)
Chenega Bay
Cordova
Tatitlek
Valdez
0 105Miles
This map depicts areas used forresource harvesting in 2014 by 20surveyed households in Cordova,Alaska. The total survey sample
includes 184 of 950 households inCordova (19%), so this map is a partial
representation of areas used forresource harvests in 2014. Resourceharvest areas change over time, so
areas not used in 2014 might be used inother years.
Source:Alaska Department of Fish and Game(ADF&G) Division of Subsistence,
2015.North American Datum 1927.
Alaska Albers Projection.
Map created by: Terri Lemons
EVOS 2014
Cordova
1:700,000SCALE:
Marine invertebratessearch and harvest areas
146°W
146°W
148°W
148°W
61°N
!
!!!
!
!
!
!
!!!!!!!!!!
!
!
!
!
!
!
Kenai
Tyonek
Nikiski
Kasilof
Clam Gulch
152°W
152°W
61°N
Road
Cook Inlet
245
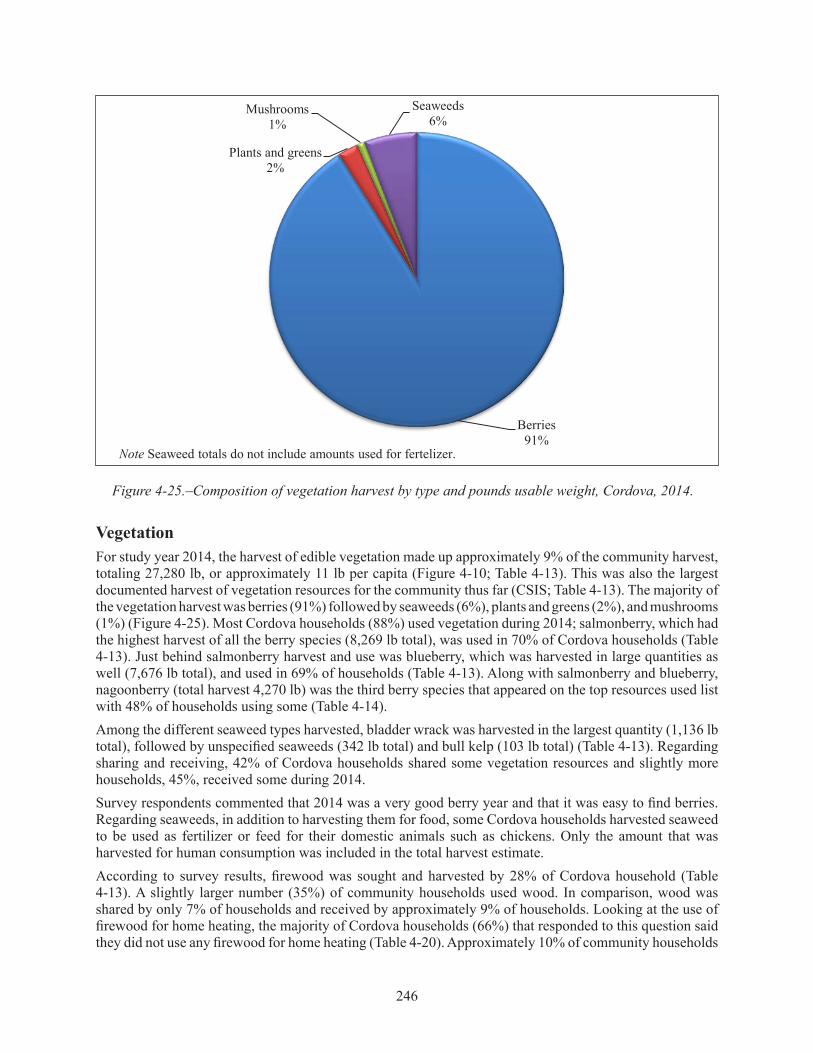
Figure 4-25.–Composition of vegetation harvest by type and pounds usable weight, Cordova, 2014.
Berries91%
Plants and greens2%
Mushrooms1%
Seaweeds6%
Note Seaweed totals do not include amounts used for fertelizer.
VegetationFor study year 2014, the harvest of edible vegetation made up approximately 9% of the community harvest, totaling 27,280 lb, or approximately 11 lb per capita (Figure 4-10; Table 4-13). This was also the largest documented harvest of vegetation resources for the community thus far (CSIS; Table 4-13). The majority of the vegetation harvest was berries (91%) followed by seaweeds (6%), plants and greens (2%), and mushrooms (1%) (Figure 4-25). Most Cordova households (88%) used vegetation during 2014; salmonberry, which had the highest harvest of all the berry species (8,269 lb total), was used in 70% of Cordova households (Table 4-13). Just behind salmonberry harvest and use was blueberry, which was harvested in large quantities as well (7,676 lb total), and used in 69% of households (Table 4-13). Along with salmonberry and blueberry, nagoonberry (total harvest 4,270 lb) was the third berry species that appeared on the top resources used list with 48% of households using some (Table 4-14). Among the different seaweed types harvested, bladder wrack was harvested in the largest quantity (1,136 lb total), followed by unspecified seaweeds (342 lb total) and bull kelp (103 lb total) (Table 4-13). Regarding sharing and receiving, 42% of Cordova households shared some vegetation resources and slightly more households, 45%, received some during 2014. Survey respondents commented that 2014 was a very good berry year and that it was easy to find berries. Regarding seaweeds, in addition to harvesting them for food, some Cordova households harvested seaweed to be used as fertilizer or feed for their domestic animals such as chickens. Only the amount that was harvested for human consumption was included in the total harvest estimate.According to survey results, firewood was sought and harvested by 28% of Cordova household (Table 4-13). A slightly larger number (35%) of community households used wood. In comparison, wood was shared by only 7% of households and received by approximately 9% of households. Looking at the use of firewood for home heating, the majority of Cordova households (66%) that responded to this question said they did not use any firewood for home heating (Table 4-20). Approximately 10% of community households
246

Table 4-20.–Use of firewood for home heating in sampled households, Cordova, 2014.
responding to this question said that between 1–25% of their home heating comes from firewood, and an additional 10% estimated that between 26–50% of their home heating was provided by firewood. Only small numbers of Cordova households said that more than 50% of their home heating came from firewood. One survey respondent commented that it is getting harder and harder to harvest firewood and that there is a need for a subsistence firewood harvest lot in the community. Another respondent observed that there has been a lot of clearcutting when people are getting ready to develop a property, and that they do not always replant enough new trees. Vegetation resources were harvested locally in large areas adjacent to the Copper River Highway road corridor as well as along the eastern shores of Orca Inlet (Figure 4-26). Additional harvesting took place on Hinchinbrook Island. For study year 2014, the southernmost vegetation search and harvest areas were documented on the eastern shores of Montague Island, and the northernmost areas in the Copper River Basin as well as on the west side of Cook Inlet. In comparison, the easternmost harvest and search area for vegetation resources was recorded northeast of Controller Bay. A key respondent commented that another popular vegetation search and harvest area not well documented during the survey effort is Hook Point on Hinchinbrook Island, where there are also a number of privately owned seasonally used cabins.
Percentage of home heating from firewood
Number of households
Percentage of households
0% 104 66%1-25% 15 9%26-50% 15 9%51-75% 10 6%76-99% 8 5%100% 6 4%Source ADF&G Division of Subsistence household surveys, 2015.
247

Figure 4-26.–Gathering and harvest locations of berries and plants, greens, and mushrooms, Cordova, 2014.
!
!
!
Cordova
Tatitlek
Valdez
G u l f o f A l a s k aMon
tagu
e Islan
d
Hinch
inbrook Isla
nd
P r i n c e W i l l i a m
S o u n d
Port
Vald
ez
Kayak
Islan
d
ControllerBay
Hawkins Island
Orca Bay
Port Gravina
Copper River
Delta
Orca
Inlet
0 2010Miles
This map depicts areas used forresource harvesting in 2014 by 71surveyed households in Cordova,Alaska. The total survey sample
includes 184 of 950 households inCordova (19%), so this map is a partial
representation of areas used forresource harvests in 2014. Resourceharvest areas change over time, so
areas not used in 2014 might be used inother years.
Source:Alaska Department of Fish and Game(ADF&G) Division of Subsistence,
2015.North American Datum 1927.
Alaska Albers Projection.
Map created by: Terri Lemons
EVOS 2014
Cordova
1:950,000SCALE:
Berries, greens, and mushrooms search and harvest areas
!
!!
!
PalmerWasilla
Girdwood
Anchorage
150°W
150°W
62°N
61°N
!
!
!
Chitina
Glennallen
Copper Center
144°W
145°W
145°W
62°N
144°W
146°W
146°W
61°N
60°N
Roads
248

coMParing harveStS and uSeS in 2014 with PreviouS yearS
Harvest AssessmentsResearchers asked respondents to assess their own harvests in 2 ways: whether they got more, less, or about the same amount of the 9 resource categories in 2014 as in the past 5 years, and whether they got “enough” of each of the 9 resource categories. Households also were asked to provide reasons if their use was different or if they were unable to get enough of a resource. Responses about less, same, or more use of resources are important because they can point out abnormalities in resource use in the study year in comparison to consistent lack of use or steady use of resources from a specific category in recent previous years. If households did not get enough of a resource, they were asked to evaluate the severity of the impact to their household as a result of not getting enough. This section discusses responses to those questions.Together, Table 4-21 and Figure 4-27 and Figure 4-28 provide a broad overview of households’ assessments of their uses of harvests in 2014. Because not everyone uses all resource categories, some households did not respond to the assessment questions. Additionally, some households that do typically use a resource category simply did not answer questions. Overall, relative to responses of the same level of use, and simultaneously relative to responses of more use, a greater percentage of households said they used less large land mammals, marine mammals, birds and bird eggs, and seaweed (Table 4-21; Figure 4-27).Salmon was the most harvested of all subsistence resource categories used by Cordova households (Figure 4-10). Of the households that responded to the question, 47% explained that they used the same amount of salmon in 2014 as they did in previous years, 28% reported that they used less, and 16% said they used more (Table 4-21; Figure 4-27). When asked why they used less, 42% of respondents that used less salmon reported that they did so due to salmon being less available (Table 4-22). Other stated reasons for using less salmon included a greater incidence of unsuccessful harvesting (17%), which could be tied to a lack of salmon availability. An equal number of households said that their ability to fish was limited by work or other life events that kept them too busy, and that they used less salmon due to lack of harvest effort. For those households that used more salmon in the study year, 83% said it was due to an increased harvest effort (Table 4-23). Approximately one-quarter of households in Cordova stated that they did not get enough salmon (Figure 4-28; Table 4-24). When those households were asked to evaluate the impact of not getting enough salmon, 16% described it as not noticeable, 55% described the impact as minor, 14% explained that not getting enough salmon had a major effect on their household, and 5% stated that the impact was severe (Table 4-24). The 2 species of salmon people were particularly concerned with getting more of were sockeye salmon (20%) and Chinook salmon (15%) (Table 4-25).The second most harvested resource category in Cordova was large land mammals (Figure 4-10). Of the households that responded to the question, 31% stated that they used the same amount of large game animals as in the previous 5 years; 37% reported using less large land mammals than in recent previous years (Table 4-21). People reported a variety of reasons for less use of these resources; however, the most frequently cited reasons were no time to hunt due to work (24%), family/personal reasons (22%), unsuccessful hunting (20%), lack of hunting effort (18%), and less sharing (16%) (Table 4-22). An important additional reason for less use of large land mammals was a lack of necessary equipment or gear needed to hunt. Many people in the Cordova stated that a boat or an airboat is needed to hunt for large land mammals. Although the boundaries of many moose hunt areas border the Copper River Highway, significant portions of the local game management units are located off the road system. Deer are hunted almost exclusively on surrounding islands, making boat access mandatory. Hunting mountain goats requires a boat or small plane. Other hunts (caribou and Dall sheep) require transportation outside of Prince William Sound by air or ferry with additional transportation needed once a person has arrived in the Copper River Basin or on the Kenai Peninsula.Another reason some respondents noted harvesting less large land mammals was out of concern for population health. This was especially true for deer, of which some respondents reported harvesting less
249

Table 4-21.–Changes in household uses of resources compared to recent years, Cordova, 2014.
Number Percentage Number Percentage Number Percentage Number Percentage Number PercentageAny resource 184 184 181 98.4% 141 76.6% 165 89.7% 96 52.2% NA NA
All resources 184 179 177 98.9% 58 32.4% 86 48.0% 33 18.4% 2 1.1%Salmon 184 180 165 91.7% 51 28.3% 85 47.2% 29 16.1% 15 8.3%Nonsalmon fish 184 180 148 82.2% 48 26.7% 69 38.3% 31 17.2% 32 17.8%Large land mammals 184 175 157 89.7% 64 36.6% 54 30.9% 39 22.3% 18 10.3%Small land mammals 184 182 37 20.3% 13 7.1% 17 9.3% 7 3.8% 145 79.7%Marine mammals 184 172 20 11.6% 12 7.0% 6 3.5% 2 1.2% 152 88.4%Birds and bird eggs 184 162 54 33.3% 23 14.2% 20 12.3% 11 6.8% 108 66.7%Marine invertebrates 184 180 94 52.2% 34 18.9% 42 23.3% 18 10.0% 86 47.8%Vegetation 184 180 163 90.6% 45 25.0% 79 43.9% 39 21.7% 17 9.4%Seaweed 184 178 15 8.4% 7 3.9% 5 2.8% 3 1.7% 163 91.6%
a. Valid responses do not include households that did not provide any response.
Source ADF&G Division of Subsistence household surveys, 2015.Note "NA" indicates that there is not applicable data.
Households not usingSampled householdsResource category
MoreSameLessValid responsesa
Total householdsHouseholds reporting use
250

Figure 4-27.–Changes in household uses of resources compared to recent years, Cordova, 2014.
28%
27%
37%
7%
7%
14%
19%
25%
16%
17%
22%
7%
10%
22%
8%
18%
10%
80%
88%
67%
48%
9%
92%
47%
38%
31%
9%
12%
23%
44%
0% 10% 20% 30% 40% 50% 60% 70% 80% 90% 100%
Salmon
Nonsalmon fish
Large land mammals
Small land mammals
Marine mammals
Birds and bird eggs
Marine invertebrates
Vegetation
Seaweed
Percentage of surveyed households providing a valid response, unlabeled percentages are less than 5%.
Households used LESS in 2014 Households used SAME in 2014 Households used MORE in 2014 Households normally do not use
251

Figure 4-28.–Percentage of sampled households reporting whether they had enough resources, by resource category, Cordova, 2014.
24%
34%
36%
7%
8%
31%
27%
9%
20%
13%
80%
90%
71%
49%
12%
91%
67%
46%
51%
14%
8%
21%
20%
61%
7%
0% 10% 20% 30% 40% 50% 60% 70% 80% 90% 100%
Salmon
Nonsalmon fish
Large landmammals
Small landmammals
Marine mammals
Birds and bird eggs
Marineinvertebrates
Vegetation
Seaweed
Percentage of sampled households, unlabeled percentages are less than 5%.
Household did not get enough in 2014 Household got enough of resource in 2014 Household does not use resource
252

Table 4-22.–Reasons for less household uses of resources compared to recent years, Cordova, 2014.
Number Percentage Number Percentage Number Percentage Number Percentage Number Percentage Number PercentageAny resource 184 131 31 23.7% 35 26.7% 0 0.0% 11 8.4% 31 23.7% 48 36.6%
All resources 179 51 12 23.5% 6 11.8% 0 0.0% 2 3.9% 3 5.9% 13 25.5%Salmon 182 12 0 0.0% 5 41.7% 0 0.0% 0 0.0% 1 8.3% 2 16.7%Nonsalmon fish 180 49 8 16.3% 2 4.1% 0 0.0% 1 2.0% 6 12.2% 14 28.6%Large land mammals 180 45 10 22.2% 3 6.7% 0 0.0% 3 6.7% 7 15.6% 8 17.8%Small land mammals 175 61 8 13.1% 11 18.0% 0 0.0% 1 1.6% 11 18.0% 9 14.8%Marine mammals 172 11 3 27.3% 0 0.0% 0 0.0% 2 18.2% 4 36.4% 2 18.2%Birds and bird eggs 162 22 4 18.2% 1 4.5% 0 0.0% 1 4.5% 7 31.8% 7 31.8%Marine invertebrates 180 31 3 9.7% 10 32.3% 0 0.0% 3 9.7% 8 25.8% 5 16.1%Vegetation 180 41 9 22.0% 3 7.3% 0 0.0% 1 2.4% 1 2.4% 12 29.3%Seaweed 178 7 1 14.3% 0 0.0% 0 0.0% 0 0.0% 1 14.3% 3 42.9%
Table 4-22.–Continued.
Number Percentage Number Percentage Number Percentage Number Percentage Number Percentage Number PercentageAny resource 184 131 29 22.1% 13 9.9% 6 4.6% 31 23.7% 15 11.5% 3 2.3%
All resources 179 51 3 5.9% 4 7.8% 0 0.0% 9 17.6% 2 3.9% 0 0.0%Salmon 182 12 2 16.7% 1 8.3% 0 0.0% 2 16.7% 0 0.0% 0 0.0%Nonsalmon fish 180 49 4 8.2% 1 2.0% 3 6.1% 10 20.4% 1 2.0% 0 0.0%Large land mammals 180 45 9 20.0% 0 0.0% 0 0.0% 11 24.4% 0 0.0% 0 0.0%Small land mammals 175 61 10 16.4% 4 6.6% 0 0.0% 5 8.2% 11 18.0% 1 1.6%Marine mammals 172 11 0 0.0% 0 0.0% 0 0.0% 3 27.3% 1 9.1% 0 0.0%Birds and bird eggs 162 22 0 0.0% 0 0.0% 1 4.5% 3 13.6% 1 4.5% 0 0.0%Marine invertebrates 180 31 4 12.9% 1 3.2% 1 3.2% 0 0.0% 0 0.0% 1 3.2%Vegetation 180 41 3 7.3% 2 4.9% 1 2.4% 9 22.0% 0 0.0% 1 2.4%Seaweed 178 7 0 0.0% 0 0.0% 0 0.0% 2 28.6% 0 0.0% 0 0.0%
Lack of effort
UnsuccessfulWeather/
environment Other reasonsWorking/no time
Lack of equipment
-continued-
-continued-
Households reporting
reasons for less use
Valid responsesa
Less sharing
RegulationsSmall/
diseased animals
Family/personal
Resources less available Too far to travel
Resource category
Resource categoryValid
responsesa
Households reporting
reasons for less use
253
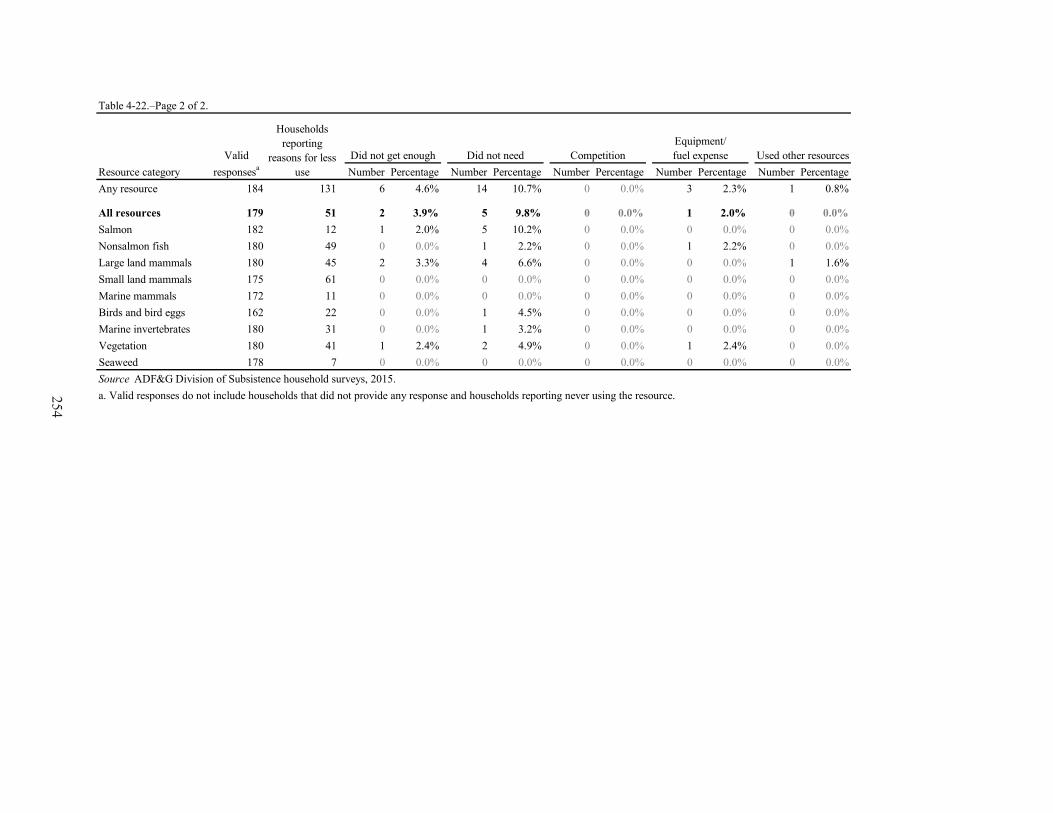
Table 4-22.–Page 2 of 2.
Number Percentage Number Percentage Number Percentage Number Percentage Number PercentageAny resource 184 131 6 4.6% 14 10.7% 0 0.0% 3 2.3% 1 0.8%
All resources 179 51 2 3.9% 5 9.8% 0 0.0% 1 2.0% 0 0.0%Salmon 182 12 1 2.0% 5 10.2% 0 0.0% 0 0.0% 0 0.0%Nonsalmon fish 180 49 0 0.0% 1 2.2% 0 0.0% 1 2.2% 0 0.0%Large land mammals 180 45 2 3.3% 4 6.6% 0 0.0% 0 0.0% 1 1.6%Small land mammals 175 61 0 0.0% 0 0.0% 0 0.0% 0 0.0% 0 0.0%Marine mammals 172 11 0 0.0% 0 0.0% 0 0.0% 0 0.0% 0 0.0%Birds and bird eggs 162 22 0 0.0% 1 4.5% 0 0.0% 0 0.0% 0 0.0%Marine invertebrates 180 31 0 0.0% 1 3.2% 0 0.0% 0 0.0% 0 0.0%Vegetation 180 41 1 2.4% 2 4.9% 0 0.0% 1 2.4% 0 0.0%Seaweed 178 7 0 0.0% 0 0.0% 0 0.0% 0 0.0% 0 0.0%
Resource categoryValid
responsesa
Households reporting
reasons for less use
Competition Used other resources
Source ADF&G Division of Subsistence household surveys, 2015.a. Valid responses do not include households that did not provide any response and households reporting never using the resource.
Did not needEquipment/fuel expenseDid not get enough
254

Table 4-23.–Reasons for more household uses of resources compared to recent years, Cordova, 2014.
Number Percentage Number Percentage Number Percentage Number Percentage Number Percentage Number Percentage Number PercentageAny resource 184 94 30 31.9% 1 1.1% 6 6.4% 35 37.2% 10 10.6% 37 39.4% 7 7.4%
All resources 179 31 8 25.8% 1 3.2% 0 0.0% 8 25.8% 3 9.7% 12 38.7% 3 9.7%Salmon 182 6 1 16.7% 0 0.0% 0 0.0% 0 0.0% 1 16.7% 5 83.3% 0 0.0%Nonsalmon fish 180 28 4 14.3% 0 0.0% 0 0.0% 7 25.0% 3 10.7% 10 35.7% 2 7.1%Large land mammals 180 29 3 10.3% 0 0.0% 1 3.4% 6 20.7% 4 13.8% 8 27.6% 2 6.9%Small land mammals 175 37 4 10.8% 0 0.0% 2 5.4% 15 40.5% 0 0.0% 6 16.2% 3 8.1%Marine mammals 172 2 0 0.0% 0 0.0% 0 0.0% 2 100.0% 0 0.0% 0 0.0% 0 0.0%Birds and bird eggs 162 11 1 9.1% 0 0.0% 0 0.0% 3 27.3% 0 0.0% 4 36.4% 0 0.0%Marine invertebrates 180 18 2 11.1% 0 0.0% 0 0.0% 7 38.9% 0 0.0% 7 38.9% 0 0.0%Vegetation 180 36 20 55.6% 0 0.0% 4 11.1% 1 2.8% 2 5.6% 10 27.8% 0 0.0%Seaweed 178 3 0 0.0% 0 0.0% 0 0.0% 0 0.0% 0 0.0% 3 100.0% 0 0.0%
Number Percentage Number Percentage Number Percentage Number Percentage Number Percentage Number Percentage Number PercentageAny resource 184 94 6 6.4% 9 9.6% 1 1.1% 22 23.4% 2 2.1% 0 0.0% 3 3.2%
All resources 179 31 1 3.2% 1 3.2% 1 3.2% 5 16.1% 0 0.0% 0 0.0% 1 3.2%Salmon 182 6 0 0.0% 1 16.7% 0 0.0% 0 0.0% 0 0.0% 0 0.0% 0 0.0%Nonsalmon fish 180 28 2 7.1% 0 0.0% 0 0.0% 3 10.7% 1 3.6% 0 0.0% 0 0.0%Large land mammals 180 29 0 0.0% 0 0.0% 0 0.0% 8 27.6% 0 0.0% 0 0.0% 2 6.9%Small land mammals 175 37 0 0.0% 7 18.9% 0 0.0% 5 13.5% 1 2.7% 0 0.0% 0 0.0%Marine mammals 172 2 0 0.0% 0 0.0% 0 0.0% 0 0.0% 0 0.0% 0 0.0% 0 0.0%Birds and bird eggs 162 11 2 18.2% 1 9.1% 0 0.0% 1 9.1% 0 0.0% 0 0.0% 0 0.0%Marine invertebrates 180 18 1 5.6% 1 5.6% 0 0.0% 2 11.1% 0 0.0% 0 0.0% 0 0.0%Vegetation 180 36 2 5.6% 1 2.8% 0 0.0% 1 2.8% 0 0.0% 0 0.0% 1 2.8%Seaweed 178 3 0 0.0% 0 0.0% 0 0.0% 0 0.0% 0 0.0% 0 0.0% 0 0.0%
-continued-
a. Valid responses do not include households that did not provide any response and households reporting never use.
Store-bought expense
Got/fixed equipment
Resource categoryValid
responsesa
Households reporting
reasons for more use
Regulations
Received moreResource category
Valid responsesa
Traveled farther More success Needed less
Source ADF&G Division of Subsistence household surveys, 2015.
Other
Needed more Increased effortUsed other resources Favorable weather
Table 4-23.–Continued.
Households reporting
reasons for more use
Increased availability Had more help
255

Table 4-24.–Reported impact to households reporting that they did not get enough of a type of resource, Cordova, 2014.
Number Percentage Number Percentage Number Percentage Number Percentage Number Percentage Number Percentage Number PercentageAll resources 184 176 95.7% 55 31.3% 10 18.2% 8 14.5% 25 45.5% 12 21.8% 0 0.0%Salmon 184 167 90.8% 44 26.3% 5 11.4% 7 15.9% 24 54.5% 6 13.6% 2 4.5%Nonsalmon fish 184 148 80.4% 63 42.6% 24 38.1% 6 9.5% 24 38.1% 9 14.3% 0 0.0%Large land mammals 184 160 87.0% 66 41.3% 8 12.1% 9 13.6% 37 56.1% 11 16.7% 1 1.5%Small land mammals 184 37 20.1% 12 32.4% 4 33.3% 3 25.0% 4 33.3% 1 8.3% 0 0.0%Marine mammals 184 19 10.3% 4 21.1% 1 25.0% 1 25.0% 1 25.0% 1 25.0% 0 0.0%Birds and bird eggs 184 54 29.3% 15 27.8% 2 13.3% 4 26.7% 8 53.3% 1 6.7% 0 0.0%Marine invertebrates 184 94 51.1% 57 60.6% 10 17.5% 16 28.1% 25 43.9% 5 8.8% 1 1.8%Vegetation 184 162 88.0% 49 30.2% 7 14.3% 11 22.4% 26 53.1% 5 10.2% 0 0.0%Seaweed 184 16 8.7% 3 18.8% 0 0.0% 0 0.0% 3 100.0% 0 0.0% 0 0.0%
a. Valid households do not include households failing to respond to the question and those households that never used the resource.Source ADF&G Division of Subsistence household surveys, 2015.
Resource categorySample
households
Households not getting enough _______ . Impact to those not getting enough ______ .Valid responsesa Did not get enough No response Not noticeable Minor Major Severe
256

Table 4-25.–Resources that households reported needing, Cordova, 2014.
All resources 3 1.6%Fish 13 7.1%Salmon 12 6.5%Coho salmon 8 4.3%Chinook salmon 28 15.2%Sockeye salmon 36 19.6%Nonsalmon fish 4 2.2%Smelt 1 0.5%Eulachon (hooligan, candlefish) 3 1.6%
Cod 2 1.1%Pacific (gray) cod 1 0.5%Pacific halibut 50 27.2%Rockfish 7 3.8%Black rockfish 1 0.5%Yelloweye rockfish 3 1.6%Sablefish (black cod) 3 1.6%Dolly Varden 1 0.5%Trout 2 1.1%Cutthroat trout 1 0.5%Land mammals 2 1.1%Large land mammals 4 2.2%Black bear 4 2.2%Caribou 1 0.5%Deer 51 27.7%Mountain goat 3 1.6%Moose 48 26.1%Beaver 1 0.5%Coyote 1 0.5%Snowshoe hare 8 4.3%Marten 1 0.5%Mink 1 0.5%Porcupine 2 1.1%Gray wolf 1 0.5%Seal 3 1.6%Birds and eggs 1 0.5%Migratory birds 1 0.5%Ducks 4 2.2%Mallard 4 2.2%Teal 1 0.5%Geese 3 1.6%Crane 1 0.5%Grouse 2 1.1%Spruce grouse 1 0.5%Ptarmigan 2 1.1%Gull eggs 5 2.7%Marine invertebrates 5 2.7%
Households needing
Percentage of households Resource
-continued-
257

Clams 16 8.7%Butter clams 5 2.7%Pacific littleneck clams (steamers) 1 0.5%
Razor clams 10 5.4%Crabs 19 10.3%Dungeness crab 13 7.1%King crab 6 3.3%Tanner crab 13 7.1%Mussels 1 0.5%Octopus 3 1.6%Oyster 3 1.6%Scallops 1 0.5%Shrimp 22 12.0%Berries 26 14.1%Blueberry 20 10.9%Lowbush cranberry 5 2.7%Highbush cranberry 1 0.5%Nagoonberry 14 7.6%Raspberry 1 0.5%Salmonberry 13 7.1%Strawberry 8 4.3%Plants, greens, and mushrooms 1 0.5%
Other wild greens 1 0.5%Unknown mushrooms 2 1.1%Seaweed/kelp 1 0.5%Unknown seaweed 1 0.5%Wood 8 4.3%Source ADF&G Division of Subsistence household surveys, 2015.
ResourceHouseholds
needingPercentage of households
Table 4-25.–Page 2 of 2.
258

than their limit in an effort to relieve pressures on the populations, noting that local deer were still recovering from record snowfall in 2012.Of the households responding to the question about use of large land mammals, 22% of households reported using more large land mammals than in the previous 5 years (Table 4-21). Approximately one-third of households that used more attributed this to an increased harvest effort on the part of the household and one-third said that they had an increase in successful harvest attempts (Table 4-23).Out of all sampled households, 36% stated that they did not get enough large land mammals (Figure 4-28). When asked to evaluate the impact of not getting enough large land mammals, 14% of responding households described it as not noticeable, 56% described the impact as minor, 17% explained that not getting enough large land mammals had a major effect on their household, and 2% stated that the impact was severe (Table 4-24). People were most particularly concerned with getting deer meat, followed by moose (Table 4-25).Nonsalmon fish was the third most harvested resource category by pounds usable weight, making up 15% of total resources harvested (Figure 4-10). Households responding to the less, same, or more use questions most frequently stated that they used the same amount of nonsalmon fish as in previous years (38%). However, a large portion (27%) noticed that they had been using less nonsalmon fish in their household (Figure 4-27). The 2 major reasons for people using less nonsalmon fish were that they were not putting as much effort into harvesting and that they were too busy with work or other activities (Table 4-22). Only 17% of responding households said that their household used more nonsalmon fish. This was attributed to increased effort by almost 36% of respondents and due to receiving more nonsalmon fish from other people (cited by 25% of respondents) (Table 4-23). Approximately one-third of sampled Cordova households reported not getting enough nonsalmon fish; this was the second most cited resource category (behind large land mammals) that sampled households felt use was lacking in 2014 (Figure 4-28). Of those households that used nonsalmon fish in 2014 and provided a valid response about not getting enough nonsalmon fish, households most frequently (38%) said that it had a minor impact on their lives (Table 4-24). Additionally, 14% of those households felt that not getting enough nonsalmon fish had a major impact on their household. This was usually explained by the fact that store-bought food was not a viable alternative to wild-caught nonsalmon fish. Lastly, 10% felt that not getting enough nonsalmon fish was not particularly noticeable. When households were asked which species of nonsalmon fish they need most, Pacific halibut was cited most frequently (Table 4-25).The fourth most harvested resource category by pounds harvested was vegetation (Figure 4-10). Of the households responding to the question about use of vegetation, 44% of households reported using the same amount of vegetation as in previous years; 25% of households use less vegetation; and 22% of households used more (Table 4-21). Of the households that reported reasons for using more vegetation, more said it was because of increased availability (56%) and due to increased effort (28%) (Table 4-23). Many people mentioned that berries were prolific in the summer and fall of 2014, which made up the majority of the vegetation harvest (Figure 4-25). Those households that reported using less vegetation and gave a reason for less use said it was mostly due to a lack of harvest effort (29%) and too little time to get out and harvest because of work (22%) or personal reasons (22%) (Table 4-22). Out of the sampled households, 27% reported not getting enough vegetation (Figure 4-28). The majority of households (53%) that did not get enough vegetation referred to the impact as minor (Table 4-24). Fewer households (22%) that did not get enough vegetation felt that not getting enough was not noticeable, and 10% of households said that it had a major impact to their households. Berries in general were the most frequently cited vegetation resources of which people needed more (Table 4-25).Marine invertebrates made up roughly 2% of the total harvest for Cordova (Figure 4-10). Of the households that responded to the question about using marine invertebrates, more households (23%) reported using the same amount as in recent previous years (Table 4-21; Figure 4-27). Closely following assessments of the same amount of use were households that reported using less marine invertebrates (19%). Of the households that cited a reason for less use of marine invertebrates, 32% said that this was due to the resources being less available (Table 4-22). Another large percentage (26%) said it was due to people sharing less. Out of all sampled households, more stated that they did not get enough in 2014 (31%) than
259
had enough (20%) (Figure 4-28). Of the households that provided a valid response and did not get enough marine invertebrates, more (44%) felt that it had a minor impact on the household than any other type of assessment (Table 4-24). Fewer households, (28%) felt that not having enough marine invertebrates was not noticeable; 9% felt that it had a major impact on their household; and 2% of households felt that not getting enough marine invertebrates had a severe impact on their lives in 2014. Shrimp, followed by crabs and clams, were the marine invertebrates that households who did not get enough most needed (Table 4-25).Birds and eggs made up a relatively small amount of harvested resources by pounds usable weight (Figure 4-10). Of the households that responded to the question about using birds and eggs, 14% reported using less in 2014 (Figure 4-27). The main reasons that were given for less use were a lack of effort (32%) and lack of sharing (32%) (Table 4-22). Conversely, out of the 7% of responding households that reported using more in 2014, they reported an increase in effort (36%) and sharing (27%) as the top reasons for more use of birds and eggs (Table 4-23).Small land mammals made up the smallest amount of the total wild resource harvest (Figure 4-10). About 80% of the households that responded to the question indicated these resources are not used in 2014 (Table 4-21). However, 7% of households that gave a valid response used less small land mammals. The most commonly cited reasons for less use of these resources were that these species were less available, less resources were shared, and due to regulations (Table 4-22). Although none of the surveys collected show a marine mammal harvest, there were households that used marine mammals. Most households that usually use marine mammals and provided a valid response reported using less (7%) in 2014 than using the same amount (4%) or more (1%) (Table 4-21). Out of the households that provided a reason for less use, 36% reported that it was because fewer resources were shared with them (Table 4-22). The next 2 reasons were equally reported: being too busy and personal or family reasons (cited by 27% of respondents giving a reason for less use). The majority of the community does not harvest or use marine mammals (90% of sampled households) due in large part to regulations and a lack of interest; but out of the remaining 10% of sampled households that usually use marine mammals and provided an assessment about whether they had enough marine mammals, 2% said that they did not get enough in 2014 (Figure 4-28).Considering all resources combined, nearly one-half (48%) of the households that gave a response about less, same, or more use of wild resources assessed that their use was the same compared to the previous 5 years (Table 4-21). Out of the responding households that also indicated they did not get enough of all resources, 46% indicated the impact of not having enough wild resources was minor (Table 4-24). It is important to note that during the survey, a respondent who indicated a minor effect from lacking a type of resource would often add a qualifying statement to make it clear it was definitely noticeable to the household’s members even when assessing that missing resources had an overall minor impact.The overall assessment of uses of wild resources as compared to the last 5 years is similar for 2014 in comparison to the responses for the same question from the previous study year 2003. For 2003, 43% of responding households in Cordova indicated they used the same amount of wild resources compared to the previous 5 years (Fall 2006:A-17). In 2003, lack of effort to harvest resources (including general lack of interest or knowledge to do so) was the most cited reason for declined use of overall resources (30% of households that provided a reason) (Fall 2006:A-18); lack of effort was the most cited reason for 2014 as well (26%) (Table 4-22).
Harvest DataChanges in the harvest of resources by Cordova residents can also be discerned through comparisons with findings from other study years. Comprehensive subsistence harvest surveys were conducted in Cordova for study years 1985, 1988, 1991, 1992, 1993, 1997, 2003, and 2014. Marine mammal harvests were also recorded for all study years between 1992 and 2008, except for 1999, as well as in 2014 as part of this survey.26
26. Results for both comprehensive and marine mammal subsistence harvest surveys are available in the CSIS. The survey
260
Historically, the per capita harvest has remained fairly consistent throughout the study years, excepting 1993 and 2014 (Figure 4-29; Table 4-26). The most notable declines in per capita harvests since 2003 have occurred for salmon (declined from 77 lb in 2003 to 44 lb in 2014), large land mammals (declined from 55 lb in 2003 to 40 lb in 2014), and nonsalmon fish (declined from 29 lb in 2003 to 18 lb in 2014) (Table 4-26; Figure 4-30). In comparison, the per capita harvest of marine invertebrates has held relatively steady in both study years. In spite of the declines of per capita harvests of salmon, large land mammals, and nonsalmon fish, in terms of estimated total harvest, resources from these categories continue to make up the largest portion of the total wild resource harvest in Cordova (Table 4-27).As mentioned previously, the most notable per capita harvest declines relate to fish (Figure 4-30; Table 4-27). Many people discussed a decline in Chinook salmon harvests and a reduction in the size of those that are being harvested as a cause of reduced harvest. Compared to previous study years, the harvest of salmon contributed less of the total harvest of wild resources in 2014 (38% of total usable pounds harvested) than in 2003 (44% of total usable pounds harvested), but close to the historical average for study years spanning 1985–2003 of 40% of the total wild resource harvest (Table 4-27). The composition of the salmon harvest also continues to be dominated by the same 3 salmon species as in the past: coho, Chinook, and sockeye salmon (CSIS). The 2003 study year showed an average harvest of 21 lb per capita of Chinook salmon (Fall 2006:55). The Chinook salmon harvest dropped to 8 lb per capita by 2014 (Table 4-13). Respondents in Cordova attributed this to the larger trend of declining Chinook salmon runs across the state as well as upriver fishing practices and management, particularly the Chitina personal use fishery. The coho salmon per capita harvest also declined; it changed from 31 lb in 2003 to 16 lb in 2014. Cordova survey respondents said that it has become increasingly difficult to compete with non-local sport fishers who heavily target coho salmon. Coho salmon is particularly important to the community in that it is one of the only species of salmon available from road-accessible streams such as Alaganik Slough and Ibeck Creek (inriver fishing on the Copper River is not permitted below Miles Lake). Most coho salmon were harvested with rod and reel under sport fishing regulations; however, coho salmon are an important wild resource for households that do not have boat access to the subsistence fishery in the Copper River Delta. Although it was not the most harvested salmon species in the 2014 study, the large amount of rod and reel harvests of coho salmon show the amount of effort households exerted to meet their subsistence salmon needs. Other salmon species had minimal per capita harvest declines.Despite residents’ observations that Chinook and coho salmon runs are declining, when looking at the historical trend for study years spanning 1985–2003, salmon as a resource category has steadily contributed to the total harvest weight, composing 38% of the total wild resource harvest in 2014, which, as previously stated, is near the historical average of 40% (Table 4-27). Whereas the salmon harvest for all species combined is proportionally steady compared to the overall harvest, the composition of the salmon harvest has changed. This is seen in the rise of sockeye salmon harvests, which people are becoming more dependent on to meet their harvesting needs. For instance, 2014 was the first year in which sockeye salmon was the top harvested salmon species as measured in pounds usable weight, replacing coho or Chinook salmon as the top harvested salmon species in previous study years (CSIS). Cordova residents also continue to retain salmon from their commercial catches for home use (referred to as “home pack”), which is predominantly sockeye salmon (64% as estimated in usable pounds in 2014; Table 4-15). In 2014, an estimated 43% of the total salmon harvest weight came from commercial catches, and 63% of the harvest weight of the most harvested species (sockeye salmon) came from commercial catches (Table 4-15). Retaining home pack salmon occurs at the expense of the households’ direct cash income. Respondents spoke frequently about limited opportunities for harvesting salmon for their households under subsistence regulations, noting that commercial and subsistence fishery openings coincided, thus preventing residents who are commercial fishers from participating in subsistence salmon fisheries.The nonsalmon fish resource category has shown a similar per capita pattern to salmon, in which low harvest years (1985, 1993, 2003, and 2014) are interspersed with more abundant years (Table 4-26). However, the months for each study year are noted in the CSIS project year “Methods” section. Additionally, comprehensive subsistence sur-vey results for selected study years are reported in Stratton (1989, 1992), Fall and Utermohle (1995b, 1999), and Fall (2006); the marine mammal subsistence harvest results for 1994 are not available in the CSIS but are published in Wolfe and Mishler (1995).
261

Figure 4-29.–Estimated per capita harvests in pounds usable weight, Cordova, 1985, 1988, 1991, 1992, 1993, 1997, 2003, and 2014.
0
50
100
150
200
250
1985 1988 1991 1992 1993 1997 2003 2014
Poun
ds u
sabl
e w
eigh
t per
cap
ita
Study year
262

Table 4-26.–Estimated per capita harvests in pounds usable weight by resource category, Cordova, 1985, 1988, 1991, 1992, 1993, 1997, 2003, and 2014.
Resource category 1985 1988 1991 1992 1993 1997 2003 2014Salmon 62.3 59.3 86.2 71.3 58.3 62.6 77.3 43.8Nonsalmon fish 36.8 91.4 40.1 40.8 29.9 42.6 29.0 17.8Land mammals 44.0 50.2 50.0 42.4 24.9 54.5 54.7 40.4Marine mammals 1.0 0.8 0.4 0.0 0.8 3.6 3.9 0.0Birds and eggs 1.7 4.7 1.8 1.3 1.1 2.2 2.6 1.5Marine invertebrates 12.5 21.8 5.5 4.6 5.4 5.5 2.8 2.3Vegetation 5.5 5.6 5.2 3.1 7.5 8.4 6.2 10.5All resources 163.8 233.8 189.2 163.5 127.8 179.4 176.4 116.2Sources Community Subsistence Information System (CSIS) for 1985–2003 data; ADF&G Division of Subsistence household surveys, 2015, for 2014 data.
past 2 decades have culminated in an overall decline in the per capita nonsalmon fish harvest. This decline is corroborated by community observations. Pacific herring was a large portion of the reduction in nonsalmon fish harvests, going from 4 lb per capita in 2003 to less than 1 lb per capita in 2014 (Fall 2006:55) (Table 4-13). Rockfish harvests were also reduced from previous studies; in 2003, an estimated 3 lb of rockfish were harvested per capita compared to 1 lb in 2014. However, many people attribute the decline in nonsalmon fish harvests to a continued scarcity and smaller size of Pacific halibut; this was attributed by some respondents to the opening of the subsistence fishery in 2003. However, when looking at the Pacific halibut pounds per capita harvested in 2003 (14.5 lb) and in 2014 (14.5 lb), the per capita harvest weights are nearly identical. The total estimated harvest weight of Pacific halibut has also remained very similar (approximately 35,000 lb in 2003 compared to 37,671 lb in 2014) (Fall 2006:55) (Table 4-13). Yet, in spite of the nonsalmon fish harvest composition showing a similar variety of species harvested for 2003 and 2014, the proportion of the nonsalmon fish harvest composed of Pacific halibut has increased substantially since 2003. In 2003, approximately one-half of the nonsalmon fish harvest was Pacific halibut compared to an estimated 82% of the total nonsalmon fish harvest in 2014, which is an increase of 63% (CSIS; Figure 4-15). This shift illustrates that Cordova residents’ dependency on Pacific halibut has increased while reliance on other stocks (Pacific herring and rockfish) has declined, and also that Pacific halibut has become more accessible to the community through the subsistence fishery. Although the per capita weight has not changed since 2003, similarly to the views about salmon fishing, people feel that the effort and time needed to meet their household’s needs when harvesting Pacific halibut has increased, while the importance of Pacific halibut to a household has also increased. While marine fish species typically compose the bulk of the nonsalmon fish harvest, a noticeable decline in freshwater fish harvests occurred overall between 1985 and 2014; the harvests of trout and char species were an estimated 4 lb per capita in 1985 and less than 1 lb per capita in 2014 (CSIS; Table 4-13).When looking at all past study years, the 2014 large land mammal per capita harvest of 40 lb is close to the historical average of 44 lb (Table 4-26). However, when focusing on just the 2003 and 2014 study years, both the estimated total and per capita harvests of large land mammals have declined from approximately 127,718 lb (53 lb per capita) in 2003 to 104,165 lb (40 lb per capita) in 2014 (Fall 2006:56) (Table 4-13). This decline is exhibited most extremely in the per capita harvest of deer, which dropped from 24 lb in 2003 to 8 lb in 2014. The 2014 deer harvest is far from the historical average of 20 lb per capita, with only 1993 (10 lb per capita) coming anywhere close to the 2014 per capita harvest. Many people attribute this decline in 2014 deer harvests to the “snowpocalypse” of 2012, which greatly damaged deer numbers on surrounding islands. Although residents noted that the deer were recovering, the population was still hurting and significantly lower than normal. Despite the low deer harvest in 2014, moose and deer have historically and continue to make up the significant majority of the large land mammal harvest (CSIS). At its minimum
263

Figure 4-30.–Estimated per capita harvests in pounds usable weight by resource category, Cordova, 1985, 1988, 1991, 1992, 1993, 1997, 2003, and 2014.
0
10
20
30
40
50
60
70
80
90
100
Salmon Nonsalmon fish Land mammals Marine mammals Birds and eggs Marine invertebrates Vegetation
Poun
ds u
sabl
e w
eigh
t per
cap
ita
Resource category
1985 1988 1991 1992 1993 1997 2003 2014
264

Table 4-27.–Comparison of harvest composition by resource category, Cordova, 1985, 1988, 1991, 1992, 1993, 1997, 2003, and 2014.
Resource category 1985 1988 1991 1992 1993 1997 2003 2014Salmon 38.0% 25.4% 45.6% 43.6% 45.6% 34.9% 43.8% 37.7%Nonsalmon fish 22.5% 39.1% 21.2% 25.0% 23.4% 23.7% 16.4% 15.3%Land mammals 26.8% 21.5% 26.4% 25.9% 19.5% 30.4% 31.0% 34.8%Marine mammals 0.6% 0.3% 0.2% 0.0% 0.6% 2.0% 2.2% 0.0%Birds and eggs 1.1% 2.0% 1.0% 0.8% 0.8% 1.2% 1.5% 1.3%Marine invertebrates 7.7% 9.3% 2.9% 2.8% 4.3% 3.1% 1.6% 2.0%Vegetation 3.3% 2.4% 2.7% 1.9% 5.8% 4.7% 3.5% 9.0%Sources Community Subsistence Information System (CSIS) for 1985–2003 data; ADF&G Division of Subsistence household surveys, 2015, for 2014 data.
in 1997, deer and moose per capita harvests composed approximately 88% of the total large land mammal harvest (CSIS).Both the total estimated harvest in pounds usable weight and the per capita harvest have declined noticeably for small land mammals. In 2003, the estimated per capita harvest was approximately 2 lb, but in 2014 the harvest was less than 0.5 lb per capita (Fall 2006:57) (Table 4-13). This is a decline from the historical average of 1.4 lb per capita. Although there has been a large harvest decline, especially in the harvest of snowshoe hares, the primary species harvested (snowshoe hare and beaver) have stayed the same over the past 3 decades of studies (CSIS). Multiple respondents noted that there did not seem to be many snowshoe hares locally, and referred to the cyclical nature of hare populations.27 Community members stated that although there were few hares in 2014, their population seemed to be on the rise and it was predicted that the following years would be good for hare harvesting. In reference to the declined harvest participation of small land mammals, one survey respondent commented that their interest in trapping has declined as they aged. Another previously more active trapper mentioned that with older age trapping has become more challenging due to having to navigate slippery surfaces during winter months. For marine mammals, there were no recorded harvests of marine mammals in 2014, which is a decline from the average 1.5 lb per capita historical harvest for study years spanning 1985–2003 (Table 4-26). The results of the 2014 study year differ from the previous study findings from 2003 when approximately 9% of Cordova households both attempted to harvest and successfully harvested marine mammals (Fall 2006:57). The percentage of community households using marine mammals was also much larger (15% of households) in 2003 than in 2014 (4% of households) (Fall 2006:57) (Table 4-13). The majority of the marine mammal harvest in pounds usable weight in 2003 was harbor seal; additionally, a small amount of Steller sea lion was harvested. In both 2003 and 2014, sea otter was the most frequently harvested animal: 284 individual animals in 2003 and 215 animals in 2014 (Fall 2006:57) (Forrest Hannan, Natural Resource Specialist, Marine Mammals Management, U.S. Fish & Wildlife Service, Anchorage, personal communication, November 10, 2015). However, because sea otters are harvested for fur only, harvests are not included in the estimated harvest in pounds usable weight. In comparing marine mammal hunting, harvesting, and use for 2003 and 2014 at the households level, it is important to consider the different sampling methods for the compared study years. For 2003, a sample of households from the Eyak Tribe was developed in coordination with a household list for the overall Cordova community; households that were not from the Eyak Tribe were designated as randomly selected “other” households. The sample achievement in 2003 included 56 Eyak Tribe households and 92 randomly selected “other” households for a total of 148 households surveyed in Cordova (Fall 2006:5). In comparison, for study year 2014 the sample was 184 randomly-selected Cordova households overall.
27. Tim Mowry, “Snowshoe Hares Peak in Interior Alaska,” 2007. Alaska Department of Fish and Game, Alaska Fish and Wildlife News. http://www.adfg.alaska.gov/index.cfm?adfg=wildlifenews.view_article&articles_id=339 (accessed December 2, 2015).
265
When combined, the birds and bird eggs harvest for 2014 was on par with the historical average for all previous studies combined of 2.2 lb per capita (CSIS). However, the birds and eggs estimated per capita harvest has declined since 2003 (Table 4-26; Figure 4-30). In 2003, the per capita harvest was approximately 2.6 lb while in 2014 the number had declined to approximately 1.5 lb (Table 4-26). Comparing the migratory species harvested during the 2 study years shows that mallards, wigeons, and northern pintails were harvested in larger amounts than other migratory species, with Canada geese also being highly harvested in 2003 and sandhill cranes in 2014 (Figure 4-21; CSIS). A noteworthy difference is the increased harvest of sandhill cranes in 2014 totaling 62 birds compared to 33 birds in 2003 (Table 4-19; CSIS). When asked about the increase in the sandhill crane harvest, a key respondent commented that the sandhill cranes are a species that local residents hunt opportunistically when they find a flock while out hunting, for example, for large land mammals. One community member stated that sandhill cranes are delicious and had a lot of meat, making them highly valued. Regarding gull egg harvests, the same key respondent suggested that with the legal spring subsistence harvest approved starting in spring 201428, there could be an increase in the harvest of gull eggs by community residents in the coming years.Compared to previous survey results from 2003, the 2014 harvest of marine invertebrates (6,008 lb) was less than the 2003 harvest (6,833 lb) (Table 4-13) (Fall 2006:59). However, at the per capita level, the total marine invertebrates harvests in 2014 and 2003 were very similar (approximately 3 lb per capita in 2003 and 2 lb in 2014) (Table 4-26). While the 2003 and 2014 per capita harvests of marine invertebrates are very similar, the per capita harvest of marine invertebrates by Cordova households has never reached the much higher pre-oil spill harvest levels, and both years are considerably lower than the historical average (1985–2003) per capita harvest of 8 lb (Table 4-26). While this could be for many reasons, it is important to note that all noncommercial crab fisheries in Prince William Sound were closed by regulation from 1999 to 2008 due to documented declines in abundance (Rumble et al. 2014). Furthermore, the commercial Tanner crab fishery has been closed since 1989. In comparison, the commercial king crab fishery in Prince William Sound has been closed since 1996. The Alaska Board of Fisheries (BOF) opened a subsistence Tanner crab fishery in Prince William Sound in March 2008 after findings of improved abundance of legal-sized male Tanner crab in the management area by ADF&G. Fishery harvests are monitored through a permit system, and since its opening in the 2008–2009 season, participation and harvest in the small fishery have been growing with an average of 27 crabs harvested per permit during the 2012–2013 season. Simultaneous to the opening of the subsistence Tanner crab fishery, the BOF also opened a subsistence fishery for king crab in Prince William Sound. This fishery is administered in conjunction with the subsistence Tanner crab fishery. However, the popularity of the subsistence king crab fishery has remained low and there was no reported effort, or harvesting during the 2012–2013 season (Rumble et al. 2014). While the per capita harvest of resources in all other resource categories has declined or, as is the case with birds and eggs, remained low but stable, the per capita harvest of vegetation grew by several pounds. Vegetation harvests increased from approximately 6 lb per capita in 2003 to 11 lb per capita in 2014 (Table 4-26).
Natural Resource Conditions
Food SafetyRespondents were asked to assess the safety of consuming Pacific herring, harbor seals, chitons, and clams harvested around Cordova. If people believed that one of these resources was unsafe to consume, they were asked why they thought the resource was unsafe. Many people in Cordova noted that the area directly surrounding the community was largely protected from direct exposure to oil after the spill, which many other communities in Prince William Sound faced. People were more concerned about outer islands and beaches where they used to go to harvest various resources.
28. United States Department of the Interior, Fish and Wildlife Service, Final rule, “Migratory Bird Subsistence Harvest in Alaska; Harvest Regulations for Migratory Birds in Alaska During the 2014 Season,” Federal Register 79, no. 67 (April 8, 2014): 19454–19460. http://www.fws.gov/alaska/ambcc/Regs/2014-07824.pdf (accessed December 6, 2015).
266

The 1997 community study shows that people thought that Pacific herring were generally safe to eat (80% of responding households said that Pacific herring were safe) (Fall and Utermohle 1999:V-56). This declined sharply to 42% of responding households that believed Pacific herring were safe to eat in 2003, and then a slight uptick in food safety confidence in 2014 to 57% of responding households (Fall 2006:A-156) (Table 4-28). In all 3 years, people stated most that EVOS contamination or the condition of Pacific herring was the main reason they felt these fish were unsafe to eat (namely sickly looking fish). In 1997, 19% of households that said Pacific herring were not safe to eat and also provided reasons why they thought so reported EVOS contamination as a reason for Pacific herring being unsafe (Fall and Utermohle 1999:V-57). This increased to 31% in 2003 and dipped to 19% in 2014 (Fall 2006:A-161) (Table 4-29). In 2014, more people stated that the lasting effects of the oil spill were affecting Pacific herring stocks. Many mentioned in particular that the fish did not seem to grow well, stating that there would be many juvenile Pacific herring, but that not many reached adulthood. Other people also mentioned lesions on Pacific herring. Many people connected the sickly fish to continued effects of the oil spill. A paper released just a few months after the completion of these surveys backs up community observations that the oil spill is still affecting Pacific herring, specifically juvenile fish (Incardona et al. 2015). A reason for the dramatic shift in perception about EVOS contamination being the reason Pacific herring are not safe to eat from 1998 to 2014 could be due to the previously closed (in 1993) Pacific herring fishery opening in 1997 and in 1998 and very briefly in 1999.29 These openers gave people confidence that the Pacific herring were safe to eat. As one respondent noted for the 1997 survey, “They [Pacific herring] better be safe. They are sold commercially” (Fall and Utermohle 1999:53). The continued fishery closures since 1999 have made people question this belief, showing them that the stock is still being affected by the oil contamination. One thing that has not changed during the past few decades is people’s eagerness to have Pacific herring examined more closely in hope that more research and management could lead to the reopening of a healthy and prosperous fishery.Many people were unsure whether or not harbor seals from around Cordova were safe to eat (43% of responses), but the majority of responding households said that seals were safe to eat (52%) (Table 4-28). This is up from 41% in the previous study (Fall 2006:A-162). However, many people noted that this only applied to seals directly around the Cordova area (excluding the harbor) and did not apply to many of the surrounding islands and beaches that were hit harder by the oil spill. Of those who were still concerned with the safety of harbor seal meat in the 2014 survey (5% of responding households), 20% attributed it to EVOS contamination, 20% attributed it to other ocean contaminants that were not EVOS related, and 20% gave reasons relating to the resource condition such as sores or sickly animals (Table 4-29). This is a drop from the 2003 study in which 35% of households that responded listed EVOS contamination as why harbor seal meat was unsafe (Fall 2006:A-163).Most of the people in Cordova did not know what chitons are since they are not frequently harvested or seen in the area. One person remembers seeing only a few throughout their entire life in Cordova. Because of the community’s unfamiliarity with these resources, the majority of households that responded said they did not know if chitons would be safe to eat (65%); 28% said they would feel safe eating chitons from around Cordova proper; only 7% said that they thought chitons would be unsafe to eat (Table 4-28). This concern about safety was due exclusively to concerns over paralytic shellfish poisoning (PSP), which was a concern that was mentioned in general (Table 4-29). This assessment is similar to the previous study in which 6% of responding households stated that chitons were unsafe to consume; the reasons have shifted, however, with respondents saying that EVOS contamination was responsible in 2003 (Fall 2006:A-158).Clams were of concern for Cordova residents in 2014 for a number of reasons. Although 62% of valid responders indicated that clams from the Cordova area would be safe to eat, many people stated that they would not eat clams from the area because they were worried about the health of the stock. Out of the responding households, 12% thought that clams were not safe to eat in the area (Table 4-28). The leading reason for this assessment was EVOS contamination (41%); however, PSP (18%) and other non-EVOS related contamination (12%) were also cause for concerns (Table 4-29). Although many households responded that the Exxon Valdez oil spill continued to harm clam recovery efforts, they felt that the 1964 29. Prince William Sound Science Center, “Herring Research and Monitoring.” n.d. http://pwssc.org/herring-research-and-moni-toring (accessed November 18, 2015).
267
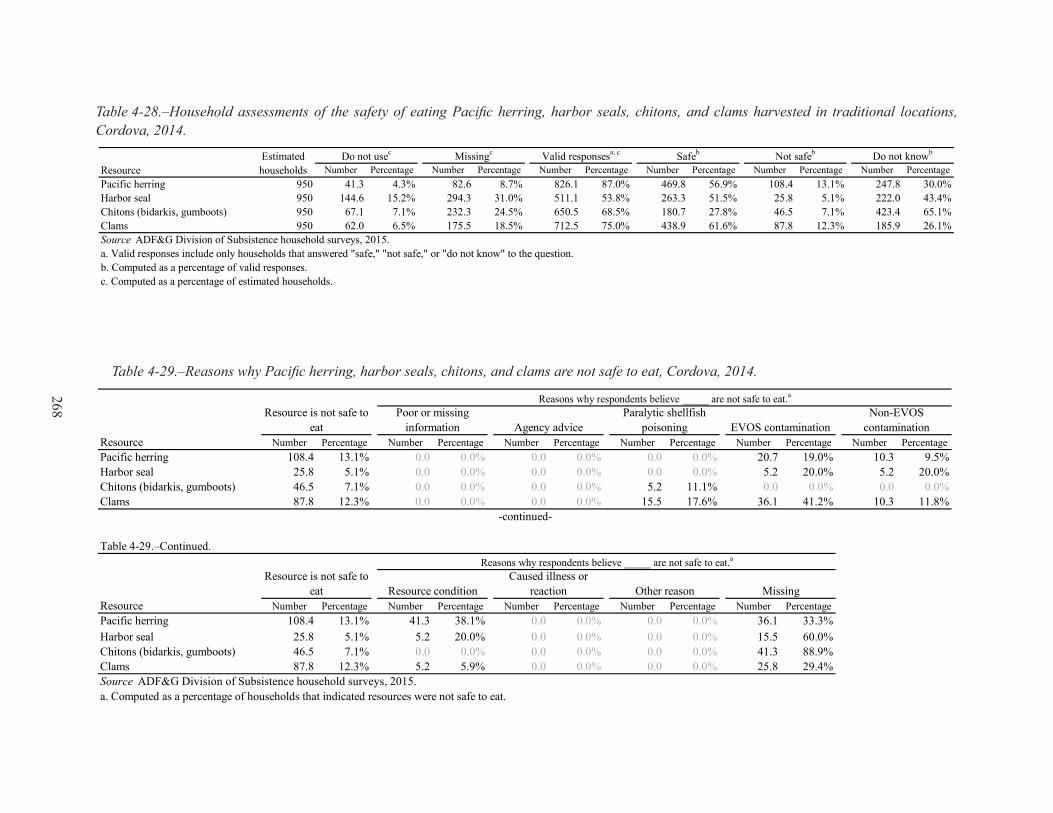
Table 4-28.–Household assessments of the safety of eating Pacific herring, harbor seals, chitons, and clams harvested in traditional locations, Cordova, 2014.
Table 4-29.–Reasons why Pacific herring, harbor seals, chitons, and clams are not safe to eat, Cordova, 2014.
Number Percentage Number Percentage Number Percentage Number Percentage Number Percentage Number PercentagePacific herring 950 41.3 4.3% 82.6 8.7% 826.1 87.0% 469.8 56.9% 108.4 13.1% 247.8 30.0%Harbor seal 950 144.6 15.2% 294.3 31.0% 511.1 53.8% 263.3 51.5% 25.8 5.1% 222.0 43.4%Chitons (bidarkis, gumboots) 950 67.1 7.1% 232.3 24.5% 650.5 68.5% 180.7 27.8% 46.5 7.1% 423.4 65.1%Clams 950 62.0 6.5% 175.5 18.5% 712.5 75.0% 438.9 61.6% 87.8 12.3% 185.9 26.1%
a. Valid responses include only households that answered "safe," "not safe," or "do not know" to the question.b. Computed as a percentage of valid responses.c. Computed as a percentage of estimated households.
Do not knowbNot safebSafebValid responsesa, cMissingcDo not usecEstimated householdsResource
Source ADF&G Division of Subsistence household surveys, 2015.
Number Percentage Number Percentage Number Percentage Number Percentage Number Percentage Number PercentagePacific herring 108.4 13.1% 0.0 0.0% 0.0 0.0% 0.0 0.0% 20.7 19.0% 10.3 9.5%Harbor seal 25.8 5.1% 0.0 0.0% 0.0 0.0% 0.0 0.0% 5.2 20.0% 5.2 20.0%Chitons (bidarkis, gumboots) 46.5 7.1% 0.0 0.0% 0.0 0.0% 5.2 11.1% 0.0 0.0% 0.0 0.0%Clams 87.8 12.3% 0.0 0.0% 0.0 0.0% 15.5 17.6% 36.1 41.2% 10.3 11.8%
Number Percentage Number Percentage Number Percentage Number Percentage Number PercentagePacific herring 108.4 13.1% 41.3 38.1% 0.0 0.0% 0.0 0.0% 36.1 33.3%Harbor seal 25.8 5.1% 5.2 20.0% 0.0 0.0% 0.0 0.0% 15.5 60.0%Chitons (bidarkis, gumboots) 46.5 7.1% 0.0 0.0% 0.0 0.0% 0.0 0.0% 41.3 88.9%Clams 87.8 12.3% 5.2 5.9% 0.0 0.0% 0.0 0.0% 25.8 29.4%Source ADF&G Division of Subsistence household surveys, 2015.a. Computed as a percentage of households that indicated resources were not safe to eat.
Table 4-29.–Continued.Reasons why respondents believe _____ are not safe to eat.a
-continued-
Resource
Resource is not safe to eat Resource condition
Caused illness or reaction Other reason Missing
EVOS contaminationNon-EVOS
contaminationResource
Resource is not safe to eat
Poor or missing information Agency advice
Paralytic shellfish poisoning
Reasons why respondents believe _____ are not safe to eat.a268
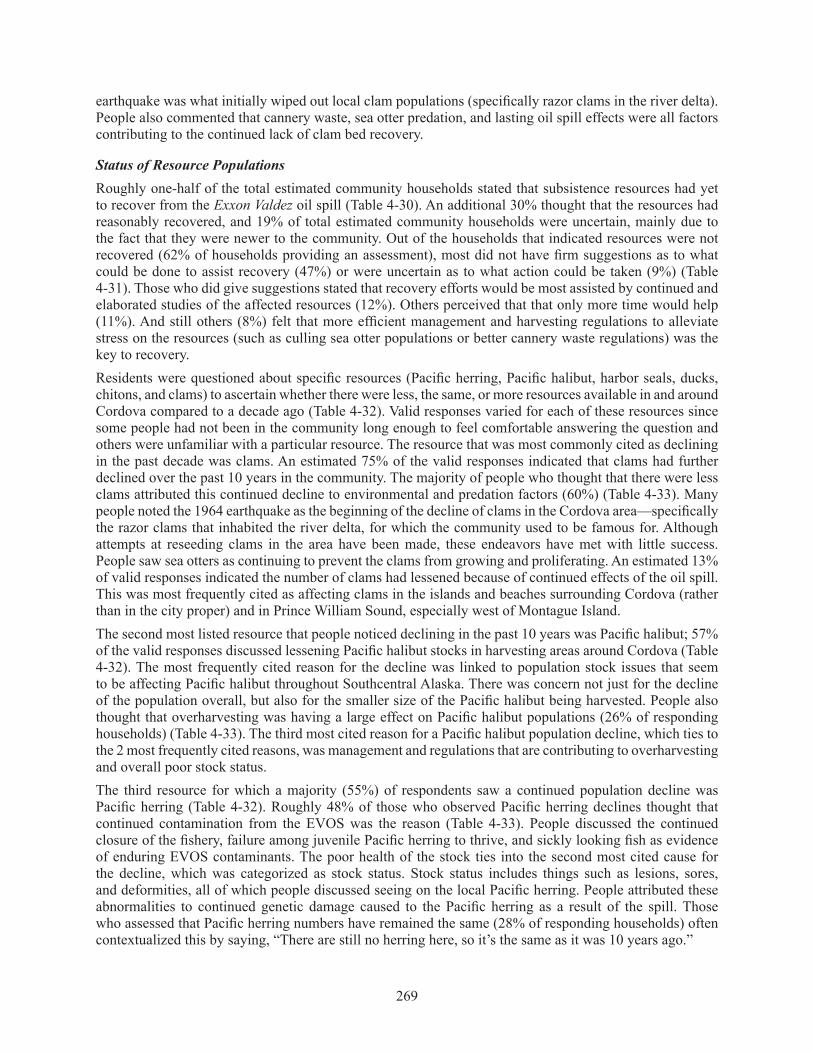
earthquake was what initially wiped out local clam populations (specifically razor clams in the river delta). People also commented that cannery waste, sea otter predation, and lasting oil spill effects were all factors contributing to the continued lack of clam bed recovery.
Status of Resource PopulationsRoughly one-half of the total estimated community households stated that subsistence resources had yet to recover from the Exxon Valdez oil spill (Table 4-30). An additional 30% thought that the resources had reasonably recovered, and 19% of total estimated community households were uncertain, mainly due to the fact that they were newer to the community. Out of the households that indicated resources were not recovered (62% of households providing an assessment), most did not have firm suggestions as to what could be done to assist recovery (47%) or were uncertain as to what action could be taken (9%) (Table 4-31). Those who did give suggestions stated that recovery efforts would be most assisted by continued and elaborated studies of the affected resources (12%). Others perceived that that only more time would help (11%). And still others (8%) felt that more efficient management and harvesting regulations to alleviate stress on the resources (such as culling sea otter populations or better cannery waste regulations) was the key to recovery.Residents were questioned about specific resources (Pacific herring, Pacific halibut, harbor seals, ducks, chitons, and clams) to ascertain whether there were less, the same, or more resources available in and around Cordova compared to a decade ago (Table 4-32). Valid responses varied for each of these resources since some people had not been in the community long enough to feel comfortable answering the question and others were unfamiliar with a particular resource. The resource that was most commonly cited as declining in the past decade was clams. An estimated 75% of the valid responses indicated that clams had further declined over the past 10 years in the community. The majority of people who thought that there were less clams attributed this continued decline to environmental and predation factors (60%) (Table 4-33). Many people noted the 1964 earthquake as the beginning of the decline of clams in the Cordova area—specifically the razor clams that inhabited the river delta, for which the community used to be famous for. Although attempts at reseeding clams in the area have been made, these endeavors have met with little success. People saw sea otters as continuing to prevent the clams from growing and proliferating. An estimated 13% of valid responses indicated the number of clams had lessened because of continued effects of the oil spill. This was most frequently cited as affecting clams in the islands and beaches surrounding Cordova (rather than in the city proper) and in Prince William Sound, especially west of Montague Island. The second most listed resource that people noticed declining in the past 10 years was Pacific halibut; 57% of the valid responses discussed lessening Pacific halibut stocks in harvesting areas around Cordova (Table 4-32). The most frequently cited reason for the decline was linked to population stock issues that seem to be affecting Pacific halibut throughout Southcentral Alaska. There was concern not just for the decline of the population overall, but also for the smaller size of the Pacific halibut being harvested. People also thought that overharvesting was having a large effect on Pacific halibut populations (26% of responding households) (Table 4-33). The third most cited reason for a Pacific halibut population decline, which ties to the 2 most frequently cited reasons, was management and regulations that are contributing to overharvesting and overall poor stock status.The third resource for which a majority (55%) of respondents saw a continued population decline was Pacific herring (Table 4-32). Roughly 48% of those who observed Pacific herring declines thought that continued contamination from the EVOS was the reason (Table 4-33). People discussed the continued closure of the fishery, failure among juvenile Pacific herring to thrive, and sickly looking fish as evidence of enduring EVOS contaminants. The poor health of the stock ties into the second most cited cause for the decline, which was categorized as stock status. Stock status includes things such as lesions, sores, and deformities, all of which people discussed seeing on the local Pacific herring. People attributed these abnormalities to continued genetic damage caused to the Pacific herring as a result of the spill. Those who assessed that Pacific herring numbers have remained the same (28% of responding households) often contextualized this by saying, “There are still no herring here, so it’s the same as it was 10 years ago.”
269

Table 4-30.–Household assessments of the recovery of subsistence resources since the oil spill, Cordova, 2014.
Number Percentage Number Percentage Number Percentage Number Percentage Number Percentage
Cordova 950 20.7 2.2% 180.7 19.0% 748.6 78.8% 284.0 37.9% 464.7 62.1%
a. Computed as a percentage of estimated community households.
Prince William Sound
Source ADF&G Division of Subsistence household surveys, 2015.
b. Computed as a percentage of valid responses.c. Valid responses include only households that gave a "yes" or "no" response to the question.
Have subsistence resources recovered since the Exxon Valdez oil spill?
Missinga Do not knowa Yesb NobValid responsesa, c
CommunityCommunity households
270
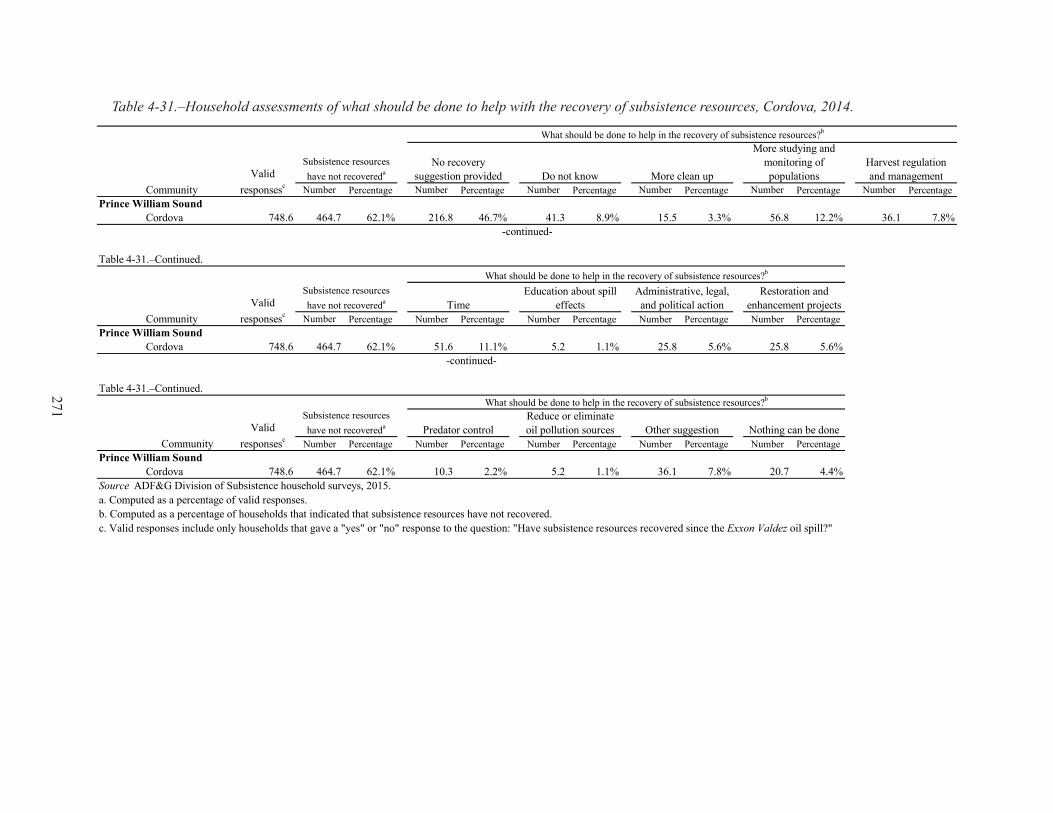
Table 4-31.–Household assessments of what should be done to help with the recovery of subsistence resources, Cordova, 2014.
Number Percentage Number Percentage Number Percentage Number Percentage Number Percentage Number Percentage
Cordova 748.6 464.7 62.1% 216.8 46.7% 41.3 8.9% 15.5 3.3% 56.8 12.2% 36.1 7.8%
Number Percentage Number Percentage Number Percentage Number Percentage Number Percentage
Cordova 748.6 464.7 62.1% 51.6 11.1% 5.2 1.1% 25.8 5.6% 25.8 5.6%
Number Percentage Number Percentage Number Percentage Number Percentage Number Percentage
Cordova 748.6 464.7 62.1% 10.3 2.2% 5.2 1.1% 36.1 7.8% 20.7 4.4%
Prince William SoundCommunity
Valid responsesc
Subsistence resources have not recovereda More clean up
More studying and monitoring of populations
Harvest regulation and management
Restoration and enhancement projects
-continued-
What should be done to help in the recovery of subsistence resources?b
CommunityValid
responsesc
Subsistence resources have not recovereda
No recovery suggestion provided Do not know
-continued-
Table 4-31.–Continued.
CommunityPrince William Sound
Valid responsesc
Subsistence resources have not recovereda
What should be done to help in the recovery of subsistence resources?b
Predator controlReduce or eliminate oil pollution sources Other suggestion Nothing can be done
Prince William Sound
What should be done to help in the recovery of subsistence resources?b
TimeEducation about spill
effectsAdministrative, legal, and political action
Source ADF&G Division of Subsistence household surveys, 2015.a. Computed as a percentage of valid responses.b. Computed as a percentage of households that indicated that subsistence resources have not recovered.c. Valid responses include only households that gave a "yes" or "no" response to the question: "Have subsistence resources recovered since the Exxon Valdez oil spill?"
Table 4-31.–Continued.271

Table 4-32.–Household assessments of change in resource availability compared to 10 years ago, Cordova, 2014.
Numer Percentage Numer Percentage Numer Percentage Numer PercentagePacific herring 950 278.8 29.3% 222.0 23.4% 728.0 76.6% 449.2 61.7%Pacific halibut 950 242.7 25.5% 222.0 23.4% 728.0 76.6% 485.3 66.7%Harbor seal 950 500.8 52.7% 222.0 23.4% 728.0 76.6% 227.2 31.2%Ducks 950 526.6 55.4% 222.0 23.4% 728.0 76.6% 201.4 27.7%Chitons (bidarkis, gumboots) 950 598.9 63.0% 222.0 23.4% 728.0 76.6% 129.1 17.7%Clams 950 351.1 37.0% 222.0 23.4% 728.0 76.6% 376.9 51.8%
Numer Percentage Numer Percentage Numer PercentagePacific herring 950 247.8 55.2% 123.9 27.6% 77.4 17.2%Pacific halibut 950 278.8 57.4% 144.6 29.8% 62.0 12.8%Harbor seal 950 25.8 11.4% 98.1 43.2% 103.3 45.5%Ducks 950 20.7 10.3% 154.9 76.9% 25.8 12.8%Chitons (bidarkis, gumboots) 950 51.6 40.0% 67.1 52.0% 10.3 8.0%Clams 950 284.0 75.3% 72.3 19.2% 20.7 5.5%Source ADF&G Division of Subsistence household surveys, 2015.a. Computed as a percentage of estimated households.
Lessc
Valid responsesb, dNot in communityaNo responsea
Samec MorecTable 4-32.–Continued.
b. Computed as a percentage of households that were in the community 10 years ago.c. Computed as a percentage of valid responses.d. Valid responses include only those households that were in the community 10 years ago and that responded that resource availability was either less, the same, or more compared to 10 years ago.
In communityaEstimated householdsResource
-continued-
ResourceEstimated
households
272
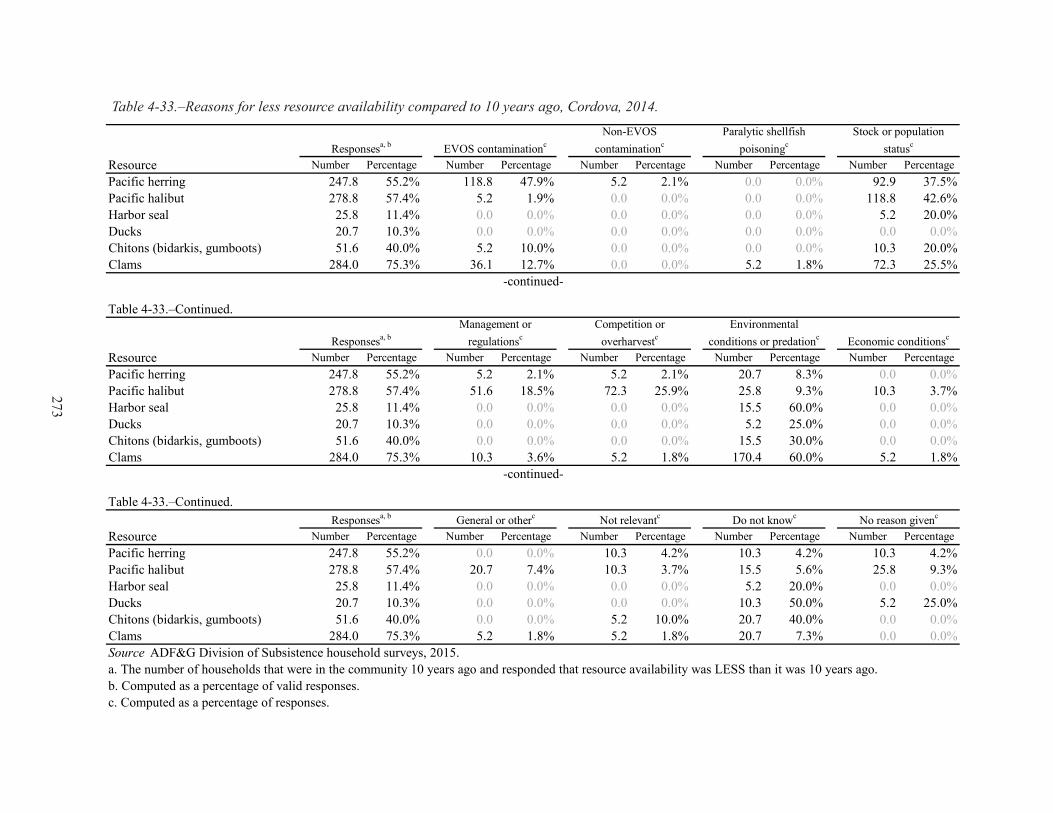
Table 4-33.–Reasons for less resource availability compared to 10 years ago, Cordova, 2014.
Number Percentage Number Percentage Number Percentage Number Percentage Number PercentagePacific herring 247.8 55.2% 118.8 47.9% 5.2 2.1% 0.0 0.0% 92.9 37.5%Pacific halibut 278.8 57.4% 5.2 1.9% 0.0 0.0% 0.0 0.0% 118.8 42.6%Harbor seal 25.8 11.4% 0.0 0.0% 0.0 0.0% 0.0 0.0% 5.2 20.0%Ducks 20.7 10.3% 0.0 0.0% 0.0 0.0% 0.0 0.0% 0.0 0.0%Chitons (bidarkis, gumboots) 51.6 40.0% 5.2 10.0% 0.0 0.0% 0.0 0.0% 10.3 20.0%Clams 284.0 75.3% 36.1 12.7% 0.0 0.0% 5.2 1.8% 72.3 25.5%
Number Percentage Number Percentage Number Percentage Number Percentage Number PercentagePacific herring 247.8 55.2% 5.2 2.1% 5.2 2.1% 20.7 8.3% 0.0 0.0%Pacific halibut 278.8 57.4% 51.6 18.5% 72.3 25.9% 25.8 9.3% 10.3 3.7%Harbor seal 25.8 11.4% 0.0 0.0% 0.0 0.0% 15.5 60.0% 0.0 0.0%Ducks 20.7 10.3% 0.0 0.0% 0.0 0.0% 5.2 25.0% 0.0 0.0%Chitons (bidarkis, gumboots) 51.6 40.0% 0.0 0.0% 0.0 0.0% 15.5 30.0% 0.0 0.0%Clams 284.0 75.3% 10.3 3.6% 5.2 1.8% 170.4 60.0% 5.2 1.8%
Number Percentage Number Percentage Number Percentage Number Percentage Number PercentagePacific herring 247.8 55.2% 0.0 0.0% 10.3 4.2% 10.3 4.2% 10.3 4.2%Pacific halibut 278.8 57.4% 20.7 7.4% 10.3 3.7% 15.5 5.6% 25.8 9.3%Harbor seal 25.8 11.4% 0.0 0.0% 0.0 0.0% 5.2 20.0% 0.0 0.0%Ducks 20.7 10.3% 0.0 0.0% 0.0 0.0% 10.3 50.0% 5.2 25.0%Chitons (bidarkis, gumboots) 51.6 40.0% 0.0 0.0% 5.2 10.0% 20.7 40.0% 0.0 0.0%Clams 284.0 75.3% 5.2 1.8% 5.2 1.8% 20.7 7.3% 0.0 0.0%Source ADF&G Division of Subsistence household surveys, 2015.
EVOS contaminationcResponsesa, b
Do not knowc No reason givenc
Stock or population statusc
Paralytic shellfish poisoningc
Non-EVOS contaminationc
Not relevantc
Resource
a. The number of households that were in the community 10 years ago and responded that resource availability was LESS than it was 10 years ago.b. Computed as a percentage of valid responses.c. Computed as a percentage of responses.
-continued-
Table 4-33.–Continued.
ResourceResponsesa, b
Management or regulationsc
Competition or overharvestc
Environmental conditions or predationc Economic conditionsc
-continued-
Table 4-33.–Continued.
ResourceResponsesa, b General or otherc
273
The only resource (out of the 6 resources of interest) that a significant portion of respondents thought had increased in availability in the past decade was harbor seals; 46% of responding households thought that they had been noticing more seals around Cordova (Table 4-32). This was mostly attributed to an overall rise in the stock (Table 4-34). However, one respondent stated that the seals might be moving into the area rather than actually growing in population size. He thought that seals might be moving from other areas in the sound that are still affected by oil and pushing into the area directly around Cordova to try to avoid EVOS contaminants.Sea ducks and chitons populations were perceived to have mostly stayed the same (77% and 52% of responding households, respectively) (Table 4-32). People who thought the presence of sea ducks had remained the same discussed it in the context that they had noticed neither an increase nor a decrease. Those who said sea duck numbers have increased (13%) attributed this to the overall health of the stock more than any other reason (Table 4-34). A few people who did know about chitons said that they are not frequently found around Cordova, and that harvesters have to go to some of the islands in the sound and search the rocky faces to find them. Many of those who thought that the chiton stocks had declined (40% of responding households) based this on overall declining conditions of other shellfish and fish in the area due to environmental conditions like ocean acidification, ocean warming, and increasing number of diseases afflicting shellfish (Table 4-33).
Social and Economic Conditions
Young Adults’ Involvement in Subsistence ActivitiesParticipants were asked if young adults in the community were learning enough subsistence skills, including hunting, fishing, trapping, and processing wild resources. Of the estimated households that gave valid responses (85% of total community households), an estimated 60% indicated that young adults were adequately learning subsistence skills, while the remaining 40% stated that young adults were not (Table 4-35). Those who thought that young adults were learning enough subsistence skills felt that this was from knowledge being passed down from family members or from other community members and friends (Table 4-36). Of those respondents who said that young adults were not learning enough skills, more attributed this to factors such as that the younger generation does not have interest in a subsistence way of life, young adults are too distracted by technology, and due to a cultural shift in the community way life (Table 4-37).The previous survey asked these same questions and there has been an increase of 7 percentage points in the amount of respondents who feel that young adults are learning enough subsistence skills (53% in 2003 compared to 60% in 2014) (Fall 2006:A-164).
Elders’ InfluenceThis survey asked participants if the influence of elders in regard to wild food harvesting practices in the community had increased, decreased, or stayed the same over the past decade. Out of the total estimated community households, 67% responded to this question (Table 4-38). Of the people who responded, most said that elders’ influence has decreased (48%). Those who felt that elders’ influence had decreased over the past decade attributed this to numerous reasons, including demographic-related issues (50%) and cultural changes (40%) (Table 4-39). Approximately 36% of people said that the influence of elders has remained the same from the past 10 years (Table 4-38). And 16% of respondents said that the influence of elders has increased over the last decade. Those who said that the elders’ influence has increased largely attributed this to the cultural factors (40%), including involvement in cultural camps hosted by the Native Village of Eyak, and also active elders (20%) (Table 4-40). Many respondents who thought elders were more involved gave other reasons (35%), which included the influence of the commercial fishing tradition of the Cordova community.There has been a dramatic decline in perceptions of elder influence since 2003. In that year, 51% of respondents said that elder influence in teaching subsistence skills had increased compared to the 5 years
274
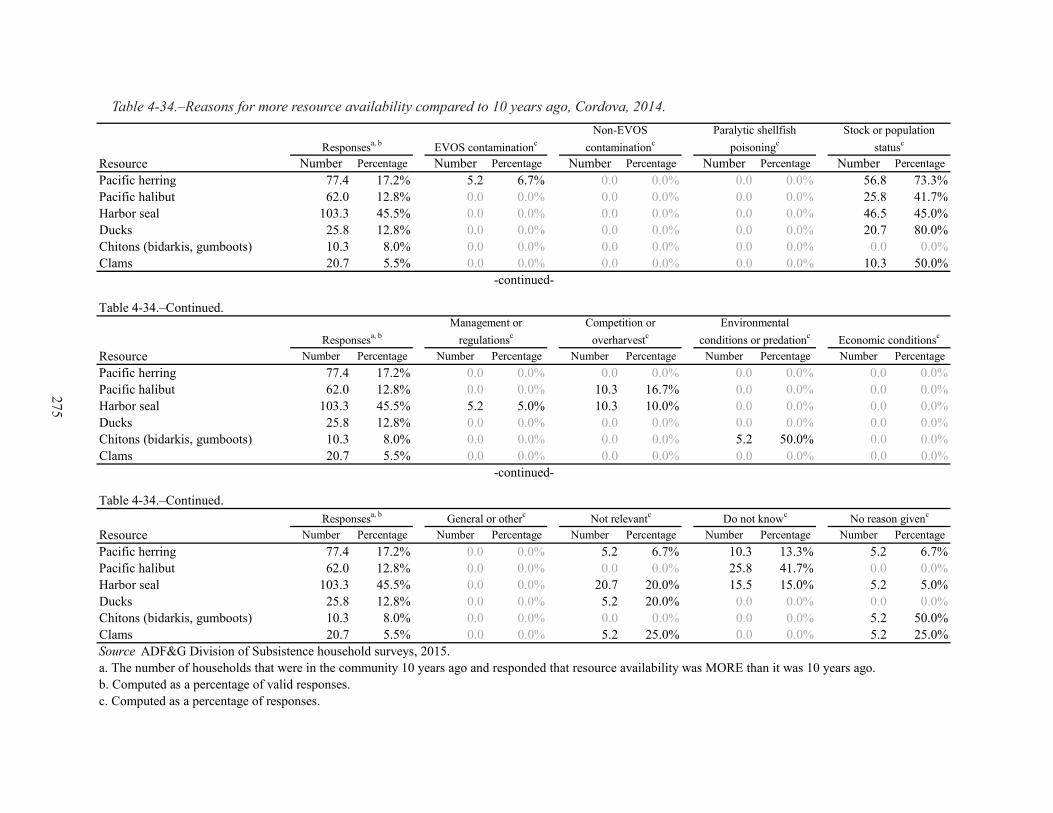
Table 4-34.–Reasons for more resource availability compared to 10 years ago, Cordova, 2014.
Number Percentage Number Percentage Number Percentage Number Percentage Number PercentagePacific herring 77.4 17.2% 5.2 6.7% 0.0 0.0% 0.0 0.0% 56.8 73.3%Pacific halibut 62.0 12.8% 0.0 0.0% 0.0 0.0% 0.0 0.0% 25.8 41.7%Harbor seal 103.3 45.5% 0.0 0.0% 0.0 0.0% 0.0 0.0% 46.5 45.0%Ducks 25.8 12.8% 0.0 0.0% 0.0 0.0% 0.0 0.0% 20.7 80.0%Chitons (bidarkis, gumboots) 10.3 8.0% 0.0 0.0% 0.0 0.0% 0.0 0.0% 0.0 0.0%Clams 20.7 5.5% 0.0 0.0% 0.0 0.0% 0.0 0.0% 10.3 50.0%
Number Percentage Number Percentage Number Percentage Number Percentage Number PercentagePacific herring 77.4 17.2% 0.0 0.0% 0.0 0.0% 0.0 0.0% 0.0 0.0%Pacific halibut 62.0 12.8% 0.0 0.0% 10.3 16.7% 0.0 0.0% 0.0 0.0%Harbor seal 103.3 45.5% 5.2 5.0% 10.3 10.0% 0.0 0.0% 0.0 0.0%Ducks 25.8 12.8% 0.0 0.0% 0.0 0.0% 0.0 0.0% 0.0 0.0%Chitons (bidarkis, gumboots) 10.3 8.0% 0.0 0.0% 0.0 0.0% 5.2 50.0% 0.0 0.0%Clams 20.7 5.5% 0.0 0.0% 0.0 0.0% 0.0 0.0% 0.0 0.0%
Number Percentage Number Percentage Number Percentage Number Percentage Number PercentagePacific herring 77.4 17.2% 0.0 0.0% 5.2 6.7% 10.3 13.3% 5.2 6.7%Pacific halibut 62.0 12.8% 0.0 0.0% 0.0 0.0% 25.8 41.7% 0.0 0.0%Harbor seal 103.3 45.5% 0.0 0.0% 20.7 20.0% 15.5 15.0% 5.2 5.0%Ducks 25.8 12.8% 0.0 0.0% 5.2 20.0% 0.0 0.0% 0.0 0.0%Chitons (bidarkis, gumboots) 10.3 8.0% 0.0 0.0% 0.0 0.0% 0.0 0.0% 5.2 50.0%Clams 20.7 5.5% 0.0 0.0% 5.2 25.0% 0.0 0.0% 5.2 25.0%Source ADF&G Division of Subsistence household surveys, 2015.a. The number of households that were in the community 10 years ago and responded that resource availability was MORE than it was 10 years ago.b. Computed as a percentage of valid responses.c. Computed as a percentage of responses.
Table 4-34.–Continued.
Table 4-34.–Continued.
Resource
Resource
Responsesa, bManagement or
regulationscCompetition or
overharvestcEnvironmental
conditions or predationc Economic conditionsc
Responsesa, b General or otherc Not relevantc Do not knowc No reason givenc
-continued-
EVOS contaminationcNon-EVOS
contaminationcParalytic shellfish
poisoningcStock or population
statusc
-continued-
ResourceResponsesa, b
275

Table 4-35.–Household assessments of whether young adults learn enough subsistence skills, Cordova, 2014.
Number Percentage Number Percentage Number Percentage Number Percentage Number Percentage
Cordova 950 20.7 2.2% 123.9 13.0% 805.4 84.8% 485.3 60.3% 320.1 39.7%
Are young adults learning enough hunting, fishing, and processing skills?
Missinga Valid responsea,c Yesb NobDo not knowa
CommunityCommunity households
c. Valid resonses include only households that responded "yes" or "no" to the question.
a. Computed as a percentage of estimated community households.
Prince William Sound
Source ADF&G Division of Subsistence household surveys, 2015.
b. Computed as a percentage of valid responses.
Table 4-36.–Ways that young adults are learning subsistence skills, Cordova, 2014.
Number Percentage Number Percentage Number Percentage Number Percentage Number Percentage Number Percentage
Cordova 805.4 485.3 60.3% 129.1 26.6% 10.3 2.1% 160.1 33.0% 51.6 10.6% 56.8 11.7%
Number Percentage Number Percentage Number Percentage Number Percentage Number Percentage
Cordova 805.4 485.3 60.3% 41.3 8.5% 41.3 8.5% 129.1 26.6% 20.7 4.3%Source ADF&G Division of Subsistence household surveys, 2015.a. Computed as a percentage of valid responses.b. Computed as a percentage of households that responded "yes" to the question.c. Valid resonses include only households that responded "yes" or "no" to the question: "Are young adults learning enough hunting, fishing, and processing skills?"
Valid responsesc
Yes, learning enougha
How young adults are learning hunting, fishing, and processing skills?b
Prince William Sound
How young adults are learning hunting, fishing, and processing skills?b
Prince William Sound
Yes, learning enougha
Community
Valid responsescCommunity
-continued-
Spirit camps and Native programs School programs
Other community members and friends Other
Table 4-36.–Continued.
Involvement in activitiesEldersFamily membersDo not knowNo reason given
276

Table 4-37.–Reasons why young adults are not learning enough subsistence skills, Cordova, 2014.
Number Percentage Number Percentage Number Percentage Number Percentage Number Percentage
Cordova 805.4 320.1 39.7% 15.5 4.8% 10.3 3.2% 77.4 24.2% 62.0 19.4%
Number Percentage Number Percentage Number Percentage Number Percentage Number Percentage
Cordova 805.4 320.1 39.7% 72.3 22.6% 0.0 0.0% 10.3 3.2% 0.0 0.0%
Number Percentage Number Percentage Number Percentage Number Percentage Number Percentage
Cordova 805.4 320.1 39.7% 36.1 11.3% 25.8 8.1% 72.3 22.6% 25.8 8.1%Source ADF&G Division of Subsistence household surveys, 2015.a. Computed as a percentage of valid responses.b. Computed as a percentage of households that responded "no" to the question.c. Valid resonses include only households that responded "yes" or "no" to the question: "Are young adults learning enough hunting, fishing, and processing skills?"
Decline in/scarcity of subsistence resources Economics
Technology and modernization Other reason
-continued-
Prince William Sound
Table 4-37.–Continued.
Prince William SoundCommunity
Valid responsesc
Not learning enougha
Why young adults are not learning enough hunting, fishing, and processing skills?b
-continued-
Why young adults are not learning enough hunting, fishing, and processing skills?b
Why young adults are not learning enough hunting, fishing, and processing skills?b
CommunityValid
responsescNot learning enougha
Change in community way of life Too much else to do No time
Subsistence uses impeded
Table 4-37.–Continued.
Prince William SoundCommunity
Valid responsesc
Not learning enougha No reason given No interest Lack of teachersDo not know
277

Table 4-38.–Household assessments of change in elders’ influence in the last 10 years, Cordova, 2014.
Number Percentage Number Percentage Number Percentage Number Percentage Number Percentage
Cordova 950 309.8 32.6% 640.2 67.4% 309.8 48.4% 227.2 35.5% 103.3 16.1%
Note The "missing" and "valid response" categories are computed as percentages of estimated community households. All other categories are calculated as percentages of valid responses.
Missing Valid responses
Prince William Sound
Same IncreasedDecreasedCommunityhouseholdsCommunity
Source ADF&G Division of Subsistence household surveys, 2015.
Change in elders' influence compared to 10 years ago (2004)
Table 4-39.–Reasons for decreased influence of elders in the last 10 years, Cordova, 2014.
Number Percentage Number Percentage Number Percentage Number Percentage Number Percentage
Cordova 310 31.0 10.0% 154.9 50.0% 123.9 40.0% 10.3 3.3% 0.0 0.0%
Number Percentage Number Percentage Number Percentage Number Percentage
Cordova 310 15.5 5.0% 25.8 8.3% 15.5 5.0% 46.5 15.0%
Demographic
Prince William Sound
Missing Elders less activeCulturalInfluence decreasedCommunity
Elders more activeReasons for decreased influence of elders compared to 10 years ago (2004)
Source ADF&G Division of Subsistence household surveys, 2015.Note Only households responding that the influence of elders has decreased are included.
Table 4-39.–Continued.
-continued-
Prince William SoundCommunity
Influence decreased
Reasons for decreased influence of elders compared to 10 years ago (2004)Social/political Economic Non-specific Other
278

Table 4-40.–Reasons for increased influence of elders in the last 10 years, Cordova, 2014.
Number Percentage Number Percentage Number Percentage Number Percentage Number Percentage
Cordova 103 15 15.0% 5.2 5.0% 41.3 40.0% 0.0 0.0% 20.7 20.0%
Number Percentage Number Percentage Number Percentage Number Percentage
Cordova 103 15 15.0% 0.0 0.0% 10.3 10.0% 36.1 35.0%Source ADF&G Division of Subsistence household surveys, 2015.Note Only households responding that the influence of elders has increased are included.
Table 4-40.–Continued.
-continued-
CommunityInfluence increased
Prince William Sound
Reasons for increased influence of elders compared to 10 years ago (2004)Social/political Economic Non-specific Other
Prince William Sound
Influence increasedCommunity
Demographic Cultural Elders less active Elders more activeMissingReasons for increased influence of elders compared to 10 years ago (2004)
279

prior (Fall 2006:A-167). Some households (23%) indicated that elder influence had decreased and 27% indicated that influence had remained the same. Community members stated that there were fewer elders in the community and those who had previously been passing on cultural information had passed on or moved to Anchorage.
Status of the Traditional Way of LifeCordova residents were asked about how the Exxon Valdez oil spill affected the community’s traditional way of life and whether the effects were still being felt in 2014. Of the households that answered the question, 77% stated that the oil spill did affect Cordova residents’ traditional way of life, 13% of respondents were uncertain, and 10% indicated that there had not been any effects (Table 4-41). For this series of questions, most households that responded that they did not know stated this was because they had not been in the community for long enough to sufficiently make an observation. Of those households that indicated the traditional way of life was affected, 96% answered the question asking whether the traditional way of life has recovered; of those households, 62% reported that the traditional way of life in Cordova has not recovered from the trauma of the Exxon Valdez oil spill (Table 4-42). Another 31% indicated that the traditional way of life had recovered, and 7% stated that they did not know. When asked what could be done to aid in the recovery of the traditional way of life, many people supported an increase of educational and spirit camps and said those are a good source of traditional knowledge and would aid in recovery (16%) (Table 4-43). Another common response was that nothing could be done (16%). Some respondents followed up this response with comments indicating that they felt that the foundational mechanisms of Cordova had been forever altered by the oil spill and could not be recouped. For example, respondents stated that many Cordova residents participated in the commercial Pacific herring fishery, especially those with commercial boats that fished for salmon later in the season. This essentially extended the commercial fishing season by 2.5 months for many fishers, increasing the likelihood that those commercial fishers would remain year-round in the community. The closure of the Pacific herring commercial fishery as a result of the oil spill effects forced people to move out of the community. Others thought that there needed to be continued disaster cleanup efforts on the ocean floor and on surrounding areas where oil can still be readily found under rocks or in the sand (7%). Lastly, 7% of respondents would like more concentered efforts to increase the populations of resources that were most significantly affected by the oil spill as a means to help the traditional way of life recover (such as marine invertebrates fisheries).
280

Table 4-41.–Household assessments of the oil spill’s effect on the traditional way of life, Cordova, 2014.
Number Percentage Number Percentage Number Percentage Number Percentage Number Percentage
Cordova 950 20.7 2.2% 929.3 97.8% 118.8 12.8% 92.9 10.0% 717.7 77.2%
a. Computed as a percentage of community households.b. Computed as a percentage of valid responses.c. Valid responses include only households that responded "yes," "no," or "do not know" to the question.
Source ADF&G Division of Subsistence household surveys, 2015.
CommunityCommunity households
Do not knowb
Prince William Sound
Was the traditional way of life affected by the Exxon Valdez oil spill?Missinga Valid responsesa, c Not affectedb Affectedb
Table 4-42.–Household assessments of the recovery of the traditional way of life since the oil spill, Cordova, 2014.
Number Percentage Number Percentage Number Percentage Number Percentage Number Percentage
Cordova 717.7 25.8 3.6% 691.8 96.4% 46.5 6.7% 428.5 61.9% 216.8 31.3%
c. Valid responses include only households that responded "yes," "no," or "do not know" to the question.
CommunityYes, way of life affected
Has the traditional way of life recovered from the Exxon Valdez oil spill?Missinga Valid responsesa, c Do not knowb Not recoveredb Recoveredb
Prince William Sound
Source ADF&G Division of Subsistence household surveys, 2015.a. Computed as a percentage of households that responded "yes" to the question: "Was the traditional way of life affected by the Exxon Valdez oil spill?"b. Computed as a percentage of valid responses.
281

Table 4-43.–Household assessments for ways to help the recovery of the traditional way of life, Cordova, 2014.
Number Percentage Number Percentage Number Percentage Number Percentage Number Percentage Number PercentagePrince William Sound
Cordova 717.7 428.5 61.9% 139.4 32.5% 10.3 2.4% 31.0 7.2% 15.5 3.6% 0.0 0.0%
Number Percentage Number Percentage Number Percentage Number Percentage Number Percentage Number Percentage
Cordova 717.7 428.5 61.9% 31.0 7.2% 5.2 1.2% 25.8 6.0% 0.0 0.0% 67.1 15.7%
Number Percentage Number Percentage Number Percentage Number Percentage Number Percentage
Cordova 717.7 428.5 61.9% 67.1 15.7% 25.8 6.0% 25.8 6.0% 20.7 4.8%
b. Computed as a percentage of households that responded "no" to the question: "Has the traditional way of life recovered from the Exxon Valdez oil spill?"
Nothing can be done TimeNeed to involve elders
more Other suggestion
Prince William Sound
Prince William Sound
What should be done to help in the recovery of the traditional way of life?b
Source ADF&G Division of Subsistence household surveys, 2015.a. Computed as a percentage of households that responded "yes" to the question: "Was the traditional way of life affected by the Exxon Valdez oil spill?"
-continued-
Community
Yes, way of life
affected
No, way of life not recovereda
Table 4-43.–Continued.
No, way of life not recovereda Get rid of the oil
Table 4-43.–Continued.
-continued-
Continue studies on effects
Take legal and political action
Stop cash distributions and
dividend paymentsMore education and
spirit camps
What should be done to help in the recovery of the traditional way of life?b
Community
Yes, way of life
affected
No, way of life not recovereda Do not knowMissing
What should be done to help in the recovery of the traditional way of life?b
Yes, way of life
affectedCommunity
Create new jobs and new sources of
incomeRespond to social
disruptionsIncrease resource
populations
282
ACKNOWLEDGMENTS
The Division of Subsistence would like to thank first and foremost the partnership and assistance provided by the Native Village of Eyak. We would also like to thank the tireless local research assistants who made this research happen, including: Alvin Kuramoto, Ellen Americus, Faith Barnes, Harrison Cain, Jacob West, June Harrelson, Kenneth Eleshansky, Lennette Ronnegard, and Tim Merculeif. Additionally, the Alaska Department of Fish and Game Cordova office and the Chugach National Forest Cordova District provided boundless support. Lastly, thank you to the community of Cordova for your support and for sharing a bit of your life with us. Thank you all.
283
5. DISCUSSION AND CONCLUSIONS
James A. Fall
overview oF FindingS For the Study coMMunitieS, 2014
Addressing the Recovery ObjectiveThe goal of this project was to collect, analyze, and report information about subsistence uses of fish and wildlife in the 3 Exxon Valdez oil spill (EVOS) area communities of Cordova, Tatitlek, and Chenega Bay in 2014 that is comparable with previous research results and that can be applied to evaluate the status of subsistence uses in light of the EVOS Trustee Council (EVOSTC) recovery objective. The restoration plan adopted by the EVOSTC and last updated in November 2014 (Exxon Valdez Oil Spill Trustee Council 2014) lists subsistence as an injured natural resource service that is “recovering.” The EVOSTC plan defines the following restoration objective for subsistence:
Subsistence will have recovered when injured resources used for subsistence are healthy and productive and exist at pre-spill levels. In addition, there is recognition that people must be confident that the resources are safe to eat and that the cultural values provided by gathering, preparing, and sharing food need to be reintegrated into community life.
As noted in Chapter 1 “Introduction,” evaluating progress toward the EVOSTC’s recovery objective for subsistence entails addressing 3 questions:
1. Are resources used for subsistence purposes healthy, and are their populations at pre-spill levels?
2. Are people confident that resources are safe to eat?
3. Have the cultural values associated with subsistence uses been reintegrated into community life?
As also noted earlier, assessing the recovery of subsistence uses also includes the difficult task of separating the potential lingering effects of the oil spill from other concurrent factors, in what has been called “the total environment of change” (Moerlein and Carothers 2012). These other factors encompass environmental, economic, social, and cultural changes that are active in the communities. In some cases, such as global climate change, these other conditions have no link to the oil spill. In others, such as the changing role of commercial fishing, spill and non-spill factors may be intertwined. In still others, the role of the oil spill in changing fundamental environmental or social conditions is a point of contention. The link between paralytic shellfish poisoning (PSP) and the oil spill is an example (Fall 2006:387); another may be the perception on the part of many survey respondents that young people no longer have an interest in subsistence hunting and fishing.Additionally, evaluation of the post-spill recovery of subsistence uses must also be informed by other measures that are deemed important by local community residents, such as harvest levels, the diversity of species used, and changing environmental, economic, demographic, and sociocultural conditions that have shaped subsistence hunting and fishing during the last 25 years.The discussion that follows is organized around the key findings and conclusions from the last update for 2003 (Fall 2006:377–397). Study findings for Nanwalek and Port Graham, 2 communities in the spill area for which research was funded from another source, are included here to broaden comparisons across study years and subareas. The reader should consult the previous chapters for detailed discussions of study findings for each community, which will not be repeated here. Full study results for Nanwalek and Port Graham will appear in another report.1
1. Jones, Bronwyn and G. Zimelman, eds. In prep. “The Harvest and Use of Wild Resources in Nikiski, Seldovia, Nanwalek, and
284
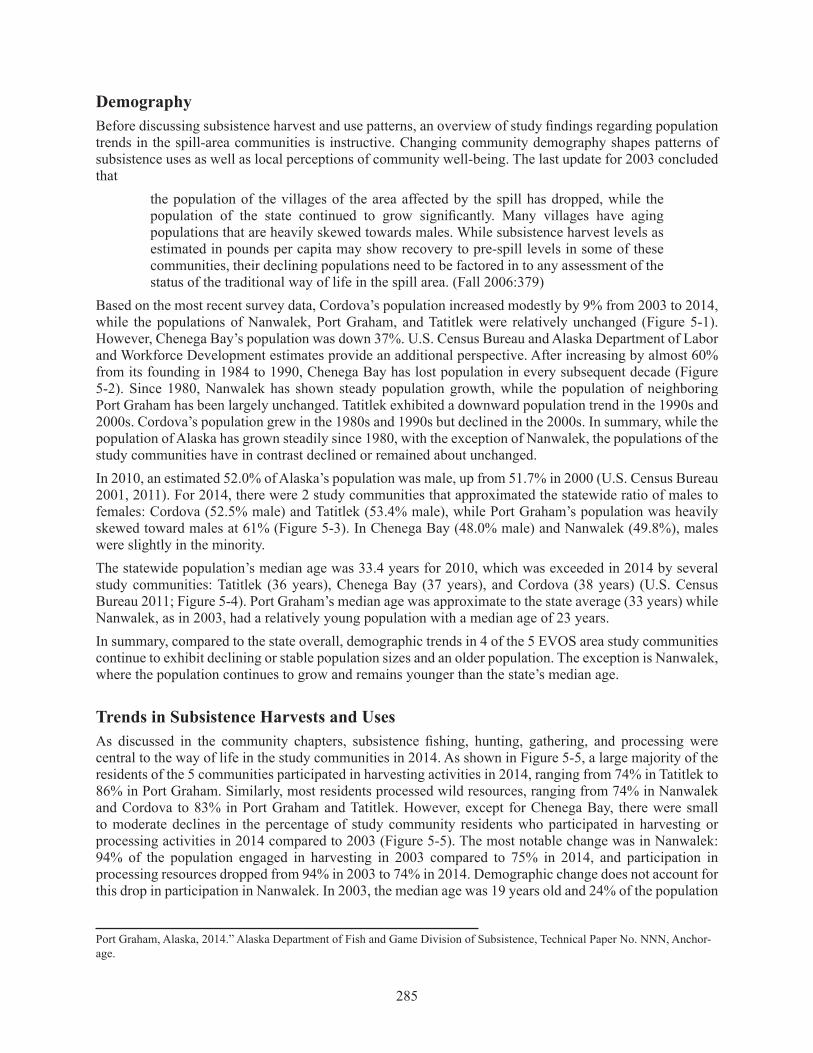
DemographyBefore discussing subsistence harvest and use patterns, an overview of study findings regarding population trends in the spill-area communities is instructive. Changing community demography shapes patterns of subsistence uses as well as local perceptions of community well-being. The last update for 2003 concluded that
the population of the villages of the area affected by the spill has dropped, while the population of the state continued to grow significantly. Many villages have aging populations that are heavily skewed towards males. While subsistence harvest levels as estimated in pounds per capita may show recovery to pre-spill levels in some of these communities, their declining populations need to be factored in to any assessment of the status of the traditional way of life in the spill area. (Fall 2006:379)
Based on the most recent survey data, Cordova’s population increased modestly by 9% from 2003 to 2014, while the populations of Nanwalek, Port Graham, and Tatitlek were relatively unchanged (Figure 5-1). However, Chenega Bay’s population was down 37%. U.S. Census Bureau and Alaska Department of Labor and Workforce Development estimates provide an additional perspective. After increasing by almost 60% from its founding in 1984 to 1990, Chenega Bay has lost population in every subsequent decade (Figure 5-2). Since 1980, Nanwalek has shown steady population growth, while the population of neighboring Port Graham has been largely unchanged. Tatitlek exhibited a downward population trend in the 1990s and 2000s. Cordova’s population grew in the 1980s and 1990s but declined in the 2000s. In summary, while the population of Alaska has grown steadily since 1980, with the exception of Nanwalek, the populations of the study communities have in contrast declined or remained about unchanged.In 2010, an estimated 52.0% of Alaska’s population was male, up from 51.7% in 2000 (U.S. Census Bureau 2001, 2011). For 2014, there were 2 study communities that approximated the statewide ratio of males to females: Cordova (52.5% male) and Tatitlek (53.4% male), while Port Graham’s population was heavily skewed toward males at 61% (Figure 5-3). In Chenega Bay (48.0% male) and Nanwalek (49.8%), males were slightly in the minority.The statewide population’s median age was 33.4 years for 2010, which was exceeded in 2014 by several study communities: Tatitlek (36 years), Chenega Bay (37 years), and Cordova (38 years) (U.S. Census Bureau 2011; Figure 5-4). Port Graham’s median age was approximate to the state average (33 years) while Nanwalek, as in 2003, had a relatively young population with a median age of 23 years.In summary, compared to the state overall, demographic trends in 4 of the 5 EVOS area study communities continue to exhibit declining or stable population sizes and an older population. The exception is Nanwalek, where the population continues to grow and remains younger than the state’s median age.
Trends in Subsistence Harvests and UsesAs discussed in the community chapters, subsistence fishing, hunting, gathering, and processing were central to the way of life in the study communities in 2014. As shown in Figure 5-5, a large majority of the residents of the 5 communities participated in harvesting activities in 2014, ranging from 74% in Tatitlek to 86% in Port Graham. Similarly, most residents processed wild resources, ranging from 74% in Nanwalek and Cordova to 83% in Port Graham and Tatitlek. However, except for Chenega Bay, there were small to moderate declines in the percentage of study community residents who participated in harvesting or processing activities in 2014 compared to 2003 (Figure 5-5). The most notable change was in Nanwalek: 94% of the population engaged in harvesting in 2003 compared to 75% in 2014, and participation in processing resources dropped from 94% in 2003 to 74% in 2014. Demographic change does not account for this drop in participation in Nanwalek. In 2003, the median age was 19 years old and 24% of the population
Port Graham, Alaska, 2014.” Alaska Department of Fish and Game Division of Subsistence, Technical Paper No. NNN, Anchor-age.
285
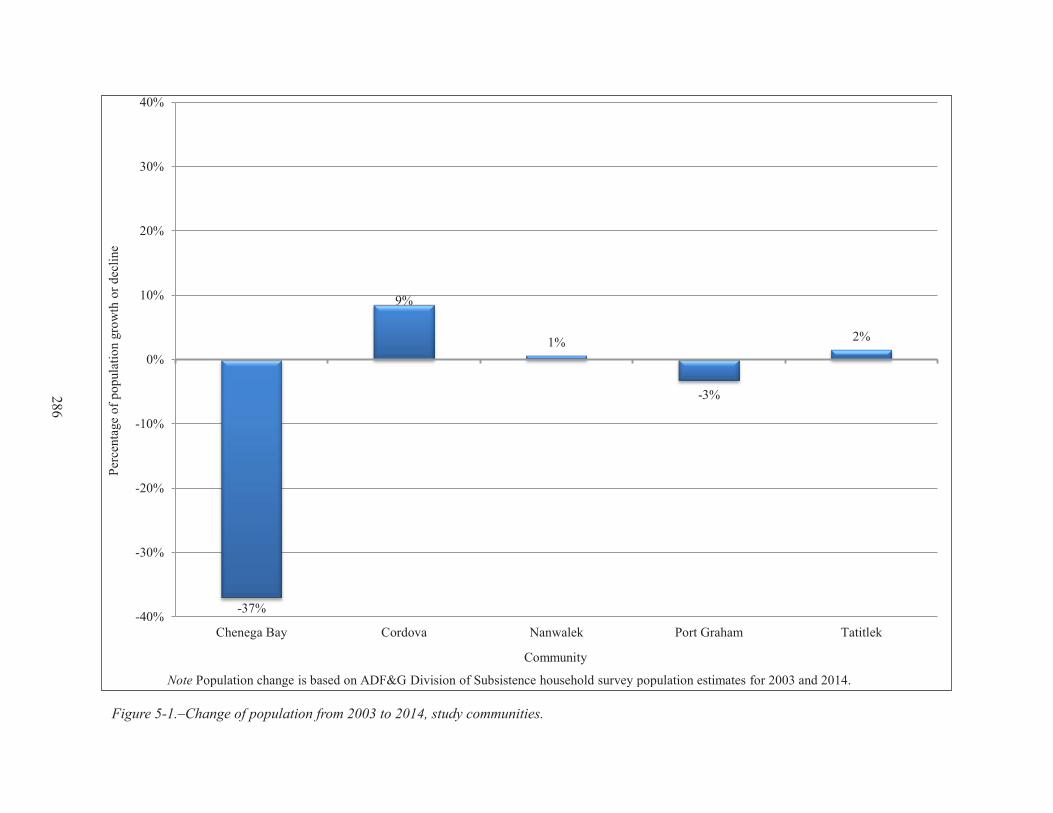
Figure 5-1.–Change of population from 2003 to 2014, study communities.
-37%
9%
1%
-3%
2%
-40%
-30%
-20%
-10%
0%
10%
20%
30%
40%
Chenega Bay Cordova Nanwalek Port Graham Tatitlek
Perc
enta
ge o
f pop
ulat
ion
grow
th o
r dec
line
Community
Note Population change is based on ADF&G Division of Subsistence household survey population estimates for 2003 and 2014.
286
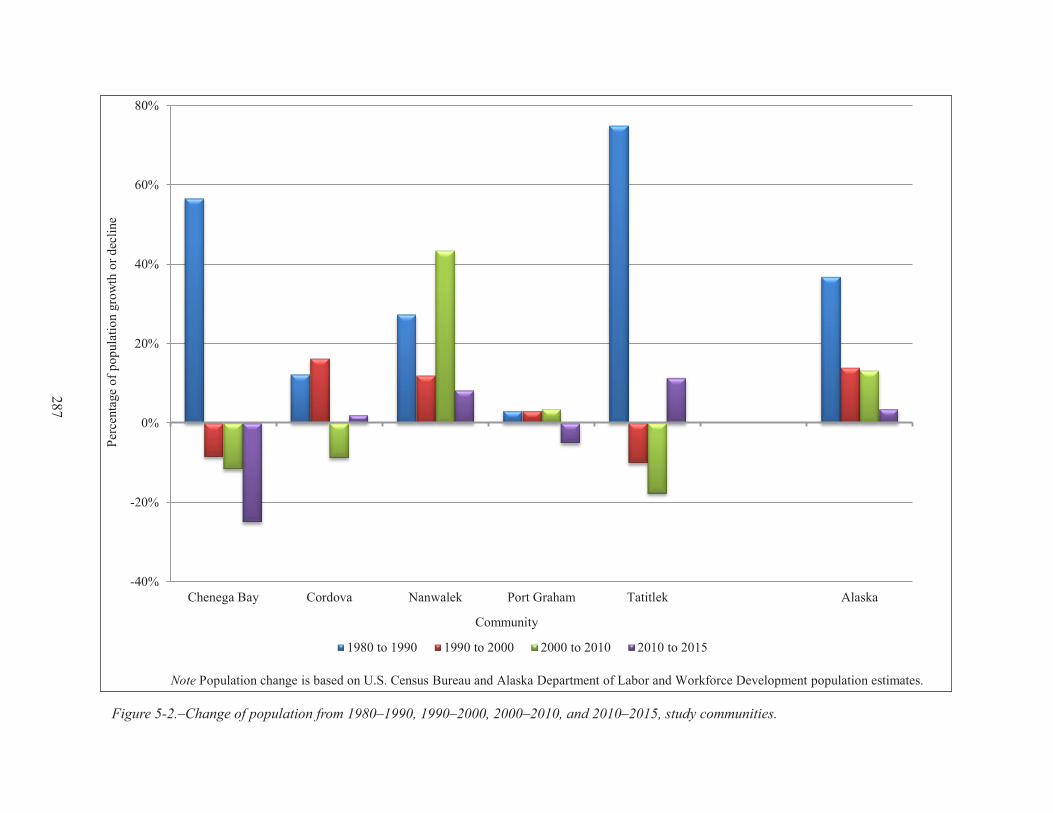
Figure 5-2.–Change of population from 1980–1990, 1990–2000, 2000–2010, and 2010–2015, study communities.
-40%
-20%
0%
20%
40%
60%
80%
Chenega Bay Cordova Nanwalek Port Graham Tatitlek Alaska
Perc
enta
ge o
f pop
ulat
ion
grow
th o
r dec
line
Community
1980 to 1990 1990 to 2000 2000 to 2010 2010 to 2015
Note Population change is based on U.S. Census Bureau and Alaska Department of Labor and Workforce Development population estimates.
287
Figure 5-3.–Percentage of population that is male, study communities, 2003 and 2014.
0%
10%
20%
30%
40%
50%
60%
70%
Chenega Bay Cordova Nanwalek Port Graham Tatitlek Alaska*
Perc
enta
ge o
f mal
e po
pula
tion
Community
2003 2014
*Percentages for Alaska reflect U.S. Census Bureau census results for 2000 and 2010.
288
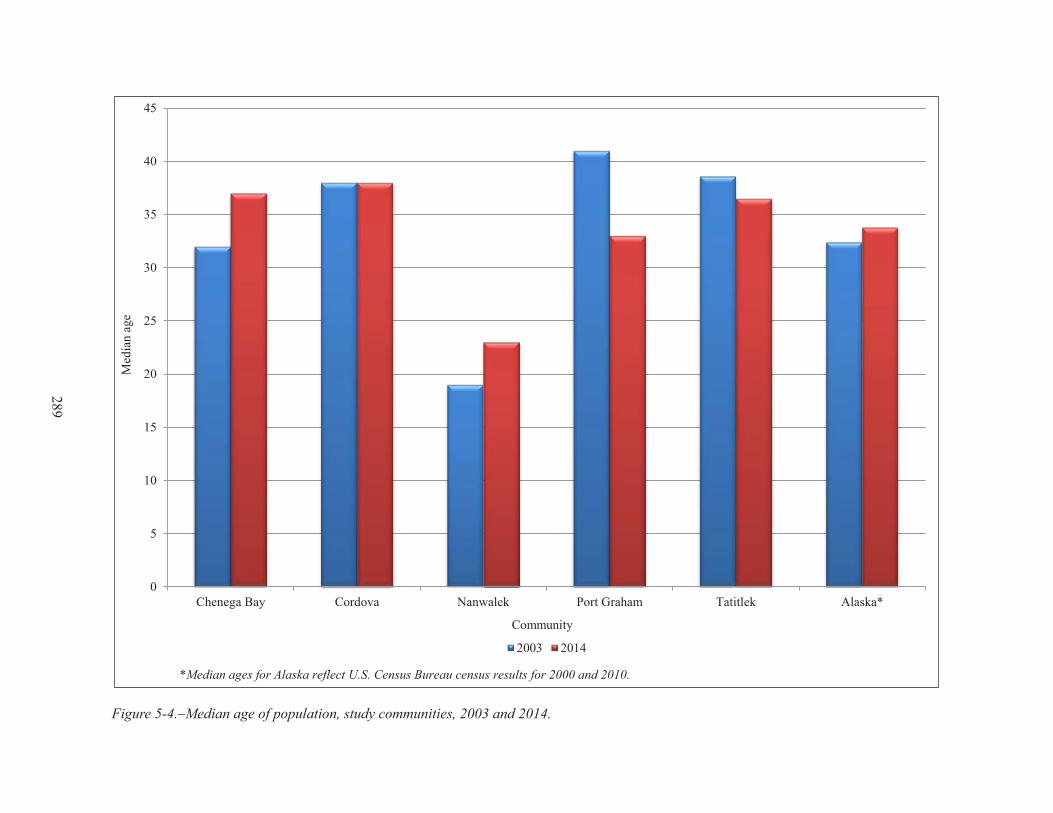
Figure 5-4.–Median age of population, study communities, 2003 and 2014.
0
5
10
15
20
25
30
35
40
45
Chenega Bay Cordova Nanwalek Port Graham Tatitlek Alaska*
Med
ian
age
Community
2003 2014
*Median ages for Alaska reflect U.S. Census Bureau census results for 2000 and 2010.
289
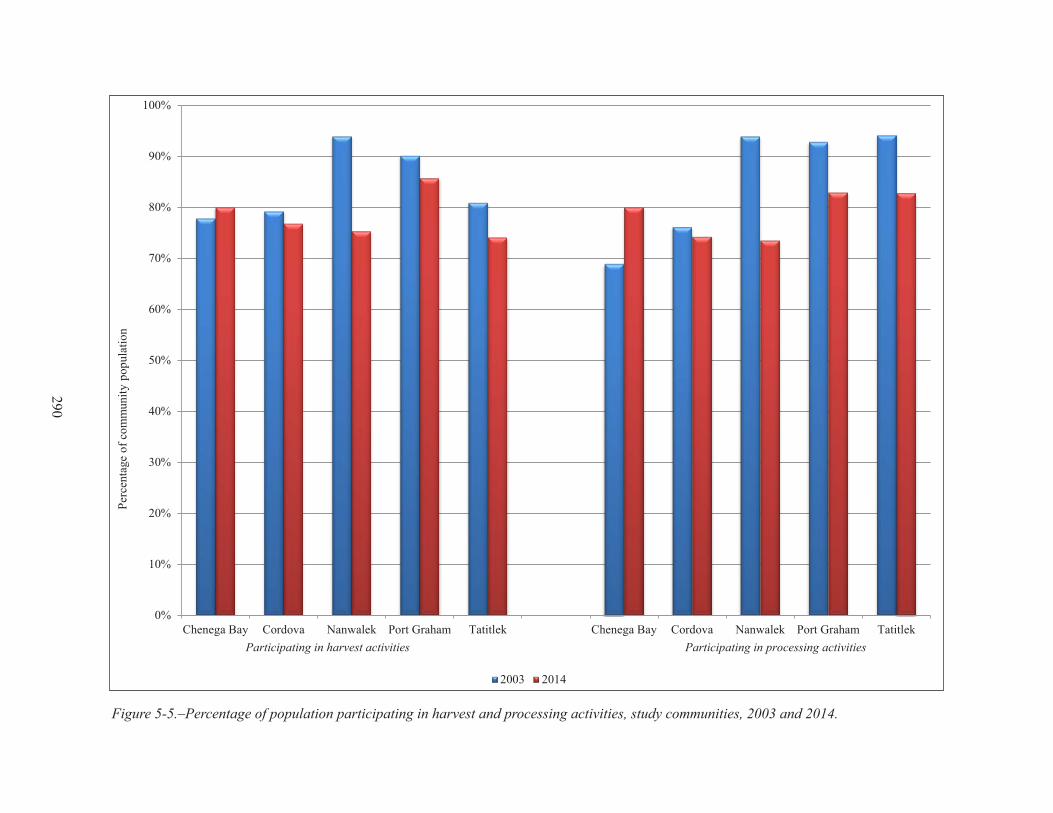
Figure 5-5.–Percentage of population participating in harvest and processing activities, study communities, 2003 and 2014.
0%
10%
20%
30%
40%
50%
60%
70%
80%
90%
100%
Chenega Bay Cordova Nanwalek Port Graham Tatitlek Chenega Bay Cordova Nanwalek Port Graham Tatitlek
Perc
enta
ge o
f com
mun
ity p
opul
atio
n
Participating in harvest activities Participating in processing activities
2003 2014
290
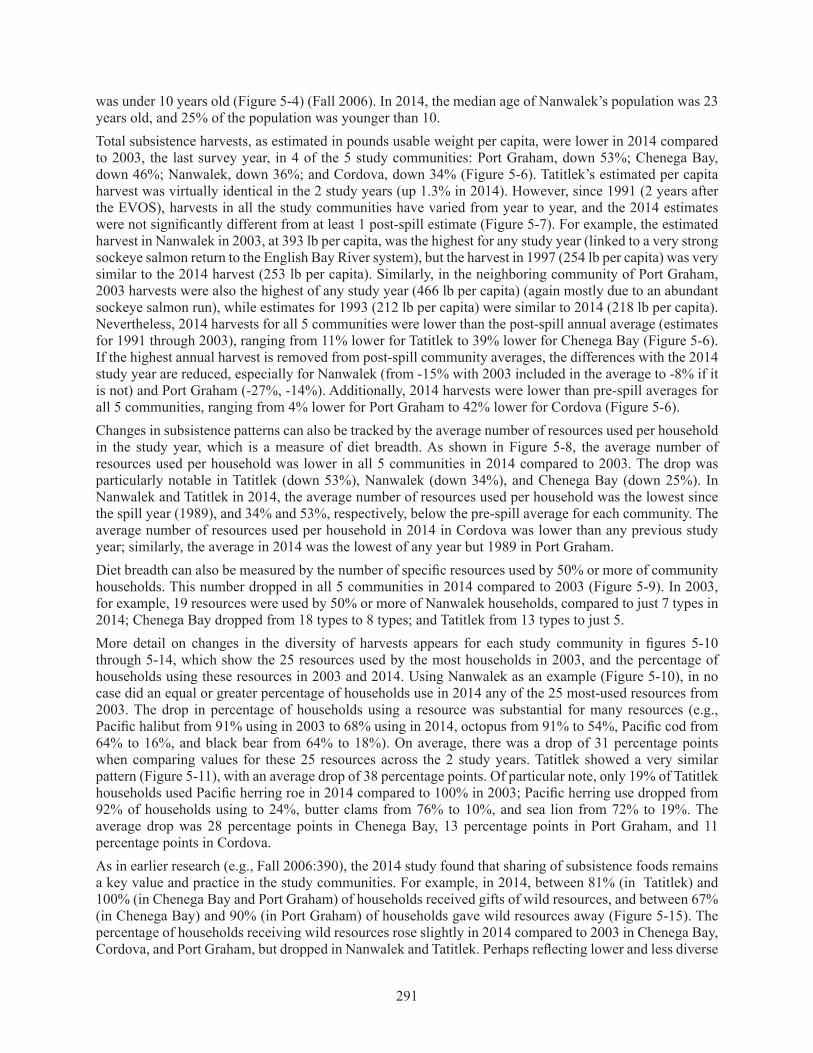
was under 10 years old (Figure 5-4) (Fall 2006). In 2014, the median age of Nanwalek’s population was 23 years old, and 25% of the population was younger than 10.Total subsistence harvests, as estimated in pounds usable weight per capita, were lower in 2014 compared to 2003, the last survey year, in 4 of the 5 study communities: Port Graham, down 53%; Chenega Bay, down 46%; Nanwalek, down 36%; and Cordova, down 34% (Figure 5-6). Tatitlek’s estimated per capita harvest was virtually identical in the 2 study years (up 1.3% in 2014). However, since 1991 (2 years after the EVOS), harvests in all the study communities have varied from year to year, and the 2014 estimates were not significantly different from at least 1 post-spill estimate (Figure 5-7). For example, the estimated harvest in Nanwalek in 2003, at 393 lb per capita, was the highest for any study year (linked to a very strong sockeye salmon return to the English Bay River system), but the harvest in 1997 (254 lb per capita) was very similar to the 2014 harvest (253 lb per capita). Similarly, in the neighboring community of Port Graham, 2003 harvests were also the highest of any study year (466 lb per capita) (again mostly due to an abundant sockeye salmon run), while estimates for 1993 (212 lb per capita) were similar to 2014 (218 lb per capita). Nevertheless, 2014 harvests for all 5 communities were lower than the post-spill annual average (estimates for 1991 through 2003), ranging from 11% lower for Tatitlek to 39% lower for Chenega Bay (Figure 5-6). If the highest annual harvest is removed from post-spill community averages, the differences with the 2014 study year are reduced, especially for Nanwalek (from -15% with 2003 included in the average to -8% if it is not) and Port Graham (-27%, -14%). Additionally, 2014 harvests were lower than pre-spill averages for all 5 communities, ranging from 4% lower for Port Graham to 42% lower for Cordova (Figure 5-6).Changes in subsistence patterns can also be tracked by the average number of resources used per household in the study year, which is a measure of diet breadth. As shown in Figure 5-8, the average number of resources used per household was lower in all 5 communities in 2014 compared to 2003. The drop was particularly notable in Tatitlek (down 53%), Nanwalek (down 34%), and Chenega Bay (down 25%). In Nanwalek and Tatitlek in 2014, the average number of resources used per household was the lowest since the spill year (1989), and 34% and 53%, respectively, below the pre-spill average for each community. The average number of resources used per household in 2014 in Cordova was lower than any previous study year; similarly, the average in 2014 was the lowest of any year but 1989 in Port Graham.Diet breadth can also be measured by the number of specific resources used by 50% or more of community households. This number dropped in all 5 communities in 2014 compared to 2003 (Figure 5-9). In 2003, for example, 19 resources were used by 50% or more of Nanwalek households, compared to just 7 types in 2014; Chenega Bay dropped from 18 types to 8 types; and Tatitlek from 13 types to just 5.More detail on changes in the diversity of harvests appears for each study community in figures 5-10 through 5-14, which show the 25 resources used by the most households in 2003, and the percentage of households using these resources in 2003 and 2014. Using Nanwalek as an example (Figure 5-10), in no case did an equal or greater percentage of households use in 2014 any of the 25 most-used resources from 2003. The drop in percentage of households using a resource was substantial for many resources (e.g., Pacific halibut from 91% using in 2003 to 68% using in 2014, octopus from 91% to 54%, Pacific cod from 64% to 16%, and black bear from 64% to 18%). On average, there was a drop of 31 percentage points when comparing values for these 25 resources across the 2 study years. Tatitlek showed a very similar pattern (Figure 5-11), with an average drop of 38 percentage points. Of particular note, only 19% of Tatitlek households used Pacific herring roe in 2014 compared to 100% in 2003; Pacific herring use dropped from 92% of households using to 24%, butter clams from 76% to 10%, and sea lion from 72% to 19%. The average drop was 28 percentage points in Chenega Bay, 13 percentage points in Port Graham, and 11 percentage points in Cordova.As in earlier research (e.g., Fall 2006:390), the 2014 study found that sharing of subsistence foods remains a key value and practice in the study communities. For example, in 2014, between 81% (in Tatitlek) and 100% (in Chenega Bay and Port Graham) of households received gifts of wild resources, and between 67% (in Chenega Bay) and 90% (in Port Graham) of households gave wild resources away (Figure 5-15). The percentage of households receiving wild resources rose slightly in 2014 compared to 2003 in Chenega Bay, Cordova, and Port Graham, but dropped in Nanwalek and Tatitlek. Perhaps reflecting lower and less diverse
291

Figure 5-6.–Comparisons of estimated 2014 per capita harvest with previous estimated per capita harvests, study communities.
-27%
-42%
-12%
-4%
-39%-39%
-31%
-15%
-27%
-11%
-32%
-28%
-8%
-14%
-3%
-46%
-34%-36%
-53%
1%
-60%
-50%
-40%
-30%
-20%
-10%
0%
10%
Chenega Bay Cordova Nanwalek Port Graham Tatitlek
Perc
enta
ge o
f cha
nge
of h
arve
st in
pou
nds u
sabl
e w
eigh
t per
cap
ita
CommunityDifference, 2014 from pre-spill average Difference, 2014 from post-spill average
Difference, 2014 from post-spill averagewith highest post-spill harvest deleted
Difference, 2014 from 2003
292

Figure 5-7.–Estimated per capita harvests in pounds usable weight, study communities, pre-spill average, 1989–1993, 1997, 2003, and 2014.
0
100
200
300
400
500
600
700
Chenega Bay Cordova Nanwalek Port Graham Tatitlek
Estim
ated
har
vest
wei
ght i
n us
able
pou
nds p
er c
apita
CommunityPre-spill average 1989 1990 1991 1992 1993 1997 2003 2014
*Data are not availabile for Cordova for 1989 or 1990, or for Tatitlek for 1992.
* * *
293

Figure 5-8.–Average number of resources used per household, study communities, pre-spill average, 1989–1993, 1997, 2003, and 2014.
0
5
10
15
20
25
30
Chenega Bay Cordova Nanwalek Port Graham Tatitlek
Ave
rage
num
ber o
f res
ourc
es u
sed
per h
ouse
hold
CommunityPre-spill average 1989 1990 1991 1992 1993 1997 2003 2014
*Data are not available for Cordova for 1989 or 1990, or for Tatitlek for 1992.
***
294

Figure 5-9.–Number of resources used by 50% or more households, study communities, 2003 and 2014.
0
2
4
6
8
10
12
14
16
18
20
Chenega Bay Cordova Nanwalek Port Graham Tatitlek
Num
ber o
f res
ourc
es u
sed
by 5
0% o
r mor
e ho
useh
olds
Community
2003 2014Note Vegetation resources were excluded from the list of resources used by 50% or more households.
295
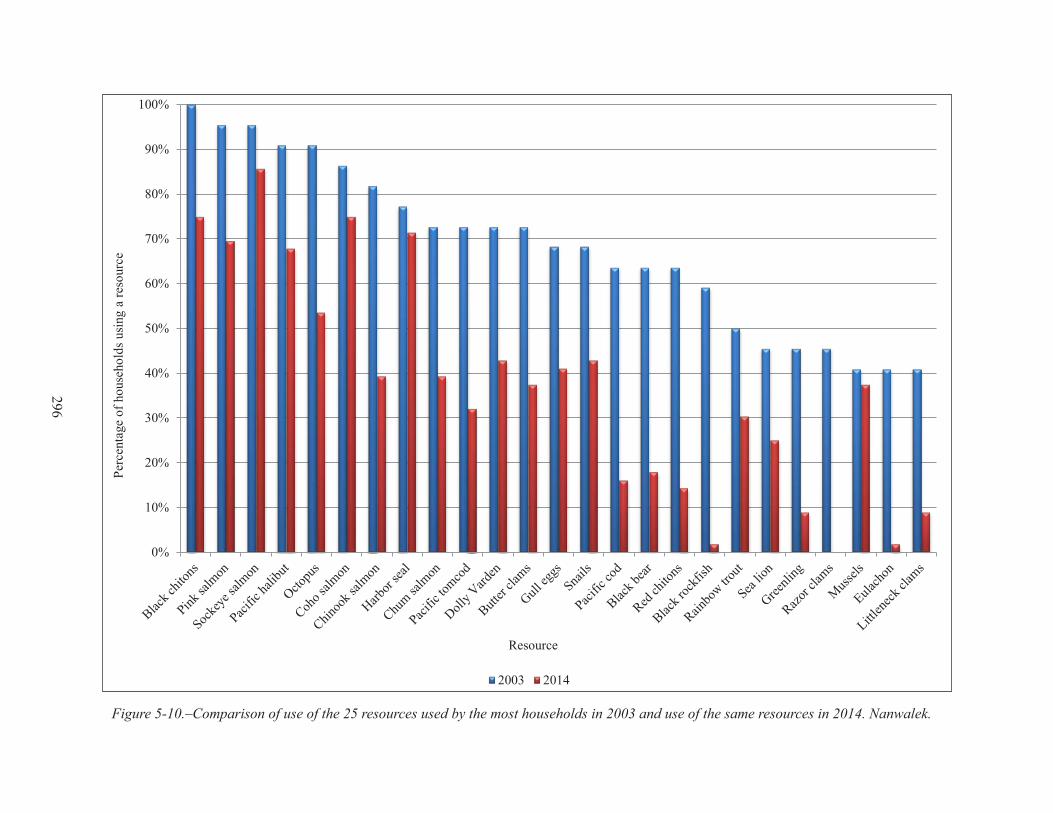
Figure 5-10.–Comparison of use of the 25 resources used by the most households in 2003 and use of the same resources in 2014. Nanwalek.
0%
10%
20%
30%
40%
50%
60%
70%
80%
90%
100%Pe
rcen
tage
of h
ouse
hold
s usi
ng a
reso
urce
Resource
2003 2014
296

Figure 5-11.–Comparison of use of the 25 resources used by the most households in 2003 and use of the same resources in 2014. Tatitlek.
0%
10%
20%
30%
40%
50%
60%
70%
80%
90%
100%Pe
rcen
tage
of h
ouse
hold
s usi
ng a
reso
urce
Resource
2003 2014
297

Figure 5-12.–Comparison of use of the 25 resources used by the most households in 2003 and use of the same resources in 2014. Port Graham.
0%
10%
20%
30%
40%
50%
60%
70%
80%
90%
100%Pe
rcen
tage
of h
ouse
hold
s usi
ng a
reso
urce
Resource
2003 2014
298

Figure 5-13.–Comparison of use of the 25 resources used by the most households in 2003 and use of the same resources in 2014. Chenega Bay.
0%
10%
20%
30%
40%
50%
60%
70%
80%
90%
100%Pe
rcen
tage
of h
ouse
hold
s usi
ng a
reso
urce
Resource
2003 2014
299

Figure 5-14.–Comparison of use of the 25 resources used by the most households in 2003 and use of the same resources in 2014. Cordova.
0%
10%
20%
30%
40%
50%
60%
70%
80%
90%
100%Pe
rcen
tage
of h
ouse
hold
s usi
ng a
reso
urce
Resource
2003 2014
300

Figure 5-15.–Percentage of households receiving resources and giving away resources, study communities, 2003 and 2014.
0%
10%
20%
30%
40%
50%
60%
70%
80%
90%
100%
Chenega Bay Cordova Nanwalek Port Graham Tatitlek Chenega Bay Cordova Nanwalek Port Graham Tatitlek
Perc
enta
ge o
f hou
seho
lds
Receiving resources Giving away resources
2003 2014
301
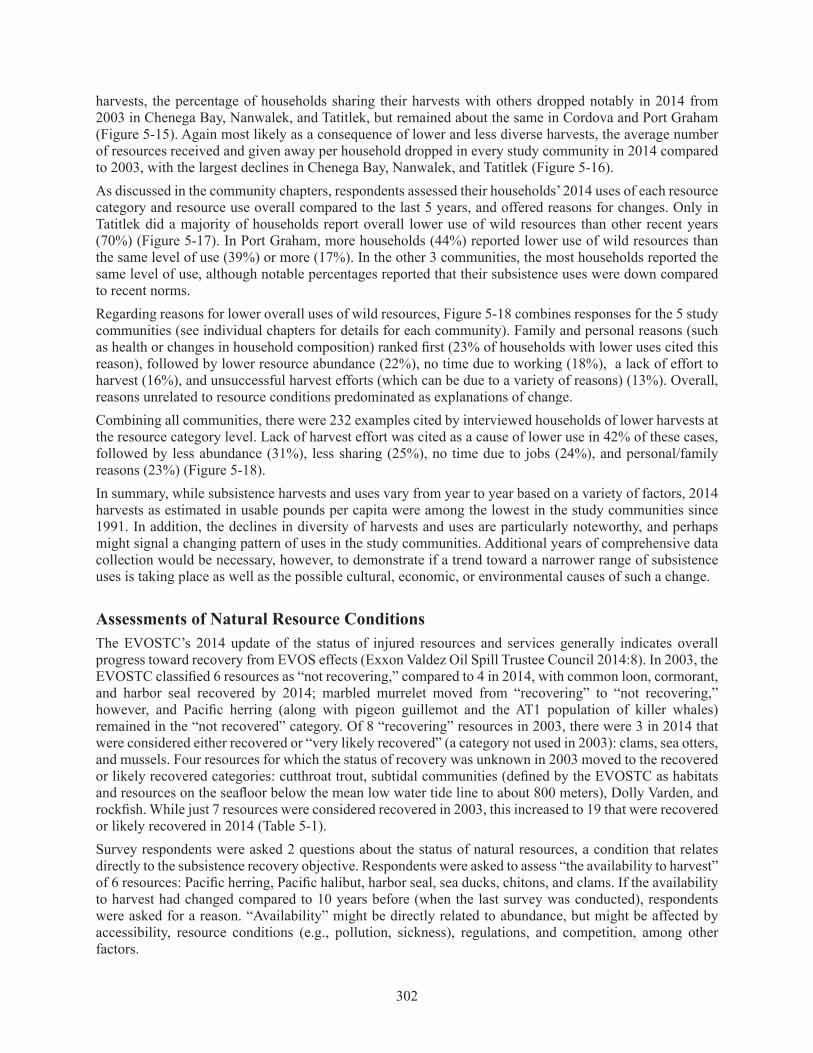
harvests, the percentage of households sharing their harvests with others dropped notably in 2014 from 2003 in Chenega Bay, Nanwalek, and Tatitlek, but remained about the same in Cordova and Port Graham (Figure 5-15). Again most likely as a consequence of lower and less diverse harvests, the average number of resources received and given away per household dropped in every study community in 2014 compared to 2003, with the largest declines in Chenega Bay, Nanwalek, and Tatitlek (Figure 5-16).As discussed in the community chapters, respondents assessed their households’ 2014 uses of each resource category and resource use overall compared to the last 5 years, and offered reasons for changes. Only in Tatitlek did a majority of households report overall lower use of wild resources than other recent years (70%) (Figure 5-17). In Port Graham, more households (44%) reported lower use of wild resources than the same level of use (39%) or more (17%). In the other 3 communities, the most households reported the same level of use, although notable percentages reported that their subsistence uses were down compared to recent norms.Regarding reasons for lower overall uses of wild resources, Figure 5-18 combines responses for the 5 study communities (see individual chapters for details for each community). Family and personal reasons (such as health or changes in household composition) ranked first (23% of households with lower uses cited this reason), followed by lower resource abundance (22%), no time due to working (18%), a lack of effort to harvest (16%), and unsuccessful harvest efforts (which can be due to a variety of reasons) (13%). Overall, reasons unrelated to resource conditions predominated as explanations of change. Combining all communities, there were 232 examples cited by interviewed households of lower harvests at the resource category level. Lack of harvest effort was cited as a cause of lower use in 42% of these cases, followed by less abundance (31%), less sharing (25%), no time due to jobs (24%), and personal/family reasons (23%) (Figure 5-18).In summary, while subsistence harvests and uses vary from year to year based on a variety of factors, 2014 harvests as estimated in usable pounds per capita were among the lowest in the study communities since 1991. In addition, the declines in diversity of harvests and uses are particularly noteworthy, and perhaps might signal a changing pattern of uses in the study communities. Additional years of comprehensive data collection would be necessary, however, to demonstrate if a trend toward a narrower range of subsistence uses is taking place as well as the possible cultural, economic, or environmental causes of such a change.
Assessments of Natural Resource ConditionsThe EVOSTC’s 2014 update of the status of injured resources and services generally indicates overall progress toward recovery from EVOS effects (Exxon Valdez Oil Spill Trustee Council 2014:8). In 2003, the EVOSTC classified 6 resources as “not recovering,” compared to 4 in 2014, with common loon, cormorant, and harbor seal recovered by 2014; marbled murrelet moved from “recovering” to “not recovering,” however, and Pacific herring (along with pigeon guillemot and the AT1 population of killer whales) remained in the “not recovered” category. Of 8 “recovering” resources in 2003, there were 3 in 2014 that were considered either recovered or “very likely recovered” (a category not used in 2003): clams, sea otters, and mussels. Four resources for which the status of recovery was unknown in 2003 moved to the recovered or likely recovered categories: cutthroat trout, subtidal communities (defined by the EVOSTC as habitats and resources on the seafloor below the mean low water tide line to about 800 meters), Dolly Varden, and rockfish. While just 7 resources were considered recovered in 2003, this increased to 19 that were recovered or likely recovered in 2014 (Table 5-1).Survey respondents were asked 2 questions about the status of natural resources, a condition that relates directly to the subsistence recovery objective. Respondents were asked to assess “the availability to harvest” of 6 resources: Pacific herring, Pacific halibut, harbor seal, sea ducks, chitons, and clams. If the availability to harvest had changed compared to 10 years before (when the last survey was conducted), respondents were asked for a reason. “Availability” might be directly related to abundance, but might be affected by accessibility, resource conditions (e.g., pollution, sickness), regulations, and competition, among other factors.
302

Figure 5-16.–Average number of resources received and given away per household, study communities, 2003 and 2014.
0
2
4
6
8
10
12
14
16
18
20
Chenega Bay Cordova Nanwalek Port Graham Tatitlek Chenega Bay Cordova Nanwalek Port Graham Tatitlek
Ave
rage
num
ber o
f res
ourc
es p
er h
ouse
hold
Average number of resources received Average number of resources given away
2003 2014
303

Figure 5-17.–Assessments of uses of all resources compared to recent years, study communities, 2014.
0%
10%
20%
30%
40%
50%
60%
70%
80%
90%
100%
Chenega Bay Cordova Nanwalek Port Graham Tatitlek
Perc
enta
ge o
f hou
seho
lds
Community
Less Same More
Note The percentage of households is based on the total households that used resources.
304

Figure 5-18.–Reasons for less use of resources overall, and less use of any resource category, study communities combined, 2014.
0%
5%
10%
15%
20%
25%
30%
35%
40%
45%Pe
rcen
tage
of r
espo
nses
Cited reasons for less use of wild resources
Reason for using less resources overall
Reason for using less for any resource category
Note The percentage of responses pertaining to less resources overall is based on the number of households combined for all study communities that cited a reason, out of the total number of households for all study communities that used less resources overall. The percentage of responses pertaining to any resource category is based upon the number of cases of respondents in all communities combined citing a reason for a lower use of a particular resourcecategory, out of the total number of cases of lower uses of particular resource categories.
305

Table 5-1.–Status of injured resources and services, 2014.Not recovering Recovering Recovered Very likely recovered Recovery unknown Human servicesa
Marbled murrelet Designated wilderness Archaeological resources Black oysercatchers Kittlitz's murrelet Commercial fishingPacific herring Intertidal communities Bald eagle Cutthroat trout Passive usePigeon guillemot Killer whale–AB pod Barrow's goldeneye Rockfish Recreation and tourismKiller whale–AT1 population Sediments Clams Subtidal communities Subsistence
Common loonCommon murreCormorantDolly VardenHarbor sealHarlequin ducksMusselsPink salmonRiver otterSea otterSockeye salmon
Source EVOSTC 2014a. All human services are considered to be recovering, but recovery is not complete.
306

In 2014, assessments of availability varied by community and resource with no clear consensus (Figure 5-19). The majority of households in Cordova, Port Graham, and Tatitlek said that Pacific herring and clams were less available in 2014 than in 2003. Most households in Cordova and Port Graham said that Pacific halibut were less available. Forty percent or more of households in Cordova, Nanwalek, and Port Graham said chitons were less available, although no one gave this response in Chenega Bay or Tatitlek. A substantial percentage of households in Port Graham and Tatitlek said sea ducks were less available, but few provided this assessment in the other communities. Except for Port Graham, few households in the study communities in 2014 said harbor seals are less available to harvest than 10 years ago. This is a notable change from 2003 (Table 5-2; Figure 5-20), when the percentage of respondents reporting less availability of harbor seals ranged from 38% in Cordova to 86% in Tatitlek. The percentage of respondents saying sea ducks were not as available dropped in all 5 study communities (Table 5-2). Changes in assessments of availability of the other 4 resources were less consistent. For example, a larger percentage of respondents in Cordova, Nanwalek, and Port Graham said Pacific halibut were less available to harvest in 2014 than in 2003, while “less” responses dropped compared to 2003 in Chenega Bay and, especially, Tatitlek.Combining all assessments of lowered availability, lower populations and environmental conditions (including sea otter predation on clams) were cited most often as reasons for declining availability of resources (Figure 5-21). Competition with other user groups was frequently cited as causing less availability of Pacific halibut. EVOS contamination was cited most frequently for less availability of Pacific herring: 44% of respondents who reported lower availability said the cause was the EVOS. The EVOS was cited as a cause of lower availability of clams by 13% of valid responses, sea ducks by 12%, chitons by 8%, and harbor seals by 5%.More generally, respondents were asked if injured natural resources have recovered from EVOS effects. Again, there was no consensus (Figure 5-22). Fifty percent or more of households in Cordova, Nanwalek, Port Graham, and Tatitlek said no, but only 35% in Chenega Bay said no; in Chenega Bay, the percentage saying that natural resources have not recovered dropped from over 70% in 1997. “No” responses peaked for the other 4 communities in 2003 and dropped but remained a significant portion of responses in 2014.Respondents were asked to recommend actions to assist in the recovery of injured natural resources. Many offered no suggestions (45%), did not know what might be done (9%), or said nothing can be done (4%). The most frequent suggestions were to allow time for recovery (12%), conduct more studies and monitoring programs (11%), implement management plans and regulations (9%), and conduct restoration and enhancement projects (7%) (Figure 5-23). Three of these suggestions were also the most frequently offered in 2003.
Subsistence Food SafetyWithin the EVOSTC’s recovery plan, a condition for subsistence recovery is whether people are confident that resources are safe to eat. For 2014, respondents were asked to assess the safety of eating clams, chitons, Pacific herring, and harbor seals. Although the assessments were by no means unanimous, a strong majority of households in all 5 communities said that they are confident in the safety of eating these subsistence foods, and of the remainder, far more said they were not sure about safety rather than voiced a definite negative response that, “no, they are not safe” (figures 5-24 through 5-27). For chitons and seals in Cordova and Pacific herring in Nanwalek and Port Graham, this uncertainty might be related more to unfamiliarity with the resource rather than a concern about using it. Figure 5-28 shows the trend in stated confidence in the safety of eating clams since 1991. Confidence has increased steadily in Chenega Bay, and confidence rebounded in Nanwalek and Port Graham in 2014 after dropping to relatively low levels in 1997 and 2003. A majority of respondents in Cordova and Tatitlek have expressed confidence in the safety of eating clams since 1993, although in all communities a minority has yet to express full confidence. High levels of confidence in the safety of eating seals have generally been the norm since 1991, although following an uninterrupted steady increase in confidence there was a drop in confidence in Nanwalek and Port Graham in
307
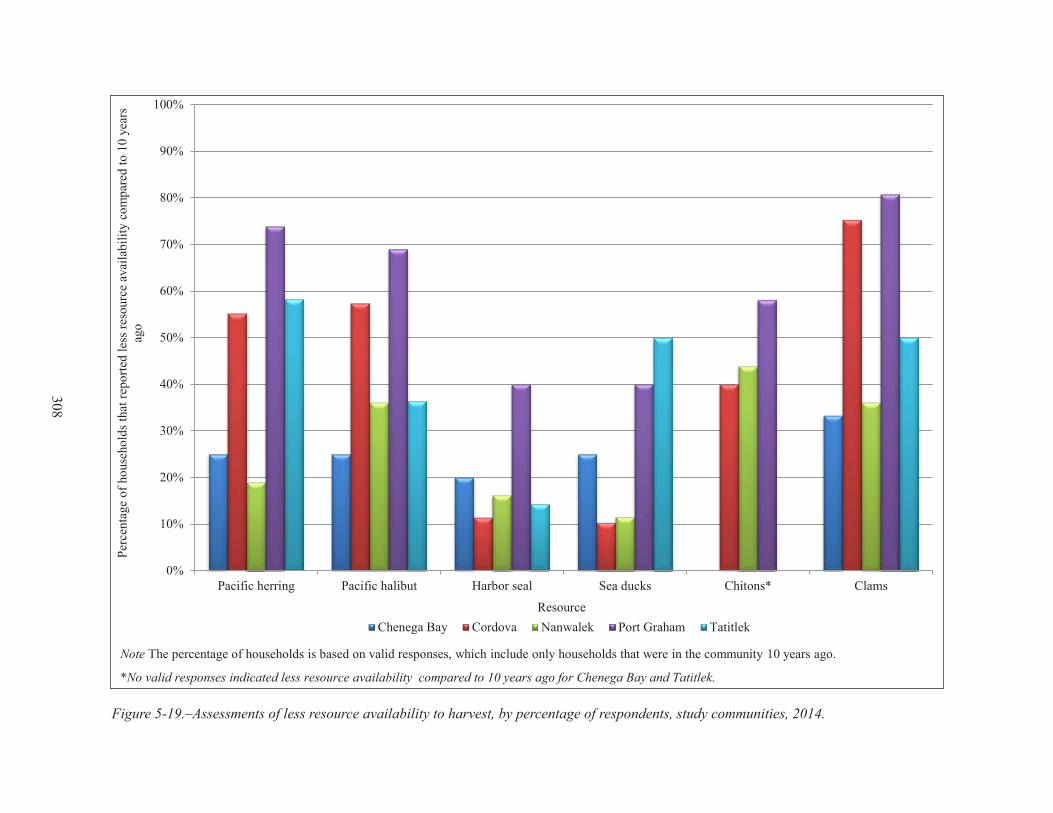
Figure 5-19.–Assessments of less resource availability to harvest, by percentage of respondents, study communities, 2014.
0%
10%
20%
30%
40%
50%
60%
70%
80%
90%
100%
Pacific herring Pacific halibut Harbor seal Sea ducks Chitons* Clams
Perc
enta
ge o
f hou
seho
lds t
hat r
epor
ted
less
reso
urce
ava
ilabi
lity
com
pare
d to
10
year
s ag
o
ResourceChenega Bay Cordova Nanwalek Port Graham Tatitlek
Note The percentage of households is based on valid responses, which include only households that were in the community 10 years ago.
*No valid responses indicated less resource availability compared to 10 years ago for Chenega Bay and Tatitlek.
308
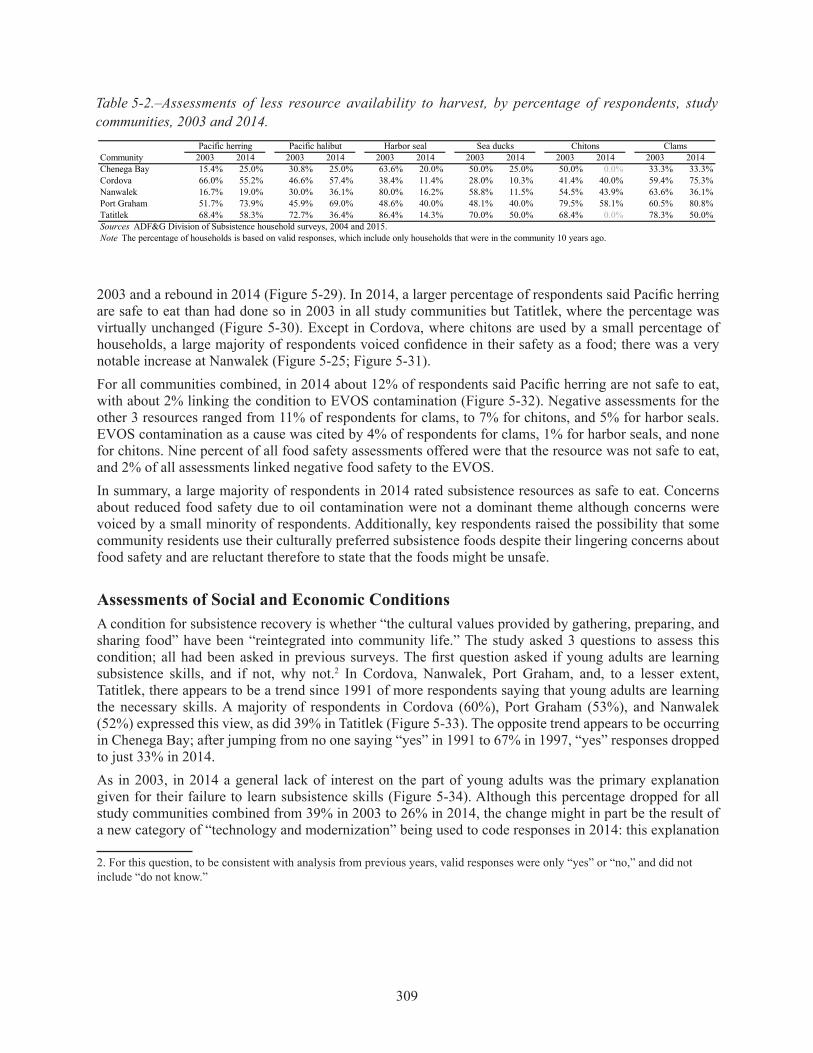
Table 5-2.–Assessments of less resource availability to harvest, by percentage of respondents, study communities, 2003 and 2014.
Community 2003 2014 2003 2014 2003 2014 2003 2014 2003 2014 2003 2014Chenega Bay 15.4% 25.0% 30.8% 25.0% 63.6% 20.0% 50.0% 25.0% 50.0% 0.0% 33.3% 33.3%Cordova 66.0% 55.2% 46.6% 57.4% 38.4% 11.4% 28.0% 10.3% 41.4% 40.0% 59.4% 75.3%Nanwalek 16.7% 19.0% 30.0% 36.1% 80.0% 16.2% 58.8% 11.5% 54.5% 43.9% 63.6% 36.1%Port Graham 51.7% 73.9% 45.9% 69.0% 48.6% 40.0% 48.1% 40.0% 79.5% 58.1% 60.5% 80.8%Tatitlek 68.4% 58.3% 72.7% 36.4% 86.4% 14.3% 70.0% 50.0% 68.4% 0.0% 78.3% 50.0%
Note The percentage of households is based on valid responses, which include only households that were in the community 10 years ago.Sources ADF&G Division of Subsistence household surveys, 2004 and 2015.
ClamsPacific herring Pacific halibut Harbor seal Sea ducks Chitons
2003 and a rebound in 2014 (Figure 5-29). In 2014, a larger percentage of respondents said Pacific herring are safe to eat than had done so in 2003 in all study communities but Tatitlek, where the percentage was virtually unchanged (Figure 5-30). Except in Cordova, where chitons are used by a small percentage of households, a large majority of respondents voiced confidence in their safety as a food; there was a very notable increase at Nanwalek (Figure 5-25; Figure 5-31).For all communities combined, in 2014 about 12% of respondents said Pacific herring are not safe to eat, with about 2% linking the condition to EVOS contamination (Figure 5-32). Negative assessments for the other 3 resources ranged from 11% of respondents for clams, to 7% for chitons, and 5% for harbor seals. EVOS contamination as a cause was cited by 4% of respondents for clams, 1% for harbor seals, and none for chitons. Nine percent of all food safety assessments offered were that the resource was not safe to eat, and 2% of all assessments linked negative food safety to the EVOS. In summary, a large majority of respondents in 2014 rated subsistence resources as safe to eat. Concerns about reduced food safety due to oil contamination were not a dominant theme although concerns were voiced by a small minority of respondents. Additionally, key respondents raised the possibility that some community residents use their culturally preferred subsistence foods despite their lingering concerns about food safety and are reluctant therefore to state that the foods might be unsafe.
Assessments of Social and Economic ConditionsA condition for subsistence recovery is whether “the cultural values provided by gathering, preparing, and sharing food” have been “reintegrated into community life.” The study asked 3 questions to assess this condition; all had been asked in previous surveys. The first question asked if young adults are learning subsistence skills, and if not, why not.2 In Cordova, Nanwalek, Port Graham, and, to a lesser extent, Tatitlek, there appears to be a trend since 1991 of more respondents saying that young adults are learning the necessary skills. A majority of respondents in Cordova (60%), Port Graham (53%), and Nanwalek (52%) expressed this view, as did 39% in Tatitlek (Figure 5-33). The opposite trend appears to be occurring in Chenega Bay; after jumping from no one saying “yes” in 1991 to 67% in 1997, “yes” responses dropped to just 33% in 2014.As in 2003, in 2014 a general lack of interest on the part of young adults was the primary explanation given for their failure to learn subsistence skills (Figure 5-34). Although this percentage dropped for all study communities combined from 39% in 2003 to 26% in 2014, the change might in part be the result of a new category of “technology and modernization” being used to code responses in 2014: this explanation
2. For this question, to be consistent with analysis from previous years, valid responses were only “yes” or “no,” and did not include “do not know.”
309

Figure 5-20.–Assessments of less harbor seal availability to harvest, by percentage of respondents, study communities, 2003 and 2014.
0%
10%
20%
30%
40%
50%
60%
70%
80%
90%
100%
Chenega Bay Cordova Nanwalek Port Graham Tatitlek
Perc
enta
ge o
f hou
seho
lds t
hat r
epor
ted
less
har
bor s
eal a
vaila
bilit
y
Community
2003 2014
Note The percentage of households is based on valid responses, which include only households that were in the community 10 years ago.
310

Figure 5-21.–Reasons for less resource availability to harvest, study communities combined, 2014.
0%
10%
20%
30%
40%
50%
60%
70%Pe
rcen
tage
of h
ouse
hold
s tha
t rep
orte
d le
ss re
sour
ce a
vaila
bilit
y
Reasons for less availability of resources
Pacific herring Pacific halibut Harbor seal Sea ducks Chitons Clams
Note The percentage of households is based on valid responses, which include only households that were in the community 10 years ago and reported less resource availability.
311
Figure 5-22.–Percentage of households that reported resources have not recovered since the oil spill, study communities, 1997, 2003, and 2014.
0%
10%
20%
30%
40%
50%
60%
70%
80%
90%
100%
Chenega Bay Cordova Nanwalek Port Graham Tatitlek
Perc
enta
ge o
f hou
seho
lds t
hat r
epor
ted
reso
urce
s hav
e no
t rec
over
ed si
nce
the
oil s
pill
Community
1997 2003 2014
Note The percentage of households is computed as a percentage of total estimated community households and based on valid responses.
312
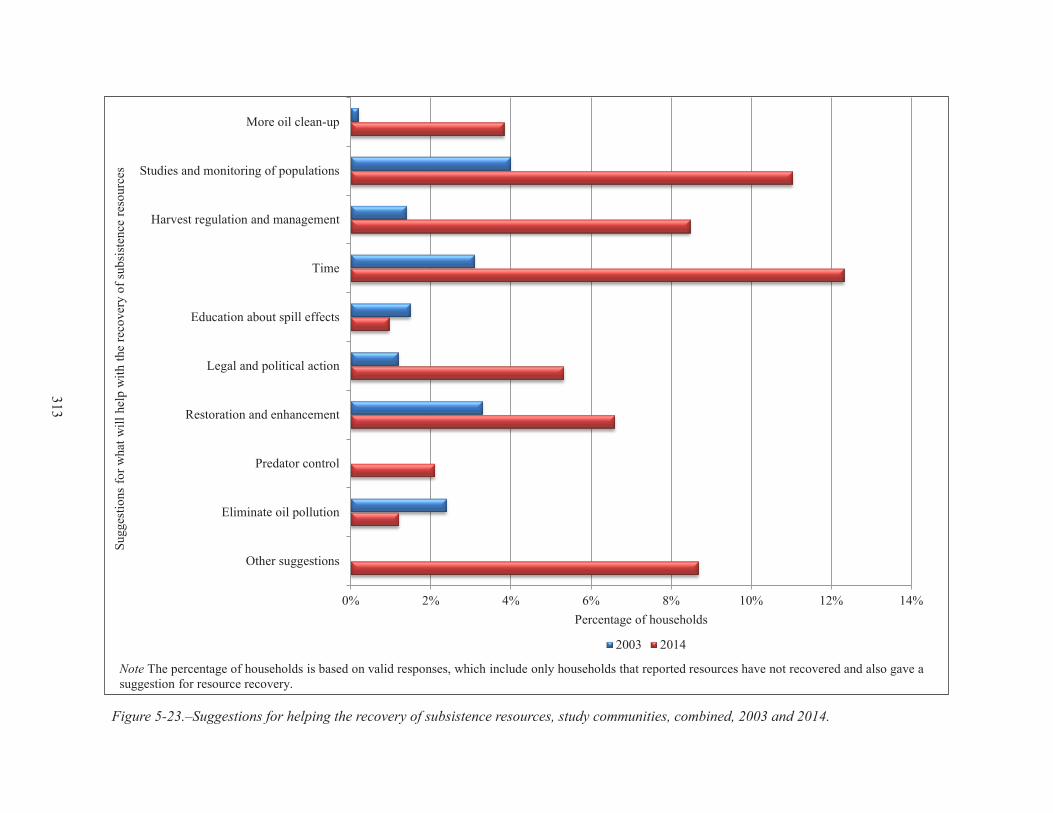
Figure 5-23.–Suggestions for helping the recovery of subsistence resources, study communities, combined, 2003 and 2014.
0% 2% 4% 6% 8% 10% 12% 14%
Other suggestions
Eliminate oil pollution
Predator control
Restoration and enhancement
Legal and political action
Education about spill effects
Time
Harvest regulation and management
Studies and monitoring of populations
More oil clean-up
Percentage of households
Sugg
estio
ns fo
r wha
t will
hel
p w
ith th
e re
cove
ry o
f sub
sist
ence
reso
urce
s
2003 2014
Note The percentage of households is based on valid responses, which include only households that reported resources have not recovered and also gave asuggestion for resource recovery.
313

Figure 5-24.–Assessments of safety to eat clams, study communities, 2014.
0%
10%
20%
30%
40%
50%
60%
70%
80%
90%
100%
Chenega Bay Cordova Nanwalek Port Graham Tatitlek
Perc
enta
ge o
f hou
seho
lds
Community
Yes No Not sure
Note The percentage of households is based on valid responses, which include only households that use clams.
314
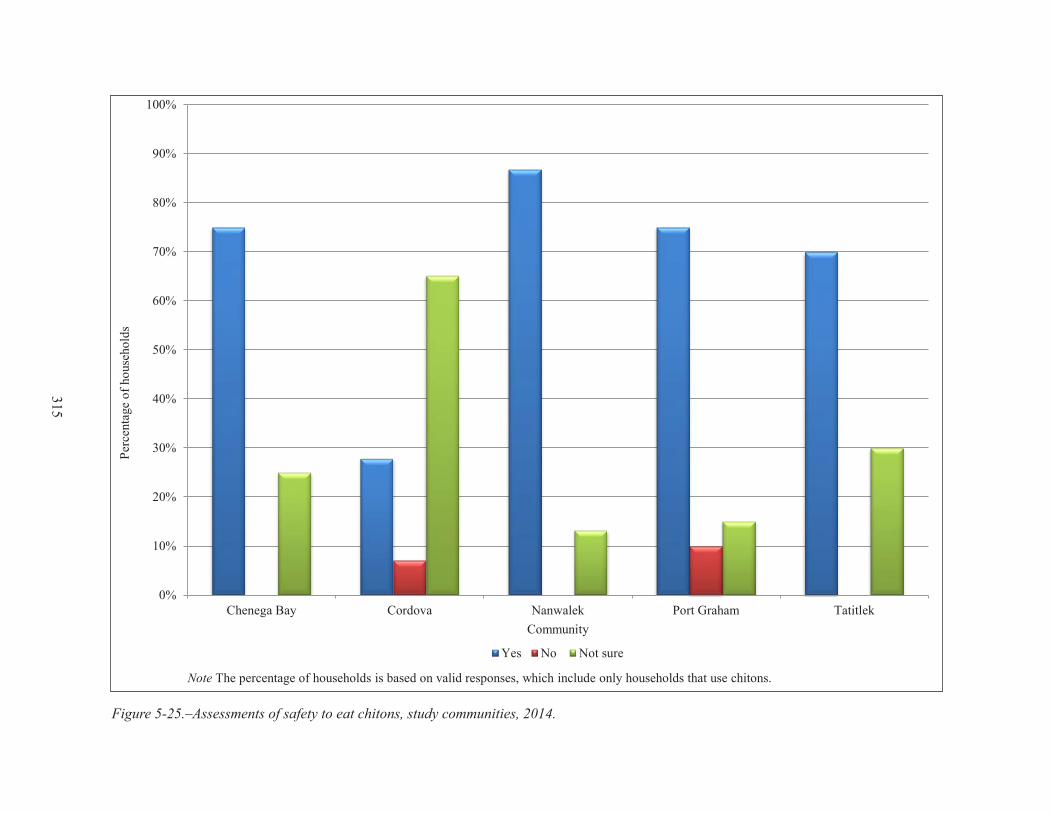
Figure 5-25.–Assessments of safety to eat chitons, study communities, 2014.
0%
10%
20%
30%
40%
50%
60%
70%
80%
90%
100%
Chenega Bay Cordova Nanwalek Port Graham Tatitlek
Perc
enta
ge o
f hou
seho
lds
Community
Yes No Not sure
Note The percentage of households is based on valid responses, which include only households that use chitons.
315
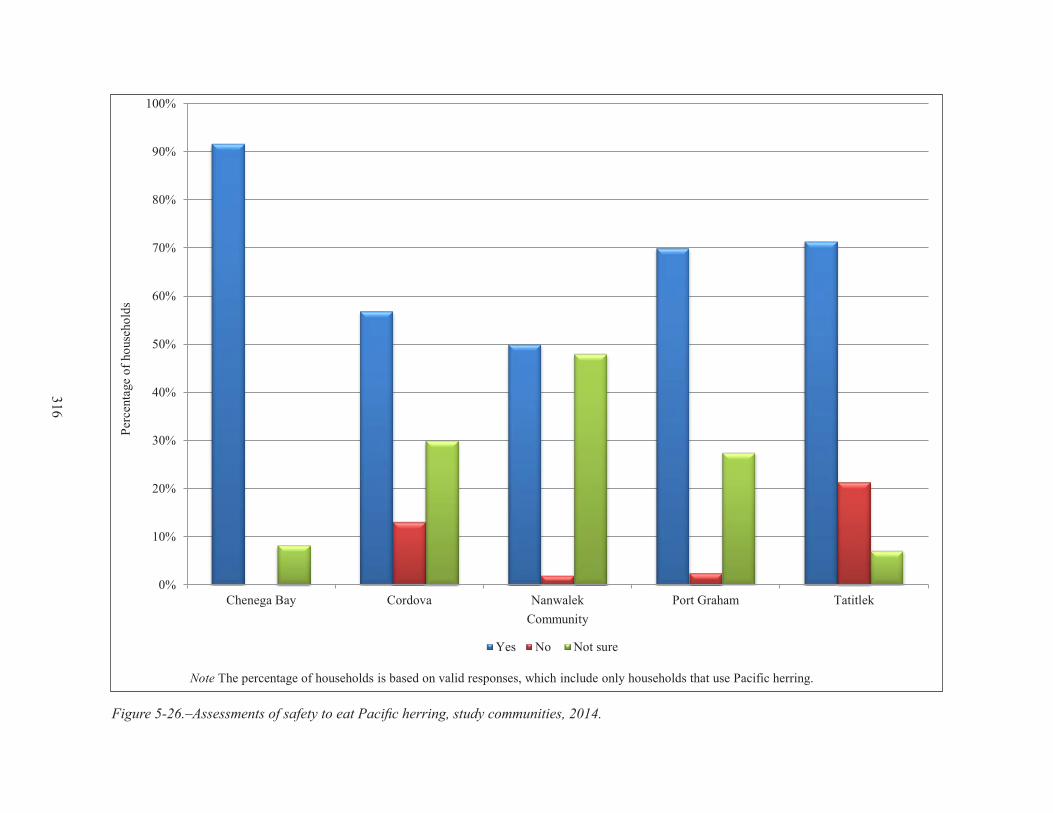
Figure 5-26.–Assessments of safety to eat Pacific herring, study communities, 2014.
0%
10%
20%
30%
40%
50%
60%
70%
80%
90%
100%
Chenega Bay Cordova Nanwalek Port Graham Tatitlek
Perc
enta
ge o
f hou
seho
lds
Community
Yes No Not sure
Note The percentage of households is based on valid responses, which include only households that use Pacific herring.
316
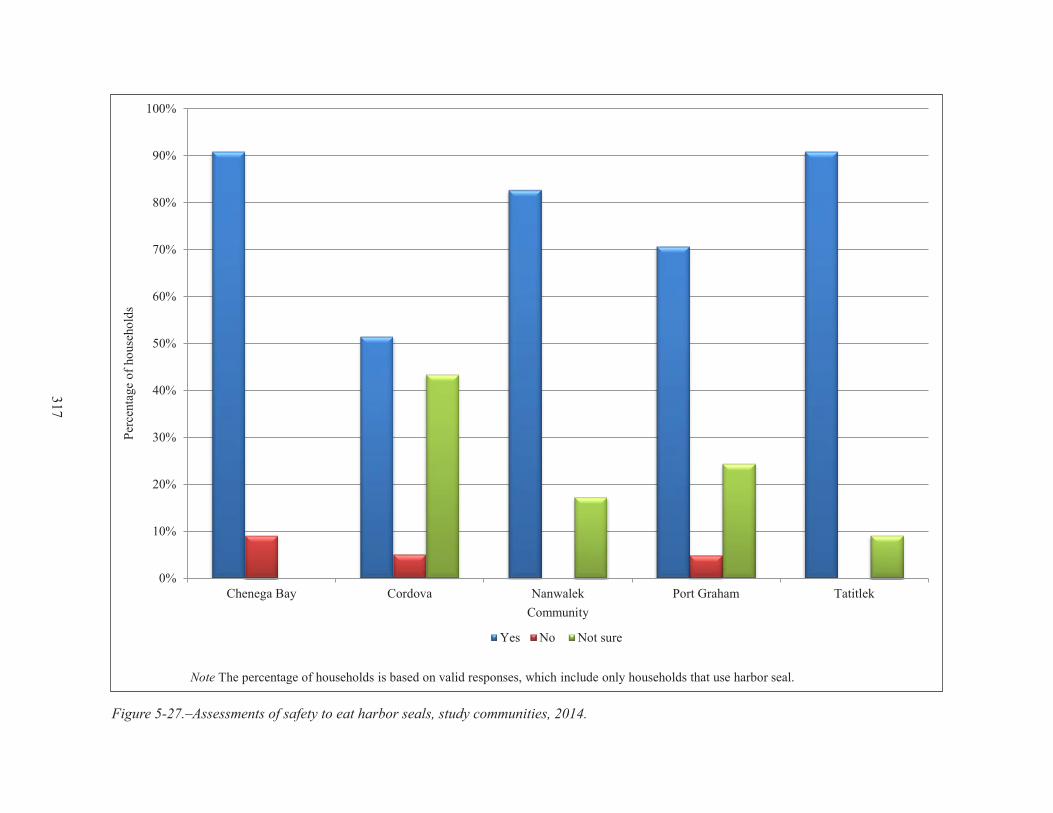
Figure 5-27.–Assessments of safety to eat harbor seals, study communities, 2014.
0%
10%
20%
30%
40%
50%
60%
70%
80%
90%
100%
Chenega Bay Cordova Nanwalek Port Graham Tatitlek
Perc
enta
ge o
f hou
seho
lds
Community
Yes No Not sure
Note The percentage of households is based on valid responses, which include only households that use harbor seal.
317

Figure 5-28.–Households that reported clams are safe to eat, study communities, 1991–1993, 1997, 2003, and 2014.
0%
10%
20%
30%
40%
50%
60%
70%
80%
90%
100%
Chenega Bay Cordova Nanwalek Port Graham Tatitlek
Perc
enta
ge o
f hou
seho
lds
Community
Yes No Not sure
Note The percentage of households is based on valid responses, which include only households that use Pacific herring.
318

Figure 5-29.–Households that reported harbor seals are safe to eat, study communities, 1991–1993, 1997, 2003, and 2014.
0%
10%
20%
30%
40%
50%
60%
70%
80%
90%
100%
Chenega Bay Nanwalek Port Graham Tatitlek
Perc
enta
ge o
f hou
seho
lds t
hat r
espo
nded
har
bor s
eal i
s saf
e to
eat
Community
1991 1992 1993 1997 2003 2014
Note The percentage of households is based on valid responses, which include only households that use harbor seal. Cordova was not includedin this figure because of the relatively small number of harbor seal users in the community.
*
*Tatitlek was not surveyed for 1992; comparison data are not available.
319
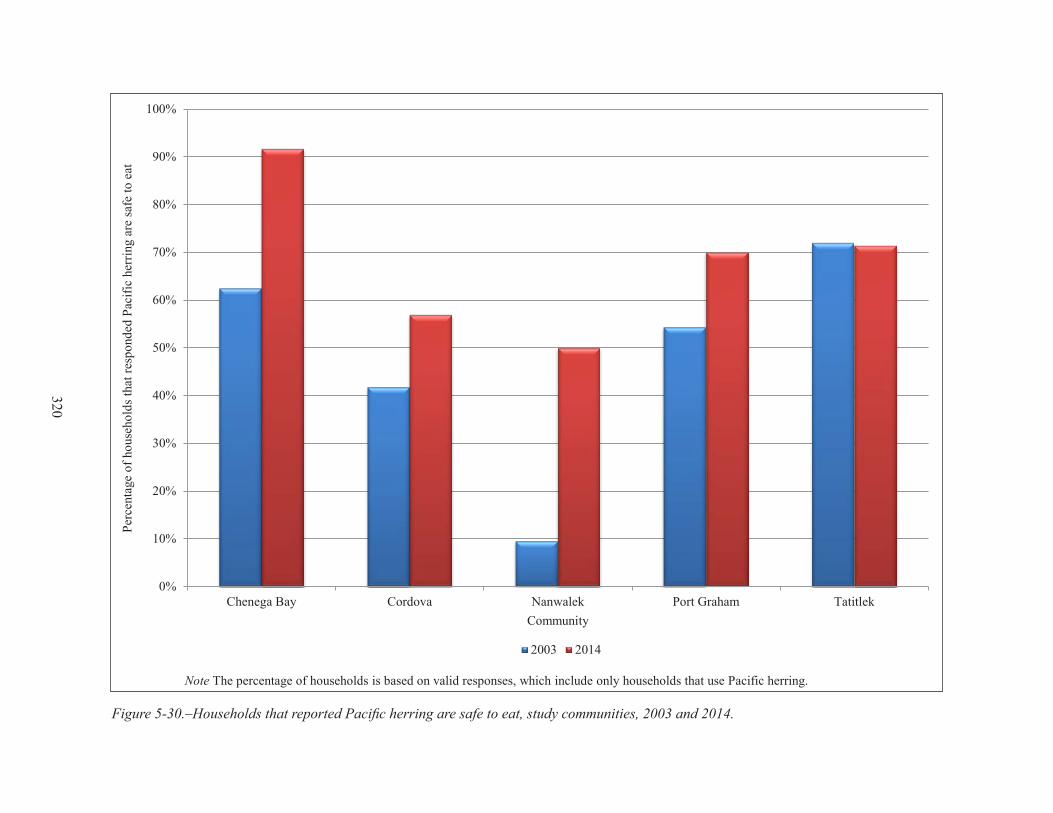
Figure 5-30.–Households that reported Pacific herring are safe to eat, study communities, 2003 and 2014.
0%
10%
20%
30%
40%
50%
60%
70%
80%
90%
100%
Chenega Bay Cordova Nanwalek Port Graham Tatitlek
Perc
enta
ge o
f hou
seho
lds t
hat r
espo
nded
Pac
ific
herr
ing
are
safe
to e
at
Community
2003 2014
Note The percentage of households is based on valid responses, which include only households that use Pacific herring.
320
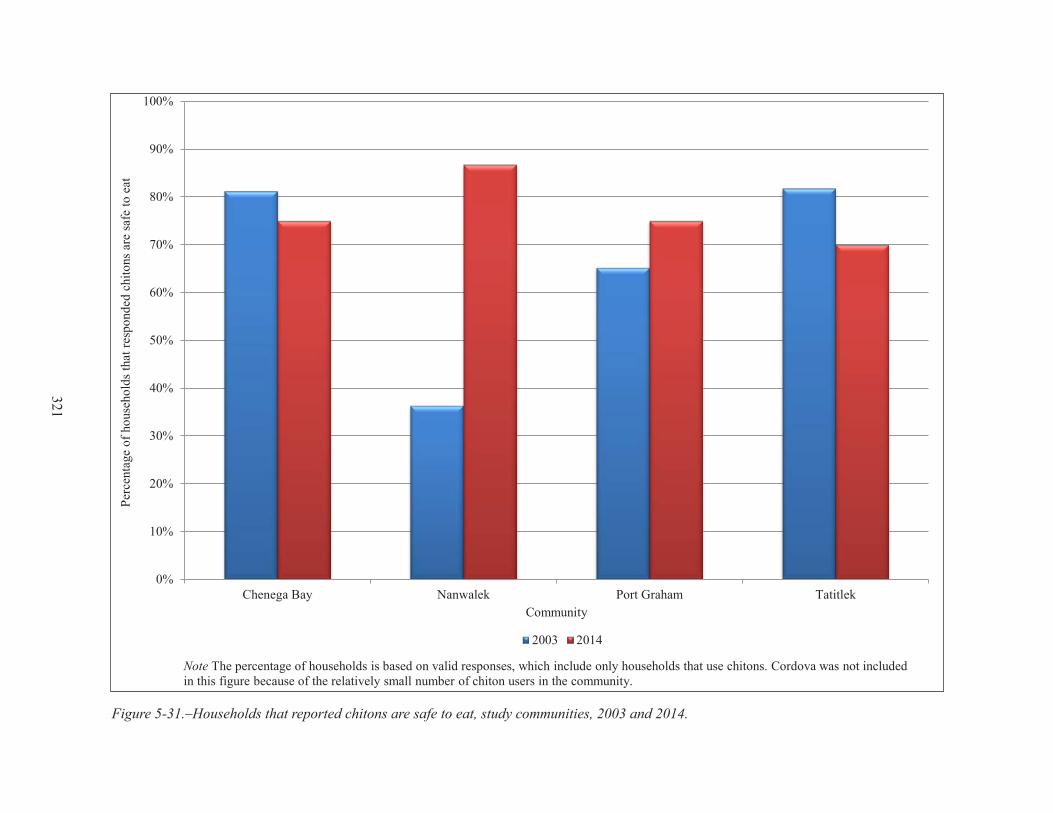
Figure 5-31.–Households that reported chitons are safe to eat, study communities, 2003 and 2014.
0%
10%
20%
30%
40%
50%
60%
70%
80%
90%
100%
Chenega Bay Nanwalek Port Graham Tatitlek
Perc
enta
ge o
f hou
seho
lds t
hat r
espo
nded
chi
tons
are
safe
to e
at
Community
2003 2014
Note The percentage of households is based on valid responses, which include only households that use chitons. Cordova was not includedin this figure because of the relatively small number of chiton users in the community.
321

Figure 5-32.–Percentage of households that reported resource was not safe to eat, and the percentage that attributed lack of food safety to oil spill contamination, study communities combined, 2014.
0%
10%
20%
30%
40%
50%
60%
70%
80%
90%
100%
Pacific herring Harbor seal Chitons Clams Any
Perc
enta
ge o
f hou
seho
lds
Resource
Not safe Not safe due to EVOS contamination
Note The percentage of households is based on valid responses, which include only those households that use the resource .
322

Figure 5-33.–Households that reported young adults are learning enough subsistence skills, study communities, 1991, 1997, 2003, and 2014.
0%
10%
20%
30%
40%
50%
60%
70%
80%
90%
100%
Chenega Bay Cordova Nanwalek Port Graham Tatitlek
Perc
enta
ge o
f hou
seho
lds t
hat r
espo
nded
: "Y
es, y
outh
are
lear
ning
eno
ugh
subs
iste
nce
skill
s."
Community
1991 1997 2003 2014
Note The percentage of households is based on valid responses, which include only households that responded "yes" or "no" when asked ifyouth are learning enough subsistence skills.
*No valid responses indicated youth were learning enough subsistence skills.
*
323

Figure 5-34.–Reasons why young adults are not learning enough subsistence skills, study communities combined, 2003 and 2014.
0% 5% 10% 15% 20% 25% 30% 35% 40% 45%
Technology and modernization
Economics
Decline in resources
Subsistence uses impeded
No time
Too much else to do
Change in community way of life
Lack of teachers
Kids have no interest
Percentage of households that cited reason for why youth are not learning enough subsistence skills
Cite
d re
ason
s for
why
you
th a
re n
ot le
arni
ng e
noug
h su
bsis
tenc
e sk
ills
2003 2014
Note The percentage of households is based on valid responses, which include households that responded "no" when asked if youth are learning subsistence skills and also provided a reason for why.
324
was cited by 24% of respondents in 2014. Other frequent explanations in both 2003 and 2014 were lack of teachers and a change in the community way of life.The second question addressing the status of the subsistence way of life asked if the role of elders in teaching subsistence skills and values in the community had changed over the last 10 years. In all 5 study communities, the most respondents said elders’ influence had decreased, ranging from 48% in Cordova and Port Graham to 91% in Chenega Bay (Figure 5-35). The percentage of respondents saying that elders’ influence has declined rose notably from the 2003 results in Chenega Bay, Cordova, and Nanwalek, and remained at about 50% in Port Graham and Tatitlek (Figure 5-36). In both 2003 and 2014, a primary reason cited for declining influence of elders was demographic: there are now fewer knowledgeable elders in the communities (Figure 5-37). Cultural change was the second most cited reason for declining elders’ influence. As an example, key respondents in Chenega Bay said that the few elders remaining in the community no longer participate in subsistence activities with youth and the community did not host a culture camp that could facilitate such interactions.Finally, as in the 1997 and 2003 study years, respondents in 2014 were asked if the traditional way of life had been affected by the EVOS and if so, has it recovered. Ideas for assisting in the recovery of the traditional way of life were also solicited. As in past study years, a large majority of respondents in 2014 who offered a “yes” or “no” response said that the traditional way of life had been injured by the spill, although the percentage saying “yes” was lower than 2003 in every community but Chenega Bay, where every respondent in all 3 study years said yes (Figure 5-38).3 Also, as in past years, most respondents said that recovery of the traditional way of life has not occurred, ranging from 52% in Port Graham to 79% in Tatitlek (Figure 5-39). There was a slight drop in the percentage of “no” responses in Cordova, Nanwalek, and Tatitlek, and a larger drop in Port Graham. The top action recommended in 2014 to restore the traditional way of life was more education and spirit camps at 15% of respondents, up from 8% in 2003 (Figure 5-40). Other frequent responses included restoring resource populations (8%), more time (8%), removing the remaining oil (6%), and more involvement of elders in community life (6%). However, 14% of respondents said that nothing can be done to restore the traditional way of life, up from 5% of respondents in 2003.
concluSionS: the StatuS oF the recovery oF SuBSiStence uSeS in 2014As noted at the beginning of this chapter, applying the EVOSTC’s recovery objective for subsistence entails addressing 3 questions: what is the status of natural resources; do people believe that resources are safe to eat; and have the cultural values associated with subsistence uses been reintegrated into community life? This section addresses each of these questions, in turn, by first summarizing the findings related to each from the 2003 study (Fall 2006:393–394) and then adding information from the 2014 study to supplement or modify the earlier conclusions. It is also important to reiterate an observation offered at the outset of this chapter: that with time, there is increasing difficulty in linking trends in demographic, cultural, social, and economic conditions in the study communities wholly or in part to the lingering effects of the EVOS within “the total environment of change.”
Question One: Are resources used for subsistence purposes healthy, and are their populations at pre-spill levels? Evidence from the 2003 study that subsistence uses were recovering based on the status of resource populations and levels of subsistence harvests and uses included rebounding harvest levels and diversity of uses that matched or exceeded pre-spill estimates. Evidence not in support of recovery included the long list of injured natural resources in the “not recovered” or “recovery unknown” categories; respondents’ reports of lower subsistence uses; and respondents’ views that injured natural resources had not recovered (Fall 2006:393).
3. A possible explanation for the decline in “yes” responses is that some respondents interpreted the question to ask if the tradi-tional way of life was still affected by the EVOS.
325

Figure 5-35.–Assessments of the influence of elders, study communities, 2014.
0%
10%
20%
30%
40%
50%
60%
70%
80%
90%
100%
Chenega Bay Cordova Nanwalek Port Graham Tatitlek
Perc
enta
ge o
f hou
seho
lds
Community
Increased Same Decreased
Note The percentage of households is based on valid responses, which include only households that answered the question.
326

Figure 5-36.–Households that reported influence of elders decreased, study communities, 2003 and 2014.
0%
10%
20%
30%
40%
50%
60%
70%
80%
90%
100%
Chenega Bay Cordova Nanwalek Port Graham Tatitlek
Perc
enta
ge o
f hou
seho
lds t
hat i
ndic
ated
eld
ers'
influ
ence
dec
reas
ed
Community
2003 2014
Note The percentage of households is based on valid responses, which include only households that answered the question.
327

Figure 5-37.–Reasons why the influence of elders decreased, study communities combined, 2003 and 2014.
0% 10% 20% 30% 40% 50% 60%
Economic
Social/political
Elders less active
Cultural
Demographic
Percentage of households that cited reason for why elders' influence has decreased
Cite
d re
ason
s for
why
eld
ers'
influ
ence
has
dec
reas
ed
2003 2014
Note The percentage of households is based on valid responses, which include households that indicated elders' influence decreasedand also provided a reason for why.
328

Figure 5-38.–Assessments that the traditional way of life was affected by the oil spill, study communities, 1997, 2003, and 2014.
0%
10%
20%
30%
40%
50%
60%
70%
80%
90%
100%
Chenega Bay Cordova Nanwalek Port Graham Tatitlek
Perc
enta
ge o
f hou
seho
lds t
hat r
espo
nded
: "Y
es, t
he sp
ill a
ffect
ed th
e tra
ditio
nal w
ay o
f lif
e."
Community
1997 2003 2014
Note The percentage of households is based on those households that responded "yes" or "no," when asked if the traditional way of life was affected by the oil spill.
329
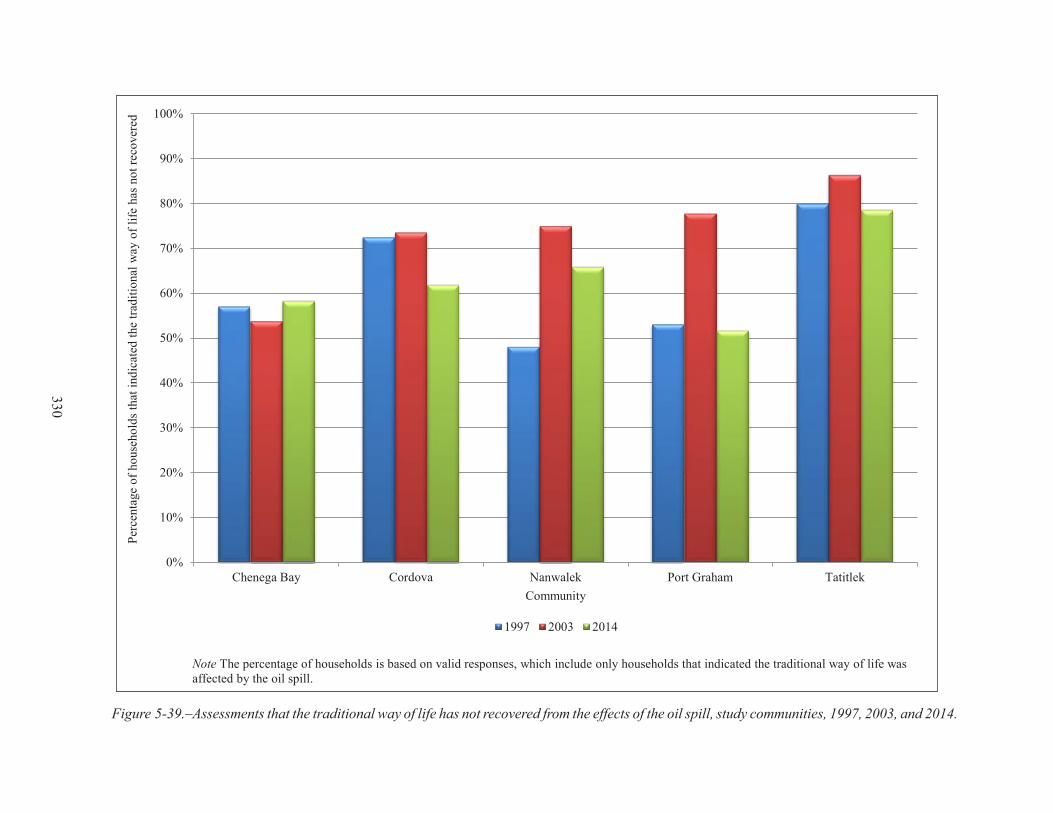
Figure 5-39.–Assessments that the traditional way of life has not recovered from the effects of the oil spill, study communities, 1997, 2003, and 2014.
0%
10%
20%
30%
40%
50%
60%
70%
80%
90%
100%
Chenega Bay Cordova Nanwalek Port Graham Tatitlek
Perc
enta
ge o
f hou
seho
lds t
hat i
ndic
ated
the
tradi
tiona
l way
of l
ife h
as n
ot re
cove
red
Community
1997 2003 2014
Note The percentage of households is based on valid responses, which include only households that indicated the traditional way of life was affected by the oil spill.
330

Figure 5-40.–Suggestions for helping the recovery of the traditional way of life, study communities combined, 2003 and 2014.
0% 2% 4% 6% 8% 10% 12% 14% 16%
Involve elders more
More time
Nothing can be done
More education and spirit camps
Stop cash distributions
Take legal and political action
Continue impact studies
Remove the oil
Create jobs
Respond to social disruptions
Restore resource populations
Percentage of households that cited a way to help the traditional way of life recover
Cite
d re
ason
s for
wha
t cou
ld h
elp
the
tradi
tiona
l way
of l
ife re
cove
r
2003 2014
Note The percentage of households is based on valid responses, which include households that indicated the traditional way of life was affected by the oil spill, that it has not recovered, and also provided a suggestion for how to assist in the recovery of the traditional way of life.
331
• Based on the findings from the 2014 research, evidence that subsistence uses are recovering based on the status of natural resources and subsistence uses includes the following:
• Relatively high levels of harvests of a variety of resources;
• Widespread participation in harvest activities;
• Frequent sharing of fish and wildlife harvests;
• Harvests in 2014 were within the range of post-spill levels; and
• An increase in the number of resources classified as recovered or likely recovered by the EVOSTC; only 4 still classified as not recovering.
Potential evidence that subsistence uses are not fully recovered based on this criterion includes the following:
• Harvests in 2014 were down substantially from 2003, down from post-spill averages, and down from pre-spill estimates;
• A much lower diversity of resource uses in all study communities compared to pre-spill averages and post-spill averages from 1991 through 2003;
• A drop in the percentage of households receiving and giving away wild resources and the average number of resources received and given away per household;
• Many households reported their uses of wild resources were down in 2014 compared to other recent years;
• Respondents overall said some natural resources have not recovered and, for many, depleted Pacific herring stocks are evidence of continuing EVOS effects; and
• Availability to harvest is also low for some resources.
As noted, however, this potential evidence of a lack of a full recovery from EVOS effects, which cites changes in harvest and use patterns and natural resource conditions, is very likely not solely related to the EVOS and some changes might not be connected to EVOS conditions at all. For example, as explanations for lower harvests and uses, respondents cited personal reasons, work commitments, and general lower levels of effort as often, or more often, than natural resource conditions, and few directly cited spill effects as a single or primary cause to changing subsistence patterns. For example, respondents in Chenega Bay, Cordova, and Tatitlek linked heavy snowfalls that reduced deer populations to lower deer harvests. Respondents in Nanwalek and Port Graham attributed lower subsistence Pacific halibut harvests to increased pressure from sport fishing charter operations, and in Chenega Bay and Nanwalek, respondents discussed competition between subsistence salmon fisheries and commercial fisheries. Nanwalek residents are concerned about the effects of erosion on the sockeye salmon stocks of the English Bay River, which they attribute to both climate change and road and trail development. Rising costs of equipment and fuel inhibit or limit harvest effort in all the study communities. A drop in involvement in commercial fisheries in several communities has also affected access to harvest areas and equipment as well as a source of cash income linked to local resources.Respondents in Nanwalek and Port Graham discussed an overall decline in populations of marine invertebrates that they attributed to a variety of factors. For them, commercial overharvests are linked to scarcities of crab, and rebounding sea otter populations have resulted in a decline in clams. Smaller and fewer chitons are, in the view of key respondents, the result of a combination of factors: sea otters, local overharvest, water pollution (from Cook Inlet oil and gas productions, for example), and EVOS effects.
332
There is a concern about the effect of warming water temperatures on marine invertebrate populations in general. Local depletions result in higher costs to travel to more productive areas or families curtailing harvest activities.In several communities, respondents linked lower and less diverse subsistence harvests and uses to a lack of interest and effort on the part of younger generations. These observations also illustrate how changes initiated or exacerbated by the EVOS have in subsequent decades intertwined with other causes of change. For example, a key respondent pointed out the challenges faced by the newly re-founded community of Chenega Bay in the 1980s: many elders had died when the old village was destroyed in 1964 and a generation grew up with little direct knowledge of the traditional harvest areas or resources. As the community struggled to reestablish its traditions, the EVOS cast doubt on the safety of subsistence foods and threatened populations of key resources. These natural resource conditions coupled with improved transportation infrastructure (ferry docks, fast ferries, a new airstrip at Chenega Bay), made travel to urban areas and purchase of commercial foods viable options to subsistence harvests for residents of Prince William Sound communities. In Nanwalek and Port Graham, too, respondents noted that local resource scarcities (e.g., clams and chitons), whether caused by the EVOS or not, have disrupted the transmission of essential skills, values, and food preferences across generations. In Nanwalek, an elder also offered that post-EVOS cash income resulted in more individualized harvest activities with a consequent decline in collaboration, sharing, and multi-generational transmission of knowledge.
Question Two: Are people confident that resources are safe to eat? Evidence from the 2003 study that subsistence uses were recovering based on food safety issues included improved confidence in the safety of eating chitons, Pacific herring, and harbor seals. However, confidence in eating clams remained low, and some respondents suspected that increasing incidents of PSP were related to conditions created by the oil spill (Fall 2006:394).Based on the findings from the 2014 survey, evidence that subsistence uses are recovering based on food safety issues includes the following:
• Most respondents expressed confidence in the safety of using subsistence foods, and this level of confidence has increased; and
• Few respondents pointed to EVOS contamination as a source of concern about food safety.
Potential evidence that subsistence uses are not fully recovered based on this criterion includes the following:
• Small but notable portions of respondents expressed concerns about food safety, especially related to Pacific herring and clams;
• Some key respondents wondered if lingering EVOS contamination concerns were not voiced due to a strong preference for eating traditional foods (such as clams); and
• EVOS contamination was commonly cited as a cause of food safety issues among those who did express a concern.
In summary, while a suspicion of EVOS-caused food safety issues remains among a small segment of the study communities’ population, a strong majority expressed confidence in subsistence food safety and this confidence has continued to grow. Nevertheless, community residents are aware of pockets of residual oil within their traditional use areas. Respondents also expressed broader concerns about potential food safety issues, such as radiation contamination on fish from the Fukushima Daiichi nuclear accident in Japan and the effects of warming ocean temperatures on bivalves.
333

Question Three: Have the cultural values associated with subsistence uses been reintegrated into community life? Evidence from the 2003 study that subsistence uses related to cultural values connected to subsistence uses were recovering included frequent sharing of subsistence foods and a majority of respondents in some study communities having the opinion that youth were learning subsistence skills. Evidence that subsistence was not fully recovered included common reports that youth were not learning subsistence skills, that elders’ influence was declining, and that the traditional way of life had not recovered (Fall 2006:394). Based on the findings from 2014, evidence that subsistence uses are recovering based upon reintegration of values into community life includes the following:
• Majorities in some communities reported youth are learning subsistence skills; and
• Most households received and gave away wild resources.
Potential evidence that subsistence uses are not fully recovered based on this criterion includes the following:
• Many survey respondents stated that youth are not learning subsistence skills;
• Many respondents said elders’ influence continues to decline; and
• Few respondents said the traditional way of life has recovered.
In summary, the study results point to the same conclusion as in 2003, in supporting the EVOSTC’s assessment that, as an injured natural resource service, subsistence uses are “recovering” but not fully recovered. While the majority of injured natural resources have recovered or are recovering from the conditions created by the EVOS, cultural recovery in the communities of the spill area is ongoing, and takes place within a broad array of other sociocultural and environmental factors.
concluSionS
The last overview of subsistence uses in EVOS area communities, pertaining to the 2003 study year, concluded that
Conditions in the natural, economic, and social environments have changed significantly for the residents of the area affected by the spill since 1989. Some of these changes are direct consequences of the oil spill, while the link for others is less certain. This study has shown that despite these changes, subsistence uses of natural resources remain key to the health and well-being of these communities. (Fall 2006:396)
The same conclusion applies to the findings for 2014 summarized in this report. Subsistence harvests remain an important source of food in the study communities, include a wide range of species, are frequently shared, and provide a context for expressing and sharing the skills and values intimately linked to centuries-old traditions and future cultural survival.However, the study also documented relatively low harvests compared to other post-spill years for all 5 communities. Subsistence uses were also less diverse in 2014 than in any study years except for the first 2 years after spill. Also, many respondents stated that youth are not learning subsistence skills, elders are not engaged to transmitting essential knowledge and values, many natural resource populations have declined or are difficult to access, and the traditional way of life has not recovered from the effects of the EVOS.Certainly, subsistence harvests vary from year to year for a variety of reasons. Given that harvest estimates for 2014 were the first in the study communities since 2003, it would be premature to conclude that the findings signify a trend. However, there were lower and less diverse harvests in all 5 study communities in 2014, which were generally consistent with respondents’ evaluations. As discussed, respondents also cited a range of explanations for changing subsistence uses. The EVOS initiated or contributed to a set
334
of environmental, economic, and sociocultural conditions that are now part of the “total environment of change” for each study community. It is not possible to completely factor out EVOS effects from this broader set of conditions; nor is this necessary in order to support community resilience and well-being. As the study for 2003 concluded, a return to pre-spill conditions is impossible for spill-area communities and is not the appropriate measure of recovery (Fall 2006:396–397). A viable future for these communities will be based on meaningful involvement in natural resource management, opportunities in the cash and subsistence sectors of the local economies, and the transmission of skills and knowledge across generations.We end this report with a few suggestions for potential actions to include local communities in post-EVOS restoration efforts as well as to build for their future. First, the communities themselves need to identify the most critical issues to address in future projects. Direct involvement by local residents in such projects is essential to build skills, share knowledge, and foster a sense of ownership and optimism. Given the strong concern about the role of elders and the lack of involvement of youth in subsistence activities, additional support for cultural camps and other ways to engage elders with youth is needed. More broadly, programs that assist community residents to participate in fishing, hunting, and gathering activities across the areas traditionally used for subsistence activities could be designed to support both the subsistence and cash sectors of the local mixed economies. Finally, long-term monitoring of natural resource populations as well as the effected human populations needs to be supported in the future.
335
336
REFERENCES CITED
ADLWD (Alaska Department of Labor and Workforce Development). 2015. Population of Alaska by economic region, borough and census area, 2010–2014. State of Alaska Department of Labor and Workforce Development, Research and Analysis Homepage: Population: Juneau. http://laborstats.alaska.gov/pop/popest.htm
Alaska Department of Labor and Workforce Development. 2014. Population by age and sex for Alaska cities and census designated places (CDPs) with a population of 1,000 or more, 2010 to 2014.http://laborstats.alaska.gov/pop/popest.htm
2015. Alaska population estimates by borough, census area, city, and census designated place (CDP), 2010–2014.http://laborstats.alaska.gov/pop/popest.htm
Association of Canadian Universities for Northern Studies. 2003. Ethical principles for the conduct of research in the North. The Association = L’Association: Ottawa. ISBN 0-921421-10-9
Bickel, G., M. Nord, C. Price, W. Hamilton, and J. Cook. 2000. Guide to Measuring Household Food Security, Revised 2000. U.S. Department of Agriculture, Food and Nutrition Service: Alexandria, VA.
Botz, J., T. Sheridan, A. Wiese, S. Moffitt, and R. Brenner. 2014. 2013 Prince William Sound area finfish management report. Alaska Department of Fish and Game Divisions of Sport Fish and Commercial Fisheries, Fishery Management Report No. 14-43: Anchorage. http://www.adfg.alaska.gov/FedAidPDFs/FMR14-43.pdf
Coates, J. 2004. Experience and expression of food security across cultures: practical implications for valid measurement. Food and Nutrition Technical Assistance Project, FHI 360: Washington, D.C.
Coates, J., E.A. Frongillo, B.L. Rogers, P. Webb, P.E. Wilde, and R. Houser. 2006. Commonalities in the experience of household food insecurity across cultures: what are measures missing? Journal of Nutrition 136(5), page 1438S–1448S.
Cochran, W.G. 1977. Sampling techniques, 3rd edition. John Wiley & Sons: New York.
Coleman-Jensen, A., M. Nord, M. Andrews, and S. Carlson. 2012. Household food security in the United States, 2011. U.S. Department of Agriculture, Economic Research Service, Economic Research Report No. 141: Washington, D.C. http://www.ers.usda.gov/media/884525/err141.pdf
Exxon Valdez Oil Spill Trustee Council. 2002. Exxon Valdez oil spill restoration plan: update on injured resources and services. Exxon Valdez Oil Spill Trustee Council: Anchorage. http://www.evostc.state.ak.us/static/PDFs/2002IRSUpdate.pdf
2004. 2004 annual report: restoring the resources injured by the Exxon Valdez oil spill, understanding the environmental change in the northern Gulf of Alaska. Exxon Valdez Oil Spill Trustee Council: Anchorage. http://www.evostc.state.ak.us/Universal/Documents/Publications/AnnualStatus/2004AnnualReport.pdf
2014. Exxon Valdez oil spill restoration plan: 2014 update on injured resources and services. Exxon Valdez Oil Spill Trustee Council: Anchorage. http://www.evostc.state.ak.us/static/PDFs/2014IRSUpdate.pdf
Fall, J.A., editor. 1997. Subsistence harvests and uses in seven Gulf of Alaska communities in the second year following the Exxon Valdez oil spill. Alaska Department of Fish and Game Division of Subsistence, Technical Paper No. 218: Juneau. http://www.adfg.alaska.gov/techpap/tp218.pdf
1999a. “Patterns of subsistence uses of fish and wildlife resources in the area of the Exxon Valdez oil spill” [in] L.J. Field, J.A. Fall, T.S. Nighswander, N. Peacock, and U. Varanasi, editors. Evaluating and communicating subsistence seafood safety in a cross-cultural context: lessons learned from the Exxon Valdez oil spill. Society of Environmental Toxicology and Chemistry (SETAC): Pensacola, Fla. ISBN 978-1-880611-29-6
1999b. “Changes in subsistence uses of fish and wildlife resources following the Exxon Valdez oil spill” [in] L.J. Field, J.A. Fall, T.S. Nighswander, N. Peacock, and U. Varanasi, editors. Evaluating and communicating subsistence seafood safety in a cross-cultural context: lessons learned from the Exxon Valdez oil spill. Society of Environmental Toxicology and Chemistry (SETAC): Pensacola, Fla. ISBN 978-1-880611-29-6
337
1999c. Subsistence, Restoration Notebook. Exxon Valdez Oil Spill Trustee Council: n.p. http://www.evostc.state.ak.us/Universal/Documents/Publications/RestorationNotebook/RN_subsist.pdf
2006. Update of the status of subsistence uses in Exxon Valdez oil spill area communities, 2003. Alaska Department of Fish and Game Division of Subsistence, Technical Paper No. 312: Juneau. http://www.adfg.alaska.gov/techpap/tp312.pdf
Fall, J.A. and L.J. Field. 1996. “Subsistence uses of fish and wildlife before and after the Exxon Valdez oil spill” [in] S.D. Rice, R.B. Spies, D.A. Wolfe, and B.A. Wright, editors. Proceedings of the Exxon Valdez oil spill symposium: American Fisheries Society Symposium 18. American Fisheries Society: Bethesda, Md.
Fall, J.A. and D.S. Koster. 2014. Subsistence harvests of Pacific halibut in Alaska, 2012. Alaska Department of Fish and Game Division of Subsistence, Technical Paper No. 388: Anchorage. http://www.adfg.alaska.gov/techpap/TP388.pdf
Fall, J.A. and T. Lemons. 2016. Subsistence harvests of Pacific halibut in Alaska, 2014. Alaska Department of Fish and Game Division of Subsistence, Technical Paper No. 414: Anchorage. http://www.adfg.alaska.gov/techpap/TP414.pdf
Fall, J.A., R. Miraglia, W. Simeone, C.J. Utermohle, and R.J. Wolfe. 2001. Long-term consequences of the Exxon Valdez oil spill for coastal communities of Southcentral Alaska. Alaska Department of Fish and Game Division of Subsistence, Technical Paper No. 264. http://www.adfg.alaska.gov/techpap/tp264.pdf
Fall, J.A., L. Stratton, P. Coiley, L. Brown, C.J. Utermohle, and G. Jennings. 1996. Subsistence harvests and uses in Chenega Bay and Tatitlek in the year following the Exxon Valdez oil spill. Alaska Department of Fish and Game Division of Subsistence, Technical Paper No. 199: Juneau. http://www.adfg.alaska.gov/techpap/tp199.pdf
Fall, J.A. and C.J. Utermohle editors. 1995a. An investigation of the sociocultural consequences of outer continental shelf development in Alaska, U.S. Minerals Management Service, Alaska Outer Continental Shelf Region Study MMS 95-010, Technical Report No. 160. Alaska Department of Fish and Game Division of Subsistence: Anchorage.
1995b. An investigation of the sociocultural consequences of outer continental shelf development in Alaska, Volume II. Prince William Sound. U.S. Department of the Interior Minerals Management Service, Alaska OCS Region, Social and Economic Studies Unit, OCS Study MMS 95-011, Technical Report No. 160: Anchorage. http://www.boem.gov/BOEM-Newsroom/Library/Publications/1995/95_011.aspx
1999. Subsistence harvests and uses in eight communities ten years after the Exxon Valdez oil spill. Alaska Department of Fish and Game Division of Subsistence, Technical Paper No. 252: Juneau. http://www.adfg.alaska.gov/techpap/tp252.pdf
Frongillo, E.A. and S. Nanama. 2006. Development and validation of an experience-based measure of household food insecurity within and across seasons in northern Burkina Faso. Journal of Nutrition 136(5), page 1409s–1419s.
Incardona, J.P., M.G. Carls, L. Holland, T.L. Linbo, D.H. Baldwin, M.S. Myers, K.A. Peck, M. Tagal, S.D. Rice, and N.L. Scholz. 2015. Very low embryonic crude oil exposures cause lasting cardiac defects in salmon andherring. Scientific Reports 5, page 13499. ISSN 2045-2322 10.1038/srep13499. http://www.nature.com/articles/srep13499
Melgar-Quinonez, H.R., A.C. Zubieta, B. MkNelly, A. Nteziyaremye, M.F.D. Gerardo, and C. Dunford. 2006.Household Food Insecurity and Food Expenditure in Bolivia, Burkina Faso, and the Philippines. Journal of Nutrition 136(5), page 1431S–1437S.
Moerlein, K.J. and C. Carothers. 2012. Total environment of change: Impacts of climate change and social transitions on subsistence fisheries in Northwest Alaska. Ecology and Society 17(1), page 10.
Nielsen, N.J. 1984. From fish and copper, Cordova’s heritage and buildings. Cordova Historical Society: Cordova.
Nord, M., M. Andrews, and S. Carlson. 2008. Household food security in the United States, 2007. Department of Agriculture, Economic Research Service, ERR-66: Washington, D.C.
338
Pérez-Escamilla, R., A.M. Segall-Corrêa, L.K. Maranha, M. de F.A. Sampaio, L. Marín-León, and G. Panigassi.2004. An adapted version of the U.S. Department of Agriculture food insecurity module is a valid tool for assessing household food insecurity in Campinas, Brazil. Journal of Nutrition 134(8), pages 1923–1928.
Rumble, J., M. Wessel, E. Russ, K.J. Goldman, R.L. Gustafson, and C. Russ. 2014. Cook Inlet and Prince William Sound area management report for Tanner and king crab fisheries through 2013. Alaska Department of Fish and Game Divisions of Sport Fish and Commercial Fisheries, Fishery Management Report No. 14-08: Anchorage. http://www.adfg.alaska.gov/FedAidPDFs/FMR14-08.pdf
Sherman, C.R. 2012. Cordova, Images of America. Arcadia Publishing: Charleston, SC.
Simeone, W.E. and R.A. Miraglia. 2000. An ethnography of Chenega Bay and Tatitlek, Alaska. Alaska Department of Fish and Game Division of Subsistence, Special Publication No. SP2000-001: Anchorage. http://www.adfg.alaska.gov/specialpubs/SP2_SP2000-001.pdf
Stratton, L. 1989. Resource uses in Cordova, a coastal community of Southcentral Alaska. Alaska Department of Fish and Game Division of Subsistence, Technical Paper No. 153. http://www.adfg.alaska.gov/techpap/tp153.pdf
1990. Resource harvest and use in Tatitlek, Alaska. Alaska Department of Fish and Game Division of Subsistence,Technical Paper No. 181: Anchorage. http://www.adfg.alaska.gov/techpap/tp181.pdf
1992. Cordova: A 1988 update on resource harvests and uses. Alaska Department of Fish and Game Division of Subsistence, Technical Paper No. 204: Juneau. http://www.adfg.alaska.gov/techpap/tp204.pdf
Stratton, L. and E.B. Chisum. 1986. Resource use patterns in Chenega, western Prince William Sound: Chenega in the 1960s and Chenega Bay 1984-1986. Alaska Department of Fish and Game Division of Subsistence, Technical Paper No. 139: Anchorage. http://www.adfg.alaska.gov/techpap/tp139.pdf
Swindale, A. and P. Bilinsky. 2006. Development of a universally applicable household food insecurity measurement tool: process, current status, and outstanding issues. Journal of Nutrition 136(5), page 1449S–1452S.
U.S. Census Bureau. n.d. 2010 Decennial Census and American Community Survey data. U.S. Census Bureau American FactFinder Homepage: Washington, D.C. http://factfinder2.census.gov/faces/nav/jsf/pages/index.xhtml
2001. 2000 census. U.S. Census Bureau: Washington, D.C. http://factfinder2.census.gov/faces/nav/jsf/pages/index.xhtml
2011. 2010 census. U.S. Census Bureau: Washington, D.C.http://factfinder2.census.gov/faces/nav/jsf/pages/index.xhtml
Webb, P., J. Coates, E.A. Frongillo, B.L. Rogers, A. Swindale, and P. Bilinsky. 2006. Measuring household food insecurity: why it’s so important and yet so difficult to do. Journal of Nutrition 136(5), page 1404s–1408s.
Wessel, M., M. Thalhauser, K.J. Goldman, X. Zhang, P.A. Hansen, J. Rumble, and C. Russ. 2015. Prince William Sound shrimp pot fisheries, 2010–2014. Alaska Department of Fish and Game Divisions of Sport Fish and Commercial Fisheries, Special Publication No. 15-03: Anchorage. http://www.adfg.alaska.gov/FedAidPDFs/SP15-03.pdf
Wessel, M., C.E. Trowbridge, and C. Russ. 2012. Prince William Sound area management report for dungeness crab, shrimp, and miscellaneous shellfish fisheries 2011. Alaska Department of Fish and Game Divisions of Sport Fish and Commercial Fisheries, Fishery Management Report No. 12-05: Anchorage. http://www.adfg.alaska.gov/FedAidPDFs/FMR12-05.pdf
Wolfe, R.J., J.A. Fall, and M. Riedel. 2009. The subsistence harvest of harbor seals and sea lions by Alaska Natives in 2008. Alaska Department of Fish and Game Division of Subsistence, and the Alaska Native Harbor Seal Commission, Technical Paper No. 347: Anchorage. http://www.adfg.alaska.gov/techpap/TP347.pdf
Wolfe, R.J. and C. Mishler. 1995. The subsistence harvest of harbor seal and sea lion by Alaska Natives in 1994.Alaska Department of Fish and Game Division of Subsistence, Technical Paper No. 236: Juneau. http://www.adfg.alaska.gov/techpap/tp236.pdf

339
Wunderlich, G.S. and J.L. Norwood. 2006. Food insecurity and hunger in the United States: an assessment of the measure. Panel to review the U.S. Department of Agriculture’s measurement of food insecurity and hunger.Committee on National Statistics, Division of Behavioral and Social Sciences and Education, the National Academies Press: Washington, D.C.

340
APPENDIX A–SURVEY INSTRUMENT (TATITLEK)

341
TATITLEK, ALASKAFrom January 1, 2014 to December 31, 2014
HOUSEHOLD ID:COMMUNITY ID:
INTERVIEWER #1:INTERVIEWER #2:INTERVIEW DATE:
START TIME:STOP TIME:
DATA CODED BY:DATA ENTERED BY:
SUPERVISOR:
photo by Dave WithrowCOOPERATING ORGANIZATIONS
ALASKA DEPARTMENT OF FISH AND GAME
DIVISION OF PUBLIC HEALTH AND SOCIAL SERVICES
EVOS
printed: 2015-02-12
COMPREHENSIVE SUBSISTENCE SURVEY
338 338
907-267-2353 907-269-8000
333 RASPBERRY ROAD 3601 C STREET, SUITE 540ANCHORAGE, AK 99518 ANCHORAGE, AK 99503
This survey is used to estimate wild food harvests and to describe rural community economies. We will publish a short summary report, that will be available to community members. We share this information with the Alaska Department of Fish and Game. We work with the Federal Regional Advisory Councils and with local Fish and Game Advisory Committees to better manage wild food resources. We will NOT identify your household. We will NOT use this information for enforcement. Participation in this survey is voluntary. Even if you agree to be surveyed, you may stop at any time.
Page 1

342
HOUSEHOLD MEMBERS HOUSEHOLD ID
Last year, that is, between January 1, 2014 and December 31, 2014 WHO were the head or heads of your household?
EVOS - Comprehensive Subsistence Survey, 2014
First, I would like to ask about the people in your household, permanent members of your household who live in your house. This includes students who return home every summer. I am NOT interested in people who lived with you temporarily, even if they stayed several months.
2
How OLD is this person?
Where were parents living when this
person was born?
Y N M F Y N
ID #
Is this person answering questions on this
survey?
HEAD 1
How is this person related
to HEAD 1?
Is this person MALE or
FEMALE?
Is this person an ALASKA NATIVE?
(years)(circle)(circle)(relation)(circle) (AK city or state)
HEAD 2 Y N M F Y N
1
PERSON 03 Y N M F Y N
PERSON 04 Y N M F Y N
3
PERSON 05 Y N M F Y N
4
PERSON 06 Y N M F Y N
5
PERSON 07 Y N M F Y N
6
PERSON 08 Y N M F Y N
7
PERSON 09 Y N M F Y N
8
PERSON 10 Y N M F Y N
9
11
PERSON 11 Y N M F Y N
10
How many years has this person lived in
Tatitlek?(number)
NEXT enter spouse or partner. If a household has a SINGLE HEAD, leave HEAD 2 row BLANK and move to PERSON 3.
BELOW, enter children (oldest to youngest), grandchildren, grandparents, or anyone else living full-time in this household.
13
PERSON 13 Y N M F Y N
12
PERMANENT HH MEMBERS: 01 TATITLEK: 338
PERSON 12 Y N M F Y N
Page 2
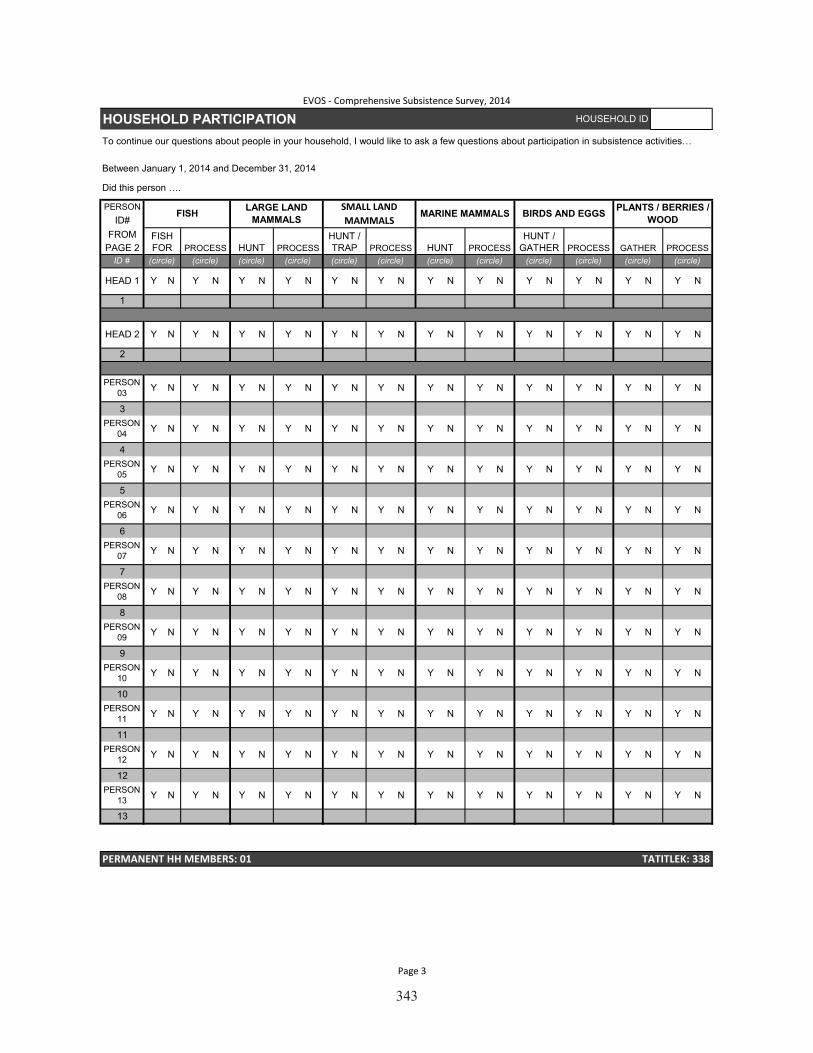
343
HOUSEHOLD ID HOUSEHOLD PARTICIPATION HOUSEHOLD ID
Between January 1, 2014 and December 31, 2014
Did this person ….
PERMANENT HH MEMBERS: 01 TATITLEK: 338
PAGE 2ID #
FROMID#
PERSON
(circle)
FISH
HUNT / GATHER
(circle)PROCESSPROCESS PROCESS
(circle) (circle)PROCESS
(circle)
HUNT / TRAP(circle)
LARGE LAND MAMMALS
SMALL LAND MAMMALS
MARINE MAMMALS BIRDS AND EGGS
Y N Y N Y N
(circle)PROCESS
(circle) (circle)PROCESS
(circle)GATHER
PLANTS / BERRIES / WOOD
1
(circle)HUNT
Y N
(circle)HUNT
Y N Y N Y N Y N Y NY NHEAD 1 Y N Y N
Y N
2
HEAD 2 Y N Y N Y N Y N Y N Y N Y N Y N
Y N Y N Y N Y N Y N
Y N Y N Y N
Y N Y N Y N
Y N Y N Y N Y N Y N Y N
Y N
3
PERSON 03 Y N Y N Y N
Y N Y N Y N Y N
Y N Y N Y N Y N
4
PERSON 04 Y N Y N
Y N Y N
Y N Y N Y N Y N
5
PERSON 05 Y N Y N Y N Y N
Y N Y N Y N Y N
6
PERSON 06 Y N Y N Y N Y N Y N Y N
PERSON 07 Y N Y N Y N Y N Y N Y N Y N Y N
7
Y N Y N Y N Y N Y N
Y N Y N Y N Y N
Y N Y N Y N
Y N Y N Y N Y N
8
PERSON 08 Y N Y N Y N
Y N
Y N Y N Y N Y N
9
PERSON 09 Y N Y N Y N Y N Y N
Y N Y N Y N
10
PERSON 10 Y N Y N Y N Y N Y N Y N Y N
PERSON 11 Y N Y N Y N Y N Y N Y N Y N Y N
11
12
PERSON 12 Y N Y N Y N Y N Y N
Y N Y N Y N Y N Y N Y N
Y N Y N Y NY N Y N Y N
To continue our questions about people in your household, I would like to ask a few questions about participation in subsistence activities…
Y N Y N Y N Y N
13
PERSON 13 Y N Y N
Y N
Y N Y N Y N Y N
Y N
EVOS - Comprehensive Subsistence Survey, 2014
FISH FOR
Page 3
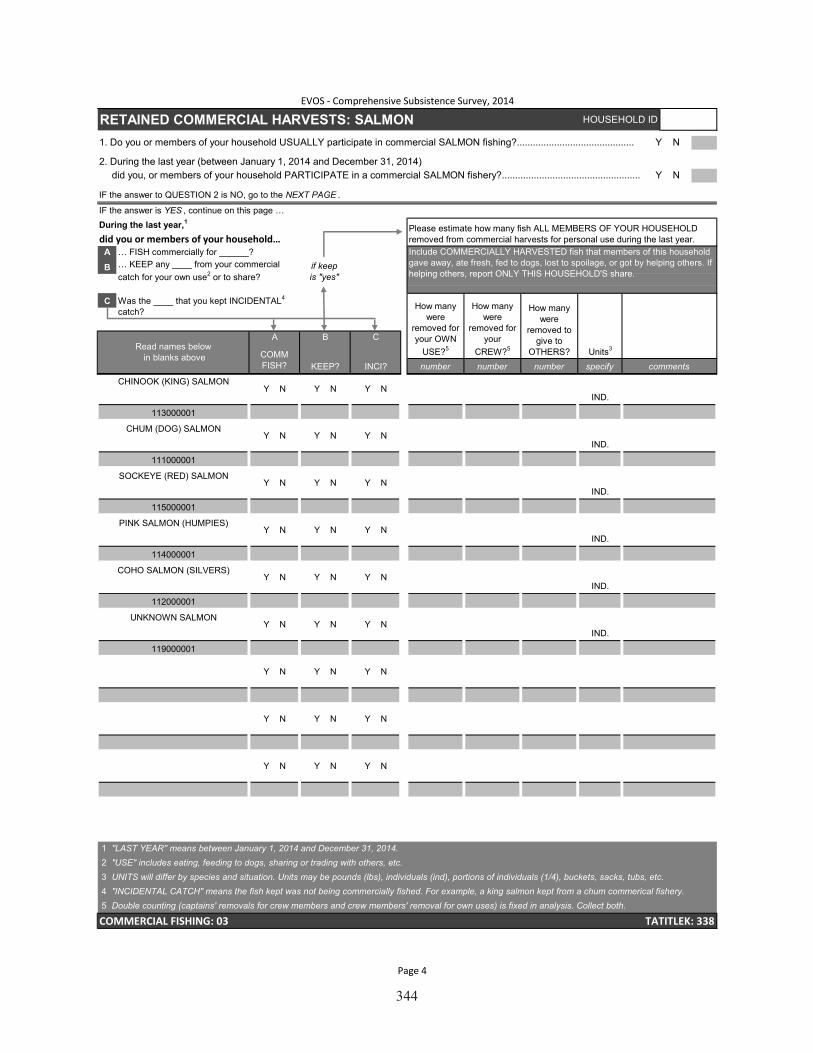
344
RETAINED COMMERCIAL HARVESTS: SALMON HOUSEHOLD ID
1. Do you or members of your household USUALLY participate in commercial SALMON fishing?............................................ Y N
2. During the last year (between January 1, 2014 and December 31, 2014) did you, or members of your household PARTICIPATE in a commercial SALMON fishery?.................................................... Y N
IF the answer is YES , continue on this page …During the last year,1
did you or members of your household…AB … KEEP any ____ from your commercial
catch for your own use2 or to share?
C Was the ____ that you kept INCIDENTAL4
catch?
… FISH commercially for ______?
IND.
A CRead names below
in blanks above COMM FISH? KEEP?
CHINOOK (KING) SALMON
How many were
removed for your OWN
USE?5
How many were
removed for your
CREW?5
111000001
IND.
COMMERCIAL FISHING: 03 TATITLEK: 338
IND.
IND.
SOCKEYE (RED) SALMONY N Y N Y N
IND.Y N Y N Y N
commentsspecifynumbernumbernumber
B
INCI?
How many were
removed to give to
OTHERS? Units3
CHUM (DOG) SALMONY N Y N Y N
IND.
113000001
Include COMMERCIALLY HARVESTED fish that members of this household gave away, ate fresh, fed to dogs, lost to spoilage, or got by helping others. If helping others, report ONLY THIS HOUSEHOLD'S share.
Please estimate how many fish ALL MEMBERS OF YOUR HOUSEHOLD removed from commercial harvests for personal use during the last year.
IF the answer to QUESTION 2 is NO, go to the NEXT PAGE .
if keep is "yes"
EVOS - Comprehensive Subsistence Survey, 2014
Y N Y N
115000001
COHO SALMON (SILVERS)Y N Y N Y N
114000001
PINK SALMON (HUMPIES)Y N
UNKNOWN SALMONY N Y N Y N
112000001
Y N Y N Y N
119000001
Y N Y N Y N
Y N Y N Y N
45
''LAST YEAR'' means between January 1, 2014 and December 31, 2014."USE" includes eating, feeding to dogs, sharing or trading with others, etc.UNITS will differ by species and situation. Units may be pounds (lbs), individuals (ind), portions of individuals (1/4), buckets, sacks, tubs, etc."INCIDENTAL CATCH" means the fish kept was not being commercially fished. For example, a king salmon kept from a chum commerical fishery.Double counting (captains' removals for crew members and crew members' removal for own uses) is fixed in analysis. Collect both.
123
Page 4

345
RETAINED COMMERCIAL HARVESTS: OTHER FISH HOUSEHOLD ID
1. Do you or members of your household USUALLY participate in a commercial fishery for OTHER FISH?................... Y N
2. During the last year (between January 1, 2014 and December 31, 2014) did you, or members of your household PARTICIPATE in a commercial fishery for OTHER FISH?........................... Y N
IF the answer is YES , continue on this page …During the last year,1
did you or members of your household…
EVOS - Comprehensive Subsistence Survey, 2014
IF the answer to QUESTION 2 is NO, go to the NEXT PAGE .
Please estimate how many fish ALL MEMBERS OF YOUR HOUSEHOLD removed from commercial harvests for personal use during the last year.
A … FISH commercially for ______? Include COMMERCIALLY HARVESTED fish that members of this household gave away, ate fresh, fed to dogs, lost to spoilage, or got by helping others. If helping others, report ONLY THIS HOUSEHOLD'S share.
B … KEEP any ____ from your commercial catch for your own use2 or to share?
if keep is "yes"
C Was the ____ that you kept INCIDENTAL4
catch? How many were
removed for your OWN
USE?5
How many were
removed for your
CREW?5
How many were
removed to give to
OTHERS? Units3Read names below in blanks above
A B C
COMM FISH? KEEP? INCI? number number number specify comments
GAL.120200001
HERRINGY N Y N Y N
HERRING SPAWN ON KELP Y N Y N Y NGAL.
120306001
HERRING SAC ROE Y N Y N Y NGAL.
125800001
STURGEON Y N Y N Y NIND.
120304001
LINGCOD Y N Y N Y NIND.
121606001
PACIFIC COD (GRAY) Y N Y N Y NIND.
121004001
SABLEFISH (BLACK COD) Y N Y N Y NIND.
UNKNOWN FLOUNDER Y N Y N Y NIND.
122800001
IND.
121499001
121800001
UNKNOWN SOLE Y N Y N Y N
HALIBUT Y N Y N Y N
2 "USE" includes eating, feeding to dogs, sharing or trading with others, etc.3 UNITS will differ by species and situation. Units may be pounds (lbs), individuals (ind), portions of individuals (1/4), buckets, sacks, tubs, etc.4
123699001
1 ''LAST YEAR'' means between January 1, 2014 and December 31, 2014.
LB.
"INCIDENTAL CATCH" means the fish kept was not being commercially fished. For example, a king salmon kept from a chum commerical fishery.5 Double counting (captains' removals for crew members and crew members' removal for own uses) is fixed in analysis. Collect both.
COMMERCIAL FISHING: 03 TATITLEK: 338
Page 5

346
RETAINED COMMERCIAL HARVESTS: OTHER FISH HOUSEHOLD ID
…. CONTINUED from previous page
During the last year,1
did you or members of your household…
EVOS - Comprehensive Subsistence Survey, 2014
Please estimate how many fish ALL MEMBERS OF YOUR HOUSEHOLD removed from commercial harvests for personal use during the last year.
A … FISH commercially for ______? Include COMMERCIALLY HARVESTED fish that members of this household gave away, ate fresh, fed to dogs, lost to spoilage, or got by helping others. If helping others, report ONLY THIS HOUSEHOLD'S share.B … KEEP any ____ from your commercial
catch for your own use2 or to share?if keep is "yes"
C Was the ____ that you kept INCIDENTAL4
catch? How many were
removed for your OWN
USE?5
How many were
removed for your
CREW?5
How many were
removed to give to
OTHERS? Units3Read names below in blanks above
A B C
specify comments
BLACK ROCKFISHY N Y N Y N
COMM FISH? KEEP? INCI? number number number
IND.(BLACK BASS)122602001
RED ROCKFISH Y N Y N Y NIND.
122699001
UNKNOWN ROCKFISH Y N Y N Y NIND.
122604001
GREENLING (POGIES) Y N Y N Y NIND.
121600001
SHARK Y N Y N Y NIND.
(WHITING)
123299001
WALLEYE POLLOCK Y N Y N Y NIND.
123000001
SCULPIN Y N Y N Y NIND.
121012001
DOLLY VARDEN Y N Y N Y NIND.
125006001
Y N Y N Y N
Y N Y N Y N
Y N Y N Y N
5 Double counting (captains' removals for crew members and crew members' removal for own uses) is fixed in analysis. Collect both.
COMMERCIAL FISHING: 03 TATITLEK: 338
1 ''LAST YEAR'' means between January 1, 2014 and December 31, 2014.2 "USE" includes eating, feeding to dogs, sharing or trading with others, etc.3 UNITS will differ by species and situation. Units may be pounds (lbs), individuals (ind), portions of individuals (1/4), buckets, sacks, tubs, etc.4 "INCIDENTAL CATCH" means the fish kept was not being commercially fished. For example, a king salmon kept from a chum commerical fishery.
Page 6

347
RETAINED COMMERCIAL HARVESTS: MARINE INVERTEBRATES HOUSEHOLD ID
1. Do you or members of your household USUALLY participate in a commercial fishery for MARINE INVERTEBRATES? Y N
2. During the last year (between January 1, 2014 and December 31, 2014) did you, or members of your household PARTICIPATE in a commercial fishery for MARINE INVERTEBRATES? …………………..Y N
IF the answer is YES , continue on this page …During the last year,1
did you or members of your household…
EVOS - Comprehensive Subsistence Survey, 2014
IF the answer to QUESTION 2 is NO, go to the NEXT PAGE .
Please estimate how many fish ALL MEMBERS OF YOUR HOUSEHOLD removed from commercial harvests for personal use during the last year.
A … FISH commercially for ______? Include COMMERCIALLY HARVESTED fish that members of this household gave away, ate fresh, fed to dogs, lost to spoilage, or got by helping others. If helping others, report ONLY THIS HOUSEHOLD'S share.
B … KEEP any ____ from your commercial catch for your own use2 or to share?
if keep is "yes"
C Was the ____ that you kept INCIDENTAL4
catch? How many were
removed for your OWN
USE?5
How many were
removed for your
CREW?5
How many were
removed to give to
OTHERS? Units3Read names below in blanks above
A B C
COMM FISH? KEEP? INCI? number number number specify comments
GAL.500612001
RAZOR CLAMSY N Y N Y N
PACIFIC LITTLENECK CLAMS Y N Y N Y NGAL.(STEAMERS)
500608001
DUNGENESS CRAB Y N Y N Y NIND.
501008991
KING CRAB Y N Y N Y NIND.
501004001
TANNER CRAB Y N Y N Y NIND.
501012991
OCTOPUS Y N Y N Y NIND.
502200001
SHRIMP Y N Y N Y NLB.
Y N Y N Y N
503400001
Y N Y N Y N
3 UNITS will differ by species and situation. Units may be pounds (lbs), individuals (ind), portions of individuals (1/4), buckets, sacks, tubs, etc.4 "INCIDENTAL CATCH" means the fish kept was not being commercially fished. For example, a king salmon kept from a chum commerical fishery.5 Double counting (captains' removals for crew members and crew members' removal for own uses) is fixed in analysis. Collect both.
1 ''LAST YEAR'' means between January 1, 2014 and December 31, 2014.2 "USE" includes eating, feeding to dogs, sharing or trading with others, etc.
Y N Y N Y N
COMMERCIAL FISHING: 03 TATITLEK: 338
Page 7
348
HARVESTS: SALMON HOUSEHOLD ID
1. Do you or members of your household USUALLY fish for salmon ?............................................... Y N
2. During the last year (between January 1, 2014 and December 31, 2014) did you, or members of your household USE or TRY TO HARVEST salmon?........................................................... Y N
IF the answer is YES , continue on this page …
Between January 1, 2014 and December 31, 2014…
Last year…… did your household use LESS, SAME, or MORE salmon than in recent years? ……………………………………………………….
IF LESS or MORE … X = do not useWHY was your use different?
Last year……did your household GET ENOUGH salmon?............................................................................................................................
If NO…What KIND of salmon did you need?
EVOS - Comprehensive Subsistence Survey, 2014
IF the answer to QUESTION 2 is NO, go to the NEXT PAGE .
SET GILL NET
SEINE NET
FISH WHEEL
ROD & REEL
OTHER GEAR (specify type) UNITS
In 2014 HOW MANY _____ DID YOUR HOUSEHOLD HARVEST WITH ….
In 2014 did members of your household …
Please estimate how many salmon ALL MEMBERS OF YOUR HOUSEHOLD HARVESTED in 2014, including with a rod and reel. INCLUDE salmon you gave away, ate fresh, fed to dogs, lost to spoilage, or got by helping others. If fishing with others, report ONLY YOUR SHARE of the catch. Do not include fish caught and released.
GIV
E
AW
AY
?
RE
CE
IVE
?
HA
RV
ES
T?
TRY
TO
H
AR
VE
ST?
US
E?
# of those used
just for dog
food?
(number harvested by each gear type) amount / type specify amt.
CHINOOK (KING) SALMONY N Y N Y N Y N
Read names below (circle)
IND.
113000000
Y N /
111000000
/ IND.CHUM (DOG) SALMON
Y N Y N Y N Y N Y N
SOCKEYE (RED) SALMONY N Y N Y N Y N IND.
115000000
Y N /
114000000
/ IND.PINK SALMON (HUMPIES)
Y N Y N Y N Y N Y N
IND.
112000000
Y N /COHO SALMON (SILVERS)Y N Y N
These columns should include ALL the salmon HARVESTED by members of this household in 2014.
UNKNOWN SALMONY N Y N Y N Y N
Y N Y N
/ IND.
Y N /
LANDLOCKED SALMONY N Y N Y N Y N Y N
SALMON: 04 TATITLEK: 338
How would you describe the impact to your household of not getting enough salmon last year?
119000000
110000000ASSESSMENTS: SALMON
To conclude our salmon section, I am going to ask a few general questions about salmon.
… not noticable?(0)
… minor ?(1)
… major?(2)
… Severe?(3)
116000000
X L S M
Y N
IND.
12
Page 8

349
FISHERY PARTICIPATION HOUSEHOLD ID DON'T ENTER TEXT ON FORM, ENTER TEXT IN GREEN CELLS
SALMON
If the houshold harvested salmon in the previous section, continue this section. If the household did not harvest salmon go to the PARTICIPATION questions below…
Y N PAGE SUBJECT-VERB-RECORD TYPE
If YES …how many members of your household were listed on the permit? (# HH Members)
…were there other people outside of your household listed on the permit? Y N …if yes how many people besides those in your household were listed on the permit? (# outside HH)
…did you share your net with another household? Y N... if yes how many other households? (# Other HH)
If NO …were you listed on another household's permit?.................................................................. Y N
Does your household own a net for harvesting salmon? Y NDoes your houshold own a boat? Y NIf YES what size? (boat size in feet)
Is your boat used for commercial fishing? Y N
PARTICIPATION IN FISHERIES AND COMMUNITY
Does a member of your household participate in the commercial fishery? Y NIf YES, continue this sectionIs a member of your household.. 1. Permit holder 2. Crew 3. Both
How much of your household income comes from commercial fishing? 0% 1-25% 26-50% 50-75% 76-100%(0) (1) (2) (3) (4)
Y NY N
If you retain salmon for home use, do you still usually participate in subsistence fishing? Y N(Usually is the past 5 years)
COMMUNITY AND ECONOMY
1
2
3
Do you plan on leaving in the future? Y N
If so why?
Do you consider commercial fishing to be important for the economy of Tatitlek? Y N
Not Important Somewhat Important Very Important(0) (1) (2)
SALMON (04) TATITLEK: 338
In your opinion, what are the reasons you continue to live in Tatitlek? List most important reason first.
EVOS - Comprehensive Subsistence Survey, 2014
Last year, did your household get a subsistence salmon permit?............................................................
Do you usually retain Chinook salmon for home use?Do you usually retain sockeye salmon for home use?
PAGE 9

350
HARVESTS: OTHER FISH HOUSEHOLD ID
1. Do you or members of your household USUALLY fish for other fish?............................................... Y N
2. During the last year (between January 1, 2014 and December 31, 2014) did you, or members of your household USE or TRY TO HARVEST other fish?........................................................... Y N
IF the answer is YES , continue on this page …
122602000
/ IND.
These columns should include ALL the other fish HARVESTED by members of this household in 2014.
OTHER FISH: 06 TATITLEK: 338
/
BLACK ROCKFISHY N Y N Y N Y N Y N
121800000
HALIBUTY N Y N Y N Y N Y N
123699000
121008000
LB.
121406000
/ IND.SOLE
Y N Y N Y N Y N Y N
STARRY FLOUNDERY N Y N Y N Y N Y N
/ IND.
/ IND.
PACIFIC TOM CODY N Y N Y N Y N Y N
121606000
LINGCODY N Y N Y N Y N Y N
121004000
/ IND.
122800000
/ IND.PACIFIC COD (GRAY)
Y N Y N Y N Y N Y N
SABLEFISH (BLACK COD)Y N Y N Y N Y N Y N
120499000
/ IND.
/ GAL.
/
UNKNOWN SMELTY N Y N Y N Y N Y N
120404000
120300000EULACHON (HOOLIGAN)
Y N Y N Y N Y N Y N
120200000
/ GAL.HERRING ROE
Y N Y N Y N Y N Y N
Read names below (circle) (number harvested by each gear type) amount / type specify amt.HERRING
Y N Y N Y N Y N Y N / GAL.
# of those used just for dog
food?FISH
WHEELROD & REEL
EVOS - Comprehensive Subsistence Survey, 2014
IF the answer to QUESTION 2 is NO, go to the NEXT PAGE .
Please estimate how many other fish ALL MEMBERS OF YOUR HOUSEHOLD HARVESTED in 2014, including with a rod and reel. INCLUDE other fish you gave away, ate fresh, fed to dogs, lost to spoilage, or got by helping others. If fishing with others, report ONLY YOUR SHARE of the catch. Do not include fish caught and released.
In 2014 did members of your household …
In 2014 HOW MANY _____ DID YOUR HOUSEHOLD HARVEST WITH ….
US
E?
TRY
TO
H
AR
VE
ST?
HA
RV
ES
T?
RE
CE
IVE
?
GIV
E
AW
AY
? SET GILL NET
SEINE NET UNITS
OTHER GEAR (specify type)
GAL.
Page 10
351
HARVESTS: OTHER FISH HOUSEHOLD ID
…continued from previous page
These columns should include ALL the other fish HARVESTED by members of this household in 2014.
SEA BASSY N Y N Y N Y N Y N / IND.
120602000
OTHER FISH: 06 TATITLEK: 338
PIKEY N Y N Y N Y N Y N / IND.
125500000
126206000
/ IND.STEELHEAD
Y N Y N Y N Y N Y N
RAINBOW TROUTY N Y N Y N Y N IND.
126204000
125010000
LAKE TROUTY N
Y N /
/ IND.Y N Y N Y N Y N
IND.
125006000
Y N /DOLLY VARDENY N Y N Y N Y N
123400000
/ IND.SKATES
Y N Y N Y N Y N Y N
SHARKY N Y N Y N Y N IND.
123299000
Y N /
/
(WHITING)121012000
WALLEYE POLLOCKY N Y N Y N Y N Y N
Y N Y N Y N
IND.
/ IND.
/ IND.
GREENLING (POGIES)Y N Y N Y N Y N
121600000
Y N
Read names below (circle) (number harvested by each gear type) amount / type specify amt.
HA
RV
ES
T?
RE
CE
IVE
?
GIV
E
AW
AY
? SET GILL NET
SEINE NET
FISH WHEEL
# of those used just for dog
food?
122699000
UNKNOWN ROCKFISHY N Y N
EVOS - Comprehensive Subsistence Survey, 2014
In 2014 did members of your household …
In 2014 HOW MANY _____ DID YOUR HOUSEHOLD HARVEST WITH ….
US
E?
TRY
TO
H
AR
VE
ST?
ROD & REEL
OTHER GEAR (specify type) UNITS
/ IND.
124200000
Y N
CUTTHROAT TROUTY N Y N Y N Y N Y N / IND.
126202000
WOLF EEL (WOLF FISH)Y N Y N Y N Y N
/ IND.
125200000
GRAYLINGY N Y N Y N Y N Y N
Page 11
352
HARVESTS: OTHER FISH HOUSEHOLD ID
…continued from previous page
Between January 1, 2014 and December 31, 2014…
Last year…… did your household use LESS, SAME, or MORE other fish than in recent years? ……………………………………………………….
IF LESS or MORE … X = do not useWHY was your use different?
Last year……did your household GET ENOUGH other fish?............................................................................................................................
If NO…What KIND of other fish did you need?
Do you think HERRING from your traditional harvest areas are safe for you to eat? Y N12
If not the same, why?
If not the same, why?
If NOT safe, why?
12
EVOS - Comprehensive Subsistence Survey, 2014
In 2014 did memers of your household …
In 2014 HOW MANY _____ DID YOUR HOUSEHOLD HARVEST WITH ….
US
E?
TRY
TO
H
AR
VE
ST?
HA
RV
ES
T?
RE
CE
IVE
?
GIV
E
AW
AY
? SET GILL NET
SEINE NET
FISH WHEEL
ROD & REEL
Read names below (circle) (number harvested by each gear type) amount / type specify amt.
WHITEFISHY N Y N Y N Y N Y N / IND.
# of those used just for dog
food?OTHER GEAR (specify type) UNITS
IRISH LORDY N Y N Y N Y N Y N / IND.
126499000
UNKNOWN SCULPINY N Y N Y N Y N Y N / IND.
123006000
EELY N Y N Y N Y N Y N / IND.
123099000
Y N Y N Y N Y N Y N /121200000
Y N Y N Y N Y N Y N /
12
How would you describe the impact to your household of not getting enough other fish last year?
… not noticable? … minor ? … major? … Severe?
These columns should include ALL the other fish HARVESTED by members of this household in 2014.
OTHER FISH: 06 TATITLEK: 338
L S M
L S M
Think back to about ten years ago (2004). Would you say that HALIBUT available to harvest in this area are less, the same, or more than ten year ago?
Think back to about ten years ago (2004). Would you say that HERRING available to harvest in this area are less, the same, or more than ten year ago?
12
(0) (1) (2) (3)
Y N
ASSESSMENTS: OTHER FISH 120000000
To conclude our other fish section, I am going to ask a few general questions about other fish.
X L S M
Page 12

353
HARVESTS: MARINE INVERTEBRATES HOUSEHOLD ID
1. Do you or members of your household USUALLY attempt to harvest marine invertebrates?............................................... Y N
2. During the last year (between January 1, 2014 and December 31, 2014) did you, or members of your household USE or TRY TO HARVEST marine invertebrates?...........................................................Y N
IF the answer is YES , continue on this page …
EVOS - Comprehensive Subsistence Survey, 2014
IF the answer to QUESTION 2 is NO, go to the NEXT PAGE .
Please estimate how many marine invertebrates ALL MEMBERS OF YOUR HOUSEHOLD HARVESTED in 2014. INCLUDE marine invertebrates you gave away, ate fresh, fed to dogs, lost to spoilage, or got by helping others. If harvesting with others, report ONLY YOUR SHARE of the harvest.
Read names below (circle)
In 2014 did members of your household …
US
E?
TRY
TO
H
AR
VE
ST?
HA
RV
ES
T?
RE
CE
IVE
?
GIV
E
AW
AY
?
In 2014 HOW MANY _____ DID YOUR HOUSEHOLD HARVEST….
AMOUNT UNITS COMMENTS(amt) specify (text)
BLACK BIDARKIS (CHITONS)Y N Y N Y N Y N Y N
GAL.
500408000RED (LARGE) BIDARKIS
Y N Y N Y N Y N Y N
500404000
502200000
OCTOPUSY N Y N Y N Y N Y N
500899000
GAL.COCKLES
Y N Y N Y N Y N Y N
500602000
BUTTER CLAMSY N Y N Y N Y N Y N
GAL.RAZOR CLAMS
Y N Y N Y N Y N Y N
500612000
500608000
LITTLENECK CLAMSY N Y N Y N Y N Y N
500610000
GAL.PINKNECK (SURF) CLAMS
Y N Y N Y N Y N Y N
500606000
HORSE CLAMS (GAPER)Y N Y N Y N Y N Y N
GAL.UNKNOWN CLAMS
Y N Y N Y N Y N Y N
500699000
501004000
DUNGENESS CRABY N Y N Y N Y N Y N
IND.KING CRAB
Y N Y N Y N Y N Y N
501008000
GAL.
GAL.
GAL.
GAL.
IND.
IND.
Include ALL the marine invertebrates HARVESTED by members of this household in 2014.
MARINE INVERTEBRATES: 08 TATITLEK: 338
Page 13

354
HARVESTS: MARINE INVERTEBRATES HOUSEHOLD ID
…continued from previous page
TANNER CRAB, BAIRDIY N Y N Y N Y N Y N
Read names below (circle)
HA
RV
ES
T?
RE
CE
IVE
?
GIV
E
AW
AY
?
US
E?
TRY
TO
H
AR
VE
ST?
(SNOW CRAB)
(amt) specify (text)
501012020
IND.
501099000
Y NUNKNOWN CRABS
Y N Y N Y N Y N
502099000
GAL.MUSSELS
Y N Y N Y N Y N Y N
502602000
Y NWEATHERVANE SCALLOPS
Y N Y N Y N Y N
SEA URCHINY N Y N Y N Y N Y N
503200000
GAL.
503400000
Y NSHRIMP
Y N Y N Y N Y N
503600000
GAL.SNAILS
Y N Y N Y N Y N Y N
501800000
Y NLIMPETS
Y N Y N Y N Y N
SEA CUCUMBERY N Y N Y N Y N Y N
503099000
GAL.
504000000
Y NWHELK
Y N Y N Y N Y N
Y N Y N Y N Y N Y N
Y NY N Y N Y N Y N
Y N Y N Y N Y N Y N
Y NY N Y N Y N Y N
In 2014 HOW MANY _____ DID YOUR HOUSEHOLD HARVEST….
AMOUNT UNITS COMMENTS
EVOS - Comprehensive Subsistence Survey, 2014
In 2014 did memers of your household …
GAL.
IND.
GAL.
LBS.
GAL.
Include ALL the marine invertebrates HARVESTED by members of this household in 2014.
MARINE INVERTEBRATES: 08 TATITLEK: 338
Page 14

355
HARVESTS: MARINE INVERTEBRATES HOUSEHOLD ID
…continued from previous page
Between January 1, 2014 and December 31, 2014…
Last year…… did your household use LESS, SAME, or MORE marine invertebrates than in recent years? ……………………………………………………….
IF LESS or MORE … X = do not useWHY was your use different?
Last year……did your household GET ENOUGH marine invertebrates?............................................................................................................................
If NO…What KIND of marine invertebrates did you need?
Do you think the BIDARKIES (CHITONS) from your traditional harvest areas are safe to eat?............................................................................................If NOT safe, why?
Do you think the CLAMS from your traditional harvest areas are safe to eat?............................................................................................If NOT safe, why?
2
Y N12
12
Y N Y N Y N Y N Y N
Read names below (circle)
RE
CE
IVE
?
GIV
E
AW
AY
?
US
E?
TRY
TO
H
AR
VE
ST?
HA
RV
ES
T?
GAL.
Y NY N Y N Y N Y N
GAL.Y N Y N Y N Y N Y N
Y NY N Y N Y N Y N
GAL.Y N Y N Y N Y N
500000000ASSESSMENTS: MARINE INVERTEBRATES
MARINE INVERTEBRATES: 08 TATITLEK: 338
2
How would you describe the impact to your household of not getting enough marine invertebrates last year?
… not noticable? … minor ? … major? … Severe?(0)
Y N
(1)
Think back to about ten years ago (2004). Would you say that BIDARKIES (CHITONS) available to harvest in this area are less, the same, or more than ten year ago? L S M
1If not the same, why?
If not the same, why?
Y N1
2
Think back to about ten years ago (2004). Would you say that CLAMS available to harvest in this area are less, the same, or more than ten year ago? L S M
In 2014 HOW MANY _____ DID YOUR HOUSEHOLD HARVEST….
AMOUNT UNITS COMMENTS(amt) specify (text)
EVOS - Comprehensive Subsistence Survey, 2014
In 2014 did memers of your household …
(2) (3)
GAL.
GAL.
To conclude our marine invertebrates section, I am going to ask a few general questions about marine invertebrates.
1
X L S M
Include ALL the marine invertebrates HARVESTED by members of this household in 2014.
Y N
Page 15

356
HARVESTS: LARGE LAND MAMMALS HOUSEHOLD ID
1. Do you or members of your household USUALLY hunt for large land mammals?............................................... Y N
2. During the last year (between January 1, 2014 and December 31, 2014) did you, or members of your household USE or TRY TO HARVEST large land mammals?...........................................................Y N
IF the answer is YES , continue on this page …
Between January 1, 2014 and December 31, 2014…
Last year…… did your household use LESS, SAME, or MORE large land mammals than in recent years? ……………………………………………………….
IF LESS or MORE … X = do not useWHY was your use different?
Last year……did your household GET ENOUGH large land mammals?............................................................................................................................
If NO…What KIND of large land mammals did you need?
IND
211600000 1
MOUNTAIN GOATY N Y N Y N Y N Y N
EVOS - Comprehensive Subsistence Survey, 2014
IF the answer to QUESTION 2 is NO, go to the NEXT PAGE .
Please estimate how many large land mammals ALL MEMBERS OF YOUR HOUSEHOLD HARVESTED in 2014. INCLUDE large land mammals you gave away, ate fresh, fed to dogs, lost to spoilage, or got by helping others. If hunting with others, report ONLY YOUR SHARE of the harvest.
Read names below (circle)
In 2014 HOW MANY _____ DID MEMBERS OF YOUR HOUSEHOLD HARVEST….
US
E?
TRY
TO
H
AR
VE
ST?
HA
RV
ES
T?
RE
CE
IVE
?
GIV
E
AW
AY
?
UNITS(specify amount harvested per month) (specify)
UN
KN
OW
N
DE
CE
MB
ER
NO
VE
MB
ER
OC
TOB
ER
SE
PTE
MB
ER
AU
GU
ST
211800001
211800000
MOOSEY N Y N Y N Y N Y N
211800002211800009
211000001211000000
CARIBOUY N Y N Y N Y N Y N
BLACK BEARY N Y N Y N Y N Y N
211000002211000009
DEERY N Y N Y N Y N Y N
210600000
MOUNTAIN GOATY N Y N Y N Y N Y N
211200000
211600000 1
M/F
MF
Unk
12
LARGE LAND MAMMALS: 10 TATITLEK: 338
… minor ? … major? … Severe?
(1) (2) (3)How would you describe the impact to your household of not getting enough large land mammals last year?
… not noticable?
(0)
12
Y N
ASSESSMENTS: LARGE LAND MAMMALS 210000000
To conclude our large land mammals section, I am going to ask a few general questions about large land mammals.
In 2014 did members of your household …
SE
X
JAN
UA
RY
FEB
RU
AR
Y
MA
RC
H
JULY
JUN
E
MA
Y
AP
RIL
INDINDIND
-9IND
FM
INDUnk IND
1
-92
1
IND
IND
1
Include ALL the large land mammals HARVESTED by members of this household in 2014.
X L S M
IND
Page 16

357
HARVESTS: SMALL LAND MAMMALS HOUSEHOLD ID
1. Do you or members of your household USUALLY hunt or trap for small land mammals?............................................... Y N
2. During the last year (between January 1, 2014 and December 31, 2014) did you, or members of your household USE or TRY TO HARVEST small land mammals?...........................................................Y N
IF the answer is YES , continue on this page …
JAN
UA
RY
FEB
RU
AR
Y
MA
RC
H
AP
RIL
MA
Y
JUN
E
JULY
AU
GU
ST
EVOS - Comprehensive Subsistence Survey, 2014
IF the answer to QUESTION 2 is NO, go to the NEXT PAGE .
Please estimate how many small land mammals ALL MEMBERS OF YOUR HOUSEHOLD HARVESTED in 2014. INCLUDE small land mammals you gave away, ate fresh, fed to dogs, lost to spoilage, or got by helping others. If hunting or trapping with others, report ONLY YOUR SHARE of the harvest.
Y N Y N Y N Y N
Read names below (circle) (specify amount harvested per month) (amount) (specify)
UNITSUS
E?
TRY
TO
H
AR
VE
ST?
HA
RV
ES
T?
RE
CE
IVE
?
GIV
E
AW
AY
?
SE
PTE
MB
ER
OC
TOB
ER
NO
VE
MB
ER
DE
CE
MB
ER
UN
KN
OW
N HOW MANY _____ WERE
USED FOR FUR ONLY?
In 2014 did members of your household …
In 2014 HOW MANY _____ DID MEMBERS OF YOUR HOUSEHOLD HARVEST….
IND.222600000
PORCUPINEY N
RED FOXY N Y N Y N Y N Y N
IND.220804000BEAVER
Y N Y N Y N Y N Y NIND.
220200000MUSKRAT
Y N Y N Y N Y N Y NIND.
222400000SNOWSHOE HARE
Y N Y N Y N Y N Y NIND.
221004000RIVER OTTER
Y N Y N Y N Y N Y NIND.
221200000MINK
Y N Y N Y N Y N Y NIND.
222200000
SMALL LAND MAMMALS: 14 TATITLEK: 338
IND.
Include ALL the small land mammals HARVESTED by members of this household in 2014.
WEASELY N Y N Y N Y N Y N IND.
223000000MARTEN
Y N Y N Y N Y N Y NIND.
222000000LYNX
Y N Y N Y N Y N Y NIND.
221600000COYOTE
Y N Y N Y N Y N Y N
220400000WOLF
Y N Y N Y N Y N Y NIND.
223200000
Page 17

358
HARVESTS: SMALL LAND MAMMALS HOUSEHOLD ID
…continued from previous page
Between January 1, 2014 and December 31, 2014…
Last year…
… did your household use LESS, SAME, or MORE small land mammals than in recent years? ……………………………………………………….
IF LESS or MORE … X = do not use
WHY was your use different?
Last year……did your household GET ENOUGH small land mammals?............................................................................................................................
If NO…What KIND of small land mammals did you need?
EVOS - Comprehensive Subsistence Survey, 2014
NO
VE
MB
ER
In 2014 did members of your household …
In 2014 HOW MANY _____ DID MEMBERS OF YOUR HOUSEHOLD HARVEST….
JAN
UA
RY
FEB
RU
AR
Y
MA
RC
H
AP
RIL
MA
Y
Y N Y N Y N Y N
Read names below (circle) (specify amount harvested per month) (amount) (specify)
DE
CE
MB
ER
UN
KN
OW
N HOW MANY _____ WERE
USED FOR FUR ONLY? UNITSU
SE
?
TRY
TO
H
AR
VE
ST?
HA
RV
ES
T?
RE
CE
IVE
?
GIV
E
AW
AY
?
JUN
E
JULY
AU
GU
ST
SE
PTE
MB
ER
OC
TOB
ER
IND.223400000
WOLVERINEY N
TREE SQUIRRELY N Y N Y N Y N Y N
IND.222804000
PARKA SQUIRREL (GROUND)
Y N Y N Y N Y N Y NIND.
222802000
Y N Y N Y N Y N Y N
Y N Y N Y N Y N Y N
Y N Y N Y N Y N Y N
Y N Y N Y N Y NY N
SMALL LAND MAMMALS: 14 TATITLEK: 338
How would you describe the impact to your household of not getting enough small land mammals last year?
1
2
Include ALL the small land mammals HARVESTED by members of this household in 2014.
To conclude our small land mammals section, I am going to ask a few general questions about small land mammals.
Y N Y N Y N Y N Y N
… not noticable? … minor ? … major? … Severe?(0) (1) (2) (3)
X L S M
Y N
ASSESSMENTS: SMALL LAND MAMMALS 220000000
Page 18

359
HARVESTS: MARINE MAMMALS HOUSEHOLD ID
1. Do you or members of your household USUALLY hunt for marine mammals ?............................................... Y N
2. During the last year (between January 1, 2014 and December 31, 2014) did you, or members of your household USE or TRY TO HARVEST marine mammals?........................................................... Y N
IF the answer is YES , continue on this page …
1
Y N Y N Y N Y N Y N
1
Y N Y N Y N Y N Y N
FEB
RU
AR
Y
MA
RC
H
AP
RIL
MA
Y
JUN
E
JULY
DE
CE
MB
ER
UN
KN
OW
N
In 2014 did members of your household …
In 2014 HOW MANY _____ DID MEMBERS OF YOUR HOUSEHOLD HARVEST….
SE
X
JAN
UA
RY
M
EVOS - Comprehensive Subsistence Survey, 2014
IF the answer to QUESTION 2 is NO, go to the NEXT PAGE .
Please estimate how many marine mammals ALL MEMBERS OF YOUR HOUSEHOLD HARVESTED in 2014. INCLUDE marine mammals you gave away, ate fresh, fed to dogs, lost to spoilage, or got by helping others. If hunting with others, report ONLY YOUR SHARE of the harvest.
HARBOR SEALY N
Read names below (circle) M/F (specify amount harvested per month) (specify)UNITSU
SE
?
TRY
TO
H
AR
VE
ST?
HA
RV
ES
T?
RE
CE
IVE
?
GIV
E
AW
AY
?
AU
GU
ST
SE
PTE
MB
ER
OC
TOB
ER
NO
VE
MB
ER
F IND300806000 Unk
Y N Y N Y N Y NIND
IND300806001 1300806002 2300806009
INDSEA LIONY N Y N Y N Y N Y N
M-9
IND301200000 Unk
FIND
301200001 1
301200009 -92301200002
SEA OTTERY N Y N Y N Y N Y N IND
301000000 1
Y N Y N Y N Y N Y N
1
Include ALL the marine mammals HARVESTED by members of this household in 2014.
MARINE MAMMALS: 12 TATITLEK: 338
Page 19

360
HARVESTS: MARINE MAMMALS HOUSEHOLD ID
Between January 1, 2014 and December 31, 2014…
Last year…… did your household use LESS, SAME, or MORE marine mammals than in recent years? ……………………………………………………….
IF LESS or MORE … X = do not useWHY was your use different?
Last year……did your household GET ENOUGH marine mammals?............................................................................................................................
If NO…What KIND of marine mammals did you need?
Do you think the HARBOR SEALS from your traditional harvest areas are safe to eat?............................................................................................If NOT safe, why?
If not the same, why? 12
To conclude our marine mammals section, I am going to ask a few general questions about marine mammals.
X L S M
12
ASSESSMENTS: MARINE MAMMALS 300000000
EVOS - Comprehensive Subsistence Survey, 2014
MARINE MAMMALS: 12 TATITLEK: 338
How would you describe the impact to your household of not getting enough marine mammals last year?
… not noticable?(0)
Y N
… minor ? … major? … Severe?(1) (2) (3)
Y N12
Think back to about ten years ago (2004). Would you say that HARBOR SEALS available to harvest in this area are less, the same, or more than ten year ago? L S M
Page 20

361
HARVESTS: DUCKS HOUSEHOLD ID
1. Do you or members of your household USUALLY hunt for ducks?............................................... Y N
2. During the last year (between January 1, 2014 and December 31, 2014) did you, or members of your household USE or TRY TO HARVEST ducks?........................................................... Y N
IF the answer is YES , continue on this page …
(circle) (specify)
EVOS - Comprehensive Subsistence Survey, 2014
IF the answer to QUESTION 2 is NO, go to the NEXT PAGE .
Please estimate how many ducks ALL MEMBERS OF YOUR HOUSEHOLD HARVESTED in 2014. INCLUDE ducks you gave away, ate fresh, fed to dogs, lost to spoilage, or got by helping others. If hunting with others, report ONLY YOUR SHARE of the harvest.
In 2014 did members of your household …
In 2014 HOW MANY _____ DID MEMBERS OF YOUR HOUSEHOLD HARVEST….
WINTER SPRING SUMMER FALL
UNKNOWN SEASON UNITSU
SE?
TRY
TO
HAR
VEST
?
IND.
OC
TOBE
R
NO
VEM
BER
D
ECEM
BER
Read names below (specify amount harvested per season)
MALLARDY N Y N Y N Y N Y N
HAR
VEST
?
REC
EIVE
?
GIV
E AW
AY?
JAN
UAR
Y FE
BRU
ARY
MAR
CH
AP
RIL
MAY
JUN
E
JULY
AU
GU
ST
SEPT
EMBE
R
BLACK SCOTERY N Y N Y N Y N Y N
IND.
410214000
410228020WHITE-WINGED SCOTER
Y N Y N Y N Y N Y NIND.
410228060SURF SCOTER
Y N Y N Y N Y N Y NIND.
410228040MERGANSER
Y N Y N Y N Y N Y NIND.
WIGEONY N Y N Y N Y N Y N
IND.
410232990
410216000
TEALY N Y N Y N Y N Y N
410236020
Include ALL the ducks HARVESTED by members of this household in 2014.
IND.
IND.
IND.
IND.
IND.
DUCKS: 15 TATITLEK: 338
NORTHERN PINTAILY N Y N Y N Y N Y N
IND.SHOVELER
Y N Y N Y N Y N Y N
GOLDENEYEY N Y N Y N Y N Y N
410202000
410220000
BUFFLEHEADY N Y N Y N Y N Y N
410230000
410210000SCAUP (BLUEBILL)
Y N Y N Y N Y N Y N
410226990
Page 21
362
HARVESTS: DUCKS AND GEESE HOUSEHOLD ID
…continued from previous page
(circle) (specify)
Include ALL the ducks HARVESTED by members of this household in 2014.
Y N Y N Y N Y N Y N
EVOS - Comprehensive Subsistence Survey, 2014
In 2014 did members of your household …
In 2014 HOW MANY _____ DID MEMBERS OF YOUR HOUSEHOLD HARVEST….
WINTER SPRING SUMMER FALL
UNKNOWN SEASON UNITSU
SE?
TRY
TO
HAR
VEST
?
HAR
VEST
?
REC
EIVE
?
GIV
E AW
AY?
JAN
UAR
Y FE
BRU
ARY
MAR
CH
AP
RIL
MAY
JUN
E
JULY
AU
GU
ST
SEPT
EMBE
R
OC
TOBE
R
NO
VEM
BER
D
ECEM
BER
Read names below (specify amount harvested per season)
EIDER (UNKNOWN/SPECIFY)Y N Y N Y N Y N
IND.410206990
Y N
IND.HARLEQUIN DUCK
Y N Y N Y N Y N Y N
LONG-TAILED DUCK (OLDSQUAW)Y N Y N Y N Y N Y N
410210990
IND.
UNKNOWN DUCKSY N Y N Y N Y N Y N
IND.410299000
410404990
UNKNOWN GEESEY N Y N Y N Y N Y N
410410000
DUCKS AND GEESE: 15 TATITLEK: 338
Y N Y N
CANADA GOOSEY N Y N Y N Y N Y N
IND.
410218000
WHITE-FRONTED GEESEY N Y N Y N Y N Y N
IND.
IND.410499000
Y NY N Y N
Y N Y N Y N Y N Y N
Y N Y N Y N Y N Y N
Y N Y N Y N Y N Y N
Y N Y N Y N Y N Y N
Y N Y N Y N Y N Y N
Page 22
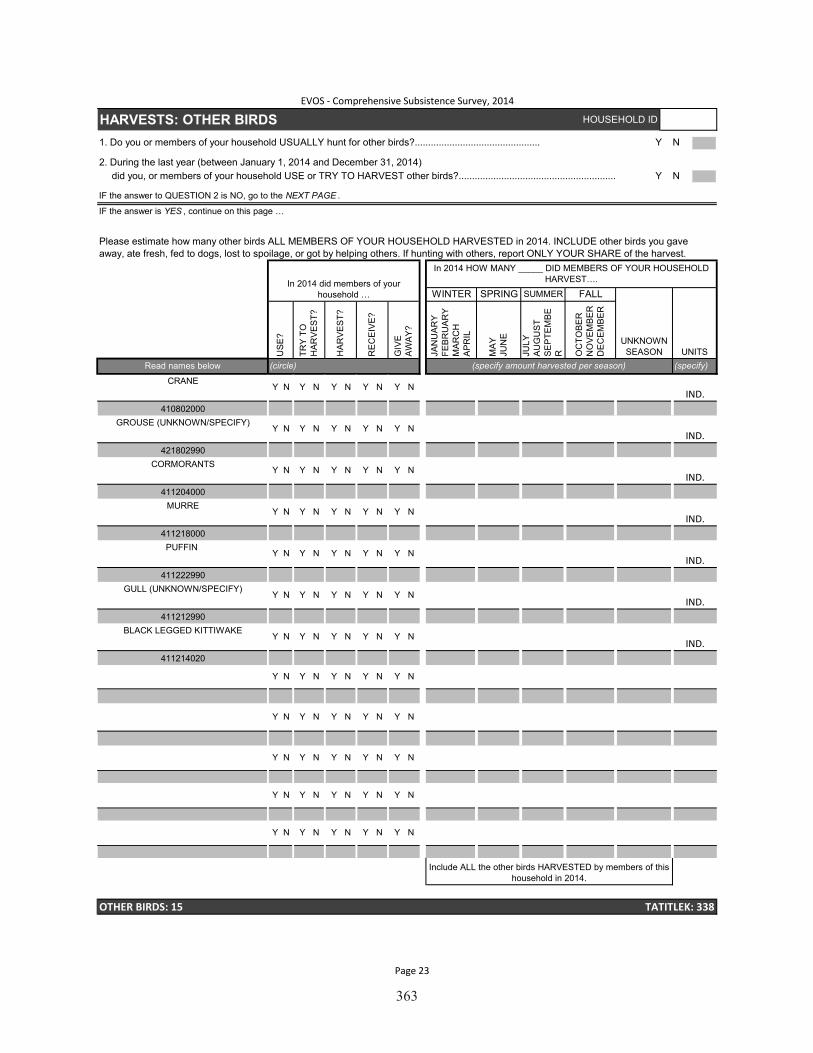
363
HARVESTS: OTHER BIRDS HOUSEHOLD ID
1. Do you or members of your household USUALLY hunt for other birds?............................................... Y N
2. During the last year (between January 1, 2014 and December 31, 2014) did you, or members of your household USE or TRY TO HARVEST other birds?........................................................... Y N
IF the answer is YES , continue on this page …
(circle) (specify)
EVOS - Comprehensive Subsistence Survey, 2014
IF the answer to QUESTION 2 is NO, go to the NEXT PAGE .
Please estimate how many other birds ALL MEMBERS OF YOUR HOUSEHOLD HARVESTED in 2014. INCLUDE other birds you gave away, ate fresh, fed to dogs, lost to spoilage, or got by helping others. If hunting with others, report ONLY YOUR SHARE of the harvest.
In 2014 did members of your household …
In 2014 HOW MANY _____ DID MEMBERS OF YOUR HOUSEHOLD HARVEST….
WINTER SPRING SUMMER FALL
UNKNOWN SEASON UNITSU
SE
?
TRY
TO
H
AR
VE
ST?
IND.
OC
TOB
ER
N
OV
EM
BE
R
DE
CE
MB
ER
Read names below (specify amount harvested per season)
CRANEY N Y N Y N Y N Y N
HA
RV
ES
T?
RE
CE
IVE
?
GIV
E
AW
AY
?
JAN
UA
RY
FE
BR
UA
RY
M
AR
CH
A
PR
IL
MA
YJU
NE
JULY
A
UG
US
T S
EP
TEM
BE
R
GROUSE (UNKNOWN/SPECIFY)Y N Y N Y N Y N Y N
IND.
410802000
421802990CORMORANTS
Y N Y N Y N Y N Y NIND.
411204000MURRE
Y N Y N Y N Y N Y NIND.
411218000PUFFIN
Y N Y N Y N Y N Y NIND.
411222990GULL (UNKNOWN/SPECIFY)
Y N Y N Y N Y N Y NIND.
411212990BLACK LEGGED KITTIWAKE
Y N Y N Y N Y N Y NIND.
411214020
Y N Y N Y N Y N Y N
Y N Y N Y N Y N Y N
Y N Y N Y N Y N Y N
Y N Y N Y N Y N Y N
Y N Y N Y N Y N Y N
OTHER BIRDS: 15 TATITLEK: 338
Include ALL the other birds HARVESTED by members of this household in 2014.
Page 23
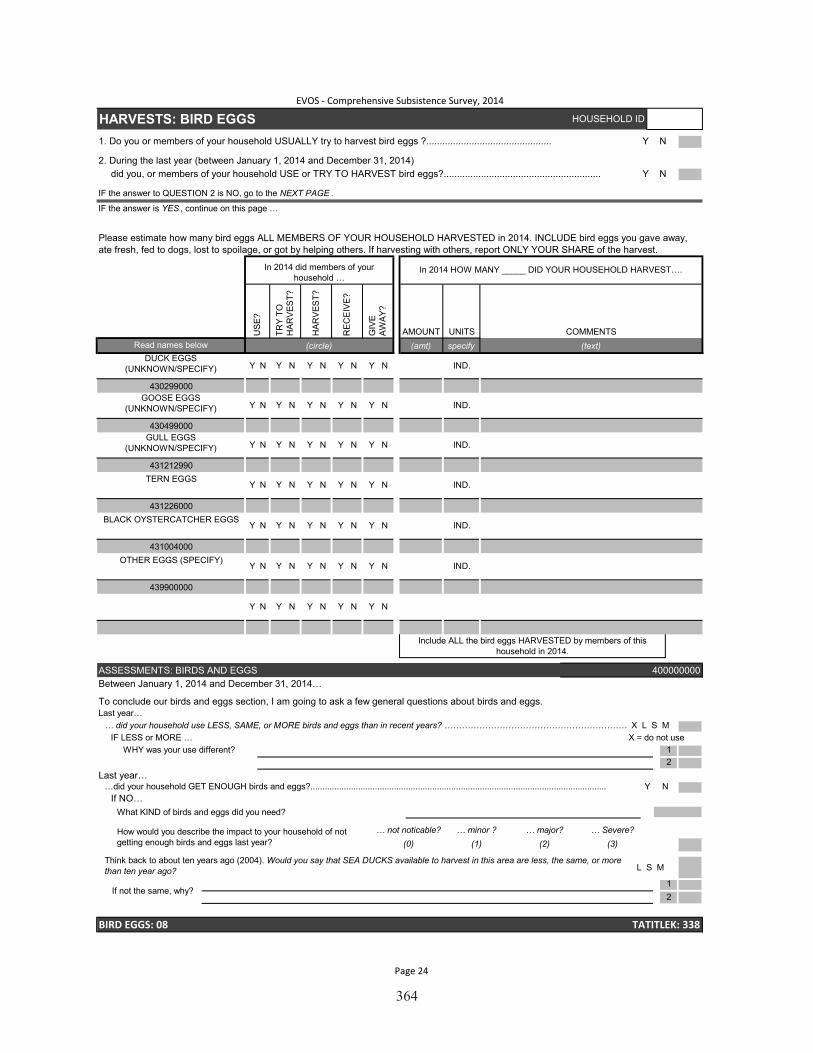
364
HARVESTS: BIRD EGGS HOUSEHOLD ID
1. Do you or members of your household USUALLY try to harvest bird eggs ?............................................... Y N
2. During the last year (between January 1, 2014 and December 31, 2014) did you, or members of your household USE or TRY TO HARVEST bird eggs?........................................................... Y N
IF the answer is YES , continue on this page …
Between January 1, 2014 and December 31, 2014…
Last year…… did your household use LESS, SAME, or MORE birds and eggs than in recent years? ……………………………………………………….
IF LESS or MORE … X = do not useWHY was your use different?
Last year……did your household GET ENOUGH birds and eggs?............................................................................................................................
If NO…What KIND of birds and eggs did you need?
EVOS - Comprehensive Subsistence Survey, 2014
IF the answer to QUESTION 2 is NO, go to the NEXT PAGE .
Please estimate how many bird eggs ALL MEMBERS OF YOUR HOUSEHOLD HARVESTED in 2014. INCLUDE bird eggs you gave away, ate fresh, fed to dogs, lost to spoilage, or got by helping others. If harvesting with others, report ONLY YOUR SHARE of the harvest.
Read names below (circle) (amt) specify (text)
In 2014 did members of your household …
In 2014 HOW MANY _____ DID YOUR HOUSEHOLD HARVEST….U
SE?
TRY
TO
HAR
VEST
?
HAR
VEST
?
REC
EIVE
?
GIV
E AW
AY?
AMOUNT UNITS COMMENTS
IND.
430299000
DUCK EGGS (UNKNOWN/SPECIFY) Y N Y N Y N Y N Y N
430499000
GOOSE EGGS (UNKNOWN/SPECIFY) Y N Y N Y N Y N Y N IND.
GULL EGGS (UNKNOWN/SPECIFY) Y N Y N Y N Y N Y N IND.
TERN EGGSY N Y N Y N Y N Y N IND.
431212990
BLACK OYSTERCATCHER EGGSY N Y N Y N Y N Y N IND.
431226000
OTHER EGGS (SPECIFY)Y N Y N Y N Y N Y N IND.
431004000
Y N Y N Y N Y N Y N
439900000
12
Include ALL the bird eggs HARVESTED by members of this household in 2014.
ASSESSMENTS: BIRDS AND EGGS 400000000
To conclude our birds and eggs section, I am going to ask a few general questions about birds and eggs.
X L S M
BIRD EGGS: 08 TATITLEK: 338
Y N
How would you describe the impact to your household of not getting enough birds and eggs last year?
… not noticable? … minor ? … major? … Severe?(0) (1)
Think back to about ten years ago (2004). Would you say that SEA DUCKS available to harvest in this area are less, the same, or more than ten year ago? L S M
If not the same, why?12
(2) (3)
Page 24
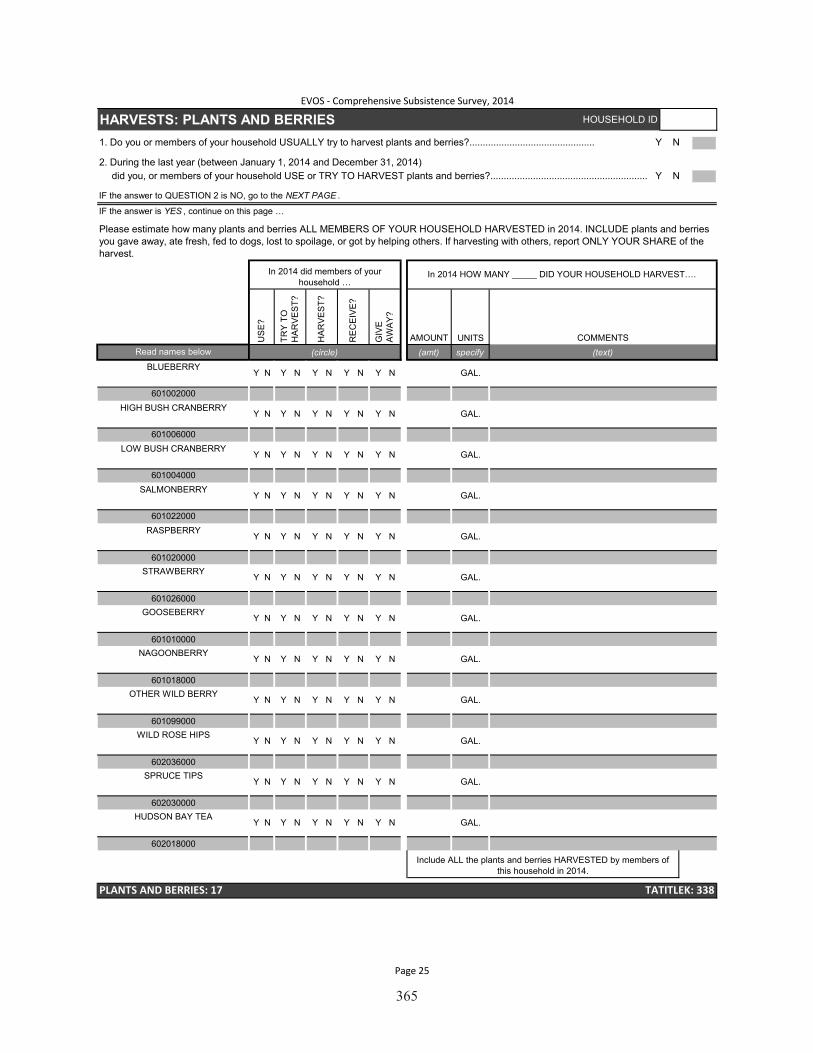
365
HARVESTS: PLANTS AND BERRIES HOUSEHOLD ID
1. Do you or members of your household USUALLY try to harvest plants and berries?............................................... Y N
2. During the last year (between January 1, 2014 and December 31, 2014) did you, or members of your household USE or TRY TO HARVEST plants and berries?........................................................... Y N
IF the answer is YES , continue on this page …
EVOS - Comprehensive Subsistence Survey, 2014
IF the answer to QUESTION 2 is NO, go to the NEXT PAGE .
Please estimate how many plants and berries ALL MEMBERS OF YOUR HOUSEHOLD HARVESTED in 2014. INCLUDE plants and berries you gave away, ate fresh, fed to dogs, lost to spoilage, or got by helping others. If harvesting with others, report ONLY YOUR SHARE of the harvest.
Read names below (circle) (amt) specify (text)
In 2014 did members of your household …
In 2014 HOW MANY _____ DID YOUR HOUSEHOLD HARVEST….U
SE
?
TRY
TO
H
AR
VE
ST?
HA
RV
ES
T?
RE
CE
IVE
?
GIV
E
AW
AY
?
AMOUNT UNITS COMMENTS
GAL.
601002000
BLUEBERRYY N Y N Y N Y N Y N
601006000
HIGH BUSH CRANBERRYY N Y N Y N Y N Y N GAL.
LOW BUSH CRANBERRYY N Y N Y N Y N Y N GAL.
SALMONBERRYY N Y N Y N Y N Y N GAL.
601004000
RASPBERRYY N Y N Y N Y N Y N
601022000
Include ALL the plants and berries HARVESTED by members of this household in 2014.
GAL.
601020000
Y N Y N Y N Y N Y N GAL.
601010000NAGOONBERRY
PLANTS AND BERRIES: 17 TATITLEK: 338
602036000
GAL.
602030000
SPRUCE TIPSY N Y N Y N
STRAWBERRYY N Y N Y N Y N Y N GAL.
601026000GOOSEBERRY
Y N Y N Y N Y N Y N GAL.
601018000OTHER WILD BERRY
Y N Y N GAL.
601099000
Y N Y N Y N
GAL.WILD ROSE HIPS
Y N Y N Y N Y N Y N
602018000
Y N Y N
HUDSON BAY TEAY N Y N Y N Y N Y N GAL.
Page 25
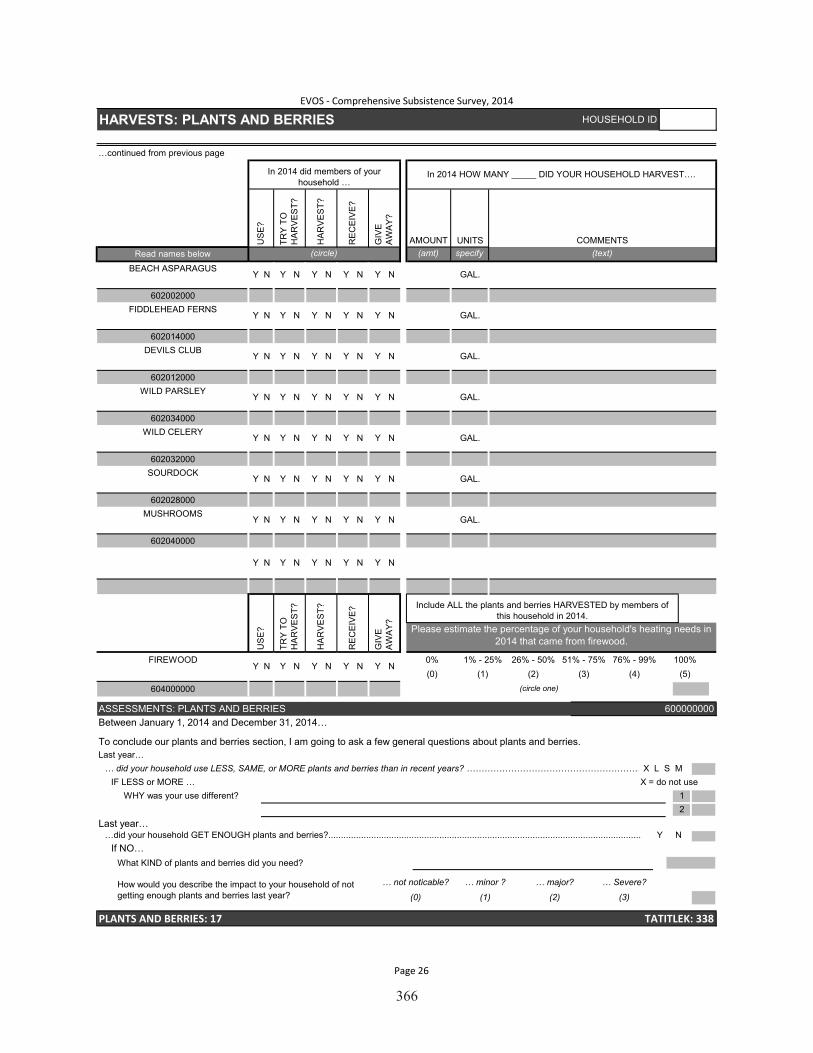
366
HARVESTS: PLANTS AND BERRIES HOUSEHOLD ID
…continued from previous page
Between January 1, 2014 and December 31, 2014…
Last year…… did your household use LESS, SAME, or MORE plants and berries than in recent years? ……………………………………………………….
IF LESS or MORE … X = do not useWHY was your use different?
Last year……did your household GET ENOUGH plants and berries?............................................................................................................................
If NO…What KIND of plants and berries did you need?
EVOS - Comprehensive Subsistence Survey, 2014
In 2014 did members of your household …
In 2014 HOW MANY _____ DID YOUR HOUSEHOLD HARVEST….
UNITS COMMENTSRead names below (circle) (amt) specify (text)
US
E?
TRY
TO
H
AR
VE
ST?
HA
RV
ES
T?
RE
CE
IVE
?
GIV
E
AW
AY
?
AMOUNT
GAL.
602002000
BEACH ASPARAGUSY N Y N Y N Y N Y N
FIDDLEHEAD FERNSY N Y N Y N Y N Y N GAL.
Y N GAL.
602014000
602034000
DEVILS CLUBY N Y N Y N Y N
WILD PARSLEYY N Y N Y N Y N Y N GAL.
602012000
FIREWOODY N Y N Y N Y N Y N
US
E?
TRY
TO
H
AR
VE
ST?
HA
RV
ES
T?
RE
CE
IVE
?
GIV
E
AW
AY
?
Please estimate the percentage of your household's heating needs in 2014 that came from firewood.
602028000
(0) (1) (2) (3) (4) (5)0% 1% - 25% 26% - 50% 51% - 75% 76% - 99% 100%
2
(circle one)
ASSESSMENTS: PLANTS AND BERRIES 600000000
604000000
(2) (3)
PLANTS AND BERRIES: 17 TATITLEK: 338
Y N
How would you describe the impact to your household of not getting enough plants and berries last year?
… not noticable? … minor ? … major? … Severe?
(0) (1)
To conclude our plants and berries section, I am going to ask a few general questions about plants and berries.
X L S M
1
Include ALL the plants and berries HARVESTED by members of this household in 2014.
WILD CELERYY N Y N Y N Y N
GAL.SOURDOCK
Y N Y N Y N Y N Y N
Y N GAL.
602032000
MUSHROOMSY N Y N Y N Y N Y N GAL.
602040000
Y N Y N Y N Y N Y N
Page 26

367
HARVESTS: SEAWEED HOUSEHOLD ID
1. Do you or members of your household USUALLY try to harvest seaweed?............................................... Y N
2. During the last year (between January 1, 2014 and December 31, 2014) did you, or members of your household USE or TRY TO HARVEST seaweed?........................................................... Y N
IF the answer is YES , continue on this page …
Between January 1, 2014 and December 31, 2014…
Last year…… did your household use LESS, SAME, or MORE seaweed than in recent years? ……………………………………………………….
IF LESS or MORE … X = do not useWHY was your use different?
Last year……did your household GET ENOUGH seaweed?............................................................................................................................
If NO…What KIND of seaweed did you need?
EVOS - Comprehensive Subsistence Survey, 2014
IF the answer to QUESTION 2 is NO, go to the NEXT PAGE .
Please estimate how many seaweed ALL MEMBERS OF YOUR HOUSEHOLD HARVESTED in 2014. INCLUDE seaweed you gave away, ate fresh, fed to dogs, lost to spoilage, or got by helping others. If harvesting with others, report ONLY YOUR SHARE of the harvest.
Read names below (circle) (amt) specify (text)
In 2014 did members of your household …
In 2014 HOW MANY _____ DID YOUR HOUSEHOLD HARVEST….
US
E?
TRY
TO
H
AR
VE
ST?
HA
RV
ES
T?
RE
CE
IVE
?
GIV
E
AW
AY
?
AMOUNT UNITS COMMENTS
GAL.
603002000
BLACK SEAWEEDY N Y N Y N Y N Y N
603004000
BULL KELPY N Y N Y N Y N Y N GAL.
RED SEAWEEDY N Y N Y N Y N Y N GAL.
SEA RIBBONSY N Y N Y N Y N Y N GAL.
603006000
GIANT KELP (MACROCYSTIS)Y N Y N Y N Y N Y N GAL.
603008000
ALARIAY N Y N Y N Y N Y N GAL.
603010000
UNKNOWN SEAWEEDY N Y N Y N Y N Y N GAL.
603012000
12
Include ALL the seaweed HARVESTED by members of this household in 2014.
ASSESSMENTS: SEAWEED 603000000
To conclude our seaweed section, I am going to ask a few general questions about seaweed.
603099000
X L S M
(2) (3)
SEAWEED: 17 TATITLEK: 338
Y N
How would you describe the impact to your household of not getting enough seaweed last year?
… not noticable? … minor ? … major? … Severe?(0) (1)
Page 27

368
HARVEST SUMMARY: ALL RESOURCES HOUSEHOLD ID
During the last year,1
… did your household use LESS, SAME, or MORE wild resources than in recent years? ……………………………………………………….IF LESS or MORE … X = do not use
WHY was your use different?
During the last year,1
…did your household GET ENOUGH wild resources?....................................................................................................................................If NO…
What KIND of wild resources did you need?
Are there any subsistence foods from your traditional areas that you are concerned about eating? ..........................................................................................
If YES, what are the species and why are you concerned?
Otherwise, continue below…
Y N
We know things change throughout the year, but in general, over the whole year, how often are wild foods such as fish, game, birds, berries, and other wild resources served in your household?
EVOS - Comprehensive Subsistence Survey, 2014
ASSESSMENTS: ALL RESOURCES 0
X L S M
1
To conclude our subsistence harvests section, I am going to ask a few general questions about wild resources.
2
Y N
How would you describe the impact to your household of not getting enough wild resources last year? …………………
… not noticable? … minor ? … major? … Severe?(0) (1) (2) (3)
ASSESSMENTS OF ALL RESOURCES: 66 TATITLEK: 338
HEALTH IMPACT ASSESSMENTS
(5) (6)
(circle ONE response)
If this household does NOT USE wild foods, go to the next page
Please list the most important wild foods that are used in your household each year. Include wild foods that may not be available now, but are important at other times of the year. Please list most important wild foods first.
(Not necessary to fill out every line)
None, don't use
(0) (1) (2) (3) (4)
less than once per
week1 - 3 times per week
4 - 6 times per week
once per day
2 times per day
3 or more times per
day
If your household cannot get or runs short of wild foods, what do members of your household eat instead? These can be foods from the store or garden, such as: meat, grains, prepared foods, or fruits and vegetables. Please list your most important alternative foods first.
(Not necessary to fill out every line)
Wild Food 2 Wild Food 3 Wild Food 4 Wild Food 5TOP FIVE WILD
FOODS
Wild Food 1
OTHER FOODS2
(1 TO 5)
Other Food Other Food Other Food Other Food Other Food
OTHER FOODS2
(6 TO 10)
1 ''LAST YEAR'' means between January 1, 2014 and December 31, 2014.2 For "OTHER FOODS", we are not interested in condiments or staples, such as sugar, flour, coffee, or butter etc... We are interested in
foods used in place of traditional foods for meals or snacks. This includes foods substituted by personal preference or out of necessity (traditional food not available).
Page 28

369
SUBSISTENCE OBSERVATIONS DON'T ENTER TEXT ON FORM, ENTER TEXT IN GREEN CELLS
RECOVERY
In your view have subsistence resources recovered since the oil spill1? PAGE SUBJECT-VERB-RECORD TYPE
If NO, what do you think should be done to help in the recovery of subsistence resources?12
SUBSISTENCE SKILLS
Do you think that young adults are learning enough hunting, fishing, and processing skills?
If YES, how are they learning these skills?12
If NO, why? 12
ELDERS
Over the last ten years, do you think the influence of elders in teaching subsistence skills and values in the community has decreased, stayed the same, or increased?
Decreased Stayed the same Increased Don't Know
If not the same, why?12
SUBSISTENCE WAY OF LIFE
Do you think the traditional way of life was affected by the oil spill1? If YES, in your view has the traditional way of life recovered since the oil spill1?
If NOT recovered, what do you think is needed to help the traditional way of life recover? [Consider spill and non-spill factors]
12
ASSESSMENTS TATITLEK: 338
(3) (-8)
EVOS - Comprehensive Subsistence Survey, 2014
1 Exxon Valdez oil spill in Prince William Sound on March 24, 1989
Y N
Y N
Y N Y N
(1) (2)
PAGE 29
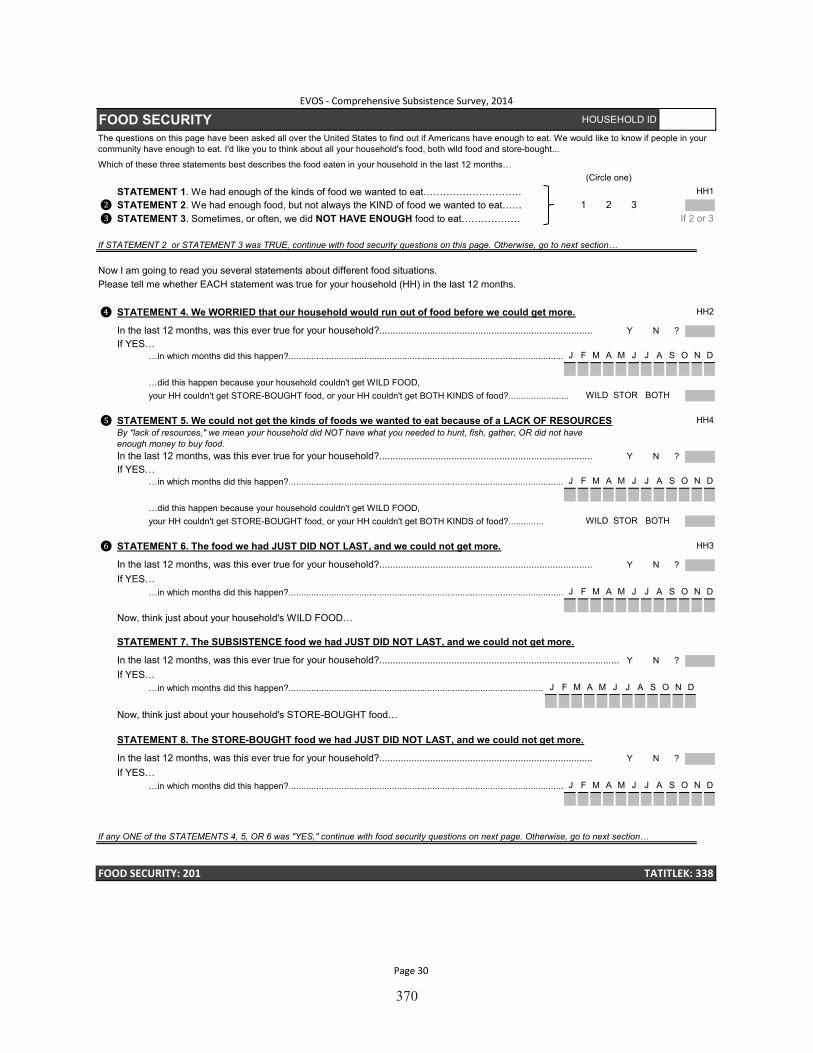
370
FOOD SECURITY HOUSEHOLD ID
Which of these three statements best describes the food eaten in your household in the last 12 months…
STATEMENT 1. We had enough of the kinds of food we wanted to eat…………………………STATEMENT 2. We had enough food, but not always the KIND of food we wanted to eat……STATEMENT 3. Sometimes, or often, we did NOT HAVE ENOUGH food to eat………………
STATEMENT 4. We WORRIED that our household would run out of food before we could get more.
In the last 12 months, was this ever true for your household?................................................................................If YES…
…in which months did this happen?....................................................................................................................................
…did this happen because your household couldn't get WILD FOOD,your HH couldn't get STORE-BOUGHT food, or your HH couldn't get BOTH KINDS of food?..........................
STATEMENT 5. We could not get the kinds of foods we wanted to eat because of a LACK OF RESOURCES
In the last 12 months, was this ever true for your household?................................................................................If YES…
…in which months did this happen?....................................................................................................................................
…did this happen because your household couldn't get WILD FOOD,your HH couldn't get STORE-BOUGHT food, or your HH couldn't get BOTH KINDS of food?..............
STATEMENT 6. The food we had JUST DID NOT LAST, and we could not get more.
In the last 12 months, was this ever true for your household?................................................................................If YES…
…in which months did this happen?....................................................................................................................................
Now, think just about your household's WILD FOOD…
STATEMENT 7. The SUBSISTENCE food we had JUST DID NOT LAST, and we could not get more.
In the last 12 months, was this ever true for your household?.................................................................................................If YES…
…in which months did this happen?....................................................................................................................................
Now, think just about your household's STORE-BOUGHT food…
STATEMENT 8. The STORE-BOUGHT food we had JUST DID NOT LAST, and we could not get more.
In the last 12 months, was this ever true for your household?................................................................................If YES…
…in which months did this happen?....................................................................................................................................
❷❸
❹
❺
❻
J
J J A S
Y N ?
D
EVOS - Comprehensive Subsistence Survey, 2014
The questions on this page have been asked all over the United States to find out if Americans have enough to eat. We would like to know if people in your community have enough to eat. I'd like you to think about all your household's food, both wild food and store-bought...
HH11 2 3
(Circle one)
N
Please tell me whether EACH statement was true for your household (HH) in the last 12 months.Now I am going to read you several statements about different food situations.
If STATEMENT 2 or STATEMENT 3 was TRUE, continue with food security questions on this page. Otherwise, go to next section…
If 2 or 3
HH2
Y N ?
M J A S O DAMFJ
O N
J
HH3
Y N ?
J F M A M
D
HH4
J F M A M
By "lack of resources," we mean your household did NOT have what you needed to hunt, fish, gather, OR did not have enough money to buy food.
Y N ?
WILD STOR BOTH
A S
WILD STOR BOTH
J J A S O N
O N D
If any ONE of the STATEMENTS 4, 5, OR 6 was "YES," continue with food security questions on next page. Otherwise, go to next section…
J F M A M J J
FOOD SECURITY: 201 TATITLEK: 338
Y N ?
A S O N DF M A M J J
Page 30
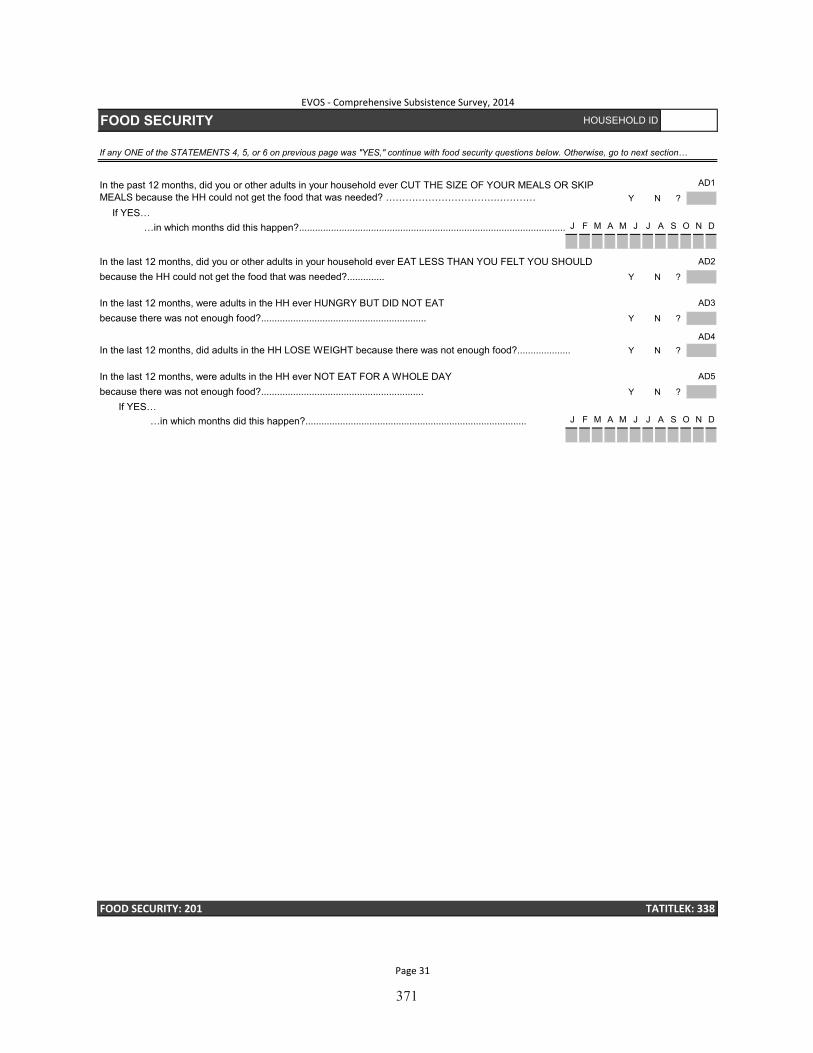
371
FOOD SECURITY HOUSEHOLD ID
If YES……in which months did this happen?....................................................................................................................................
In the last 12 months, did you or other adults in your household ever EAT LESS THAN YOU FELT YOU SHOULD because the HH could not get the food that was needed?..............
In the last 12 months, were adults in the HH ever HUNGRY BUT DID NOT EATbecause there was not enough food?..............................................................
In the last 12 months, did adults in the HH LOSE WEIGHT because there was not enough food?....................
In the last 12 months, were adults in the HH ever NOT EAT FOR A WHOLE DAYbecause there was not enough food?.............................................................
If YES……in which months did this happen?...................................................................................
If any ONE of the STATEMENTS 4, 5, or 6 on previous page was "YES," continue with food security questions below. Otherwise, go to next section…
Y N ?In the past 12 months, did you or other adults in your household ever CUT THE SIZE OF YOUR MEALS OR SKIP MEALS because the HH could not get the food that was needed? …………………………….…………
AD1
J A S O N DJ F M A M J
D
Y N ?
Y N ?
Y N ?
Y N ?
J F M A M J
FOOD SECURITY: 201 TATITLEK: 338
EVOS - Comprehensive Subsistence Survey, 2014
AD2
AD3
AD4
AD5
J A S O N
Page 31
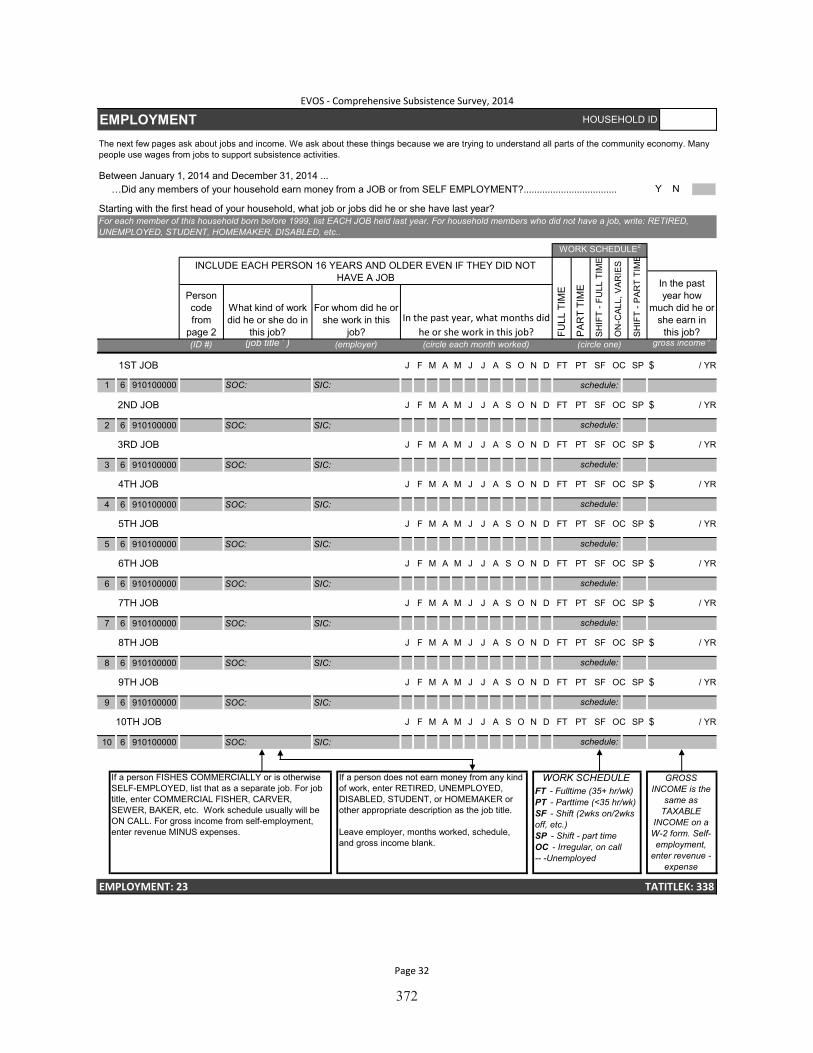
372
EMPLOYMENT HOUSEHOLD ID
Between January 1, 2014 and December 31, 2014 ...…Did any members of your household earn money from a JOB or from SELF EMPLOYMENT?................................... Y N
Starting with the first head of your household, what job or jobs did he or she have last year?
EVOS - Comprehensive Subsistence Survey, 2014
The next few pages ask about jobs and income. We ask about these things because we are trying to understand all parts of the community economy. Many people use wages from jobs to support subsistence activities.
1ST JOB
EMPLOYMENT: 23 TATITLEK: 338
M A M J
8TH JOB
J J A
/ YR
(ID #)
FT PTAJ
In the past year how
much did he or she earn in
this job?In the past year, what months did
he or she work in this job?
JMAM
Person code from
page 2
What kind of work did he or she do in
this job?
For whom did he or she work in this
job?
FJ
gross income 3
SF OC SP $
(circle one)(circle each month worked)(employer)(job title 1 )
DNOS
2ND JOB J F
WORK SCHEDULE2
schedule:SIC:
SIC:
SF OC SP $ / YRS O N D FT PTM A M J J A
schedule:
3RD JOB J F M A M / YRFT PT SF OC SP $J A S O N D
schedule:
J
J F M SP $ / YRO N D FT PT SFA M J J A S
$ / YRO N D FT PT SFA M J J A SJ F M
$ / YRS O N D FT PTM A M J J AJ F
7TH JOB J F M A M $ / YRO N D FT PT SF
schedule:SIC:
S
/ YRFT PT SF OC SP $J A S O N DJ F M A M J
9TH JOB J F M A M
schedule:
$ / YRD FT PT SF OC SPJ J A S O N
10TH JOB J F
6 910100000
schedule:
/ YRFT PT SF OC SP $J A S O N D
1 6 910100000
2 6 910100000
3
schedule:
OC SP
SF OC SP6TH JOB
OC SP
OC
6 6 910100000
7 6 910100000
6 910100000
4 6 910100000
5 6 910100000
4TH JOB
5TH JOB
GROSS INCOME is the
same as TAXABLE
INCOME on a W-2 form. Self-employment,
enter revenue - expense
If a person FISHES COMMERCIALLY or is otherwise SELF-EMPLOYED, list that as a separate job. For job title, enter COMMERCIAL FISHER, CARVER, SEWER, BAKER, etc. Work schedule usually will be ON CALL. For gross income from self-employment, enter revenue MINUS expenses.
If a person does not earn money from any kind of work, enter RETIRED, UNEMPLOYED, DISABLED, STUDENT, or HOMEMAKER or other appropriate description as the job title.
Leave employer, months worked, schedule, and gross income blank.
WORK SCHEDULEFT - Fulltime (35+ hr/wk)PT - Parttime (<35 hr/wk)SF - Shift (2wks on/2wks off, etc.)SP - Shift - part timeOC - Irregular, on call-- -Unemployed
For each member of this household born before 1999, list EACH JOB held last year. For household members who did not have a job, write: RETIRED, UNEMPLOYED, STUDENT, HOMEMAKER, DISABLED, etc..
SH
IFT
- PA
RT
TIM
E
ON
-CA
LL, V
AR
IES
SH
IFT
- FU
LL T
IME
PA
RT
TIM
E
FULL
TIM
E
INCLUDE EACH PERSON 16 YEARS AND OLDER EVEN IF THEY DID NOT HAVE A JOB
SOC:
SOC:
10 6 910100000
8 6 910100000
9
SOC:
SOC:
SOC:
SOC:
SOC:
SOC:
SOC:
SOC:
schedule:
schedule:
schedule:
SIC:
SIC:
SIC:
SIC:
SIC:
SIC:
SIC:
Page 32
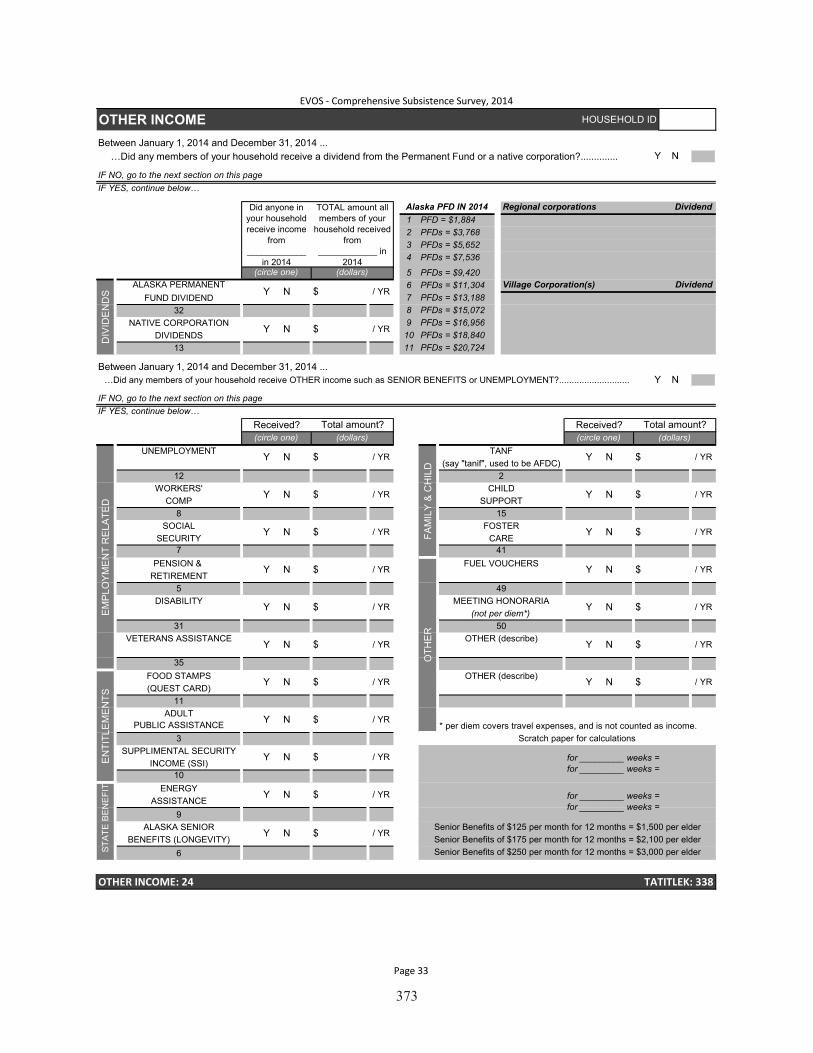
373
OTHER INCOME HOUSEHOLD ID
Between January 1, 2014 and December 31, 2014 ...…Did any members of your household receive a dividend from the Permanent Fund or a native corporation?.............. Y N
Between January 1, 2014 and December 31, 2014 ...…Did any members of your household receive OTHER income such as SENIOR BENEFITS or UNEMPLOYMENT?............................ Y N
EVOS - Comprehensive Subsistence Survey, 2014
IF NO, go to the next section on this pageIF YES, continue below…
8910
PFDs = $5,652PFDs = $7,536
PFDs = $9,420PFDs = $11,304PFDs = $13,188
(circle one)
34
PFDs = $15,072PFDs = $16,956PFDs = $18,840
DividendRegional corporations
Y N $ / YR
Received? Total amount?
IF NO, go to the next section on this pageIF YES, continue below…
PFDs = $20,72411
(say "tanif", used to be AFDC)2
TANF $ / YR
(circle one) (dollars)
DIV
IDE
ND
S
OTHER INCOME: 24 TATITLEK: 338
3
EM
PLO
YM
EN
T R
ELA
TED
EN
TITL
EM
EN
TS
50
495
41
FAM
ILY
& C
HIL
D
/ YRSECURITY
7
TOTAL amount all members of your
household received from
____________ in 2014
(dollars)
/ YRY N $Village Corporation(s) Dividend6
7
5
Did anyone in your household receive income
from ____________
in 2014
Alaska PFD IN 201412
PFD = $1,884PFDs = $3,768
FUND DIVIDENDALASKA PERMANENT
32NATIVE CORPORATION
DIVIDENDS13
Y N $ / YR
Y N $
Received? Total amount?(circle one) (dollars)
UNEMPLOYMENT Y N $ / YR
12
Y NSUPPORT
15
CHILD $WORKERS'/ YR
Y N
COMP8
35
DISABILITY Y N $ / YR
31
FUEL VOUCHERS Y N $
SOCIAL FOSTER Y N $ / YRCARE
VETERANS ASSISTANCE Y N $ / YR
PENSION & Y N $ / YRRETIREMENT
Y N $ / YR(not per diem*)
SUPPLIMENTAL SECURITY Y N $
/ YR
Y N $ / YRPUBLIC ASSISTANCE
FOOD STAMPS Y N $ / YR(QUEST CARD)
$ / YR
OTH
ER
OTHER (describe) Y N
9
10ENERGY Y N $ / YR
ASSISTANCE
MEETING HONORARIA
OTHER (describe) Y N
$ / YR
11ADULT
/ YRINCOME (SSI)
STA
TE B
EN
EFI
TS
for _________ weeks = for _________ weeks =
for _________ weeks = for _________ weeks =
Senior Benefits of $125 per month for 12 months = $1,500 per elder
Senior Benefits of $250 per month for 12 months = $3,000 per elderSenior Benefits of $175 per month for 12 months = $2,100 per elder
* per diem covers travel expenses, and is not counted as income.Scratch paper for calculations
6
ALASKA SENIOR Y N $ / YRBENEFITS (LONGEVITY)
Page 33

374
COMMENTS HOUSEHOLD ID
DO YOU HAVE ANY QUESTIONS, COMMENTS OR CONCERNS?
INTERVIEW SUMMARY: DON'T FORGET TO FILL IN THE STOP TIME _______________________________________
COMMENTS: 300 TATITLEK: 338
EVOS - Comprehensive Subsistence Survey, 2014
Page 34

375
APPENDIX B–CONVERSION FACTORS
The following tables present the conversion factors used in determining how many pounds were harvested of each resource. For instance, if respondents reported harvesting 3 gal of smelt, the quantity would be multiplied by the appropriate conversion factor (in this case 3.25) to show a harvest of 9.75 lb of smelt.
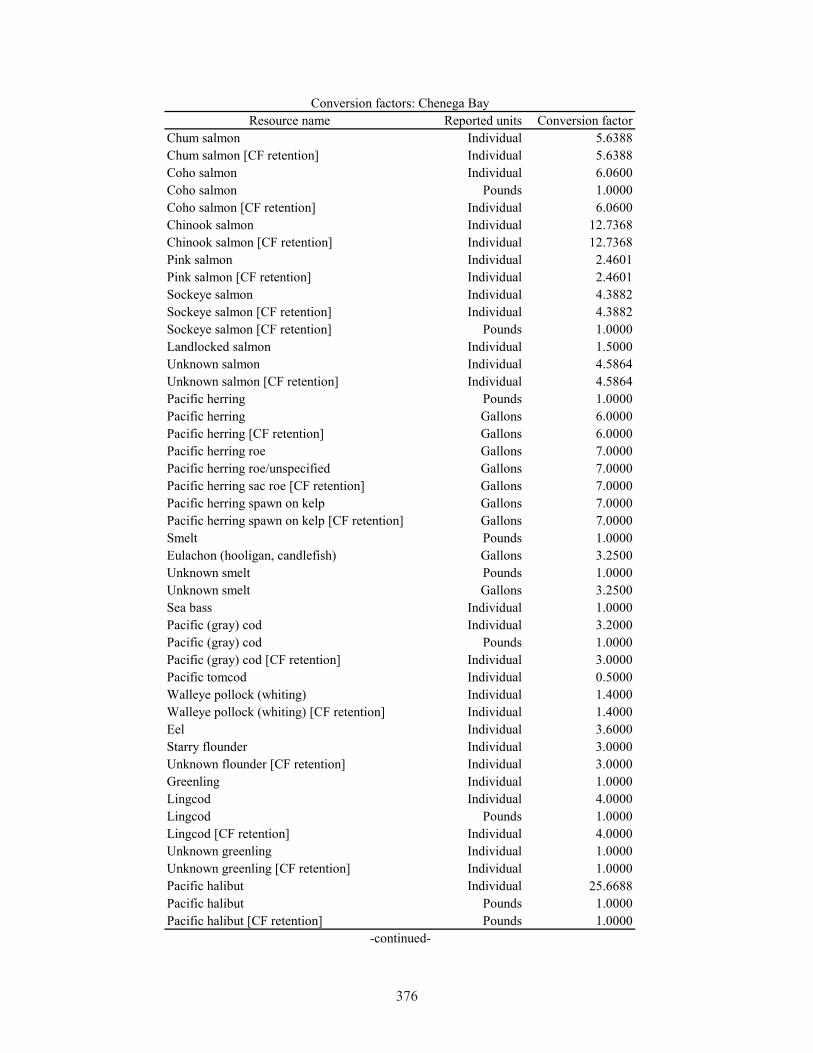
376
Resource name Reported units Conversion factorChum salmon Individual 5.6388Chum salmon [CF retention] Individual 5.6388Coho salmon Individual 6.0600Coho salmon Pounds 1.0000Coho salmon [CF retention] Individual 6.0600Chinook salmon Individual 12.7368Chinook salmon [CF retention] Individual 12.7368Pink salmon Individual 2.4601Pink salmon [CF retention] Individual 2.4601Sockeye salmon Individual 4.3882Sockeye salmon [CF retention] Individual 4.3882Sockeye salmon [CF retention] Pounds 1.0000Landlocked salmon Individual 1.5000Unknown salmon Individual 4.5864Unknown salmon [CF retention] Individual 4.5864Pacific herring Pounds 1.0000Pacific herring Gallons 6.0000Pacific herring [CF retention] Gallons 6.0000Pacific herring roe Gallons 7.0000Pacific herring roe/unspecified Gallons 7.0000Pacific herring sac roe [CF retention] Gallons 7.0000Pacific herring spawn on kelp Gallons 7.0000Pacific herring spawn on kelp [CF retention] Gallons 7.0000Smelt Pounds 1.0000Eulachon (hooligan, candlefish) Gallons 3.2500Unknown smelt Pounds 1.0000Unknown smelt Gallons 3.2500Sea bass Individual 1.0000Pacific (gray) cod Individual 3.2000Pacific (gray) cod Pounds 1.0000Pacific (gray) cod [CF retention] Individual 3.0000Pacific tomcod Individual 0.5000Walleye pollock (whiting) Individual 1.4000Walleye pollock (whiting) [CF retention] Individual 1.4000Eel Individual 3.6000Starry flounder Individual 3.0000Unknown flounder [CF retention] Individual 3.0000Greenling Individual 1.0000Lingcod Individual 4.0000Lingcod Pounds 1.0000Lingcod [CF retention] Individual 4.0000Unknown greenling Individual 1.0000Unknown greenling [CF retention] Individual 1.0000Pacific halibut Individual 25.6688Pacific halibut Pounds 1.0000Pacific halibut [CF retention] Pounds 1.0000
-continued-
Conversion factors: Chenega Bay

377
Conversion factors: Chenega Bay–Page 2 of 7.Resource name Reported units Conversion factor
Black rockfish Individual 1.5000Black rockfish Pounds 1.0000Black rockfish [CF retention] Individual 2.0000Red rockfish [CF retention] Individual 4.0000Yelloweye rockfish Individual 4.0000Yelloweye rockfish Pounds 1.0000Quillback rockfish Individual 4.0000Dusky rockfish Individual 1.0000Copper rockfish Individual 4.0000Tiger rockfish Individual 1.0000China rockfish Individual 1.0000Northern rockfish Individual 1.0000Boccaccio rockfish Individual 1.0000Unknown rockfish Individual 1.8756Unknown rockfish Pounds 1.0000Unknown rockfish [CF retention] Individual 1.8756Sablefish (black cod) Individual 3.1000Sablefish (black cod) Pounds 1.0000Sablefish (black cod) [CF retention] Individual 3.0000Unknown Irish lord Individual 0.5000Unknown sculpin Individual 1.0000Unknown sculpin [CF retention] Individual 1.0000Unknown shark Individual 9.0000Unknown shark [CF retention] Individual 9.0000Skates Individual 5.0000Sole Individual 1.0000Unknown sole Individual 1.0000Unknown sole [CF retention] Individual 1.0000Wolffish Individual 1.0000Dolly Varden Individual 1.4000Dolly Varden [CF retention] Individual 1.4000Lake trout Individual 1.4000Arctic grayling Individual 0.7000Northern pike Individual 3.0000Unknown sturgeon [CF retention] Individual 34.0000Cutthroat trout Individual 1.4000Rainbow trout Individual 1.4000Steelhead Individual 1.4000Lake whitefish Individual 1.7500Unknown whitefishes Individual 1.7500Bison Individual 450.0000Black bear Individual 58.0000Caribou Individual 150.0000Deer Individual 43.2000Elk Individual 225.0000Mountain goat Individual 72.5000
-continued-
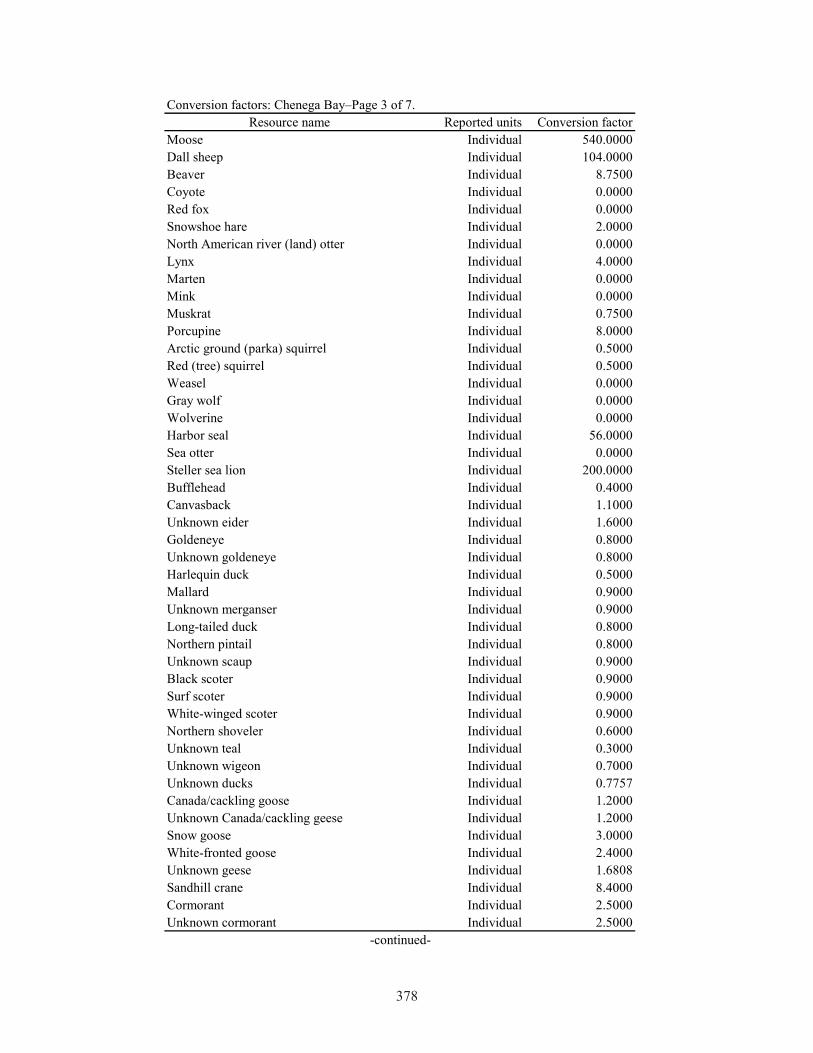
378
Conversion factors: Chenega Bay–Page 3 of 7.Resource name Reported units Conversion factor
Moose Individual 540.0000Dall sheep Individual 104.0000Beaver Individual 8.7500Coyote Individual 0.0000Red fox Individual 0.0000Snowshoe hare Individual 2.0000North American river (land) otter Individual 0.0000Lynx Individual 4.0000Marten Individual 0.0000Mink Individual 0.0000Muskrat Individual 0.7500Porcupine Individual 8.0000Arctic ground (parka) squirrel Individual 0.5000Red (tree) squirrel Individual 0.5000Weasel Individual 0.0000Gray wolf Individual 0.0000Wolverine Individual 0.0000Harbor seal Individual 56.0000Sea otter Individual 0.0000Steller sea lion Individual 200.0000Bufflehead Individual 0.4000Canvasback Individual 1.1000Unknown eider Individual 1.6000Goldeneye Individual 0.8000Unknown goldeneye Individual 0.8000Harlequin duck Individual 0.5000Mallard Individual 0.9000Unknown merganser Individual 0.9000Long-tailed duck Individual 0.8000Northern pintail Individual 0.8000Unknown scaup Individual 0.9000Black scoter Individual 0.9000Surf scoter Individual 0.9000White-winged scoter Individual 0.9000Northern shoveler Individual 0.6000Unknown teal Individual 0.3000Unknown wigeon Individual 0.7000Unknown ducks Individual 0.7757Canada/cackling goose Individual 1.2000Unknown Canada/cackling geese Individual 1.2000Snow goose Individual 3.0000White-fronted goose Individual 2.4000Unknown geese Individual 1.6808Sandhill crane Individual 8.4000Cormorant Individual 2.5000Unknown cormorant Individual 2.5000
-continued-

379
Conversion factors: Chenega Bay–Page 4 of 7.Resource name Reported units Conversion factor
Unknown gull Individual 1.0000Black-legged kittiwake Individual 0.0000Loon Individual 3.0000Unknown loon Individual 3.0000Unknown murre Individual 1.0000Unknown puffin Individual 0.5000Unknown migratory birds Individual 0.8302Spruce grouse Individual 0.7000Unknown grouse Individual 0.7000Ptarmigan Individual 0.7000Unknown ptarmigan Individual 0.7000Unknown duck eggs Individual 0.1500Unknown goose eggs Individual 0.3000Black oystercatcher eggs Individual 0.0500Unknown gull eggs Individual 0.3000Unknown gull eggs Gallons 3.0000Unknown murre eggs Individual 0.2200Unknown tern eggs Individual 0.0500Unknown eggs Individual 0.3000Red (large) chitons Gallons 3.0000Black (small) chitons Gallons 4.0000Butter clams Individual 0.1200Butter clams Gallons 3.0000Horse clams Gallons 3.0000Pacific littleneck clams (steamers) Individual 0.2500Pacific littleneck clams (steamers) Gallons 3.0000Pacific littleneck clams (steamers) [CF retentio Gallons 3.0000Pinkneck clams Gallons 3.0000Razor clams Individual 0.2500Razor clams Gallons 3.0000Razor clams Dozen 3.0000Razor clams [CF retention] Gallons 3.0000Unknown clams Individual 0.2500Unknown clams Gallons 3.0000Unknown cockles Individual 0.2500Unknown cockles Gallons 3.0000Dungeness crab Individual 0.7000Dungeness crab [CF retention] Individual 0.7000Unknown king crab Individual 2.3000Unknown king crab [CF retention] Individual 2.3000Unknown king crab [CF retention] Pounds 1.0000Tanner crab, bairdi Individual 1.6000Tanner crab, bairdi Gallons 1.6000Unknown tanner crab [CF retention] Individual 1.6000Unknown crab Individual 1.6000Limpets Gallons 1.5000
-continued-
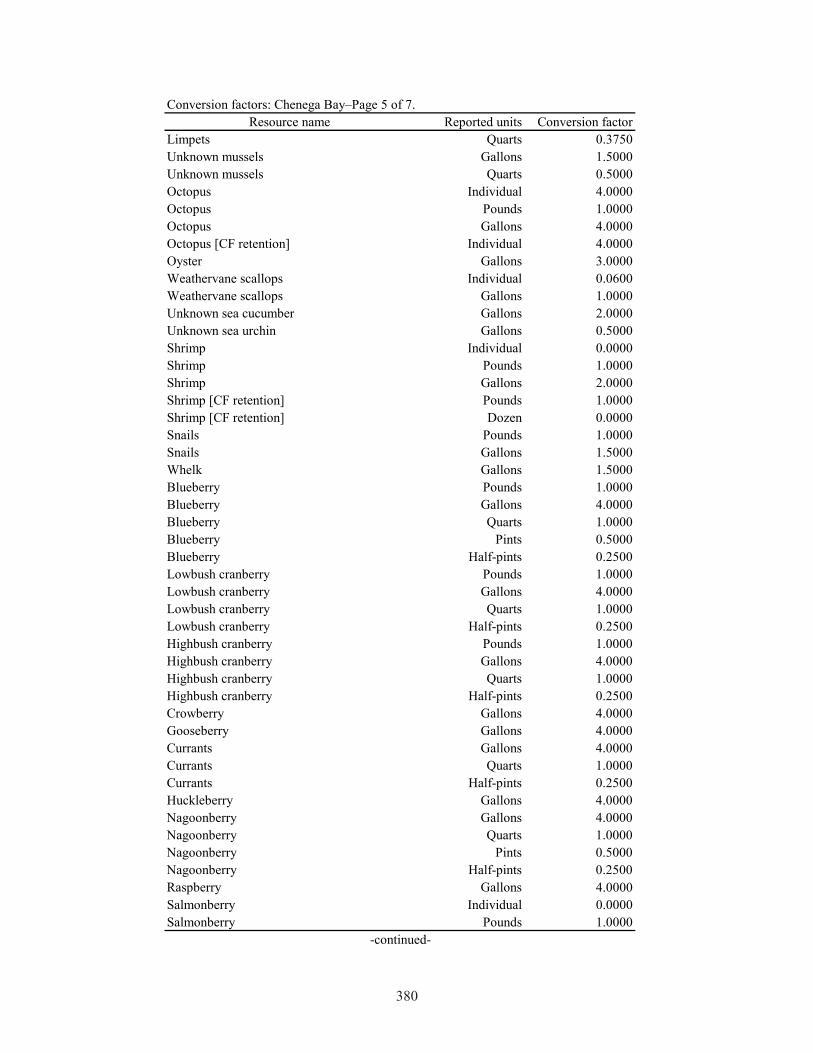
380
Conversion factors: Chenega Bay–Page 5 of 7.Resource name Reported units Conversion factor
Limpets Quarts 0.3750Unknown mussels Gallons 1.5000Unknown mussels Quarts 0.5000Octopus Individual 4.0000Octopus Pounds 1.0000Octopus Gallons 4.0000Octopus [CF retention] Individual 4.0000Oyster Gallons 3.0000Weathervane scallops Individual 0.0600Weathervane scallops Gallons 1.0000Unknown sea cucumber Gallons 2.0000Unknown sea urchin Gallons 0.5000Shrimp Individual 0.0000Shrimp Pounds 1.0000Shrimp Gallons 2.0000Shrimp [CF retention] Pounds 1.0000Shrimp [CF retention] Dozen 0.0000Snails Pounds 1.0000Snails Gallons 1.5000Whelk Gallons 1.5000Blueberry Pounds 1.0000Blueberry Gallons 4.0000Blueberry Quarts 1.0000Blueberry Pints 0.5000Blueberry Half-pints 0.2500Lowbush cranberry Pounds 1.0000Lowbush cranberry Gallons 4.0000Lowbush cranberry Quarts 1.0000Lowbush cranberry Half-pints 0.2500Highbush cranberry Pounds 1.0000Highbush cranberry Gallons 4.0000Highbush cranberry Quarts 1.0000Highbush cranberry Half-pints 0.2500Crowberry Gallons 4.0000Gooseberry Gallons 4.0000Currants Gallons 4.0000Currants Quarts 1.0000Currants Half-pints 0.2500Huckleberry Gallons 4.0000Nagoonberry Gallons 4.0000Nagoonberry Quarts 1.0000Nagoonberry Pints 0.5000Nagoonberry Half-pints 0.2500Raspberry Gallons 4.0000Salmonberry Individual 0.0000Salmonberry Pounds 1.0000
-continued-

381
Conversion factors: Chenega Bay–Page 6 of 7.Resource name Reported units Conversion factor
Salmonberry Gallons 4.0000Salmonberry Quarts 1.0000Salmonberry Pints 0.5000Salmonberry Half-pints 0.2500Strawberry Gallons 4.0000Strawberry Quarts 1.0000Strawberry Pints 0.5000Strawberry Half-pints 0.2500Twisted stalk berry (watermelon berry) Gallons 4.0000Twisted stalk berry (watermelon berry) Half-pints 0.2500Bearberry Half-pints 0.2500Other wild berry Gallons 4.0000Beach asparagus Gallons 1.0000Goose tongue Gallons 1.0000Wild rhubarb Half-pints 0.0625Other beach greens Gallons 1.0000Devils club Gallons 1.0000Fiddlehead ferns Individual 0.0000Fiddlehead ferns Pounds 1.0000Fiddlehead ferns Gallons 1.0000Fiddlehead ferns Quarts 0.2500Fiddlehead ferns Pints 0.1250Fiddlehead ferns Half-pints 0.0625Nettle Gallons 1.0000Hudson's Bay (Labrador) tea Gallons 1.0000Hudson's Bay (Labrador) tea Half-pints 0.0625Salmonberry shoots Half-pints 0.0625Dandelion greens Gallons 1.0000Sourdock Gallons 1.0000Spruce tips Gallons 1.0000Spruce tips Quarts 0.2500Spruce tips Pints 0.1250Spruce tips Half-pints 0.0625Wild celery Gallons 1.0000Wild celery Pints 0.1250Wild parsley Gallons 1.0000Wild rose hips Gallons 4.0000Other wild greens Pounds 1.0000Other wild greens Gallons 1.0000Unknown mushrooms Pounds 1.0000Unknown mushrooms Gallons 1.0000Unknown mushrooms Quarts 0.2500Sorrel Gallons 1.0000Fireweed Gallons 1.0000Stinkweed Gallons 1.0000Black seaweed Gallons 4.0000
-continued-
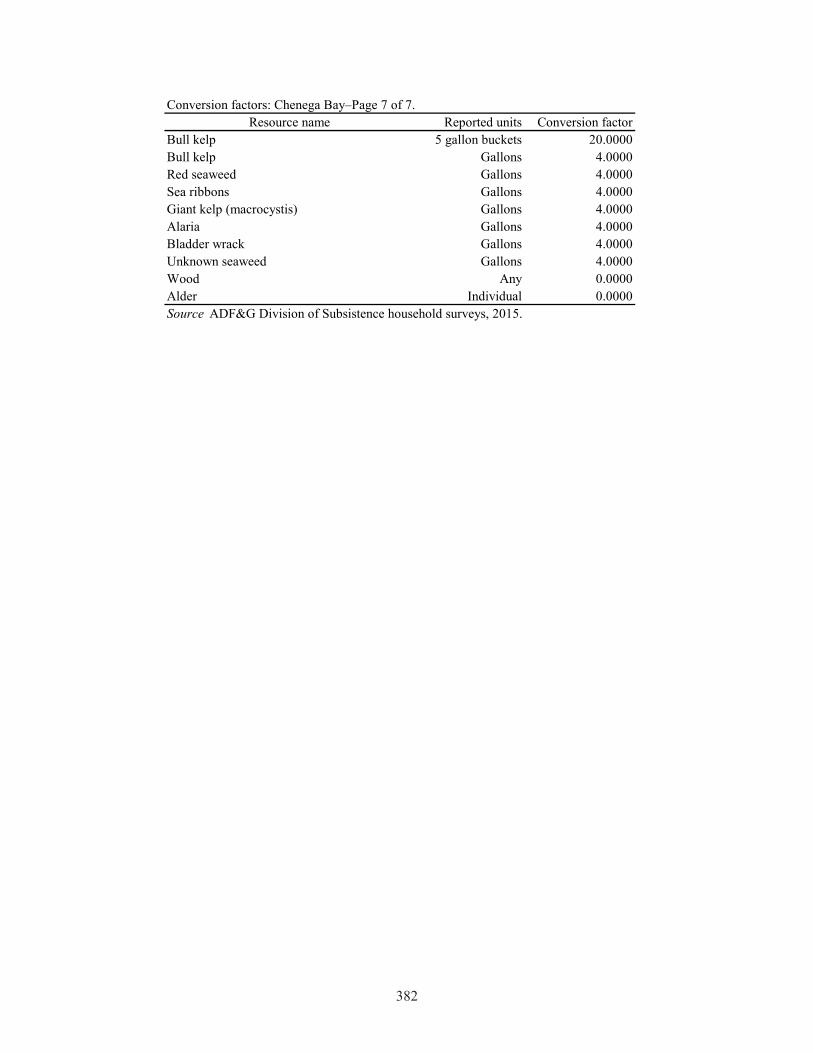
382
Conversion factors: Chenega Bay–Page 7 of 7.Resource name Reported units Conversion factor
Bull kelp 5 gallon buckets 20.0000Bull kelp Gallons 4.0000Red seaweed Gallons 4.0000Sea ribbons Gallons 4.0000Giant kelp (macrocystis) Gallons 4.0000Alaria Gallons 4.0000Bladder wrack Gallons 4.0000Unknown seaweed Gallons 4.0000Wood Any 0.0000Alder Individual 0.0000Source ADF&G Division of Subsistence household surveys, 2015.

383
Resource name Reported units Conversion factorChum salmon Individual 5.6388Chum salmon [CF retention] Individual 5.6388Coho salmon Individual 6.0600Coho salmon Pounds 1.0000Coho salmon [CF retention] Individual 6.0600Chinook salmon Individual 12.7368Chinook salmon [CF retention] Individual 12.7368Pink salmon Individual 2.4601Pink salmon [CF retention] Individual 2.4601Sockeye salmon Individual 4.3882Sockeye salmon [CF retention] Individual 4.3882Sockeye salmon [CF retention] Pounds 1.0000Landlocked salmon Individual 1.5000Unknown salmon Individual 5.0841Unknown salmon [CF retention] Individual 5.0841Pacific herring Pounds 1.0000Pacific herring Gallons 6.0000Pacific herring [CF retention] Gallons 6.0000Pacific herring roe/unspecified Gallons 7.0000Pacific herring sac roe [CF retention] Gallons 7.0000Pacific herring spawn on kelp Gallons 7.0000Pacific herring spawn on kelp [CF retention] Gallons 7.0000Eulachon (hooligan, candlefish) Gallons 3.2500Unknown smelt Pounds 3.2500Unknown smelt Gallons 3.2500Sea bass Individual 1.0000Pacific (gray) cod Individual 3.2000Pacific (gray) cod Pounds 1.0000Pacific (gray) cod [CF retention] Individual 3.0000Pacific tomcod Individual 0.5000Walleye pollock (whiting) Individual 1.4000Walleye pollock (whiting) [CF retention] Individual 1.4000Eel Individual 3.6000Starry flounder Individual 3.0000Unknown flounder [CF retention] Individual 3.0000Lingcod Individual 4.0000Lingcod Pounds 1.0000Lingcod [CF retention] Individual 4.0000Unknown greenling Individual 1.0000Unknown greenling [CF retention] Individual 1.0000Pacific halibut Individual 25.6688Pacific halibut Pounds 1.0000Pacific halibut [CF retention] Pounds 1.0000Black rockfish Individual 1.5000Black rockfish Pounds 1.0000Black rockfish [CF retention] Individual 2.0000
-continued-
Conversion factors: Tatitlek
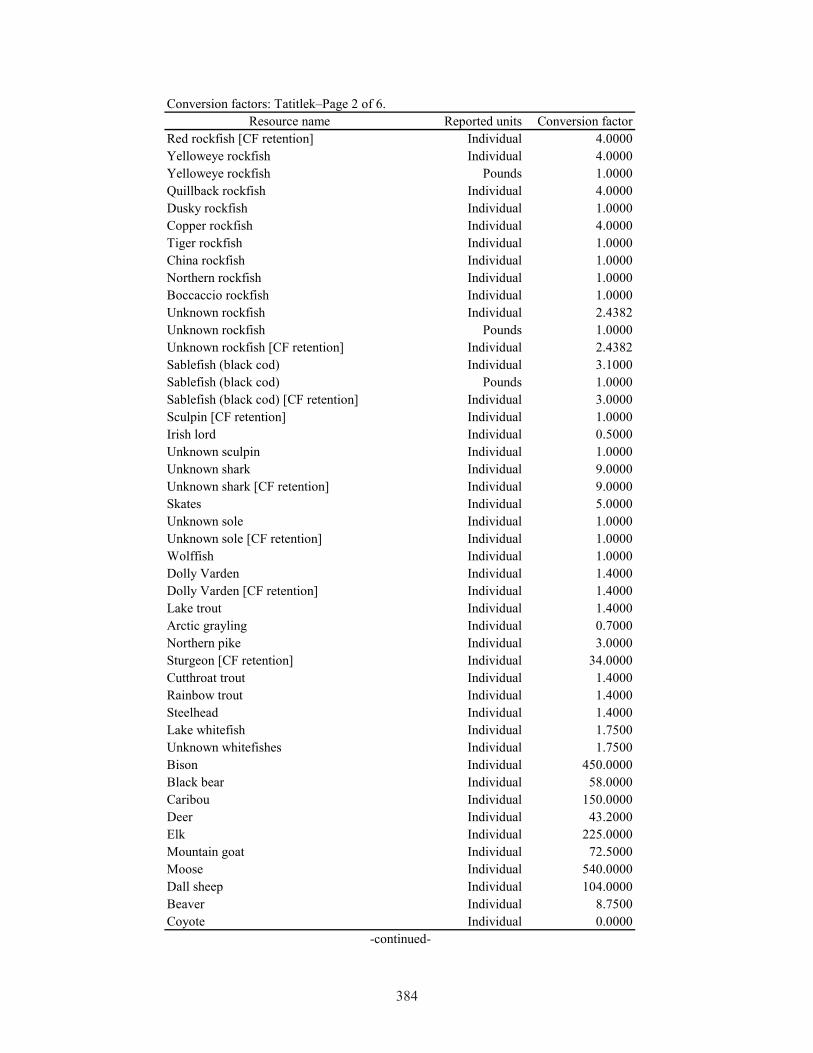
384
Conversion factors: Tatitlek–Page 2 of 6.Resource name Reported units Conversion factor
Red rockfish [CF retention] Individual 4.0000Yelloweye rockfish Individual 4.0000Yelloweye rockfish Pounds 1.0000Quillback rockfish Individual 4.0000Dusky rockfish Individual 1.0000Copper rockfish Individual 4.0000Tiger rockfish Individual 1.0000China rockfish Individual 1.0000Northern rockfish Individual 1.0000Boccaccio rockfish Individual 1.0000Unknown rockfish Individual 2.4382Unknown rockfish Pounds 1.0000Unknown rockfish [CF retention] Individual 2.4382Sablefish (black cod) Individual 3.1000Sablefish (black cod) Pounds 1.0000Sablefish (black cod) [CF retention] Individual 3.0000Sculpin [CF retention] Individual 1.0000Irish lord Individual 0.5000Unknown sculpin Individual 1.0000Unknown shark Individual 9.0000Unknown shark [CF retention] Individual 9.0000Skates Individual 5.0000Unknown sole Individual 1.0000Unknown sole [CF retention] Individual 1.0000Wolffish Individual 1.0000Dolly Varden Individual 1.4000Dolly Varden [CF retention] Individual 1.4000Lake trout Individual 1.4000Arctic grayling Individual 0.7000Northern pike Individual 3.0000Sturgeon [CF retention] Individual 34.0000Cutthroat trout Individual 1.4000Rainbow trout Individual 1.4000Steelhead Individual 1.4000Lake whitefish Individual 1.7500Unknown whitefishes Individual 1.7500Bison Individual 450.0000Black bear Individual 58.0000Caribou Individual 150.0000Deer Individual 43.2000Elk Individual 225.0000Mountain goat Individual 72.5000Moose Individual 540.0000Dall sheep Individual 104.0000Beaver Individual 8.7500Coyote Individual 0.0000
-continued-

385
Conversion factors: Tatitlek–Page 3 of 6.Resource name Reported units Conversion factor
Red fox Individual 0.0000Snowshoe hare Individual 2.0000North American river (land) otter Individual 0.0000Lynx Individual 4.0000Marten Individual 0.0000Mink Individual 0.0000Muskrat Individual 0.7500Porcupine Individual 8.0000Arctic ground (parka) squirrel Individual 0.5000Red (tree) squirrel Individual 0.5000Weasel Individual 0.0000Gray wolf Individual 0.0000Wolverine Individual 0.0000Harbor seal Individual 56.0000Sea otter Individual 0.0000Steller sea lion Individual 200.0000Bufflehead Individual 0.4000Canvasback Individual 1.1000Unknown eider Individual 1.6000Goldeneye Individual 0.8000Harlequin duck Individual 0.5000Mallard Individual 0.9000Merganser Individual 0.9000Long-tailed duck Individual 0.8000Northern pintail Individual 0.8000Scaup Individual 0.9000Black scoter Individual 0.9000Surf scoter Individual 0.9000White-winged scoter Individual 0.9000Northern shoveler Individual 0.6000Teal Individual 0.3000Wigeon Individual 0.7000Unknown ducks Individual 0.8765Unknown Canada/cackling geese Individual 1.2000Snow goose Individual 3.0000White-fronted goose Individual 2.4000Unknown geese Individual 1.7143Crane Individual 8.4000Unknown cormorant Individual 2.5000Unknown gull Individual 1.0000Black-legged kittiwake Individual 0.0000Unknown loon Individual 3.0000Murre Individual 1.0000Puffin Individual 0.5000Unknown migratory birds Individual 1.1209Spruce grouse Individual 0.7000
-continued-

386
Conversion factors: Tatitlek–Page 4 of 6.Resource name Reported units Conversion factor
Unknown grouse Individual 0.7000Ptarmigan Individual 0.7000Unknown duck eggs Individual 0.1500Unknown goose eggs Individual 0.3000Black oystercatcher eggs Individual 0.0500Unknown gull eggs Individual 0.3000Unknown gull eggs Gallons 3.0000Murre eggs Individual 0.2200Tern eggs Individual 0.0500Unknown eggs Individual 0.2885Red (large) chitons Gallons 3.0000Black (small) chitons Gallons 4.0000Butter clams Individual 0.1200Butter clams Gallons 3.0000Horse clams Gallons 3.0000Pacific littleneck clams (steamers) Individual 0.2500Pacific littleneck clams (steamers) Gallons 3.0000Pacific littleneck clams (steamers) [CF retentio Gallons 3.0000Pinkneck clams Gallons 3.0000Razor clams Individual 0.2500Razor clams Gallons 3.0000Razor clams Dozen 3.0000Razor clams [CF retention] Gallons 3.0000Unknown clams Individual 0.2500Unknown clams Gallons 3.0000Cockles Individual 0.2500Cockles Gallons 3.0000Dungeness crab Individual 0.7000Dungeness crab [CF retention] Individual 0.7000Unknown king crab Individual 2.3000Unknown king crab [CF retention] Individual 2.3000Unknown king crab [CF retention] Pounds 1.0000Tanner crab, bairdi Individual 1.6000Tanner crab, bairdi Gallons 1.6000Unknown tanner crab [CF retention] Individual 1.6000Unknown crab Individual 1.6000Limpets Gallons 1.5000Limpets Quarts 0.3750Mussels Gallons 1.5000Mussels Quarts 0.5000Octopus Individual 4.0000Octopus Pounds 1.0000Octopus Gallons 4.0000Octopus [CF retention] Individual 4.0000Oyster Gallons 3.0000Weathervane scallops Individual 0.0600
-continued-
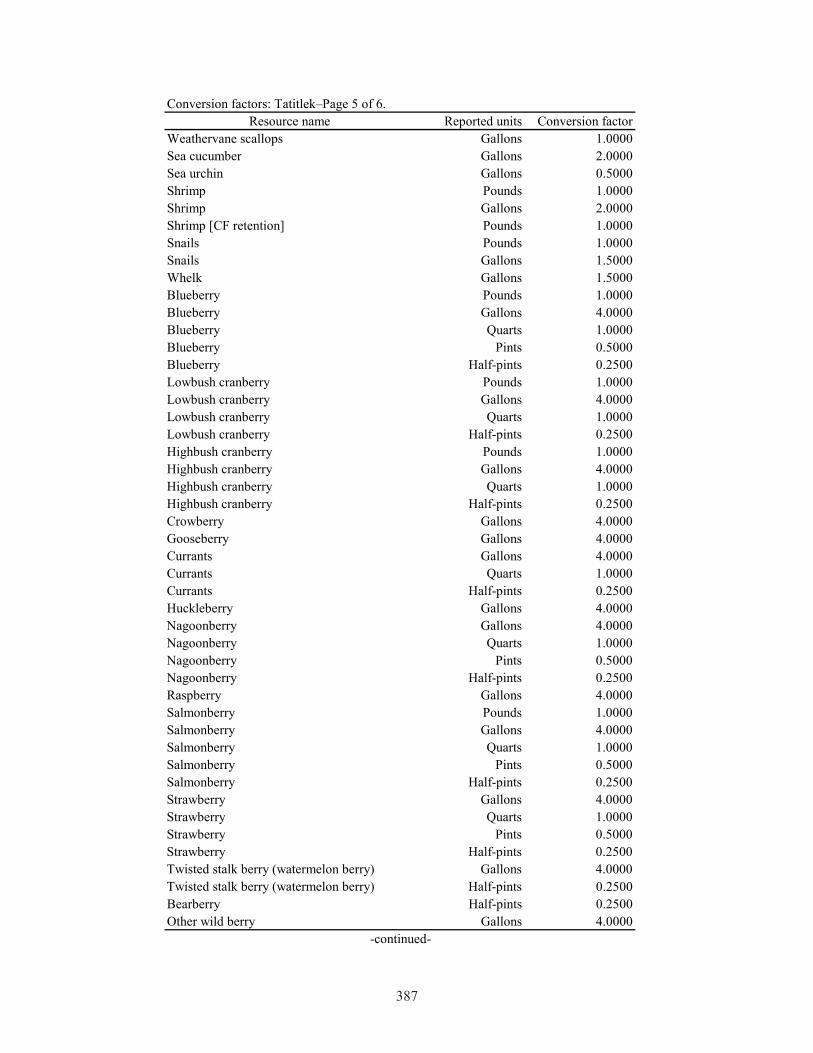
387
Conversion factors: Tatitlek–Page 5 of 6.Resource name Reported units Conversion factor
Weathervane scallops Gallons 1.0000Sea cucumber Gallons 2.0000Sea urchin Gallons 0.5000Shrimp Pounds 1.0000Shrimp Gallons 2.0000Shrimp [CF retention] Pounds 1.0000Snails Pounds 1.0000Snails Gallons 1.5000Whelk Gallons 1.5000Blueberry Pounds 1.0000Blueberry Gallons 4.0000Blueberry Quarts 1.0000Blueberry Pints 0.5000Blueberry Half-pints 0.2500Lowbush cranberry Pounds 1.0000Lowbush cranberry Gallons 4.0000Lowbush cranberry Quarts 1.0000Lowbush cranberry Half-pints 0.2500Highbush cranberry Pounds 1.0000Highbush cranberry Gallons 4.0000Highbush cranberry Quarts 1.0000Highbush cranberry Half-pints 0.2500Crowberry Gallons 4.0000Gooseberry Gallons 4.0000Currants Gallons 4.0000Currants Quarts 1.0000Currants Half-pints 0.2500Huckleberry Gallons 4.0000Nagoonberry Gallons 4.0000Nagoonberry Quarts 1.0000Nagoonberry Pints 0.5000Nagoonberry Half-pints 0.2500Raspberry Gallons 4.0000Salmonberry Pounds 1.0000Salmonberry Gallons 4.0000Salmonberry Quarts 1.0000Salmonberry Pints 0.5000Salmonberry Half-pints 0.2500Strawberry Gallons 4.0000Strawberry Quarts 1.0000Strawberry Pints 0.5000Strawberry Half-pints 0.2500Twisted stalk berry (watermelon berry) Gallons 4.0000Twisted stalk berry (watermelon berry) Half-pints 0.2500Bearberry Half-pints 0.2500Other wild berry Gallons 4.0000
-continued-

388
Conversion factors: Tatitlek–Page 6 of 6.Resource name Reported units Conversion factor
Beach asparagus Gallons 1.0000Goose tongue Gallons 1.0000Wild rhubarb Half-pints 0.0625Other beach greens Gallons 1.0000Devils club Gallons 1.0000Fiddlehead ferns Pounds 1.0000Fiddlehead ferns Gallons 1.0000Fiddlehead ferns Quarts 0.2500Fiddlehead ferns Pints 0.1250Fiddlehead ferns Half-pints 0.0625Nettle Gallons 1.0000Hudson's Bay (Labrador) tea Gallons 1.0000Hudson's Bay (Labrador) tea Half-pints 0.0625Salmonberry shoots Half-pints 0.0625Dandelion greens Gallons 1.0000Sourdock Gallons 1.0000Spruce tips Gallons 1.0000Spruce tips Quarts 0.2500Spruce tips Pints 0.1250Spruce tips Half-pints 0.0625Wild celery Gallons 1.0000Wild celery Pints 0.1250Wild parsley Gallons 1.0000Wild rose hips Gallons 4.0000Other wild greens Pounds 1.0000Other wild greens Gallons 1.0000Unknown mushrooms Pounds 1.0000Unknown mushrooms Gallons 1.0000Unknown mushrooms Quarts 0.2500Sorrel Gallons 1.0000Fireweed Gallons 1.0000Stinkweed Gallons 1.0000Black seaweed Gallons 4.0000Bull kelp 5 gallon buckets 20.0000Bull kelp Gallons 4.0000Red seaweed Gallons 4.0000Sea ribbons Gallons 4.0000Giant kelp (macropcystis) Gallons 4.0000Alaria Gallons 4.0000Bladder wrack Gallons 4.0000Unknown seaweed Gallons 4.0000Wood Cords 0.0000Alder Individual 0.0000Source ADF&G Division of Subsistence household surveys, 2015.

389
Resource name Reported units Conversion factorChum salmon Individual 5.6388Chum salmon [CF retention] Individual 5.6388Coho salmon Individual 6.0600Coho salmon Pounds 1.0000Coho salmon [CF retention] Individual 6.0600Chinook salmon Individual 12.7368Chinook salmon [CF retention] Individual 12.7368Pink salmon Individual 2.4601Pink salmon [CF retention] Individual 2.4601Sockeye salmon Individual 4.3882Sockeye salmon [CF retention] Individual 4.3882Sockeye salmon [CF retention] Pounds 1.0000Landlocked salmon Individual 1.5000Unknown salmon Individual 5.6035Unknown salmon Pounds 1.0000Unknown salmon [CF retention] Individual 5.6035Unknown salmon [CF retention] Pounds 1.0000Pacific herring Individual 0.4000Pacific herring Pounds 1.0000Pacific herring Gallons 6.0000Pacific herring [CF retention] Gallons 6.0000Pacific herring roe Gallons 7.0000Pacific herring roe/unspecified Gallons 7.0000Pacific herring sac roe [CF retention] Gallons 7.0000Pacific herring spawn on kelp Gallons 7.0000Pacific herring spawn on kelp [CF retention] Gallons 7.0000Smelt Pounds 1.0000Eulachon (hooligan, candlefish) Gallons 3.2500Unknown smelt Pounds 1.0000Unknown smelt Gallons 3.2500Sea bass Individual 1.0000Pacific (gray) cod Individual 3.2000Pacific (gray) cod Pounds 1.0000Pacific (gray) cod [CF retention] Individual 3.0000Pacific tomcod Individual 0.5000Walleye pollock (whiting) Individual 1.4000Walleye pollock (whiting) [CF retention] Individual 1.4000Eel Individual 3.6000Starry flounder Individual 3.0000Unknown flounder [CF retention] Individual 3.0000Greenling Individual 1.0000Lingcod Individual 4.0000Lingcod Pounds 1.0000Lingcod [CF retention] Individual 4.0000Unknown greenling Individual 1.0000Unknown greenling [CF retention] Individual 1.0000
-continued-
Conversion factors: Cordova
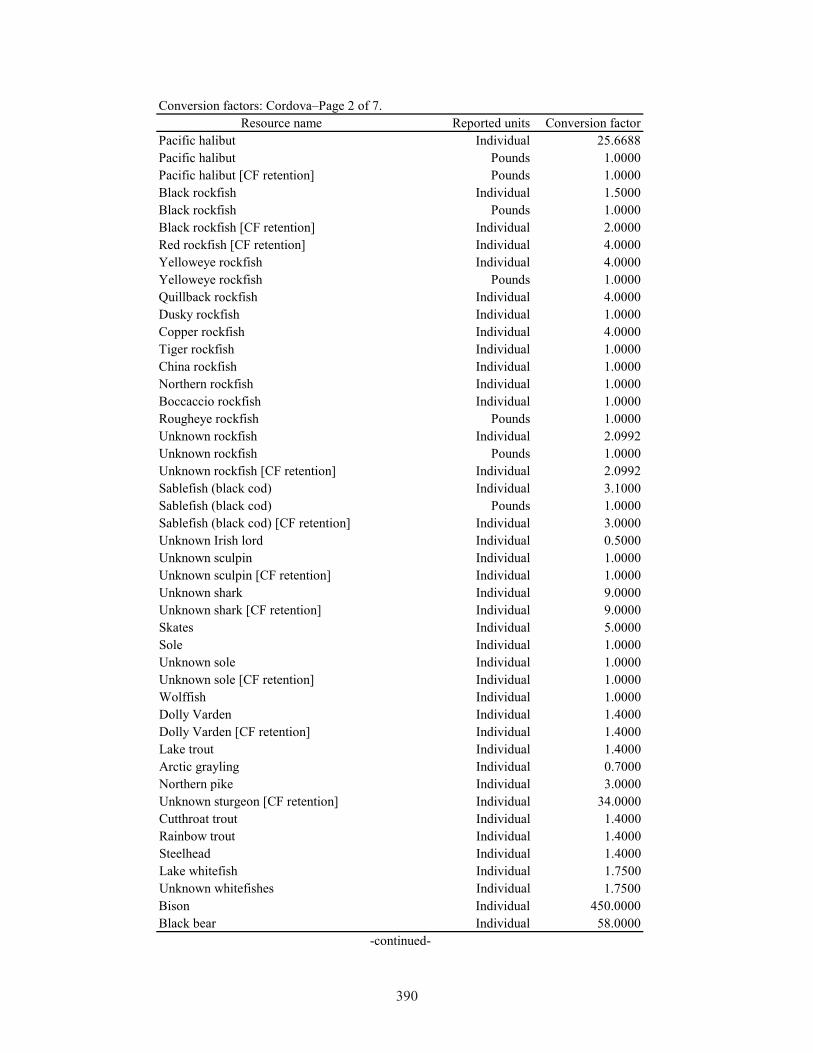
390
Conversion factors: Cordova–Page 2 of 7.Resource name Reported units Conversion factor
Pacific halibut Individual 25.6688Pacific halibut Pounds 1.0000Pacific halibut [CF retention] Pounds 1.0000Black rockfish Individual 1.5000Black rockfish Pounds 1.0000Black rockfish [CF retention] Individual 2.0000Red rockfish [CF retention] Individual 4.0000Yelloweye rockfish Individual 4.0000Yelloweye rockfish Pounds 1.0000Quillback rockfish Individual 4.0000Dusky rockfish Individual 1.0000Copper rockfish Individual 4.0000Tiger rockfish Individual 1.0000China rockfish Individual 1.0000Northern rockfish Individual 1.0000Boccaccio rockfish Individual 1.0000Rougheye rockfish Pounds 1.0000Unknown rockfish Individual 2.0992Unknown rockfish Pounds 1.0000Unknown rockfish [CF retention] Individual 2.0992Sablefish (black cod) Individual 3.1000Sablefish (black cod) Pounds 1.0000Sablefish (black cod) [CF retention] Individual 3.0000Unknown Irish lord Individual 0.5000Unknown sculpin Individual 1.0000Unknown sculpin [CF retention] Individual 1.0000Unknown shark Individual 9.0000Unknown shark [CF retention] Individual 9.0000Skates Individual 5.0000Sole Individual 1.0000Unknown sole Individual 1.0000Unknown sole [CF retention] Individual 1.0000Wolffish Individual 1.0000Dolly Varden Individual 1.4000Dolly Varden [CF retention] Individual 1.4000Lake trout Individual 1.4000Arctic grayling Individual 0.7000Northern pike Individual 3.0000Unknown sturgeon [CF retention] Individual 34.0000Cutthroat trout Individual 1.4000Rainbow trout Individual 1.4000Steelhead Individual 1.4000Lake whitefish Individual 1.7500Unknown whitefishes Individual 1.7500Bison Individual 450.0000Black bear Individual 58.0000
-continued-
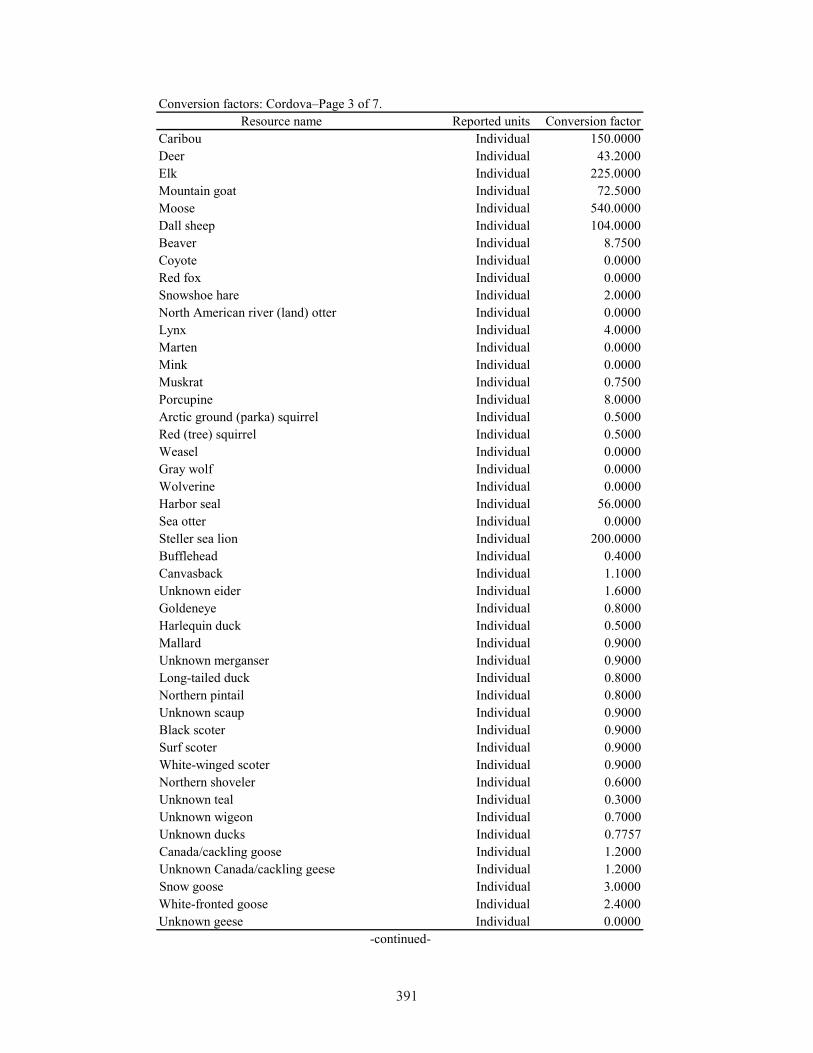
391
Conversion factors: Cordova–Page 3 of 7.Resource name Reported units Conversion factor
Caribou Individual 150.0000Deer Individual 43.2000Elk Individual 225.0000Mountain goat Individual 72.5000Moose Individual 540.0000Dall sheep Individual 104.0000Beaver Individual 8.7500Coyote Individual 0.0000Red fox Individual 0.0000Snowshoe hare Individual 2.0000North American river (land) otter Individual 0.0000Lynx Individual 4.0000Marten Individual 0.0000Mink Individual 0.0000Muskrat Individual 0.7500Porcupine Individual 8.0000Arctic ground (parka) squirrel Individual 0.5000Red (tree) squirrel Individual 0.5000Weasel Individual 0.0000Gray wolf Individual 0.0000Wolverine Individual 0.0000Harbor seal Individual 56.0000Sea otter Individual 0.0000Steller sea lion Individual 200.0000Bufflehead Individual 0.4000Canvasback Individual 1.1000Unknown eider Individual 1.6000Goldeneye Individual 0.8000Harlequin duck Individual 0.5000Mallard Individual 0.9000Unknown merganser Individual 0.9000Long-tailed duck Individual 0.8000Northern pintail Individual 0.8000Unknown scaup Individual 0.9000Black scoter Individual 0.9000Surf scoter Individual 0.9000White-winged scoter Individual 0.9000Northern shoveler Individual 0.6000Unknown teal Individual 0.3000Unknown wigeon Individual 0.7000Unknown ducks Individual 0.7757Canada/cackling goose Individual 1.2000Unknown Canada/cackling geese Individual 1.2000Snow goose Individual 3.0000White-fronted goose Individual 2.4000Unknown geese Individual 0.0000
-continued-
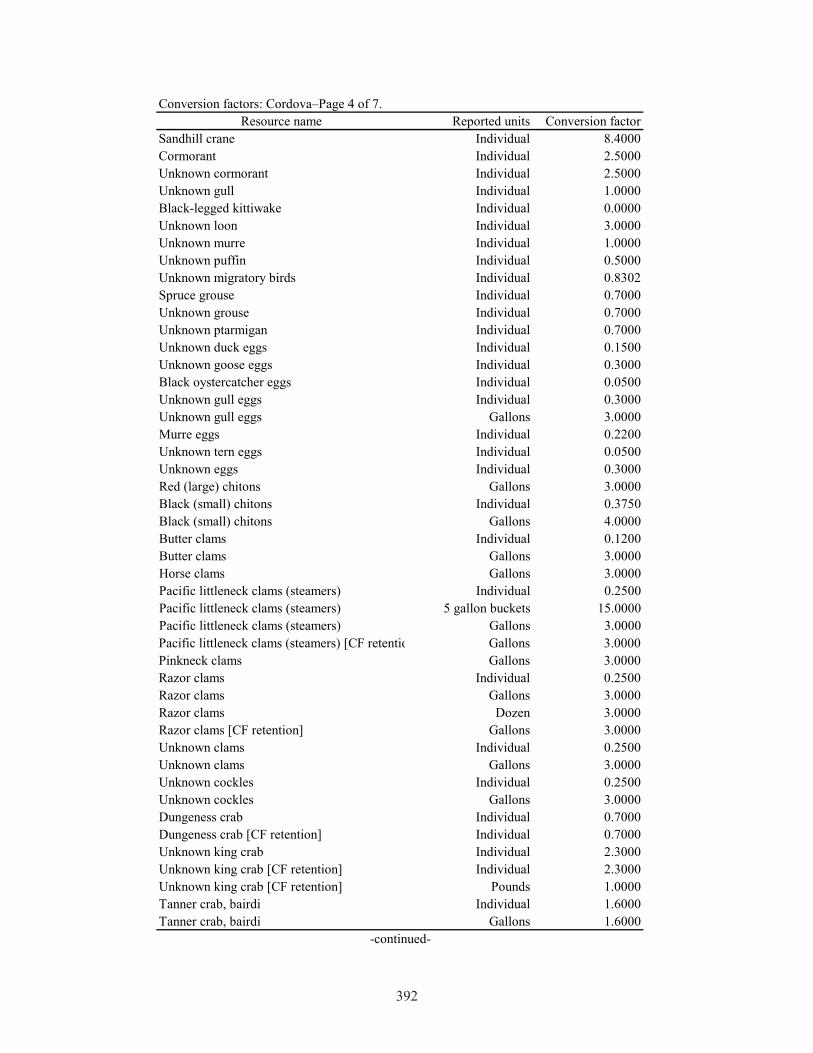
392
Conversion factors: Cordova–Page 4 of 7.Resource name Reported units Conversion factor
Sandhill crane Individual 8.4000Cormorant Individual 2.5000Unknown cormorant Individual 2.5000Unknown gull Individual 1.0000Black-legged kittiwake Individual 0.0000Unknown loon Individual 3.0000Unknown murre Individual 1.0000Unknown puffin Individual 0.5000Unknown migratory birds Individual 0.8302Spruce grouse Individual 0.7000Unknown grouse Individual 0.7000Unknown ptarmigan Individual 0.7000Unknown duck eggs Individual 0.1500Unknown goose eggs Individual 0.3000Black oystercatcher eggs Individual 0.0500Unknown gull eggs Individual 0.3000Unknown gull eggs Gallons 3.0000Murre eggs Individual 0.2200Unknown tern eggs Individual 0.0500Unknown eggs Individual 0.3000Red (large) chitons Gallons 3.0000Black (small) chitons Individual 0.3750Black (small) chitons Gallons 4.0000Butter clams Individual 0.1200Butter clams Gallons 3.0000Horse clams Gallons 3.0000Pacific littleneck clams (steamers) Individual 0.2500Pacific littleneck clams (steamers) 5 gallon buckets 15.0000Pacific littleneck clams (steamers) Gallons 3.0000Pacific littleneck clams (steamers) [CF retentio Gallons 3.0000Pinkneck clams Gallons 3.0000Razor clams Individual 0.2500Razor clams Gallons 3.0000Razor clams Dozen 3.0000Razor clams [CF retention] Gallons 3.0000Unknown clams Individual 0.2500Unknown clams Gallons 3.0000Unknown cockles Individual 0.2500Unknown cockles Gallons 3.0000Dungeness crab Individual 0.7000Dungeness crab [CF retention] Individual 0.7000Unknown king crab Individual 2.3000Unknown king crab [CF retention] Individual 2.3000Unknown king crab [CF retention] Pounds 1.0000Tanner crab, bairdi Individual 1.6000Tanner crab, bairdi Gallons 1.6000
-continued-

393
Conversion factors: Cordova–Page 5 of 7.Resource name Reported units Conversion factor
Unknown tanner crab [CF retention] Individual 1.6000Unknown crab Individual 1.6000Limpets Individual 0.0100Limpets Gallons 1.5000Limpets Quarts 0.3750Unknown mussels Gallons 1.5000Unknown mussels Quarts 0.5000Octopus Individual 4.0000Octopus Pounds 1.0000Octopus Gallons 4.0000Octopus [CF retention] Individual 4.0000Unknown oyster Gallons 3.0000Weathervane scallops Individual 0.0600Weathervane scallops Gallons 1.0000Unknown sea cucumber Gallons 2.0000Unknown sea urchin Gallons 0.5000Shrimp Individual 0.0000Shrimp Pounds 1.0000Shrimp Gallons 2.0000Shrimp [CF retention] Pounds 1.0000Shrimp [CF retention] Dozen 0.0000Snails Pounds 1.0000Snails Gallons 1.5000Whelk Gallons 1.5000Blueberry Pounds 1.0000Blueberry Gallons 4.0000Blueberry Quarts 1.0000Blueberry Pints 0.5000Blueberry Half-pints 0.2500Lowbush cranberry Pounds 1.0000Lowbush cranberry Gallons 4.0000Lowbush cranberry Quarts 1.0000Lowbush cranberry Pints 0.5000Lowbush cranberry Half-pints 0.2500Highbush cranberry Pounds 1.0000Highbush cranberry Gallons 4.0000Highbush cranberry Quarts 1.0000Highbush cranberry Half-pints 0.2500Crowberry Gallons 4.0000Gooseberry Gallons 4.0000Gooseberry Quarts 1.0000Currants Gallons 4.0000Currants Quarts 1.0000Currants Half-pints 0.2500Huckleberry Gallons 4.0000Nagoonberry Gallons 4.0000
-continued-

394
Conversion factors: Cordova–Page 6 of 7.Resource name Reported units Conversion factor
Nagoonberry Quarts 1.0000Nagoonberry Pints 0.5000Nagoonberry Half-pints 0.2500Raspberry Gallons 4.0000Salmonberry Individual 0.0000Salmonberry Pounds 1.0000Salmonberry Gallons 4.0000Salmonberry Quarts 1.0000Salmonberry Pints 0.5000Salmonberry Half-pints 0.2500Strawberry Gallons 4.0000Strawberry Quarts 1.0000Strawberry Pints 0.5000Strawberry Half-pints 0.2500Twisted stalk berry (watermelon berry) Gallons 4.0000Twisted stalk berry (watermelon berry) Half-pints 0.2500Bearberry Half-pints 0.2500Other wild berry Gallons 4.0000Beach asparagus Gallons 1.0000Goose tongue Gallons 1.0000Wild rhubarb Half-pints 0.0625Other beach greens Gallons 1.0000Devils club Gallons 1.0000Fiddlehead ferns Individual 0.0000Fiddlehead ferns Pounds 1.0000Fiddlehead ferns Gallons 1.0000Fiddlehead ferns Quarts 0.2500Fiddlehead ferns Pints 0.1250Fiddlehead ferns Half-pints 0.0625Nettle Gallons 1.0000Hudson's Bay (Labrador) tea Gallons 1.0000Hudson's Bay (Labrador) tea Half-pints 0.0625Salmonberry shoots Half-pints 0.0625Dandelion greens Gallons 1.0000Sourdock Gallons 1.0000Spruce tips Gallons 1.0000Spruce tips Quarts 0.2500Spruce tips Pints 0.1250Spruce tips Half-pints 0.0625Wild celery Gallons 1.0000Wild celery Pints 0.1250Wild parsley Gallons 1.0000Wild rose hips Gallons 4.0000Wild rose hips Half-pints 0.2500Other wild greens Pounds 1.0000Other wild greens Gallons 1.0000
-continued-
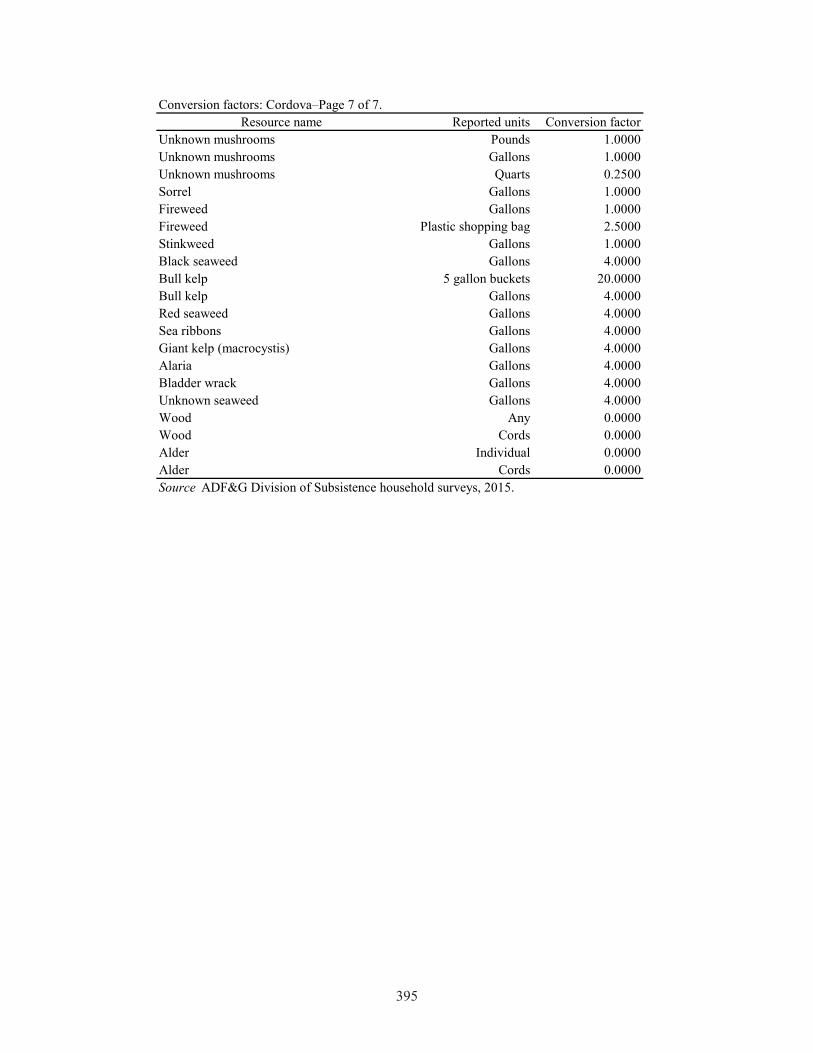
395
Conversion factors: Cordova–Page 7 of 7.Resource name Reported units Conversion factor
Unknown mushrooms Pounds 1.0000Unknown mushrooms Gallons 1.0000Unknown mushrooms Quarts 0.2500Sorrel Gallons 1.0000Fireweed Gallons 1.0000Fireweed Plastic shopping bag 2.5000Stinkweed Gallons 1.0000Black seaweed Gallons 4.0000Bull kelp 5 gallon buckets 20.0000Bull kelp Gallons 4.0000Red seaweed Gallons 4.0000Sea ribbons Gallons 4.0000Giant kelp (macrocystis) Gallons 4.0000Alaria Gallons 4.0000Bladder wrack Gallons 4.0000Unknown seaweed Gallons 4.0000Wood Any 0.0000Wood Cords 0.0000Alder Individual 0.0000Alder Cords 0.0000Source ADF&G Division of Subsistence household surveys, 2015.

396
APPENDIX C–PROJECT SUMMARY

397
1
Update on the Status of Subsistence Uses in Exxon Valdez Oil Spill Area Communities, 2014: An Overview of Study Findings
Background and MethodsThe goal of this project was to collect, analyze, and report information about subsistence uses of fish and wildlife in the 3 Exxon Valdez oil spill area communities of Cordova, Tatitlek, and Chenega Bay in 2014 that is comparable with previous research results and that can be applied to evaluate the status of subsistence uses in light of the Exxon Valdez Oil Spill Trustee Council’s (EVOSTC) recovery objective:
Subsistence will have recovered when injured resources used for subsistence are healthy and productive and exist at pre-spill levels. In addition, there is recognition that people must be confident that the resources are safe to eat and that the cultural values provided by gathering, preparing, and sharing food need to be reintegrated into community life.
Evaluating progress toward the recovery objective for subsistence entails addressing 3 questions:
1. Are resources used for subsistence purposes healthy, and are their populations at pre-spill levels?2. Are people confident that resources are safe to eat?3. Have the cultural values associated with subsistence uses been reintegrated into community life?
Assessing the recovery of subsistence uses also entails separating the potential lingering effects of the oil spill from other concurrent environmental, economic, social, and cultural factorsThe primary data gathering method was systematic household surveys using a modified version of the ADF&G Division of Subsistence standard data gathering instrument. The surveys were conducted face-to-face with community residents. Review and approval of the research plan was obtained for each study community. Sample achievement was 71% of year-round households in Chenega Bay and 78% in Tatitlek, and a random sample of 19% of households in Cordova. Study findings for Nanwalek and Port Graham, 2 lower Cook Inlet communities in the spill area for which research was funded from another source, were included in the discussion to broaden comparisons across study years and subareas.
Findings
Based on the findings from the 2014 research, evidence that subsistence uses are recovering based on the status of natural resources and subsistence uses (Question 1, above) includes:
• Relatively high levels of harvests of a variety of resources: 116 lb per capita in Cordova, 218 lb in Port Graham, 253 lb in Nanwalek, 255 lb in Chenega Bay, and 294 lb in Tatitlek;
• Widespread participation in harvest activities;• Frequent sharing of fish and wildlife harvests; and• An increase in the number of resources classified as recovered or likely recovered by the EVOSTC;
only 4 are still classified as not recovering.
Potential evidence that subsistence uses are not fully recovered based on this criterion includes:
• Harvests in 2014 as estimated in pounds per capita were down substantially from 2003 (ranging from 34% in Cordova to 53% in Port Graham; Tatitlek’s harvest rose 1%), down from post-spill averages since 1991 (from 11% in Tatitlek to 39% in Chenega Bay), and down from pre-spill estimates (from 4% in Port Graham to 42% in Cordova) (Figure 1);
• A much lower diversity of resource uses was documented in all study communities compared to pre-spill averages and post-spill averages from 1991 through 2003;
• In 2 communities (Nanwalek and Tatitlek), a notable drop occurred in the percentage of households receiving wild resources in 2014 compared to 2003; in all 5 communities, a lower percentage of
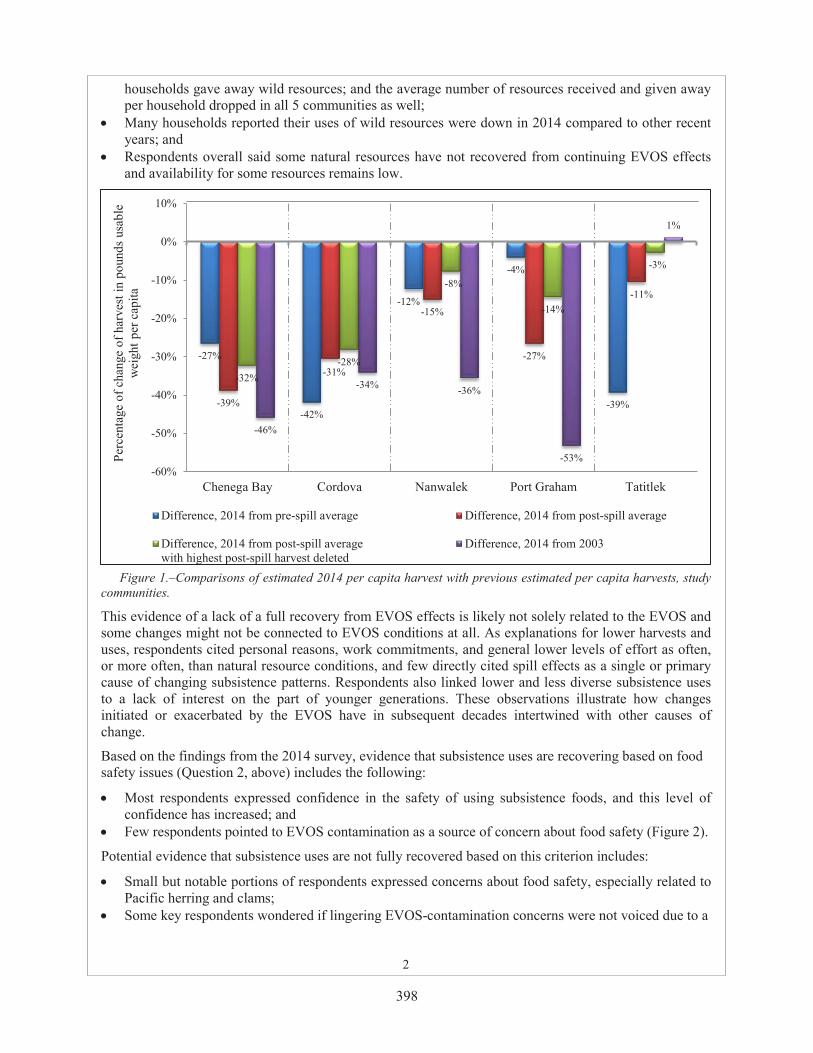
398
2
households gave away wild resources; and the average number of resources received and given away per household dropped in all 5 communities as well;
• Many households reported their uses of wild resources were down in 2014 compared to other recent years; and
• Respondents overall said some natural resources have not recovered from continuing EVOS effectsand availability for some resources remains low.
Figure 1.–Comparisons of estimated 2014 per capita harvest with previous estimated per capita harvests, study communities.
This evidence of a lack of a full recovery from EVOS effects is likely not solely related to the EVOS and some changes might not be connected to EVOS conditions at all. As explanations for lower harvests and uses, respondents cited personal reasons, work commitments, and general lower levels of effort as often, or more often, than natural resource conditions, and few directly cited spill effects as a single or primary cause of changing subsistence patterns. Respondents also linked lower and less diverse subsistence uses to a lack of interest on the part of younger generations. These observations illustrate how changes initiated or exacerbated by the EVOS have in subsequent decades intertwined with other causes of change.
Based on the findings from the 2014 survey, evidence that subsistence uses are recovering based on food safety issues (Question 2, above) includes the following:
• Most respondents expressed confidence in the safety of using subsistence foods, and this level ofconfidence has increased; and
• Few respondents pointed to EVOS contamination as a source of concern about food safety (Figure 2).
Potential evidence that subsistence uses are not fully recovered based on this criterion includes:
• Small but notable portions of respondents expressed concerns about food safety, especially related to Pacific herring and clams;
• Some key respondents wondered if lingering EVOS-contamination concerns were not voiced due to a
-27%
-42%
-12%
-4%
-39%-39%
-31%
-15%
-27%
-11%
-32%-28%
-8%
-14%
-3%
-46%
-34% -36%
-53%
1%
-60%
-50%
-40%
-30%
-20%
-10%
0%
10%
Chenega Bay Cordova Nanwalek Port Graham Tatitlek
Perc
enta
ge o
f cha
nge
of h
arve
st in
pou
nds u
sabl
e w
eigh
t per
cap
ita
Difference, 2014 from pre-spill average Difference, 2014 from post-spill average
Difference, 2014 from post-spill averagewith highest post-spill harvest deleted
Difference, 2014 from 2003

399
3
strong preference for eating traditional foods (such as clams); and• EVOS contamination was commonly cited as a cause of food safety issues among those who did
express a concern.
Figure 2.–Percentage of households that reported resource was not safe to eat, and the percentage that attributed lack of food safety to oil spill contamination, study communities combined, 2014.
Based on the findings from 2014, evidence that subsistence uses are recovering based upon reintegration of cultural values connected to subsistence uses into community life (Question 3, above) includes:
• Most respondents in some communities reported youth are learning subsistence skills; and• Most households received and gave away wild resources.
Potential evidence that subsistence uses are not fully recovered based on this criterion includes:
• Many survey respondents stated that youth are not learning subsistence skills; • Many respondents said elders’ influence continues to decline; and• Few respondents said the traditional way of life has recovered (Figure 3).
In summary, the study results support the EVOSTC’s assessment that subsistence uses are “recovering” but not fully recovered. While most injured natural resources have recovered or are recovering from the conditions created by the EVOS, cultural recovery in the communities of the spill area is ongoing, and takes place within a broad array of other sociocultural and environmental factors.
The last overview of subsistence uses in EVOS area communities, for 2003, concluded that
Conditions in the natural, economic, and social environments have changed significantly for the residents of the area affects by the spill since 1989. Some of these changes are direct consequences of the oil spill, while the link for others is less certain. This study has shown that despite these changes, subsistence uses of natural resources remain key to the health and well-being of these communities.
The same conclusion applies to the finding for 2014. Subsistence harvests remain a key source of food, include a wide range of species, are frequently shared, and provide a context for expressing and sharing the skills and values intimately linked to centuries-old traditions and future cultural survival.
0%
10%
20%
30%
40%
50%
60%
70%
80%
90%
100%
Pacific herring Harbor seal Chitons Clams Any
Perc
enta
ge o
f hou
seho
lds
Not safe Not safe due to EVOS contamination
Note The percentage of households is based on valid responses, which include only those households that use the resource .
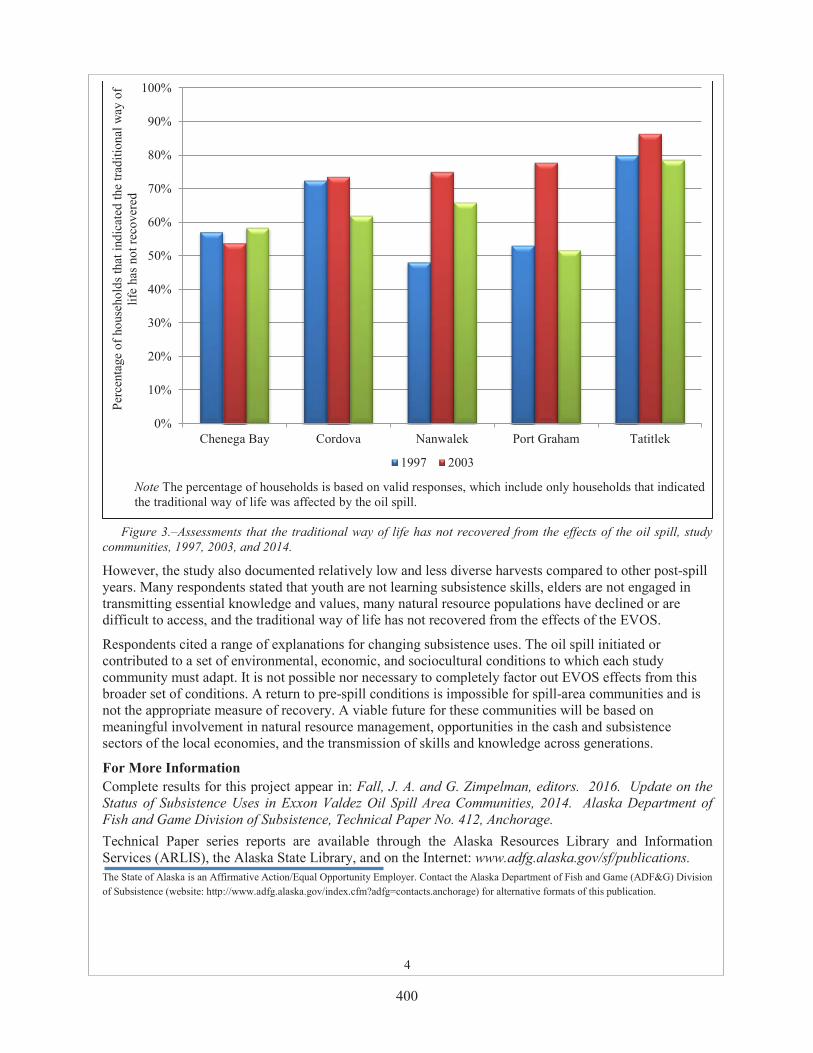
400
4
Figure 3.–Assessments that the traditional way of life has not recovered from the effects of the oil spill, study communities, 1997, 2003, and 2014.
However, the study also documented relatively low and less diverse harvests compared to other post-spill years. Many respondents stated that youth are not learning subsistence skills, elders are not engaged in transmitting essential knowledge and values, many natural resource populations have declined or are difficult to access, and the traditional way of life has not recovered from the effects of the EVOS.
Respondents cited a range of explanations for changing subsistence uses. The oil spill initiated or contributed to a set of environmental, economic, and sociocultural conditions to which each study community must adapt. It is not possible nor necessary to completely factor out EVOS effects from this broader set of conditions. A return to pre-spill conditions is impossible for spill-area communities and is not the appropriate measure of recovery. A viable future for these communities will be based on meaningful involvement in natural resource management, opportunities in the cash and subsistence sectors of the local economies, and the transmission of skills and knowledge across generations.
For More InformationComplete results for this project appear in: Fall, J. A. and G. Zimpelman, editors. 2016. Update on the Status of Subsistence Uses in Exxon Valdez Oil Spill Area Communities, 2014. Alaska Department of Fish and Game Division of Subsistence, Technical Paper No. 412, Anchorage.Technical Paper series reports are available through the Alaska Resources Library and Information Services (ARLIS), the Alaska State Library, and on the Internet: www.adfg.alaska.gov/sf/publications.The State of Alaska is an Affirmative Action/Equal Opportunity Employer. Contact the Alaska Department of Fish and Game (ADF&G) Division of Subsistence (website: http://www.adfg.alaska.gov/index.cfm?adfg=contacts.anchorage) for alternative formats of this publication.
0%
10%
20%
30%
40%
50%
60%
70%
80%
90%
100%
Chenega Bay Cordova Nanwalek Port Graham Tatitlek
Perc
enta
ge o
f hou
seho
lds t
hat i
ndic
ated
the
tradi
tiona
l way
of
life
has n
ot re
cove
red
1997 2003
Note The percentage of households is based on valid responses, which include only households that indicatedthe traditional way of life was affected by the oil spill.