resources & reserves - miningdataonline.com · institute of mining, metallurgy and petroleum...
TRANSCRIPT

Resources & Reserves as at 31 December 2016
Contents
Page number
About this report 2
Definitions 4
Metals and Minerals:
Copper 5
Zinc 16
Nickel 30
Ferroalloys 34
Iron ore 40
Energy Products:
Coal 44
Oil 63

About this report
2 Glencore - Resources & Reserves Report 2016
We report our resources and reserves in accordance with the 2012 edition of the Australasian Code for Reporting of Exploration Results, Mineral Resources and Ore Reserves (JORC Code), the 2007 edition (as amended July 2009) of the South African Code for Reporting of Mineral Resources and Mineral Reserves (SAMREC), the Canadian Institute of Mining, Metallurgy and Petroleum (CIM) Standards on Mineral Resources and Reserves (2014 edition) and the Petroleum Resources Management System (PRMS) for reporting oil and natural gas Reserves and Resources.
Overview The resource and reserve data in the following tables are as at 31 December 2016, unless otherwise noted. For comparison purposes, data for 2015 has been included. Metric units are used throughout. All data is presented on a 100% asset basis, with the Glencore attributable percentage shown against each asset, with the exception of Oil assets which are shown on a working interest basis. All tonnage information has been rounded to reflect the relative uncertainty in the estimates; there may therefore be small differences in the totals. The Measured and Indicated resources are reported inclusive of those resources modified to produce reserves, unless otherwise noted. Commodity prices and exchange rates used to establish the economic viability of reserves are based on long-term forecasts applied at the time the reserve was estimated. Where resources and reserves have not been updated, on the basis that the information has not materially changed since it was reported under JORC 2004, this information has not been updated to comply with the JORC code 2012. Reference is given in the report where this is the case.
Copper Copper has adopted the 2012 Australasian Code for Reporting of Exploration Results, Mineral Resources and Ore Reserves (JORC Code) as its standard for all public reports of exploration results, Mineral Resources and Ore Reserves. The Mineral Resources and Ore Reserves Statement has been compiled in accordance with the JORC Code. The Mineral Resources and Ore Reserves statements for Australia have been reviewed and the relevant data extracted and compiled by Jason Hosken, Glencore Copper. The Mineral Resources and Ore Reserves statements for each African and South American operation and project have been reviewed, with the data being extracted and compiled by the respective competent person for each operation and project.
Zinc The Zinc Mineral Resource and Ore Reserve Statement at 31 December 2016 has been compiled in accordance with the 2012 Australasian Code for Reporting of Exploration Results, Mineral Resources and Ore Reserves (JORC Code). The term ‘Ore Reserves’, as defined in Clause 28 of the JORC Code, has the same meaning as ‘Mineral Reserves’ as defined in The Canadian Institute of Mining, Metallurgy and Petroleum (CIM) Definition Standards for Mineral Resources and Mineral Reserves. The Mineral Resource and Ore Reserve statements have been reviewed and the relevant data extracted and compiled by Ignacio Seebold, Glencore Zinc (ICOG-EurGeol).
Nickel The Mineral Resources and Mineral Reserves estimates are prepared in accordance with the Canadian Institute of Mining, Metallurgy and Petroleum (CIM) Definition Standards on Mineral Resources and Mineral Reserves, adopted by CIM Council on 10 May 2014, and the CIM Estimation of Mineral Resources and Mineral Reserves Best Practice Guidelines, adopted by CIM Council on 23 November 2003, and have been compiled using geo-statistical and/or classical methods, plus economic and mining parameters appropriate to each project. The Mineral Resource and Ore Reserve estimates at Murrin in Australia have been prepared in accordance with the 2012 Australasian Code for Reporting of Exploration Results, Mineral Resources and Ore Reserves (JORC Code). The Mineral Resource and Ore Reserve statements have been reviewed and the relevant data extracted and compiled by Steve Kormos, Glencore Nickel.
Ferroalloys South African chromite, vanadium and PGM’s (platinum group metals) Mineral Resources and Ore Reserves in this report were prepared in accordance with the 2012 Australasian Code for Reporting of Exploration Results, Mineral Resources and Ore Reserves (JORC Code). The Chromite, Vanadium and PGM’s Mineral Resource and Ore Reserve Statement at 31 December 2016 is based on the Glencore Ferroalloys “Procedure for the Estimation of Mineral Resources and Ore Reserves”. Definitions of all the terms used in this report can be found in the relevant code.
About this report
3 Glencore - Resources & Reserves Report 2016
The Mineral Resource and Ore Reserve statements have been reviewed and the relevant data extracted and compiled by Pieter-Jan Gräbe, Glencore Ferroalloys (SACNASP).
Iron Ore Iron ore Mineral Resources and Ore Reserves have been compiled in accordance with the 2012 Australasian Code for Reporting of Exploration Results, Mineral Resources and Ore Reserves (JORC Code), unless otherwise stated in the notes for a particular Mineral Resource and Ore Reserve. Iron Ore Mineral Resources and Ore Reserves have not been re-estimated since 2015.
Coal Australian, Canadian and Colombian (Prodeco) Coal Resources and Reserves have been prepared in accordance with the 2012 Australasian Code for Reporting of Exploration Results, Mineral Resources and Ore Reserves (JORC Code). South African and Colombian (Cerrejón) Coal Resources and Reserves have been prepared in accordance with the 2007 edition (as amended July 2009) of the South African Code for Reporting of Mineral Resources and Mineral Reserves (SAMREC). The Coal Resource and Reserve Statements as at 31 December 2016 conform to the requirements of these Codes and are consistent with Glencore Coal’s internal Coal Resource and Reserve Estimation and Reporting Standard. Coal resources have been estimated for all coal seams that have reasonable prospects for eventual economic extraction by open cut or underground mining methods within mining leases or exploration licences. In general, Coal Resources are reported within a geoshell limited by the areal and depth extent of the drill holes; i.e. there is very little inclusion of Coal Resources extrapolated beyond the extent of the geological data. Coal Resources are excluded from those areas where the seam has been extracted or sterilised by mining. All tonnage information has been rounded to reflect the relative uncertainty in the estimates; there may therefore be small differences in the totals.
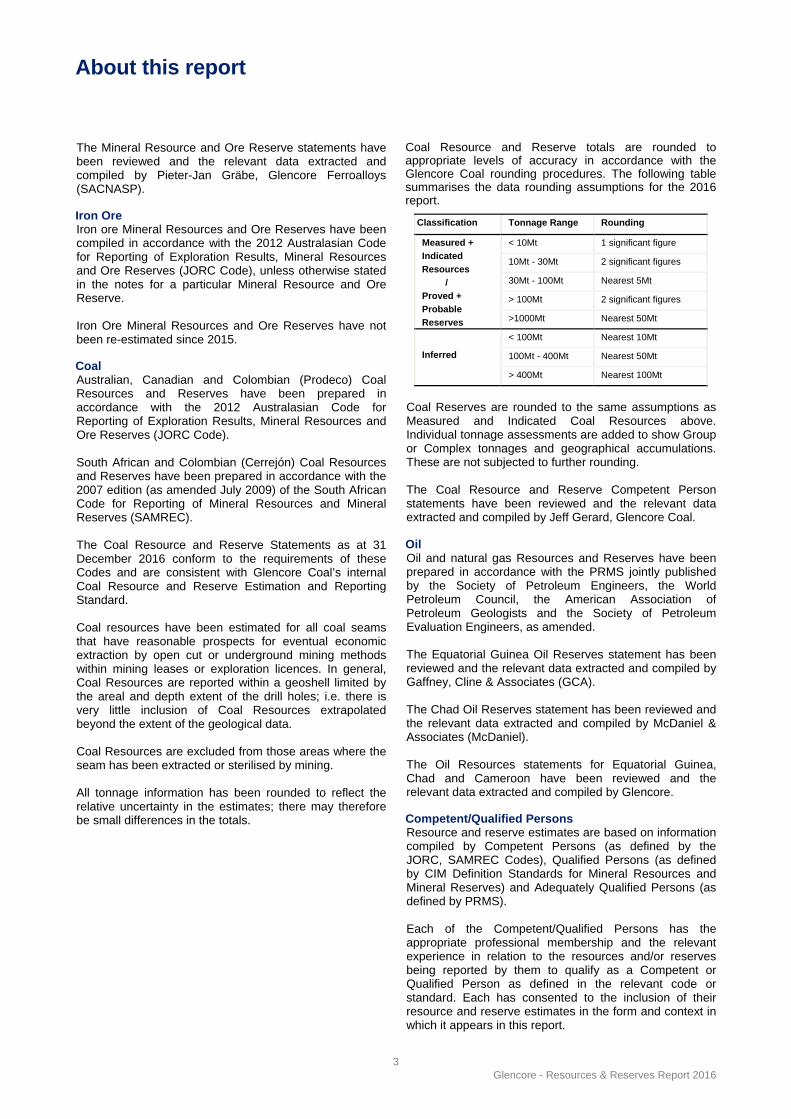
Coal Resource and Reserve totals are rounded to appropriate levels of accuracy in accordance with the Glencore Coal rounding procedures. The following table summarises the data rounding assumptions for the 2016 report.
Classification Tonnage Range Rounding
Measured +
Indicated
Resources
/
Proved +
Probable
Reserves
< 10Mt 1 significant figure
10Mt - 30Mt 2 significant figures
30Mt - 100Mt Nearest 5Mt
> 100Mt 2 significant figures
>1000Mt Nearest 50Mt
Inferred
< 100Mt Nearest 10Mt
100Mt - 400Mt Nearest 50Mt
> 400Mt Nearest 100Mt
Coal Reserves are rounded to the same assumptions as Measured and Indicated Coal Resources above. Individual tonnage assessments are added to show Group or Complex tonnages and geographical accumulations. These are not subjected to further rounding. The Coal Resource and Reserve Competent Person statements have been reviewed and the relevant data extracted and compiled by Jeff Gerard, Glencore Coal. Oil Oil and natural gas Resources and Reserves have been prepared in accordance with the PRMS jointly published by the Society of Petroleum Engineers, the World Petroleum Council, the American Association of Petroleum Geologists and the Society of Petroleum Evaluation Engineers, as amended. The Equatorial Guinea Oil Reserves statement has been reviewed and the relevant data extracted and compiled by Gaffney, Cline & Associates (GCA). The Chad Oil Reserves statement has been reviewed and the relevant data extracted and compiled by McDaniel & Associates (McDaniel). The Oil Resources statements for Equatorial Guinea, Chad and Cameroon have been reviewed and the relevant data extracted and compiled by Glencore.
Competent/Qualified Persons Resource and reserve estimates are based on information compiled by Competent Persons (as defined by the JORC, SAMREC Codes), Qualified Persons (as defined by CIM Definition Standards for Mineral Resources and Mineral Reserves) and Adequately Qualified Persons (as defined by PRMS). Each of the Competent/Qualified Persons has the appropriate professional membership and the relevant experience in relation to the resources and/or reserves being reported by them to qualify as a Competent or Qualified Person as defined in the relevant code or standard. Each has consented to the inclusion of their resource and reserve estimates in the form and context in which it appears in this report.
Definitions
4 Glencore - Resources & Reserves Report 2016
Throughout this report, the following abbreviations and definitions have been used: 3PGE Three Platinum Group Elements (Platinum, Palladium and Rhodium)
AIG Australian Institute of Geoscientists
APEGBC Association of Professional Engineers and Geoscientists of BC
APEGGA Association of Professional Engineers Geologists and Geophysicists of Alberta
APEGNB Association of Professional Engineers and Geoscientists of New Brunswick
APGO Association of Professional Geoscientists of Ontario
AusIMM Australasian Institute of Mining and Metallurgy
CIM Canadian Institute of Mining, Metallurgy and Petroleum
CV (kcal/kg) Calorific Value, kilo calories per kilogramme
DTC Davis Tube Concentrate
ECSA Engineering Council of South Africa
EL Exploration Licence
FPSO Floating production, storage and offloading
Geoshell A broad envelope limited by the depth and areal extent of geological data points (primarily drill holes)
GSL Geological Society of London
ICOG-EurGeol Ilustre Colegio Oficial de Geólogos – European Geologist
JORC Joint Ore Reserves Committee
kt Thousand tonnes
LOM Life of Mine
LOX Limit of Oxidation
LOZ Lower Oxidised Zone
Mt Million tonnes
NSR Net Smelter Return
OC Open cast or Open cut
OGQ Ordre des Géologues du Québec
OIQ Ordre des Ingénieurs du Québec
OR Ore Reserves
PEO Professional Engineers of Ontario
PLATO South African Council for Professional and Technical Surveyors
PRMS Petroleum Resources Management System
QQ Quantile quantile plot, a geostatistical method to assess modelled data against actual data
ROM Run of Mine
SACNASP The South African Council for Natural Scientific Professions
SAMREC South African Code for Reporting of Mineral Resources and Mineral Reserves
UG Underground
UG2 Upper Group No2 Chromitite layer
VMS Volcanogenic Massive Sulphide
Marketable Coal Reserves (CIM/JORC) and Saleable Coal Reserves (SAMREC) are the tonnage and coal quality that will be available for sale, either in the raw ROM state at specific moisture content or after beneficiation of the ROM Coal Reserve has produced materials at specified qualities, moisture contents and size ranges.
Definitions of many of the terms used in this report can be found in the relevant codes.

Metals and Minerals Copper
5 Glencore - Resources & Reserves Report 2016
African Copper Mineral Resources (Katanga, Mutanda, Mopani)
Name of operation
Attributable interest
Mining method Commodity
Measured Mineral Resources
Indicated Mineral Resources
Measured and Indicated Resources
Inferred Mineral Resources Competent
person31.12.16 31.12.15 31.12.16 31.12.15 31.12.16 31.12.15 31.12.16 31.12.15
Katanga
Kamoto 56.4% UG (Mt) 12.2 9.5 65.9 72.9 78.1 82.4 48.5 49.2 CS
Copper (%) 3.90 3.91 3.92 3.84 3.92 3.85 3.83 4.44
Cobalt (%) 0.59 0.48 0.46 0.43 0.48 0.43 0.38 0.34
T17 (OC&UG) 56.4% (Mt) 4.2 4.2 9.4 9.4 13.6 13.6 5.2 5.2 CS
UG/OC Copper (%) 2.66 2.66 4.44 4.44 3.89 3.89 4.21 4.21
Cobalt (%) 0.51 0.51 0.65 0.65 0.61 0.61 0.98 0.98
Mashamba 56.4% OC (Mt) – – 60.0 26.2 60.0 26.2 18.3 37.2 CS
East Copper (%) – – 1.68 1.51 1.68 1.51 2.85 2.33
Cobalt (%) – – 0.62 0.71 0.62 0.71 0.47 0.53
KOV OC, 56.4% OC (Mt) – – 110.5 71.4 110.5 71.4 78.2 91.0 CS
KOV UG, Copper (%) – – 4.75 4.16 4.75 4.16 4.39 4.44
KTE Cobalt (%) – – 0.53 0.51 0.53 0.51 0.38 0.36
Kananga 56.4% (Mt) – – 4.1 4.1 4.1 4.1 4.0 4.0 CS
Copper (%) – – 1.61 1.61 1.61 1.61 2.00 2.00
Cobalt (%) – – 0.79 0.79 0.79 0.79 0.98 0.98
Tilwezembe 56.4% (Mt) – – 9.5 9.5 9.5 9.5 13.8 13.8 CS
Copper (%) – – 1.89 1.89 1.89 1.89 1.75 1.75
Cobalt (%) – – 0.60 0.60 0.60 0.60 0.60 0.60
Total Katanga (Mt) 16 14 259 194 276 207 168 200
Copper (%) 3.58 3.53 3.66 3.53 3.66 3.53 3.78 3.81
Cobalt (%) 0.57 0.49 0.54 0.52 0.55 0.52 0.44 0.43
Mutanda
Mutanda 69.0% OC (Mt) 197.3 193.7 164.4 168.1 361.7 361.8 175.8 162.4 CS
South Copper (%) 1.71 1.78 1.20 1.16 1.48 1.49 0.92 0.90
Cobalt (%) 0.66 0.70 0.45 0.43 0.56 0.57 0.29 0.29
Mutanda 69.0% OC Mt 48.1 48.1 29.1 29.1 77.2 77.2 58.9 58.9 CS
North Copper (%) 0.73 0.73 0.51 0.51 0.65 0.65 0.48 0.48
Cobalt (%) 0.34 0.34 0.14 0.14 0.26 0.26 0.08 0.08
Total Mutanda (Mt) 245 242 194 197 439 439 235 221
Copper (%) 1.52 1.57 1.10 1.06 1.33 1.34 0.81 0.79
Cobalt (%) 0.60 0.63 0.40 0.39 0.51 0.52 0.24 0.23
Mopani
Nkana 73.1% UG (Mt) 149.8 151.7 46.6 47.0 196.4 198.7 50.2 51.1 CS
Sulphides Copper (%) 2.09 2.10 2.02 2.00 2.07 2.08 1.97 1.97
Cobalt (%) 0.11 0.11 0.12 0.12 0.11 0.11 0.15 0.14
Nkana 73.1% UG/OC (Mt) 7.3 7.5 1.9 1.9 9.2 9.4 1.5 1.6 CS
Oxides Copper (%) 2.28 2.32 1.93 1.94 2.21 2.24 1.91 1.92
Cobalt (%) 0.03 0.03 0.05 0.05 0.03 0.03 0.04 0.04
Nkana 73.1% (Mt) – – 5.7 5.7 5.7 5.7 0.8 0.8 CS
Tailings Copper (%) – – 0.71 0.71 0.71 0.71 0.94 0.94
Dump Cobalt (%) – – 0.07 0.07 0.07 0.07 0.07 0.07
Mufulira 73.1% UG (Mt) 33.5 28.0 15.9 12.5 49.4 40.5 21.9 24.0 CS
Sulphides Copper (%) 2.45 2.46 2.57 2.75 2.49 2.55 2.42 2.46
Mufulira 73.1% UG (Mt) 8.8 8.8 2.0 2.0 10.8 10.7 1.3 1.3 CS
Oxides Copper (%) 1.19 1.19 0.90 0.90 1.14 1.14 0.81 0.82
Mufulira 73.1% (Mt) 3.0 3.0 1.8 1.8 4.8 4.9 1.3 1.3 CS
Surface Copper (%) 1.81 1.81 1.80 1.80 1.81 1.81 1.76 1.76
Total Mopani (Mt) 202 199 74 71 277 270 77 80
Copper (%) 2.11 2.11 2.00 1.99 2.08 2.08 2.06 2.08
Cobalt (%) 0.08 0.08 0.08 0.09 0.08 0.08 0.10 0.09
Metals and Minerals Copper
6 Glencore - Resources & Reserves Report 2016
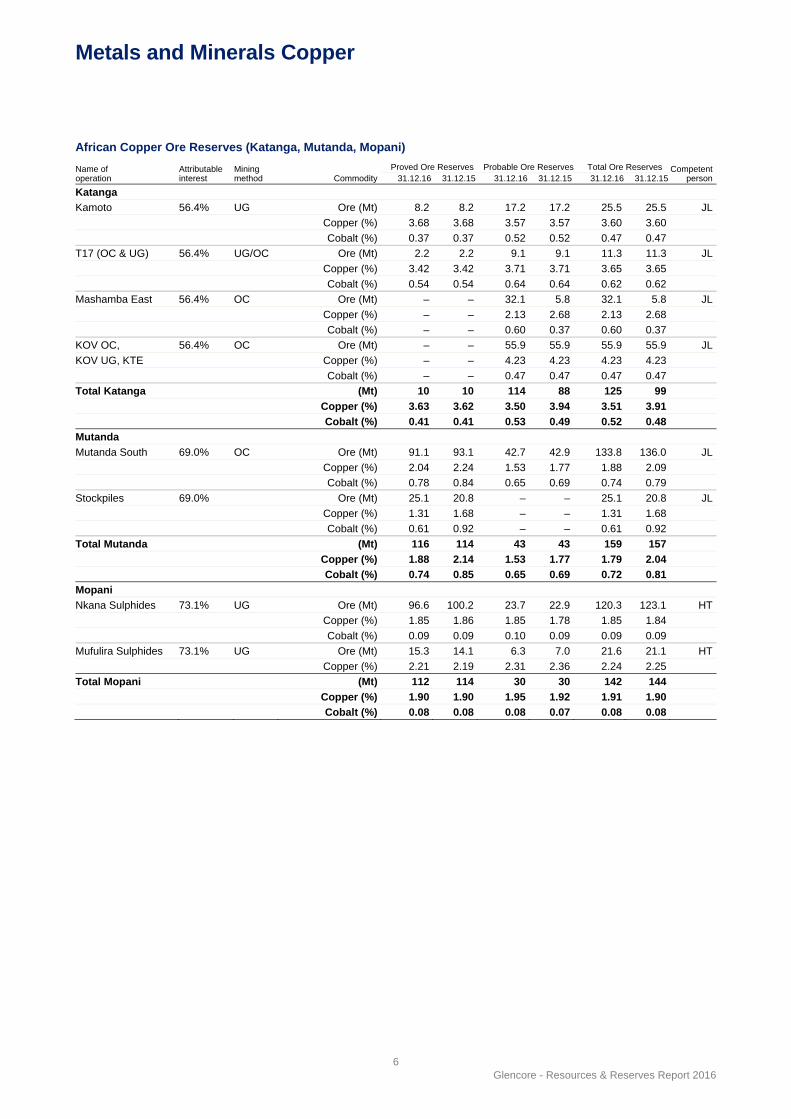
African Copper Ore Reserves (Katanga, Mutanda, Mopani)
Name of operation
Attributable interest
Mining method Commodity
Proved Ore Reserves Probable Ore Reserves Total Ore Reserves Competentperson31.12.16 31.12.15 31.12.16 31.12.15 31.12.16 31.12.15
Katanga
Kamoto 56.4% UG Ore (Mt) 8.2 8.2 17.2 17.2 25.5 25.5 JL
Copper (%) 3.68 3.68 3.57 3.57 3.60 3.60
Cobalt (%) 0.37 0.37 0.52 0.52 0.47 0.47
T17 (OC & UG) 56.4% UG/OC Ore (Mt) 2.2 2.2 9.1 9.1 11.3 11.3 JL
Copper (%) 3.42 3.42 3.71 3.71 3.65 3.65
Cobalt (%) 0.54 0.54 0.64 0.64 0.62 0.62
Mashamba East 56.4% OC Ore (Mt) – – 32.1 5.8 32.1 5.8 JL
Copper (%) – – 2.13 2.68 2.13 2.68
Cobalt (%) – – 0.60 0.37 0.60 0.37
KOV OC, 56.4% OC Ore (Mt) – – 55.9 55.9 55.9 55.9 JL
KOV UG, KTE Copper (%) – – 4.23 4.23 4.23 4.23
Cobalt (%) – – 0.47 0.47 0.47 0.47
Total Katanga (Mt) 10 10 114 88 125 99
Copper (%) 3.63 3.62 3.50 3.94 3.51 3.91
Cobalt (%) 0.41 0.41 0.53 0.49 0.52 0.48
Mutanda
Mutanda South 69.0% OC Ore (Mt) 91.1 93.1 42.7 42.9 133.8 136.0 JL
Copper (%) 2.04 2.24 1.53 1.77 1.88 2.09
Cobalt (%) 0.78 0.84 0.65 0.69 0.74 0.79
Stockpiles 69.0% Ore (Mt) 25.1 20.8 – – 25.1 20.8 JL
Copper (%) 1.31 1.68 – – 1.31 1.68
Cobalt (%) 0.61 0.92 – – 0.61 0.92
Total Mutanda (Mt) 116 114 43 43 159 157
Copper (%) 1.88 2.14 1.53 1.77 1.79 2.04
Cobalt (%) 0.74 0.85 0.65 0.69 0.72 0.81
Mopani
Nkana Sulphides 73.1% UG Ore (Mt) 96.6 100.2 23.7 22.9 120.3 123.1 HT
Copper (%) 1.85 1.86 1.85 1.78 1.85 1.84
Cobalt (%) 0.09 0.09 0.10 0.09 0.09 0.09
Mufulira Sulphides 73.1% UG Ore (Mt) 15.3 14.1 6.3 7.0 21.6 21.1 HT
Copper (%) 2.21 2.19 2.31 2.36 2.24 2.25
Total Mopani (Mt) 112 114 30 30 142 144
Copper (%) 1.90 1.90 1.95 1.92 1.91 1.90
Cobalt (%) 0.08 0.08 0.08 0.07 0.08 0.08
Metals and Minerals Copper
7 Glencore - Resources & Reserves Report 2016
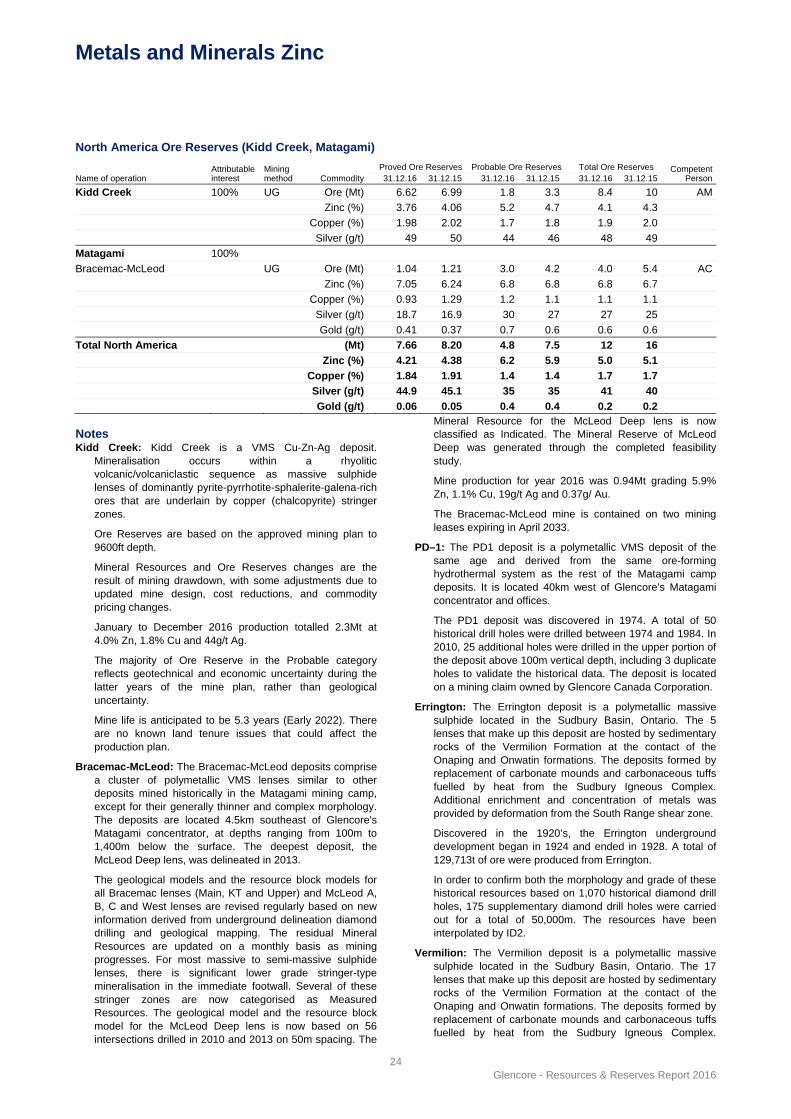
Notes Katanga: Remaining life of mine: expected to be in excess of
20 years. Expiry date of relevant permits: 7 May 2022 for the Kananga Extension and 3 April 2024 for all remaining permits (KTO and Mashamba East Open Pit, T-17 Open Pit, KOV Open Pit, Tilwezembe Open Pit, Kananga Mine), renewable in accordance with the DRC mining code for a period of 15 years.
Glencore owns 75.2% of Katanga Mining Limited (“KML”), which in turn owns 75% of Kamoto Copper Company SARL (“KCC”). KCC owns the material assets, including the mining and exploration rights related to the mining assets. La Generale des Carrieres et des Mines and La Société Immobilière du Congo, which are state-owned mining companies in the DRC, own the other 25% of KCC.
With the exception of Tilwezembe, primary mineralisation, in the form of sulphides, within the Lower Roan is associated with the Stratified Dolomite and Silicified Rocks for the Orebody Inferior and the Basal Schists and Upper Dolomitic Shales for the Orebody Superior and is thought to be sys-sedimentary in origin. Typical primary copper sulphide minerals are bornite, chalcopyrite, chalcocite and occasional native copper while cobalt is in the form of carrolite. The mineralisation occurs as disseminations or in association with hydrothermal carbonate alteration and silicification.
The mineralisation at Tilwezembe Mine is atypical being hosted by the Mwashya or R4 Formation. The mineralisation generally occurs as infilling of fissures and open fractures associated with the brecciation. The typical copper minerals are mainly chalcopyrite, malachite and pseudomalachite while cobalt is in the form of heterogenite, carrolite and spherocobaltite. Manganese minerals are psilomelane and manganite.
The increase in Mineral Resources from 2015 to 2016 is due to new drilling data and updated geological models developed for Mashamba East, KOV and KTO. Ore Reserves for Mashamba East increased as a result of revised pit optimisation and redesign based on the updated Mineral Resource model.
Mutanda: Remaining mine life: estimated in excess of 15 years. Expiry date of relevant mining permits: 26 May 2022 for Mutanda South (“Mutanda”) and 1 July 2022 for Mutanda North (“Kansuki”). Both mining permits are renewable in accordance with the DRC mining code for periods of 15 years.
Kansuki consists of Kabwimia, Area 2 East, and Area 2 West. Mutanda consists of East (includes Area 1), Central (includes Central North West), and West.
Mopani: Remaining life of mine: 28 years for Nkana and 12
years for Mufulira. Expiry date of relevant mining/ concession licences: 31 March 2025 for both of these mines.
Within the Nkana mining area there are four underground mines and a series of open pits. The open pits are under care and maintenance and have therefore been excluded from Ore Reserves and included under Mineral Resources. All are situated on the north-eastern limb of the Nkana Syncline area. Other cupriferous zones are present in the nose and southwest limb of the syncline. The orebodies are stratiform and are mainly confined to a recognisable ore formation, which occurs near the base of the Katangan sequence within the Lower Roan Group of the Mine Series. In the underground workings, the principal copper ore minerals are chalcopyrite and bornite with subordinate chalcocite. There is a zoning in the geographical distribution of these minerals. Cobalt occurs as carrollite and cobaltiferious pyrite. The principal ore minerals are malachite, pseudomalchite, chrysocolla, native copper, cuprite and libethenite. In the open pit, malachite and chrysocolla are the principal ore minerals in the zone of oxidation closer to the surface. In some places however, vermiculite, malachite pseudomalachite and accessory wad are more important. At deeper levels chalcopyrite, bornite and chalcocite are predominantly present.
In the Mufulira mining area, the Basement Complex topography appears to have exerted a significant structural control during deformation. The distribution of ore minerals in all three orebodies is stratigraphically controlled, occurring dominantly as disseminations, blebs and irregular masses. The principal copper minerals are chalcopyrite (60%), bornite (40%), and minor/trace chalcocite. Oxide minerals are confined to near surface occurrences, and supergene enrichment zones. Generally the deposit is structurally simple being characterised by three main folds that are in part overturned with a plunge and dip approximately 10º to the northeast. The basin is open and untested at depth.
Competent Persons CS = Christiano Santos Goncalves of Golder Associates Africa
(Pty) Ltd, (MAusIMM CP (Geo)).
HT = Hugo Tukker of Golder Associates Africa (Pty) Ltd, (ECSA, PrEng).
JL = Jacobus Lotheringen of Ukwazi Mining Solutions (Pty) Ltd, for Golder Associates Africa (Pty) Ltd, (SAIMM, PrEng.).
Metals and Minerals Copper
8 Glencore - Resources & Reserves Report 2016
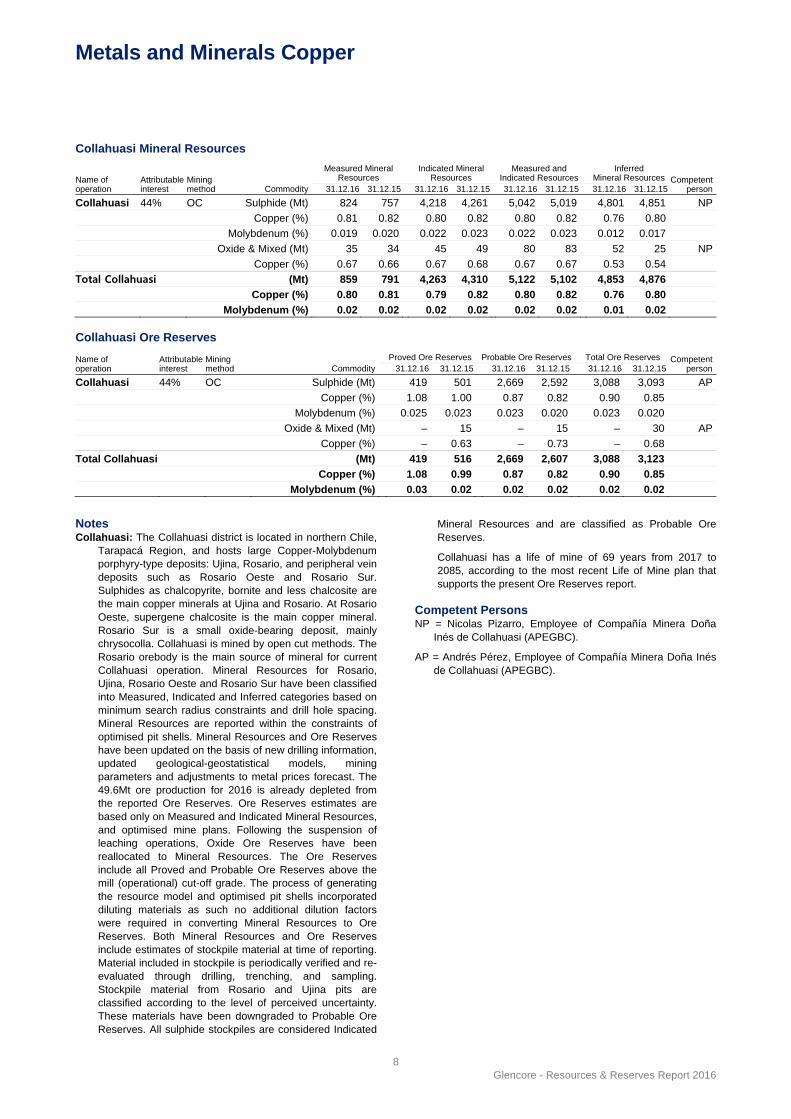
Collahuasi Mineral Resources
Name of operation
Attributable interest
Mining method Commodity
Measured Mineral Resources
Indicated Mineral Resources
Measured and Indicated Resources
Inferred Mineral Resources Competent
person31.12.16 31.12.15 31.12.16 31.12.15 31.12.16 31.12.15 31.12.16 31.12.15
Collahuasi 44% OC Sulphide (Mt) 824 757 4,218 4,261 5,042 5,019 4,801 4,851 NP
Copper (%) 0.81 0.82 0.80 0.82 0.80 0.82 0.76 0.80
Molybdenum (%) 0.019 0.020 0.022 0.023 0.022 0.023 0.012 0.017
Oxide & Mixed (Mt) 35 34 45 49 80 83 52 25 NP
Copper (%) 0.67 0.66 0.67 0.68 0.67 0.67 0.53 0.54
Total Collahuasi (Mt) 859 791 4,263 4,310 5,122 5,102 4,853 4,876
Copper (%) 0.80 0.81 0.79 0.82 0.80 0.82 0.76 0.80
Molybdenum (%) 0.02 0.02 0.02 0.02 0.02 0.02 0.01 0.02
Collahuasi Ore Reserves
Name of operation
Attributable interest
Mining method Commodity
Proved Ore Reserves Probable Ore Reserves Total Ore Reserves Competentperson31.12.16 31.12.15 31.12.16 31.12.15 31.12.16 31.12.15
Collahuasi 44% OC Sulphide (Mt) 419 501 2,669 2,592 3,088 3,093 AP
Copper (%) 1.08 1.00 0.87 0.82 0.90 0.85
Molybdenum (%) 0.025 0.023 0.023 0.020 0.023 0.020
Oxide & Mixed (Mt) – 15 – 15 – 30 AP
Copper (%) – 0.63 – 0.73 – 0.68
Total Collahuasi (Mt) 419 516 2,669 2,607 3,088 3,123
Copper (%) 1.08 0.99 0.87 0.82 0.90 0.85
Molybdenum (%) 0.03 0.02 0.02 0.02 0.02 0.02
Notes Collahuasi: The Collahuasi district is located in northern Chile,
Tarapacá Region, and hosts large Copper-Molybdenum porphyry-type deposits: Ujina, Rosario, and peripheral vein deposits such as Rosario Oeste and Rosario Sur. Sulphides as chalcopyrite, bornite and less chalcosite are the main copper minerals at Ujina and Rosario. At Rosario Oeste, supergene chalcosite is the main copper mineral. Rosario Sur is a small oxide-bearing deposit, mainly chrysocolla. Collahuasi is mined by open cut methods. The Rosario orebody is the main source of mineral for current Collahuasi operation. Mineral Resources for Rosario, Ujina, Rosario Oeste and Rosario Sur have been classified into Measured, Indicated and Inferred categories based on minimum search radius constraints and drill hole spacing. Mineral Resources are reported within the constraints of optimised pit shells. Mineral Resources and Ore Reserves have been updated on the basis of new drilling information, updated geological-geostatistical models, mining parameters and adjustments to metal prices forecast. The 49.6Mt ore production for 2016 is already depleted from the reported Ore Reserves. Ore Reserves estimates are based only on Measured and Indicated Mineral Resources, and optimised mine plans. Following the suspension of leaching operations, Oxide Ore Reserves have been reallocated to Mineral Resources. The Ore Reserves include all Proved and Probable Ore Reserves above the mill (operational) cut-off grade. The process of generating the resource model and optimised pit shells incorporated diluting materials as such no additional dilution factors were required in converting Mineral Resources to Ore Reserves. Both Mineral Resources and Ore Reserves include estimates of stockpile material at time of reporting. Material included in stockpile is periodically verified and re-evaluated through drilling, trenching, and sampling. Stockpile material from Rosario and Ujina pits are classified according to the level of perceived uncertainty. These materials have been downgraded to Probable Ore Reserves. All sulphide stockpiles are considered Indicated
Mineral Resources and are classified as Probable Ore Reserves.
Collahuasi has a life of mine of 69 years from 2017 to 2085, according to the most recent Life of Mine plan that supports the present Ore Reserves report.
Competent Persons NP = Nicolas Pizarro, Employee of Compañía Minera Doña
Inés de Collahuasi (APEGBC).
AP = Andrés Pérez, Employee of Compañía Minera Doña Inés de Collahuasi (APEGBC).
Metals and Minerals Copper
9 Glencore - Resources & Reserves Report 2016
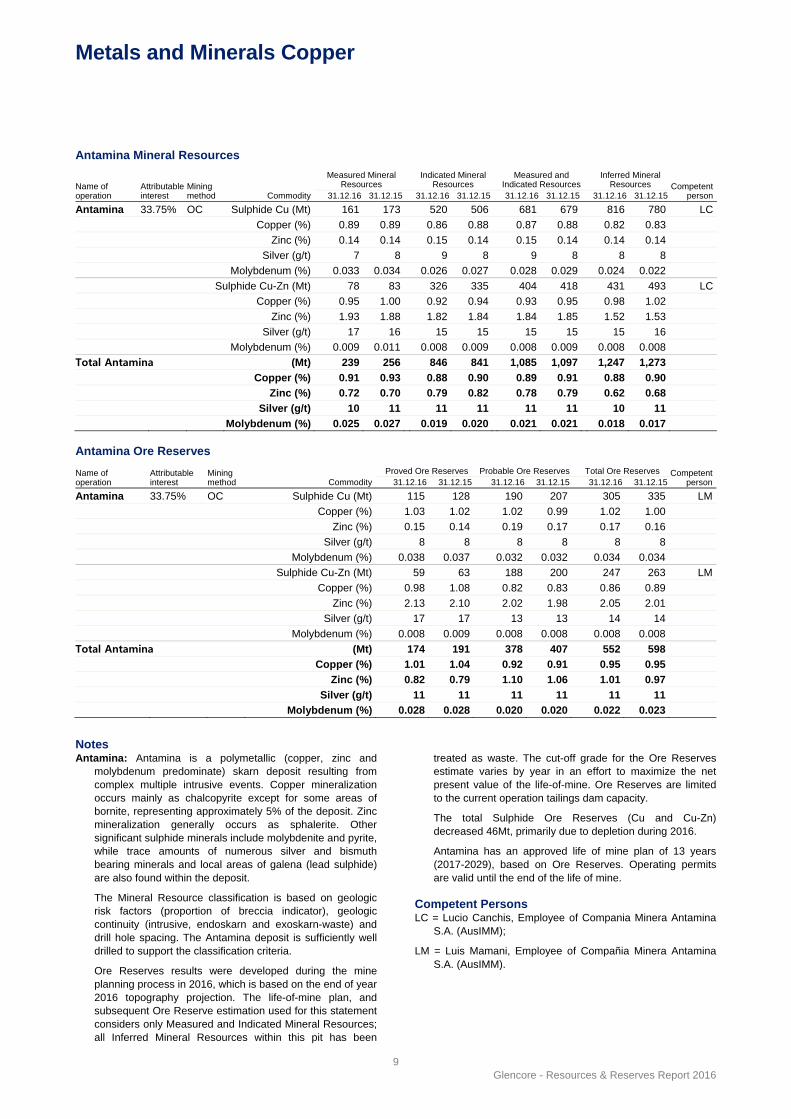
Antamina Mineral Resources
Name of operation
Attributable interest
Mining method Commodity
Measured Mineral Resources
Indicated Mineral Resources
Measured and Indicated Resources
Inferred Mineral Resources Competent
person31.12.16 31.12.15 31.12.16 31.12.15 31.12.16 31.12.15 31.12.16 31.12.15
Antamina 33.75% OC Sulphide Cu (Mt) 161 173 520 506 681 679 816 780 LC
Copper (%) 0.89 0.89 0.86 0.88 0.87 0.88 0.82 0.83
Zinc (%) 0.14 0.14 0.15 0.14 0.15 0.14 0.14 0.14
Silver (g/t) 7 8 9 8 9 8 8 8
Molybdenum (%) 0.033 0.034 0.026 0.027 0.028 0.029 0.024 0.022
Sulphide Cu-Zn (Mt) 78 83 326 335 404 418 431 493 LC
Copper (%) 0.95 1.00 0.92 0.94 0.93 0.95 0.98 1.02
Zinc (%) 1.93 1.88 1.82 1.84 1.84 1.85 1.52 1.53
Silver (g/t) 17 16 15 15 15 15 15 16
Molybdenum (%) 0.009 0.011 0.008 0.009 0.008 0.009 0.008 0.008
Total Antamina (Mt) 239 256 846 841 1,085 1,097 1,247 1,273
Copper (%) 0.91 0.93 0.88 0.90 0.89 0.91 0.88 0.90
Zinc (%) 0.72 0.70 0.79 0.82 0.78 0.79 0.62 0.68
Silver (g/t) 10 11 11 11 11 11 10 11
Molybdenum (%) 0.025 0.027 0.019 0.020 0.021 0.021 0.018 0.017
Antamina Ore Reserves
Name of operation
Attributable interest
Mining method Commodity
Proved Ore Reserves Probable Ore Reserves Total Ore Reserves Competentperson31.12.16 31.12.15 31.12.16 31.12.15 31.12.16 31.12.15
Antamina 33.75% OC Sulphide Cu (Mt) 115 128 190 207 305 335 LM
Copper (%) 1.03 1.02 1.02 0.99 1.02 1.00
Zinc (%) 0.15 0.14 0.19 0.17 0.17 0.16
Silver (g/t) 8 8 8 8 8 8
Molybdenum (%) 0.038 0.037 0.032 0.032 0.034 0.034
Sulphide Cu-Zn (Mt) 59 63 188 200 247 263 LM
Copper (%) 0.98 1.08 0.82 0.83 0.86 0.89
Zinc (%) 2.13 2.10 2.02 1.98 2.05 2.01
Silver (g/t) 17 17 13 13 14 14
Molybdenum (%) 0.008 0.009 0.008 0.008 0.008 0.008
Total Antamina (Mt) 174 191 378 407 552 598
Copper (%) 1.01 1.04 0.92 0.91 0.95 0.95
Zinc (%) 0.82 0.79 1.10 1.06 1.01 0.97
Silver (g/t) 11 11 11 11 11 11
Molybdenum (%) 0.028 0.028 0.020 0.020 0.022 0.023
Notes Antamina: Antamina is a polymetallic (copper, zinc and
molybdenum predominate) skarn deposit resulting from complex multiple intrusive events. Copper mineralization occurs mainly as chalcopyrite except for some areas of bornite, representing approximately 5% of the deposit. Zinc mineralization generally occurs as sphalerite. Other significant sulphide minerals include molybdenite and pyrite, while trace amounts of numerous silver and bismuth bearing minerals and local areas of galena (lead sulphide) are also found within the deposit.
The Mineral Resource classification is based on geologic risk factors (proportion of breccia indicator), geologic continuity (intrusive, endoskarn and exoskarn-waste) and drill hole spacing. The Antamina deposit is sufficiently well drilled to support the classification criteria.
Ore Reserves results were developed during the mine planning process in 2016, which is based on the end of year 2016 topography projection. The life-of-mine plan, and subsequent Ore Reserve estimation used for this statement considers only Measured and Indicated Mineral Resources; all Inferred Mineral Resources within this pit has been
treated as waste. The cut-off grade for the Ore Reserves estimate varies by year in an effort to maximize the net present value of the life-of-mine. Ore Reserves are limited to the current operation tailings dam capacity.
The total Sulphide Ore Reserves (Cu and Cu-Zn) decreased 46Mt, primarily due to depletion during 2016.
Antamina has an approved life of mine plan of 13 years (2017-2029), based on Ore Reserves. Operating permits are valid until the end of the life of mine.
Competent Persons LC = Lucio Canchis, Employee of Compania Minera Antamina
S.A. (AusIMM);
LM = Luis Mamani, Employee of Compañia Minera Antamina S.A. (AusIMM).
Metals and Minerals Copper
10 Glencore - Resources & Reserves Report 2016
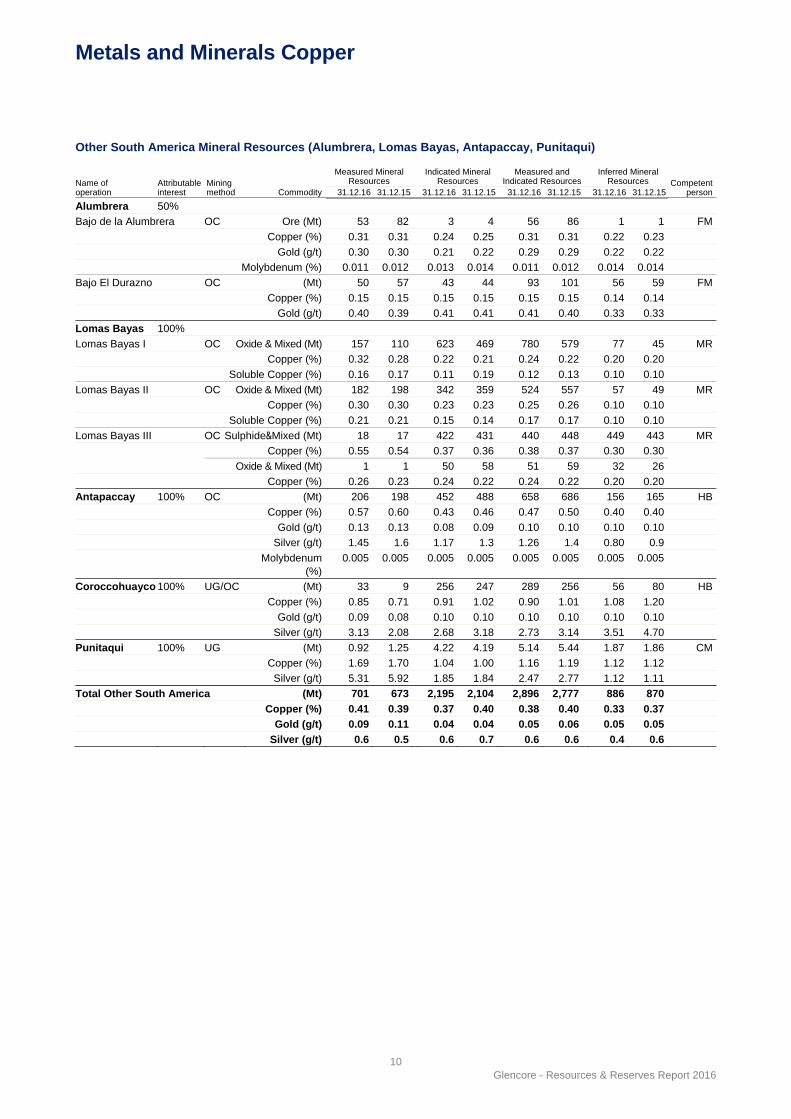
Other South America Mineral Resources (Alumbrera, Lomas Bayas, Antapaccay, Punitaqui)
Name of operation
Attributable interest
Mining method Commodity
Measured Mineral Resources
Indicated Mineral Resources
Measured and Indicated Resources
Inferred Mineral Resources Competent
person31.12.16 31.12.15 31.12.16 31.12.15 31.12.16 31.12.15 31.12.16 31.12.15
Alumbrera 50%
Bajo de la Alumbrera OC Ore (Mt) 53 82 3 4 56 86 1 1 FM
Copper (%) 0.31 0.31 0.24 0.25 0.31 0.31 0.22 0.23
Gold (g/t) 0.30 0.30 0.21 0.22 0.29 0.29 0.22 0.22
Molybdenum (%) 0.011 0.012 0.013 0.014 0.011 0.012 0.014 0.014
Bajo El Durazno OC (Mt) 50 57 43 44 93 101 56 59 FM
Copper (%) 0.15 0.15 0.15 0.15 0.15 0.15 0.14 0.14
Gold (g/t) 0.40 0.39 0.41 0.41 0.41 0.40 0.33 0.33
Lomas Bayas 100%
Lomas Bayas I OC Oxide & Mixed (Mt) 157 110 623 469 780 579 77 45 MR
Copper (%) 0.32 0.28 0.22 0.21 0.24 0.22 0.20 0.20
Soluble Copper (%) 0.16 0.17 0.11 0.19 0.12 0.13 0.10 0.10
Lomas Bayas II OC Oxide & Mixed (Mt) 182 198 342 359 524 557 57 49 MR
Copper (%) 0.30 0.30 0.23 0.23 0.25 0.26 0.10 0.10
Soluble Copper (%) 0.21 0.21 0.15 0.14 0.17 0.17 0.10 0.10
Lomas Bayas III OC Sulphide&Mixed (Mt) 18 17 422 431 440 448 449 443 MR
Copper (%) 0.55 0.54 0.37 0.36 0.38 0.37 0.30 0.30
Oxide & Mixed (Mt) 1 1 50 58 51 59 32 26
Copper (%) 0.26 0.23 0.24 0.22 0.24 0.22 0.20 0.20
Antapaccay 100% OC (Mt) 206 198 452 488 658 686 156 165 HB
Copper (%) 0.57 0.60 0.43 0.46 0.47 0.50 0.40 0.40
Gold (g/t) 0.13 0.13 0.08 0.09 0.10 0.10 0.10 0.10
Silver (g/t) 1.45 1.6 1.17 1.3 1.26 1.4 0.80 0.9
Molybdenum
(%) 0.005 0.005 0.005 0.005 0.005 0.005 0.005 0.005
Coroccohuayco 100% UG/OC (Mt) 33 9 256 247 289 256 56 80 HB
Copper (%) 0.85 0.71 0.91 1.02 0.90 1.01 1.08 1.20
Gold (g/t) 0.09 0.08 0.10 0.10 0.10 0.10 0.10 0.10
Silver (g/t) 3.13 2.08 2.68 3.18 2.73 3.14 3.51 4.70
Punitaqui 100% UG (Mt) 0.92 1.25 4.22 4.19 5.14 5.44 1.87 1.86 CM
Copper (%) 1.69 1.70 1.04 1.00 1.16 1.19 1.12 1.12
Silver (g/t) 5.31 5.92 1.85 1.84 2.47 2.77 1.12 1.11
Total Other South America (Mt) 701 673 2,195 2,104 2,896 2,777 886 870
Copper (%) 0.41 0.39 0.37 0.40 0.38 0.40 0.33 0.37
Gold (g/t) 0.09 0.11 0.04 0.04 0.05 0.06 0.05 0.05
Silver (g/t) 0.6 0.5 0.6 0.7 0.6 0.6 0.4 0.6
Metals and Minerals Copper
11 Glencore - Resources & Reserves Report 2016
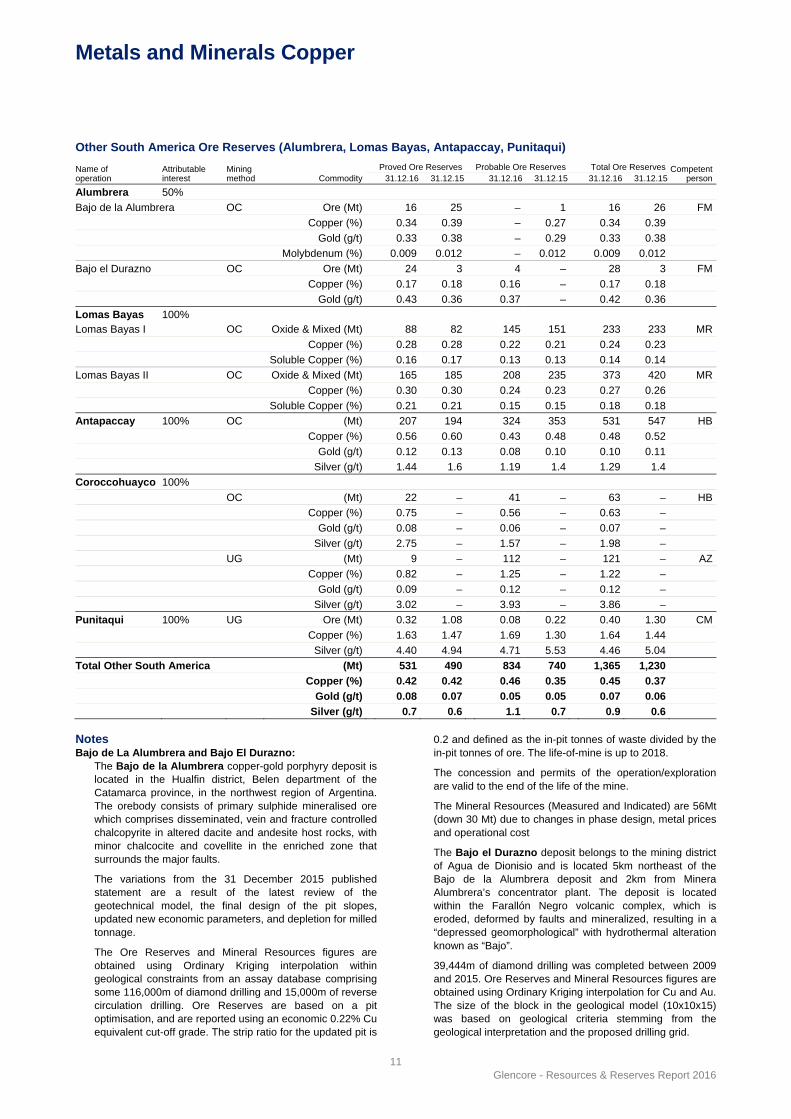
Other South America Ore Reserves (Alumbrera, Lomas Bayas, Antapaccay, Punitaqui)
Name of operation
Attributable interest
Mining method Commodity
Proved Ore Reserves Probable Ore Reserves Total Ore Reserves Competentperson31.12.16 31.12.15 31.12.16 31.12.15 31.12.16 31.12.15
Alumbrera 50%
Bajo de la Alumbrera OC Ore (Mt) 16 25 – 1 16 26 FM
Copper (%) 0.34 0.39 – 0.27 0.34 0.39
Gold (g/t) 0.33 0.38 – 0.29 0.33 0.38
Molybdenum (%) 0.009 0.012 – 0.012 0.009 0.012
Bajo el Durazno OC Ore (Mt) 24 3 4 – 28 3 FM
Copper (%) 0.17 0.18 0.16 – 0.17 0.18
Gold (g/t) 0.43 0.36 0.37 – 0.42 0.36
Lomas Bayas 100% Lomas Bayas I OC Oxide & Mixed (Mt) 88 82 145 151 233 233 MR
Copper (%) 0.28 0.28 0.22 0.21 0.24 0.23
Soluble Copper (%) 0.16 0.17 0.13 0.13 0.14 0.14
Lomas Bayas II OC Oxide & Mixed (Mt) 165 185 208 235 373 420 MR
Copper (%) 0.30 0.30 0.24 0.23 0.27 0.26
Soluble Copper (%) 0.21 0.21 0.15 0.15 0.18 0.18
Antapaccay 100% OC (Mt) 207 194 324 353 531 547 HB
Copper (%) 0.56 0.60 0.43 0.48 0.48 0.52
Gold (g/t) 0.12 0.13 0.08 0.10 0.10 0.11
Silver (g/t) 1.44 1.6 1.19 1.4 1.29 1.4
Coroccohuayco 100%
OC (Mt) 22 – 41 – 63 – HB
Copper (%) 0.75 – 0.56 – 0.63 –
Gold (g/t) 0.08 – 0.06 – 0.07 –
Silver (g/t) 2.75 – 1.57 – 1.98 –
UG (Mt) 9 – 112 – 121 – AZ
Copper (%) 0.82 – 1.25 – 1.22 –
Gold (g/t) 0.09 – 0.12 – 0.12 –
Silver (g/t) 3.02 – 3.93 – 3.86 –
Punitaqui 100% UG Ore (Mt) 0.32 1.08 0.08 0.22 0.40 1.30 CM
Copper (%) 1.63 1.47 1.69 1.30 1.64 1.44
Silver (g/t) 4.40 4.94 4.71 5.53 4.46 5.04
Total Other South America (Mt) 531 490 834 740 1,365 1,230
Copper (%) 0.42 0.42 0.46 0.35 0.45 0.37
Gold (g/t) 0.08 0.07 0.05 0.05 0.07 0.06
Silver (g/t) 0.7 0.6 1.1 0.7 0.9 0.6
Notes Bajo de La Alumbrera and Bajo El Durazno: The Bajo de la Alumbrera copper-gold porphyry deposit is
located in the Hualfin district, Belen department of the Catamarca province, in the northwest region of Argentina. The orebody consists of primary sulphide mineralised ore which comprises disseminated, vein and fracture controlled chalcopyrite in altered dacite and andesite host rocks, with minor chalcocite and covellite in the enriched zone that surrounds the major faults.
The variations from the 31 December 2015 published statement are a result of the latest review of the geotechnical model, the final design of the pit slopes, updated new economic parameters, and depletion for milled tonnage.
The Ore Reserves and Mineral Resources figures are obtained using Ordinary Kriging interpolation within geological constraints from an assay database comprising some 116,000m of diamond drilling and 15,000m of reverse circulation drilling. Ore Reserves are based on a pit optimisation, and are reported using an economic 0.22% Cu equivalent cut-off grade. The strip ratio for the updated pit is
0.2 and defined as the in-pit tonnes of waste divided by the in-pit tonnes of ore. The life-of-mine is up to 2018.
The concession and permits of the operation/exploration are valid to the end of the life of the mine.
The Mineral Resources (Measured and Indicated) are 56Mt (down 30 Mt) due to changes in phase design, metal prices and operational cost
The Bajo el Durazno deposit belongs to the mining district of Agua de Dionisio and is located 5km northeast of the Bajo de la Alumbrera deposit and 2km from Minera Alumbrera’s concentrator plant. The deposit is located within the Farallón Negro volcanic complex, which is eroded, deformed by faults and mineralized, resulting in a “depressed geomorphological” with hydrothermal alteration known as “Bajo”.
39,444m of diamond drilling was completed between 2009 and 2015. Ore Reserves and Mineral Resources figures are obtained using Ordinary Kriging interpolation for Cu and Au. The size of the block in the geological model (10x10x15) was based on geological criteria stemming from the geological interpretation and the proposed drilling grid.
Metals and Minerals Copper
12 Glencore - Resources & Reserves Report 2016
The Mineral Resources were estimated using a cut-off 0.20g/t for Au. Ore Reserves are based on a pit optimization and are reported on an economic 0.30g/t Au equivalent cut-off grade.
The increase in reserves compared to the 2015 statement is the result of optimisation, which added two additional phases to the mine. The life of mine is up to 2018.
Lomas Bayas (I) – Lomas Bayas (III): Lomas Bayas is a low grade Cu-Mo deposit resulting from the intrusion of several porphyry and breccia systems that were later exposed to leaching and subsequent supergene enrichment and in situ oxidation. Green copper oxides, copper sulphates in various forms and less partially mixed ores are the main source of ore for the existing SX/EW operation. The copper oxides-sulphate mineralisation is the basis of the Lomas Bayas Ore Reserves (Lomas Bayas I).
Mineral Resources and Ore Reserves estimation has been completed using Ordinary Kriging on a block model that includes historic drill holes totalling 318,788m and sampled at 2m intervals. Ore Reserves are as of 31 December 2016 using projected topography; operational pit life-of-mine developed in 2016; cut-off grade Heap: 0.27% CuT and ROM: 0.07% CuT. Lomas Bayas (I) Ore Reserves are maintained. The Lomas Bayas (III) Mineral Resources estimates sulphides in a pit shell calculated using Measured, Indicated and Inferred Mineral Resources; Oxides-Mixed within this pit are also considered Mineral Resources that will eventually feed the SX/EW operation.
Drilling continues in the Lomas Bayas (I) and Lomas Bayas (III) ore bodies, whereby the Lomas Bayas (III) sulphide layer lies beneath the Lomas Bayas (I) oxide layer. Additional oxide-mixed material at depth has been added to the Lomas Bayas (I) resource base during the year.
The SX/EW operation plant has a current life of mine that extends to 2028; permits for the operation are valid to the end of the life of the mine.
Lomas Bayas (II): This low grade Cu deposit is located 2km south of Lomas I pit, in the same district and geological environment as Lomas Bayas deposit. The main difference is a larger presence of water soluble copper oxides and lower geotechnical rock quality. The Lomas II block model includes historic drill holes totalling 127,369m and sampled at 2m intervals. Mineral Resources and Ore Reserves estimation has been completed using Ordinary Kriging. Ore Reserves are as of 31 December 2016, considering: operational pit life-of-mine developed in 2016; cut-off grade Heap: 0.27% CuT and ROM: 0.07% CuT. Mineral Resources as of 31 December 2016 considers economic pit shell at similar cut-off grade.
The SX/EW operation plant has a current life of mine that extends to 2028; permits for the operation are valid to the end of the life of the mine.
Antapaccay: The Antapaccay orebody is located 10km southwest of Tintaya, and together with Coroccohuayco is part of the Tintaya mineralised district. It is a sulphide mineralised system comprising disseminated, vein and fracture controlled chalcopyrite and bornite in altered quartz–monzonite and diorite in a limestone host rock, with some mineralised exoskarn areas and minor copper oxides and copper carbonates in the upper part of the deposit.
Antapaccay Ore Reserves and Mineral Resources as at 31 December 2016. Mineral Resource categorisation is based on assessment of orebody and grade continuity, structural complexity, data quality, adequacy of data coverage, and
reasonable prospects of economical extraction. The Mineral Resources estimation is based on a block model with grade interpolation by using Ordinary Kriging. Mineral Resources are stated at defined internal copper cut–off, which is maintained at 0.15% TCu. Ore Reserves are then derived from Measured and Indicated Mineral Resources after applying economical and technical modifying factors. Ore Reserves decreased by 16Mt during 2016.
The deposit geology model and Mineral Resources estimate has been updated in 2015 using a drill hole database that now includes over than 248,060m of total drilling data. The major variations from the previous published Mineral Resources statement are due to the inclusion of new infill drilling to the updated geological model and block grade interpolate.
The Ore Reserves are for 13 years ending in 2029, with ore processed through the Tintaya and Antapaccay plants. Operation permits are valid until the end of the life of mine.
Coroccohuayco: The Coroccohuayco copper–gold skarn deposit is located 9km southeast of Tintaya. Together with Tintaya and Antapaccay this orebody is part of the Tintaya mineralised district. The main copper bearing minerals are bornite, chalcopyrite and chalcocite. The Coroccohuayco orebody is defined as a copper skarn deposit, which consists of Cretaceous sedimentary rocks of the Ferrobamba and Mara formation intruded by monzonitic plutons of the Eocene–Oligocene Andahuaylas–Yauri batholiths. The deposit geology model and Mineral Resources and Reserves estimate has been updated at 31 December 2016. The major variations from the previous published Mineral Resources statement are due to the inclusion of new infill drilling to the updated geological model and block grade interpolate, and the classification of Ore Reserves.
Punitaqui: Remaining life of mine is approximately 1 year based on Ore Reserves and 10 years based on Mineral Resources. Several epigenetic stratifiorm copper mineralisation (manto type) bodies with variable thicknesses between 20 to 40m are distributed along 900m strike length mineralised corridor named Cinabrio zone. Mineralisation is composed of crisocole, brochantita and malachite in upper oxide levels turning into a mixed zone composed of malachite, crisocole and chalcopyrite. Main sulphide zones are composed of pyrite, bornite and chalcopyrite. All mineralisation is distributed in calcareous shales also within minor pre-existing faults. Dalmacia deposit is located 7km south of the Punitaqui concentrator plant. Also described as a stratiform copper deposit the mineralisation occurs as irregular lenses of chalcopyrite, chalcocite and covellite sulphides within the porphyritic andestites of the reloj formation.
Competent Persons AZ = Americo Zuzunaga, Employee of BISA (AusIMM).
CM = Carlos Manchego, independent consultant (AusIMM).
FM = Flavio Montini, Employee of Glencore (AusIMM).
HB = Heller Bernabé, Employee of Glencore (AusIMM).
MR = Mauricio Rubio, Employee of Glencore (AusIMM).
Metals and Minerals Copper
13 Glencore - Resources & Reserves Report 2016
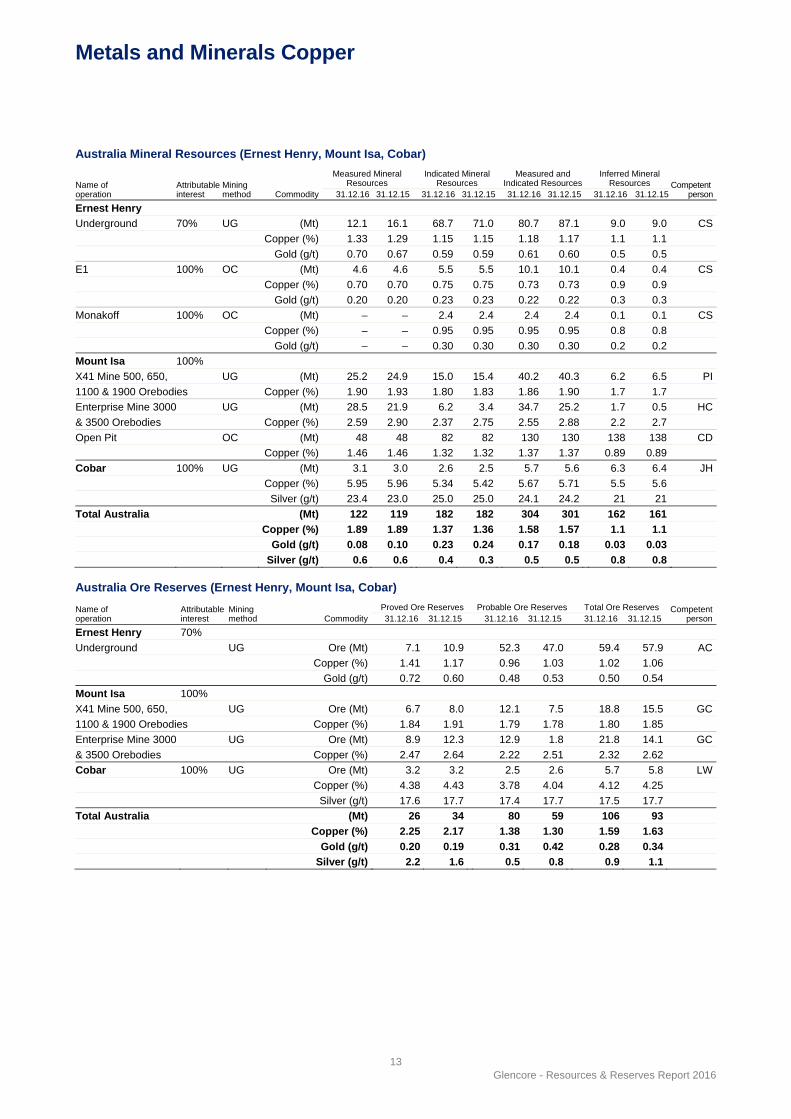
Australia Mineral Resources (Ernest Henry, Mount Isa, Cobar)
Name of operation
Attributable interest
Mining method Commodity
Measured Mineral Resources
Indicated Mineral Resources
Measured and Indicated Resources
Inferred Mineral Resources Competent
person31.12.16 31.12.15 31.12.16 31.12.15 31.12.16 31.12.15 31.12.16 31.12.15
Ernest Henry
Underground 70% UG (Mt) 12.1 16.1 68.7 71.0 80.7 87.1 9.0 9.0 CS
Copper (%) 1.33 1.29 1.15 1.15 1.18 1.17 1.1 1.1
Gold (g/t) 0.70 0.67 0.59 0.59 0.61 0.60 0.5 0.5
E1 100% OC (Mt) 4.6 4.6 5.5 5.5 10.1 10.1 0.4 0.4 CS
Copper (%) 0.70 0.70 0.75 0.75 0.73 0.73 0.9 0.9
Gold (g/t) 0.20 0.20 0.23 0.23 0.22 0.22 0.3 0.3
Monakoff 100% OC (Mt) – – 2.4 2.4 2.4 2.4 0.1 0.1 CS
Copper (%) – – 0.95 0.95 0.95 0.95 0.8 0.8
Gold (g/t) – – 0.30 0.30 0.30 0.30 0.2 0.2
Mount Isa 100%
X41 Mine 500, 650, UG (Mt) 25.2 24.9 15.0 15.4 40.2 40.3 6.2 6.5 PI
1100 & 1900 Orebodies Copper (%) 1.90 1.93 1.80 1.83 1.86 1.90 1.7 1.7
Enterprise Mine 3000 UG (Mt) 28.5 21.9 6.2 3.4 34.7 25.2 1.7 0.5 HC
& 3500 Orebodies Copper (%) 2.59 2.90 2.37 2.75 2.55 2.88 2.2 2.7
Open Pit OC (Mt) 48 48 82 82 130 130 138 138 CD
Copper (%) 1.46 1.46 1.32 1.32 1.37 1.37 0.89 0.89
Cobar 100% UG (Mt) 3.1 3.0 2.6 2.5 5.7 5.6 6.3 6.4 JH
Copper (%) 5.95 5.96 5.34 5.42 5.67 5.71 5.5 5.6
Silver (g/t) 23.4 23.0 25.0 25.0 24.1 24.2 21 21
Total Australia (Mt) 122 119 182 182 304 301 162 161
Copper (%) 1.89 1.89 1.37 1.36 1.58 1.57 1.1 1.1
Gold (g/t) 0.08 0.10 0.23 0.24 0.17 0.18 0.03 0.03
Silver (g/t) 0.6 0.6 0.4 0.3 0.5 0.5 0.8 0.8
Australia Ore Reserves (Ernest Henry, Mount Isa, Cobar)
Name of operation
Attributable interest
Mining method Commodity
Proved Ore Reserves Probable Ore Reserves Total Ore Reserves Competentperson31.12.16 31.12.15 31.12.16 31.12.15 31.12.16 31.12.15
Ernest Henry 70%
Underground UG Ore (Mt) 7.1 10.9 52.3 47.0 59.4 57.9 AC
Copper (%) 1.41 1.17 0.96 1.03 1.02 1.06
Gold (g/t) 0.72 0.60 0.48 0.53 0.50 0.54
Mount Isa 100%
X41 Mine 500, 650, UG Ore (Mt) 6.7 8.0 12.1 7.5 18.8 15.5 GC
1100 & 1900 Orebodies Copper (%) 1.84 1.91 1.79 1.78 1.80 1.85
Enterprise Mine 3000 UG Ore (Mt) 8.9 12.3 12.9 1.8 21.8 14.1 GC
& 3500 Orebodies Copper (%) 2.47 2.64 2.22 2.51 2.32 2.62
Cobar 100% UG Ore (Mt) 3.2 3.2 2.5 2.6 5.7 5.8 LW
Copper (%) 4.38 4.43 3.78 4.04 4.12 4.25
Silver (g/t) 17.6 17.7 17.4 17.7 17.5 17.7
Total Australia (Mt) 26 34 80 59 106 93
Copper (%) 2.25 2.17 1.38 1.30 1.59 1.63
Gold (g/t) 0.20 0.19 0.31 0.42 0.28 0.34
Silver (g/t) 2.2 1.6 0.5 0.8 0.9 1.1
Metals and Minerals Copper
14 Glencore - Resources & Reserves Report 2016
Notes Ernest Henry Underground: In October 2016, Glencore
entered into an agreement with Evolution Mining Limited (“Evolution”), whereby Glencore received cash in return for a 30% economic interest in the Ernest Henry Mine underground mining operation (“EHM”). Evolution’s 30% economic interest is subject to an agreed life of mine and block model. The E1 and Monakoff resources are not a part of the agreement.
The current expected mine life is 10 years (completion in 2026) with the Mining Lease tenements due to expire in 10 years (2026).
Copper and gold mineralisation occurs in a breccia comprised of strongly altered and replaced intermediate volcanic fragments in a matrix assemblage of predominantly magnetite, chalcopyrite and carbonate. Copper occurs as chalcopyrite and gold is strongly associated with chalcopyrite.
Changes to Mineral Resources are due exclusively to depletion through mining.
Net of depletion for mining over the year, and changes in draw strategy and mine design, the Ore Reserve has decreased by 1.5Mt since December 2015.
E1: Mining of the reserve was completed in early 2014. The expiry date of relevant tenements is 31 December 2032.
Economic mineralisation at E1 occurs as breccia-hosted mineralisation within the footwall volcanics at E1 North, and as strata-bound, replacement style mineralisation within the mineralised sedimentary units at E1 North, Central, South and East.
Monakoff: As per 2015, Monakoff and Monakoff East remain excluded from the Ore Reserves. The expiry date of relevant tenements is 31 October 2032.
Economic mineralisation at Monakoff and Monakoff East occurs in very-fine to medium grained steeply dipping metasediment units.
Mount Isa X41 Copper Mine: Mineralisation occurs generally as breccia hosted massive to disseminated chalcopyrite in “silica dolomite” altered pyritic dolomitic siltstone. Mining depletion, sterilisation and changes to mine design amounted to a net 3.3Mt increase in Ore Reserves. The increase results from the inclusion of additional material based on cut-off grade studies.
The X41 Mine Mineral Resources increased due to a revision in cut-off grade.
Mount Isa Enterprise Copper Mine: Mineralisation occurs generally as breccia hosted massive to disseminated chalcopyrite in “silica dolomite” altered pyritic dolomitic siltstone. Mining depletion, sterilisation and mine design changes amounted to a net 7.7Mt increase in Ore
Reserves. The increase results from the inclusion of additional material based on cut-off grade studies.
The Enterprise Mine Mineral Resources increased due to a revision in cut-off grade.
The underground life of mine estimate for the X41 and Enterprise Mines is 7 years (2023) with the tenements due to expire in 20 years (2036).
Mount Isa Open pit: The expiry date of relevant concession
licences occurs in 2036.
Copper mineralisation occurs generally as breccia hosted massive to disseminated copper minerals in “silica dolomite” altered pyritic dolomitic siltstone. Approximately half of the Mineral Resources are defined by primary chalcopyrite, the remainder being oxidised or partially oxidised, with a minor amount of supergene chalcocite mineralisation. The 2016 Mineral Resources remain unchanged from 2015 and are reported inside an optimised pit shell using a cut-off grade of 0.5% Cu.
Cobar: The expected remaining life of mine is approximately 5 years based on Ore Reserves and approximately 10 years based on Mineral Resources, although Cobar has previously been able to extend its expected life of mine through exploratory drilling over the past 50 years. The expiry date of relevant mining/concession licences is 24 June 2028.
Economic mineralisation at Cobar occurs mostly as narrow lenses with short strike lengths that are depth extensive. Lenses consist of vein or semi massive to massive chalcopyrite hosted by sub-vertical quartz-chlorite shear zones within a siltstone unit. The Cobar Mineral Resource is reported within five ‘systems’: Western, Eastern, QTS North, QTS South and QTS Central.
Mining depletion since December 2015 correlates with exploration upside over the same period resulting in minimal variation to the reported Mineral Resources and Ore Reserves.
Competent Persons AC = Alexander Campbell, Glencore Copper (AusIMM).
CD = Chris De-Vitry, ARANZ GEO (AusIMM).
CS = Colin Stelzer, Glencore Copper (AusIMM).
GC = Gibson Chitumbura, Glencore Copper (AusIMM).
HC = Helen Coackley, Glencore Copper (AusIMM).
JH = Jason Hosken, Glencore Copper (AusIMM).
LW = Leanne Waddell, Glencore Copper (AusIMM).
PI = Patricia Ila’ava, Glencore Copper (AusIMM).
Metals and Minerals Copper
15 Glencore - Resources & Reserves Report 2016
Other projects Mineral Resources
Name of operation
Attributable interest
Mining method Commodity
Measured Mineral Resources
Indicated Mineral Resources
Measured and Indicated Mineral Resources
Inferred Mineral Resources Competent
person31.12.16 31.12.15 31.12.16 31.12.15 31.12.16 31.12.15 31.12.16 31.12.15
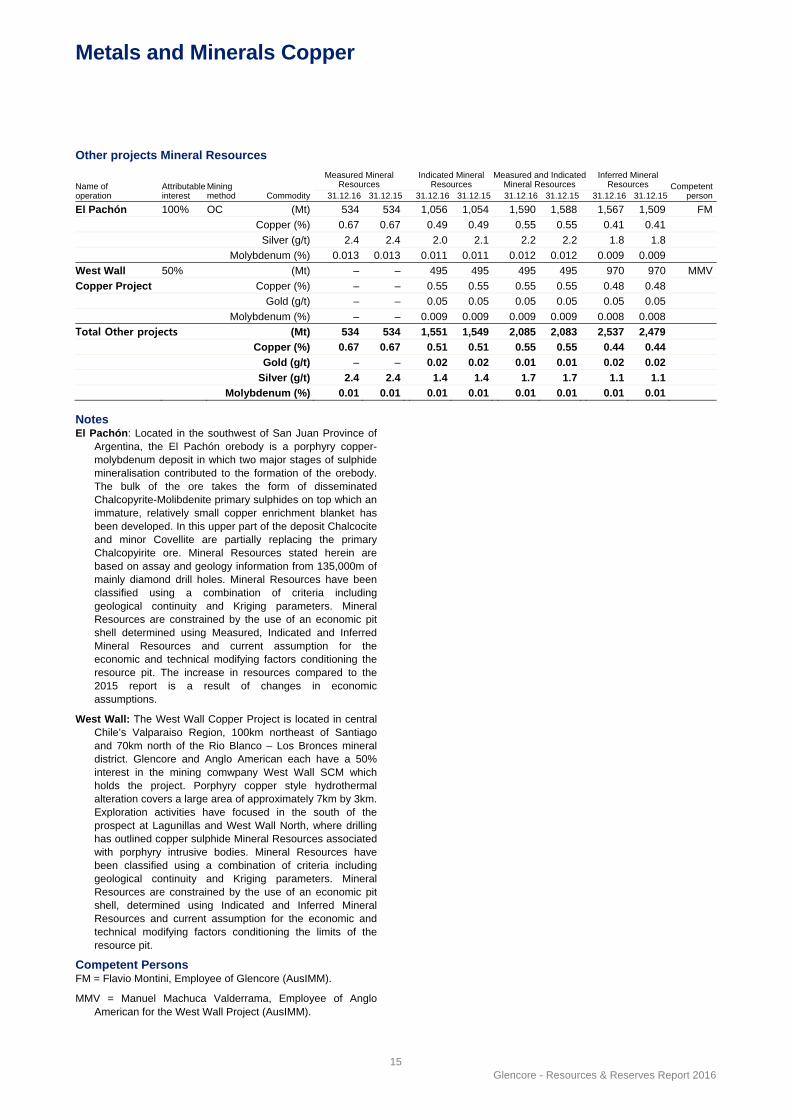
El Pachón 100% OC (Mt) 534 534 1,056 1,054 1,590 1,588 1,567 1,509 FM
Copper (%) 0.67 0.67 0.49 0.49 0.55 0.55 0.41 0.41
Silver (g/t) 2.4 2.4 2.0 2.1 2.2 2.2 1.8 1.8
Molybdenum (%) 0.013 0.013 0.011 0.011 0.012 0.012 0.009 0.009
West Wall 50% (Mt) – – 495 495 495 495 970 970 MMV
Copper Project Copper (%) – – 0.55 0.55 0.55 0.55 0.48 0.48
Gold (g/t) – – 0.05 0.05 0.05 0.05 0.05 0.05
Molybdenum (%) – – 0.009 0.009 0.009 0.009 0.008 0.008
Total Other projects (Mt) 534 534 1,551 1,549 2,085 2,083 2,537 2,479
Copper (%) 0.67 0.67 0.51 0.51 0.55 0.55 0.44 0.44
Gold (g/t) – – 0.02 0.02 0.01 0.01 0.02 0.02
Silver (g/t) 2.4 2.4 1.4 1.4 1.7 1.7 1.1 1.1
Molybdenum (%) 0.01 0.01 0.01 0.01 0.01 0.01 0.01 0.01 Notes El Pachón: Located in the southwest of San Juan Province of
Argentina, the El Pachón orebody is a porphyry copper-molybdenum deposit in which two major stages of sulphide mineralisation contributed to the formation of the orebody. The bulk of the ore takes the form of disseminated Chalcopyrite-Molibdenite primary sulphides on top which an immature, relatively small copper enrichment blanket has been developed. In this upper part of the deposit Chalcocite and minor Covellite are partially replacing the primary Chalcopyirite ore. Mineral Resources stated herein are based on assay and geology information from 135,000m of mainly diamond drill holes. Mineral Resources have been classified using a combination of criteria including geological continuity and Kriging parameters. Mineral Resources are constrained by the use of an economic pit shell determined using Measured, Indicated and Inferred Mineral Resources and current assumption for the economic and technical modifying factors conditioning the resource pit. The increase in resources compared to the 2015 report is a result of changes in economic assumptions.
West Wall: The West Wall Copper Project is located in central Chile’s Valparaiso Region, 100km northeast of Santiago and 70km north of the Rio Blanco – Los Bronces mineral district. Glencore and Anglo American each have a 50% interest in the mining comwpany West Wall SCM which holds the project. Porphyry copper style hydrothermal alteration covers a large area of approximately 7km by 3km. Exploration activities have focused in the south of the prospect at Lagunillas and West Wall North, where drilling has outlined copper sulphide Mineral Resources associated with porphyry intrusive bodies. Mineral Resources have been classified using a combination of criteria including geological continuity and Kriging parameters. Mineral Resources are constrained by the use of an economic pit shell, determined using Indicated and Inferred Mineral Resources and current assumption for the economic and technical modifying factors conditioning the limits of the resource pit.
Competent Persons FM = Flavio Montini, Employee of Glencore (AusIMM).
MMV = Manuel Machuca Valderrama, Employee of Anglo American for the West Wall Project (AusIMM).
Metals and Minerals Zinc
16 Glencore - Resources & Reserves Report 2016
Kazzinc Mineral Resources
Name of operation
Attributable interest
Mining method Commodity
Measured Mineral Resources
Indicated Mineral Resources
Measured and Indicated Resources
Inferred Mineral Resources Competent
person31.12.16 31.12.15 31.12.16 31.12.15 31.12.16 31.12.15 31.12.16 31.12.15
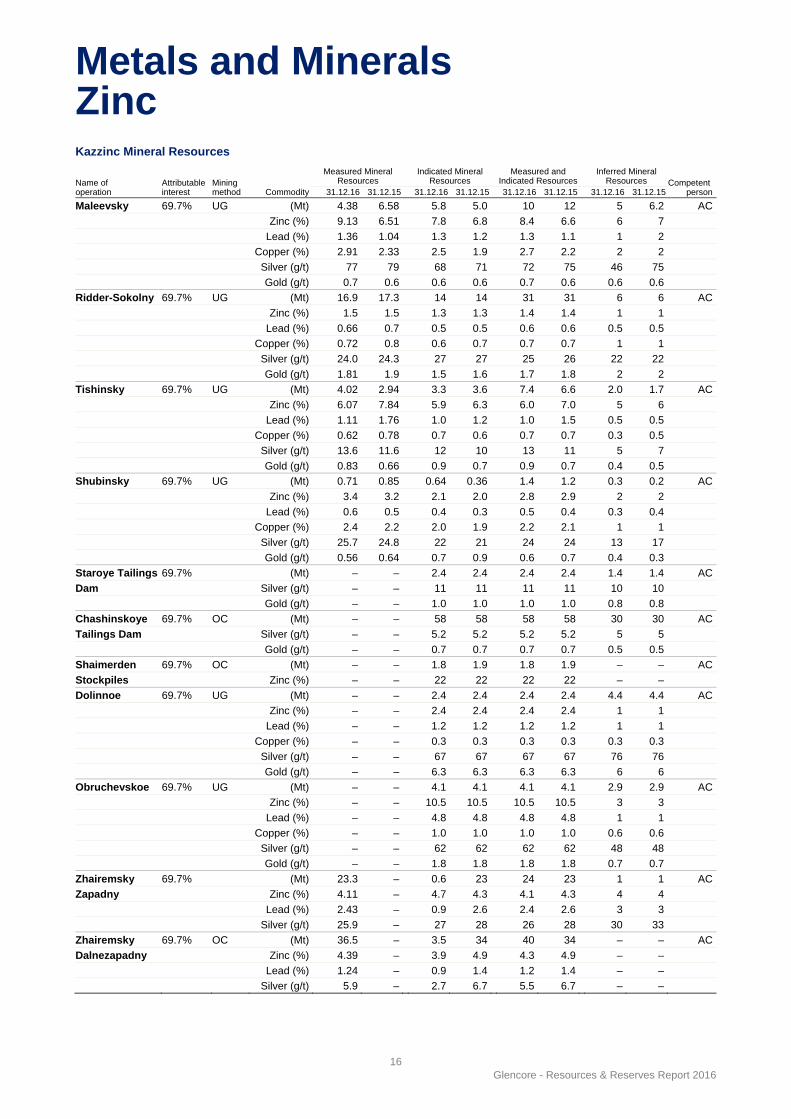
Maleevsky 69.7% UG (Mt) 4.38 6.58 5.8 5.0 10 12 5 6.2 AC
Zinc (%) 9.13 6.51 7.8 6.8 8.4 6.6 6 7
Lead (%) 1.36 1.04 1.3 1.2 1.3 1.1 1 2
Copper (%) 2.91 2.33 2.5 1.9 2.7 2.2 2 2
Silver (g/t) 77 79 68 71 72 75 46 75
Gold (g/t) 0.7 0.6 0.6 0.6 0.7 0.6 0.6 0.6
Ridder-Sokolny 69.7% UG (Mt) 16.9 17.3 14 14 31 31 6 6 AC
Zinc (%) 1.5 1.5 1.3 1.3 1.4 1.4 1 1
Lead (%) 0.66 0.7 0.5 0.5 0.6 0.6 0.5 0.5
Copper (%) 0.72 0.8 0.6 0.7 0.7 0.7 1 1
Silver (g/t) 24.0 24.3 27 27 25 26 22 22
Gold (g/t) 1.81 1.9 1.5 1.6 1.7 1.8 2 2
Tishinsky 69.7% UG (Mt) 4.02 2.94 3.3 3.6 7.4 6.6 2.0 1.7 AC
Zinc (%) 6.07 7.84 5.9 6.3 6.0 7.0 5 6
Lead (%) 1.11 1.76 1.0 1.2 1.0 1.5 0.5 0.5
Copper (%) 0.62 0.78 0.7 0.6 0.7 0.7 0.3 0.5
Silver (g/t) 13.6 11.6 12 10 13 11 5 7
Gold (g/t) 0.83 0.66 0.9 0.7 0.9 0.7 0.4 0.5
Shubinsky 69.7% UG (Mt) 0.71 0.85 0.64 0.36 1.4 1.2 0.3 0.2 AC
Zinc (%) 3.4 3.2 2.1 2.0 2.8 2.9 2 2
Lead (%) 0.6 0.5 0.4 0.3 0.5 0.4 0.3 0.4
Copper (%) 2.4 2.2 2.0 1.9 2.2 2.1 1 1
Silver (g/t) 25.7 24.8 22 21 24 24 13 17
Gold (g/t) 0.56 0.64 0.7 0.9 0.6 0.7 0.4 0.3
Staroye Tailings 69.7% (Mt) – – 2.4 2.4 2.4 2.4 1.4 1.4 AC
Dam Silver (g/t) – – 11 11 11 11 10 10
Gold (g/t) – – 1.0 1.0 1.0 1.0 0.8 0.8
Chashinskoye 69.7% OC (Mt) – – 58 58 58 58 30 30 AC
Tailings Dam Silver (g/t) – – 5.2 5.2 5.2 5.2 5 5
Gold (g/t) – – 0.7 0.7 0.7 0.7 0.5 0.5
Shaimerden 69.7% OC (Mt) – – 1.8 1.9 1.8 1.9 – – AC
Stockpiles Zinc (%) – – 22 22 22 22 – –
Dolinnoe 69.7% UG (Mt) – – 2.4 2.4 2.4 2.4 4.4 4.4 AC
Zinc (%) – – 2.4 2.4 2.4 2.4 1 1
Lead (%) – – 1.2 1.2 1.2 1.2 1 1
Copper (%) – – 0.3 0.3 0.3 0.3 0.3 0.3
Silver (g/t) – – 67 67 67 67 76 76
Gold (g/t) – – 6.3 6.3 6.3 6.3 6 6
Obruchevskoe 69.7% UG (Mt) – – 4.1 4.1 4.1 4.1 2.9 2.9 AC
Zinc (%) – – 10.5 10.5 10.5 10.5 3 3
Lead (%) – – 4.8 4.8 4.8 4.8 1 1
Copper (%) – – 1.0 1.0 1.0 1.0 0.6 0.6
Silver (g/t) – – 62 62 62 62 48 48
Gold (g/t) – – 1.8 1.8 1.8 1.8 0.7 0.7
Zhairemsky 69.7% (Mt) 23.3 – 0.6 23 24 23 1 1 AC
Zapadny Zinc (%) 4.11 – 4.7 4.3 4.1 4.3 4 4
Lead (%) 2.43 – 0.9 2.6 2.4 2.6 3 3
Silver (g/t) 25.9 – 27 28 26 28 30 33
Zhairemsky 69.7% OC (Mt) 36.5 – 3.5 34 40 34 – – AC
Dalnezapadny Zinc (%) 4.39 – 3.9 4.9 4.3 4.9 – –
Lead (%) 1.24 – 0.9 1.4 1.2 1.4 – –
Silver (g/t) 5.9 – 2.7 6.7 5.5 6.7 – –
Metals and Minerals Zinc
17 Glencore - Resources & Reserves Report 2016
Kazzinc Mineral Resources (continued)
Name of operation
Attributable interest
Mining method Commodity
Measured Mineral Resources
Indicated Mineral Resources
Measured and Indicated Resources
Inferred Mineral Resources Competent
person31.12.16 31.12.15 31.12.16 31.12.15 31.12.16 31.12.15 31.12.16 31.12.15
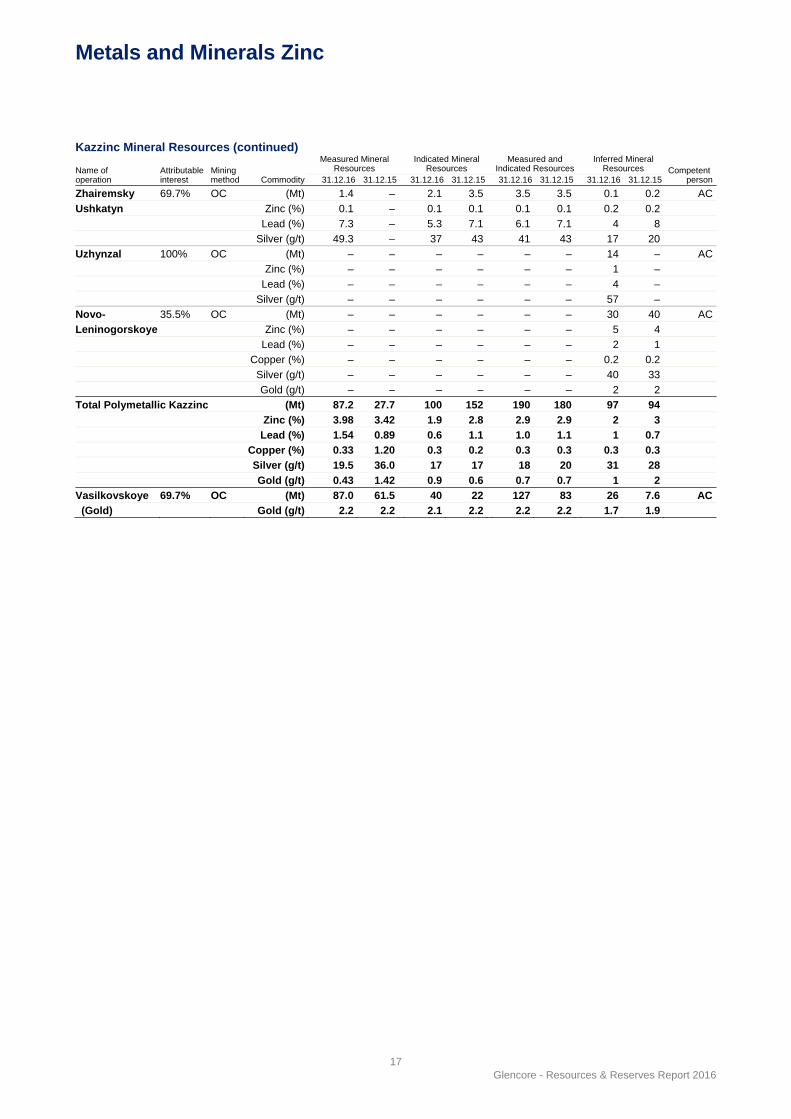
Zhairemsky 69.7% OC (Mt) 1.4 – 2.1 3.5 3.5 3.5 0.1 0.2 AC
Ushkatyn Zinc (%) 0.1 – 0.1 0.1 0.1 0.1 0.2 0.2
Lead (%) 7.3 – 5.3 7.1 6.1 7.1 4 8
Silver (g/t) 49.3 – 37 43 41 43 17 20
Uzhynzal 100% OC (Mt) – – – – – – 14 – AC
Zinc (%) – – – – – – 1 –
Lead (%) – – – – – – 4 –
Silver (g/t) – – – – – – 57 –
Novo- 35.5% OC (Mt) – – – – – – 30 40 AC
Leninogorskoye Zinc (%) – – – – – – 5 4
Lead (%) – – – – – – 2 1
Copper (%) – – – – – – 0.2 0.2
Silver (g/t) – – – – – – 40 33
Gold (g/t) – – – – – – 2 2
Total Polymetallic Kazzinc (Mt) 87.2 27.7 100 152 190 180 97 94
Zinc (%) 3.98 3.42 1.9 2.8 2.9 2.9 2 3
Lead (%) 1.54 0.89 0.6 1.1 1.0 1.1 1 0.7
Copper (%) 0.33 1.20 0.3 0.2 0.3 0.3 0.3 0.3
Silver (g/t) 19.5 36.0 17 17 18 20 31 28
Gold (g/t) 0.43 1.42 0.9 0.6 0.7 0.7 1 2
Vasilkovskoye 69.7% OC (Mt) 87.0 61.5 40 22 127 83 26 7.6 AC
(Gold) Gold (g/t) 2.2 2.2 2.1 2.2 2.2 2.2 1.7 1.9
Metals and Minerals Zinc
18 Glencore - Resources & Reserves Report 2016
Kazzinc Ore Reserves
Name of operation Attributable interest
Mining method Commodity
Proved Ore Reserves Probable Ore Reserves Total Ore Reserves Competent Person31.12.16 31.12.15 31.12.16 31.12.15 31.12.16 31.12.15
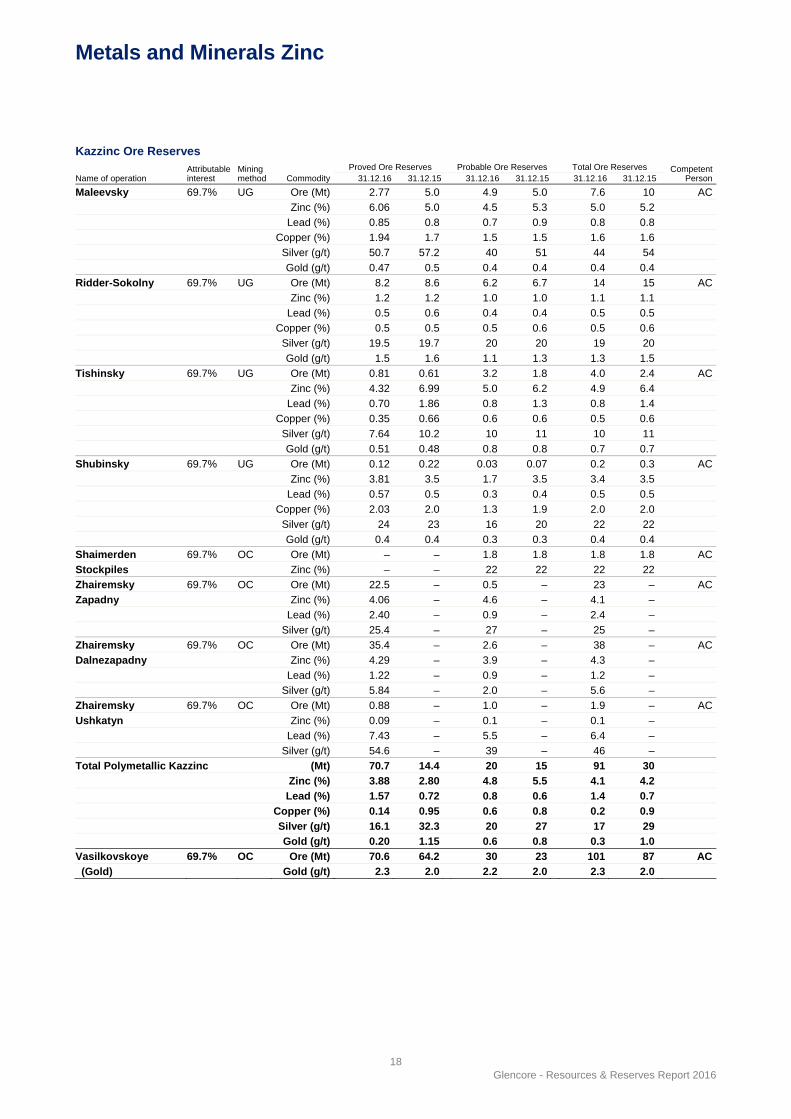
Maleevsky 69.7% UG Ore (Mt) 2.77 5.0 4.9 5.0 7.6 10 AC
Zinc (%) 6.06 5.0 4.5 5.3 5.0 5.2
Lead (%) 0.85 0.8 0.7 0.9 0.8 0.8
Copper (%) 1.94 1.7 1.5 1.5 1.6 1.6
Silver (g/t) 50.7 57.2 40 51 44 54
Gold (g/t) 0.47 0.5 0.4 0.4 0.4 0.4
Ridder-Sokolny 69.7% UG Ore (Mt) 8.2 8.6 6.2 6.7 14 15 AC
Zinc (%) 1.2 1.2 1.0 1.0 1.1 1.1
Lead (%) 0.5 0.6 0.4 0.4 0.5 0.5
Copper (%) 0.5 0.5 0.5 0.6 0.5 0.6
Silver (g/t) 19.5 19.7 20 20 19 20
Gold (g/t) 1.5 1.6 1.1 1.3 1.3 1.5
Tishinsky 69.7% UG Ore (Mt) 0.81 0.61 3.2 1.8 4.0 2.4 AC
Zinc (%) 4.32 6.99 5.0 6.2 4.9 6.4
Lead (%) 0.70 1.86 0.8 1.3 0.8 1.4
Copper (%) 0.35 0.66 0.6 0.6 0.5 0.6
Silver (g/t) 7.64 10.2 10 11 10 11
Gold (g/t) 0.51 0.48 0.8 0.8 0.7 0.7
Shubinsky 69.7% UG Ore (Mt) 0.12 0.22 0.03 0.07 0.2 0.3 AC
Zinc (%) 3.81 3.5 1.7 3.5 3.4 3.5
Lead (%) 0.57 0.5 0.3 0.4 0.5 0.5
Copper (%) 2.03 2.0 1.3 1.9 2.0 2.0
Silver (g/t) 24 23 16 20 22 22
Gold (g/t) 0.4 0.4 0.3 0.3 0.4 0.4
Shaimerden 69.7% OC Ore (Mt) – – 1.8 1.8 1.8 1.8 AC
Stockpiles Zinc (%) – – 22 22 22 22
Zhairemsky 69.7% OC Ore (Mt) 22.5 – 0.5 – 23 – AC
Zapadny Zinc (%) 4.06 – 4.6 – 4.1 –
Lead (%) 2.40 – 0.9 – 2.4 –
Silver (g/t) 25.4 – 27 – 25 –
Zhairemsky 69.7% OC Ore (Mt) 35.4 – 2.6 – 38 – AC
Dalnezapadny Zinc (%) 4.29 – 3.9 – 4.3 –
Lead (%) 1.22 – 0.9 – 1.2 –
Silver (g/t) 5.84 – 2.0 – 5.6 –
Zhairemsky 69.7% OC Ore (Mt) 0.88 – 1.0 – 1.9 – AC
Ushkatyn Zinc (%) 0.09 – 0.1 – 0.1 –
Lead (%) 7.43 – 5.5 – 6.4 –
Silver (g/t) 54.6 – 39 – 46 –
Total Polymetallic Kazzinc (Mt) 70.7 14.4 20 15 91 30
Zinc (%) 3.88 2.80 4.8 5.5 4.1 4.2
Lead (%) 1.57 0.72 0.8 0.6 1.4 0.7
Copper (%) 0.14 0.95 0.6 0.8 0.2 0.9
Silver (g/t) 16.1 32.3 20 27 17 29
Gold (g/t) 0.20 1.15 0.6 0.8 0.3 1.0
Vasilkovskoye 69.7% OC Ore (Mt) 70.6 64.2 30 23 101 87 AC
(Gold) Gold (g/t) 2.3 2.0 2.2 2.0 2.3 2.0
Metals and Minerals Zinc
19 Glencore - Resources & Reserves Report 2016
Notes Remaining mine life: different for each mine, ranging from 5 to 20 years. Expiry date of relevant mining/concession licences: different for each mine, ranging from February 2019 to March 2041. There is a routine licence extension procedure in Kazakhstan which Kazzinc undertakes as required.
Maleevsky: It is a typical syngenetic VMS deposit hosting ores of sulphide-polymetallic formation (with associated gold and silver).
The mined material from Maleevsky during 2016 was 2.3Mt at 5.8% Zn, 0.9% Pb, 1.5% Cu, 55g/t Ag and 0.5g/t Au.
Ridder-Sokolny: The gold-polymetallic deposit is also VMS type of syngenetic deposits hosting ores of gold bearing sulphide-polymetallic formation.
Mineral Resource changes are due to mining exploitation during 2016.
For Ridder-Sokolny, Mineral Resources and Ore Reserves are reported as totals for Polymetallic and Cu-type mineralisation combined.
The mined material from Ridder-Sokolny during 2016 was 1.5Mt at 0.5% Zn, 0.2% Pb, 0.7% Cu, 6g/t Ag and 2.1g/t Au.
Tishinsky: It is a syngenetic VMS deposit of Au- and Ag-bearing sulphide polymetallic ores.
Tishinsky Mineral Resources are different from previous estimates, due to several factors, including reinterpretation of geological wireframes, sterilisation of resources, and ongoing exploration.
The Ore Reserve estimate has also increased, as a result of a change in cut-off.
The mined material from Tishinsky during 2016 was 1.0Mt at 5.1% Zn, 1.0% Pb, 0.5% Cu, 11g/t Ag and 0.7g/t Au.
Shubinsky: The polymetallic deposit is a syngenetic VMS deposit hosting ores of sulphide-polymetallic formation (with associated gold and silver).
The mined material from Shubinsky during 2016 was 0.2Mt at 2.6% Zn, 0.5% Pb, 1.3% Cu, 22 g/t Ag and 0.5 g/t Au was extracted.
Shaimerden: The Shaimerden stockpile is composed of high-grade, crushed zinc oxide ore which is not amenable to the concentration process; it is directly sent to the Ridder Zinc refinery. Total material processed during 2016 was 84kt at 20.6% Zn.
Dolinnoe and Obruchevskoe: The Dolinnoe and Obruchevskoe deposits are situated in the centre and deepest south-eastern portions respectively of the Ridder mining district in the Rudnyi Altay geotectonic block. Gold is the main mineral of economic interest at Dolinnoe; veinlet-disseminated polymetallic mineralisation predominates at Obruchevskoe.
A feasibility study, regarding the mining of both deposits is underway.
Zhairemsky: The various iron, manganese, barite and polymetallic deposits of the Zhairemsky area, central Kazakhstan were discovered by geological and geophysical prospecting between the 1930s and 1960s. Between 1978 and 1995, some 22 million tonnes of low-grade zinc-lead ore including barite-dominated mineralisation were mined. As of 1996, focus was set on manganese and iron ore production.
Resource and reserve data was generated from a feasibility study completed this year.
Uzhynzal: The Uzhynzal deposit is located in central Kazakhstan, in the same belt as the Zhairemsky deposits. It has been identified as a sedimentary exhalative deposit. Its Pb-Zn ores show close spatial correlations with barite and manganese ores. The deposit is made up of an oxide cap, containing mainly Pb-oxide ores, while the sulphide portion of the deposit contains both Zn and Pb sulphides.
Novo-Leninogorskoye: The Novo-Leninogorskoye deposit is part of the Ridder-Sokolny group of VMS polymetallic deposits. Novo-Leninogorskoye was discovered in 1981 and was explored between 1981 and 1985. Two styles of mineralisation can be found at Novo-Leninogorskoye, barite-polymetallic and polymetallic with the mineralisation hosted by siltstones and quartzites.
Resource tonnages and grade changes are linked to a new geological interpretation and statistical interpolation.
Vasilkovskoye: It is a gold deposit of epigenetic (stockwork) type and beresite subtype of deposits hosting ores of gold-quartz formation.
The Resource data reported is based on a new ore model updated using 17 new drill holes drilled in 2016; the Resource was constrained in a newly designed pit shell.
Ore Reserves were estimated based upon an updated Resource interpretation and interpolation parameters; the Reserve was constrained by a new pit design, which is fully encompassed in the Resource pit shell.
The mined material from Vasilkovskoye during 2016 was 8.4Mt at 2.1g/t Au.
The Komarovsky gold mine was sold in 2016.
Competent Person AC = Aline Côté, Project Manager, Glencore Zinc, (OGQ).
Metals and Minerals Zinc
20 Glencore - Resources & Reserves Report 2016
Australia Mineral Resources (Mount Isa, McArthur River)
Name of operation Attributable interest
Mining method Commodity
Measured Mineral
Resources Indicated Mineral
Resources Measured and
Indicated Resources Inferred Mineral
Resources Competent Person 31.12.16 31.12.15 31.12.16 31.12.15 31.12.16 31.12.15 31.12.16 31.12.15
Mount Isa 100%
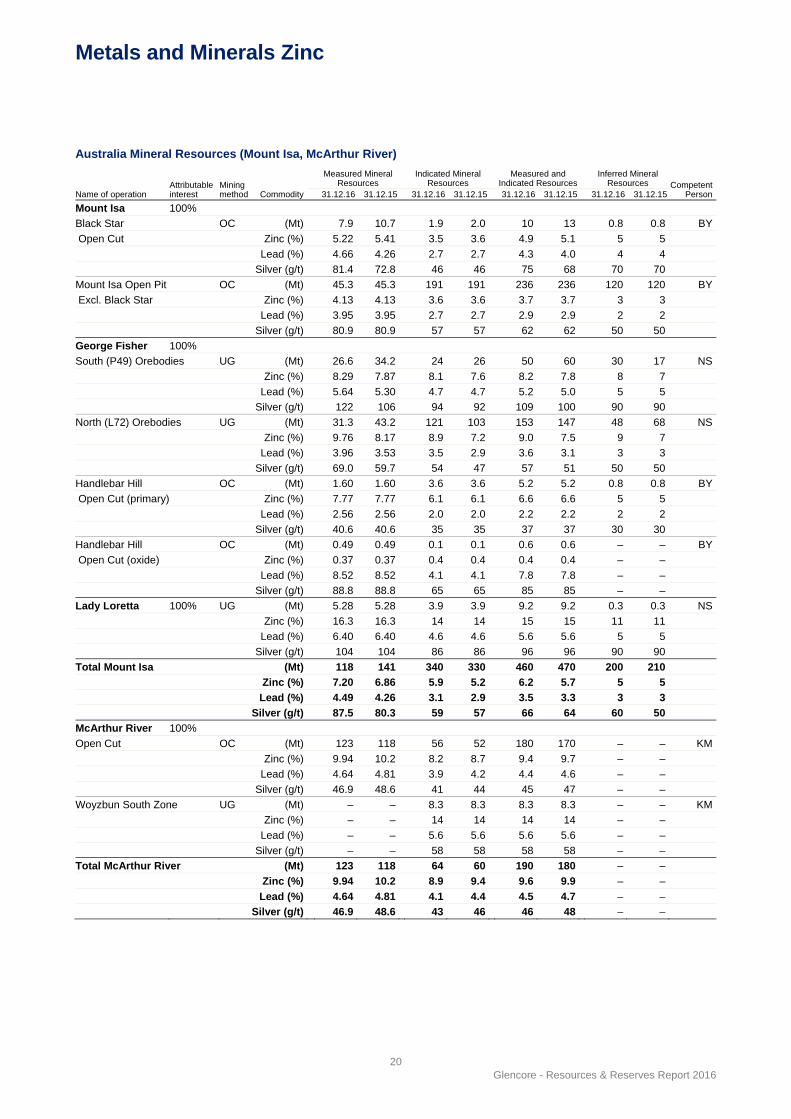
Black Star OC (Mt) 7.9 10.7 1.9 2.0 10 13 0.8 0.8 BY
Open Cut Zinc (%) 5.22 5.41 3.5 3.6 4.9 5.1 5 5
Lead (%) 4.66 4.26 2.7 2.7 4.3 4.0 4 4
Silver (g/t) 81.4 72.8 46 46 75 68 70 70
Mount Isa Open Pit OC (Mt) 45.3 45.3 191 191 236 236 120 120 BY
Excl. Black Star Zinc (%) 4.13 4.13 3.6 3.6 3.7 3.7 3 3
Lead (%) 3.95 3.95 2.7 2.7 2.9 2.9 2 2
Silver (g/t) 80.9 80.9 57 57 62 62 50 50
George Fisher 100%
South (P49) Orebodies UG (Mt) 26.6 34.2 24 26 50 60 30 17 NS
Zinc (%) 8.29 7.87 8.1 7.6 8.2 7.8 8 7
Lead (%) 5.64 5.30 4.7 4.7 5.2 5.0 5 5
Silver (g/t) 122 106 94 92 109 100 90 90
North (L72) Orebodies UG (Mt) 31.3 43.2 121 103 153 147 48 68 NS
Zinc (%) 9.76 8.17 8.9 7.2 9.0 7.5 9 7
Lead (%) 3.96 3.53 3.5 2.9 3.6 3.1 3 3
Silver (g/t) 69.0 59.7 54 47 57 51 50 50
Handlebar Hill OC (Mt) 1.60 1.60 3.6 3.6 5.2 5.2 0.8 0.8 BY
Open Cut (primary) Zinc (%) 7.77 7.77 6.1 6.1 6.6 6.6 5 5
Lead (%) 2.56 2.56 2.0 2.0 2.2 2.2 2 2
Silver (g/t) 40.6 40.6 35 35 37 37 30 30
Handlebar Hill OC (Mt) 0.49 0.49 0.1 0.1 0.6 0.6 – – BY
Open Cut (oxide) Zinc (%) 0.37 0.37 0.4 0.4 0.4 0.4 – –
Lead (%) 8.52 8.52 4.1 4.1 7.8 7.8 – –
Silver (g/t) 88.8 88.8 65 65 85 85 – –
Lady Loretta 100% UG (Mt) 5.28 5.28 3.9 3.9 9.2 9.2 0.3 0.3 NS
Zinc (%) 16.3 16.3 14 14 15 15 11 11
Lead (%) 6.40 6.40 4.6 4.6 5.6 5.6 5 5
Silver (g/t) 104 104 86 86 96 96 90 90
Total Mount Isa (Mt) 118 141 340 330 460 470 200 210
Zinc (%) 7.20 6.86 5.9 5.2 6.2 5.7 5 5
Lead (%) 4.49 4.26 3.1 2.9 3.5 3.3 3 3
Silver (g/t) 87.5 80.3 59 57 66 64 60 50
McArthur River 100%
Open Cut OC (Mt) 123 118 56 52 180 170 – – KM
Zinc (%) 9.94 10.2 8.2 8.7 9.4 9.7 – –
Lead (%) 4.64 4.81 3.9 4.2 4.4 4.6 – –
Silver (g/t) 46.9 48.6 41 44 45 47 – –
Woyzbun South Zone UG (Mt) – – 8.3 8.3 8.3 8.3 – – KM
Zinc (%) – – 14 14 14 14 – –
Lead (%) – – 5.6 5.6 5.6 5.6 – –
Silver (g/t) – – 58 58 58 58 – –
Total McArthur River (Mt) 123 118 64 60 190 180 – –
Zinc (%) 9.94 10.2 8.9 9.4 9.6 9.9 – –
Lead (%) 4.64 4.81 4.1 4.4 4.5 4.7 – –
Silver (g/t) 46.9 48.6 43 46 46 48 – –
Metals and Minerals Zinc
21 Glencore - Resources & Reserves Report 2016
Australia Ore Reserves (Mount Isa, McArthur River)
Name of operation Attributable interest
Mining method Commodity
Proved Ore Reserves Probable Ore Reserves Total Ore Reserves Competent Person31.12.16 31.12.15 31.12.16 31.12.15 31.12.16 31.12.15
Mount Isa 100%
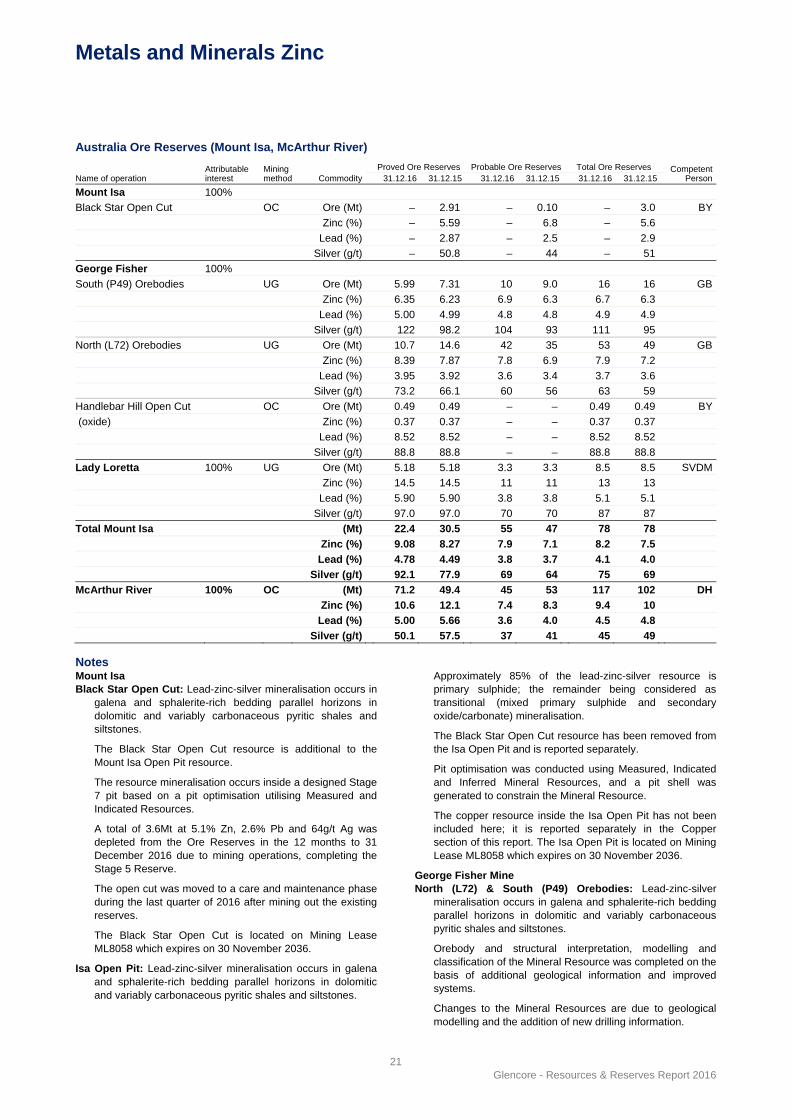
Black Star Open Cut OC Ore (Mt) – 2.91 – 0.10 – 3.0 BY
Zinc (%) – 5.59 – 6.8 – 5.6
Lead (%) – 2.87 – 2.5 – 2.9
Silver (g/t) – 50.8 – 44 – 51
George Fisher 100%
South (P49) Orebodies UG Ore (Mt) 5.99 7.31 10 9.0 16 16 GB
Zinc (%) 6.35 6.23 6.9 6.3 6.7 6.3
Lead (%) 5.00 4.99 4.8 4.8 4.9 4.9
Silver (g/t) 122 98.2 104 93 111 95
North (L72) Orebodies UG Ore (Mt) 10.7 14.6 42 35 53 49 GB
Zinc (%) 8.39 7.87 7.8 6.9 7.9 7.2
Lead (%) 3.95 3.92 3.6 3.4 3.7 3.6
Silver (g/t) 73.2 66.1 60 56 63 59
Handlebar Hill Open Cut OC Ore (Mt) 0.49 0.49 – – 0.49 0.49 BY
(oxide) Zinc (%) 0.37 0.37 – – 0.37 0.37
Lead (%) 8.52 8.52 – – 8.52 8.52
Silver (g/t) 88.8 88.8 – – 88.8 88.8
Lady Loretta 100% UG Ore (Mt) 5.18 5.18 3.3 3.3 8.5 8.5 SVDM
Zinc (%) 14.5 14.5 11 11 13 13
Lead (%) 5.90 5.90 3.8 3.8 5.1 5.1
Silver (g/t) 97.0 97.0 70 70 87 87
Total Mount Isa (Mt) 22.4 30.5 55 47 78 78
Zinc (%) 9.08 8.27 7.9 7.1 8.2 7.5
Lead (%) 4.78 4.49 3.8 3.7 4.1 4.0
Silver (g/t) 92.1 77.9 69 64 75 69
McArthur River 100% OC (Mt) 71.2 49.4 45 53 117 102 DH
Zinc (%) 10.6 12.1 7.4 8.3 9.4 10
Lead (%) 5.00 5.66 3.6 4.0 4.5 4.8
Silver (g/t) 50.1 57.5 37 41 45 49
Notes Mount Isa Black Star Open Cut: Lead-zinc-silver mineralisation occurs in
galena and sphalerite-rich bedding parallel horizons in dolomitic and variably carbonaceous pyritic shales and siltstones.
The Black Star Open Cut resource is additional to the Mount Isa Open Pit resource.
The resource mineralisation occurs inside a designed Stage 7 pit based on a pit optimisation utilising Measured and Indicated Resources.
A total of 3.6Mt at 5.1% Zn, 2.6% Pb and 64g/t Ag was depleted from the Ore Reserves in the 12 months to 31 December 2016 due to mining operations, completing the Stage 5 Reserve.
The open cut was moved to a care and maintenance phase during the last quarter of 2016 after mining out the existing reserves.
The Black Star Open Cut is located on Mining Lease ML8058 which expires on 30 November 2036.
Isa Open Pit: Lead-zinc-silver mineralisation occurs in galena and sphalerite-rich bedding parallel horizons in dolomitic and variably carbonaceous pyritic shales and siltstones.
Approximately 85% of the lead-zinc-silver resource is primary sulphide; the remainder being considered as transitional (mixed primary sulphide and secondary oxide/carbonate) mineralisation.
The Black Star Open Cut resource has been removed from the Isa Open Pit and is reported separately.
Pit optimisation was conducted using Measured, Indicated and Inferred Mineral Resources, and a pit shell was generated to constrain the Mineral Resource.
The copper resource inside the Isa Open Pit has not been included here; it is reported separately in the Copper section of this report. The Isa Open Pit is located on Mining Lease ML8058 which expires on 30 November 2036.
George Fisher Mine North (L72) & South (P49) Orebodies: Lead-zinc-silver
mineralisation occurs in galena and sphalerite-rich bedding parallel horizons in dolomitic and variably carbonaceous pyritic shales and siltstones.
Orebody and structural interpretation, modelling and classification of the Mineral Resource was completed on the basis of additional geological information and improved systems.
Changes to the Mineral Resources are due to geological modelling and the addition of new drilling information.
Metals and Minerals Zinc
22 Glencore - Resources & Reserves Report 2016
Mine production for the period January 2016 to December 2016 totalled 3.1Mt at 7.6% Zn, 4.5% Pb and 84g/t Ag.
The mine is located on Mining Lease ML8058 which expires on 30 November 2036.
Handlebar Hill Open Cut: Lead-zinc-silver mineralisation occurs in galena and sphalerite-rich bedding parallel horizons in dolomitic and variably carbonaceous pyritic shales and siltstones.
The Handlebar Hill Open Cut resource is up dip of and additional to the George Fisher South resource.
Material from the oxidised portion of the mineralisation has been reported as a Mineral Resource and Ore Reserve following confirmation of an achievable treatment path.
No depletion has occurred through mining during 2016.
The Handlebar Hill Open Cut is located on Mining Lease ML8058 which expires on 30 November 2036. The mine was placed in care and maintenance in July 2014.
Lady Loretta Lead-zinc-silver mineralisation occurs in a galena and
sphalerite rich massive sulphide lens located in carbonaceous pyritic shales and siltstones. The deposit consists of a tight syncline dislocated by a number of major faults. The deeper and high grade portion of the deposit reaches 500m below the surface.
There was no mine production for 2016 as Lady Loretta was placed on care and maintenance during the last quarter of 2015 with a view to restarting in the appropriate economic conditions. There is no change to the Resource or Reserve for 2016.
The Mining Lease (ML5568) is current until 31 January 2026.
McArthur River Mine Zinc-lead-silver mineralisation occurs predominantly as
ultra-fine bedded parallel sphalerite and galena rich bands hosted by dolomitic and carbonaceous pyritic siltstones, graded beds and chaotic debris flow breccias.
Mineral Resources and Ore Reserves are based on the approved mine plan.
All relevant Modifying Factors for the conversion of Mineral Resources to Ore Reserves have been considered, with confidence levels in these factors reflected in the classification categories. There are no known issues that could materially affect the estimates.
The Ore Reserves and Mineral Resources have been depleted during 2016 by a total of 3.4Mt at 7.8% Zn and 3.3% Pb. Mining activities are temporarily progressing at a reduced rate, as announced by Glencore in October 2015. Changes beyond depletion were primarily due to revised cut-off calculations.
Mineral Resources and Ore Reserves are located within leases that are valid to 2043, with the current mine plan ending in 2040.
Competent Persons BY = Ben Young, Mine Operations Manager, Glencore Zinc,
(AusIMM).
DH = Drew Herbert, Mining Consultant, The Minserve Group Pty Ltd, (AusIMM).
GB = Guilherme Barboza, Mine Planning Superintendent, Glencore Zinc, (AusIMM).
NS = Nicholas Spanswick, Senior Mine Geologist, Glencore Zinc, (AIG).
SVDM = Shaun Van Der Merwe, Manager Technical Services, Glencore Zinc, (AusIMM).
Metals and Minerals Zinc
23 Glencore - Resources & Reserves Report 2016
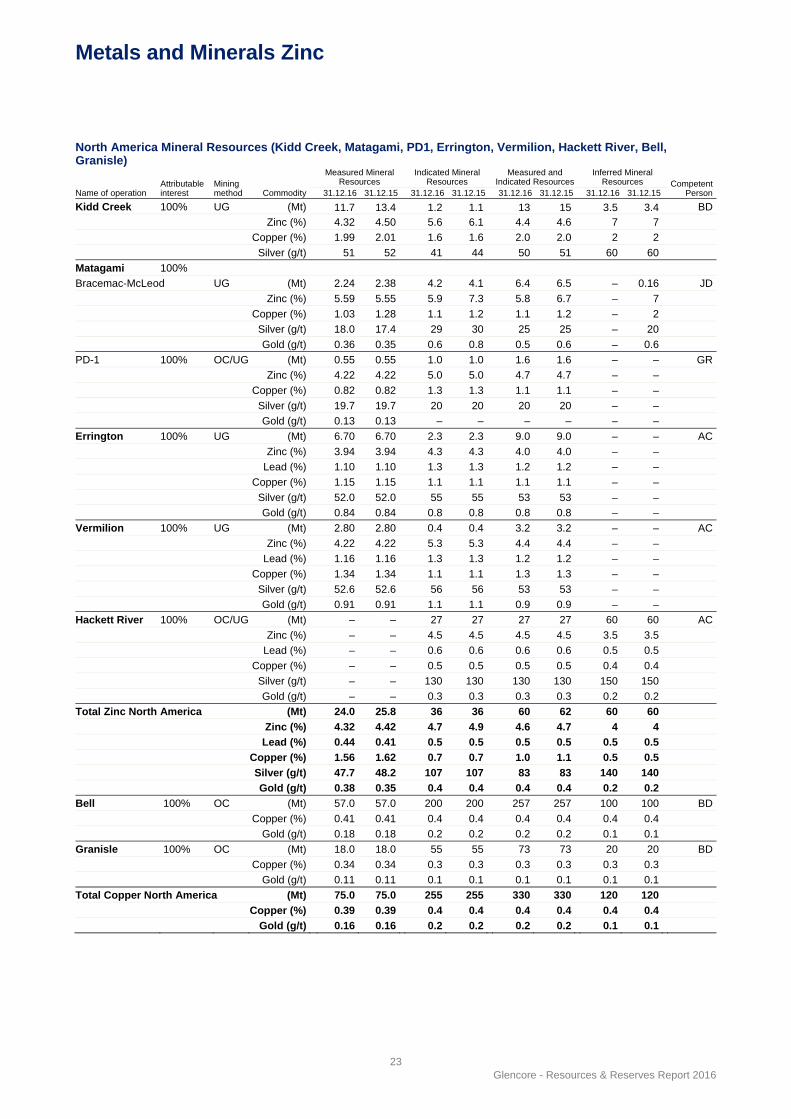
North America Mineral Resources (Kidd Creek, Matagami, PD1, Errington, Vermilion, Hackett River, Bell, Granisle)
Name of operation Attributable interest
Mining method Commodity
Measured Mineral
Resources Indicated Mineral
Resources Measured and
Indicated Resources Inferred Mineral
Resources Competent Person 31.12.16 31.12.15 31.12.16 31.12.15 31.12.16 31.12.15 31.12.16 31.12.15
Kidd Creek 100% UG (Mt) 11.7 13.4 1.2 1.1 13 15 3.5 3.4 BD
Zinc (%) 4.32 4.50 5.6 6.1 4.4 4.6 7 7
Copper (%) 1.99 2.01 1.6 1.6 2.0 2.0 2 2
Silver (g/t) 51 52 41 44 50 51 60 60
Matagami 100%
Bracemac-McLeod UG (Mt) 2.24 2.38 4.2 4.1 6.4 6.5 – 0.16 JD
Zinc (%) 5.59 5.55 5.9 7.3 5.8 6.7 – 7
Copper (%) 1.03 1.28 1.1 1.2 1.1 1.2 – 2
Silver (g/t) 18.0 17.4 29 30 25 25 – 20
Gold (g/t) 0.36 0.35 0.6 0.8 0.5 0.6 – 0.6
PD-1 100% OC/UG (Mt) 0.55 0.55 1.0 1.0 1.6 1.6 – – GR
Zinc (%) 4.22 4.22 5.0 5.0 4.7 4.7 – –
Copper (%) 0.82 0.82 1.3 1.3 1.1 1.1 – –
Silver (g/t) 19.7 19.7 20 20 20 20 – –
Gold (g/t) 0.13 0.13 – – – – – –
Errington 100% UG (Mt) 6.70 6.70 2.3 2.3 9.0 9.0 – – AC
Zinc (%) 3.94 3.94 4.3 4.3 4.0 4.0 – –
Lead (%) 1.10 1.10 1.3 1.3 1.2 1.2 – –
Copper (%) 1.15 1.15 1.1 1.1 1.1 1.1 – –
Silver (g/t) 52.0 52.0 55 55 53 53 – –
Gold (g/t) 0.84 0.84 0.8 0.8 0.8 0.8 – –
Vermilion 100% UG (Mt) 2.80 2.80 0.4 0.4 3.2 3.2 – – AC
Zinc (%) 4.22 4.22 5.3 5.3 4.4 4.4 – –
Lead (%) 1.16 1.16 1.3 1.3 1.2 1.2 – –
Copper (%) 1.34 1.34 1.1 1.1 1.3 1.3 – –
Silver (g/t) 52.6 52.6 56 56 53 53 – –
Gold (g/t) 0.91 0.91 1.1 1.1 0.9 0.9 – –
Hackett River 100% OC/UG (Mt) – – 27 27 27 27 60 60 AC
Zinc (%) – – 4.5 4.5 4.5 4.5 3.5 3.5
Lead (%) – – 0.6 0.6 0.6 0.6 0.5 0.5
Copper (%) – – 0.5 0.5 0.5 0.5 0.4 0.4
Silver (g/t) – – 130 130 130 130 150 150
Gold (g/t) – – 0.3 0.3 0.3 0.3 0.2 0.2
Total Zinc North America (Mt) 24.0 25.8 36 36 60 62 60 60
Zinc (%) 4.32 4.42 4.7 4.9 4.6 4.7 4 4
Lead (%) 0.44 0.41 0.5 0.5 0.5 0.5 0.5 0.5
Copper (%) 1.56 1.62 0.7 0.7 1.0 1.1 0.5 0.5
Silver (g/t) 47.7 48.2 107 107 83 83 140 140
Gold (g/t) 0.38 0.35 0.4 0.4 0.4 0.4 0.2 0.2
Bell 100% OC (Mt) 57.0 57.0 200 200 257 257 100 100 BD
Copper (%) 0.41 0.41 0.4 0.4 0.4 0.4 0.4 0.4
Gold (g/t) 0.18 0.18 0.2 0.2 0.2 0.2 0.1 0.1
Granisle 100% OC (Mt) 18.0 18.0 55 55 73 73 20 20 BD
Copper (%) 0.34 0.34 0.3 0.3 0.3 0.3 0.3 0.3
Gold (g/t) 0.11 0.11 0.1 0.1 0.1 0.1 0.1 0.1
Total Copper North America (Mt) 75.0 75.0 255 255 330 330 120 120
Copper (%) 0.39 0.39 0.4 0.4 0.4 0.4 0.4 0.4
Gold (g/t) 0.16 0.16 0.2 0.2 0.2 0.2 0.1 0.1
Metals and Minerals Zinc
24 Glencore - Resources & Reserves Report 2016
North America Ore Reserves (Kidd Creek, Matagami)
Name of operation Attributable interest
Mining method Commodity
Proved Ore Reserves Probable Ore Reserves Total Ore Reserves Competent Person31.12.16 31.12.15 31.12.16 31.12.15 31.12.16 31.12.15
Kidd Creek 100% UG Ore (Mt) 6.62 6.99 1.8 3.3 8.4 10 AM
Zinc (%) 3.76 4.06 5.2 4.7 4.1 4.3
Copper (%) 1.98 2.02 1.7 1.8 1.9 2.0
Silver (g/t) 49 50 44 46 48 49
Matagami 100%
Bracemac-McLeod UG Ore (Mt) 1.04 1.21 3.0 4.2 4.0 5.4 AC
Zinc (%) 7.05 6.24 6.8 6.8 6.8 6.7
Copper (%) 0.93 1.29 1.2 1.1 1.1 1.1
Silver (g/t) 18.7 16.9 30 27 27 25
Gold (g/t) 0.41 0.37 0.7 0.6 0.6 0.6
Total North America (Mt) 7.66 8.20 4.8 7.5 12 16
Zinc (%) 4.21 4.38 6.2 5.9 5.0 5.1
Copper (%) 1.84 1.91 1.4 1.4 1.7 1.7
Silver (g/t) 44.9 45.1 35 35 41 40
Gold (g/t) 0.06 0.05 0.4 0.4 0.2 0.2 Notes Kidd Creek: Kidd Creek is a VMS Cu-Zn-Ag deposit.
Mineralisation occurs within a rhyolitic volcanic/volcaniclastic sequence as massive sulphide lenses of dominantly pyrite-pyrrhotite-sphalerite-galena-rich ores that are underlain by copper (chalcopyrite) stringer zones.
Ore Reserves are based on the approved mining plan to 9600ft depth.
Mineral Resources and Ore Reserves changes are the result of mining drawdown, with some adjustments due to updated mine design, cost reductions, and commodity pricing changes.
January to December 2016 production totalled 2.3Mt at 4.0% Zn, 1.8% Cu and 44g/t Ag.
The majority of Ore Reserve in the Probable category reflects geotechnical and economic uncertainty during the latter years of the mine plan, rather than geological uncertainty.
Mine life is anticipated to be 5.3 years (Early 2022). There are no known land tenure issues that could affect the production plan.
Bracemac-McLeod: The Bracemac-McLeod deposits comprise a cluster of polymetallic VMS lenses similar to other deposits mined historically in the Matagami mining camp, except for their generally thinner and complex morphology. The deposits are located 4.5km southeast of Glencore's Matagami concentrator, at depths ranging from 100m to 1,400m below the surface. The deepest deposit, the McLeod Deep lens, was delineated in 2013.
The geological models and the resource block models for all Bracemac lenses (Main, KT and Upper) and McLeod A, B, C and West lenses are revised regularly based on new information derived from underground delineation diamond drilling and geological mapping. The residual Mineral Resources are updated on a monthly basis as mining progresses. For most massive to semi-massive sulphide lenses, there is significant lower grade stringer-type mineralisation in the immediate footwall. Several of these stringer zones are now categorised as Measured Resources. The geological model and the resource block model for the McLeod Deep lens is now based on 56 intersections drilled in 2010 and 2013 on 50m spacing. The
Mineral Resource for the McLeod Deep lens is now classified as Indicated. The Mineral Reserve of McLeod Deep was generated through the completed feasibility study.
Mine production for year 2016 was 0.94Mt grading 5.9% Zn, 1.1% Cu, 19g/t Ag and 0.37g/ Au.
The Bracemac-McLeod mine is contained on two mining leases expiring in April 2033.
PD–1: The PD1 deposit is a polymetallic VMS deposit of the same age and derived from the same ore-forming hydrothermal system as the rest of the Matagami camp deposits. It is located 40km west of Glencore's Matagami concentrator and offices.
The PD1 deposit was discovered in 1974. A total of 50 historical drill holes were drilled between 1974 and 1984. In 2010, 25 additional holes were drilled in the upper portion of the deposit above 100m vertical depth, including 3 duplicate holes to validate the historical data. The deposit is located on a mining claim owned by Glencore Canada Corporation.
Errington: The Errington deposit is a polymetallic massive sulphide located in the Sudbury Basin, Ontario. The 5 lenses that make up this deposit are hosted by sedimentary rocks of the Vermilion Formation at the contact of the Onaping and Onwatin formations. The deposits formed by replacement of carbonate mounds and carbonaceous tuffs fuelled by heat from the Sudbury Igneous Complex. Additional enrichment and concentration of metals was provided by deformation from the South Range shear zone.
Discovered in the 1920’s, the Errington underground development began in 1924 and ended in 1928. A total of 129,713t of ore were produced from Errington.
In order to confirm both the morphology and grade of these historical resources based on 1,070 historical diamond drill holes, 175 supplementary diamond drill holes were carried out for a total of 50,000m. The resources have been interpolated by ID2.
Vermilion: The Vermilion deposit is a polymetallic massive sulphide located in the Sudbury Basin, Ontario. The 17 lenses that make up this deposit are hosted by sedimentary rocks of the Vermilion Formation at the contact of the Onaping and Onwatin formations. The deposits formed by replacement of carbonate mounds and carbonaceous tuffs fuelled by heat from the Sudbury Igneous Complex.

Metals and Minerals Zinc
25 Glencore - Resources & Reserves Report 2016
Additional enrichment and concentration of metals was provided by deformation from the South Range shear zone.
Although discovered in the 1920’s, the Vermilion underground development only started between 1952 and 1957. A total of 22,172t of ore were hoisted at Vermillion and stockpiled circa since 1958. The stockpile was shipped to Kidd Creek for processing in 1992.
In order to confirm both the morphology and grade of these historical resources based on 609 historical diamond drill holes, 35 supplementary diamond drill holes were carried out for a total of 10,000m. The resources have been interpolated by ID2.
Hackett River Project: The Hackett River project is located in Nunavut, Canada, approximately 480km northeast of Yellowknife and 105km south–southwest of the community of Bathurst Inlet, which is located on the Arctic Ocean.
The Hackett River deposits are situated within the Slave Structural Province, a predominantly Archaean granite-greenstone-sedimentary terrain that lies between Great Slave Lake and Coronation Gulf. The deposits are typical of VMS deposits. Sulphide mineralisation occurs as tabular semi-massive to massive lenses. Stringer sulphide minerals are developed beneath the lower massive lenses in stratiform to pipe-like configurations. Stratiform disseminated sulphides envelop the massive sulphide and stringer zones.
The four principal sulphide occurrences from west to east are the East Cleaver, Boot Lake, Main Zone, and Jo Zone deposits. These deposits were defined as economically viable mineable resources, following boundaries of open cut vs underground mining, through a Preliminary Economic Assessment prior to Glencore’s acquisition (2010). A Pre-Feasibility study is now underway and is revisiting both the mining methods and boundaries between open cut and underground; for these reasons the Mineral Resources are only distinguished through their categories instead of exploitation method.
Following the exploration drilling campaign of 2013, which added 114 drill holes totalling 39,000m, we have undertaken the re-interpretation of an in situ resource using Zn equivalent values instead of considering a block dollar value. The resources have been interpolated by ID2.
Bell/Granisle: Bell and Granisle are porphyry copper-gold deposits located at Babine Lake. The Babine deposits are associated with calc-alkaline magmatic rocks. They were formed in the roots of Eocene volcanoes built upon continental crust. Erosion has removed most of the poorly consolidated volcanic piles, exposing the mineral deposits.
Recorded past production from the Bell mine from 1972 to 1992 totalled 77.2Mt averaging 0.47% Cu with an average waste to ore ratio of 0.95:1.
Past production for Granisle from 1966 to 1982 totalled 52.7Mt averaging 0.47% Cu with an average waste to ore ratio of 1.37.
The latest Mineral Resource estimate does not include the additional 25 holes (12,260m) drilled in 2012. The results of the Pre-Feasibility Study delivered in May 2013 are still under review.
A life of mine of 19 years has been estimated, at a processing rate of 50,000 tonnes per day.
There are no known land tenure issues and the mining leases are renewed yearly.
Competent Persons AC = Aline Côté, Project Manager, Glencore Zinc, (OGQ).
AM = Adrianus Moerman, Principal Mine Engineer, Glencore Zinc, (APEO).
BD = Benoit Drolet, Senior Resource Geologist, Glencore Zinc (APGO).
GR = Gilles Roy, District Geologist, Glencore Zinc, (OGQ).
JD = Julie Drapeau, Chief Mine Geologist, Glencore Zinc (OGQ).
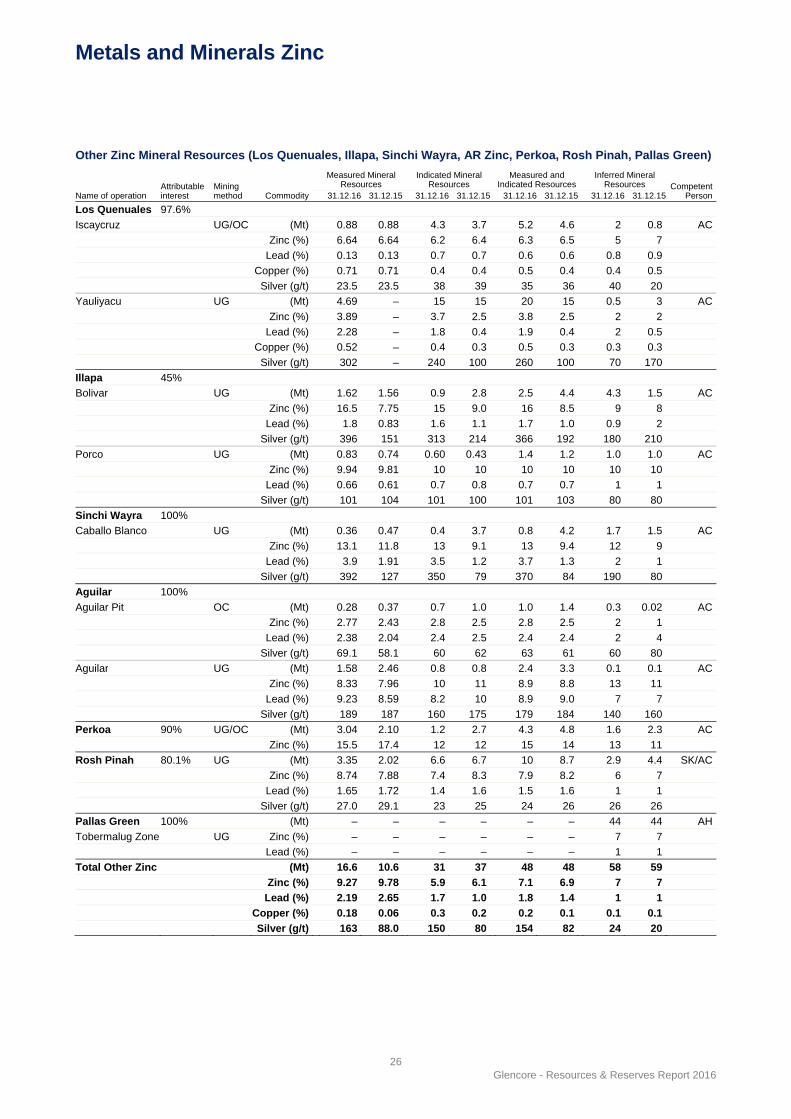
Metals and Minerals Zinc
26 Glencore - Resources & Reserves Report 2016
Other Zinc Mineral Resources (Los Quenuales, Illapa, Sinchi Wayra, AR Zinc, Perkoa, Rosh Pinah, Pallas Green)
Name of operation Attributable interest
Mining method Commodity
Measured Mineral
Resources Indicated Mineral
Resources Measured and
Indicated Resources Inferred Mineral
Resources Competent Person 31.12.16 31.12.15 31.12.16 31.12.15 31.12.16 31.12.15 31.12.16 31.12.15
Los Quenuales 97.6%
Iscaycruz UG/OC (Mt) 0.88 0.88 4.3 3.7 5.2 4.6 2 0.8 AC
Zinc (%) 6.64 6.64 6.2 6.4 6.3 6.5 5 7
Lead (%) 0.13 0.13 0.7 0.7 0.6 0.6 0.8 0.9
Copper (%) 0.71 0.71 0.4 0.4 0.5 0.4 0.4 0.5
Silver (g/t) 23.5 23.5 38 39 35 36 40 20
Yauliyacu UG (Mt) 4.69 – 15 15 20 15 0.5 3 AC
Zinc (%) 3.89 – 3.7 2.5 3.8 2.5 2 2
Lead (%) 2.28 – 1.8 0.4 1.9 0.4 2 0.5
Copper (%) 0.52 – 0.4 0.3 0.5 0.3 0.3 0.3
Silver (g/t) 302 – 240 100 260 100 70 170
Illapa 45%
Bolivar UG (Mt) 1.62 1.56 0.9 2.8 2.5 4.4 4.3 1.5 AC
Zinc (%) 16.5 7.75 15 9.0 16 8.5 9 8
Lead (%) 1.8 0.83 1.6 1.1 1.7 1.0 0.9 2
Silver (g/t) 396 151 313 214 366 192 180 210
Porco UG (Mt) 0.83 0.74 0.60 0.43 1.4 1.2 1.0 1.0 AC
Zinc (%) 9.94 9.81 10 10 10 10 10 10
Lead (%) 0.66 0.61 0.7 0.8 0.7 0.7 1 1
Silver (g/t) 101 104 101 100 101 103 80 80
Sinchi Wayra 100%
Caballo Blanco UG (Mt) 0.36 0.47 0.4 3.7 0.8 4.2 1.7 1.5 AC
Zinc (%) 13.1 11.8 13 9.1 13 9.4 12 9
Lead (%) 3.9 1.91 3.5 1.2 3.7 1.3 2 1
Silver (g/t) 392 127 350 79 370 84 190 80
Aguilar 100%
Aguilar Pit OC (Mt) 0.28 0.37 0.7 1.0 1.0 1.4 0.3 0.02 AC
Zinc (%) 2.77 2.43 2.8 2.5 2.8 2.5 2 1
Lead (%) 2.38 2.04 2.4 2.5 2.4 2.4 2 4
Silver (g/t) 69.1 58.1 60 62 63 61 60 80
Aguilar UG (Mt) 1.58 2.46 0.8 0.8 2.4 3.3 0.1 0.1 AC
Zinc (%) 8.33 7.96 10 11 8.9 8.8 13 11
Lead (%) 9.23 8.59 8.2 10 8.9 9.0 7 7
Silver (g/t) 189 187 160 175 179 184 140 160
Perkoa 90% UG/OC (Mt) 3.04 2.10 1.2 2.7 4.3 4.8 1.6 2.3 AC
Zinc (%) 15.5 17.4 12 12 15 14 13 11
Rosh Pinah 80.1% UG (Mt) 3.35 2.02 6.6 6.7 10 8.7 2.9 4.4 SK/AC
Zinc (%) 8.74 7.88 7.4 8.3 7.9 8.2 6 7
Lead (%) 1.65 1.72 1.4 1.6 1.5 1.6 1 1
Silver (g/t) 27.0 29.1 23 25 24 26 26 26
Pallas Green 100% (Mt) – – – – – – 44 44 AH
Tobermalug Zone UG Zinc (%) – – – – – – 7 7
Lead (%) – – – – – – 1 1
Total Other Zinc (Mt) 16.6 10.6 31 37 48 48 58 59
Zinc (%) 9.27 9.78 5.9 6.1 7.1 6.9 7 7
Lead (%) 2.19 2.65 1.7 1.0 1.8 1.4 1 1
Copper (%) 0.18 0.06 0.3 0.2 0.2 0.1 0.1 0.1
Silver (g/t) 163 88.0 150 80 154 82 24 20
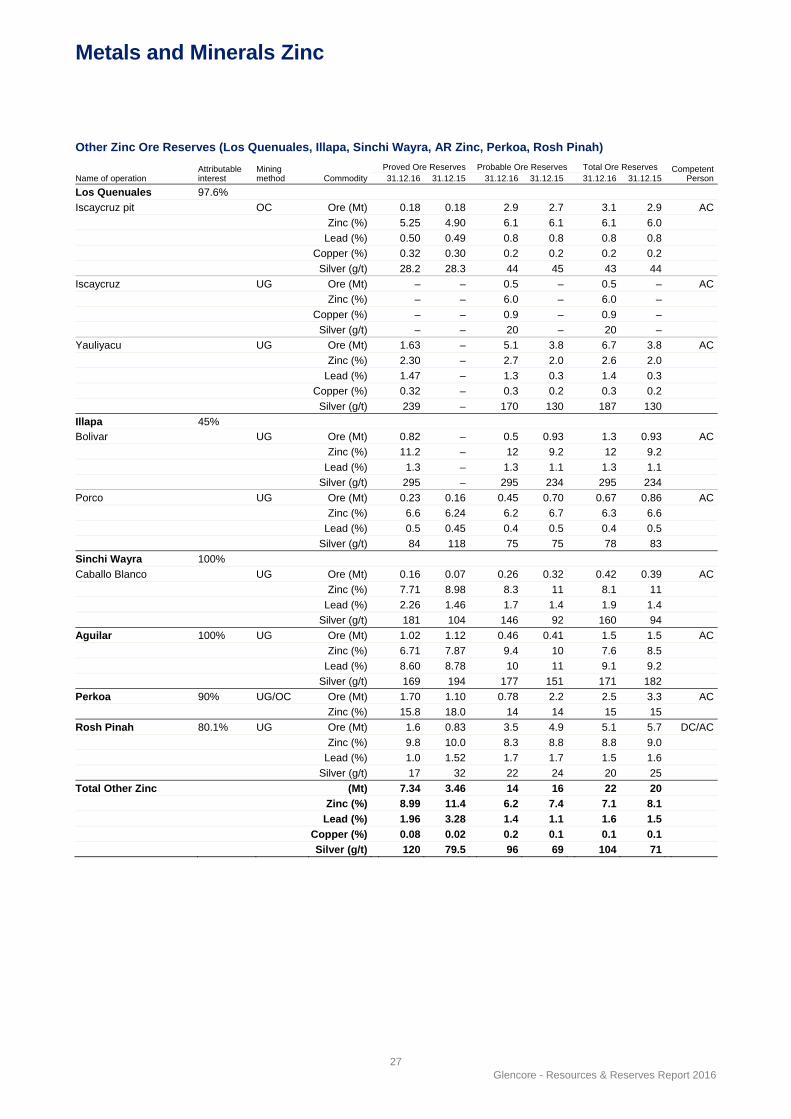
Metals and Minerals Zinc
27 Glencore - Resources & Reserves Report 2016
Other Zinc Ore Reserves (Los Quenuales, Illapa, Sinchi Wayra, AR Zinc, Perkoa, Rosh Pinah)
Name of operation Attributable interest
Mining method Commodity
Proved Ore Reserves Probable Ore Reserves Total Ore Reserves Competent Person31.12.16 31.12.15 31.12.16 31.12.15 31.12.16 31.12.15
Los Quenuales 97.6%
Iscaycruz pit OC Ore (Mt) 0.18 0.18 2.9 2.7 3.1 2.9 AC
Zinc (%) 5.25 4.90 6.1 6.1 6.1 6.0
Lead (%) 0.50 0.49 0.8 0.8 0.8 0.8
Copper (%) 0.32 0.30 0.2 0.2 0.2 0.2
Silver (g/t) 28.2 28.3 44 45 43 44
Iscaycruz UG Ore (Mt) – – 0.5 – 0.5 – AC
Zinc (%) – – 6.0 – 6.0 –
Copper (%) – – 0.9 – 0.9 –
Silver (g/t) – – 20 – 20 –
Yauliyacu UG Ore (Mt) 1.63 – 5.1 3.8 6.7 3.8 AC
Zinc (%) 2.30 – 2.7 2.0 2.6 2.0
Lead (%) 1.47 – 1.3 0.3 1.4 0.3
Copper (%) 0.32 – 0.3 0.2 0.3 0.2
Silver (g/t) 239 – 170 130 187 130
Illapa 45%
Bolivar UG Ore (Mt) 0.82 – 0.5 0.93 1.3 0.93 AC
Zinc (%) 11.2 – 12 9.2 12 9.2
Lead (%) 1.3 – 1.3 1.1 1.3 1.1
Silver (g/t) 295 – 295 234 295 234
Porco UG Ore (Mt) 0.23 0.16 0.45 0.70 0.67 0.86 AC
Zinc (%) 6.6 6.24 6.2 6.7 6.3 6.6
Lead (%) 0.5 0.45 0.4 0.5 0.4 0.5
Silver (g/t) 84 118 75 75 78 83
Sinchi Wayra 100%
Caballo Blanco UG Ore (Mt) 0.16 0.07 0.26 0.32 0.42 0.39 AC
Zinc (%) 7.71 8.98 8.3 11 8.1 11
Lead (%) 2.26 1.46 1.7 1.4 1.9 1.4
Silver (g/t) 181 104 146 92 160 94
Aguilar 100% UG Ore (Mt) 1.02 1.12 0.46 0.41 1.5 1.5 AC
Zinc (%) 6.71 7.87 9.4 10 7.6 8.5
Lead (%) 8.60 8.78 10 11 9.1 9.2
Silver (g/t) 169 194 177 151 171 182
Perkoa 90% UG/OC Ore (Mt) 1.70 1.10 0.78 2.2 2.5 3.3 AC
Zinc (%) 15.8 18.0 14 14 15 15
Rosh Pinah 80.1% UG Ore (Mt) 1.6 0.83 3.5 4.9 5.1 5.7 DC/AC
Zinc (%) 9.8 10.0 8.3 8.8 8.8 9.0
Lead (%) 1.0 1.52 1.7 1.7 1.5 1.6
Silver (g/t) 17 32 22 24 20 25
Total Other Zinc (Mt) 7.34 3.46 14 16 22 20
Zinc (%) 8.99 11.4 6.2 7.4 7.1 8.1
Lead (%) 1.96 3.28 1.4 1.1 1.6 1.5
Copper (%) 0.08 0.02 0.2 0.1 0.1 0.1
Silver (g/t) 120 79.5 96 69 104 71
Metals and Minerals Zinc
28 Glencore - Resources & Reserves Report 2016
Notes Iscaycruz: Zinc, lead and copper mineralisation are exposed as
subvertical massive sulphide orebodies; described as skarn, breccias and carbonate replacement type along 12km corridor hosted in clay-rich limestone and dolomite rocks. Hydrothermal mineralisation assemblages are mainly composed of sphalerite, galena, pyrite and chalcopyrite distributed in five production zones named Limpe Centro, Chupa, Tinyag II, Tinyag I and Santa Este from north to south. Changes in Resource grades and tonnages come from the completed 3D model, which contains geostatistical sub-domains which enable grade enhancement.
Underground Reserves were generated at Chupa and Limpe Sur following a positive economic assessment. A feasibility study to determine underground viability at Santa Este and Olga Norte is planned for 2017/18.
The mine was on care and maintenance throughout 2016.
The expected life of Iscaycruz is 2 to 3 years based on Ore Reserves and 3 to 5 years based on Mineral Resources.
Expiry date of relevant mining/concession licences: permanent.
Yauliyacu: Main mineralisation occurs as sphalerite, galena, tetrahedrite and chalcopyrite in 60° to 80° northwest dipping narrow veins, stockwork and minor replacement massive orebodies exposed in about 5km length extension and +2km depth extension. This hydrothermal mineralisation is strongly structurally controlled and hosted in folded rock units as calcareous sandstones (red beds), conglomerates, volcanic tuffs, andesites and limestones.
Mineral Resource estimate methodology for two zones of Yauliyacu was changed from 2D polygonal to 3D kriging for the main zones and 3D ID2 for the secondary zones. The grade of the Reserve estimate reflects the Resource grade increase but is dampened by appropriate mining factors, in accordance with the mineralisation and various mining methods.
Production for 2016 was 1.4Mt grading 2.3% Zn, 0.8% Pb and 73g/t Ag.
The expected life of Yauliyacu is 3 to 4 years based on Ore Reserves and 10 to 12 years based on Mineral Resources.
Expiry date of relevant mining/concession licences: permanent.
Illapa and Sinchi Wayra: The majority of the deposits within the Illapa and Sinchi Wayra portfolio are epigenetic-hydrothermal base metal type vein and fault filled mineralisation hosted within a variety of lithologies from volcanic tuffs to sedimentary packages. The main mineral assemblages are composed of sphalerite, marmatite, galena, silver rich galena and silver sulfosalts. The resources are usually based on multiple structures with Porco containing over 100 different veins. The typical dimensions of these structures is +500m in length and +450m depth profile with mineralisation open at depth; average vein widths from 0.2 - 4.0m.
Caballo Blanco operational unit consists of three mines: Colquechaquita, Reserva and Tres Amigos, supplying the central plant “Don Diego” situated close to Potosi.
Regarding Bolivar, ore zones have been fully converted to 3D and reported; the Mineral Resource grades have increased as a result of new interpolation parameters, as dictated by variography. The increased Reserve grades and tonnages reflect the Resource update.
Production for 2016 for each of the operations was:
Bolivar – 0.26Mt grading 9.0% Zn, 0.9% Pb and 229 g/t Ag.
Porco – 0.19Mt grading 7.6% Zn, 0.7% Pb and 101g/t Ag.
Caballo Blanco – 0.19Mt grading 7.8% Zn, 2.1% Pb and 214g/t Ag.
The expected life of the mines as a group, considering current production capacities, is an average of 2.5 years based on Ore Reserves and 7 to 10 years based on Mineral Resources.
According to the new Bolivian Constitution enacted in 2009, natural resources belong to the Bolivian people. The Bolivian State can enter into mining contracts with private investors to operate them. As with all private investors in Bolivia, Illapa and Sinchi Wayra do not hold property rights over mining resources in the country, but rather hold the right to exploit them pursuant to Bolivian legislation.
In May 2016, Glencore returned its exploitation rights in Poopo mine to the local co-operative.
Expiry date of relevant mining concessions / authorisations or contracts is different for each mine: Porco and Bolivar – July 2028 (joint venture agreement entered into in 2013); and permanent in respect of Caballo Blanco.
Aguilar: Mineralisation is classified as sedimentary exhalative type with sulphide layers in between siliciclastic and shale rocks with a post-secondary metasomatic over print between two intrusive stocks. Galena-rich, sphalerite, marmatite pyrite orebodies as lenses shape, locally brittle-style hydrothermal breccias, minor veinlets-stockworks and dissemination defines the economic portion of mineral inventories. Strike length extension of mineral geometries is variable and reaches up to 300m on north-south extension, about 55m in width and reaches up to 160m in depth.
The decrease in the underground Resources is a result of the sterilisation campaign on portions of Piqué Inferior and Capa that are impossible to access. There has been no effect on the Reserves in these areas as these zones were not considered part of the Reserve.
Production for 2016 from both underground and open pit was 0.58Mt grading 4.6% Zn, 5.1% Pb and 111g/t Ag.
The remaining mine life is approximately 3 years based on Ore Reserves and 4-5 years based on Mineral Resources.
Expiry date of relevant mining/concession licences: permanent.
Perkoa: Economic mineralisation at Perkoa occurs mainly as VMS lenses of sphalerite, galena, pyrite, and pyrrhotite. These massive sulphide lenses vary in width from 1m to 30m thick in places. These massive sulphide lenses dip at an average of 75°, striking northeast-southwest and consist of two main orebodies. Igneous intrusives have also caused endothermic and exothermic skarn like disseminated mineralisation of remobilised galena, pyrite, and to a lesser extent pyrrhotite and sphalerite.
Production for 2016 was 0.53Mt grading 15.2% Zn.
Current expected life of mine is approximately 5 years based on Ore Reserves and approximately 6 years based on Mineral Resources. Expiry date of relevant mining/concession licences: 20 March 2027.
Rosh Pinah: Sedimentary exhalative and remobilised zinc and lead sulphide ores are contained within the so-called Ore Equivalent Horizon, a stratiform horizon that is extensively
Metals and Minerals Zinc
29 Glencore - Resources & Reserves Report 2016
folded and thrusted, resulting in discreet, subvertical orebodies that vary in size from 0.4 - 8Mt.
Metallurgical test work is underway to improve throughput and metal recoveries from the WF3 orebody and produce a saleable Cu concentrate by 2017.
Mine production for the period January to December 2016 was 0.57Mt at 8.2% Zn and 1.7% Pb.
Expected life of mine is 7.6 years based on Ore Reserves. Rosh Pinah has previously been able to extend its expected life of mine through exploratory drilling in the area covered by its concession. Potential Life of Mine based on the conversion of Inferred Mineral Resources is 7.8 years. The expiry date of ML 39+AW (Mining Licence and Accessory Works) is 11 February 2020. EPL2616 (Exclusive Prospecting Licence) has been renewed for a period of 2 years, expiry date is 30 November 2017.
Pallas Green Project: The Pallas Green project is situated near Limerick in Southwestern Ireland. The Tobermalug zone consists of multiple, subhorizontal, stratiform lenses of Irish-type, breccia-hosted, sphalerite-galena-pyrite within a Carboniferous limestone. The lenses occur over an area 4,000m by 4,000m, and from 300m to 1,300m below surface.
The Inferred Mineral Resource is based on 370,000m of diamond drilling in 735 drill holes completed between 2005 and the end of 2014. Drill spacing is nominally 100m but 178 infill drill holes at 50m spacing have been completed. Mineralisation wireframes were built taking into account a cut-off of Zn + Pb and a minimum 3.0m true thickness, and constrain interpolation by Inverse Distance Weighting (IDW) in a block model.
No drilling was conducted in 2016, and there is no change in the Mineral Resource.
Competent Persons AC = Aline Côté, Project Manager, Glencore Zinc, (OGQ).
AH = Allan Huard, Senior Geologist, Glencore Zinc, (APGO).
DC = Duan Campbell, Projects : Mining Engineer, Glencore Zinc, (ECSA).
SK = Sheron Kaviua, Mineral Resources Manager, Glencore Zinc, (SACNASP).
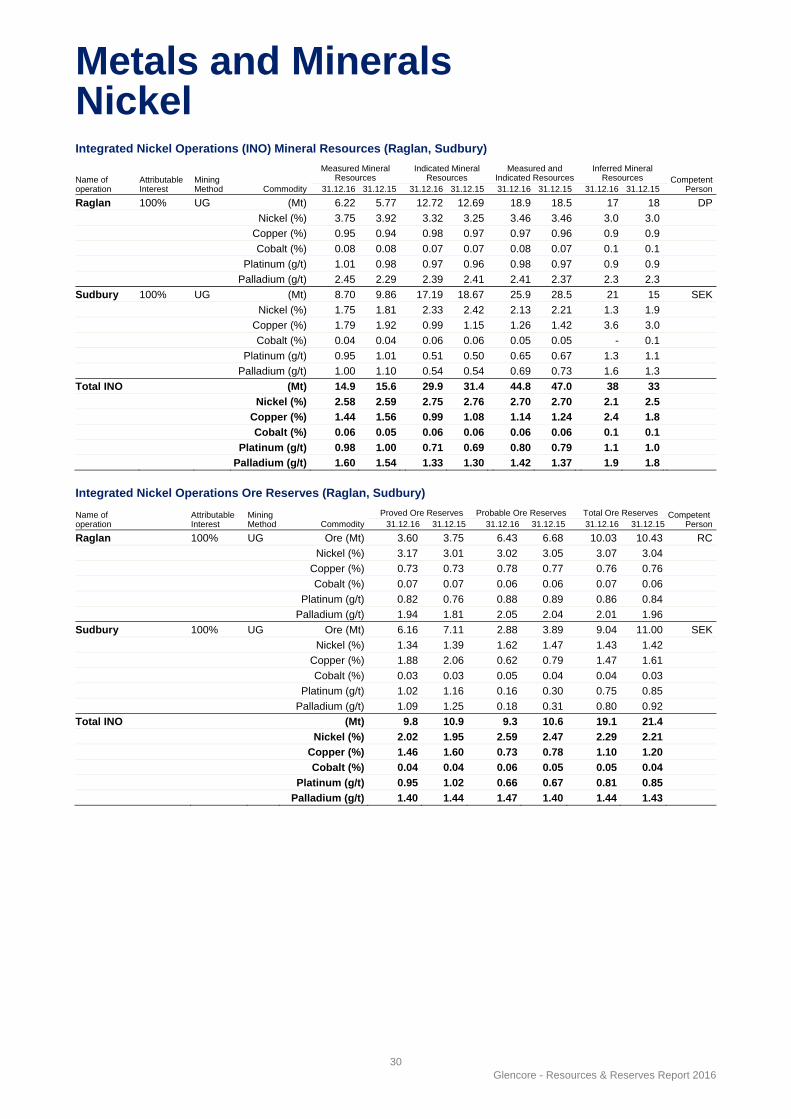
Metals and Minerals Nickel
30 Glencore - Resources & Reserves Report 2016
Integrated Nickel Operations (INO) Mineral Resources (Raglan, Sudbury)
Name of operation
Attributable Interest
Mining Method Commodity
Measured Mineral Resources
Indicated Mineral Resources
Measured and Indicated Resources
Inferred Mineral Resources Competent
Person31.12.16 31.12.15 31.12.16 31.12.15 31.12.16 31.12.15 31.12.16 31.12.15
Raglan 100% UG (Mt) 6.22 5.77 12.72 12.69 18.9 18.5 17 18 DP
Nickel (%) 3.75 3.92 3.32 3.25 3.46 3.46 3.0 3.0
Copper (%) 0.95 0.94 0.98 0.97 0.97 0.96 0.9 0.9
Cobalt (%) 0.08 0.08 0.07 0.07 0.08 0.07 0.1 0.1
Platinum (g/t) 1.01 0.98 0.97 0.96 0.98 0.97 0.9 0.9
Palladium (g/t) 2.45 2.29 2.39 2.41 2.41 2.37 2.3 2.3
Sudbury 100% UG (Mt) 8.70 9.86 17.19 18.67 25.9 28.5 21 15 SEK
Nickel (%) 1.75 1.81 2.33 2.42 2.13 2.21 1.3 1.9
Copper (%) 1.79 1.92 0.99 1.15 1.26 1.42 3.6 3.0
Cobalt (%) 0.04 0.04 0.06 0.06 0.05 0.05 - 0.1
Platinum (g/t) 0.95 1.01 0.51 0.50 0.65 0.67 1.3 1.1
Palladium (g/t) 1.00 1.10 0.54 0.54 0.69 0.73 1.6 1.3
Total INO (Mt) 14.9 15.6 29.9 31.4 44.8 47.0 38 33
Nickel (%) 2.58 2.59 2.75 2.76 2.70 2.70 2.1 2.5
Copper (%) 1.44 1.56 0.99 1.08 1.14 1.24 2.4 1.8
Cobalt (%) 0.06 0.05 0.06 0.06 0.06 0.06 0.1 0.1
Platinum (g/t) 0.98 1.00 0.71 0.69 0.80 0.79 1.1 1.0
Palladium (g/t) 1.60 1.54 1.33 1.30 1.42 1.37 1.9 1.8
Integrated Nickel Operations Ore Reserves (Raglan, Sudbury)
Name of operation
Attributable Interest
Mining Method Commodity
Proved Ore Reserves Probable Ore Reserves Total Ore Reserves Competent Person31.12.16 31.12.15 31.12.16 31.12.15 31.12.16 31.12.15
Raglan 100% UG Ore (Mt) 3.60 3.75 6.43 6.68 10.03 10.43 RC
Nickel (%) 3.17 3.01 3.02 3.05 3.07 3.04
Copper (%) 0.73 0.73 0.78 0.77 0.76 0.76
Cobalt (%) 0.07 0.07 0.06 0.06 0.07 0.06
Platinum (g/t) 0.82 0.76 0.88 0.89 0.86 0.84
Palladium (g/t) 1.94 1.81 2.05 2.04 2.01 1.96
Sudbury 100% UG Ore (Mt) 6.16 7.11 2.88 3.89 9.04 11.00 SEK
Nickel (%) 1.34 1.39 1.62 1.47 1.43 1.42
Copper (%) 1.88 2.06 0.62 0.79 1.47 1.61
Cobalt (%) 0.03 0.03 0.05 0.04 0.04 0.03
Platinum (g/t) 1.02 1.16 0.16 0.30 0.75 0.85
Palladium (g/t) 1.09 1.25 0.18 0.31 0.80 0.92
Total INO (Mt) 9.8 10.9 9.3 10.6 19.1 21.4
Nickel (%) 2.02 1.95 2.59 2.47 2.29 2.21
Copper (%) 1.46 1.60 0.73 0.78 1.10 1.20
Cobalt (%) 0.04 0.04 0.06 0.05 0.05 0.04
Platinum (g/t) 0.95 1.02 0.66 0.67 0.81 0.85
Palladium (g/t) 1.40 1.44 1.47 1.40 1.44 1.43
Metals and Minerals Nickel
31 Glencore - Resources & Reserves Report 2016
Notes For the purposes of this statement, the term ‘Ore Reserves’ as defined by the JORC Code 2012 has the same meaning as ‘Mineral Reserves’ as defined in the CIM Standards 2014. The resource totals have been restated in compliance with the JORC Code.
There are no known environmental, permitting, legal, taxation, political or other relevant issues that would materially affect the estimates of the Mineral Reserves.
Depending on when production is scheduled, Mineral Reserves and Resources are calculated using a blend of short, medium, or long term metal price assumptions and exchange rates.
Raglan: Ni-Cu-Co-PGE mineralisation is located at or near the base of subvolcanic mafic-ultramafic intrusive complexes referred to as the “Raglan Formation”. Economic Ni-Cu-Co-PGE mineralisation is composed of disseminated, net-textured, and massive pyrrhotite-pentlandite-chalcopyrite rich sulphides contained within more than 135 individual sulphide lenses, extending from surface to more than 750m vertical depth. The size of these high-grade sulphide lenses varies significantly from 0.01Mt to 5.2Mt, averaging 0.2Mt. Remaining life of mine is in excess of 20 years. Expiry date of relevant mining leases and exploration licenses: depending on the mine/project, range from 30 July 2017 to 17 August 2026.
Sudbury: Sulphide deposits sit on broadly defined trends of mineralisation along basal brecciated rocks of the Sudbury Igneous Complex as pentlandite-pyrrhotite-chalcopyrite rich concentrations as well as within the underlying footwall in fractured pathways as chalcopyrite dominated polymetallic (Cu, Ni, Au, Ag, Pt, Pd) vein-style sulphides. The total Mineral Reserve and Resource tonnage decreased from 2015 due to production. The increase in Inferred Resources is based on the discovery of the Norman West footwall deposit. Cut-off grades are calculated for each individual mine site or resource based on a metal equivalent or net smelter return value taking into account all recoverable metals. The current LOM plan based on Mineral Reserves extends to the end of 2021. Significant undeveloped Mineral Resources and exploration potential provide an opportunity to extend mine life well beyond 2021. All Land holdings in Sudbury covering existing Mineral Reserves and Resources are patented and 100% owned by Glencore with the exception of an area covered by two licences of occupation which are held in perpetuity and one mining lease which expires in 2033.
Competent Persons DP = Daniel Patry, Glencore Nickel, P.Geo (OGQ).
RC = Richard Caumartin, Glencore Nickel, P.Eng. (OIQ).
SEK = Steve Kormos, Glencore Nickel, P. Geo. (APGO).
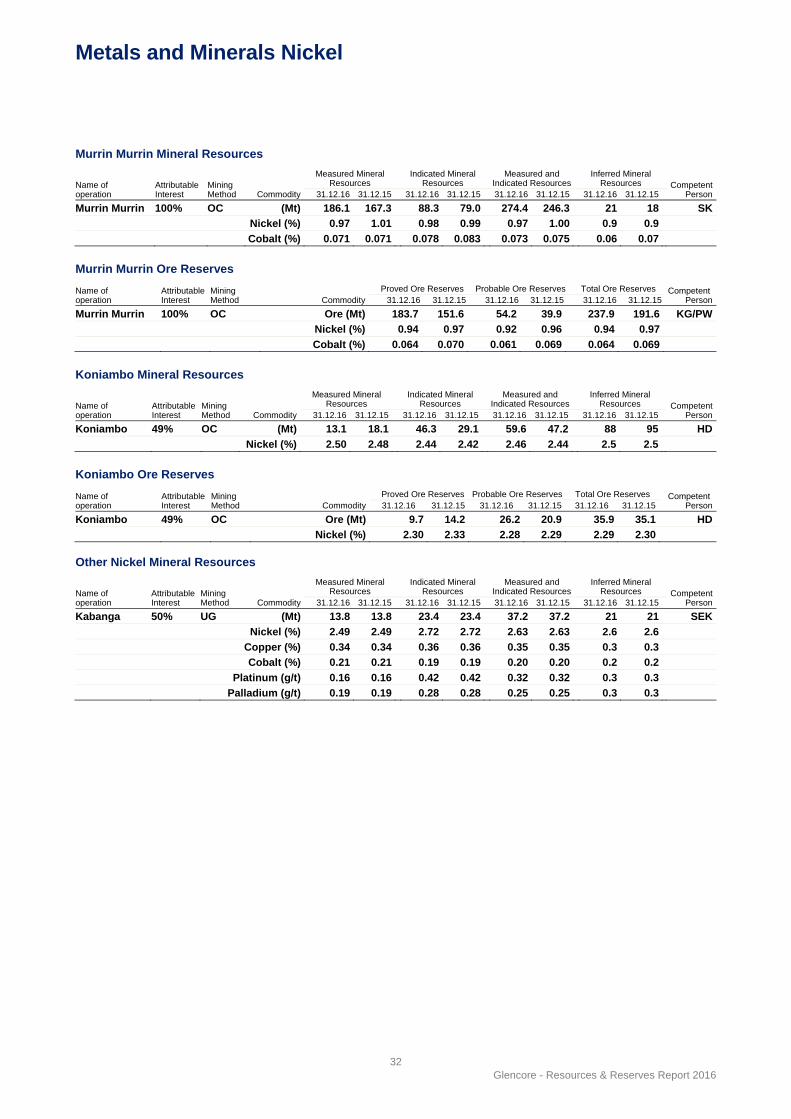
Metals and Minerals Nickel
32 Glencore - Resources & Reserves Report 2016
Murrin Murrin Mineral Resources
Name of operation
Attributable Interest
Mining Method Commodity
Measured Mineral Resources
Indicated Mineral Resources
Measured and Indicated Resources
Inferred Mineral Resources Competent
Person31.12.16 31.12.15 31.12.16 31.12.15 31.12.16 31.12.15 31.12.16 31.12.15
Murrin Murrin 100% OC (Mt) 186.1 167.3 88.3 79.0 274.4 246.3 21 18 SK
Nickel (%) 0.97 1.01 0.98 0.99 0.97 1.00 0.9 0.9
Cobalt (%) 0.071 0.071 0.078 0.083 0.073 0.075 0.06 0.07
Murrin Murrin Ore Reserves
Name of operation
Attributable Interest
Mining Method Commodity
Proved Ore Reserves Probable Ore Reserves Total Ore Reserves Competent Person31.12.16 31.12.15 31.12.16 31.12.15 31.12.16 31.12.15
Murrin Murrin 100% OC Ore (Mt) 183.7 151.6 54.2 39.9 237.9 191.6 KG/PW
Nickel (%) 0.94 0.97 0.92 0.96 0.94 0.97
Cobalt (%) 0.064 0.070 0.061 0.069 0.064 0.069
Koniambo Mineral Resources
Name of operation
Attributable Interest
Mining Method Commodity
Measured Mineral Resources
Indicated Mineral Resources
Measured and Indicated Resources
Inferred Mineral Resources Competent
Person31.12.16 31.12.15 31.12.16 31.12.15 31.12.16 31.12.15 31.12.16 31.12.15
Koniambo 49% OC (Mt) 13.1 18.1 46.3 29.1 59.6 47.2 88 95 HD
Nickel (%) 2.50 2.48 2.44 2.42 2.46 2.44 2.5 2.5
Koniambo Ore Reserves
Name of operation
Attributable Interest
Mining Method Commodity
Proved Ore Reserves Probable Ore Reserves Total Ore Reserves Competent Person31.12.16 31.12.15 31.12.16 31.12.15 31.12.16 31.12.15
Koniambo 49% OC Ore (Mt) 9.7 14.2 26.2 20.9 35.9 35.1 HD
Nickel (%) 2.30 2.33 2.28 2.29 2.29 2.30
Other Nickel Mineral Resources
Name of operation
Attributable Interest
Mining Method Commodity
Measured Mineral Resources
Indicated Mineral Resources
Measured and Indicated Resources
Inferred Mineral Resources Competent
Person31.12.16 31.12.15 31.12.16 31.12.15 31.12.16 31.12.15 31.12.16 31.12.15
Kabanga 50% UG (Mt) 13.8 13.8 23.4 23.4 37.2 37.2 21 21 SEK
Nickel (%) 2.49 2.49 2.72 2.72 2.63 2.63 2.6 2.6
Copper (%) 0.34 0.34 0.36 0.36 0.35 0.35 0.3 0.3
Cobalt (%) 0.21 0.21 0.19 0.19 0.20 0.20 0.2 0.2
Platinum (g/t) 0.16 0.16 0.42 0.42 0.32 0.32 0.3 0.3
Palladium (g/t) 0.19 0.19 0.28 0.28 0.25 0.25 0.3 0.3
Metals and Minerals Nickel
33 Glencore - Resources & Reserves Report 2016
Notes For the purposes of this statement, the term ‘Ore Reserves’ as defined by the JORC Code 2012 has the same meaning as ‘Mineral Reserves’ as defined in the CIM Standards 2014. The Mineral Resource totals have been restated in compliance with the JORC Code.
There are no known environmental, permitting, legal, taxation, political or other relevant issues that would materially affect the estimates of the Mineral Reserves.
Depending on when production is scheduled, Mineral Reserves and Resources are calculated using a blend of short, medium, or long term metal price assumptions and exchange rates.
Murrin Murrin: Nickel and cobalt mineralisation at Murrin is hosted within a laterite formed from the weathering of ultramafic rocks. The resources are hosted in multiple deposits over three main project areas (North, South and East). Mineral Resource and Ore Reserve figures as at 31 December 2016 are generated by depletion of the resource models by using end-of-period surface surveys as at 30 September 2016, with adjustments applied for October to December production. Resources are determined at a 0.76% Ni cut-off.
The Murrin 2016 Ore Reserve estimate is based on the optimised Base Case pit shells for Measured and Indicated Mineral Resources, and includes scats and stockpiles. Updates to process modelling, 4-yearly shutdown costs and operating costs have been included. The Ore Reserve and Resource tonnages increased in 2016 due to lower operating costs and revised optimised pit shells.
Ore Reserve grades have been subject to the application of grade modifying factors. These have been derived from analysis of the previous two years mine-to-mill grade performance and result in grade modifying factors of 96.7% and 86.9% for nickel and cobalt respectively.
At the forecast throughput capacity of 4.5 million tonnes per annum, the project’s operating life is in excess of 30 years. Expiry dates for relevant tenements differ for each tenement and range from 2017 to 2037.
Koniambo: Nickel rich laterite deposits are developed on variably serpentinized ultramafic rocks. The Ore Reserve estimate for the deposit was established from a new Life of Mine Resource Model established in 2015 and updated in 2016. It has been adjusted to incorporate changes in classification, and actual completed production up to 31 October 2016, with adjustments applied for forecast production between November and December. Mineral Resources for the Life of Mine area have been calculated by 3D modelling and Conditional Simulation geostatistical methods and for those areas outside of this footprint by the plan polygonal method. The reserve cut-off grade used is 2.0% Ni. Expected mine life is 18 years. The expiry date of relevant mining property licences range from April 2017 to 31 December 2048. Production began in April 2013 and mining is supporting a one line operation at the Metallurgical Plant as at 31 December 2016. Ore Reserves stated include an estimated 256kt at 2.24% of stockpiles between the mine and process plant. Ore Reserves and Mineral Resources exclude an additional 34 million tonnes of medium grade material at 1.9% Ni below the current cut-off grade (< 2.0% Ni).
Kabanga: The current delineated Mineral Resource is
comprised of 88% of contact-style massive sulphide and 12% of ultramafic-hosted disseminated to semi-massive sulphide mineralisation. The ultramafic bodies are hosted in a sequence of metamorphosed pelitic sediments that are overturned, steeply dipping. All resource estimates are done using Ordinary Kriging and are based on block models with appropriate variography. A cut-off grade of 1% Ni-equivalent is used for all Mineral Resources except ultramafic-hosted disseminated to semi-massive sulphide (UMIN) mineralisation at Tembo (1.1% Ni cut-off grade applied). The contribution to the Ni-equivalent value is provided by copper, cobalt and platinum group elements. The last Mineral Resource drilling campaign was done in 2009 and the latest Mineral Resource estimate dates from June 2010. The delineated Kabanga Mineral Resources are sufficient to support a 30 year mine life as currently studied. All resources are held under a Retention Licence which was renewed for an additional 5 year period on 2 May 2014.
Competent Persons HD = Hubert Dumon, Koniambo Nickel SAS, (AusIMM).
KG = Kellie Gill, Minara Resources Pty Ltd., (mining and metallurgical costs, reserve optimisation), (AusIMM).
PW = Paul Wiltshire, Minara Resources Pty Ltd., (process plant modelling assumptions), (AusIMM).
SK = Stephen King, Minara Resources Pty Ltd., (geostatistical analysis, modelling/estimation and resource classification), (AusIMM).
SEK = Steve Kormos, Glencore Nickel, P. Geo (APGO).
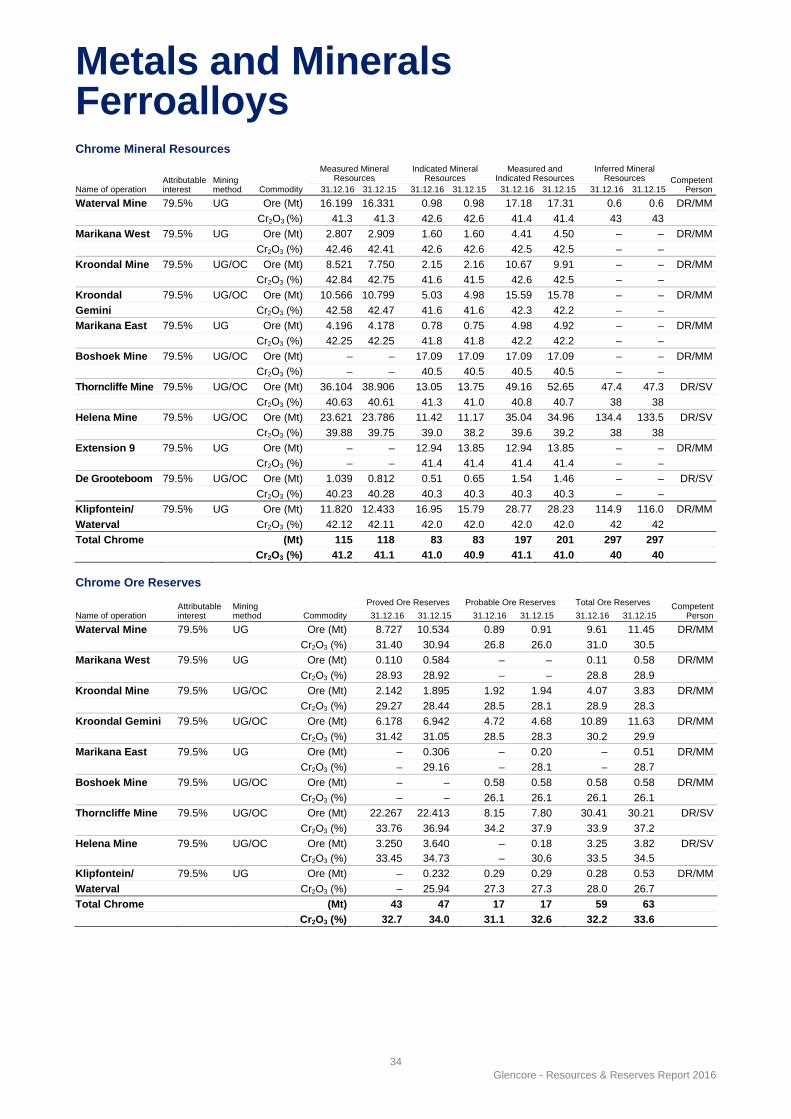
Metals and Minerals Ferroalloys
34 Glencore - Resources & Reserves Report 2016
Chrome Mineral Resources
Name of operation Attributable interest
Mining method Commodity
Measured Mineral Resources
Indicated Mineral Resources
Measured and Indicated Resources
Inferred Mineral Resources Competent
Person31.12.16 31.12.15 31.12.16 31.12.15 31.12.16 31.12.15 31.12.16 31.12.15
Waterval Mine 79.5% UG Ore (Mt) 16.199 16.331 0.98 0.98 17.18 17.31 0.6 0.6 DR/MM
Cr2O3 (%) 41.3 41.3 42.6 42.6 41.4 41.4 43 43
Marikana West 79.5% UG Ore (Mt) 2.807 2.909 1.60 1.60 4.41 4.50 – – DR/MM
Cr2O3 (%) 42.46 42.41 42.6 42.6 42.5 42.5 – –
Kroondal Mine 79.5% UG/OC Ore (Mt) 8.521 7.750 2.15 2.16 10.67 9.91 – – DR/MM
Cr2O3 (%) 42.84 42.75 41.6 41.5 42.6 42.5 – –
Kroondal 79.5% UG/OC Ore (Mt) 10.566 10.799 5.03 4.98 15.59 15.78 – – DR/MM
Gemini Cr2O3 (%) 42.58 42.47 41.6 41.6 42.3 42.2 – –
Marikana East 79.5% UG Ore (Mt) 4.196 4.178 0.78 0.75 4.98 4.92 – – DR/MM
Cr2O3 (%) 42.25 42.25 41.8 41.8 42.2 42.2 – –
Boshoek Mine 79.5% UG/OC Ore (Mt) – – 17.09 17.09 17.09 17.09 – – DR/MM
Cr2O3 (%) – – 40.5 40.5 40.5 40.5 – –
Thorncliffe Mine 79.5% UG/OC Ore (Mt) 36.104 38.906 13.05 13.75 49.16 52.65 47.4 47.3 DR/SV
Cr2O3 (%) 40.63 40.61 41.3 41.0 40.8 40.7 38 38
Helena Mine 79.5% UG/OC Ore (Mt) 23.621 23.786 11.42 11.17 35.04 34.96 134.4 133.5 DR/SV
Cr2O3 (%) 39.88 39.75 39.0 38.2 39.6 39.2 38 38
Extension 9 79.5% UG Ore (Mt) – – 12.94 13.85 12.94 13.85 – – DR/MM
Cr2O3 (%) – – 41.4 41.4 41.4 41.4 – –
De Grooteboom 79.5% UG/OC Ore (Mt) 1.039 0.812 0.51 0.65 1.54 1.46 – – DR/SV
Cr2O3 (%) 40.23 40.28 40.3 40.3 40.3 40.3 – –
Klipfontein/ 79.5% UG Ore (Mt) 11.820 12.433 16.95 15.79 28.77 28.23 114.9 116.0 DR/MM
Waterval Cr2O3 (%) 42.12 42.11 42.0 42.0 42.0 42.0 42 42
Total Chrome (Mt) 115 118 83 83 197 201 297 297
Cr2O3 (%) 41.2 41.1 41.0 40.9 41.1 41.0 40 40
Chrome Ore Reserves
Name of operation Attributable interest
Mining method Commodity
Proved Ore Reserves Probable Ore Reserves Total Ore Reserves Competent Person31.12.16 31.12.15 31.12.16 31.12.15 31.12.16 31.12.15
Waterval Mine 79.5% UG Ore (Mt) 8.727 10.534 0.89 0.91 9.61 11.45 DR/MM
Cr2O3 (%) 31.40 30.94 26.8 26.0 31.0 30.5
Marikana West 79.5% UG Ore (Mt) 0.110 0.584 – – 0.11 0.58 DR/MM
Cr2O3 (%) 28.93 28.92 – – 28.8 28.9
Kroondal Mine 79.5% UG/OC Ore (Mt) 2.142 1.895 1.92 1.94 4.07 3.83 DR/MM
Cr2O3 (%) 29.27 28.44 28.5 28.1 28.9 28.3
Kroondal Gemini 79.5% UG/OC Ore (Mt) 6.178 6.942 4.72 4.68 10.89 11.63 DR/MM
Cr2O3 (%) 31.42 31.05 28.5 28.3 30.2 29.9
Marikana East 79.5% UG Ore (Mt) – 0.306 – 0.20 – 0.51 DR/MM
Cr2O3 (%) – 29.16 – 28.1 – 28.7
Boshoek Mine 79.5% UG/OC Ore (Mt) – – 0.58 0.58 0.58 0.58 DR/MM
Cr2O3 (%) – – 26.1 26.1 26.1 26.1
Thorncliffe Mine 79.5% UG/OC Ore (Mt) 22.267 22.413 8.15 7.80 30.41 30.21 DR/SV
Cr2O3 (%) 33.76 36.94 34.2 37.9 33.9 37.2
Helena Mine 79.5% UG/OC Ore (Mt) 3.250 3.640 – 0.18 3.25 3.82 DR/SV Cr2O3 (%) 33.45 34.73 – 30.6 33.5 34.5
Klipfontein/ 79.5% UG Ore (Mt) – 0.232 0.29 0.29 0.28 0.53 DR/MM
Waterval Cr2O3 (%) – 25.94 27.3 27.3 28.0 26.7
Total Chrome (Mt) 43 47 17 17 59 63
Cr2O3 (%) 32.7 34.0 31.1 32.6 32.2 33.6
Metals and Minerals Ferroalloys
35 Glencore - Resources & Reserves Report 2016
Notes Tonnages are quoted as million metric tonnes.
Grades are quoted as %Cr2O3.
The Measured and Indicated Mineral Resources are inclusive of those Mineral Resources modified to produce Ore Reserves.
The chromitite assets include those owned by Glencore and Merafe in different ownership percentages, the attributable interest in such assets remain as reflected.
All Glencore Ferroalloys' chrome operations mine the chromitite deposits developed within the world renowned Bushveld Complex of South Africa. The 2060 Ma year-old Bushveld Complex is the largest known deposit of chrome, vanadium and platinum group elements (PGEs) in the world. The Bushveld Complex stretches 350km east-west and 450km north-south. The chrome ore is mined from shallow dipping (10o – 14o) tabular orebodies. Although there are numerous chromitite layers developed in the Bushveld Complex, the chromitite layers targeted for economic exploitation are the LG6/LG6A Chromitite Layer package and the MG1 Chromitite Layer.
No cut-off grades are applied to the chromitite layers currently being mined. The chromitite layer grades show exceptional regional grade consistency and continuity.
The chromitite layers are mostly mined underground using trackless mechanised mining methods on a board and pillar mine layout design.
The Mineral Resources are estimated as chromitite tonnages and grades to reflect the grades of the various individual chromitite layers. Both the LG6 and MG1 Chromitite Layers which Glencore currently mine are discrete solid chromitite layers with sharp contacts.
Changes in the year on year Mineral Resource tonnage and grade estimates are mainly due to mining depletion and changes due to additional geological information gained through exploration. These changes reflect in the tonnage and grade reports from the grade block models. The most significant changes are noted below.
Kroondal Mine: Previously considered un-mineable areas (white areas) have been added back to the resources. These resources amount to 0.86Mt. The net change in the Kroondal Mine resources is 1.23Mt after mining depletion has been discounted.
Kroondal Gemini: Previously considered un-mineable areas (white areas) have been added back to the resources. These resources amount to 0.25Mt. The net change in the Kroondal Gemini resources is 0.77Mt after mining depletion has been discounted.
The tonnage and grade estimations are initiated by the geostatistical analysis of the exploration drill hole data. The outcomes of this analysis are used in the construction of block models for each and every mine and project area. The geostatistical analysis of the chromitite data indicates a high degree of continuity both in grade and thickness of the chromitite layers. The block model estimates are verified using geostatistical parameters such as Kriging Efficiency to test the stability of the variograms used and the suitability of the selected cell sizes and Kriging parameters. Tonnages and grades are reported from these block models for each mine and project. There is a high degree of confidence in the tonnage and grade estimations derived from the block models. This is confirmed by the monthly and yearly reconciliation between the block model estimates, the monthly survey measurements and the actual mine production for each operating mine.
The LOM for the operating chrome mines vary between 1 year and 5 years based on the declared Ore Reserves. The LOM periods for the various operating mines, based on all the Mineral Resources converted to Ore Reserves vary between 5 years and 38 years. The Mining Right expiry dates vary from 2022 to 2039 for the operating chrome mines. All the chrome mining rights were granted for an initial period of 30 years. The production rates for the various chrome mines vary from 37kt ROM per month to 110kt ROM per month.
The Mining Rights of Horizon and Wonderkop have been disposed of through a Section 11 process and will no longer be reflected in the resource and reserve statement. The combined resources of these two properties amounted to 21.703Mt. The declared reserves for these properties were 2.102Mt. The Klipfontein/Waterval Prospecting Right has successfully been converted to a Mining Right and incorporated into the Kroondal Mining Right. The Klipfontein/Waterval resources and reserves are still declared separately.
A Prospecting Right has been granted to Glencore on the farms of St George and Richmond. These properties form the downdip extension of the Thorncliffe and Helena chrome Mining Right areas. The next resource and reserve statement will include an initial resource statement on these properties. The Extension 9 Prospecting Right is in its final 3 year cycle.
Competent Persons PJG = Pieter-Jan Gräbe, Glencore Ferroalloys, (SACNASP);
overall responsibility for Mineral Resources and Ore Reserves.
SV = Solly Vaid, Glencore Ferroalloys, (PLATO); responsibility for Mineral Resources and Ore Reserves.
DR = Dean Richards, Obsidian Consulting Services (SACNASP); responsible for geostatistical analysis of data, Mineral Resource classification and construction of tonnage and grade block models and reporting of tonnage and grades from block models.
MM = Mogomotsi Maputle, Glencore Ferroalloys, (SACNASP), Responsible for Mineral Resources and Ore Reserves.
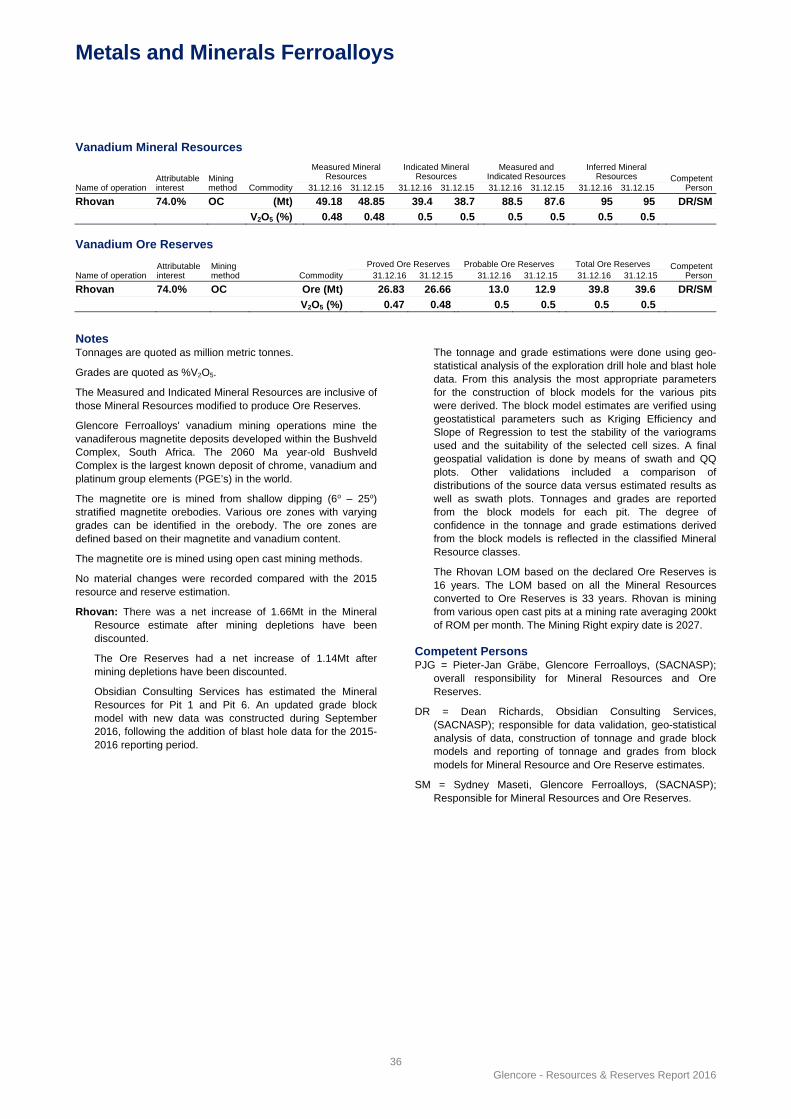
Metals and Minerals Ferroalloys
36 Glencore - Resources & Reserves Report 2016
Vanadium Mineral Resources
Name of operation Attributable interest
Mining method Commodity
Measured Mineral Resources
Indicated Mineral Resources
Measured and Indicated Resources
Inferred Mineral Resources Competent
Person 31.12.16 31.12.15 31.12.16 31.12.15 31.12.16 31.12.15 31.12.16 31.12.15
Rhovan 74.0% OC (Mt) 49.18 48.85 39.4 38.7 88.5 87.6 95 95 DR/SM
V2O5 (%) 0.48 0.48 0.5 0.5 0.5 0.5 0.5 0.5
Vanadium Ore Reserves
Name of operation Attributable interest
Mining method Commodity
Proved Ore Reserves Probable Ore Reserves Total Ore Reserves Competent Person 31.12.16 31.12.15 31.12.16 31.12.15 31.12.16 31.12.15
Rhovan 74.0% OC Ore (Mt) 26.83 26.66 13.0 12.9 39.8 39.6 DR/SM
V2O5 (%) 0.47 0.48 0.5 0.5 0.5 0.5
Notes Tonnages are quoted as million metric tonnes.
Grades are quoted as %V2O5.
The Measured and Indicated Mineral Resources are inclusive of those Mineral Resources modified to produce Ore Reserves.
Glencore Ferroalloys' vanadium mining operations mine the vanadiferous magnetite deposits developed within the Bushveld Complex, South Africa. The 2060 Ma year-old Bushveld Complex is the largest known deposit of chrome, vanadium and platinum group elements (PGE’s) in the world.
The magnetite ore is mined from shallow dipping (6o – 25o) stratified magnetite orebodies. Various ore zones with varying grades can be identified in the orebody. The ore zones are defined based on their magnetite and vanadium content.
The magnetite ore is mined using open cast mining methods.
No material changes were recorded compared with the 2015 resource and reserve estimation.
Rhovan: There was a net increase of 1.66Mt in the Mineral Resource estimate after mining depletions have been discounted.
The Ore Reserves had a net increase of 1.14Mt after mining depletions have been discounted.
Obsidian Consulting Services has estimated the Mineral Resources for Pit 1 and Pit 6. An updated grade block model with new data was constructed during September 2016, following the addition of blast hole data for the 2015-2016 reporting period.
The tonnage and grade estimations were done using geo-statistical analysis of the exploration drill hole and blast hole data. From this analysis the most appropriate parameters for the construction of block models for the various pits were derived. The block model estimates are verified using geostatistical parameters such as Kriging Efficiency and Slope of Regression to test the stability of the variograms used and the suitability of the selected cell sizes. A final geospatial validation is done by means of swath and QQ plots. Other validations included a comparison of distributions of the source data versus estimated results as well as swath plots. Tonnages and grades are reported from the block models for each pit. The degree of confidence in the tonnage and grade estimations derived from the block models is reflected in the classified Mineral Resource classes.
The Rhovan LOM based on the declared Ore Reserves is 16 years. The LOM based on all the Mineral Resources converted to Ore Reserves is 33 years. Rhovan is mining from various open cast pits at a mining rate averaging 200kt of ROM per month. The Mining Right expiry date is 2027.
Competent Persons PJG = Pieter-Jan Gräbe, Glencore Ferroalloys, (SACNASP);
overall responsibility for Mineral Resources and Ore Reserves.
DR = Dean Richards, Obsidian Consulting Services, (SACNASP); responsible for data validation, geo-statistical analysis of data, construction of tonnage and grade block models and reporting of tonnage and grades from block models for Mineral Resource and Ore Reserve estimates.
SM = Sydney Maseti, Glencore Ferroalloys, (SACNASP); Responsible for Mineral Resources and Ore Reserves.
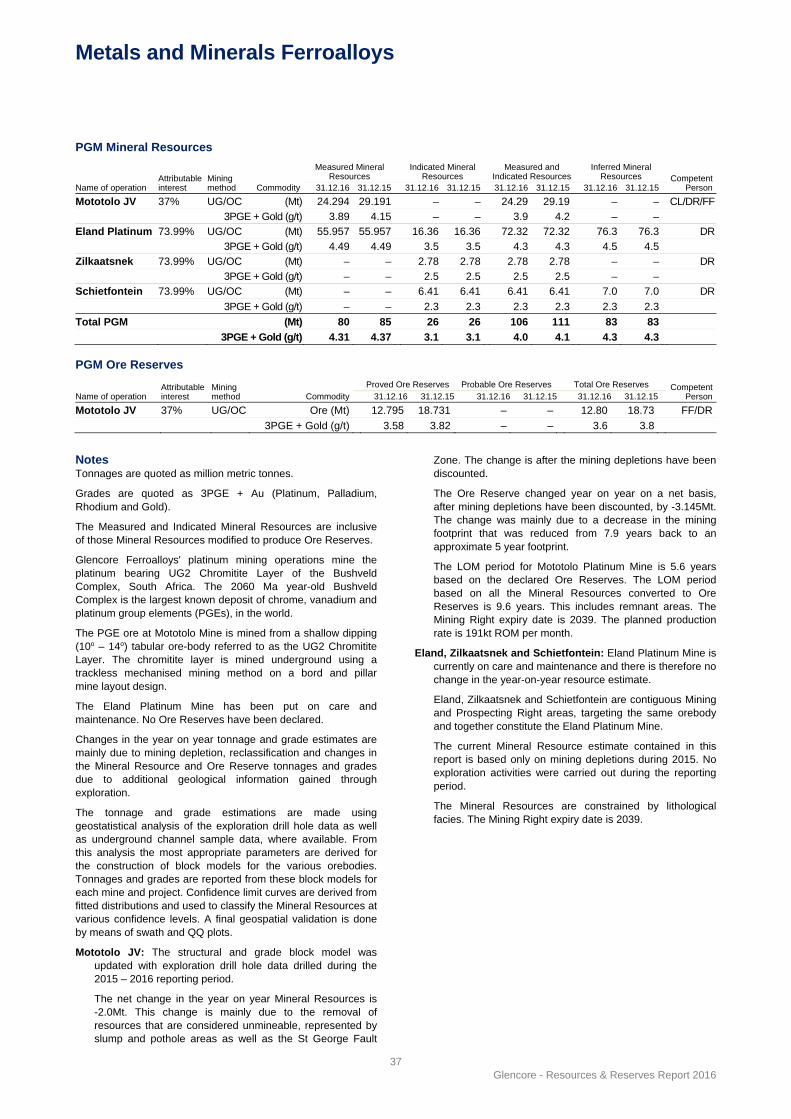
Metals and Minerals Ferroalloys
37 Glencore - Resources & Reserves Report 2016
PGM Mineral Resources
Name of operation Attributable interest
Mining method Commodity
Measured Mineral Resources
Indicated Mineral Resources
Measured and Indicated Resources
Inferred Mineral Resources Competent
Person31.12.16 31.12.15 31.12.16 31.12.15 31.12.16 31.12.15 31.12.16 31.12.15
Mototolo JV 37% UG/OC (Mt) 24.294 29.191 – – 24.29 29.19 – – CL/DR/FF
3PGE + Gold (g/t) 3.89 4.15 – – 3.9 4.2 – –
Eland Platinum 73.99% UG/OC (Mt) 55.957 55.957 16.36 16.36 72.32 72.32 76.3 76.3 DR
3PGE + Gold (g/t) 4.49 4.49 3.5 3.5 4.3 4.3 4.5 4.5
Zilkaatsnek 73.99% UG/OC (Mt) – – 2.78 2.78 2.78 2.78 – – DR
3PGE + Gold (g/t) – – 2.5 2.5 2.5 2.5 – –
Schietfontein 73.99% UG/OC (Mt) – – 6.41 6.41 6.41 6.41 7.0 7.0 DR
3PGE + Gold (g/t) – – 2.3 2.3 2.3 2.3 2.3 2.3
Total PGM (Mt) 80 85 26 26 106 111 83 83
3PGE + Gold (g/t) 4.31 4.37 3.1 3.1 4.0 4.1 4.3 4.3
PGM Ore Reserves
Name of operation Attributable interest
Mining method Commodity
Proved Ore Reserves Probable Ore Reserves Total Ore Reserves Competent Person31.12.16 31.12.15 31.12.16 31.12.15 31.12.16 31.12.15
Mototolo JV 37% UG/OC Ore (Mt) 12.795 18.731 – – 12.80 18.73 FF/DR
3PGE + Gold (g/t) 3.58 3.82 – – 3.6 3.8
Notes Tonnages are quoted as million metric tonnes.
Grades are quoted as 3PGE + Au (Platinum, Palladium, Rhodium and Gold).
The Measured and Indicated Mineral Resources are inclusive of those Mineral Resources modified to produce Ore Reserves.
Glencore Ferroalloys' platinum mining operations mine the platinum bearing UG2 Chromitite Layer of the Bushveld Complex, South Africa. The 2060 Ma year-old Bushveld Complex is the largest known deposit of chrome, vanadium and platinum group elements (PGEs), in the world.
The PGE ore at Mototolo Mine is mined from a shallow dipping (10o – 14o) tabular ore-body referred to as the UG2 Chromitite Layer. The chromitite layer is mined underground using a trackless mechanised mining method on a bord and pillar mine layout design.
The Eland Platinum Mine has been put on care and maintenance. No Ore Reserves have been declared.
Changes in the year on year tonnage and grade estimates are mainly due to mining depletion, reclassification and changes in the Mineral Resource and Ore Reserve tonnages and grades due to additional geological information gained through exploration.
The tonnage and grade estimations are made using geostatistical analysis of the exploration drill hole data as well as underground channel sample data, where available. From this analysis the most appropriate parameters are derived for the construction of block models for the various orebodies. Tonnages and grades are reported from these block models for each mine and project. Confidence limit curves are derived from fitted distributions and used to classify the Mineral Resources at various confidence levels. A final geospatial validation is done by means of swath and QQ plots.
Mototolo JV: The structural and grade block model was updated with exploration drill hole data drilled during the 2015 – 2016 reporting period.
The net change in the year on year Mineral Resources is -2.0Mt. This change is mainly due to the removal of resources that are considered unmineable, represented by slump and pothole areas as well as the St George Fault
Zone. The change is after the mining depletions have been discounted.
The Ore Reserve changed year on year on a net basis, after mining depletions have been discounted, by -3.145Mt. The change was mainly due to a decrease in the mining footprint that was reduced from 7.9 years back to an approximate 5 year footprint.
The LOM period for Mototolo Platinum Mine is 5.6 years based on the declared Ore Reserves. The LOM period based on all the Mineral Resources converted to Ore Reserves is 9.6 years. This includes remnant areas. The Mining Right expiry date is 2039. The planned production rate is 191kt ROM per month.
Eland, Zilkaatsnek and Schietfontein: Eland Platinum Mine is currently on care and maintenance and there is therefore no change in the year-on-year resource estimate.
Eland, Zilkaatsnek and Schietfontein are contiguous Mining and Prospecting Right areas, targeting the same orebody and together constitute the Eland Platinum Mine.
The current Mineral Resource estimate contained in this report is based only on mining depletions during 2015. No exploration activities were carried out during the reporting period.
The Mineral Resources are constrained by lithological facies. The Mining Right expiry date is 2039.
Metals and Minerals Ferroalloys
38 Glencore - Resources & Reserves Report 2016
Competent Persons PJG = Pieter-Jan Gräbe, Glencore Ferroalloys (SACNASP);
overall responsibility for Mineral Resources.
FF = Frikkie Fensham, Glencore Ferroalloys, (SACNASP); Responsible for Mineral Resources and Ore Reserves.
DR = Dean Richards, Obsidian Consulting Services (SACNASP); responsible for data validation, construction of tonnage and grade block models and reporting of tonnage and grades from block model.
CL = Carina Lemmer, Geological & Geostatistical Services (SACNASP); responsible for geostatistical analysis of data and classification of Mineral Resources.
Metals and Minerals Ferroalloys
39 Glencore - Resources & Reserves Report 2016
Silica Mineral Resources
Name of operation Attributable interest
Mining method Commodity
Measured Mineral
Resources Indicated Mineral
Resources Measured and
Indicated Resources Inferred Mineral
Resources Competent Person 31.12.16 31.12.15 31.12.16 31.12.15 31.12.16 31.12.15 31.12.16 31.12.15
Rietvly 79.5% OC (Mt) – – 23.27 23.81 23.27 23.81 – – CM
SiO2 (%) – – 91 91 91 91 – –
Silica Ore Reserves
Name of operation Attributable interest
Mining method Commodity
Proved Ore Reserves Probable Ore Reserves Total Ore Reserves Competent Person31.12.16 31.12.15 31.12.16 31.12.15 31.12.16 31.12.15
Rietvly 79.5% OC Ore (Mt) – – 2.05 2.15 2.05 2.15 CM
SiO2 (%) – – 91 91 91 91 Notes Tonnages are quoted as thousand metric tonnes.
Grades are quoted as %SiO2.
Glencore Ferroalloys' silica mining operation is an open cast mining operation mining a massive quartzite deposit of the Magaliesberg Formation of the Pretoria Group, which is a subgroup of the Transvaal Super Group, South Africa. The Magaliesberg Formation forms a prominent quartzite ridge striking north-south along the Magaliesberg Mountain Range. The formation is a few hundred meters thick and dips towards the east at over 20o. The Rietvly quartzite orebody is a very pure quartzite with a silica content of over 90% SiO2.
The ore is mined through open cast mining methods and the ROM ore is crushed, washed and sized on site to produce a final sized and quality graded product. No silica cut-off grades are applied to the Mineral Resource estimation. The quartzite is mainly mined to supply the Glencore Ferroalloys furnaces with silica.
No significant changes have been recorded in the year on year Mineral Resource estimation.
No significant changes have been recorded in the year on year Ore Reserve estimation.
The Ore Reserves for Rietvly Silica Mine is based on a 5 year mining footprint with a production rate of 39.94kt ROM per month. The LOM period based on all the Mineral Resources converted to Ore Reserves is 38.3 years. The Mining Right expiry date is 2037.
Competent Persons PJG = Pieter-Jan Gräbe, Glencore Ferroalloys (SACNASP);
overall responsibility for Mineral Resources and Ore Reserve.
CM = Mogomotsi Maputle, Glencore Ferroalloys (SACNASP); responsible for Mineral Resources and Ore Reserves.
Competent Person for Ore Reserve / Competent Person for Mineral Resource; where only one set of initials is listed, the same Competent Person is responsible for all categories quoted. Unless otherwise noted all Competent Persons are full time employees of Glencore plc subsidiaries.
Metals and Minerals Iron Ore
40 Glencore - Resources & Reserves Report 2016
Iron Ore Mineral Resources
Name of operation Attributable interest
Mining method Commodity
Measured Mineral Resources
Indicated Mineral Resources
Measured and Indicated Resources
Inferred Mineral Resources Competent
Person31.12.16 31.12.15 31.12.16 31.12.15 31.12.16 31.12.15 31.12.16 31.12.15
El Aouj Mining Company S.A.
Guelb el Aouj 50% OC (Mt) 400 400 1,170 1,170 1,570 1,570 300 300 AM/SvdM
East Iron (%) 36 36 36 36 36 36 36 36
DTC wt (%) 45 45 45 45 45 45 45 45
DTC Iron (%) 69.8 69.8 69.2 69.2 69.3 69.3 69.5 69.5
Oxidised (Mt) 70 70 80 80 150 150 30 30 AM/SvdM
Iron (%) 34 34 35 35 35 35 35 35
Guelb el Aouj 50% (Mt) – – 185 185 185 185 615 615 AM/SvdM
Centre Iron (%) – – 34 34 34 34 35 35
DTC wt (%) – – 43 43 43 43 44 44
DTC Iron (%) – – 69.6 69.6 69.6 69.6 69.8 69.8
Oxidised (Mt) – – – – – – 45 45 AM/SvdM
Iron (%) – – – – – – 33 33
Bou Derga 50% (Mt) – – – – – – 510 510 AM/SvdM
Iron (%) – – – – – – 36 36
DTC wt (%) – – – – – – 43 43
DTC Iron (%) – – – – – – 69.7 69.7
Oxidised (Mt) – – – – – – 130 130 AM/SvdM
Iron (%) – – – – – – 35 35
Tintekrate 50% (Mt) – – – – – – 710 710 AM/SvdM
Iron (%) – – – – – – 36 36
DTC wt (%) – – – – – – 44 44
DTC Iron (%) – – – – – – 69.4 69.4
Oxidised (Mt) – – – – – – 180 180 AM/SvdM
Iron (%) – – – – – – 34 34
Total El Aouj Mining Company S.A. (Mt) 470 470 1,435 1,435 1,905 1,905 2,520 2,520
Iron (%) 36 36 36 36 36 36 35 35
Sphere Mauritania S.A.
Askaf North 90% OC (Mt) 200 200 160 160 360 360 45 45 AM/SvdM
Iron (%) 36 36 35 35 36 36 36 36
DTC wt (%) 47 47 45 45 46 46 45 45
DTC Iron (%) 69.8 69.8 69.4 69.4 69.6 69.6 69.2 69.2
Oxidised (Mt) 15 15 30 30 45 45 15 15 AM/SvdM
Iron (%) 35 35 35 35 35 35 35 35
Askaf Centre 90% OC (Mt) – – – – – – 95 95 AM/SvdM
Iron (%) – – – – – – 36 36
DTC wt (%) – – – – – – 42 42
DTC Iron (%) – – – – – – 69.9 69.9
Oxidised (Mt) – – – – – – 13 13 AM/SvdM
Iron (%) – – – – – – 37 37
Askaf East 90% OC (Mt) – – – – – – 70 70 AM/SvdM
Iron (%) – – – – – – 35 35
DTC wt (%) – – – – – – 42 42
DTC Iron (%) – – – – – – 70.3 70.3
Oxidised (Mt) – – – – – – 13 13 AM/SvdM
Iron (%) – – – – – – 31 31
Total Sphere Mauritania S.A. (Mt) 215 215 190 190 405 405 251 251
Iron (%) 36 36 35 35 36 36 35 35
Sphere Lebtheinia S.A.
Lebtheinia 100% (Mt) – – 2,180 2,180 2,180 2,180 350 350 AM/SvdM
Centre Iron (%) – – 32 32 32 32 32 32
DTC wt (%) – – 27 27 27 27 27 27
DTC Iron (%) – – 68.6 68.6 69.6 68.6 68.1 68.1
LOZ (Mt) – – – – – – 210 210 AM/SvdM
Iron (%) – – – – – – 31 31
Total Sphere Lebtheinia S.A. (Mt) – – 2,180 2,180 2,180 2,180 560 560
Iron (%) – – 32 32 32 32 32 32
Metals and Minerals Iron Ore
41 Glencore - Resources & Reserves Report 2016
Name of operation Attributable interest
Mining method Commodity
Measured Mineral Resources
Indicated Mineral Resources
Measured and Indicated Resources
Inferred Mineral Resources Competent
Person31.12.16 31.12.15 31.12.16 31.12.15 31.12.16 31.12.15 31.12.16 31.12.15
Jumelles Limited
Zanaga 50% OC (Mt) 2,300 2,300 2,500 2,500 4,800 4,800 2,100 2,100 MT
Iron (%) 34 34 30 30 32 32 31 31
Iron Ore Reserves
Name of operation Attributable interest
Mining method Commodity
Proved Ore Reserves Probable Ore Reserves Total Ore Reserves Competent Person31.12.16 31.12.15 31.12.16 31.12.15 31.12.16 31.12.15
El Aouj Mining Company S.A.
Guelb el Aouj East 50% OC Ore (Mt) 380 380 551 551 931 931 JS
Iron (%) 35 35 35 35 35 35
DTC wt (%) 44 44 43 43 44 44
DTC Iron (%) 69.6 69.6 69.0 69.0 69.2 69.2
Jumelles Limited 50%
Zanaga OC Ore (Mt) 770 770 1,290 1,290 2,070 2,070 GB
Iron (%) 37 37 32 32 34 34
Notes All Mineral Resources are considered suitable for open cut extraction.
DTC wt (%) – Davis Tube Concentrate mass recovery.
DTC Iron (%) – Davis Tube Concentrate assay %Fe.
Davis Tube test work has been conducted at a grind size of 95% passing 80 micron.
The rounding used for the values in this report reflects the confidence in the different levels of Mineral Resource and Ore Reserve classifications.
During the year, Glencore acquired the remaining shares in Sphere Minerals that it did not already own.
No exploration activities were carried out in the reporting period.
El Aouj Mining Company: Glencore holds a 50% interest in the El Aouj Mining Company through a Joint Venture arrangement with SNIM.
Guelb el Aouj East: The “Guelb” deposits are hosted in Banded Iron Formations (BIF) within the Dorsale Reguibat, an uplifted part of the Archaean West African Craton, which dominates the northern third of Mauritania’s surface geology. Recrystallisation and aggregation of the magnetite grains in BIF has resulted in the partial to total destruction of the original banded (bedding) texture to produce the Guelb el Aouj magnetite-quartzite deposits. The geological sequence is overprinted by a reasonably uniform, approximately 80m thick weathered zone in which much of the magnetite has oxidised to hematite.
This resource uses a cut-off grade of 20% DTC wt% for fresh (unoxidised) mineralisation and a cut-off grade of 20% head Fe for oxidised mineralisation. All reported concentrate grades were weighted by DTC wt%.
The Guelb el Aouj East Ore Reserve Statement is based on a Feasibility Study and uses a 20% DTC wt% cut-off. No oxidised material has been included in the Ore Reserves.
Guelb el Aouj Centre: The El Aouj Centre magnetite-quartzite (MQ) deposit is a highly metamorphosed banded iron formation (meta-BIF) unit that ranges in true thickness from 50m to over 200m. The geometry of the deposit is defined by a tight synformal structure with a sub-vertical axial plane. The synform outcrops over a strike length of about 2.4km. The thickest accumulation of magnetite-quartzite is found along the western limb of the synform, pinching out towards the east. A series of stacked recumbent isoclinal folds
probably controlled the overall geometry of the deposit. The original bedding has been partially to completely obliterated by recrystallisation, resulting in a coarse-grained texture with aggregated magnetite grains. The weathered zone, though variable, has an average vertical thickness of approximately 40m. In this zone partial to complete oxidation of magnetite to hematite has occurred.
This resource uses a cut-off grade of 20% DTC wt% for fresh (unoxidised) mineralisation and a cut-off grade of 20% head Fe for oxidised mineralisation. All reported concentrate grades were weighted by DTC wt%.
Bou Derga: The Bou Derga deposit forms part of a larger scale synformal structure defined by an Archean magnetite-quartzite (MQ) unit that ranges in true thickness from approximately 20m to 200m. The thicker parts of the deposit are considered to be a result of isoclinal folding. Drilling was restricted to the western fold closure. The deposit dips towards the northeast at about 60°. The deposit contains a number of internal waste bands (typically 5m to 50m thick) which have been modelled separately and excluded from the Mineral Resource estimation. A northwest-southeast trending fault displaces the mineralisation in the south-eastern part of the deposit.
This resource uses a cut-off grade of 20% DTC wt% for fresh (unoxidised) mineralisation and a cut-off grade of 20% head Fe for oxidised mineralisation. All reported concentrate grades were weighted by DTC wt%.
The Bou Derga Mineral Resource Statement has been prepared in accordance with the Australasian Code for Reporting of Exploration Results, Mineral Resources and Ore Reserves (the JORC Code, 2004 Edition).
Tintekrate: The Tintekrate deposit is hosted within the Dorsale Reguibat, an uplifted part of the Archaean West African Craton, which dominates the northern third of Mauritania’s surface geology. Recrystallisation and aggregation of the magnetite grains in the meta-banded iron formation (BIF) units has resulted in partial to total destruction of the original banded (bedding) texture to produce the Tintekrate and other similar magnetite-quartzite deposits. The Tintekrate deposit is a circular structure defined by a steep dipping MQ unit with dips of 50° to 80° (locally overturned) with true mineralised thicknesses of 100m to 150m on the western side of the structure to 50m to 100m on the eastern side. The weathered zone averages 70m to 75m vertical depth below natural surface and its base tends to mirror the
Metals and Minerals Iron Ore
42 Glencore - Resources & Reserves Report 2016
natural surface profile. In this zone, magnetite has been partially to completely oxidised to hematite.
This resource uses a cut-off grade of 20% DTC wt% for fresh (unoxidised) mineralisation and a cut-off grade of 20% head Fe for oxidised mineralisation. All reported concentrate grades were weighted by DTC wt%.
Askaf North: Askaf North Deposit is an east-west striking synformal structure defined by a magnetite-quartzite (MQ) unit that ranges in true thickness from approximately 140m in the western hinge zone to approximately 30m along the eastern part of the southern limb. The synformal axis plunges at between 20° to 30° towards the east in the western part of the synform, and at about 35° to 45° towards the west at the eastern fold closure, producing a double plunging synform. A dolerite dyke has been emplaced along an east-west fault zone that displaces the northern part of the deposit in a dextral shear sense. The disruption and emplacement of the dolerite along the northern limb of the synform has not affected the quality of the mineralisation. The MQ unit represents a metamorphosed banded iron-formation (BIF). The precursor BIF was subjected to high-grade metamorphic conditions during the Archaean, which resulted in complete recrystallisation of the original fine-grained BIF. In most cases the primary textures have been destroyed by the recrystallisation. Coarse-grained (>1mm) MQ is produced as a result, with good Davis Tube liberation characteristics and concentrate grades at a liberation grind size of 95% passing 80 micron.
The Askaf North Mineral Resource Statement uses a cut-off grade of 20% DTC wt% for fresh (unoxidised) mineralisation and a cut-off grade of 20% head Fe for oxidised mineralisation. All reported concentrate grades were weighted by DTC wt%.
Askaf Centre: The Askaf Centre deposit comprises a northern body that is exposed over a strike length of 3.5km and a southern body that is exposed over a strike length of 1.7km. Both bodies form part of a regional scale antiformal structure and each body is also duplicated within itself by outcrop-scale tight isoclinal folding. The northern and southern bodies are separated and displaced in a dextral shear sense by a regional scale fault/fracture system. The northern body is generally sub-vertical striking roughly northwest-southeast. The magnetite-quartzite unit ranges in thickness from approximately 50m in the west to approximately 70m in the east, with the magnetite-quartzite mineralisation being thinnest in the steep dipping middle portion (±10 m). The multiple layers reported is the result of tight isoclinal folding. The southern body comprises an open synformal structure with an undulating sub-horizontal fold axis that plunges at approximately 25° towards the southwest at the southern part of the deposit. At this locality the mineralisation is still open-ended at depth. The two limbs of the synform are exposed over a strike length of approximately 1km. The northern part of the synform is tighter than is the case in the south, with the eastern limb almost being overturned in some places. Magnetite-quartzite ranges in thickness from approximately 30m to 35m in the limbs to approximately 45m to 55m in the synformal keel as a result of structural thickening with thicknesses of up to 90m reported. The magnetite-quartzite unit is embedded within an Archaen granitic/gneiss sequence. The weathered zone which, though variable, has an average vertical thickness of approximately 40m and in this zone partial to complete oxidation of magnetite to hematite has occurred. Oxidation significantly reduces the
Davis Tube mass recovery (wt%) in mineralised drill samples.
This resource uses a cut-off grade of 20% DTC wt% for fresh (unoxidised) mineralisation and a cut-off grade of 20% head Fe for oxidised mineralisation. All reported concentrate grades were weighted by DTC wt%.
Askaf East: The Askaf East deposit occupies the southern limb of an apparent east-west striking synformal structure defined by an Archaean magnetite-quartzite unit that ranges in true thickness from approximately 20m at the western end of the limb to approximately 140m in the central part of the limb. The hinge zone is at the eastern end of the deposit. The synformal axis plunges about 40° towards the west in the eastern part of the synform. The thickening of the sequence in the eastern part of the deposit is probably as a result of isoclinal folding within the sequence. The MQ unit is embedded within an Archaen granitic/gneiss sequence. The weathered zone, though variable, has an average vertical thickness of approximately 40m. Partial to complete oxidation of magnetite to hematite has occurred in this zone and this significantly reduces the Davis Tube mass recovery (wt%) in mineralised drill samples.
This resource uses a cut-off grade of 20% DTC wt% for fresh (unoxidised) mineralisation and a cut-off grade of 20% head Fe for oxidised mineralisation. All reported concentrate grades were weighted by DTC wt%.
Lebtheinia: The magnetite-rich Banded Iron Formations (BIF) at Lebtheinia form part of the Archaean Lebzena Group. The BIF units in EL264 are exposed over a total strike length of approximately 24km, of which Lebtheinia Centre has a strike length of 11.5km. Parts of the main BIF units at Lebtheinia Centre deposit are covered by laterite and colluvium consisting of BIF fragments.
The magnetite-BIF at Lebtheinia Centre averages about 240m thick. The BIF is characterised by a well-defined banding pattern, with individual bands ("mesobands") averaging 5-10mm thick. Drilling shows that mineralisation extends to at least 400m vertically below natural surface and is open at depth. The deposit is intruded by a series of sub-vertical dolerite dykes, striking NE-SW to NNE-SSW. Lebtheinia Centre has a hanging wall of (variously) quartzite, amphibolite, rhyolite, clay/saprolite (altered amphibolite) and a footwall of quartzite or amphibolite.
The depth of weathering (oxidation) of the BIF averages around 50m. In the lower two thirds of the oxidised zone (the Lower Oxidised Zone, "LOZ") the degree of oxidation is less than in the more oxidised upper third.
The Lebtheinia Centre Mineral Resource Statement for fresh mineralisation uses 20% DTC wt% cut-off. For the LOZ unit the cut-off is 14 SI x 10-3 units of magnetic susceptibility.
The Lebtheinia Mineral Resource Statement has been prepared in accordance with the Australasian Code for Reporting of Exploration Results, Mineral Resources and Ore Reserves (the JORC Code, 2004 Edition).
Zanaga Project: The Zanaga ELs are located within a north-south oriented greenstone belt which extends for over 47km in length, and vary between 0.5km and 3km in width. The mineralisation is hosted by metamorphosed volcano-sedimentary itabirites, and is interbedded with amphibolites and mafic schists. The contact with the crystalline basement is typically faulted and sheared. The principal ore lithologies consist of itabirites, interbedded with basic lavas, which are later altered to amphibolites. Typically, the itabirites consist
Metals and Minerals Iron Ore
43 Glencore - Resources & Reserves Report 2016
of layers of iron-rich and quartz rich meta-sediments, on a millimetre to centimetre scale. The orebody lithologies are crosscut by late intrusions and dolerite dykes, oriented northeast-southwest. The deposit comprises a sequence of weathering domains, which overlay an un-weathered protore comprising itabirite. The weathered sequence observed at Zanaga is typical of iron ore deposits, where the surficial material demonstrates enrichment in iron above the protore due to a mass reduction and associated leaching of the silicate layers.
The Mineral Resource is reported at a 0% Fe cut-off.
The Zanaga Mineral Resource Statement has been prepared in accordance with the Australasian Code for Reporting of Exploration Results, Mineral Resources and Ore Reserves (the JORC Code, 2004 Edition).
The Zanaga Project Ore Reserve Statement was prepared by SRK Consulting (UK) Limited as part of a Feasibility Study.
The full release of this Mineral Resource and Ore Reserve update is available on the Zanaga Iron website (www.zanagairon.com).
Competent Persons AM = Alan Miller, Independent Consultant (MAusIMM (CP)),
responsible for the construction of the geological block model, the grade interpolation and the Mineral Resource estimation (tonnage and grade) and classification.
JS = Jean-François St-Onge, Eng. formerly of BBA (OIQ).
GB = Gabor Bacsfalusi, SRK Consulting (UK) Limited (MAusIMM (CP)).
MT = Malcolm Titley, CSA Global (UK) Ltd (MAusIMM (CP)).
SvdM = Schalk van der Merwe, Independent Consultant (SACNSP), responsible for the geological interpretation for the Mineral Resource estimation (wireframe model), and the drill hole data set used in these resource estimation.
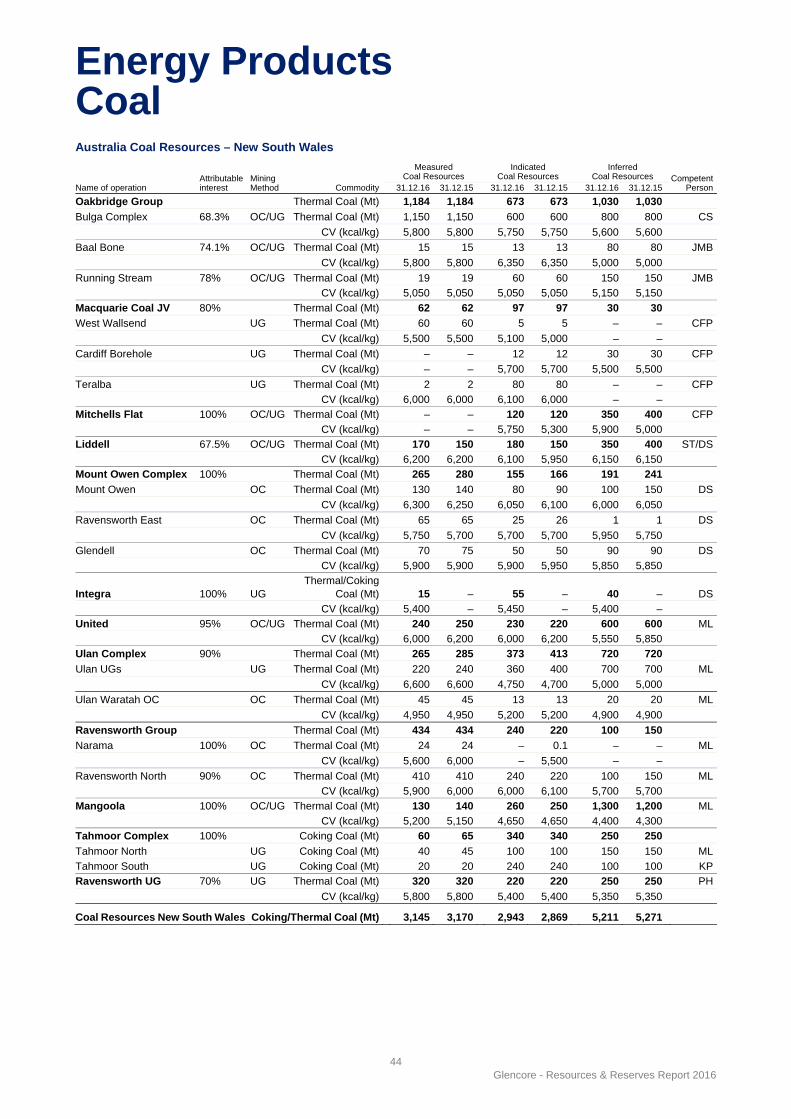
Energy Products Coal
44 Glencore - Resources & Reserves Report 2016
Australia Coal Resources – New South Wales
Name of operation Attributable interest
Mining Method Commodity
Measured Coal Resources
Indicated Coal Resources
Inferred Coal Resources Competent
Person31.12.16 31.12.15 31.12.16 31.12.15 31.12.16 31.12.15
Oakbridge Group Thermal Coal (Mt) 1,184 1,184 673 673 1,030 1,030
Bulga Complex 68.3% OC/UG Thermal Coal (Mt) 1,150 1,150 600 600 800 800 CS
CV (kcal/kg) 5,800 5,800 5,750 5,750 5,600 5,600
Baal Bone 74.1% OC/UG Thermal Coal (Mt) 15 15 13 13 80 80 JMB
CV (kcal/kg) 5,800 5,800 6,350 6,350 5,000 5,000
Running Stream 78% OC/UG Thermal Coal (Mt) 19 19 60 60 150 150 JMB
CV (kcal/kg) 5,050 5,050 5,050 5,050 5,150 5,150
Macquarie Coal JV 80% Thermal Coal (Mt) 62 62 97 97 30 30
West Wallsend UG Thermal Coal (Mt) 60 60 5 5 – – CFP
CV (kcal/kg) 5,500 5,500 5,100 5,000 – –
Cardiff Borehole UG Thermal Coal (Mt) – – 12 12 30 30 CFP
CV (kcal/kg) – – 5,700 5,700 5,500 5,500
Teralba UG Thermal Coal (Mt) 2 2 80 80 – – CFP
CV (kcal/kg) 6,000 6,000 6,100 6,000 – –
Mitchells Flat 100% OC/UG Thermal Coal (Mt) – – 120 120 350 400 CFP
CV (kcal/kg) – – 5,750 5,300 5,900 5,000
Liddell 67.5% OC/UG Thermal Coal (Mt) 170 150 180 150 350 400 ST/DS
CV (kcal/kg) 6,200 6,200 6,100 5,950 6,150 6,150
Mount Owen Complex 100% Thermal Coal (Mt) 265 280 155 166 191 241
Mount Owen OC Thermal Coal (Mt) 130 140 80 90 100 150 DS
CV (kcal/kg) 6,300 6,250 6,050 6,100 6,000 6,050
Ravensworth East OC Thermal Coal (Mt) 65 65 25 26 1 1 DS
CV (kcal/kg) 5,750 5,700 5,700 5,700 5,950 5,750
Glendell OC Thermal Coal (Mt) 70 75 50 50 90 90 DS
CV (kcal/kg) 5,900 5,900 5,900 5,950 5,850 5,850
Integra 100% UG Thermal/Coking
Coal (Mt) 15 – 55 – 40 – DS
CV (kcal/kg) 5,400 – 5,450 – 5,400 –
United 95% OC/UG Thermal Coal (Mt) 240 250 230 220 600 600 ML
CV (kcal/kg) 6,000 6,200 6,000 6,200 5,550 5,850
Ulan Complex 90% Thermal Coal (Mt) 265 285 373 413 720 720
Ulan UGs UG Thermal Coal (Mt) 220 240 360 400 700 700 ML
CV (kcal/kg) 6,600 6,600 4,750 4,700 5,000 5,000
Ulan Waratah OC OC Thermal Coal (Mt) 45 45 13 13 20 20 ML
CV (kcal/kg) 4,950 4,950 5,200 5,200 4,900 4,900
Ravensworth Group Thermal Coal (Mt) 434 434 240 220 100 150
Narama 100% OC Thermal Coal (Mt) 24 24 – 0.1 – – ML
CV (kcal/kg) 5,600 6,000 – 5,500 – –
Ravensworth North 90% OC Thermal Coal (Mt) 410 410 240 220 100 150 ML
CV (kcal/kg) 5,900 6,000 6,000 6,100 5,700 5,700
Mangoola 100% OC/UG Thermal Coal (Mt) 130 140 260 250 1,300 1,200 ML
CV (kcal/kg) 5,200 5,150 4,650 4,650 4,400 4,300
Tahmoor Complex 100% Coking Coal (Mt) 60 65 340 340 250 250
Tahmoor North UG Coking Coal (Mt) 40 45 100 100 150 150 ML
Tahmoor South UG Coking Coal (Mt) 20 20 240 240 100 100 KP
Ravensworth UG 70% UG Thermal Coal (Mt) 320 320 220 220 250 250 PH
CV (kcal/kg) 5,800 5,800 5,400 5,400 5,350 5,350
Coal Resources New South Wales Coking/Thermal Coal (Mt) 3,145 3,170 2,943 2,869 5,211 5,271
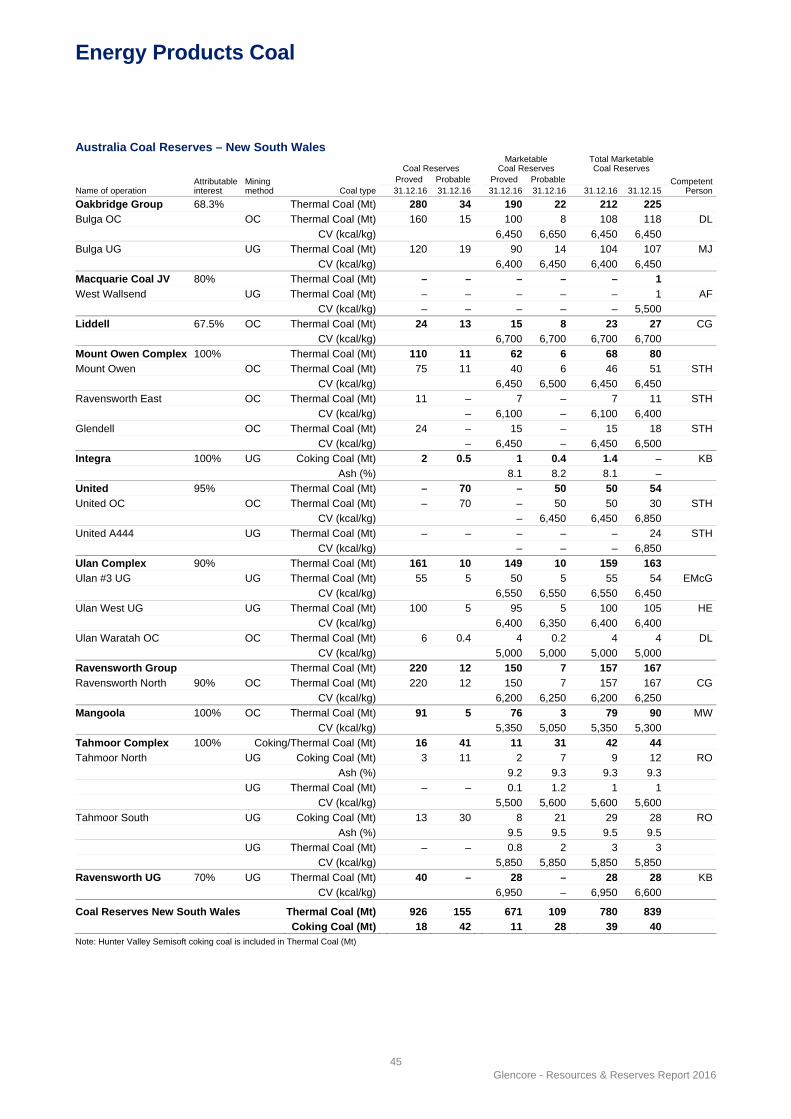
Energy Products Coal
45 Glencore - Resources & Reserves Report 2016
Australia Coal Reserves – New South Wales
Name of operation Attributable interest
Mining method Coal type
Coal Reserves Marketable
Coal Reserves Total Marketable Coal Reserves
CompetentPerson
Proved Probable Proved Probable 31.12.16 31.12.16 31.12.16 31.12.16 31.12.16 31.12.15
Oakbridge Group 68.3% Thermal Coal (Mt) 280 34 190 22 212 225
Bulga OC OC Thermal Coal (Mt) 160 15 100 8 108 118 DL
CV (kcal/kg) 6,450 6,650 6,450 6,450
Bulga UG UG Thermal Coal (Mt) 120 19 90 14 104 107 MJ
CV (kcal/kg) 6,400 6,450 6,400 6,450
Macquarie Coal JV 80% Thermal Coal (Mt) – – – – – 1
West Wallsend UG Thermal Coal (Mt) – – – – – 1 AF
CV (kcal/kg) – – – – – 5,500
Liddell 67.5% OC Thermal Coal (Mt) 24 13 15 8 23 27 CG
CV (kcal/kg) 6,700 6,700 6,700 6,700
Mount Owen Complex 100% Thermal Coal (Mt) 110 11 62 6 68 80
Mount Owen OC Thermal Coal (Mt) 75 11 40 6 46 51 STH
CV (kcal/kg) 6,450 6,500 6,450 6,450
Ravensworth East OC Thermal Coal (Mt) 11 – 7 – 7 11 STH
CV (kcal/kg) – 6,100 – 6,100 6,400
Glendell OC Thermal Coal (Mt) 24 – 15 – 15 18 STH
CV (kcal/kg) – 6,450 – 6,450 6,500
Integra 100% UG Coking Coal (Mt) 2 0.5 1 0.4 1.4 – KB
Ash (%) 8.1 8.2 8.1 –
United 95% Thermal Coal (Mt) – 70 – 50 50 54
United OC OC Thermal Coal (Mt) – 70 – 50 50 30 STH
CV (kcal/kg) – 6,450 6,450 6,850
United A444 UG Thermal Coal (Mt) – – – – – 24 STH
CV (kcal/kg) – – – 6,850
Ulan Complex 90% Thermal Coal (Mt) 161 10 149 10 159 163
Ulan #3 UG UG Thermal Coal (Mt) 55 5 50 5 55 54 EMcG
CV (kcal/kg) 6,550 6,550 6,550 6,450
Ulan West UG UG Thermal Coal (Mt) 100 5 95 5 100 105 HE
CV (kcal/kg) 6,400 6,350 6,400 6,400
Ulan Waratah OC OC Thermal Coal (Mt) 6 0.4 4 0.2 4 4 DL
CV (kcal/kg) 5,000 5,000 5,000 5,000
Ravensworth Group Thermal Coal (Mt) 220 12 150 7 157 167
Ravensworth North 90% OC Thermal Coal (Mt) 220 12 150 7 157 167 CG
CV (kcal/kg) 6,200 6,250 6,200 6,250
Mangoola 100% OC Thermal Coal (Mt) 91 5 76 3 79 90 MW
CV (kcal/kg) 5,350 5,050 5,350 5,300
Tahmoor Complex 100% Coking/Thermal Coal (Mt) 16 41 11 31 42 44
Tahmoor North UG Coking Coal (Mt) 3 11 2 7 9 12 RO
Ash (%) 9.2 9.3 9.3 9.3
UG Thermal Coal (Mt) – – 0.1 1.2 1 1
CV (kcal/kg) 5,500 5,600 5,600 5,600
Tahmoor South UG Coking Coal (Mt) 13 30 8 21 29 28 RO
Ash (%) 9.5 9.5 9.5 9.5
UG Thermal Coal (Mt) – – 0.8 2 3 3
CV (kcal/kg) 5,850 5,850 5,850 5,850
Ravensworth UG 70% UG Thermal Coal (Mt) 40 – 28 – 28 28 KB
CV (kcal/kg) 6,950 – 6,950 6,600
Coal Reserves New South Wales Thermal Coal (Mt) 926 155 671 109 780 839
Coking Coal (Mt) 18 42 11 28 39 40Note: Hunter Valley Semisoft coking coal is included in Thermal Coal (Mt)
Energy Products Coal
46 Glencore - Resources & Reserves Report 2016
Notes The Australian Coal Resources and Reserves are contained within the Sydney Basin (New South Wales), the Bowen Basin (Queensland), the Surat Basin (Queensland) and the Galilee Basin (Queensland).
Coal Resource tonnes have been reported on an in situ moisture basis while Coal Reserves are reported on an as received moisture basis. Coal Resources are reported inclusive of those Coal Resources modified to produce Coal Reserves.
Coal Resources have been re-estimated in 2016 for inclusion in this summary table except where otherwise stated. Revision of the totals includes changes to classifications of Coal Resource status due to exploration, geological reinterpretation remodelling, and changes to lease holdings and depletion by mining.
Thermal Coal Resource qualities are reported at an in situ moisture basis and Thermal Coal Reserve qualities are reported on a gross as received basis. Coal Resource qualities for coking coal are not reported, however Coking Coal Reserve qualities are reported on a gross as received basis.
Unless otherwise stated, the product yields used to estimate Marketable Coal Reserves are derived from a simulation package applied to sizing and washability data from each deposit, commonly the "Resource Mastor" software developed by A&B Mylec. The plant simulation package forecasts future plant performance based on historical plant data and exploration drill core analysis.
Changes and issues material to the estimation of Coal Resources and Reserves are noted below for specific projects. Reference to production changes between 31 December 2015 and 31 December 2016 are detailed for each producing mine site.
Tonnages are quoted as million metric tonnes.
Oakbridge Group Bulga Complex: Overall Coal Resource decrease (-13Mt).
Bulga open cut: Coal Resource and Reserve depletion due to mining (-9Mt).
Coal Reserves for Bulga Open Cut operations are sufficient to support a mine life of 17 years.
Bulga underground: Coal Resource and Reserve depletion due to mining (-4.2Mt).
Coal Reserve decrease due to mine plan changes (-4.4Mt).
Tenements for the Bulga Complex expire between April 2016 and September 2036. Some tenements have expired and Renewal Applications have been submitted.
Baal Bone: Coal Resources were not re-estimated in 2016.
Extraction of the remaining Lithgow Seam and Irondale Seam resources expected to be by underground methods except where the Lithgow, Irondale and Glen Davis Seams are potentially extractable by open cut methods.
Tenements for Baal Bone expire between May 2017 and August 2032.
Running Stream: Running Stream is an undeveloped thermal coal project. Coal Resources were not re-estimated in 2016.
Potential mining methods are open cut for the shallow Coal Resources (less than 60m depth of cover) and underground mining for Coal Resources in excess of 60m depth of cover.
Assessment Lease expires in May 2020. There is no mine plan current for this deposit.
Macquarie JV West Wallsend: Coal Resource and Reserve depletion due
to mining (-1.9Mt).
West Wallsend Mine completed operations in 2016 and mine closure work has commenced. Tenements for West Wallsend, Cardiff Borehole and Teralba expire between January 2020 and January 2030.
Cardiff Borehole: Coal Resources were not re-estimated in 2016. There is currently no mine plan at Cardiff Borehole.
Cardiff Borehole is a potential underground Coal Resource possibly accessible via the existing Teralba Colliery infrastructure.
Teralba: Coal Resources were not re-estimated in 2016.
Teralba was a longwall underground that ceased operations in 2001. The Coal Resource remains suitable for a potential underground mine.
Mitchells Flat: Inferred Coal Resource decrease due to removal of plies deeper than 300m with thin interburden and ply thicknesses (-42Mt).
Increase in Indicated and Inferred Coal Resource CV due to review of coal quality model (Indicated 450kcal/kg and Inferred 900kcal/kg).
Tenements for Mitchells Flat expire in February 2019.
Liddell Open Cut: Coal Resources include both the current Liddell Open Cut Operations and the Glendell North Project. Each area has been assessed by a different Competent Person.
Coal Resource and Reserve depletion due to mining at Liddell Open Cut (-6Mt).
Tenements for Liddell expire between October 2023 and November 2028. Coal Reserves for Liddell operations are sufficient to support a mine life of 6 years.
Coal Resources have increased due to exploration programme (19Mt) and there has been a reclassification of Inferred Resources to Measured and Indicated (37Mt).
Tenements for Glendell North Project expire October 2023.
Mt Owen Complex Mount Owen: Coal Resource decrease due to transfer of lease areas to the newly acquired Integra Underground (Measured and Indicated -10Mt, Inferred -35Mt). Coal Resource depletion due to mining (-6.5Mt). Figures in table have been reported in accordance with rounding procedures.
Coal Reserve increase due to geological model & dilution factor adjustments (3.4Mt). Coal Reserve depletion due to mining (-9.6Mt).
Tenements for Mt Owen expire between October 2015 and July 2036. Some tenements have expired and Renewal Applications have been submitted.
Coal Reserves for Mt Owen Complex operations are sufficient to support a mine life of 13 years.
Ravensworth East: Coal Resource depletion due to mining (-1.3Mt) and dilution (0.7Mt).
Coal Reserve decrease due to a life of mine plan change to pit limits (-5.7Mt). Coal Reserve depletion due to mining and sterilisation (-1.1Mt).
Energy Products Coal
47 Glencore - Resources & Reserves Report 2016
Decrease in Marketable Reserves CV due to quality model and life of mine plan changes (-300kcal/kg).
Tenements for Ravensworth East expire between July 2019 and October 2034.
Coal Reserves for Ravensworth East operations are sufficient to support a mine life of 6 years.
Glendell: Coal Resource depletion due to mining (-4Mt) and sterilisation (-1Mt).
Coal Reserve depletion due to mining (-4.5Mt) and dilution (-1.3Mt).
Tenements for Glendell expire between October 2018 and March 2032. Coal Reserves for Glendell operations are sufficient to support a mine life of 6 years.
Integra: The assets associated with the Integra underground mine including coal tenements, land, equipment and infrastructure, adjacent to the Mt Owen Complex, were acquired from the Integra JV in December 2015. Open cut mine and coal preparation assets were concurrently acquired by others.
Initial reporting of Coal Resources and Reserves has been completed during 2016. Coal Resources contained within the leases were acquired (65Mt) and, in addition, adjacent Resources from Mt Owen have been transferred (45Mt).
Underground operations are to recommence in 2017 to extract the next two longwall blocks. Reserves reflect these two blocks only.
Tenements for the area acquired by Glencore expire between March 2016 and November 2033. Some tenements have expired and Renewal Applications have been submitted.
United: No material change to Coal Resources since 31 December 2015. Tenements for United expire between January 2015 and March 2033. Some tenements have expired and Renewal Applications have been submitted.
Decrease of Resource coal quality (CV) due to calculation adjustments since the 2015 estimation (Measured -250kcal/kg, Indicated -200kcal/kg, Inferred -250kcal/kg).
United Open Cut: Coal Reserve has increased due to the expansion of the open cut mine plan (24Mt).
Decrease in Marketable Reserves coal quality (CV) due to open cut mine plan changes (-400kcal/kg).
Coal Reserves for United Open Cut operations are sufficient to support a mine life of 16 years following commencement of operations which is currently under consideration.
United A444 Underground: Coal Reserves have decreased (-36Mt) due to the underground mine project being discontinued in favour of expanding the open cut project above.
Ulan Complex: Coal Resource decrease due to removal of sterilised mining section and re-correlation of coal tops (-38Mt). Underground Coal Resource depletion due to mining (-11.6Mt). Open Cut Coal Resource depletion due to mining (-0.8Mt). Figures in table have been reported in accordance with rounding procedures
Tenements for Ulan expire between February 2017 and January 2036.
Ulan Waratah Open Cut: Coal Reserve depletion due to mining (-0.8Mt).
Ulan West Underground: Coal Reserve depletion due to mining (-7.1Mt).
Coal Reserves for Ulan West underground operations are sufficient to support a mine life of 13 years.
Ulan #3 Underground: Coal Reserve increase due to change in reported moisture basis and review of working section (6.1Mt). Coal Reserve depletion due to mining (-5Mt).
Coal Reserves for Ulan #3 underground operations are sufficient to support a mine life of 12 years.
Ravensworth Group Narama: No material change to Coal Resources since 31 December 2015. Mining Operations in Narama ceased at the end of 2014 upon completion of the Life of Mine Plan. The area is currently being used by the adjacent Ravensworth North operations for overburden, water management and infrastructure.
Decrease in Measured Resource CV due to 2015 calculation corrections (-400kcal/kg).
Tenements for Narama expire between December 2023 and August 2036.
Ravensworth North: Coal Resource and Reserve depletion due to mining (-11.4Mt).
Coal Reserve increase due to parting thickness changes in some seams (4.9Mt).
Tenements for Ravensworth North expire between May 2014 and February 2034. Some tenements have expired and Renewal Applications have been submitted. Coal Reserves for Ravensworth North operations are sufficient to support a mine life of 18 years.
Mangoola: Coal Resource increase due to additional exploration drill data within Mangoola North allowing reclassification of resources and addition of new Inferred Resources. Coal Resource and Reserve depletion due to mining (-13.5Mt).
Tenements for Mangoola expire between November 2019 and November 2029. Coal Reserves for Mangoola operations are sufficient to support a mine life of 10 years.
Ravensworth Underground: No material change in Coal Resource or Reserve estimations since 31 December 2015.
Production was suspended in September 2014 with the mine currently on care and maintenance.
Increase in Marketable Reserves CV due to 2015 CV calculation corrections (350kcal/kg).
Tenements for Ravensworth Underground expire between September 2012 and August 2036. Some tenements have expired and Renewal Applications have been submitted.
Tahmoor Complex: Tahmoor North: Coal Resource depletion due to mining (-2.8Mt). Coal Reserve depletion due to mining (-2.5Mt).
Tenements for Tahmoor North expire between August 2016 and March 2035. Some tenements have expired and Renewal Applications have been submitted. Coal Reserves for Tahmoor North underground operations are sufficient to support a mine life of 1 year.
Tahmoor South: Coal Resources were not re-estimated in 2016.
Tenements for Tahmoor South expire in November 2025.
Energy Products Coal
48 Glencore - Resources & Reserves Report 2016
Competent Persons
AF = Alison Freeman, Senior Mining Engineer, West Wallsend Colliery (AusIMM);
CFP = Charles Parbury, Director, McElroy Bryan Geological Services Pty Ltd (AusIMM);
CG = Chris Gerard, Technical Services Manager, Liddell Open Cut (AusIMM);
CS = Christopher Smith, Geologist, Bulga Underground Operations (AusIMM);
DC = David Cahill, Superintendent Technical Services, Ravensworth Open Cut (AusIMM);
DL = David Lennard, Xenith Consulting/Manager – Hunter Valley (AusIMM);
DS = Daniel Saunders, Geologist, Glendell Mine (AusIMM);
EMcG = Edward McGonigle, Senior Mining Engineer – Ulan Underground Mine (AusIMM);
HE = Heath Evans, Technical Services Manager, Ulan West Operations (AusIMM);
JMB = Janet Bartolo, Senior Geologist, McElroy Bryan Geological Services Pty Ltd (AusIMM);
KB = Konrad Bawelkiewicz, Mining Engineer/Analyst, Glencore Coal Assets Australia (AusIMM);
KP = Karol Patino, Senior Project Geologist, McElroy Bryan Geological Services Pty Ltd (AusIMM);
MJ = Marc Justen, Senior Mining Engineer, Bulga Underground Operations (AusIMM);
ML = Mark Laycock, Geology Superintendent, Glencore Coal NSW (AusIMM);
MW = Mark Williams, Technical Services Manager, Mangoola (AusIMM);
PH = Paul Harrison, Senior Geologist, McElroy Bryan Geological Services Pty Ltd (AusIMM);
RO = Rachelle Oliver, Project Manager, Glencore Coal Assets (AusIMM);
STH = Shane Holmes, Technical Services Manager, Mt Owen (AusIMM);
ST = Shaun Tamplin, Principal Consultant, Tamplin Resources (AusIMM);
VC = Vrotnesky Cediel, Technical Services Superintendent, Ulan Surface Operations (AusIMM).

Energy Products Coal
49 Glencore - Resources & Reserves Report 2016
Australia Coal Resources – Queensland
Name of operation Attributable interest
Mining Method Commodity
Measured Coal Resources
Indicated Coal Resources
Inferred Coal Resources Competent
Person31.12.16 31.12.15 31.12.16 31.12.15 31.12.16 31.12.15
Oaky Creek 55% OC/UG Coking Coal (Mt) 260 260 340 350 80 80 RJH
Red Rock 75% OC/UG Coking/Thermal Coal (Mt) 0.1 – 150 150 150 150 RJH
CV (kcal/kg) 6,900 7,450 6,000 5,950 5,700 6,200 NCA 100% Coking/Thermal Coal (Mt) 473 513 544 542 1,010 1,018
Newlands, Suttor OC/UG Coking Coal (Mt) – 13 – 7 – 3 JT/BL
Eastern (RCM) Thermal Coal (Mt) 310 330 130 120 400 400 JT/BL
CV (kcal/kg) 5,700 5,700 5,400 5,350 5,100 5,200
Wollombi (MCM) OC/UG Coking Coal (Mt) 10 11 26 27 70 70 BL
Thermal Coal (Mt) 18 19 60 60 90 90 BL
CV (kcal/kg) 5,250 4,800 5,050 4,650 5,100 4,550
Sarum OC/UG Coking Coal (Mt) 30 30 8 8 60 60 JT
Thermal Coal (Mt) – – 65 65 250 250 JT
CV (kcal/kg) – – 5,450 5,450 4,650 4,650
Collinsville OC/UG Coking Coal (Mt) 35 35 75 75 40 45 RJH
Thermal Coal (Mt) 70 75 180 180 100 100 RJH
CV (kcal/kg) 5,850 5,750 6,250 6,200 5,850 5,800
Cook 95% OC/UG Coking/Thermal Coal (Mt) – – 210 100 800 900 DP
CV (kcal/kg) – – 6,650 6,650 6,500 6,850
Rolleston 75% Thermal Coal (Mt) 220 225 210 215 370 370
Rolleston ML OC Thermal Coal (Mt) 220 140 210 45 350 20 JB
CV (kcal/kg) 5,750 5,750 5,550 5,550 5,800 5,450
Rolleston MDL & OC Thermal Coal (Mt) – 85 – 170 20 350 JB
EPCs CV (kcal/kg) – 5,700 – 5,550 5,550 5,550
Togara North 70% OC/UG Thermal Coal (Mt) 370 370 250 250 700 730 DP
CV (kcal/kg) 6,350 6,350 6,000 6,000 6,000 6,000
Wandoan 75% Thermal Coal (Mt) 1,500 1,450 1,750 1,700 4,300 4,400 RJ
CV (kcal/kg) 5,200 5,200 5,050 5,150 5,200 5,200
Milray 75% OC/UG Thermal Coal (Mt) – – 170 – 600 600 RJH
CV (kcal/kg) – – 6,150 – 5,800 4,900
Pentland 75% OC/UG Thermal Coal (Mt) 100 100 40 40 10 10 RJ
CV (kcal/kg) 4,400 4,400 4,050 4,050 4,100 4,100
Clermont 25% OC Thermal Coal (Mt) 110 110 21 26 10 11 JT
CV (kcal/kg) 6,200 6,250 6,050 6,050 5,750 5,750
Coal Resources Queensland Coking/Thermal Coal (Mt) 3,033 3,028 3,685 3,373 8,030 8,269
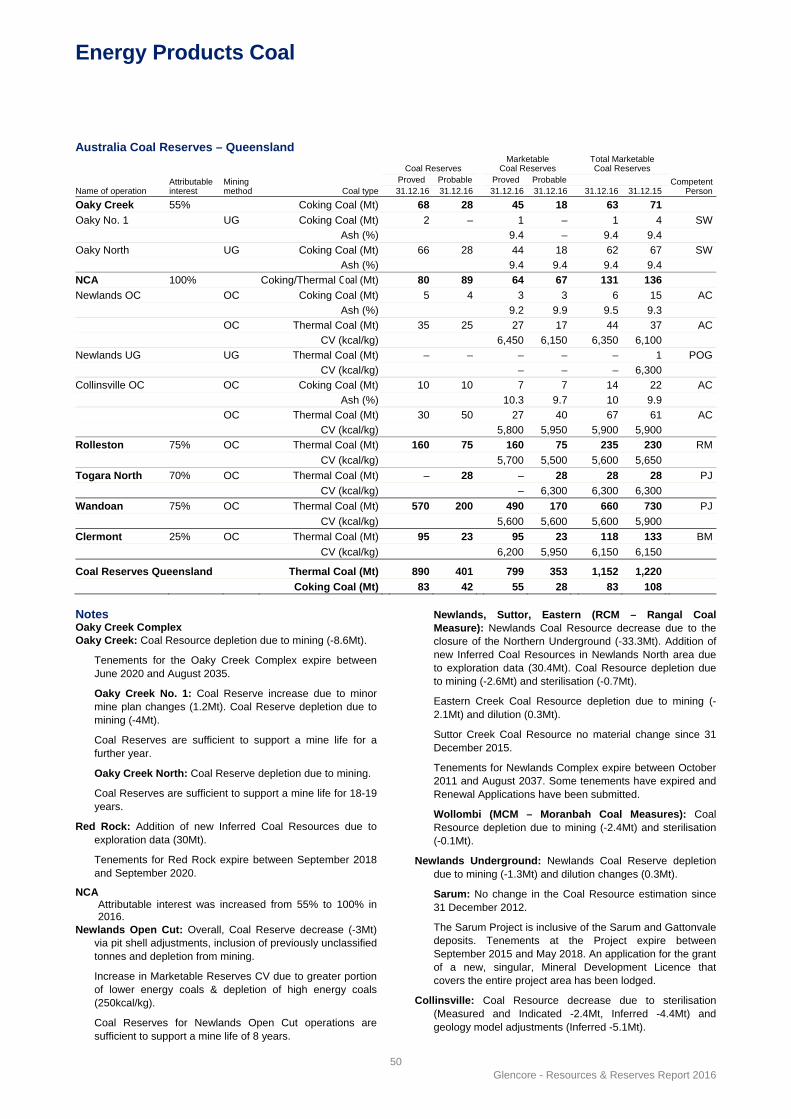
Energy Products Coal
50 Glencore - Resources & Reserves Report 2016
Australia Coal Reserves – Queensland
Name of operation Attributable interest
Mining method Coal type
Coal Reserves Marketable
Coal Reserves Total Marketable Coal Reserves
Competent Person
Proved Probable Proved Probable 31.12.16 31.12.16 31.12.16 31.12.16 31.12.16 31.12.15
Oaky Creek 55% Coking Coal (Mt) 68 28 45 18 63 71
Oaky No. 1 UG Coking Coal (Mt) 2 – 1 – 1 4 SW
Ash (%) 9.4 – 9.4 9.4
Oaky North UG Coking Coal (Mt) 66 28 44 18 62 67 SW
Ash (%) 9.4 9.4 9.4 9.4
NCA 100% Coking/Thermal Coal (Mt) 80 89 64 67 131 136
Newlands OC OC Coking Coal (Mt) 5 4 3 3 6 15 AC
Ash (%) 9.2 9.9 9.5 9.3
OC Thermal Coal (Mt) 35 25 27 17 44 37 AC
CV (kcal/kg) 6,450 6,150 6,350 6,100
Newlands UG UG Thermal Coal (Mt) – – – – – 1 POG
CV (kcal/kg) – – – 6,300
Collinsville OC OC Coking Coal (Mt) 10 10 7 7 14 22 AC
Ash (%) 10.3 9.7 10 9.9
OC Thermal Coal (Mt) 30 50 27 40 67 61 AC
CV (kcal/kg) 5,800 5,950 5,900 5,900
Rolleston 75% OC Thermal Coal (Mt) 160 75 160 75 235 230 RM
CV (kcal/kg) 5,700 5,500 5,600 5,650
Togara North 70% OC Thermal Coal (Mt) – 28 – 28 28 28 PJ
CV (kcal/kg) – 6,300 6,300 6,300
Wandoan 75% OC Thermal Coal (Mt) 570 200 490 170 660 730 PJ
CV (kcal/kg) 5,600 5,600 5,600 5,900
Clermont 25% OC Thermal Coal (Mt) 95 23 95 23 118 133 BM
CV (kcal/kg) 6,200 5,950 6,150 6,150
Coal Reserves Queensland Thermal Coal (Mt) 890 401 799 353 1,152 1,220
Coking Coal (Mt) 83 42 55 28 83 108 Notes Oaky Creek Complex Oaky Creek: Coal Resource depletion due to mining (-8.6Mt).
Tenements for the Oaky Creek Complex expire between June 2020 and August 2035.
Oaky Creek No. 1: Coal Reserve increase due to minor mine plan changes (1.2Mt). Coal Reserve depletion due to mining (-4Mt).
Coal Reserves are sufficient to support a mine life for a further year.
Oaky Creek North: Coal Reserve depletion due to mining.
Coal Reserves are sufficient to support a mine life for 18-19 years.
Red Rock: Addition of new Inferred Coal Resources due to exploration data (30Mt).
Tenements for Red Rock expire between September 2018 and September 2020.
NCA Attributable interest was increased from 55% to 100% in
2016. Newlands Open Cut: Overall, Coal Reserve decrease (-3Mt)
via pit shell adjustments, inclusion of previously unclassified tonnes and depletion from mining.
Increase in Marketable Reserves CV due to greater portion of lower energy coals & depletion of high energy coals (250kcal/kg).
Coal Reserves for Newlands Open Cut operations are sufficient to support a mine life of 8 years.
Newlands, Suttor, Eastern (RCM – Rangal Coal Measure): Newlands Coal Resource decrease due to the closure of the Northern Underground (-33.3Mt). Addition of new Inferred Coal Resources in Newlands North area due to exploration data (30.4Mt). Coal Resource depletion due to mining (-2.6Mt) and sterilisation (-0.7Mt).
Eastern Creek Coal Resource depletion due to mining (-2.1Mt) and dilution (0.3Mt).
Suttor Creek Coal Resource no material change since 31 December 2015.
Tenements for Newlands Complex expire between October 2011 and August 2037. Some tenements have expired and Renewal Applications have been submitted.
Wollombi (MCM – Moranbah Coal Measures): Coal Resource depletion due to mining (-2.4Mt) and sterilisation (-0.1Mt).
Newlands Underground: Newlands Coal Reserve depletion due to mining (-1.3Mt) and dilution changes (0.3Mt).
Sarum: No change in the Coal Resource estimation since 31 December 2012.
The Sarum Project is inclusive of the Sarum and Gattonvale deposits. Tenements at the Project expire between September 2015 and May 2018. An application for the grant of a new, singular, Mineral Development Licence that covers the entire project area has been lodged.
Collinsville: Coal Resource decrease due to sterilisation (Measured and Indicated -2.4Mt, Inferred -4.4Mt) and geology model adjustments (Inferred -5.1Mt).
Energy Products Coal
51 Glencore - Resources & Reserves Report 2016
Coking Coal Reserve decrease due to reclassification as thermal reserves (-6.8Mt) and removal of marginal reserves (-4.3Mt).
Coal Reserves for Collinsville are sufficient to support a mine life for 20 years.
Tenements for Collinsville expire between March 2018 and September 2035.
Cook (Blackrock): Coal Resource reclassification of Inferred Resources to Indicated (123.6Mt). Figures in table have been reported in accordance with rounding procedures.
Tenements for Cook expire between April 2021 and September 2028.
Rolleston: Coal Resource and Reserve depletion due to mining (-13.3Mt) and sterilisation (-1.7Mt). Additional MLs granted during 2016, resulting in transference of resources from EPCs to MLs.
Coal Reserve increase due to addition of Rolleston West in mine plan (12.7Mt) and alterations to software aggregation logic (7Mt).
Tenements for Rolleston expire between May 2016 and May 2043. Some tenements have expired and Renewal Applications have been submitted. Coal Reserves for Rolleston are sufficient to support a mine life of 20 years.
Togara North: Coal Resources were not re-estimated in 2016. The Inferred Coal Resource rounding has been corrected for 2016.
Tenements for Togara North expire between September 2018 and December 2046.
Wandoan: No material change to Coal Resources since 31 December 2015.
Coal Reserve decrease due to change in mining strategy and reassessment of mining layout (-247Mt).
Decrease in Marketable Reserves CV due to change in product composition with additional bypass coal (-300kcal/kg).
Tenements for Wandoan expire between October 2016 and August 2020. Some tenements have expired and Renewal Applications have been submitted. Coal Reserves for Wandoan are sufficient to support a mine life greater than 30 years.
Milray: Coal Resource increase due to interpretation review in light of additional 2015/16 exploration data (152.8Mt).
Tenement for Milray expires in January 2021.
Pentland: Coal Resources were not re-estimated in 2016.
Tenements for Pentland expire between October 2019 and September 2021.
Clermont: Clermont Coal Resources estimated for the extraction of thermal coal via open cut methods.
Coal Resource and Reserve depletion due to mining (-12.5Mt) and sterilisation (-1.9Mt).
Coal Resource increase due to re-correlation (3.7Mt).
Tenements for Clermont expire between April 2020 and November 2027. Coal Reserves at Clermont are sufficient to support a mine life for 10 years.
Competent Persons AC = Andrew Connell, Principal Mining Engineer, Glencore
Coal (AusIMM).
BL = Bronwyn Leonard, Senior Resource Geologist, Newlands Coal QLD (AusIMM).
BM = Ben Myall, Production Manager, Clermont (AusIMM).
DP = Doyle Pryde, Senior Geologist, McElroy Bryan Geological Services Pty Ltd (AusIMM).
JB = Jarrod Bennedick, Senior Mine Geologist, Rolleston (AusIMM).
JT = John Terrill, Principal Geologist, Glencore Coal QLD (AIG).
PJ = Paul Jones, Principal Mining Engineer, Glencore Coal (AusIMM).
POG = Paul O'Grady, Group Manager – Mine Planning, Glencore Coal (AusIMM).
RJ = Rowan Johnson, Senior Geologist, McElroy Bryan Geological Services Pty Ltd (AusIMM).
RJH = Richard Hingst, Resource Geologist, Glencore (AusIMM).
RM =Rob Molan, Senior Mining Engineer, Glencore Coal Qld (AusIMM).
SW = Steven Winter, Technical Services Manager, Glencore (AusIMM).
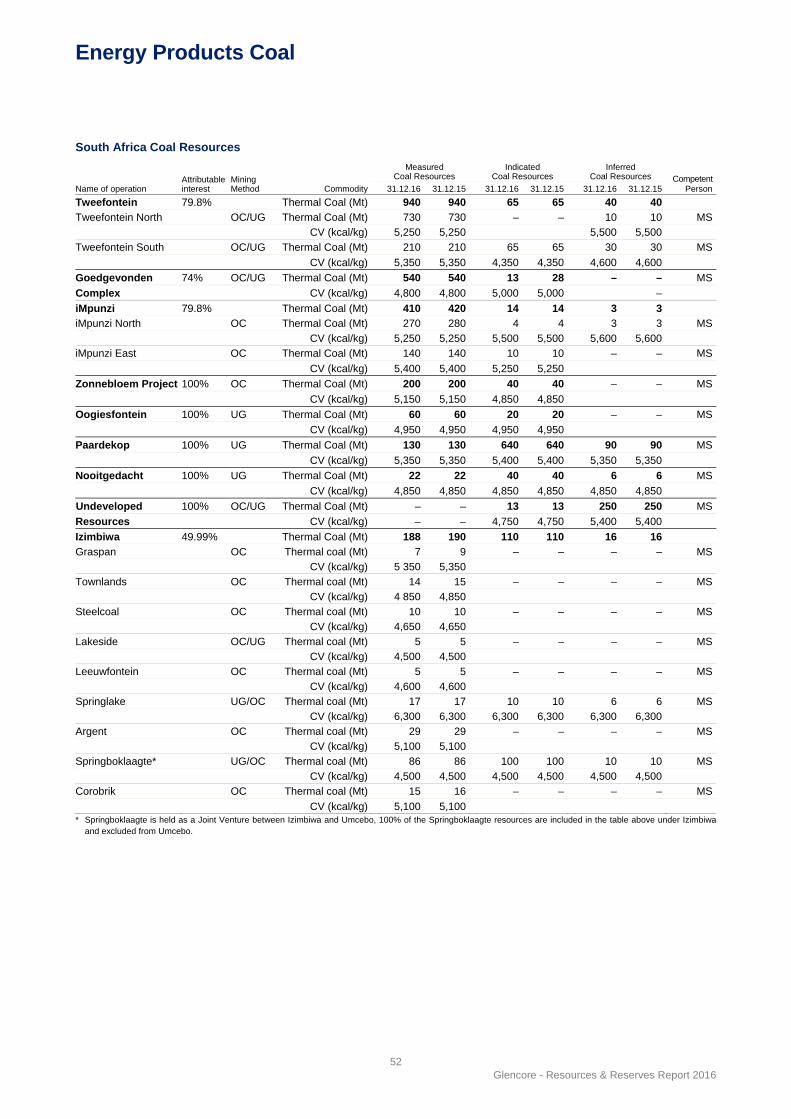
Energy Products Coal
52 Glencore - Resources & Reserves Report 2016
South Africa Coal Resources
Name of operation Attributable interest
Mining Method Commodity
Measured Coal Resources
Indicated Coal Resources
Inferred Coal Resources Competent
Person31.12.16 31.12.15 31.12.16 31.12.15 31.12.16 31.12.15
Tweefontein 79.8% Thermal Coal (Mt) 940 940 65 65 40 40
Tweefontein North OC/UG Thermal Coal (Mt) 730 730 – – 10 10 MS
CV (kcal/kg) 5,250 5,250 5,500 5,500
Tweefontein South OC/UG Thermal Coal (Mt) 210 210 65 65 30 30 MS
CV (kcal/kg) 5,350 5,350 4,350 4,350 4,600 4,600
Goedgevonden 74% OC/UG Thermal Coal (Mt) 540 540 13 28 – – MS
Complex CV (kcal/kg) 4,800 4,800 5,000 5,000 –
iMpunzi 79.8% Thermal Coal (Mt) 410 420 14 14 3 3
iMpunzi North OC Thermal Coal (Mt) 270 280 4 4 3 3 MS
CV (kcal/kg) 5,250 5,250 5,500 5,500 5,600 5,600
iMpunzi East OC Thermal Coal (Mt) 140 140 10 10 – – MS
CV (kcal/kg) 5,400 5,400 5,250 5,250
Zonnebloem Project 100% OC Thermal Coal (Mt) 200 200 40 40 – – MS
CV (kcal/kg) 5,150 5,150 4,850 4,850
Oogiesfontein 100% UG Thermal Coal (Mt) 60 60 20 20 – – MS
CV (kcal/kg) 4,950 4,950 4,950 4,950
Paardekop 100% UG Thermal Coal (Mt) 130 130 640 640 90 90 MS
CV (kcal/kg) 5,350 5,350 5,400 5,400 5,350 5,350
Nooitgedacht 100% UG Thermal Coal (Mt) 22 22 40 40 6 6 MS
CV (kcal/kg) 4,850 4,850 4,850 4,850 4,850 4,850
Undeveloped 100% OC/UG Thermal Coal (Mt) – – 13 13 250 250 MS
Resources CV (kcal/kg) – – 4,750 4,750 5,400 5,400
Izimbiwa 49.99% Thermal Coal (Mt) 188 190 110 110 16 16
Graspan OC Thermal coal (Mt) 7 9 – – – – MS
CV (kcal/kg) 5 350 5,350
Townlands OC Thermal coal (Mt) 14 15 – – – – MS
CV (kcal/kg) 4 850 4,850
Steelcoal OC Thermal coal (Mt) 10 10 – – – – MS
CV (kcal/kg) 4,650 4,650
Lakeside OC/UG Thermal coal (Mt) 5 5 – – – – MS
CV (kcal/kg) 4,500 4,500
Leeuwfontein OC Thermal coal (Mt) 5 5 – – – – MS
CV (kcal/kg) 4,600 4,600
Springlake UG/OC Thermal coal (Mt) 17 17 10 10 6 6 MS
CV (kcal/kg) 6,300 6,300 6,300 6,300 6,300 6,300
Argent OC Thermal coal (Mt) 29 29 – – – – MS
CV (kcal/kg) 5,100 5,100
Springboklaagte* UG/OC Thermal coal (Mt) 86 86 100 100 10 10 MS
CV (kcal/kg) 4,500 4,500 4,500 4,500 4,500 4,500
Corobrik OC Thermal coal (Mt) 15 16 – – – – MS
CV (kcal/kg) 5,100 5,100 * Springboklaagte is held as a Joint Venture between Izimbiwa and Umcebo, 100% of the Springboklaagte resources are included in the table above under Izimbiwa
and excluded from Umcebo.
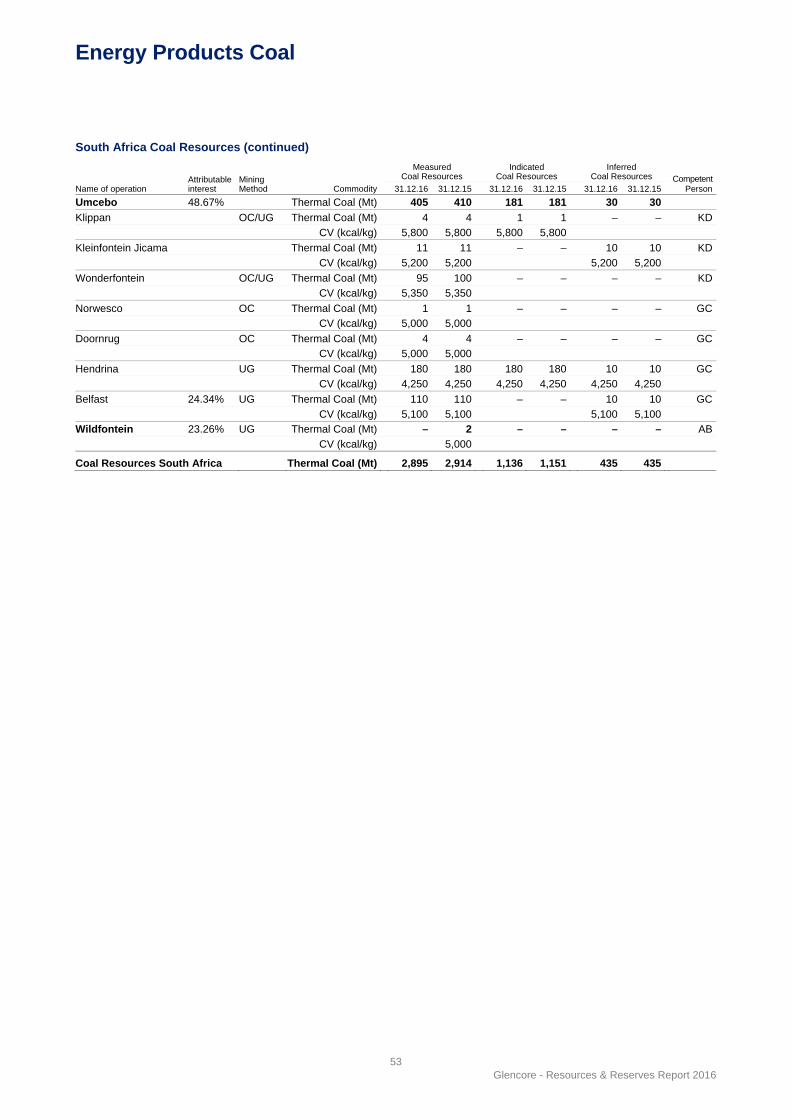
Energy Products Coal
53 Glencore - Resources & Reserves Report 2016
South Africa Coal Resources (continued)
Name of operation
Attributable interest
Mining Method Commodity
Measured Coal Resources
Indicated Coal Resources
Inferred Coal Resources Competent
Person31.12.16 31.12.15 31.12.16 31.12.15 31.12.16 31.12.15
Umcebo 48.67% Thermal Coal (Mt) 405 410 181 181 30 30
Klippan OC/UG Thermal Coal (Mt) 4 4 1 1 – – KD
CV (kcal/kg) 5,800 5,800 5,800 5,800
Kleinfontein Jicama Thermal Coal (Mt) 11 11 – – 10 10 KD
CV (kcal/kg) 5,200 5,200 5,200 5,200
Wonderfontein OC/UG Thermal Coal (Mt) 95 100 – – – – KD
CV (kcal/kg) 5,350 5,350
Norwesco OC Thermal Coal (Mt) 1 1 – – – – GC
CV (kcal/kg) 5,000 5,000
Doornrug OC Thermal Coal (Mt) 4 4 – – – – GC
CV (kcal/kg) 5,000 5,000
Hendrina UG Thermal Coal (Mt) 180 180 180 180 10 10 GC
CV (kcal/kg) 4,250 4,250 4,250 4,250 4,250 4,250
Belfast 24.34% UG Thermal Coal (Mt) 110 110 – – 10 10 GC
CV (kcal/kg) 5,100 5,100 5,100 5,100
Wildfontein 23.26% UG Thermal Coal (Mt) – 2 – – – – AB
CV (kcal/kg) 5,000
Coal Resources South Africa Thermal Coal (Mt) 2,895 2,914 1,136 1,151 435 435
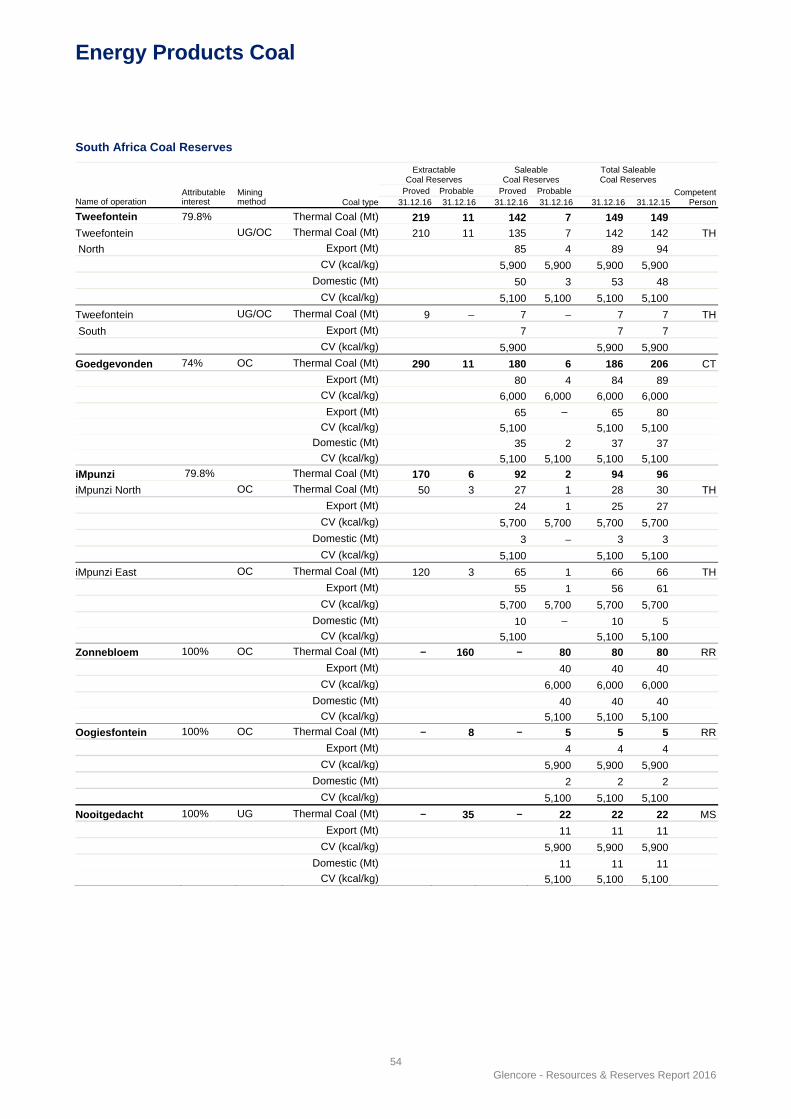
Energy Products Coal
54 Glencore - Resources & Reserves Report 2016
South Africa Coal Reserves
Name of operation Attributable interest
Mining method Coal type
Extractable Coal Reserves
Saleable Coal Reserves
Total Saleable Coal Reserves
Competent Person
Proved Probable Proved Probable 31.12.16 31.12.16 31.12.16 31.12.16 31.12.16 31.12.15
Tweefontein 79.8% Thermal Coal (Mt) 219 11 142 7 149 149
Tweefontein UG/OC Thermal Coal (Mt) 210 11 135 7 142 142 TH
North Export (Mt) 85 4 89 94
CV (kcal/kg) 5,900 5,900 5,900 5,900
Domestic (Mt) 50 3 53 48
CV (kcal/kg) 5,100 5,100 5,100 5,100
Tweefontein UG/OC Thermal Coal (Mt) 9 – 7 – 7 7 TH
South Export (Mt) 7 7 7
CV (kcal/kg) 5,900 5,900 5,900
Goedgevonden 74% OC Thermal Coal (Mt) 290 11 180 6 186 206 CT
Export (Mt) 80 4 84 89
CV (kcal/kg) 6,000 6,000 6,000 6,000
Export (Mt) 65 – 65 80
CV (kcal/kg) 5,100 5,100 5,100
Domestic (Mt) 35 2 37 37 CV (kcal/kg) 5,100 5,100 5,100 5,100
iMpunzi 79.8% Thermal Coal (Mt) 170 6 92 2 94 96
iMpunzi North OC Thermal Coal (Mt) 50 3 27 1 28 30 TH
Export (Mt) 24 1 25 27
CV (kcal/kg) 5,700 5,700 5,700 5,700
Domestic (Mt) 3 – 3 3
CV (kcal/kg) 5,100 5,100 5,100
iMpunzi East OC Thermal Coal (Mt) 120 3 65 1 66 66 TH
Export (Mt) 55 1 56 61
CV (kcal/kg) 5,700 5,700 5,700 5,700
Domestic (Mt) 10 – 10 5 CV (kcal/kg) 5,100 5,100 5,100
Zonnebloem 100% OC Thermal Coal (Mt) – 160 – 80 80 80 RR
Export (Mt) 40 40 40
CV (kcal/kg) 6,000 6,000 6,000
Domestic (Mt) 40 40 40 CV (kcal/kg) 5,100 5,100 5,100
Oogiesfontein 100% OC Thermal Coal (Mt) – 8 – 5 5 5 RR
Export (Mt) 4 4 4
CV (kcal/kg) 5,900 5,900 5,900
Domestic (Mt) 2 2 2
CV (kcal/kg) 5,100 5,100 5,100
Nooitgedacht 100% UG Thermal Coal (Mt) – 35 – 22 22 22 MS
Export (Mt) 11 11 11
CV (kcal/kg) 5,900 5,900 5,900
Domestic (Mt) 11 11 11 CV (kcal/kg) 5,100 5,100 5,100
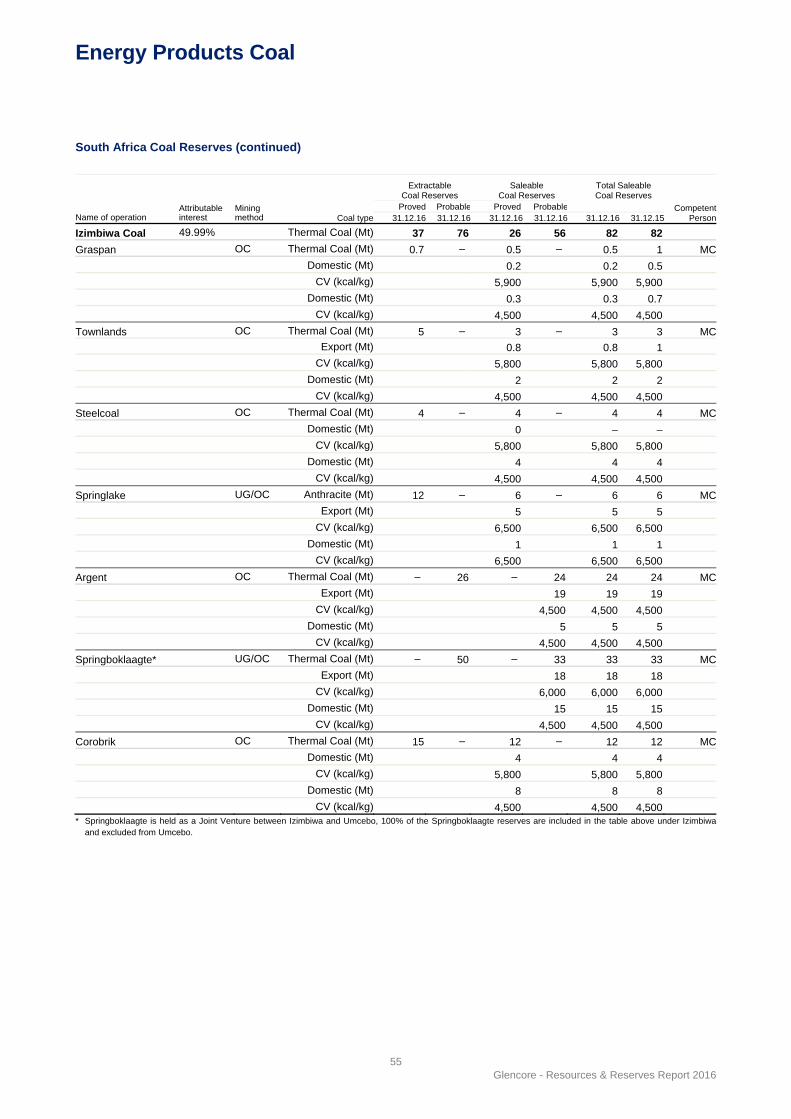
Energy Products Coal
55 Glencore - Resources & Reserves Report 2016
South Africa Coal Reserves (continued)
Name of operation Attributable interest
Mining method Coal type
Extractable Coal Reserves
Saleable Coal Reserves
Total Saleable Coal Reserves
Competent Person
Proved Probable Proved Probable31.12.16 31.12.16 31.12.16 31.12.16 31.12.16 31.12.15
Izimbiwa Coal 49.99% Thermal Coal (Mt) 37 76 26 56 82 82
Graspan OC Thermal Coal (Mt) 0.7 – 0.5 – 0.5 1 MC
Domestic (Mt) 0.2 0.2 0.5
CV (kcal/kg) 5,900 5,900 5,900
Domestic (Mt) 0.3 0.3 0.7
CV (kcal/kg) 4,500 4,500 4,500
Townlands OC Thermal Coal (Mt) 5 – 3 – 3 3 MC
Export (Mt) 0.8 0.8 1
CV (kcal/kg) 5,800 5,800 5,800
Domestic (Mt) 2 2 2
CV (kcal/kg) 4,500 4,500 4,500
Steelcoal OC Thermal Coal (Mt) 4 – 4 – 4 4 MC
Domestic (Mt) 0 – –
CV (kcal/kg) 5,800 5,800 5,800
Domestic (Mt) 4 4 4
CV (kcal/kg) 4,500 4,500 4,500
Springlake UG/OC Anthracite (Mt) 12 – 6 – 6 6 MC
Export (Mt) 5 5 5
CV (kcal/kg) 6,500 6,500 6,500
Domestic (Mt) 1 1 1
CV (kcal/kg) 6,500 6,500 6,500
Argent OC Thermal Coal (Mt) – 26 – 24 24 24 MC
Export (Mt) 19 19 19
CV (kcal/kg) 4,500 4,500 4,500
Domestic (Mt) 5 5 5
CV (kcal/kg) 4,500 4,500 4,500
Springboklaagte* UG/OC Thermal Coal (Mt) – 50 – 33 33 33 MC
Export (Mt) 18 18 18
CV (kcal/kg) 6,000 6,000 6,000
Domestic (Mt) 15 15 15
CV (kcal/kg) 4,500 4,500 4,500
Corobrik OC Thermal Coal (Mt) 15 – 12 – 12 12 MC
Domestic (Mt) 4 4 4
CV (kcal/kg) 5,800 5,800 5,800
Domestic (Mt) 8 8 8
CV (kcal/kg) 4,500 4,500 4,500* Springboklaagte is held as a Joint Venture between Izimbiwa and Umcebo, 100% of the Springboklaagte reserves are included in the table above under Izimbiwa
and excluded from Umcebo.
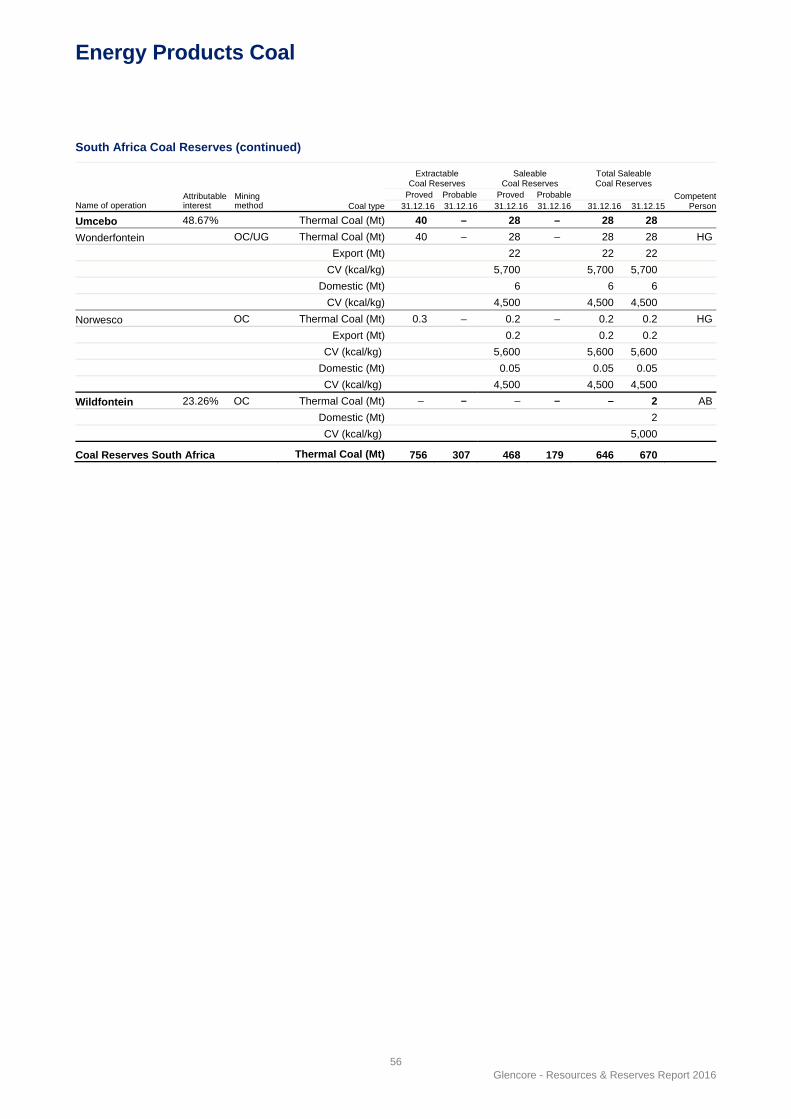
Energy Products Coal
56 Glencore - Resources & Reserves Report 2016
South Africa Coal Reserves (continued)
Name of operation Attributable interest
Mining method Coal type
Extractable Coal Reserves
Saleable Coal Reserves
Total Saleable Coal Reserves
Competent Person
Proved Probable Proved Probable31.12.16 31.12.16 31.12.16 31.12.16 31.12.16 31.12.15
Umcebo 48.67% Thermal Coal (Mt) 40 – 28 – 28 28
Wonderfontein OC/UG Thermal Coal (Mt) 40 – 28 – 28 28 HG
Export (Mt) 22 22 22
CV (kcal/kg) 5,700 5,700 5,700
Domestic (Mt) 6 6 6
CV (kcal/kg) 4,500 4,500 4,500
Norwesco OC Thermal Coal (Mt) 0.3 – 0.2 – 0.2 0.2 HG
Export (Mt) 0.2 0.2 0.2
CV (kcal/kg) 5,600 5,600 5,600
Domestic (Mt) 0.05 0.05 0.05
CV (kcal/kg) 4,500 4,500 4,500
Wildfontein 23.26% OC Thermal Coal (Mt) – – – – – 2 AB
Domestic (Mt) 2
CV (kcal/kg) 5,000
Coal Reserves South Africa Thermal Coal (Mt) 756 307 468 179 646 670
Energy Products Coal
57 Glencore - Resources & Reserves Report 2016
Notes Coal Resources have been re-estimated in 2016 for inclusion in this summary table except where otherwise stated. Revision of the totals includes changes to classifications of Coal Resource status due to exploration, geological reinterpretation and remodelling, and changes to lease holdings.
Coal Resources and Reserve qualities are reported at an air dried moisture basis and Export Saleable Coal Reserves are reported at a net as received moisture basis. Coal Resources are reported inclusive of Coal Reserves.
Product yields used to estimate Saleable Coal Reserves were derived from the “Limn Model” software. Inputs to this model are coal ply and in-seam dilution data, processed in the model. The model takes into account plant efficiencies to calculate practical yields. The model is calibrated to historical plant performance and where applicable, large diameter borehole data is used.
Changes and notes relevant to the estimation of Coal Resources and Reserves are listed below for specific projects. Changes reported are exclusive of production from 31 December 2015 to 31 December 2016. Depletion due to mining is based on the actual depletion from January to September, and a forecast for October to December. This forecast number is reconciled each year to the actual and an adjustment is made accordingly.
Coal Resource and Reserve totals are rounded to appropriate levels of accuracy in accordance with the 2007 SAMREC Code (as amended July 2009) and the Glencore Coal rounding process. In summary, Measured and Indicated Coal Resources are rounded to 1 significant figure if less than 10Mt and 2 significant figures if greater than 10Mt; calorific values are rounded to the nearest 50kcal/kg.
Tweefontein Complex Tweefontein North: Coal Resource depletion due to mining: (-
12Mt). Re-evaluation of pillars in the opencast areas (+6.5Mt). Resource gain in Makoupan Pit after additional drilling and remodelling increased the resource footprint (+4.2Mt).
The Tweefontein North development includes all five seams present in the Vryheid Formation. The 1, 2, 4 and 5 seams form part of the mineable and economic Coal Resources. The resources have the potential to be extracted via both opencast truck and shovel or dragline, and underground bord and pillar mining methods.
Coal Reserve depletion due to mining: (-1.8Mt). Probable reserves of 9.9Mt were reclassified as proven reserves in the TUGO 2S highwall area.
Changes in the mine plan resulted in a number of changes in the reserves: review of economic pitshells resulted in an increase in UG reserves (2.5Mt) and OC reserves (3.6Mt). A change in the practical pitshell design in BM Central 2 seam UG area resulted in a loss of reserves (-2.0Mt). Re-evaluation of BM North 2 seam reallocated reserves to UG from OC, giving access to additional UG reserves (2.5Mt). No-Coal areas were identified by sub-outcrop drilling in the Klipplaat OC (-1.6Mt).
Mining Tenement for Tweefontein North expires in August 2020. Coal Reserves for Tweefontein North are sufficient to support a mine life of 18 years.
Tweefontein South: Tweefontein South Complex is contained in the Tavistock and Klippoortje old order mining authorisations, situated within the Witbank Coalfield. The complex development includes all five seams, however,
only the 1, 2, 4 and 5 seams form part of the potentially mineable and economic Coal Resources.
No mining was conducted in 2016 and the 5 Seam Addcar Coal Reserves remain available for future extraction.
Tenements for Tweefontein South expire between August 2024 and August 2040. Coal Reserves for Tweefontein South are sufficient to support a mine life of 10 years.
Goedgevonden: Coal Resource depletion due to mining (-11.5Mt). Resource loss due to spoils covering coal seams in cut 17, North Pit (-2.9Mt).
The Goedgevonden Complex is situated within the Witbank coal field. Opencast dragline mining operations in the area are extracting the 2, 4 and 5 seams. The 3 seam is too thin for practical extraction and the 1 seam is not considered an economic Coal Resource in the area.
Coal Reserve depletion due to mining (-10.5Mt).
Mine planning changes have reduced Coal Reserves (-5.2Mt) and Marketable Reserves (-3.4Mt). Product optimisation has resulted in a reduction in ROM Coal Reserves (-1.6Mt), an increase in saleable export coal (1.7Mt) and reduction in saleable low grade coal (5.3Mt). Removal of fines flotation recovery from the current plan has resulted in a reduction in low grade saleable reserves (-11.6Mt).
Tenements for Goedgevonden expire between February 2038 and May 2038. Coal Reserves for Goedgevonden are sufficient to support a mine life of 25 years.
iMpunzi iMpunzi North Coal Resource depletion due to mining (-
11.3Mt). Loss of 4 Lower Seam Resources in North East Pit based on the extent of a coal wash out area after additional drilling (-0.14Mt).
iMpunzi consists of iMpunzi Opencast (opencast dragline and truck and shovel operations) and iMpunzi minipits (truck and shovel operations). The Opencast resources include the 1, 2 and 4 seams, whilst the minipits includes only the 4 seam.
Coal Reserve depletion due to mining: (-9.8Mt), Top coal situated immediately above the 2 seam is included in the mining horizon, (previously seen as spoils), after new drilling has proved that the qualities are acceptable, increasing the reserves by 1.9Mt.
Mining tenement for iMpunzi North expires in August 2040. Coal Reserves for iMpunzi North and East are sufficient to support a mine life of 24 years.
iMpunzi East: Resource depletion due to mining (-0.8Mt).
A large portion of the 2 seam and a small area of the 4 seam have been previously mined via underground bord and pillar method. The full seam is extracted through opencast mining methods – the lower zone of each seam was previously partially extracted by underground mining and the upper zone remains intact.
Reserves depletion due to mining (-0.7Mt). Thin 4 upper seam of between 0.5 and 1.0m thick in the VDD West area, which satisfies the quality requirements and overlies 4 lower seam reserves, has been included in the mining horizon increasing the reserves by 1.9Mt
Zonnebloem: The 1 and 2 seams are developed at Zonnebloem and will be extracted by opencast truck and shovel or dragline.
Energy Products Coal
58 Glencore - Resources & Reserves Report 2016
All mining and environmental licensing and permitting has been finalised. Mining tenement for Zonnebloem expires in September 2039. Coal Reserves for Zonnebloem are sufficient to support a mine life of 24 years.
Oogiesfontein: There have been no changes to the Coal Resource or Reserve. A Section 102 application has been approved to incorporate Oogiesfontein into the Goedgevonden Complex. Awaiting environmental licensing and permitting to be finalised.
Mining Tenement for Oogiesfontein expires in October 2018.
Paardekop: The project area comprises underground resources in a single-seam deposit. A mining right application was submitted in 2012. Awaiting approval of right and environmental licensing and permitting.
The only seam of economic importance in Paardekop project area is the Main seam which contains nearly 95% of the extractable coal. The seam has a mean thickness of 2.5m and is structurally almost flat. The upper zone is of poor CV whilst the lower zone has an average raw CV over 5,300kcal/kg.
Undeveloped Coal Resources: Applications for mining rights have been submitted for all the undeveloped Coal Resources. The mining right for Amersfoort was granted while the others are still outstanding. The Coal Resource estimation includes:
Amersfoort (contained in the southern portion of the Ermelo Coalfield, Mpumalanga province southwest of Breyten). Estimation for Amersfoort is based on the C seam which is at a depth of 200m and a thickness of 2.5m;
Boschmanspoort (located in the Witbank Coalfield of Mpumalanga southeast of Middleburg). Estimation for Boschmanspoort is based on the 2 seam which dips towards the east, therefore allowing some potential opencast resources in the west; and
Trichardsfontein (located north of Trichardt). Estimation for Trichardsfontein is based on the 4 seam lower at approximately 90m depth. The seam has potential for underground extraction.
Izimbiwa Coal: Please note the name change from Shanduka to Izimbiwa Coal (Pty) Ltd.
The remaining mine life for individual mining operations range from 2 to 12 years, based on the coal reserves except for the Springboklaagte deposit that extends Izimbiwa’s expected life by approximately 20 to 25 years.
Expiry date of relevant mining/concession licenses are different for each mine, ranging from January 2017 to March 2027 in respect of Graspan, Townlands, Steelcoal, Lakeside and Springlake. An application for extension of the Graspan mining right that lapses in January 2017 has been submitted.
Springboklaagte is a prospecting right, which is granted for 5 year periods and renewable for a further three year period. The main prospecting right expired on 3 August 2011 and an application for the renewal of the prospecting right was lodged on 3 June 2011. A mining right was also lodged in April 2011. The mining right was granted in May 2016, awaiting finalisation of the environmental licensing and permitting.
Argent had its mining right granted in May 2016, awaiting finalisation of the environmental licensing and permitting.
Graspan: Coal Resource depletion due to mining (-2.5Mt).
Losses due to geological disturbances including wash-outs, pinching seams and geological structures (-0.4Mt).
Coal Reserve depletion due to mining (-2.5Mt). Coal gained outside mine layout and Portion 31 boundary pillar resulting in a 1.5Mt ROM reserve increase.
Townlands: No mining was conducted at Townlands and the reserves remains unchanged. It forms part of the Graspan LOM and the reserves will be mined as such in the future.
Steelcoal: No change in Coal Resources or Reserves, and the reserves have been earmarked as a future expansion to Graspan.
Lakeside and Leeuwfontein: No change to Coal Resources or Reserves, mines are on care and maintenance. Leeuwfontein remains an ‘old order right’ or mining licence, with applications pending for conversion into a ‘new order right’ or mining licence.
Springlake: Coal Resource depletion due to mining (-0.5Mt).
Coal Reserve depletion due to mining (-0.5Mt). Mine placed on care and maintenance.
Corobrik: Resource Depletion due to mining (1.1Mt). Thinning of 1 seam towards the north of North-West Pit and into the Corobrik block resulted in a loss of resources (-0.1Mt)
The reserve forms a natural extension to Graspan Colliery and North Pit was extended into the Corobrik block.
Coal Reserve depletion due to mining (-0.7Mt).
Umcebo: The remaining mine life of the individual mining operations range up to 10 years. Expiry date of relevant mining/concession licenses are different for each mine, ranging from October 2017 to December 2037. Renewals have been lodged for Doornrug, Klippan and Norwesco. The Wonderfontein mining right expires in August 2037.
Klippan: The mine is currently closed with 4.2Mt of Coal Resources remaining.
Kleinfontein Jicama: Mine on care and maintenance.
Wonderfontein: Coal Resource depletion due to mining (-3.3Mt).
Coal Reserve depletion due to mining (-3.2Mt). Change in seam thickness cut-off to from 1.0m to 0.5m resulted in an increase in reserves (2.9Mt).
Norwesco, Doornrug, Hendrina and Belfast: future projects and there are no changes in Coal Resources or Reserves for the current reporting period.
Wildfontein was held under a Joint Venture agreement between Izimbiwa Coal and Hlagisa. The coal reserve was depleted through mining in 2016(1.9Mt).
Energy Products Coal
59 Glencore - Resources & Reserves Report 2016
Competent Persons AB = Allen Bullock; N.H.Dip. Coal Mining; Pr Sc Nat
(400059/98); Director, Hlagisa Mining (Pty) Ltd;
CT = Chris Theart; ND, NHD Metal Mining; SAIMM (706513); Group Mining Engineer, Glencore Coal South Africa;
GC = Gerrit Cronjé, BSc Hons Geology; Pr Sc Nat 400128/86, employed by Izimbiwa Coal (Pty) Ltd;
HG = Hugo Grobler B Engineering Mining; MSc Engineering Mining; MCC, SAIMM; employed by Izimbiwa Coal (Pty) Ltd;
KD = Karin van Deventer; (MSc Geochemistry; Pr Sc Nat 400705/15, employed by Glencore Coal South Africa;
MC = Mark Cunney, BEng Hons Mining Engineering, MCC; Pr Cert Eng 2007 0114, employed by Izimbiwa Coal (Pty) Ltd;
MS = Marius Smith; B Sc. Honours Geology; MBA; Pr Sc Nat 400075/03; Group Coal Geologist, Glencore Coal South Africa;
RR = Rohan Roach; B Com; B Tech Mine Engineering; Coal Mine Managers Certificate of Competency, Metalliferous Mine Managers Certificate of Competency; SAIMM, ECSA; Group Mining Engineer, Glencore Coal South Africa;
TH = Trevor Howard; B Eng. Mining; Coal Mine Managers Certificate of Competency; SAIMM (701062); Group Mining Engineer, Glencore Coal South Africa;
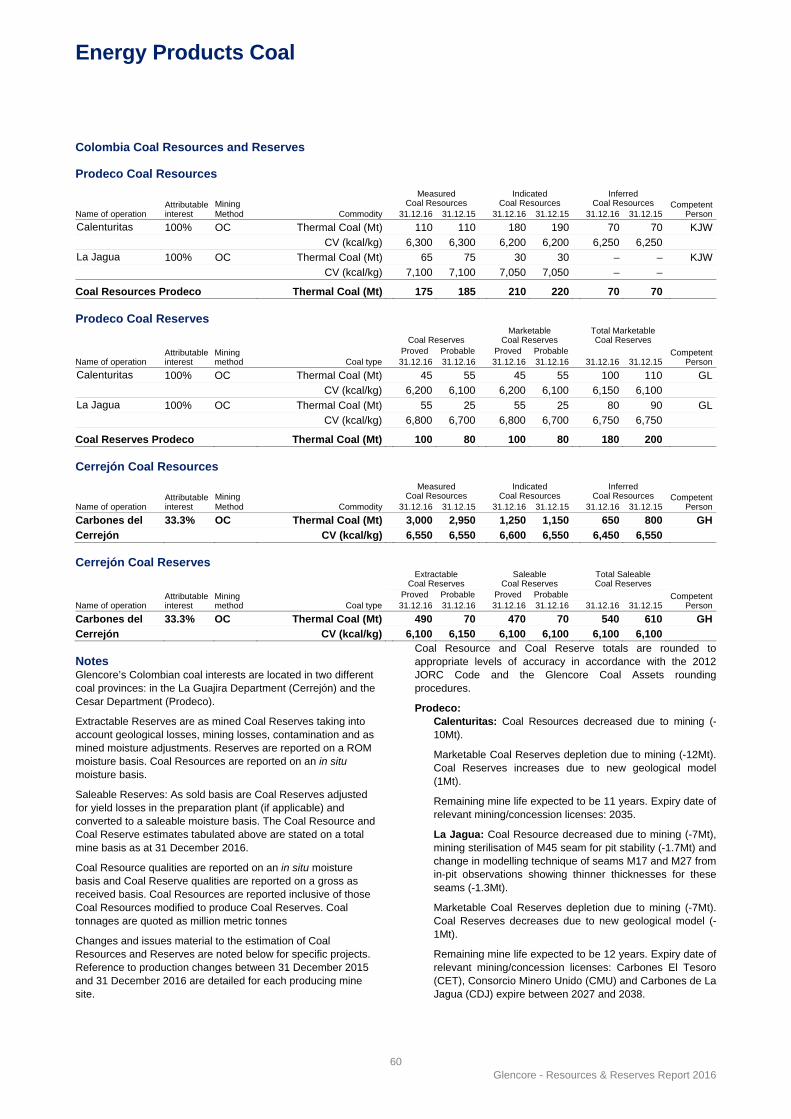
Energy Products Coal
60 Glencore - Resources & Reserves Report 2016
Colombia Coal Resources and Reserves
Prodeco Coal Resources
Name of operation Attributable interest
Mining Method Commodity
Measured Coal Resources
Indicated Coal Resources
Inferred Coal Resources Competent
Person31.12.16 31.12.15 31.12.16 31.12.15 31.12.16 31.12.15
Calenturitas 100% OC Thermal Coal (Mt) 110 110 180 190 70 70 KJW CV (kcal/kg) 6,300 6,300 6,200 6,200 6,250 6,250La Jagua 100% OC Thermal Coal (Mt) 65 75 30 30 – – KJW CV (kcal/kg) 7,100 7,100 7,050 7,050 – –
Coal Resources Prodeco Thermal Coal (Mt) 175 185 210 220 70 70
Prodeco Coal Reserves
Name of operation Attributable interest
Mining method Coal type
Coal Reserves
Marketable Coal Reserves
Total Marketable Coal Reserves
CompetentPerson
Proved Probable Proved Probable 31.12.16 31.12.16 31.12.16 31.12.16 31.12.16 31.12.15
Calenturitas 100% OC Thermal Coal (Mt) 45 55 45 55 100 110 GL CV (kcal/kg) 6,200 6,100 6,200 6,100 6,150 6,100La Jagua 100% OC Thermal Coal (Mt) 55 25 55 25 80 90 GL CV (kcal/kg) 6,800 6,700 6,800 6,700 6,750 6,750
Coal Reserves Prodeco Thermal Coal (Mt) 100 80 100 80 180 200
Cerrejón Coal Resources
Name of operation Attributable interest
Mining Method Commodity
Measured Coal Resources
Indicated Coal Resources
Inferred Coal Resources Competent
Person31.12.16 31.12.15 31.12.16 31.12.15 31.12.16 31.12.15
Carbones del 33.3% OC Thermal Coal (Mt) 3,000 2,950 1,250 1,150 650 800 GH
Cerrejón CV (kcal/kg) 6,550 6,550 6,600 6,550 6,450 6,550
Cerrejón Coal Reserves
Name of operation Attributable interest
Mining method Coal type
Extractable Coal Reserves
Saleable Coal Reserves
Total Saleable Coal Reserves
CompetentPerson
Proved Probable Proved Probable 31.12.16 31.12.16 31.12.16 31.12.16 31.12.16 31.12.15
Carbones del 33.3% OC Thermal Coal (Mt) 490 70 470 70 540 610 GH
Cerrejón CV (kcal/kg) 6,100 6,150 6,100 6,100 6,100 6,100 Notes Glencore’s Colombian coal interests are located in two different coal provinces: in the La Guajira Department (Cerrejón) and the Cesar Department (Prodeco).
Extractable Reserves are as mined Coal Reserves taking into account geological losses, mining losses, contamination and as mined moisture adjustments. Reserves are reported on a ROM moisture basis. Coal Resources are reported on an in situ moisture basis.
Saleable Reserves: As sold basis are Coal Reserves adjusted for yield losses in the preparation plant (if applicable) and converted to a saleable moisture basis. The Coal Resource and Coal Reserve estimates tabulated above are stated on a total mine basis as at 31 December 2016.
Coal Resource qualities are reported on an in situ moisture basis and Coal Reserve qualities are reported on a gross as received basis. Coal Resources are reported inclusive of those Coal Resources modified to produce Coal Reserves. Coal tonnages are quoted as million metric tonnes
Changes and issues material to the estimation of Coal Resources and Reserves are noted below for specific projects. Reference to production changes between 31 December 2015 and 31 December 2016 are detailed for each producing mine site.
Coal Resource and Coal Reserve totals are rounded to appropriate levels of accuracy in accordance with the 2012 JORC Code and the Glencore Coal Assets rounding procedures.
Prodeco: Calenturitas: Coal Resources decreased due to mining (-10Mt).
Marketable Coal Reserves depletion due to mining (-12Mt). Coal Reserves increases due to new geological model (1Mt).
Remaining mine life expected to be 11 years. Expiry date of relevant mining/concession licenses: 2035.
La Jagua: Coal Resource decreased due to mining (-7Mt), mining sterilisation of M45 seam for pit stability (-1.7Mt) and change in modelling technique of seams M17 and M27 from in-pit observations showing thinner thicknesses for these seams (-1.3Mt).
Marketable Coal Reserves depletion due to mining (-7Mt). Coal Reserves decreases due to new geological model (-1Mt).
Remaining mine life expected to be 12 years. Expiry date of relevant mining/concession licenses: Carbones El Tesoro (CET), Consorcio Minero Unido (CMU) and Carbones de La Jagua (CDJ) expire between 2027 and 2038.
Energy Products Coal
61 Glencore - Resources & Reserves Report 2016
Cerrejón: Coal Resources are reported as gross tonnes in situ, i.e. thin seams (<0.65m) excluded with no geological losses applied. The Coal Resources occur within a ‘geoshell’ constrained by the horizontal and vertical distribution of data within the drill hole (data limits) envelope. Resources include coal for which the continuity, quality and mineability are established but are outside the current LOM plan. There are approximately 220Mt of coal that occurs within the geoshell and under mining restricted areas within 1 km of major towns. This coal has not been included in the Coal Resources in 2016. These Coal Resources comply with current and foreseen mining and marketing criteria and have economic potential.
Coal Reserves have reduced by 40Mt due principally to depletion by mining (-33.1Mt).
The estimates of Coal Resources and Coal Reserves presented in this table for Cerrejón have been prepared in accordance with the 2007 SAMREC Code (South African Code for Reporting of Mineral Resources and Mineral Reserves) (as amended July 2009).
Competent Persons GL = Guillermo Leon, Superintendent Mine Planning, Prodeco, (AusIMM).
KJW = Kerry Whitby, Managing Director, McElroy Bryan Geological Services Pty Ltd (AusIMM).
GH = German Hernandez; BSc, BHPBilliton Certificate of Competent Person; GSSA; APS Geology Superintendent, Carbones del Cerrejón.
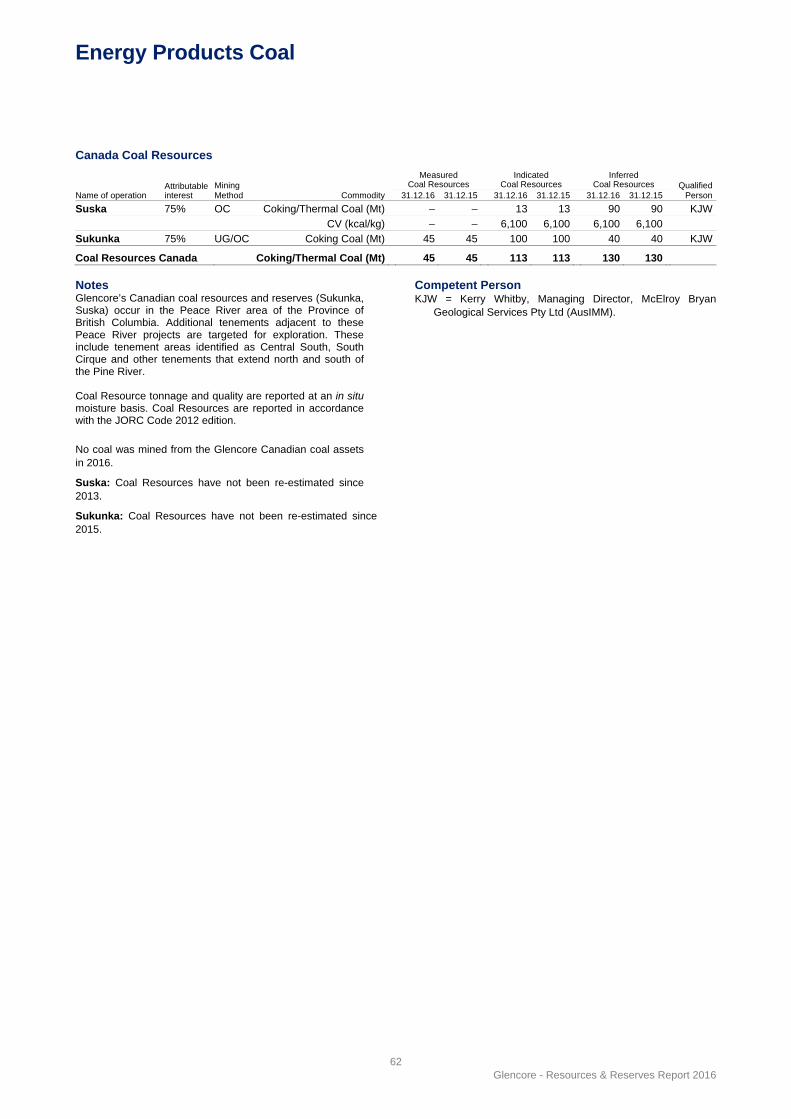
Energy Products Coal
62 Glencore - Resources & Reserves Report 2016
Canada Coal Resources
Name of operation Attributable interest
Mining Method Commodity
Measured Coal Resources
Indicated Coal Resources
Inferred Coal Resources Qualified
Person31.12.16 31.12.15 31.12.16 31.12.15 31.12.16 31.12.15
Suska 75% OC Coking/Thermal Coal (Mt) – – 13 13 90 90 KJW
CV (kcal/kg) – – 6,100 6,100 6,100 6,100
Sukunka 75% UG/OC Coking Coal (Mt) 45 45 100 100 40 40 KJW
Coal Resources Canada Coking/Thermal Coal (Mt) 45 45 113 113 130 130
Notes Glencore’s Canadian coal resources and reserves (Sukunka, Suska) occur in the Peace River area of the Province of British Columbia. Additional tenements adjacent to these Peace River projects are targeted for exploration. These include tenement areas identified as Central South, South Cirque and other tenements that extend north and south of the Pine River. Coal Resource tonnage and quality are reported at an in situ moisture basis. Coal Resources are reported in accordance with the JORC Code 2012 edition.
No coal was mined from the Glencore Canadian coal assets in 2016.
Suska: Coal Resources have not been re-estimated since 2013.
Sukunka: Coal Resources have not been re-estimated since 2015.
Competent Person KJW = Kerry Whitby, Managing Director, McElroy Bryan
Geological Services Pty Ltd (AusIMM).
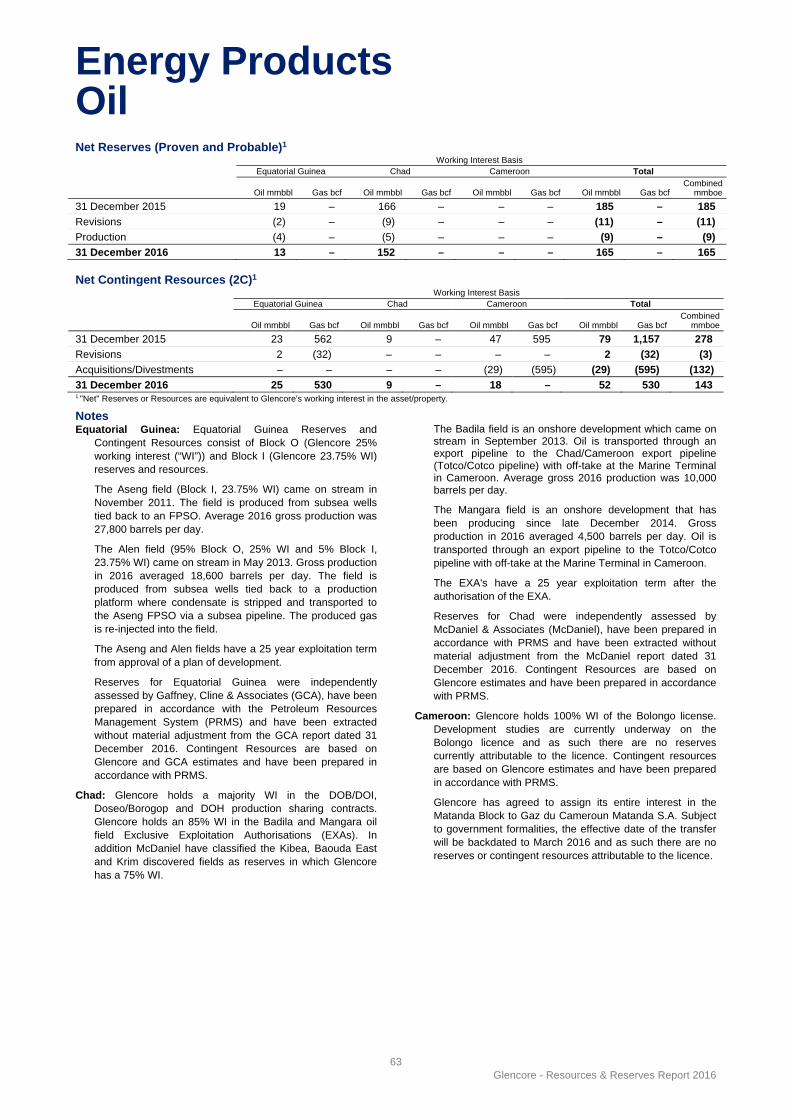
Energy Products Oil
63 Glencore - Resources & Reserves Report 2016
Net Reserves (Proven and Probable)1 Working Interest Basis Equatorial Guinea Chad Cameroon Total Oil mmbbl Gas bcf Oil mmbbl Gas bcf Oil mmbbl Gas bcf Oil mmbbl Gas bcf
Combined mmboe
31 December 2015 19 – 166 – – – 185 – 185
Revisions (2) – (9) – – – (11) – (11)
Production (4) – (5) – – – (9) – (9)
31 December 2016 13 – 152 – – – 165 – 165 Net Contingent Resources (2C)1 Working Interest Basis Equatorial Guinea Chad Cameroon Total Oil mmbbl Gas bcf Oil mmbbl Gas bcf Oil mmbbl Gas bcf Oil mmbbl Gas bcf
Combined mmboe
31 December 2015 23 562 9 – 47 595 79 1,157 278
Revisions 2 (32) – – – – 2 (32) (3)
Acquisitions/Divestments – – – – (29) (595) (29) (595) (132)
31 December 2016 25 530 9 – 18 – 52 530 143 1 "Net" Reserves or Resources are equivalent to Glencore's working interest in the asset/property.
Notes Equatorial Guinea: Equatorial Guinea Reserves and
Contingent Resources consist of Block O (Glencore 25% working interest (“WI”)) and Block I (Glencore 23.75% WI) reserves and resources.
The Aseng field (Block I, 23.75% WI) came on stream in November 2011. The field is produced from subsea wells tied back to an FPSO. Average 2016 gross production was 27,800 barrels per day.
The Alen field (95% Block O, 25% WI and 5% Block I, 23.75% WI) came on stream in May 2013. Gross production in 2016 averaged 18,600 barrels per day. The field is produced from subsea wells tied back to a production platform where condensate is stripped and transported to the Aseng FPSO via a subsea pipeline. The produced gas is re-injected into the field.
The Aseng and Alen fields have a 25 year exploitation term from approval of a plan of development.
Reserves for Equatorial Guinea were independently assessed by Gaffney, Cline & Associates (GCA), have been prepared in accordance with the Petroleum Resources Management System (PRMS) and have been extracted without material adjustment from the GCA report dated 31 December 2016. Contingent Resources are based on Glencore and GCA estimates and have been prepared in accordance with PRMS.
Chad: Glencore holds a majority WI in the DOB/DOI, Doseo/Borogop and DOH production sharing contracts. Glencore holds an 85% WI in the Badila and Mangara oil field Exclusive Exploitation Authorisations (EXAs). In addition McDaniel have classified the Kibea, Baouda East and Krim discovered fields as reserves in which Glencore has a 75% WI.
The Badila field is an onshore development which came on stream in September 2013. Oil is transported through an export pipeline to the Chad/Cameroon export pipeline (Totco/Cotco pipeline) with off-take at the Marine Terminal in Cameroon. Average gross 2016 production was 10,000 barrels per day.
The Mangara field is an onshore development that has been producing since late December 2014. Gross production in 2016 averaged 4,500 barrels per day. Oil is transported through an export pipeline to the Totco/Cotco pipeline with off-take at the Marine Terminal in Cameroon.
The EXA's have a 25 year exploitation term after the authorisation of the EXA.
Reserves for Chad were independently assessed by McDaniel & Associates (McDaniel), have been prepared in accordance with PRMS and have been extracted without material adjustment from the McDaniel report dated 31 December 2016. Contingent Resources are based on Glencore estimates and have been prepared in accordance with PRMS.
Cameroon: Glencore holds 100% WI of the Bolongo license. Development studies are currently underway on the Bolongo licence and as such there are no reserves currently attributable to the licence. Contingent resources are based on Glencore estimates and have been prepared in accordance with PRMS.
Glencore has agreed to assign its entire interest in the Matanda Block to Gaz du Cameroun Matanda S.A. Subject to government formalities, the effective date of the transfer will be backdated to March 2016 and as such there are no reserves or contingent resources attributable to the licence.