resource the pluripotent regulatory circuitry connecting ... res... · the pluripotent regulatory...
TRANSCRIPT
The pluripotent regulatory circuitry connectingpromoters to their long-range interacting elements
Stefan Schoenfelder,1,9 Mayra Furlan-Magaril,1,9 Borbala Mifsud,2,3,9
Filipe Tavares-Cadete,2,3,9 Robert Sugar,3,4 Biola-Maria Javierre,1 Takashi Nagano,1
Yulia Katsman,5 Moorthy Sakthidevi,5 Steven W. Wingett,1,6 Emilia Dimitrova,1
Andrew Dimond,1 Lucas B. Edelman,1 Sarah Elderkin,1 Kristina Tabbada,1
Elodie Darbo,2,3 Simon Andrews,6 Bram Herman,7 Andy Higgs,7 Emily LeProust,7
Cameron S. Osborne,1 Jennifer A. Mitchell,5 Nicholas M. Luscombe,2,3,8
and Peter Fraser11Nuclear Dynamics Programme, The Babraham Institute, Babraham Research Campus, Cambridge CB22 3AT, United Kingdom;2University College London, UCL Genetics Institute, Department of Genetics, Evolution and Environment, University College London,London WC1E 6BT, United Kingdom; 3Cancer Research UK London Research Institute, London WC2A 3LY, United Kingdom; 4EMBLEuropean Bioinformatics Institute, Wellcome Trust Genome Campus, Hinxton, Cambridge CB10 1SD, United Kingdom; 5Departmentof Cell and Systems Biology, University of Toronto, Toronto, Ontario M5S 3G5, Canada; 6Bioinformatics Group, The BabrahamInstitute, Babraham Research Campus, Cambridge CB22 3AT, United Kingdom; 7Agilent Technologies, Inc., Santa Clara, California95051, USA; 8Okinawa Institute for Science and Technology Graduate University, 1919-1 Tancha, Onna-son, Kunigami-gun,Okinawa 904-0495, Japan
The mammalian genome harbors up to one million regulatory elements often located at great distances from their target
genes. Long-range elements control genes through physical contact with promoters and can be recognized by the presence
of specific histone modifications and transcription factor binding. Linking regulatory elements to specific promoters ge-
nome-wide is currently impeded by the limited resolution of high-throughput chromatin interaction assays. Here we apply
a sequence capture approach to enrich Hi-C libraries for >22,000 annotated mouse promoters to identify statistically sig-
nificant, long-range interactions at restriction fragment resolution, assigning long-range interacting elements to their target
genes genome-wide in embryonic stem cells and fetal liver cells. The distal sites contacting active genes are enriched in active
histone modifications and transcription factor occupancy, whereas inactive genes contact distal sites with repressive histone
marks, demonstrating the regulatory potential of the distal elements identified. Furthermore, we find that coregulated genes
cluster nonrandomly in spatial interaction networks correlated with their biological function and expression level.
Interestingly, we find the strongest gene clustering in ES cells between transcription factor genes that control key develop-
mental processes in embryogenesis. The results provide the first genome-wide catalog linking gene promoters to their long-
range interacting elements and highlight the complex spatial regulatory circuitry controlling mammalian gene expression.
[Supplemental material is available for this article.]
Mammalian development and cell identity critically depend onthe function of regulatory DNA elements (such as enhancers, si-lencers, and insulators) to establish spatiotemporal gene expres-sion programs. Although recent advances in next generationsequencing have enabled the large-scale identification of regulato-ry DNA elements in mammalian genomes, which genes they reg-ulate remains largely unknown. Distant genomic regions can bebrought into close spatial proximity through specific chromosom-al interactions that play a key role in gene expression control(Bulger andGroudine 2011). For example, developmental enhanc-ers can be located at considerable genomic distances from the gene
promoters they regulate, often bypassing several promoters locat-ed in the intervening DNA sequence to interact with their targetgenes (Carvajal et al. 2001; Carter et al. 2002; Spitz et al. 2003;Sagai et al. 2005; Jeong et al. 2006; Pennacchio et al. 2006; Rufet al. 2011; Marinic et al. 2013). These findings challenge the con-cept of inferring regulatory interactions from genomic proximity,which underlies the widely used strategy to assign enhancers tothe nearest gene promoter. An alternative strategy is to link pro-moters with enhancers based on capturing their physical contacts,because direct interactions between enhancers and promoters arecentral to the dominant models for enhancer function (Bulgerand Groudine 2011). In strong support of these models, ex-perimental tethering between an enhancer and its target genecan induce gene transcription even in the absence of a key tran-scriptional activator (Deng et al. 2012). A major task toward
9These authors contributed equally to this work.Corresponding authors: [email protected], [email protected] published online before print. Article, supplemental material, and publi-cation date are at http://www.genome.org/cgi/doi/10.1101/gr.185272.114.Freely available online through the Genome Research Open Access option.
© 2015 Schoenfelder et al. This article, published in Genome Research, is avail-able under a Creative Commons License (Attribution 4.0 International), as de-scribed at http://creativecommons.org/licenses/by/4.0.
Resource
582 Genome Research 25:582–597 Published by Cold Spring Harbor Laboratory Press; ISSN 1088-9051/15; www.genome.orgwww.genome.org
Cold Spring Harbor Laboratory Press on September 20, 2016 - Published by genome.cshlp.orgDownloaded from

unraveling gene expression circuitry is to link, on a genome-widescale, regulatory sequences to the gene promoters they control.
Preferential chromosomal organization is not confined tocontacts between genes and regulatory elements. Intra- and inter-chromosomal associations between genes have been detected ina range of nuclear processes, including gene activation (Osborneet al. 2004, 2007; Spilianakis et al. 2005; Apostolou and Thanos2008), gene silencing (Bantignies et al. 2011; Engreitz et al.2013), and recombination (Skok et al. 2007; Zhang et al. 2012).Spatial coassociations have also been observed between coregu-lated genes (Schoenfelder et al. 2010; Apostolou et al. 2013; deWit et al. 2013; Denholtz et al. 2013). These findings suggestthat spatial proximity between specific genomic elements, in addi-tion to shaping 3D genome architecture, may influence genomefunction (Fanucchi et al. 2013).
The 3C technique (Dekker et al. 2002) and its derivatives haverevolutionized the study of 3D genome organization by providingthe means to capture spatial proximity between genomic regions.Variations of 3C have focused on interactions for a small numberof genomic bait regions (4C) (Simonis et al. 2006; Zhao et al. 2006;van de Werken et al. 2012), interactions within specific genomicdomains (5C) (Dostie et al. 2006; Sanyal et al. 2012), or involvinga particular protein of interest (ChIA-PET) (Fullwood et al. 2009;Handoko et al. 2011; Zhang et al. 2013). Hi-C, a genome-wide ad-aptation of 3C (Lieberman-Aiden et al. 2009), has the potential tocapture the ensemble of chromosomal interactions within a cellpopulation. However, the vast complexity of mammalian 3C orHi-C libraries (estimated to contain up to 1011 unique pair-wise in-teractions) (Belton et al. 2012) impedes their analysis at a resolu-tion required to identify interactions between specific elements,such as promoters and enhancers. To overcome this limitation,we and others have incorporated a sequence capture step to enrich3C (Hughes et al. 2014) or Hi-C (Dryden et al. 2014) libraries forchromosomal interactions involving a few hundred specific baitregions. These studies demonstrate the feasibility of capturingspecific interactions in 3C/Hi-C libraries, but a genome-wide ap-proach enabling the systematic, unbiased, and high-resolution in-terrogation of chromosomal interactions for tens of thousands ofgenomic elements simultaneously, independent of their activityor bound proteins, is currently lacking.
Here we combine Hi-C with sequence capture enrichment(CHi-C for Capture Hi-C) for 22,225 annotated gene promotersin themouse genome.We apply promoter CHi-C tomouse embry-onic stem cells (ESCs) and mouse fetal liver cells (FLCs), creatingthe first genome-wide map of interaction profiles for all anno-tated mouse gene promoters in pluripotent and committed/differ-entiated cells.
Results
Promoter capture Hi-C
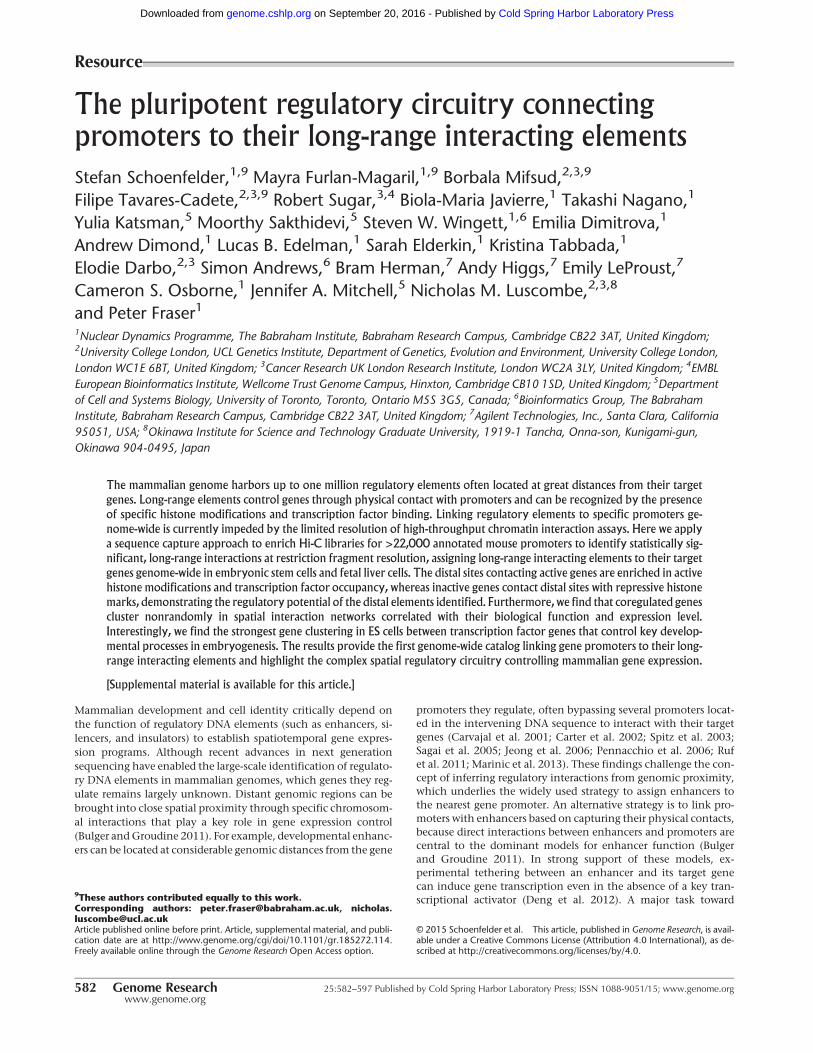
To generate chromosomal interaction maps for all annotated pro-moters in the mouse genome, highly complex Hi-C libraries weresubjected to solution hybrid capture with a custom-designedcollection of 39,021 biotinylated RNA “baits” targeting 22,225annotated promoter-containing restriction fragments (Fig. 1A;Supplemental Table 1). We generated two promoter CHi-C biolog-ical replicates for both ESCs and FLCs and sequenced them to highdepth. In total, we analyzed more than 1.9 billion CHi-C paired-end sequence reads (ditags), which were reduced to 754 millionuniquely mapped ditags after data filtering (HiCUP Hi-C analysispipeline) (see Methods). Promoter bait coverage was highly corre-
lated between the two biological promoter CHi-C replicates(Spearman correlation r = 0.91 for ESC and r = 0.95 for FLC).Sequence capture efficiencies, defined as the percentage of ditagswith at least one end mapping to a targeted promoter, were71.1% for ESC and 65.6% for FLC, in line with previously reportedsequence capture approaches (Gnirke et al. 2009).We removed off-target and exact sequence duplicate read pairs from our data(Supplemental Table 2), since control barcoding experiments dem-onstrated that exact duplicates arise from preferential PCR ampli-fication rather than independent ligation events (SW Wingett,S Schoenfelder, M Furlan-Magaril, T Nagano, P Fraser, S Andrews,in prep.). Compared to our precapture Hi-C libraries, and to previ-ously published Hi-C libraries (Dixon et al. 2012), promoter CHi-Cresulted in >10-fold enrichment of read-pairs involving promoterelements (Fig. 1B; Supplemental Fig. 1A,B).
Capturing promoter fragments markedly enriches their inter-acting fragments, thus reducing the overall library complexitycompared to a corresponding precapture Hi-C library. In order toobtain an equivalent number of promoter reads, a Hi-C librarywould need to be sequenced up to 19-fold greater depth. Withthis increased power, promoter CHi-C enables the identificationof statistically significant promoter interactions at the restriction-fragment level. To this end, we developed an interaction-calling al-gorithm called GOTHiC (Genome Organisation Through Hi-C)(B Mifsud, I Martincorena, E Darbo, R Sugar, S Schoenfelder, PFraser, NM Luscombe, in prep.). GOTHiC accounts for biases inHi-C experiments by considering that these will be representedby the total coverage of the interacting fragments. Using the frag-ment coverage, GOTHiC uses a cumulative binomial test to cal-culate the probability of having two fragments linked by theobserved number of reads. P-values are corrected for multiple test-ing with the Benjamini-Hochberg procedure (Benjamini andHochberg 1995), and significant interactions are called using anFDR < 0.05. We focused on promoter interactions that were pre-sent in both replicates and further filtered the significant interac-tion set by interaction strength (see Methods). Promoter CHi-Cresults in two types of paired-end sequence reads: read-pairs inwhich one end maps to a promoter fragment and the othermaps to a nonpromoter fragment (promoter–genome contacts)(Fig. 1C); and read-pairs in which both endsmap to promoter frag-ments (promoter–promoter contacts) (Fig. 1D). Because these twoclasses of ditags potentially represent different types of interac-tions, we analyzed them separately.
GOTHiC detected 317,271 genomic fragments engaged in548,551 significant, reproducible interactions with 21,748 pro-moters in ESCs. In FLCs, we detected 311,475 genomic fragmentsinvolved in 615,186 significant, reproducible long-range interac-tions with 21,431 promoters (Fig. 1C). In both cell types, >99.9%of the significant promoter–genome contacts were between pro-moters and elements located on the same chromosome. The ma-jority of promoter–genome interactions (59%) were unique toeither ESCs or FLCs, indicating strong tissue-specific promoterinteractomes. GOTHiC also detected 477,682 and 699,749 signifi-cant promoter–promoter contacts in ESCs and FLCs, respectively(Fig. 1D). More than 73% of these contacts were unique to eitherESCs or FLCs, demonstrating robust tissue-specific 3D genomeorganization of promoters. At the chromosomal level, Hi-C andCHi-C contact maps provide a similar coarse-grained view of3D genome topology (Fig. 2A). However, in contrast to Hi-C, pro-moter CHi-C enables the identification of statistically significantlong-range promoter interactions at the restriction fragment level(Fig. 2A).
Genome-wide capture of promoter interactions
Genome Research 583www.genome.org
Cold Spring Harbor Laboratory Press on September 20, 2016 - Published by genome.cshlp.orgDownloaded from
91190000 91230000 91910000 91950000
Nod2Cyld Sall1
2 20
2 20
2 55
ESC Hi-C
ESC Hi-C Sall1 promoter reads
ESC Promoter CHi-C Sall1 reads
91,310,000 91,390,000 91,470,000 91,550,000 91,630,000 91,710,000 91,790,000 91,870,000Chr. 8
A
B
B
B
B
B
B
B
B
B
B
B
B
B
B
B
B
B
B
B
B
B
B
B
B
B
B
B
4
5b
B
B
B
B
B
B
B B
Restriction digestBiotin fill-in
LigationCrosslink reversal
Sonication, end repair
Streptavidin pulldown
CHi-C hybridization
Streptavidinpulldown
Adapter ligationPCR (6-8 cycles)
PCR (4 cycles)
Size selection, A tailing
Paired-end NGS Hi-C
5a
1 2 3
7 6
Paired-end NGS Promoter CHi-C
8
Bait capture library(39,021 baits)
D
FLC ESC FLC ESC
CPromoter-genome interactions Promoter-promoter interactions
230,151452,218 247,531211,516278,151 337,035
Figure 1. Promoter capture Hi-C. (A) Experimental strategy: Hi-C libraries were either directly interrogated by massively parallel paired-end sequencing(step 5a) or subjected to promoter CHi-C (steps 5b–8). For promoter CHi-C, the Hi-C library is hybridized to the RNA capture library (“bait”) in solution,followed by streptavidin pulldown of Hi-C library ligation products containing promoters targeted by the biotin-RNA baits (22,225 promoters in themousegenome). The resulting promoter CHi-C library is analyzed bymassively parallel paired-end sequencing. Chromosomal regions are depicted in blue, green,gray, orange, and yellow; promoters are depicted in red; and sequencing adapters in light blue. Biotin moieties are symbolized by an encircled “B,” andformaldehyde crosslinks are represented by purple crosses. RNA bait molecules are represented by red fragments connected to a biotin moiety. (B) Thechromosomal interactome of the Sall1 locus in ESCs. Shown are unfiltered read pairs from Hi-C data for a 0.6-Mb region containing the Sall1 gene(top), Sall1 promoter-contacting read pairs from the same Hi-C data (middle), and Sall1 promoter-contacting read pairs from promoter CHi-C (lower).Hi-C and CHi-C data sets were adjusted to the same number of overall sequence reads. Interactions are displayed using the WashU EpiGenomeBrowser (Zhou et al. 2013). (C) Unique and shared promoter–genome significant interactions after GOTHiC filtering in ESCs and FLCs. (D) Unique andshared promoter–promoter significant interactions after GOTHiC filtering in ESCs and FLCs.
Schoenfelder et al.
584 Genome Researchwww.genome.org
Cold Spring Harbor Laboratory Press on September 20, 2016 - Published by genome.cshlp.orgDownloaded from

B
C
DNA FISH ESC
DNA FISH FLC
Hist1h
3e
Hist1h
3e
C- C- 0
5
10
15
20
25 Hist1h2ae
FLC
ESC
A
50048.5 Mb 500 Kb 100 Kb
Chromosome 17 36 Mb35 MbChromosome 170 Mb 97 Mb
Chr
omos
ome
17
Chromosome 1735.61 Mb 35.81 Mb
CHi-C
Hi-C
CHi-C
Hi-C
CHi-C
Hi-C
-log10(q-value)
Hist1h2ae
Hist1h
4i Hist
1h4i C- C-
0
2
4
6
Rel
. cro
sslin
king
freq
uenc
ies
Rel
. cro
sslin
king
freq
uenc
ies
Chr. 13
Rel
. cro
sslin
king
freq
uenc
ies
Fev0
01
Fev0
01
Wnt6 Wnt6
C- C- 0
5
10
15
20
25
30
Mir375
Mir3
75
C- C- 0
0.5
1
1.5
2
2.5
Rel
. cro
sslin
king
freq
uenc
ies
Alleles
Dis
tanc
e m
00
1
2
3
100 200 300 400
77%
23%
Hist1h4h to Hist1h2aiHist1h4h to Vmn1r
DNA FISH FLC
Hist1h4h to Hist1h2aiHist1h4h to Vmn1r
Alleles0
0
1
2
3
100 200 300
Dis
tanc
e m
63%
37%
DNA FISH ESC
22.5 Mb 23 Mb 23.5 Mb22 Mb
Hist1h4hVmn1rHist1h2ai
Chr.13
CHi-C ESC
CHi-C FLC
Enrichmentp < 0.0001
p < 0.0001
D
F
E
G
Hist1h4i Hist1h3e Hist1h2ae
100kb * * * *
C-
* * * *
C- Mir375 Wnt6 Fev001
Tesc
Tesc
C- C- 0
5
10
15
20
25 Tbx5
Rel
. cro
sslin
king
freq
uenc
ies
Tbx3
Tbx3
C- C- 0
1
2
3
4
5 Tbx5
Rel
. cro
sslin
king
freq
uenc
ies
Tbx5
Lhx5
Lhx5
C- C- 0
10
20
30
40
Rel
. cro
sslin
king
freq
uenc
ies
Chr. 1
C- Lhx5 Tbx5 Tbx3 Tesc
* * * * * 100kb Chr. 5 100kb
Mtnr1a
Enh.
Enh.
C- C- 0
0.5
1
1.5
2
Rel
. cro
sslin
king
freq
uenc
ies
Enh. Mtnr1a C-
100kb * * *
Chr. 8
Slc25a37
C- C- 0
0.5
1
1.5
Rel
. cro
sslin
king
freq
uenc
ies
Slc25a37 C- Loxl2
100kb * * *
Chr. 14
Ermap
Enh.
Enh.
C- C- 0
5
10
15
Rel
. cro
sslin
king
freq
uenc
ies
Enh. C-
* * *
Ermap
100kb Chr. 4
Bcl6
Enh.
Enh.
C- C- 0
0.5
1
1.5
2
Rel
. cro
sslin
king
freq
uenc
ies
Enh. C- Bcl6
100kb * * *
Chr. 16
Hist1h4h Vmn1r
Hist1h2ai
Hist1h4h Vmn1r
Hist1h2ai
0.0
2.5
5.0
7.5
Loxl2
Loxl2
Figure 2. (Legend on next page)
Genome-wide capture of promoter interactions
Genome Research 585www.genome.org
Cold Spring Harbor Laboratory Press on September 20, 2016 - Published by genome.cshlp.orgDownloaded from
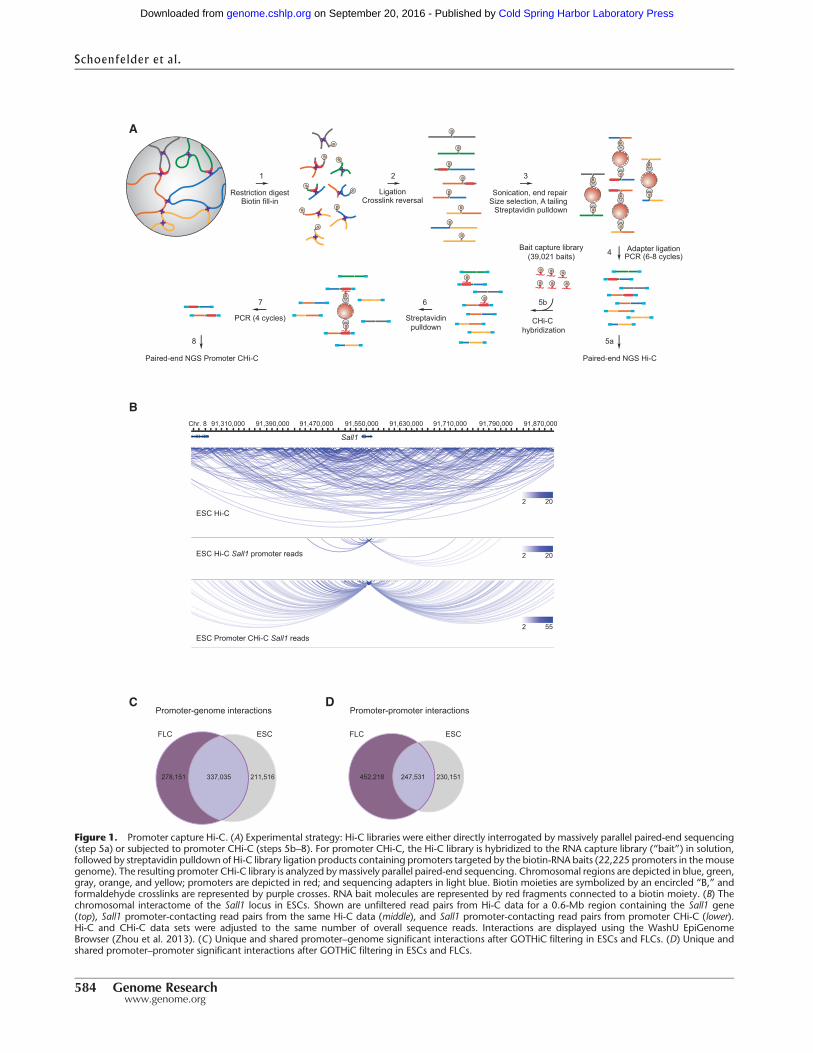
To validate promoter capture Hi-C, we compared our data setsto published 3C and 4C data. ESC-specific long-range interactionsinvolving the Phc1 (Kagey et al. 2010) and Nanog (Levasseur et al.2008) genes were recapitulated in our data (Supplemental Fig. 1C,D), as was an interaction between Pou5f1 and a putative enhancerelement (Supplemental Fig. 1E; van de Werken et al. 2012).Similarly, known erythroid cell-specific enhancer–promoter inter-actions in the Hbb (Mitchell and Fraser 2008) and Hba (Vernim-men et al. 2007) gene loci were accurately detected in FLCs(Supplemental Fig. 1F,G).
The promoter-interacting regions identified by promoterCHi-C include regulatory elements that are required for appropri-ate expression of their target genes, such as enhancers controllingHba (Supplemental Fig. 1F; Anguita et al. 2002), Hbb (Supplemen-tal Fig. 1G; Bender et al. 2001, 2012), Sox2 (Zhou et al. 2014; datanot shown), andTal1 transcription (Supplemental Fig. 1H; Ferreiraet al. 2013). These examples indicate that CHi-C uncovers func-tional chromosomal interactions and illustrate the potential ofpromoter CHi-C to link gene promoters to the regulatory elementscontrolling their expression.
We further validated a subset of shared and tissue-specific pro-moter–genomeandpromoter–promoter interactions usingquanti-tative 3C (3C-qPCR). In all cases tested, we detected higher 3Cinteraction frequencies for contacting genomic fragments identi-fied by promoter CHi-C in the appropriate tissue than for moreproximally located noninteracting regions (Fig. 2B). Finally, tovalidate promoter CHi-C by an independent method, we assessedselected long-range contacts by triple-label 3D DNA FISH (Supple-mental Fig. 2; Fig. 2C–G). The results show that contacting regionsseparated by multiple megabases are more frequently in close spa-tial proximity than intervening control regions in the appropri-ate cell types. Collectively, the comparison to published dataand validation by 3C and 3D DNA FISH demonstrate that pro-moter CHi-C accurately identifies promoter-interacting, long-range chromosomal elements and multiscale, tissue-specific ge-nome architecture.
Promoter–genome interactomes
To obtain a generalized view of the genomic range of promoter in-teractions, we plotted the average promoter interaction frequencyagainst increasing genomic distance from the promoters (Fig. 3A,B; Supplemental Fig. 3A,B). These profiles confirm the inverse rela-tionship between genomic distance and interaction frequencythat has previously been reported in 4C, 5C, and Hi-C data sets(Gibcus and Dekker 2013). We found that active promoters under-
go significantly fewer short-range and more long-range interac-tions than inactive promoters (P-value < 2.2 × 10⁻¹⁶; Ansari-test),suggesting that the activity of a gene promoter is linked to therange of its chromosomal interactome (Fig. 3A,B; SupplementalFig. 3A,B). Increasing gene expression is positively correlatedwith the number of promoter interactions in FLCs, but less so inESCs (Spearman correlation) (Fig. 3C); whereas the average num-ber of interactions per promoter is comparable in both cell types(Supplemental Fig. 3C). Promoter-interacting fragments in bothcell types show a higher sequence conservation compared to allnonbait fragments (P-value < 2 × 10⁻¹⁶) (Supplemental Fig. 3D).We found that interactions between promoters and intragenicsequences are more prevalent than interactions with intergenic re-gions and that this preference increases with promoter expressionlevel (Spearman correlation) (Fig. 3D; Supplemental Fig. 3E). Thismay reflect the fact that regulatory elements can be located withingenes they control, or indeed within neighboring or distal genes.
Epigenetic modifications at distal interacting sites
To assess the regulatory potential of promoter–genome interact-ing sites, we integrated our promoter CHi-C data with publishedepigenome data sets. In total, we examined data for 10 differenthistone modifications, DNase I hypersensitivity, and low andunmethylated DNA regions (Supplemental Table 3). We foundhigh levels of enrichment of active histone marks (H3K4me1,H3K4me2, H3K4me3, H3K9ac, H3K27ac, H3K36me3) at distalpromoter-interacting sites that correlated with promoter expres-sion level in ESCs and FLCs (Fig. 3E; Supplemental Fig. 3F). Pro-moters of highly expressed genes interact with regions that arehighly enriched for “active” histone marks, whereas regions inter-acting with moderately expressed genes show a less pronouncedenrichment. Promoters of weakly expressed and silent genes inter-act with regions that are depleted for active histonemarks (Fig. 3E).In contrast, the repressive histone mark H3K27me3 is enriched atregions interacting with promoters of poorly expressed genes (Fig.3E; Supplemental Fig. 3F). These results suggest that the promoter-interacting sites identified show marks of regulatory potential ap-propriate to the activity level of the genes they contact.
Trans-acting factor occupancy in promoter-interacting regions
We further characterized promoter-interacting regions in ESCsand FLCs by assessing trans-acting factor occupancy (Supple-mental Table 3). In total, almost 43% (135,944/317,271) of thepromoter-interacting fragments uncovered by promoter CHi-C
Figure 2. Validation of promoter interactions. (A) Hi-C and promoter CHi-C contact maps after GOTHiC filtering for significant interactions: whole chro-mosome viewofmouse Chromosome 17 (left), and 1-Mb (middle) and 200-kb subregions (right) encompassing the Pou5f1 gene locus. Individual promoterbait restriction fragments aremarked by light blue dots in the right panel. Color intensity corresponds to the significance of the interaction, −log10(q-value)fromGOTHiC. (B) Validation of CHi-C results by 3C-qPCR. Graphs showing the relative crosslinking frequencies of promoter restriction fragments (top) withanother promoter, putative enhancer (Enh) or control, noninteracting fragments (C-), as depicted in the graphs and themaps below. Interactions identifiedby promoter CHi-C present in both cell types (Hist1h2ae), preferential in ESCs (Wnt6, Tbx5, Mtnr1a, Bcl6), or preferential in FLCs (Ermap, Slc25a37) areshown. Control fragments (C-) were identified as noninteracting, or interacting at lower frequencies by CHi-C, compared to the interacting fragmentsin the respective cell type. Asterisks denote the position of the primers used in 3C-qPCR. (C–G) Validation of CHi-C results by triple-label 3D DNA FISH.(C ) Promoter CHi-C contact maps for a ∼2-Mb region on mouse Chromosome 13 in ESCs (top) and FLCs (below), encompassing the Hist1h2ai, Vmn1r,and Hist1h4h loci as shown. Contact enrichment between Hist1h4h and Vmn1r loci are marked by blue squares on the contact maps, and contact enrich-ment between Hist1h4h and Hist1h2ai are marked by red squares. (D) and (F) Representative triple-label 3D DNA FISH in ESCs (D) and FLCs (F ), DNA FISHsignals for the Hist1h2ai locus (green), the Vmn1r locus (purple), and the Hist1h4h locus (red). Scale bar, 2 μm. (E) and (G) Interprobe distance measure-ments of triple-label 3D DNA FISH in ESCs (E) and FLCs (G). Shown are the ranked interprobe distances between Hist1h4h and Hist1h2ai (red line) with thecorresponding interprobe distance between Hist1h4h and Vmn1r (blue dots) per allele. Percentages above the red line indicate the frequency at which thedistance between Vmn1r and Hist1h4h is greater than the distance between Hist1h2ai and Hist1h4h, whereas percentages below the line indicate the fre-quency at which the distance between Vmn1r and Hist1h4h is less than the distance between Hist1h2ai and Hist1h4h. P-values: χ2 test comparing the dis-tance distributions between Vmn1r and Hist1h4h to the distance between Hist1h2ai and Hist1h4h.
Schoenfelder et al.
586 Genome Researchwww.genome.org
Cold Spring Harbor Laboratory Press on September 20, 2016 - Published by genome.cshlp.orgDownloaded from

A
C
E
D
B
Promoter-interacting regions in ESC
Expression0
25
50
75
100
Per
cent
age
of in
tera
ctio
ns
Promoter
Intergenic
Genome (% of non-bait fragments)
Num
ber o
f int
erac
tions
in d
ista
nce
bin
/ nu
mbe
r of i
nter
actio
ns
0
Genomic distance (kb)
0.04
0.03
0.02
0.01
0-50-100-150 +50 +100 +150
Inactive promoterActive promoter
-
H3K4m
e1
H3K4m
e3
H3K27
ac
H3K27
me3
H3K9m
e3
H3K4m
e2
H3K36
me3
H3K9a
cNot expressed
all
ExpressionEnrichment
H3K79
me2
J
1000
4000
2000
0
Num
ber o
f pro
mot
ers
Interacting enhancers per promoter in ESC
3000
1 2 3
H
0 4 5 6 7 8 9 10 >10
Expression
Not expressed
Inactive promoter in ESCActive promoter in ESC
-
Inte
ract
ions
per
pro
mot
er
50
0
100
ESC FLC
Expression -
ESCFLCI
Promoters contacting>10 enhancers
LMRUMR
DNase I
HS
RNAPII
CTCF
SMC1ASMC3
SOX2
SMAD1
NANOG
POU5F1
E2F1
TFCP2L1
ZFXSTA
T3
MYCNNIP
BLKLF
4MYC
MED1
EP300
MED12ELL
3
Enrichment
F
Not expressed
all
Expression
Chromatin states in ESCs
Insula
tor
Promote
r-like
Enhan
cer
Elonga
tion
Empty
Repres
sive
H3K27
me3 +
H3K9a
c
Enrichment
G
Not expressed
all
Expression
Promoter interactions with enhancers
% o
f pro
mot
ers
% of interaction conservation
0
10
20
30
0 20 40 60 80 100
ESC
K
+100Genomic distance (kb)
-100 0
●●
● ● ●●
●●
●●
●
●
●
●
●●●●●●
●
●●
●●
●
●●
●●
●●
●
●●●
●●
●●
●●●●
●
●
●●
●
●
●
●
●●
●●
●
●●●
●●●
●
●
●
●●
●
●
●
●●
●
●
●●●●
●●
●●●●●
●
●
●●●
●●●
●
●
●
●
●
●●●●●
●●
●●●●●●
●
●
●●●●
●
●
●
●●●
●●●
●
●
●●
●
●●
●
●
●
●
●
●●
●
●
●
●●●
●
●
●
●●
●
●
●
●
●
●●
●
●
●●
●
●
●
●
●
●
●●
●
●
●●●
●
●
●
●
●●
●
●
●●
●●
●
●●
●●
●
●●●
●●
●●
●
●
●●
●
●
●
●
●
●
●
●
●●●
●
●
●●
●●
●
●
●
●●
●
●
● ●●
●
●
●
●
●●
●●
●
●
●●
●
●
●
●
●●●
●●
●●●
●
●●
●●
●
●
●
●●●●
●
●●
●
●●●
●
●●
●
●
●
●●
●●
●
●
●
●
●
●●
●
●
●
●
●
●
●
●
●
●
●
●
●●
●
●
●
●●
●
●
●
●
●
●
●●
●●●
●
●
●●
●
●
●
●●
●
●
●
●
●●●●
●●●
●
●
●
●
●●
●
●●
●●
●●
● ●
●
●
●●●●
●
●
●●
●
●
●
●●
●
●
●●●
●
●
●
●●
●●
●●●
●●●●
●
●●●
●
●
●
●●
●
●
●
●
●●
●
●
●
●●●
●
●
●
●●●
●
●●
●●
●
●
●●●●
●●
●
●●
●
●
●
●
●
●●
●
●
●●
●
●●●
●
●
●
●●
●
●
●●●●
●●●
●
●
●
●
●
●●
●
●
●●
●
●●
●
●●●●●
●
●●
●
●●
●●
●
●●
●
●
●
●●●
−2−1012
-1
0
1
-2-1012
5000 13222751 1237
132730000 132850000 132970000 133090000 133210000 133330000 133450000 133540000
Gstcd qG3
H3K27acH3K4me1
H3K27me3EP300
Enhancers
CHi-C ESC
Chr.3Ints12 Arhgef38 Ppa2 Tet2
Intragenic
Figure 3. Hallmarks of promoter-interacting regions. (A) Composite profile showing the proportion of promoter–genome interactions for 5-kb distancebins upstream of and downstream from the transcription start sites for active (red) and inactive (blue) promoters in ESCs. (B) Genomic range of interactionsfor active (red) and inactive (blue) promoters in ESCs. (C) Number of promoter–genome interactions in ESCs and FLCs, separated by expression categories.(D) Intra- and intergenic distribution of promoter-interacting regions in ESCs, with genes driven by the promoters separated in expression categories(HindIII fragments encompassing exonic or intronic sequences are classed as “intragenic” here). The distribution of intragenic and intergenic sequencesin themouse genome is shown on the right. (E–G) Heat maps showing the enrichment/depletion for histonemodifications (E), chromatin proteins (F ), andchromatin states (G) in promoter-interacting regions in ESCs, for all promoters and separated by expression of the interacting promoters, compared tononbait regions. (UMR) Unmethylated region; (LMR) low-methylated region (Stadler et al. 2011). (H) Number of promoters from each expression categoryinteracting with between zero and more than 10 genomic elements with the hallmarks of enhancers in ESCs. (I) Unique and overlapping promoters in-teracting with multiple (>10) enhancer-like elements in ESCs and FLCs. (J) Example of a promoter (driving the Tet2 gene) contacting multiple enhancersin ESCs. (K ) Conservation of promoter–enhancer contacts between ESCs and FLCs. Shown is the percentage of promoters that share 0%, 10%, 20%, etc.,of their interactions with enhancer-like elements. Only enhancers active in both cell types (ESC and FLC) have been included in the analyses.
Genome-wide capture of promoter interactions
Genome Research 587www.genome.org
Cold Spring Harbor Laboratory Press on September 20, 2016 - Published by genome.cshlp.orgDownloaded from

in ESCs harbor at least one of the chromatinmarks analyzed, indic-ative of potential biological function (Supplemental Table 4). Ingeneral, we found high levels of enrichment of various transcrip-tional regulatory factors occupying regions interacting with mod-erately to highly expressed gene promoters (Fig. 3F; SupplementalFig. 3G). The same trend is seen in ESCs for the Mediator complex(NIPBL, MED1, MED12), which has been implicated in the es-tablishment and/or maintenance of chromosomal interactions(Kagey et al. 2010; Phillips-Cremins et al. 2013). Binding sites forEP300 and ELL3, two chromatin proteins that mark enhancer se-quences (Chen et al. 2008; Visel et al. 2009; Lin et al. 2013), arealso enriched in genomic regions interacting with expressedgene promoters (Fig. 3F). Genomic regions interactingwithnonex-pressed gene promoters are either not enriched or depleted foroccupancy by these factors. As expected, none of the analyzedchromatin proteins were enriched in promoter-interacting regionswhen randomized ChIP-seq data sets were used (data not shown).
To gain further insight into the features of promoter-inter-acting regions, we defined a set of chromatin states in ESCs, char-acterized by distinct combinations of factor occupancy andhistone modifications (Supplemental Fig. 3H), and analyzed theirenrichment in promoter-interacting regions (Fig. 3G). The chro-matin state results corroborate those obtained with individualChIP-seq data sets (Fig. 3E,F), and show that promoters of ex-pressed genes preferentially interact with chromatin associatedwith transcriptional activation (“Enhancer,” “Promoter-like,”“Elongation”). Conversely, inactive gene promoters preferentiallyassociate with repressive chromatin (Fig. 3G). Collectively, theseresults suggest that the long-range promoter-interacting elementsidentified have strong regulatory potential.
Enhancer–promoter contacts
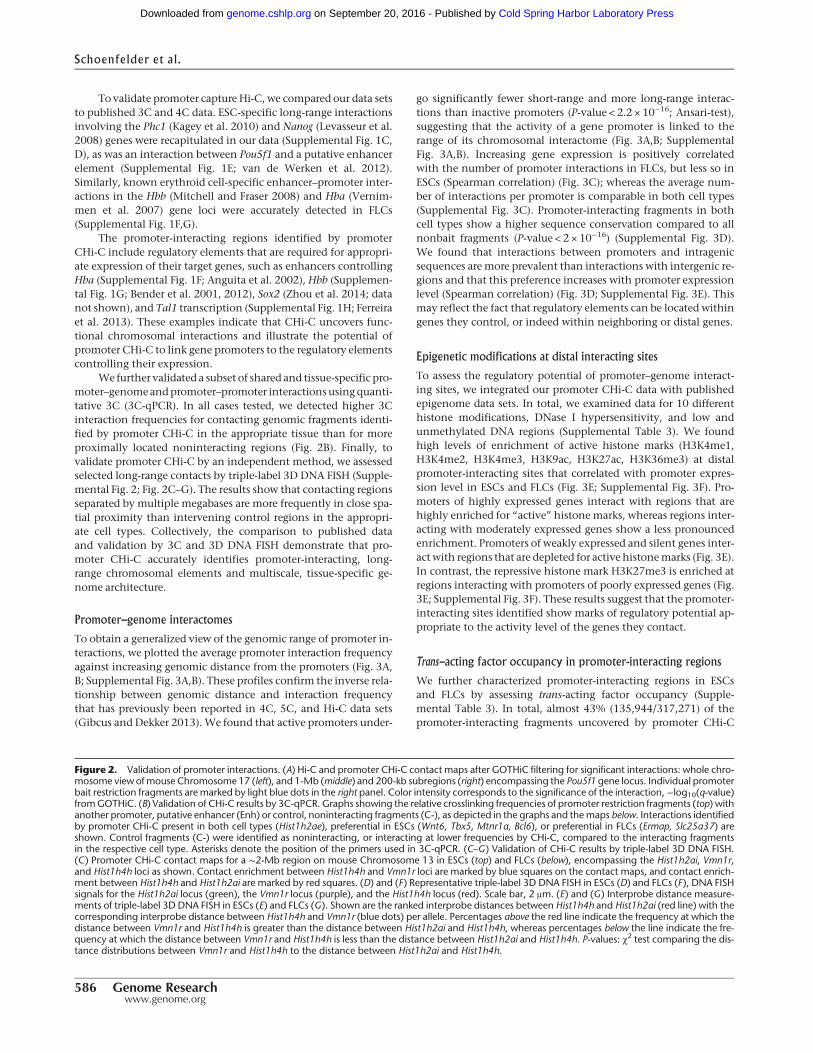
Previous studies have identified transcriptional enhancers in ESCsand FLCs based on specific combinations of chromatin marks,such as H3K4me1, H3K27ac, and EP300 binding (Shen et al.2012). Our results assign more than two-thirds of all such identi-fied enhancers in the cell types analyzed (67.6% in ESCs; 70.3%in FLCs) to potential target genes. The remaining predicted en-hancers may act via mechanisms that do not involve direct pro-moter contact, interact too transiently with their target genes tobe captured, or interact in response to specific signals. Our dataalso show that only about one in five promoter-interacting ele-ments identified (17.7% for ESCs; 19.7% for FLCs) are predictedenhancers (Shen et al. 2012), suggesting that other types of ele-ments may contribute to promoter regulation.
Previous studies have suggested that mammalian genomesharbor more than one million enhancers, far outnumberinggene promoters (The ENCODE Project Consortium 2012; Shenet al. 2012; Calo andWysocka 2013). The extent towhichmultipleenhancers interact with the same target gene, andwhether specificenhancers drive expression of the same target gene in different celltypes, is largely unknown. We found that 26.6% of all promotersanalyzed do not interact with any putative enhancer elements inESCs (Fig. 3H); and as expected, inactive genes are overrepresentedin this category. A total of 39.5%of promoters interact with several(2–10) enhancers, whereas 12.1% of promoters interact with mul-tiple (more than 10) enhancers (Fig. 3H–J). Gene ontology analysisindicates that gene promoters interacting with more than 10 en-hancers specifically in ESCs are enriched in developmental path-ways, whereas genes driven by promoters interacting with morethan 10 enhancers only in FLCs are enriched in metabolic func-
tions (cumulative hypergeometric test with P-values corrected formultiple testing) (Supplemental Fig. 3I,J). In general, we observeda positive correlation between gene expression level and the num-ber of interacting enhancer elements (Spearman correlation; r =0.975 and P = 0.005 for both ESCs and FLCs), suggesting that addi-tive effects of enhancers promote increased expression (Fig. 3H;Supplemental Fig. 3I). Less than half of the enhancers present inESCs are also present in FLCs, and only a minority of these com-mon enhancers are contacted by the same promoters in both celltypes (Fig. 3K; Supplemental Fig. 3K). This finding indicates thatextensive rewiring of enhancer–promoter contacts occurs duringdevelopment.
Highly connected enhancers and super-enhancers
We next asked whether enhancers are contacted by multiple pro-moters. The majority of enhancer-like elements are contacted byone to five promoters (69.1% in ESCs; 69.6% in FLCs), whereasa smaller fraction of highly connected enhancers (2% in ESCs;4.1% in FLCs) are contacted by more than five promoters (Fig.4A,B). The promoters contacting these highly connected (HC) en-hancers show ahigh degree of overlap between ESCs and FLCs (Fig.4C). However, the HC enhancers themselves are largely differentbetween cell types (Fig. 4D; Supplemental Fig. 4A), suggestingthat highly connected enhancers represent a class of tissue-specifichub enhancers that coordinate the expression of multiple genesexpressed in both cell types. The expression levels of genes in-teracting with highly connected enhancers are similar to genescontacting other enhancer elements (Fig. 4E). These characteristicsdistinguish highly connected enhancers from super-enhancers,which differ from “regular” enhancers in both domain size and oc-cupancy of chromatin proteins (Whyte et al. 2013). The 231 super-enhancers identified in murine ESCs are located in the genomicproximity of, and have been proposed to associate with, 210key genes controlling cellular identity (Whyte et al. 2013). Wefound that 142 of these 210 genes interact with super-enhancers.In addition, we found 361 other genes that interact with super-en-hancers, suggesting that super-enhancers control the expression ofconsiderablymore genes than previously appreciated (Supplemen-tal Fig. 4B). Gene ontology analysis (cumulative hypergeometrictest, P-values corrected for multiple testing) of this extendedgene set indicates that super-enhancers contact key genes control-ling cellular identity. Unlike highly connected enhancers, super-enhancers do not contact more promoters than other enhancer el-ements in the genome (Supplemental Fig. 4C), but highly ex-pressed gene promoters are overrepresented among their targets(Fig. 4E). Interestingly, we found that nearly all genes that contactsuper-enhancers in ESCs (98.2%) also associatewith other enhanc-ers, suggesting that super-enhancers act in the context of larger 3Dregulatory networks.
Promoters frequently interact with distal enhancer elements
Enhancer–promoter interactions have been shown to bridge con-siderable genomic distances, looping out intervening DNA and of-ten bypassing other promoters or enhancers that are located closeron the genomic map (Bulger and Groudine 2011). On a genome-wide level however, it is not known how frequently “enhancerskipping” occurs (i.e., how frequently a promoter skips over prox-imal enhancers for interactions with more distal enhancers). Wefound that in ESCs, 66.6% of active promoters interact with thenearest enhancer (Fig. 4F), whereas the remaining active ESC pro-moters interact with a more distal enhancer (4.1%) or bypass at
Schoenfelder et al.
588 Genome Researchwww.genome.org
Cold Spring Harbor Laboratory Press on September 20, 2016 - Published by genome.cshlp.orgDownloaded from
A
F
G
P EEE
12
3
1 Promoter interacts with nearest enhancer
2 Promoter does not interact with nearest enhancer
3 Promoter does not interact with nearest enhancer,skips (at least) one enhancerNot expressed
Expression
Enhan
cer
Non-en
hanc
er
HC enha
ncer
Per
cent
age
of in
tera
ctin
g pr
omot
ers
0
20
40
80
100
Super-
enha
ncer
C
E
ESCFLC
Promoters contacted by highly connected enhancers
60
Highly connected enhancer overlap
ESCFLC
D
ESC FLC
B
9692480 36410223001 2451
12
3
1
2 3
Interacting promoters per enhancer
ESCFLC
5000
10000
15000
20000
0 1 2 3 4 5 >5
Num
ber o
f enh
ance
r fra
gmen
ts
25000
92870000 92910000 92950000 92990000 93030000 93070000 93110000 93150000
Rab17Rab17
Lrrfip1Lrrfip1Lrrfip1
Rbm44Ramp1Ramp1
Ube2f
EP300H3K27me3
CHi-C ESC
H3K27acH3K4me1
Chr. 1
Enhancers
70000000 70080000 70160000 70240000 70320000 70400000 70480000 70560000
Entpd4
Loxl2
R3hcc1Chmp7
Tnfrsf10bRhobtb2
Pebp4
Pebp4
Egr3 Bin3Ccar2
9930012K11Rik
Pdlim2Sorbs3Sorbs3Sorbs3Sorbs3
Ppp3cc
EP300H3K27me3
CHi-C ESC
H3K27acH3K4me1
Chr.14
HC enhancer
Figure 4. Promoter-enhancer 3D circuitry. (A) Number of enhancer elements interacting with between zero and more than five promoters in ESCs andFLCs. (B) Example of highly connected (HC) enhancer (representedbypurple rectangle) contactingmultiple genepromoters in ESCs. (C )Numbers of uniqueand overlapping promoters interacting with highly connected enhancers in ESCs and FLCs. (D) Numbers of unique and overlapping highly connected en-hancers in ESCs and FLCs. (E) Percentage of promoters in the separate expression categories that contact enhancers, highly connected (HC) enhancers, su-per-enhancers, and nonenhancer elements in ESCs. (F) Percentages of active promoters interactingwith the nearest enhancer (on the linear genomicmap),a more distally located enhancer, or skipping (at least) one enhancer in ESCs and FLCs, as illustrated by schematic on the right ([P] promoter; [E] enhancer).(G) Example of an active promoter (Ramp1) bypassing proximal enhancers (red arrows) in ESCs.
Genome-wide capture of promoter interactions
Genome Research 589www.genome.org
Cold Spring Harbor Laboratory Press on September 20, 2016 - Published by genome.cshlp.orgDownloaded from

least one enhancer (29.3%) (Fig. 4F,G). Enhancer skipping is alsofound in FLCs, albeit less prevalent than in ESCs (Fig. 4F;Supplemental Fig. 4D). If we consider individual enhancers andthe location of promoters that contact them, we find that promot-er skipping, from the viewpoint of enhancers, is also observed inESCs and FLCs (Supplemental Fig. 4E). Our results demonstratethat enhancer–promoter contacts cannot be reliably inferredfrom genomic distance, consistent with chromosomal interactiondata from human gene loci (Sanyal et al. 2012). Even in cases inwhich a promoter interacts with the nearest enhancer, 89.9%also interact with at least one more distal enhancer, indicatingthat the complexity of enhancer–promoter interactions is underes-timated in the absence of spatial proximity data.
Long-range interactions and 3D architectural features
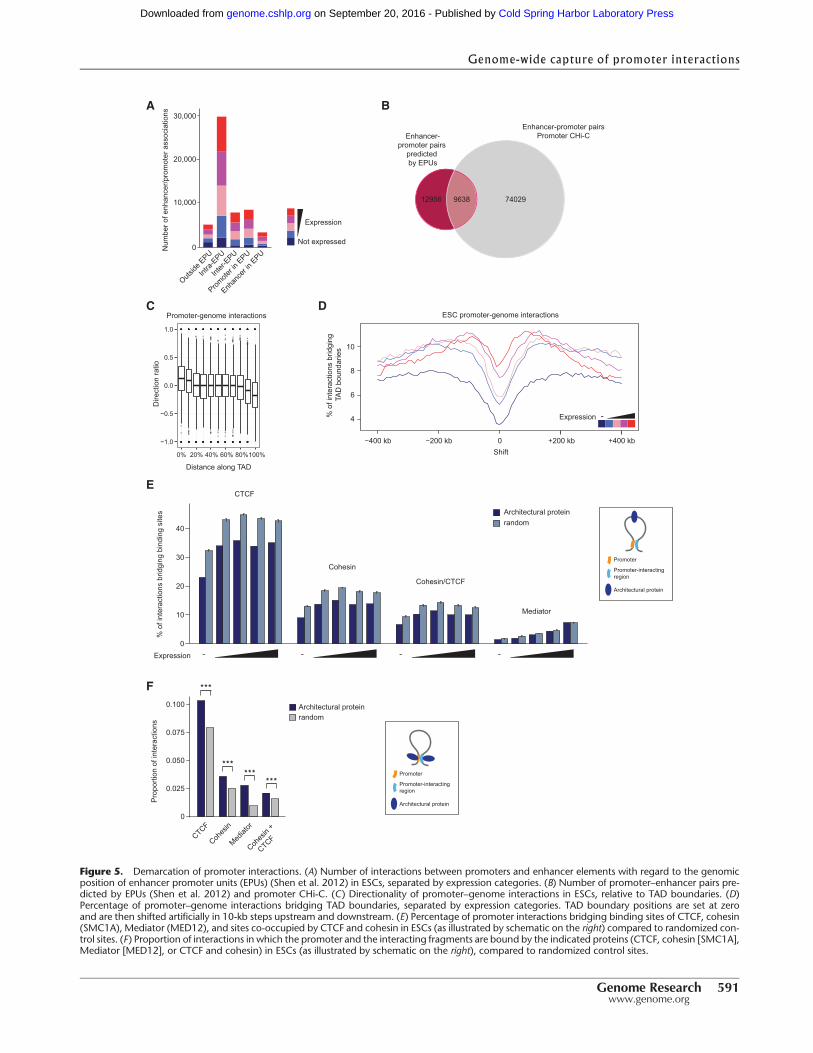
Enhancer–promoter units (EPUs) have recently been defined basedon the observation that coregulated enhancers and promotersform clusters on the linear genomic map (Shen et al. 2012). As ex-pected, we found that the majority (54% in ESCs; 51.7% in FLCs)of enhancer–promoter interactions uncovered by CHi-C werebetween elements within the same EPUs (Fig. 5A; SupplementalFig. 5A). However, we also identified a large number of interactionsin which either the promoter (15.6%), the associating enhancer(6.2%), or both (9.4%) are located outside defined EPUs in ESCs(Fig. 5A; Supplemental Fig. 5A). In total, 42.7% of the 22,594 en-hancer–promoter pairs predicted by EPUs in ESCs (Shen et al.2012) were confirmed by our data (Fig. 5B). In addition, promoterCHi-C discovered 74,029 interactions between promoters and en-hancer elements in ESCs that were not predicted by EPUs (Fig. 5B).
We next asked whether promoter interactions are limited bystructural domains in eukaryotic genomes, suchas topologically as-sociating domains (TADs) (Dixon et al. 2012; Nora et al. 2012;Sexton et al. 2012) or lamina-associated domains (LADs) (Guelenet al. 2008).We found that only aminor fraction of promoter inter-actions occurwithin LADs (15.5%) or cross LADboundaries (4.1%)(Supplemental Fig. 5B), consistent with the notion that LADs aregene-poor (Guelen et al. 2008; Peric-Hupkes et al. 2010). In con-trast, our results show thatmostpromoter–genome interactionsoc-cur within TADs, with only a minority bridging TAD boundaries(6% in ESCs; 9.1% in FLCs) (Supplemental Fig. 5C,D).We observeda marked directionality of promoter–genome interactions with re-gard toTADboundaries (Fig. 5C).Notably, activepromotersdisplaya higher probability for inter-TAD interactions (χ2 test; ESC: X2 =17131.9, P-value < 2.2 × 10⁻¹⁶; FLC: X2 = 19031.01, P-value <2.2 × 10⁻¹⁶) (Supplemental Fig. 5C,D), which may reflect the factthat active genes in general engage in longer-range interactionscompared to inactive genes (Fig. 3A,B; Supplemental Fig. 3A,B).This observation could also be explained by the fact that active pro-moters tend to be located close to TAD boundaries (Dixon et al.2012).Nevertheless,we see clear localminimaof interactions cross-ing TAD boundaries (Fig. 5D) even when only very long-rangeinteractions (>500 kb) are considered (Supplemental Fig. 5E), con-sistent with the concept that TADs represent discrete regulatorydomains.
We next looked for evidence that long-range interactions arehindered by sites bound by architectural proteins such as CTCFand cohesin (Phillips-Cremins et al. 2013). We found that thevast majority of CTCF binding sites genome-wide, including sitesco-occupied by cohesin, are “bridged” by promoter–genome inter-actions (i.e., CTCF binding sites are located in the interveningsequence betweenpromoters and the interacting genomic regions)
(Supplemental Fig. 5F), supporting the idea that CTCF and CTCF/cohesin sites are not general blocks to long-range interactions.However, comparison to randomized controls suggest that CTCFand CTCF/cohesin sites are bridged by significantly fewer interac-tions than other genomic sites, even when CTCF/cohesin sites atTAD boundaries are removed from the analysis (P-values < 2.2 ×10⁻¹⁶) (Fig. 5E). This suggests that CTCF and CTCF/cohesin sitesmay selectively block long-range promoter interactions. We alsofound a significant number of promoter–genome interactions inwhich both fragments (the promoter and the interacting region)are bound by CTCF, cohesin, CTCF/cohesion, or Mediator (Fig.5F), supporting previous findings implicating these factors inlong-range interactions (Hadjur et al. 2009; Mishiro et al. 2009;Nativio et al. 2009; Handoko et al. 2011; Phillips-Cremins et al.2013). The finding that these factors are potentially blockingsome interactions while facilitating others suggests that theymay contribute to the specificity of promoter contacts.
Promoter–promoter 3D interaction networks
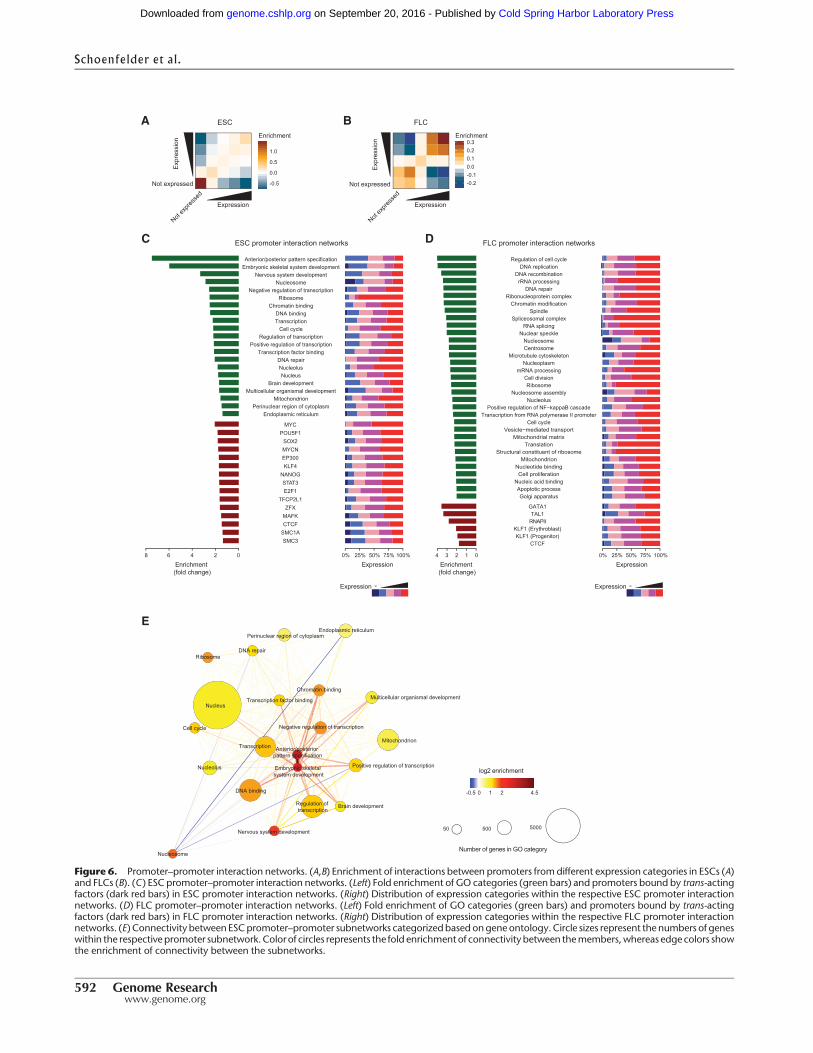
We next used our promoter CHi-C data to interrogate contacts be-tween promoters. Long-range intra- and interchromosomal pro-moter–promoter contacts may represent an additional layer of3D genome organization with potential to influence gene expres-sion (Schoenfelder et al. 2010; Fanucchi et al. 2013). Consistentwith previous results (Lieberman-Aiden et al. 2009), active and in-active promoters are largely spatially segregated, but surprisinglywe found that promoters across the entire expression spectrumpreferentially contact other promoters within the same expressioncategory, especially in FLCs (Fig. 6A,B). That highly expressedgenes contact each other more often could be predicted by thefact that they aremore often at shared transcription sites comparedto medium and poorly expressed genes (Schoenfelder et al. 2010).However, the same rationale would not predict that medium andpoorly expressed genes would preferentially contact medium andpoorly expressed genes, respectively. This nonrandom contact be-tween promoters suggests that the transcriptional output of groupsof spatially associating genes may be coordinated.
To characterize these promoter–promoter networks morethoroughly, we interrogated the connectivity of promoters associ-ated with more than 1000 GO terms covering all major cellularfunctions. To negate potential interaction bias between nearbypromoters, we focused the analysis on long-range (>1 Mb) interac-tions. We found striking differences between ESCs and FLCs, withseveral subnetworks enriched in specific GO categories and con-taining promoters with higher than expected connectivity (Fig.6C,D). The strongest subnetworks present in ESCs (fold change> 6; P-value < 8.9 × 10⁻¹⁷; colocalization analysis) contain genes re-lated to developmental processes, such as anterior/posterior pat-tern specification or embryonic development (Fig. 6C). Thesesubnetworks were not found in FLCs, where instead we foundsubnetworks of genes involved in regulation of cell cycle andDNA replication (Fig. 6D). The majority of genes engaged in pro-moter–promoter networks in FLCs are expressed at moderate tohigh levels (Fig. 6D), whereas the spatially associating develop-mental gene networks in ESCs contain a higher percentage of low-ly expressed genes (Fig. 6C). This finding suggests that poised orprimed developmental genes spatially associate in the pluripotentgenome.
We next analyzed whether promoters occupied by specifictranscription factors are engaged in preferential interactions. Wefound that promoters bound by key transcriptional regulators in
Schoenfelder et al.
590 Genome Researchwww.genome.org
Cold Spring Harbor Laboratory Press on September 20, 2016 - Published by genome.cshlp.orgDownloaded from
A
D
Expression
Not expressed
E
B
Enhancer-promoter pairs
predicted by EPUs
Enhancer-promoter pairsPromoter CHi-C
Shift
% o
f int
erac
tions
brid
ging
TA
D b
ound
arie
s
4
6
8
10
−400 kb −200 kb 0
C
Expression -
20% 40% 60% 80%100%0%
Distance along TAD
Promoter-genome interactions
−1.0
−0.5
0.0
0.5
1.0
Dire
ctio
n ra
tio
+200 kb +400 kb
ESC promoter-genome interactions
F
Architectural proteinrandom
Architectural proteinrandom
10,000
20,000
0Num
ber o
f enh
ance
r/pro
mot
er a
ssoc
iatio
ns 30,000
Outside
EPU
Intra-
EPU
Inter-
EPU
Promote
r in E
PU
Enhan
cer in
EPU
CTCF
Cohesin/CTCF
Cohesin
Mediator
Expression
% o
f int
erac
tions
brid
ging
bin
ding
site
s
20
40
0
30
10
- - --
7402912956 9638
CTCF
Cohes
in
Mediat
or
Cohes
in +
CTCF
Pro
porti
on o
f int
erac
tions
0.025
0.050
0.075
0.100
0
* * *
* * * * * *
* * *
Promoter
Architectural protein
Promoter-interacting region
Promoter
Architectural protein
Promoter-interacting region
Figure 5. Demarcation of promoter interactions. (A) Number of interactions between promoters and enhancer elements with regard to the genomicposition of enhancer promoter units (EPUs) (Shen et al. 2012) in ESCs, separated by expression categories. (B) Number of promoter–enhancer pairs pre-dicted by EPUs (Shen et al. 2012) and promoter CHi-C. (C) Directionality of promoter–genome interactions in ESCs, relative to TAD boundaries. (D)Percentage of promoter–genome interactions bridging TAD boundaries, separated by expression categories. TAD boundary positions are set at zeroand are then shifted artificially in 10-kb steps upstream and downstream. (E) Percentage of promoter interactions bridging binding sites of CTCF, cohesin(SMC1A), Mediator (MED12), and sites co-occupied by CTCF and cohesin in ESCs (as illustrated by schematic on the right) compared to randomized con-trol sites. (F) Proportion of interactions in which the promoter and the interacting fragments are bound by the indicated proteins (CTCF, cohesin [SMC1A],Mediator [MED12], or CTCF and cohesin) in ESCs (as illustrated by schematic on the right), compared to randomized control sites.
Genome-wide capture of promoter interactions
Genome Research 591www.genome.org
Cold Spring Harbor Laboratory Press on September 20, 2016 - Published by genome.cshlp.orgDownloaded from
A
C
02468
SMC3SMC1ACTCFMAFKZFX
TFCP2L1E2F1STAT3
NANOGKLF4
EP300MYCNSOX2
POU5F1MYC
Endoplasmic reticulumPerinuclear region of cytoplasm
MitochondrionMulticellular organismal development
Brain developmentNucleus
NucleolusDNA repair
Transcription factor bindingPositive regulation of transcription
Regulation of transcriptionCell cycle
TranscriptionDNA binding
Chromatin bindingRibosome
Negative regulation of transcriptionNucleosome
Nervous system developmentEmbryonic skeletal system developmentAnterior/posterior pattern specification
0% 25% 50% 75% 100%
ExpressionEnrichment (fold change)
E
ESC promoter interaction networks
BEnrichment
-0.2-0.10.00.10.20.3
FLC
Expression
Exp
ress
ion
Not expressed
Not ex
press
ed
CTCFKLF1 (Progenitor)
KLF1 (Erythroblast)RNAPIITAL1
GATA1
Golgi apparatusApoptotic process
Nucleic acid bindingCell proliferation
Nucleotide bindingMitochondrion
Structural constituent of ribosomeTranslation
Mitochondrial matrixVesicle−mediated transport
Cell cycleTranscription from RNA polymerase II promoter
Positive regulation of NF−kappaB cascadeNucleolus
Nucleosome assemblyRibosome
Cell divisionmRNA processing
NucleoplasmMicrotubule cytoskeleton
CentrosomeNucleosome
Nuclear speckleRNA splicing
Spliceosomal complexSpindle
Chromatin modificationRibonucleoprotein complex
DNA repairrRNA processing
DNA recombinationDNA replication
Regulation of cell cycle
0% 25% 50% 75% 100%
Expression01234
FLC promoter interaction networks
Enrichment (fold change)
Expression -
D
Expression -
Expression
Exp
ress
ion
-0.5
0.0
0.5
1.0
Enrichment
ESC
Not expressed
Not ex
press
ed
-0.5 0 1 2 4.5
50 500 5000
Endoplasmic reticulumPerinuclear region of cytoplasm
Mitochondrion
Multicellular organismal development
Brain development
Nucleus
Nucleolus
DNA repair
Transcription factor binding
Positive regulation of transcription
Regulation of transcription
Cell cycle
Transcription
DNA binding
Chromatin binding
Ribosome
Negative regulation of transcription
Nucleosome
Nervous system development
Embryonic skeletal system development
Anterior/posterior pattern specification
log2 enrichment
Number of genes in GO category
Figure 6. Promoter–promoter interaction networks. (A,B) Enrichment of interactions between promoters from different expression categories in ESCs (A)and FLCs (B). (C) ESC promoter–promoter interaction networks. (Left) Fold enrichment of GO categories (green bars) and promoters bound by trans-actingfactors (dark red bars) in ESC promoter interaction networks. (Right) Distribution of expression categories within the respective ESC promoter interactionnetworks. (D) FLC promoter–promoter interaction networks. (Left) Fold enrichment of GO categories (green bars) and promoters bound by trans-actingfactors (dark red bars) in FLC promoter interaction networks. (Right) Distribution of expression categories within the respective FLC promoter interactionnetworks. (E) Connectivity between ESCpromoter–promoter subnetworks categorizedbased ongene ontology.Circle sizes represent the numbers of geneswithin the respective promoter subnetwork. Colorof circles represents the fold enrichmentof connectivity between themembers,whereas edge colors showthe enrichment of connectivity between the subnetworks.
Schoenfelder et al.
592 Genome Researchwww.genome.org
Cold Spring Harbor Laboratory Press on September 20, 2016 - Published by genome.cshlp.orgDownloaded from
the respective cell type (POU5F1, KLF4, SOX2, and NANOG inESCs; GATA1, KLF1, and TAL1 in FLCs) associate at higher thanexpected frequencies (Supplemental Table 5). Neither genomicdistance nor expression level (Supplemental Fig. 6A,B; Supplemen-tal Table 5) can fully account for the level of promoter connectivitywe observe, suggesting that occupancy by specific factors favors as-sociations between specific groups of genes beyond the preferen-tial contacts between expression categories we observed (Fig. 6A,B). In general, promoters occupied by tissue-specific transcriptionfactors show a stronger enrichment in promoter networks thanpromoters bound by the architectural chromatin proteins CTCFand the cohesin complex (Fig. 6C,D).
Finally, we looked at the degree of contacts between promot-er–promoter subnetworks. Interestingly, we found that the MYC,SOX2, POU5F1, and NANOG subnetworks are highly centralizedand strongly connected to each other in ESCs (Supplemental Fig.6C). Visualizing the networks based on GO categories demon-strates that key genes involved in gene expression control anddevelopmental processes are central and highly connected inESCs, whereas genes in the “nucleosome” and “endoplasmic retic-ulum” categories have fewer than expected connections (Fig. 6E).The results in FLCs show different categories that are central andhighly connected, mainly involved in RNA processing, DNA repli-cation, and repair (Supplemental Fig. 6D). Collectively, these re-sults show that genes involved in related functional pathways,regulated by common transcription factors and of similar tran-scriptional output are preferentially contacting each other, sug-gesting that 3D gene organization contributes to coordination ofcell type-specific gene expression programs.
Discussion
Promoter capture Hi-C: genome-wide promoter interactome
profiling
We have applied CHi-C to the ensemble of mouse gene promotersin pluripotent and differentiated cells, providing the first compre-hensive catalog linking promoters to their interacting elementsacross the genomic landscape. CHi-C represents a significant tech-nological advance for the analysis of 3D genome organization.Compared toHi-C, promoter CHi-Coffers amarked increase in res-olution for targeted regions, enabling the genome-wide linkageof promoters to their interacting elements with statistical signifi-cance. Genome-scale chromosomal interaction maps have previ-ously been generated for selected loci using 4C (Simonis et al.2006; Zhao et al. 2006). However, even in multiplex 4C experi-ments (van de Werken et al. 2012; de Wit et al. 2013) the numberof interrogated bait points in the genome is considerably smaller(by several orders of magnitude) than in promoter CHi-C. 5C gen-erates high-resolution chromosomal interaction landscape mapsof megabase-size genomic regions (Dostie et al. 2006; Nora et al.2012; Sanyal et al. 2012; Phillips-Cremins et al. 2013), but is notcapable of capturing interactions involving DNA sequences out-side the 5C target region(s).
ChIA-PET (Fullwood et al. 2009) combines antibody-mediat-ed precipitation with ligation to map chromosomal associations.This depends on the availability and efficiency of suitable affinityreagents and restricts bait choice to genomic regions occupied bya protein of interest. CHi-C on the other hand is relatively unbi-ased, enabling the comparison of chromosomal interaction pro-files for genomic regions regardless of cell type or differences inprotein occupancy. Two recent reports use ChIA-PET with an anti-
body against RNA polymerase II (RNAPII) to map interactions forRNAPII-bound genomic regions, including promoter–enhancerassociations (Kieffer-Kwon et al. 2013; Zhang et al. 2013). Bothstudies show pronounced changes in promoter–enhancer con-tacts between different cell types, consistent with our findings.However, other findings differ markedly. For example, the stron-gest ESC promoter–promoter interaction networks between keydevelopmental genes uncovered by CHi-C were not detectedby RNAPII ChIA-PET (Kieffer-Kwon et al. 2013; Zhang et al.2013). These ESC promoter networks contain a high proportionof lowly expressed developmental genes, which is likely to reducetheir capture efficiency in RNAPII ChIA-PET. Our data indicatethat these interaction networks between lowly expressed develop-mental genes represent a major feature of genome architecture inpluripotent cells. It remains to be determined whether this spatialgenome arrangement facilitates the coordinated transcriptionalrepression of developmental genes to maintain ESC pluripotency,their coordinated expression during cell lineage commitment, orboth.
A recent study reported a multiplex sequence capture ap-proach to enrich 3C libraries for promoter interactions (Capture-C) (Hughes et al. 2014). We found that the percentage of sequencereads representing genuine chromosomal interactions is about10-fold higher in CHi-C compared to Capture-C, presumably dueto the fact that genuine ligation junctions are not pre-enrichedin Capture-C. Although the number of promoters we targeted inpromoter CHi-C is almost 50 times higher than in Hughes et al.(2014), (22,225 versus 455 promoters), the number of informativesequence reads representing chromosomal interactions per cap-tured promoter is comparable.
Promoter CHi-C serves as proof of principle methodology toobtain high-resolution chromosomal interaction maps for a largenumber of genomic elements. The design of bait probes for CHi-C can be easily modified for unbiased targeting of other genomicregions, such as enhancers, insulators, or genome-wide bindingsites of chromatin proteins.
Regulatory 3D enhancer–promoter circuitry
Our data highlight the enormous complexity of 3D promoter–en-hancer architecture, with promoters often skipping themost prox-imal enhancer and often interacting with multiple enhancers.These results expand upon previous studies, which have detailedintricate regulatory landscapes at several developmentally regulat-ed genes (Carvajal et al. 2001; Carter et al. 2002; Jeong et al. 2006;Kleinjan et al. 2006; Sagai et al. 2009; Montavon et al. 2011;Marinic et al. 2013), where numerous enhancers with overlappingtissue-specific activities control gene expression. Notably, the ex-perimental deletion of some enhancers results in severe develop-mental abnormalities (Sagai et al. 2005; Attanasio et al. 2013),whereas in other cases, enhancer deletions have no obvious phe-notypic consequences (Ahituv et al. 2007) or lead to only subtlechanges of target gene expression levels (Bender et al. 2001;Anguita et al. 2002; Drissen et al. 2010; Ferreira et al. 2013). Inte-grating 3D promoter–enhancer connectivity data may help to bet-ter understand these results.
Our data reveal a positive correlation between the expressionlevel of promoters and the number of interacting enhancers. Thisfinding adds weight to the concept of additive effects of enhanceraction and suggests possible models to explain how the activityfrom multiple enhancers is integrated for gene expression con-trol. For example, do multiple enhancers interact with their
Genome-wide capture of promoter interactions
Genome Research 593www.genome.org
Cold Spring Harbor Laboratory Press on September 20, 2016 - Published by genome.cshlp.orgDownloaded from
target genes simultaneously, creating amore stable complex, or dothey interact sequentially, increasing the probability that the geneis in contact with one of the enhancers at any moment in time?Both scenariosmay result in prolonging transcriptional “on” cycleof genes (Osborne et al. 2004), by increasing the frequency of tran-scriptional bursts (Suter et al. 2011), or both. Single-cell approach-es (Nagano et al. 2013) may help to distinguish between thesepossibilities.
Contacts between transcribed genes and enhancers havebeen shown to occur at specialized subnuclear compartmentscalled transcription factories (Osborne et al. 2004; Schoenfelderet al. 2010). It is therefore conceivable that at least some of the de-tected promoter contacts are the consequence, rather than thecause, of spatial proximity between active genes and regulatory el-ements at shared subnuclear compartments.
We found that only a fraction (∼20%) of interactions uncov-ered by promoter CHi-C are between promoters and annotatedenhancers. Like all 3C-based assays, promoter CHi-C detects func-tional interactions and structural interactions, and we cannotexclude the possibility that some of these interactions are non-functional, functionally redundant, or that they confer robustnessto gene expression programs in a manner similar to the recentlydescribed shadow enhancers (Hong et al. 2008; Frankel et al.2010). Nonetheless, the high-resolution data generated by pro-moter capture Hi-C provides a framework to formulate hypothesesand to guide the future experimental dissection of promoter–enhancer circuitry in mammalian genomes, for example byCRISPR-mediated deletion of regulatory regions (Zhou et al. 2014).
Promoter–promoter 3D interactomes
Our promoter CHi-C data uncovers promoter–promoter networksthat are composed of preferential interactions between genes func-tioning in related biological pathways and bound by the sametranscription factors, suggesting that these may be spatial net-works of coregulated genes. Several studies have implicated tran-scription factors in three-dimensional gene clustering. KLF1 hasbeen shown to mediate preferential associations between KLF1-regulated genes in FLCs (Schoenfelder et al. 2010), and a similarrole has been reported for KLF4 in ESCs (Wei et al. 2013). Spatialclustering has also been reported between the Ifnb gene andNFKB-bound sites upon virus infection (Apostolou and Thanos2008), between the Nanog locus and genes bound by pluripotencyfactors (Apostolou et al. 2013), for pluripotency factor (NANOG,POU5F1, and SOX2) binding sites in ESCs (de Wit et al. 2013;Denholtz et al. 2013), Polycomb-regulated genes (Denholtz et al.2013), and for NFKB-regulated genes in response to TNF−alphastimulation (Papantonis et al. 2010). Notably, experimental re-moval of a gene from a NFKB-dependent multigene complex wasshown to directly affect the transcription of its interacting genes,suggesting that coassociation of coregulated genes may contributeto a hierarchy of gene expression control (Fanucchi et al. 2013).Thus, 3D promoter interaction networks may not only facilitatethe coordinated expression control of network members, butalso allow for regulatory crosstalk between them.
In summary, in addition to linking genes to their long-rangeregulatory elements genome-wide, our results on promoter–pro-moter networks emphasize the potential of genome organizationin controlling gene expression. The clustering of coregulated genesat nuclear subcompartments, such as transcription factories orPolycomb bodies, may create nuclear microenvironments thatare enriched in specific factors to coordinate the expression or
repression of specific groups of genes. How this organization isachieved is a major outstanding question in genome biology.
Methods
Tissue isolation and cell culture
J1 (129S4/SvJae) murine ESCs were expanded on irradiated prima-ry embryonic fibroblasts under standard pluripotent conditions(15%FBS) on tissue culture plates coatedwith 0.1%gelatin. Tohar-vest the cells and remove contaminating feeder cells, ESCs weretrypsinized and passaged twice for 30 min each.
Fetal livers were dissected from C57BL/6 mouse embryos atday 14.5 (E14.5) of development. Fetal liver cells were filteredthrough a cell strainer (70 μm) and directly fixed in formaldehyde.
Promoter capture Hi-C
Hi-C was performed essentially as described in Belton et al. (2012),with some modifications (see Supplemental Material). To captureHi-C ligation products containing promoter sequences, 500 ngof Hi-C library DNA was lyophilized using a vacuum concentratorat 45°C and resuspended in 3.4 µL H2O. Hybridization blockers(Agilent Technologies) were added to the Hi-C DNA, and hybridi-zation buffer and capture bait RNA were prepared according tothe manufacturer’s instructions (SureSelect Target Enrichment,Agilent Technologies). In a PCR machine, the Hi-C library DNA/hybridization blockers were heated for 5 min at 95°C, before low-ering the temperature to 65°C. Hi-C library DNA was mixed withhybridization buffer (prewarmed for 5 min to 65°C), and subse-quently with the custom-designed capture bait system (pre-warmed for 3 min to 65°C), consisting of 39,021 biotinylatedRNAs targeting the HindIII restriction fragment ends of 22,225mouse gene promoters (Agilent Technologies, see SupplementalMaterial for capture bait design). After 24 h at 65°C in the PCRmachine, biotin pulldown (MyOne Streptavidin T1 Dynabeads;Life Technologies) and washes were performed following theSureSelect Target enrichment protocol (Agilent Technologies).After the final wash, beads were resuspended in 30 µL NEBuffer2 without prior DNA elution, and a post-capture PCR (four ampli-fication cycles using Illumina PE PCR 1.0 and PE PCR 2.0 primers)was performed on DNA bound to the beads via biotinylated RNA.Capture Hi-C libraries were paired-end sequenced (HiSeq 1000,Illumina).
DNA FISH
BAC clones (RP23-162O16 [Slc25a37 locus], RP23-51D11 [Dleu2locus], RP23-369O11 [Dcaf11 locus], RP23-9O8 [Tbx3 locus],RP23-438D11 [Fzd10 locus], RP23-431D16 [Uncx locus], RP23-141E23 [Hist1h4h locus], RP24-239K5 [Vmn1r locus], RP23-73B14 [Hist1h2ai locus]) were purchased from Life Technologiesor BACPAC Resources (Children’s Hospital Oakland). BAC DNAwas purified using the NucleoBond BAC100 kit (Macherey-Nagel), and labelled with aminoallyl-dUTP by nick translation.After purification, 0.5–1 µg labeled BAC DNA was coupled withAlexa Fluor 488, Alexa Fluor 555, or Alexa Fluor 647 reactivedyes (Life Technologies) according to the manufacturer’s instruc-tions, and DNA FISH was performed as described (Nagano et al.2013) with minor modifications (see Supplemental Material).
Interaction calling
Raw sequencing reads were processed using the HiCUP pipeline,which maps the ditags against the mouse genome (mm9), filters
Schoenfelder et al.
594 Genome Researchwww.genome.org
Cold Spring Harbor Laboratory Press on September 20, 2016 - Published by genome.cshlp.orgDownloaded from

experimental artefacts, such as circularized reads and religa-tions, and removes duplicate reads (http://www.bioinformatics.babraham.ac.uk/projects/hicup/). Significantly interacting regionswere called using the GOTHiC BioConductor package (http://www.bioconductor.org/packages/release/bioc/html/GOTHiC.html). Thisassumes that biases occurring in Hi-C-type experiments are cap-tured in the coverage (total number of readsmapping to a genomicregion), and significantly interacting regions can be separatedfrom background noise using a cumulative binomial test basedon coverage followed by Benjamini-Hochberg multiple testing(FDR < 0.05) (Benjamini and Hochberg 1995). Promoter–promoterand promoter–genome interactions were handled separately. Forpromoter–promoter interactions, we calculated a modified nulldistribution to account for the nonmultiplicative capture bias inproducts targeted by two baits. A random ligation sample (seeSupplemental Methods) was used to build a generalized linearmodel. The product and the sum of the coverage values of thetwo ends were used as input variables, whereas the interaction fre-quencies of random ligation events were used as dependent vari-ables. Predicted interaction frequencies for the actual sampleswere calculated from themodel using logit regression. Thenwe ap-plied the GOTHiC binomial test with this modified backgrounddistribution. Significant interactions were further filtered by re-moving interactions in which one of the fragments has extremelyhigh coverage. We kept interactions for which there is at least onevalid ditag with one of the two neighboring fragments to controlfor spurious interaction spikes. Promoter–genome interactionswere considered if they were present in both biological replicates; promoter–promoter interactions were pooled to increase the sen-sitivity for detecting long-range interactions. Finally, we fitted anormal distribution to the lower peak of the bimodal average logobserved/expected distribution and used a cutoff at the 95th per-centile (∼10) to remove weak promoter–genome interactions.
Data access
Raw data and the list of interactions have been submitted to theEBI ArrayExpress (https://www.ebi.ac.uk/arrayexpress/) under ac-cession number E-MTAB-2414.
Competing interest statement
The authors declare that we have applied for a patent related to thecontent of this manuscript. The international application numberfor this patent application is PCT/GB2014/052664.
Acknowledgments
We thank JoanaMartins and Anne Segonds-Pichon for expert helpwith MetaCyte data analyses; Sara Borghi for assistance in 3C li-brary generation; Mikhail Spivakov for critical reading of the man-uscript; and members of the Fraser and Luscombe groups forstimulating discussions. This work was supported by theBiotechnology and Biological Science Research Council, UK, theMedical Research Council, UK (P.F.), the EU, FP7 EpigenesysNetwork of Excellence (N.M.L.), the Canadian Institutes ofHealth Research, and the Canada Foundation for Innovation andthe Ontario Ministry of Research and Innovation (J.A.M.).
Author contributions: P.F. and S.S. designed the overall studywith contributions from M.F.M. S.S. and M.F.M. performed CHi-C experiments, with help from T.N. B.M.J. performed 3C-qPCR.T.N. performed DNA FISH experiments, and M.F.M. analyzed the
DNA FISH data. Y.K., M.S., and J.A.M. performed validationexperiments. E. Dimitrova and S.E. maintained and culturedESCs for CHi-C. K.T. performed next-generation sequencing. N.M.L., B.M., F.T.C., R.S., S.W.W., E. Darbo, A.D., and L.B.E. analyzedthe data. S.A. and C.S.O. designed the capture system, with contri-butions from B.H., E.L., and A.H. S.S. and P.F. wrote the manu-script with contributions from M.F.M. and all other authors.
References
Ahituv N, Zhu Y, Visel A, Holt A, Afzal V, Pennacchio LA, Rubin EM. 2007.Deletion of ultraconserved elements yields viable mice. PLoS Biol 5:e234.
Anguita E, Sharpe JA, Sloane-Stanley JA, Tufarelli C, Higgs DR, Wood WG.2002. Deletion of the mouse α-globin regulatory element (HS –26) hasan unexpectedly mild phenotype. Blood 100: 3450–3456.
Apostolou E, Thanos D. 2008. Virus infection induces NFKB-dependent in-terchromosomal associations mediating monoallelic IFN-β gene expres-sion. Cell 134: 85–96.
Apostolou E, Ferrari F, Walsh RM, Bar-Nur O, Stadtfeld M, Cheloufi S, StuartHT, Polo JM, Ohsumi TK, BorowskyML, et al. 2013. Genome-wide chro-matin interactions of the Nanog locus in pluripotency, differentiation,and reprogramming. Cell Stem Cell 12: 699–712.
Attanasio C, Nord AS, Zhu Y, Blow MJ, Li Z, Liberton DK, Morrison H,Plajzer-Frick I, Holt A, Hosseini R, et al. 2013. Fine tuning of craniofacialmorphology by distant-acting enhancers. Science 342: 1241006.
Bantignies F, Roure V, Comet I, Leblanc B, Schuettengruber B, Bonnet J,Tixier V, Mas A, Cavalli G. 2011. Polycomb-dependent regulatory con-tacts between distant Hox loci in Drosophila. Cell 144: 214–226.
Belton JM, McCord RP, Gibcus JH, Naumova N, Zhan Y, Dekker J. 2012. Hi-C: a comprehensive technique to capture the conformation of genomes.Methods 58: 268–276.
BenderMA, Roach JN, Halow J, Close J, Alami R, Bouhassira EE, GroudineM,Fiering SN. 2001. Targeted deletion of 5′HS1 and 5′HS4 of the β-globinlocus control region reveals additive activity of the DNase I hypersensi-tive sites. Blood 98: 2022–2027.
BenderMA, Ragoczy T, Lee J, Byron R, Telling A, Dean A, GroudineM. 2012.The hypersensitive sites of the murine β-globin locus control region actindependently to affect nuclear localization and transcriptional elonga-tion. Blood 119: 3820–3827.
Benjamini Y, Hochberg Y. 1995. Controlling the false discovery rate: apractical and powerful approach to multiple testing. J R Stat Soc SeriesB 57: 289–300.
Bulger M, GroudineM. 2011. Functional and mechanistic diversity of distaltranscription enhancers. Cell 144: 327–339.
Calo E, Wysocka J. 2013. Modification of enhancer chromatin: what, how,and why? Mol Cell 49: 825–837.
Carter D, Chakalova L, Osborne CS, Dai YF, Fraser P. 2002. Long-range chro-matin regulatory interactions in vivo. Nat Genet 32: 623–626.
Carvajal JJ, Cox D, Summerbell D, Rigby PW. 2001. A BAC transgenic anal-ysis of the Mrf4/Myf5 locus reveals interdigitated elements that controlactivation andmaintenance of gene expression during muscle develop-ment. Development 128: 1857–1868.
Chen X, Xu H, Yuan P, Fang F, Huss M, Vega VB, Wong E, Orlov YL, ZhangW, Jiang J, et al. 2008. Integration of external signaling pathways withthe core transcriptional network in embryonic stem cells. Cell 133:1106–1117.
deWit E, Bouwman BA, Zhu Y, Klous P, Splinter E, VerstegenMJ, Krijger PH,Festuccia N, Nora EP,WellingM, et al. 2013. The pluripotent genome inthree dimensions is shaped around pluripotency factors. Nature 501:227–231.
Dekker J, Rippe K, Dekker M, Kleckner N. 2002. Capturing chromosomeconformation. Science 295: 1306–1311.
Deng W, Lee J, Wang H, Miller J, Reik A, Gregory PD, Dean A, Blobel GA.2012. Controlling long-range genomic interactions at a native locusby targeted tethering of a looping factor. Cell 149: 1233–1244.
Denholtz M, Bonora G, Chronis C, Splinter E, de Laat W, Ernst J, PellegriniM, Plath K. 2013. Long-range chromatin contacts in embryonic stemcells reveal a role for pluripotency factors and polycomb proteins in ge-nome organization. Cell Stem Cell 13: 602–616.
Dixon JR, Selvaraj S, Yue F, Kim A, Li Y, Shen Y, Hu M, Liu JS, Ren B. 2012.Topological domains in mammalian genomes identified by analysis ofchromatin interactions. Nature 485: 376–380.
Dostie J, Richmond TA, Arnaout RA, Selzer RR, Lee WL, Honan TA, RubioED, Krumm A, Lamb J, Nusbaum C, et al. 2006. ChromosomeConformation Capture Carbon Copy (5C): a massively parallel solutionfor mapping interactions between genomic elements. Genome Res 16:1299–1309.
Genome-wide capture of promoter interactions
Genome Research 595www.genome.org
Cold Spring Harbor Laboratory Press on September 20, 2016 - Published by genome.cshlp.orgDownloaded from
Drissen R, Guyot B, Zhang L, Atzberger A, Sloane-Stanley J, Wood B,Porcher C, Vyas P. 2010. Lineage-specific combinatorial action of en-hancers regulates mouse erythroid Gata1 expression. Blood 115: 3463–3471.
Dryden NH, Broome LR, Dudbridge F, Johnson N, Orr N, Schoenfelder S,Nagano T, Andrews S, Wingett S, Kozarewa I, et al. 2014. Unbiased anal-ysis of potential targets of breast cancer susceptibility loci by CaptureHi-C. Genome Res 24: 1854–1868.
The ENCODE Project Consortium. 2012. An integrated encyclopedia ofDNA elements in the human genome. Nature 489: 57–74.
Engreitz JM, Pandya-Jones A, McDonel P, Shishkin A, Sirokman K, Surka C,Kadri S, Xing J, GorenA, Lander ES, et al. 2013. The Xist lncRNA exploitsthree-dimensional genome architecture to spread across the X chromo-some. Science 341: 1237973.
Fanucchi S, Shibayama Y, Burd S, Weinberg MS, Mhlanga MM. 2013.Chromosomal contact permits transcription between coregulatedgenes. Cell 155: 606–620.
Ferreira R, Spensberger D, Silber Y, Dimond A, Li J, Green AR,Göttgens B. 2013. Impaired in vitro erythropoiesis followingdeletion of the Scl (Tal1) +40 enhancer is largely compensated for invivo despite a significant reduction in expression. Mol Cell Biol 33:1254–1266.
Frankel N, Davis GK, Vargas D,Wang S, Payre F, Stern DL. 2010. Phenotypicrobustness conferred by apparently redundant transcriptional enhanc-ers. Nature 466: 490–493.
FullwoodMJ, LiuMH, PanYF, Liu J, XuH,Mohamed YB, Orlov YL, Velkov S,Ho A, Mei PH, et al. 2009. An oestrogen-receptor-α-bound human chro-matin interactome. Nature 462: 58–64.
Gibcus JH, Dekker J. 2013. The hierarchy of the 3D genome. Mol Cell 49:773–782.
Gnirke A, Melnikov A, Maguire J, Rogov P, LeProust EM, Brockman W,Fennell T, Giannoukos G, Fisher S, Russ C, et al. 2009. Solution hybridselectionwith ultra-long oligonucleotides formassively parallel targetedsequencing. Nat Biotechnol 27: 182–189.
Guelen L, Pagie L, Brasset E, MeulemanW, FazaMB, TalhoutW, Eussen BH,de Klein A,Wessels L, de LaatW, et al. 2008. Domain organization of hu-man chromosomes revealed bymapping of nuclear lamina interactions.Nature 453: 948–951.
Hadjur S, Williams LM, Ryan NK, Cobb BS, Sexton T, Fraser P, FisherAG, Merkenschlager M. 2009. Cohesins form chromosomal cis-inter-actions at the developmentally regulated IFNG locus. Nature 460:410–413.
Handoko L, Xu H, Li G, Ngan CY, Chew E, Schnapp M, Lee CW, Ye C, PingJL, Mulawadi F, et al. 2011. CTCF-mediated functional chromatin inter-actome in pluripotent cells. Nat Genet 43: 630–638.
Hong JW, Hendrix DA, Levine MS. 2008. Shadow enhancers as a source ofevolutionary novelty. Science 321: 1314.
Hughes JR, Roberts N, McGowan S, Hay D, Giannoulatou E, Lynch M, DeGobbi M, Taylor S, Gibbons R, Higgs DR. 2014. Analysis of hundredsof cis-regulatory landscapes at high resolution in a single, high-through-put experiment. Nat Genet 46: 205–212.
Jeong Y, El-Jaick K, Roessler E, Muenke M, Epstein DJ. 2006. A functionalscreen for sonic hedgehog regulatory elements across a 1Mb interval iden-tifies long-range ventral forebrain enhancers. Development 133: 761–772.
Kagey MH, Newman JJ, Bilodeau S, Zhan Y, Orlando DA, van Berkum NL,Ebmeier CC, Goossens J, Rahl PB, Levine SS, et al. 2010. Mediator andcohesin connect gene expression and chromatin architecture. Nature467: 430–435.
Kieffer-Kwon KR, Tang Z, Mathe E, Qian J, Sung MH, Li G, ReschW, Baek S,Pruett N, Grøntved L, et al. 2013. Interactome maps of mouse gene reg-ulatory domains reveal basic principles of transcriptional regulation.Cell 155: 1507–1520.
KleinjanDA, Seawright A,Mella S, Carr CB, Tyas DA, Simpson TI,Mason JO,Price DJ, van Heyningen V. 2006. Long-range downstream enhancersare essential for Pax6 expression. Dev Biol 299: 563–581.
Levasseur DN, Wang J, Dorschner MO, Stamatoyannopoulos JA, Orkin SH.2008. OCT4 dependence of chromatin structure within the extendedNanog locus in ES cells. Genes Dev 22: 575–580.
Lieberman-Aiden E, van Berkum NL, Williams L, Imakaev M, Ragoczy T,Telling A, Amit I, Lajoie BR, Sabo PJ, Dorschner MO, et al. 2009.Comprehensive mapping of long-range interactions reveals foldingprinciples of the human genome. Science 326: 289–293.
Lin C, Garruss AS, Luo Z, Guo F, Shilatifard A. 2013. The RNA Pol II elonga-tion factor Ell3 marks enhancers in ES cells and primes future gene acti-vation. Cell 152: 144–156.
Marinic M, Aktas T, Ruf S, Spitz F. 2013. An integrated holo-enhancer unitdefines tissue and gene specificity of the Fgf8 regulatory landscape. DevCell 24: 530–542.
Mishiro T, Ishihara K, Hino S, Tsutsumi S, Aburatani H, Shirahige K,Kinoshita Y, Nakao M. 2009. Architectural roles of multiple chromatin
insulators at the human apolipoprotein gene cluster. EMBO J 28: 1234–1245.
Mitchell JA, Fraser P. 2008. Transcription factories are nuclear subcom-partments that remain in the absence of transcription. Genes Dev 22:20–25.
Montavon T, Soshnikova N, Mascrez B, Joye E, Thevenet L, Splinter E, deLaat W, Spitz F, Duboule D. 2011. A regulatory archipelago controlsHox genes transcription in digits. Cell 147: 1132–1145.
Nagano T, Lubling Y, Stevens TJ, Schoenfelder S, Yaffe E, Dean W, Laue ED,Tanay A, Fraser P. 2013. Single-cell Hi-C reveals cell-to-cell variability inchromosome structure. Nature 502: 59–64.
Nativio R, Wendt KS, Ito Y, Huddleston JE, Uribe-Lewis S, Woodfine K,Krueger C, Reik W, Peters JM, Murrell A. 2009. Cohesin is required forhigher-order chromatin conformation at the imprinted IGF2-H19 locus.PLoS Genet 5: e1000739.
Nora EP, Lajoie BR, Schulz EG, Giorgetti L, Okamoto I, Servant N, PiolotT, van Berkum NL, Meisig J, Sedat J, et al. 2012. Spatial partitioningof the regulatory landscape of the X-inactivation centre. Nature 485:381–385.
Osborne CS, Chakalova L, Brown KE, Carter D, Horton A, Debrand E,Goyenechea B, Mitchell JA, Lopes S, Reik W, et al. 2004. Active genesdynamically colocalize to shared sites of ongoing transcription. NatGenet 36: 1065–1071.
Osborne CS, Chakalova L, Mitchell JA, Horton A, Wood AL, Bolland DJ,Corcoran AE, Fraser P. 2007. Myc dynamically and preferentially relo-cates to a transcription factory occupied by Igh. PLoS Biol 5: e192.
Papantonis A, Larkin JD,Wada Y, Ohta Y, Ihara S, Kodama T, Cook PR. 2010.Active RNA polymerases: mobile or immobile molecular machines?PLoS Biol 8: e1000419.
Pennacchio LA, AhituvN,Moses AM, Prabhakar S, NobregaMA, ShoukryM,Minovitsky S, Dubchak I, Holt A, Lewis KD, et al. 2006. In vivo enhanceranalysis of human conserved non-coding sequences. Nature 444: 499–502.
Peric-Hupkes D, MeulemanW, Pagie L, Bruggeman SW, Solovei I, BrugmanW, Gräf S, Flicek P, Kerkhoven RM, van Lohuizen M, et al. 2010.Molecular maps of the reorganization of genome-nuclear lamina inter-actions during differentiation. Mol Cell 38: 603–613.
Phillips-Cremins JE, Sauria ME, Sanyal A, Gerasimova TI, Lajoie BR, Bell JS,Ong CT, Hookway TA, Guo C, Sun Y, et al. 2013. Architectural proteinsubclasses shape 3D organization of genomes during lineage commit-ment. Cell 153: 1281–1295.
Ruf S, Symmons O, Uslu VV, Dolle D, Hot C, Ettwiller L, Spitz F. 2011. Large-scale analysis of the regulatory architecture of themouse genomewith atransposon-associated sensor. Nat Genet 43: 379–386.
Sagai T, Hosoya M, Mizushina Y, Tamura M, Shiroishi T. 2005. Eliminationof a long-range cis-regulatory module causes complete loss of limb-spe-cific Shh expression and truncation of the mouse limb. Development132: 797–803.
Sagai T, Amano T, Tamura M, Mizushina Y, Sumiyama K, Shiroishi T. 2009.A cluster of three long-range enhancers directs regional Shh expressionin the epithelial linings. Development 136: 1665–1674.
Sanyal A, Lajoie BR, Jain G, Dekker J. 2012. The long-range interaction land-scape of gene promoters. Nature 489: 109–113.
Schoenfelder S, Sexton T, Chakalova L, Cope NF, Horton A, Andrews S,Kurukuti S, Mitchell JA, Umlauf D, Dimitrova DS, et al. 2010.Preferential associations between co-regulated genes reveal a transcrip-tional interactome in erythroid cells. Nat Genet 42: 53–61.
Sexton T, Yaffe E, Kenigsberg E, Bantignies F, Leblanc B, Hoichman M,Parrinello H, Tanay A, Cavalli G. 2012. Three-dimensional folding andfunctional organization principles of the Drosophila genome. Cell 148:458–472.
Shen Y, Yue F,McClearyDF, Ye Z, Edsall L, Kuan S,WagnerU, Dixon J, Lee L,Lobanenkov VV, et al. 2012. A map of the cis-regulatory sequences inthe mouse genome. Nature 488: 116–120.
Simonis M, Klous P, Splinter E, Moshkin Y, Willemsen R, de Wit E, vanSteensel B, de Laat W. 2006. Nuclear organization of active and inactivechromatin domains uncovered by chromosome conformation capture-on-chip (4C). Nat Genet 38: 1348–1354.
Skok JA, Gisler R, NovatchkovaM, Farmer D, de LaatW, BusslingerM. 2007.Reversible contraction by looping of the Tcra and Tcrb loci in rearrang-ing thymocytes. Nat Immunol 8: 378–387.
Spilianakis CG, Lalioti MD, Town T, Lee GR, Flavell RA. 2005. Interchromo-somal associations between alternatively expressed loci. Nature 435:637–645.
Spitz F, Gonzalez F, Duboule D. 2003. A global control region defines a chro-mosomal regulatory landscape containing the HoxD cluster. Cell 113:405–417.
Stadler MB, Murr R, Burger L, Ivanek R, Lienert F, Schöler A, van NimwegenE, Wirbelauer C, Oakeley EJ, Gaidatzis D, et al. 2011. DNA-binding fac-tors shape the mouse methylome at distal regulatory regions. Nature480: 490–495.
Schoenfelder et al.
596 Genome Researchwww.genome.org
Cold Spring Harbor Laboratory Press on September 20, 2016 - Published by genome.cshlp.orgDownloaded from

Suter DM, Molina N, Gatfield D, Schneider K, Schibler U, Naef F. 2011.Mammalian genes are transcribed with widely different bursting kinet-ics. Science 332: 472–474.
van deWerken HJ, Landan G, Holwerda SJ, HoichmanM, Klous P, ChachikR, Splinter E, Valdes-Quezada C, Öz Y, Bouwman BA, et al. 2012. Robust4C-seq data analysis to screen for regulatory DNA interactions. NatMethods 9: 969–972.
Vernimmen D, De Gobbi M, Sloane-Stanley JA, Wood WG, Higgs DR.2007. Long-range chromosomal interactions regulate the timing ofthe transition between poised and active gene expression. EMBO J26: 2041–2051.
Visel A, BlowMJ, Li Z, Zhang T, Akiyama JA, Holt A, Plajzer-Frick I, ShoukryM, Wright C, Chen F, et al. 2009. ChIP-seq accurately predicts tissue-specific activity of enhancers. Nature 457: 854–858.
Wei Z, Gao F, Kim S, Yang H, Lyu J, AnW,Wang K, LuW. 2013. KLF4 organ-izes long-range chromosomal interactions with the Oct4 locus in repro-gramming and pluripotency. Cell Stem Cell 13: 36–47.
Whyte WA, Orlando DA, Hnisz D, Abraham BJ, Lin CY, Kagey MH, RahlPB, Lee TI, Young RA. 2013. Master transcription factors and mediatorestablish super-enhancers at key cell identity genes. Cell 153: 307–319.
Zhang Y, McCord RP, Ho YJ, Lajoie BR, Hildebrand DG, Simon AC, BeckerMS, Alt FW, Dekker J. 2012. Spatial organization of the mouse genome
and its role in recurrent chromosomal translocations. Cell 148:908–921.
Zhang Y, Wong CH, Birnbaum RY, Li G, Favaro R, Ngan CY, Lim J, Tai E,Poh HM, Wong E, et al. 2013. Chromatin connectivity maps revealdynamic promoter-enhancer long-range associations. Nature 504:306–310.
Zhao Z, TavoosidanaG, SjolinderM, Gondor A,Mariano P,Wang S, KanduriC, Lezcano M, Sandhu KS, Singh U, et al. 2006. Circular chromosomeconformation capture (4C) uncovers extensive networks of epigeneti-cally regulated intra- and interchromosomal interactions. Nat Genet38: 1341–1347.
Zhou X, Lowdon RF, Li D, Lawson HA, Madden PA, Costello JF, Wang T.2013. Exploring long-range genome interactions using the WashUEpigenome Browser. Nat Methods 10: 375–376.
Zhou HY, Katsman Y, Dhaliwal NK, Davidson S, Macpherson NN,SakthideviM, Felicia Collura F,Mitchell JA. 2014. A Sox2 distal enhancercluster regulates embryonic stem cell differentiation potential. GenesDev 28: 2699–2711.
Received October 3, 2014; accepted in revised form February 11, 2015.
Genome-wide capture of promoter interactions
Genome Research 597www.genome.org
Cold Spring Harbor Laboratory Press on September 20, 2016 - Published by genome.cshlp.orgDownloaded from
10.1101/gr.185272.114Access the most recent version at doi:2015 25: 582-597 originally published online March 9, 2015Genome Res.
Stefan Schoenfelder, Mayra Furlan-Magaril, Borbala Mifsud, et al. long-range interacting elementsThe pluripotent regulatory circuitry connecting promoters to their
Material
Supplemental
http://genome.cshlp.org/content/suppl/2015/03/09/gr.185272.114.DC1.html
References
http://genome.cshlp.org/content/25/4/582.full.html#ref-list-1
This article cites 79 articles, 22 of which can be accessed free at:
Open Access
Open Access option.Genome ResearchFreely available online through the
License
Commons Creative
.http://creativecommons.org/licenses/by/4.0
License (Attribution 4.0 International), as described at , is available under a Creative CommonsGenome ResearchThis article, published in
ServiceEmail Alerting
click here.top right corner of the article or
Receive free email alerts when new articles cite this article - sign up in the box at the
http://genome.cshlp.org/subscriptionsgo to: Genome Research To subscribe to
© 2015 Schoenfelder et al.; Published by Cold Spring Harbor Laboratory Press
Cold Spring Harbor Laboratory Press on September 20, 2016 - Published by genome.cshlp.orgDownloaded from