resolved gas cavities_in_transitional_disks_inferred_from_co_isotopologs_with_alma
TRANSCRIPT
arX
iv:1
511.
0714
9v2
[ast
ro-p
h.E
P]
2 D
ec 2
015
Astronomy & Astrophysicsmanuscript no. Paper˙final c© ESO 2015December 3, 2015
Resolved gas cavities in transitional disks inferred from COisotopologs with ALMA
N. van der Marel1, E.F. van Dishoeck1,2, S. Bruderer2, S.M. Andrews3, K.M. Pontoppidan4, G.J. Herczeg5, T. vanKempen1, and A. Miotello1
1 Leiden Observatory, Leiden University, P.O. Box 9513, 2300RA Leiden, the Netherlands2 Max-Planck-Institut fur Extraterrestrische Physik, Giessenbachstrasse 1, 85748 Garching, Germany3 Harvard-Smithsonian Center for Astrophysics, 60 Garden Street, Cambridge, MA 02138, USA4 Space Telescope Science Institute, 3700 San Martin Drive, Baltimore, MD 21218, USA5 Kavli Institute for Astronomy and Astrophysics, Peking University, Yi He Yuan Lu 5, Haidijan district, Beijing 100871,China
ABSTRACT
Context. Transitional disks around young stars with large dust cavities are promising candidates to look for recently formed, embed-ded planets. Models of planet-disk interaction predict that young planets clear a gap in the gas while trapping dust at larger radii.Other physical mechanisms might also be responsible for cavities. Previous observations have revealed that gas is still present insidethese cavities, but the spatial distribution of this gas remains uncertain.Aims. We present high spatial resolution observations with the Atacama Large Millimeter/submillimeter Array (ALMA) of13CO andC18O 3–2 or 6–5 lines of four well-studied transitional disks around pre-main-sequence stars with large dust cavities. Theline andcontinuum observations are used to set constraints on the the gas surface density, specifically on the cavity size and density drop insidethe cavity.Methods. The physical-chemical model DALI was used to analyze the gasimages of SR21, HD135344B (also known asSAO 206462), DoAr44, and IRS 48. The main parameters of interest are the size, depth and shape of the gas cavity in each ofthe disks. CO isotope-selective photodissociation is included to properly constrain the surface density in the outer disk from C18Oemission.Results. The gas cavities are up to three times smaller than those of the dust in all four disks. Model fits indicate that the surfacedensity inside the gas cavities decreases by a factor of 100 to 10000 compared with the surface density profile derived from the outerdisk. The data can be fit by either introducing one or two dropsin the gas surface density or a surface density profile that increaseswith radius inside the cavity. A comparison with an analytical model of gap depths by planet-disk interaction shows thatthe diskviscosities are most likely low, between between 10−3 and 10−4 , for reasonable estimates of planet masses of up to 10 Jupiter masses.Conclusions. The resolved measurements of the gas and dust in transition disk cavities support the predictions of models that describehow planet-disk interactions sculpt gas disk structures and influence the evolution of dust grains. These observed structures stronglysuggest the presence of giant planetary companions in transition disk cavities, although at smaller orbital radii thanis typically indi-cated from the dust cavity radii alone.
Key words. Astrochemistry - Protoplanetary disks - Stars: formation -ISM: molecules
1. Introduction
Protoplanetary disks around young stars are the birth cra-dles of planets (e.g., Williams & Cieza 2011). Disks with in-ner dust cavities, also called transition disks, are good can-didates to search for young planets that have recently beenformed and cleared out their orbit. Dust cavities have been in-ferred from modeling of spectral energy distributions (SEDs)(Espaillat et al. 2014, and references therein) and millimeterinterferometry (e.g., Brown et al. 2009; Andrews et al. 2011).Planet candidates have been found in cavities of several tran-sition disks (Kraus & Ireland 2012; Quanz et al. 2013, 2015).However, planet-disk interaction models indicate that dust cav-ities are only an indirect consequence of planet clearing: aplanet will lower the gas surface density along its orbit, cre-ating a gas gap with a pressure bump at its outer edge wherethe millimeter-sized dust is trapped (e.g., Zhu et al. 2011;Dodson-Robinson & Salyk 2011; Pinilla et al. 2012). The re-sult is a millimeter-dust ring (or in particular cases an az-imuthal asymmetry that is due to a Rossby-wave instability of
the pressure bump, van der Marel et al. 2013; Fukagawa et al.2013; Casassus et al. 2013) and a gas cavity that can be up totwice as small as the radius of the dust ring. Other mechanismsthat could cause a dust cavity or dust ring are photoevapora-tion (Clarke et al. 2001) and instabilities at the edges of deadzones (e.g., Regaly et al. 2012). Measuring the gas densityin-side the cavity is essential to distinguish between these mecha-nisms: photoevaporation clears the dust and gas from the insideout, dead zones do not change the gas density inside the cavity,and planetary clearing creates a gas cavity. Furthermore, the de-crease of gas surface density inside the gas cavity radius dependson the mass of the companion and the disk viscosity. More gen-erally, the fundamental properties of a disk are the gas-to-dustratio and gas surface density profile because the gas does notnecessarily follow the dust distribution.
The presence of gas inside the dust cavities was discoveredthrough accretion (e.g., Valenti et al. 1993; Najita et al. 2007)and H2 emission (Bergin et al. 2003; Ingleby et al. 2009). Otherfirst indicators of warm molecular gas inside the cavities werenear-infrared observations of CO rovibrational lines, in several
1
N. van der Marel et al.: Gas cavities in transitional disks
cases revealing a gas cavity that was indeed smaller than thedustcavity (Pontoppidan et al. 2008; Brittain et al. 2009; Salyket al.2009; Brown et al. 2012). As a result of a combination of highcritical densities and non-LTE excitation, rovibrationalCO datacan be difficult to interpret, and derived gas masses are highlymodel-dependent.
To properly derive the molecular gas densities, CO purerotational line observations are required. For a handful ofdisks, pioneering interferometers such as SMA and PdBI haverevealed gas inside the cavity through CO rotational lines:AB Aur (Pietu et al. 2005), GM Aur (Dutrey et al. 2008), andHD 135344B (Lyo et al. 2011). Spatially resolved ALMA ob-servations of12CO emission confirm the presence of gas in-side the dust cavity for several other disks (van der Marel etal.2013; Casassus et al. 2013; Perez et al. 2014; Zhang et al. 2014;Canovas et al. 2015). Using a disk model based on the dust struc-ture derived from the SED and millimeter imaging, the12COdata suggest a gas density decrease of one or two orders ofmagnitude inside the dust cavity compared to the density pro-file of the outer disk (van der Marel et al. 2015b). On the otherhand, the dust density decreased by at least three orders of mag-nitude inside the cavity. For IRS 48 and J1604-2130, the gascavities are sufficiently empty so that12CO becomes opticallythin inside the dust cavity, and it was found that the gas cav-ity radius is indeed smaller than the dust cavity (Bruderer et al.2014; Zhang et al. 2014; van der Marel et al. 2015b), consistentwith predictions for the planet-disk interaction. The sameresultwas found for HD 142527 using CO isotopolog observations(Perez et al. 2015).
Since detecting planets in disks is challenging, quantifyingthe gas density structure of the disk inside the cavity can provideimportant clues on the properties of embedded unseen planets.The depth and shape of the gap depend primarily on the planetmass and the disk viscosity (Zhu et al. 2011; Pinilla et al. 2012;Fung et al. 2014). These models show that a planet does not cre-ate a steep gas gap, but a gradual decrease over several AUs.While spatially resolved12CO can provide some informationon the gas density profile, the emission remains optically thickthroughout most of the disk and is thus not a very good absolutedensity tracer. Spatially resolved CO isotopolog observations arerequired to constrain the outer disk mass and the gas cavity ra-dius, as well as the depth and potentially the shape of the gassurface density profile.
Converting CO emission into density is not trivial either:the CO abundance with respect to H2 varies throughout thedisk due to photodissociation by the stellar UV radiation andfreeze-out onto dust grains in the cold regions in the mid-plane and outer disk (van Zadelhoff et al. 2001; Aikawa et al.2002). CO photodissociation is subject to self-shielding.AsCO isotopologs have lower abundances, they are not self-shielded until deeper into a cloud or disk (Bally & Langer 1982;van Dishoeck & Black 1988; Visser et al. 2009). Therefore, diskmodels that do not include isotope-selective photodissociationpredict higher CO abundances than when this effect is included,as recently demonstrated by Miotello et al. (2014). In addition,the gas temperature is decoupled from the dust temperature inthe upper layers in the disk and at the directly heated cav-ity wall (e.g., Kamp & Dullemond 2004; Jonkheid et al. 2004;Gorti & Hollenbach 2008). For a proper interpretation of COemission, the physical and chemical structure of gas and dustneeds to be modeled. We make use of physical-chemical mod-eling with DALI (Bruderer et al. 2012; Bruderer 2013), whichsimultaneously solves the heating-cooling balance of the gas
and chemistry to determine the gas temperature, molecular abun-dances, and molecular excitation for a given density structure.
In this paper, we present ALMA Cycle 1 and 2 observa-tions of CO isotopologs13CO and C18O at∼ 0.2 − 0.25′′ res-olution of four additional well-studied transitional disks: SR 21,HD135344B, DoAr44, and IRS 48. For IRS 48, the 6–5 tran-sitions are observed and for the other disks the lower 3–2transitions. Previously derived models from12CO ALMA ob-servations (Bruderer et al. 2014; van der Marel et al. 2015b)ofIRS 48, SR 21 and HD135344B are used as a starting point foranalyzing the isotopologs. With DALI we determine a gas den-sity structure that is consistent with the CO observations,SED,and continuum dust interferometry. Information on the hot gasand dust from the literature is included. The goals of this studyare to determine the gas surface density profile, specificially thesize, depth, and shape of the gas density structure inside the dustcavity, to constrain the properties of potential embedded planets.
The paper is structured as follows. In Sect. 2.1 we describethe details of the ALMA observations. In Sect. 2.2 we presentmoment maps of the13CO and18CO observations. The model-ing approach is presented in Sect. 3. Section 4 presents the mod-eling results. Section 5 discusses the implications for embeddedplanets in the disk.
2. Data
The observations were obtained during ALMA Cycle 1 and 2 inJune and July 2014, with baselines ranging from 20 to 1100 m,probing scales from 0.15 to 8 arcseconds. The sources and theirproperties are summarized in Table 2.
2.1. Observational details
The disks SR 21, HD 135344B, and DoAr 44 were observed inALMA Cycle 1 program 2012.1.00158.S (PI van Dishoeck) inBand 7 (∼335 GHz or 896µm) with a resulting spatial resolu-tion of 0.2–0.25”. The observations were taken in four spectralwindows of 3840 channels: three windows have a bandwidth of469 MHz (channel width 122 kHz, equivalent to 0.1 km s−1),centered on the13CO 3–2, C18O 3–2, and CN 3–2 transitionswith rest frequencies of 330.58796, 329.33056, and 340.24778GHz, respectively. The fourth spectral window was centeredon342.15000 GHz with a bandwidth of 1875 MHz (channel width488 kHz, equivalent to 0.5 km s−1) aimed at higher continuumsensitivity. The total continuum bandwidth was∼3.2 GHz. ForHD135344B, the flux was calibrated using Ceres, and J1427-4206 was used for calibration of both bandpass and gain. SR 21and DoAr 44 were observed in one scheduling block, with Titanas flux calibrator, J1517-2422 as bandpass calibrator, and J1625-2527 as gain calibrator. In both objects, the flux calibrator(Ceresresp. Titan) is highly resolved on long baselines. The gain cali-bration on the flux calibrator was thus performed using a sub-set of the antennas. The total on-source integration time was30 minutes each for SR 21 and DoAr 44, and 54 minutes forHD 135344B.
IRS 48 was observed in ALMA Cycle 2 program2013.1.00100.S (PI van der Marel) in Band 9 (∼680 GHz or 440µm) with a resulting spatial resolution of 0.15–0.2”. The obser-vations were taken in four spectral windows of 1920 channels:three windows with a bandwidth of 937.5 MHz (channel width488 kHz or 0.3 km s−1), centered on the13CO 6–5, C18O 6–5and H2CO 9–8 transitions with rest frequencies of 661.067276,658.553278 and 674.80978 GHz, respectively. The fourth spec-tral window was centered on 672 GHz with a bandwidth of 1875
2
N. van der Marel et al.: Gas cavities in transitional disks
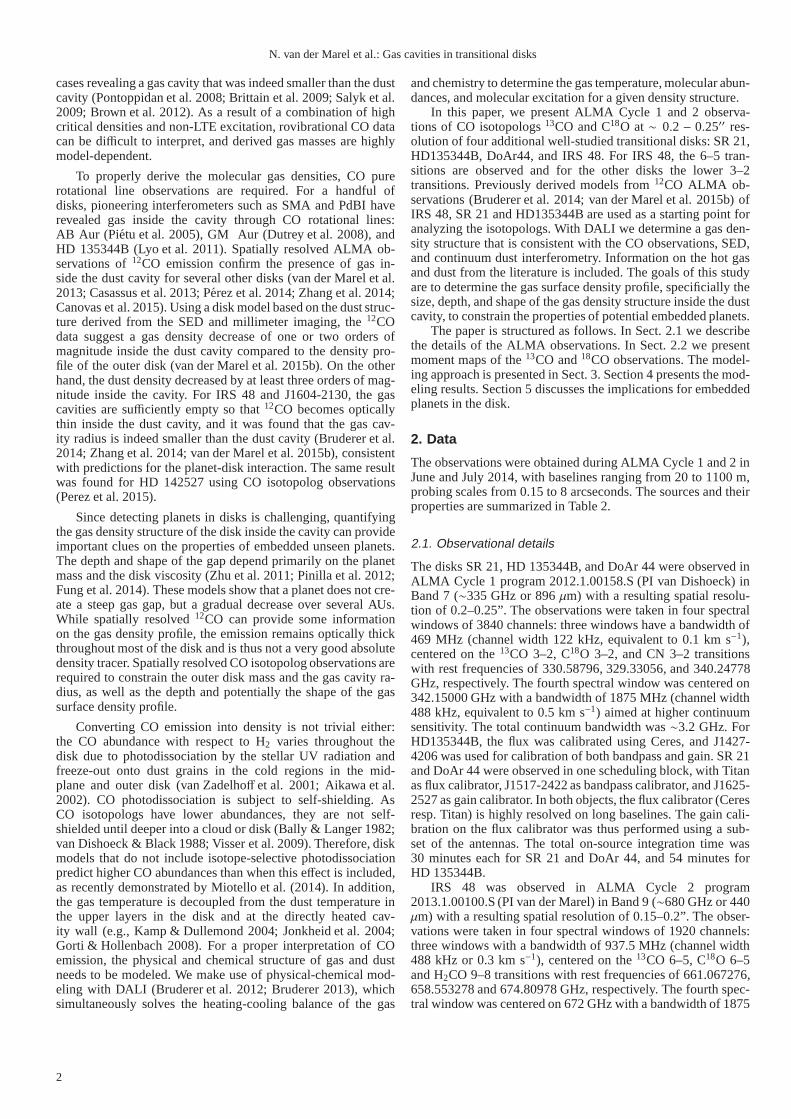
Fig. 1. ALMA observations of the continuum,13CO and C18O 3-2 lines of the first three targets.Top left: zero-moment13CO map.Top middle: Continuum map.Top right: 13CO spectrum integrated over the entire disk.Bottom left: zero-moment C18O map.Bottom middle: first moment13CO map (velocity map).Bottom right: C18O spectrum integrated over the entire disk. The beamis indicated in each map by a white ellipse in the lower left corner. The dotted white ellipse indicates the dust cavity radius.
MHz (channel width 977 kHz or 0.5 km s−1) aimed at highercontinuum sensitivity. The total continuum bandwidth was∼4.7
GHz. The flux was calibrated using J1517-243, the bandpasswith J1427-4206 and the gain with J1626-2951. J1700-2610 was
3
N. van der Marel et al.: Gas cavities in transitional disks
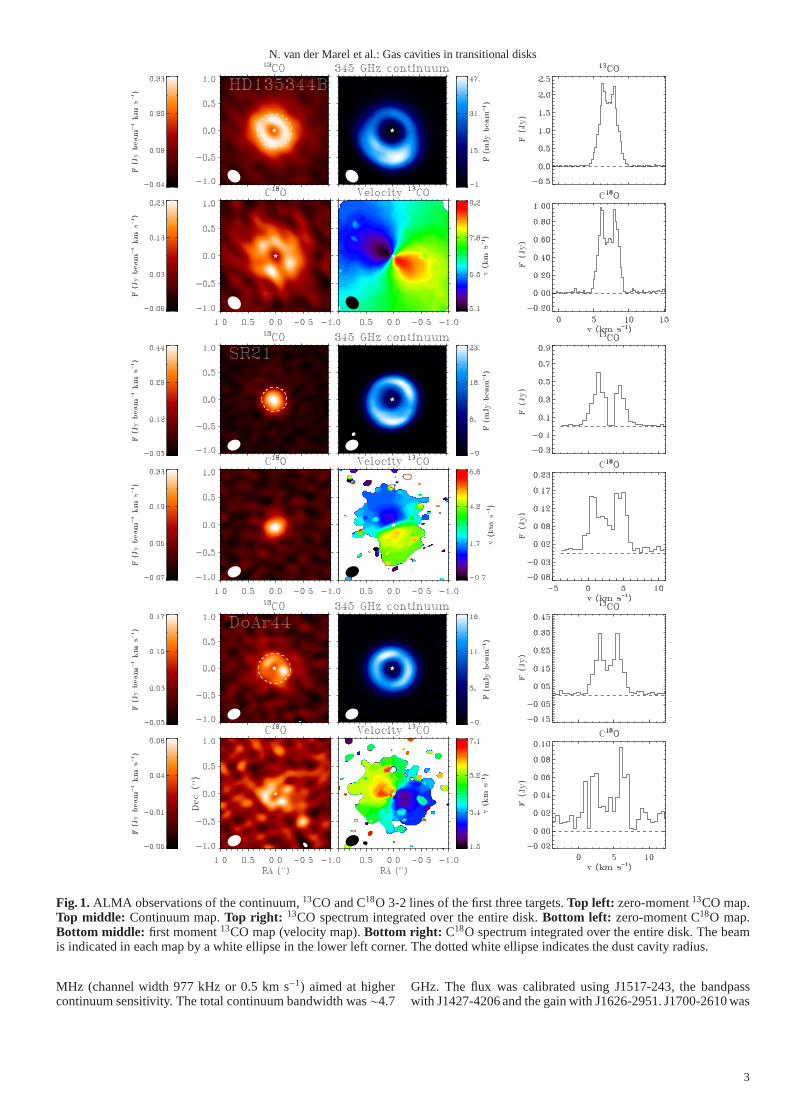
Fig. 2. ALMA observations of the continuum, the13CO and C18O 6-5 lines of the fourth target.Top left: zero-moment13CO map.Top middle: Continuum map.Top right: 13CO spectrum integrated over the entire disk.Bottom left: zero-moment C18O map.Bottom middle: first moment13CO map (velocity map).Bottom right: C18O spectrum integrated over the entire disk. The beamis indicated in each map by a white ellipse in the lower left corner. The dotted white ellipse indicates the dust cavity radius.
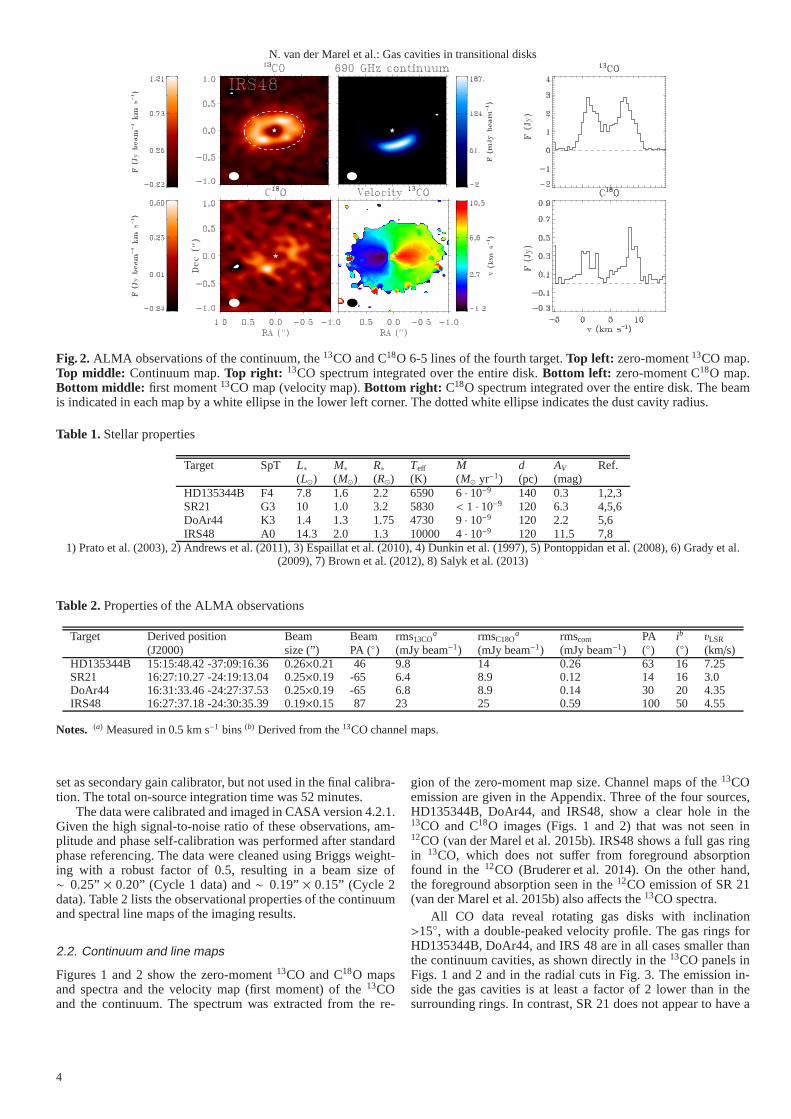
Table 1. Stellar properties
Target SpT L∗ M∗ R∗ Teff M d AV Ref.(L⊙) (M⊙) (R⊙) (K) (M⊙ yr−1) (pc) (mag)
HD135344B F4 7.8 1.6 2.2 6590 6· 10−9 140 0.3 1,2,3SR21 G3 10 1.0 3.2 5830 < 1 · 10−9 120 6.3 4,5,6DoAr44 K3 1.4 1.3 1.75 4730 9· 10−9 120 2.2 5,6IRS48 A0 14.3 2.0 1.3 10000 4· 10−9 120 11.5 7,8
1) Prato et al. (2003), 2) Andrews et al. (2011), 3) Espaillatet al. (2010), 4) Dunkin et al. (1997), 5) Pontoppidan et al. (2008), 6) Grady et al.(2009), 7) Brown et al. (2012), 8) Salyk et al. (2013)
Table 2. Properties of the ALMA observations
Target Derived position Beam Beam rms13COa rmsC18O
a rmscont PA ib3LSR
(J2000) size (”) PA (◦) (mJy beam−1) (mJy beam−1) (mJy beam−1) (◦) (◦) (km/s)HD135344B 15:15:48.42 -37:09:16.36 0.26×0.21 46 9.8 14 0.26 63 16 7.25SR21 16:27:10.27 -24:19:13.04 0.25×0.19 -65 6.4 8.9 0.12 14 16 3.0DoAr44 16:31:33.46 -24:27:37.53 0.25×0.19 -65 6.8 8.9 0.14 30 20 4.35IRS48 16:27:37.18 -24:30:35.39 0.19×0.15 87 23 25 0.59 100 50 4.55
Notes. (a) Measured in 0.5 km s−1 bins (b) Derived from the13CO channel maps.
set as secondary gain calibrator, but not used in the final calibra-tion. The total on-source integration time was 52 minutes.
The data were calibrated and imaged in CASA version 4.2.1.Given the high signal-to-noise ratio of these observations, am-plitude and phase self-calibration was performed after standardphase referencing. The data were cleaned using Briggs weight-ing with a robust factor of 0.5, resulting in a beam size of∼ 0.25” × 0.20” (Cycle 1 data) and∼ 0.19” × 0.15” (Cycle 2data). Table 2 lists the observational properties of the continuumand spectral line maps of the imaging results.
2.2. Continuum and line maps
Figures 1 and 2 show the zero-moment13CO and C18O mapsand spectra and the velocity map (first moment) of the13COand the continuum. The spectrum was extracted from the re-
gion of the zero-moment map size. Channel maps of the13COemission are given in the Appendix. Three of the four sources,HD135344B, DoAr44, and IRS48, show a clear hole in the13CO and C18O images (Figs. 1 and 2) that was not seen in12CO (van der Marel et al. 2015b). IRS48 shows a full gas ringin 13CO, which does not suffer from foreground absorptionfound in the12CO (Bruderer et al. 2014). On the other hand,the foreground absorption seen in the12CO emission of SR 21(van der Marel et al. 2015b) also affects the13CO spectra.
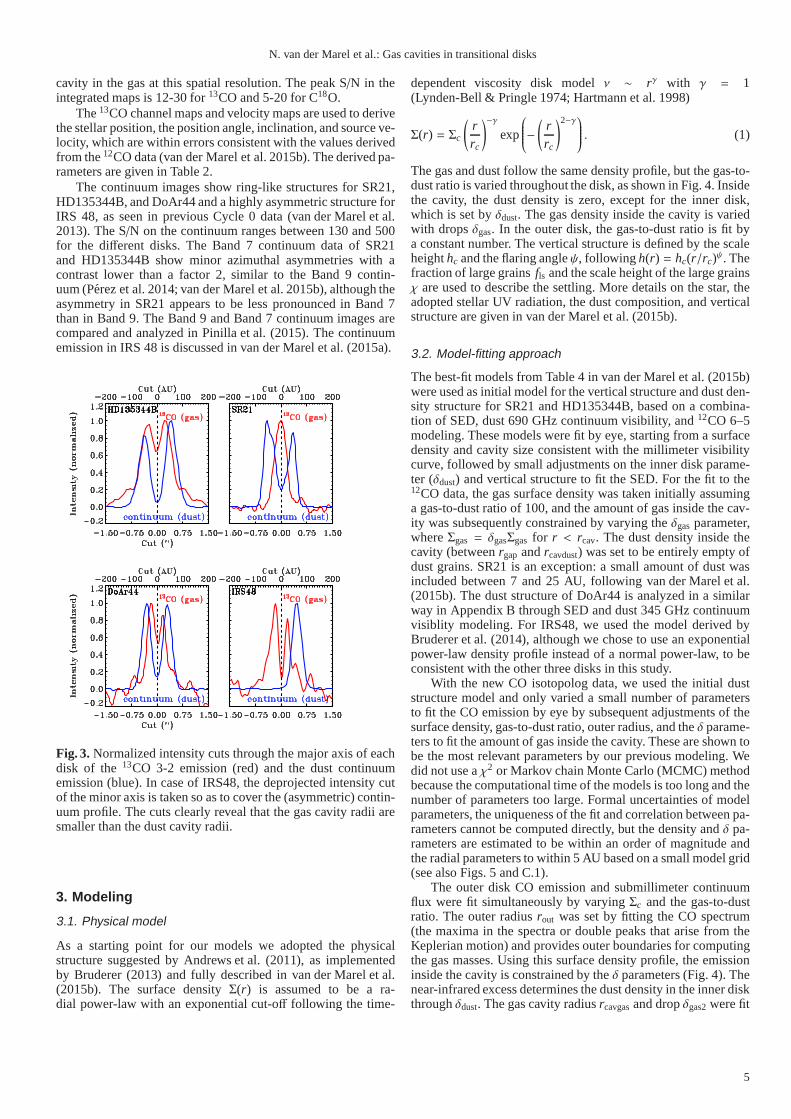
All CO data reveal rotating gas disks with inclination>15◦, with a double-peaked velocity profile. The gas rings forHD135344B, DoAr44, and IRS 48 are in all cases smaller thanthe continuum cavities, as shown directly in the13CO panels inFigs. 1 and 2 and in the radial cuts in Fig. 3. The emission in-side the gas cavities is at least a factor of 2 lower than in thesurrounding rings. In contrast, SR 21 does not appear to havea
4
N. van der Marel et al.: Gas cavities in transitional disks
cavity in the gas at this spatial resolution. The peak S/N in theintegrated maps is 12-30 for13CO and 5-20 for C18O.
The13CO channel maps and velocity maps are used to derivethe stellar position, the position angle, inclination, andsource ve-locity, which are within errors consistent with the values derivedfrom the12CO data (van der Marel et al. 2015b). The derived pa-rameters are given in Table 2.
The continuum images show ring-like structures for SR21,HD135344B, and DoAr44 and a highly asymmetric structure forIRS 48, as seen in previous Cycle 0 data (van der Marel et al.2013). The S/N on the continuum ranges between 130 and 500for the different disks. The Band 7 continuum data of SR21and HD135344B show minor azimuthal asymmetries with acontrast lower than a factor 2, similar to the Band 9 contin-uum (Perez et al. 2014; van der Marel et al. 2015b), althoughtheasymmetry in SR21 appears to be less pronounced in Band 7than in Band 9. The Band 9 and Band 7 continuum images arecompared and analyzed in Pinilla et al. (2015). The continuumemission in IRS 48 is discussed in van der Marel et al. (2015a).
Fig. 3. Normalized intensity cuts through the major axis of eachdisk of the 13CO 3-2 emission (red) and the dust continuumemission (blue). In case of IRS48, the deprojected intensity cutof the minor axis is taken so as to cover the (asymmetric) contin-uum profile. The cuts clearly reveal that the gas cavity radiiaresmaller than the dust cavity radii.
3. Modeling
3.1. Physical model
As a starting point for our models we adopted the physicalstructure suggested by Andrews et al. (2011), as implementedby Bruderer (2013) and fully described in van der Marel et al.(2015b). The surface densityΣ(r) is assumed to be a ra-dial power-law with an exponential cut-off following the time-
dependent viscosity disk modelν ∼ rγ with γ = 1(Lynden-Bell & Pringle 1974; Hartmann et al. 1998)
Σ(r) = Σc
(
rrc
)−γ
exp
−(
rrc
)2−γ
. (1)
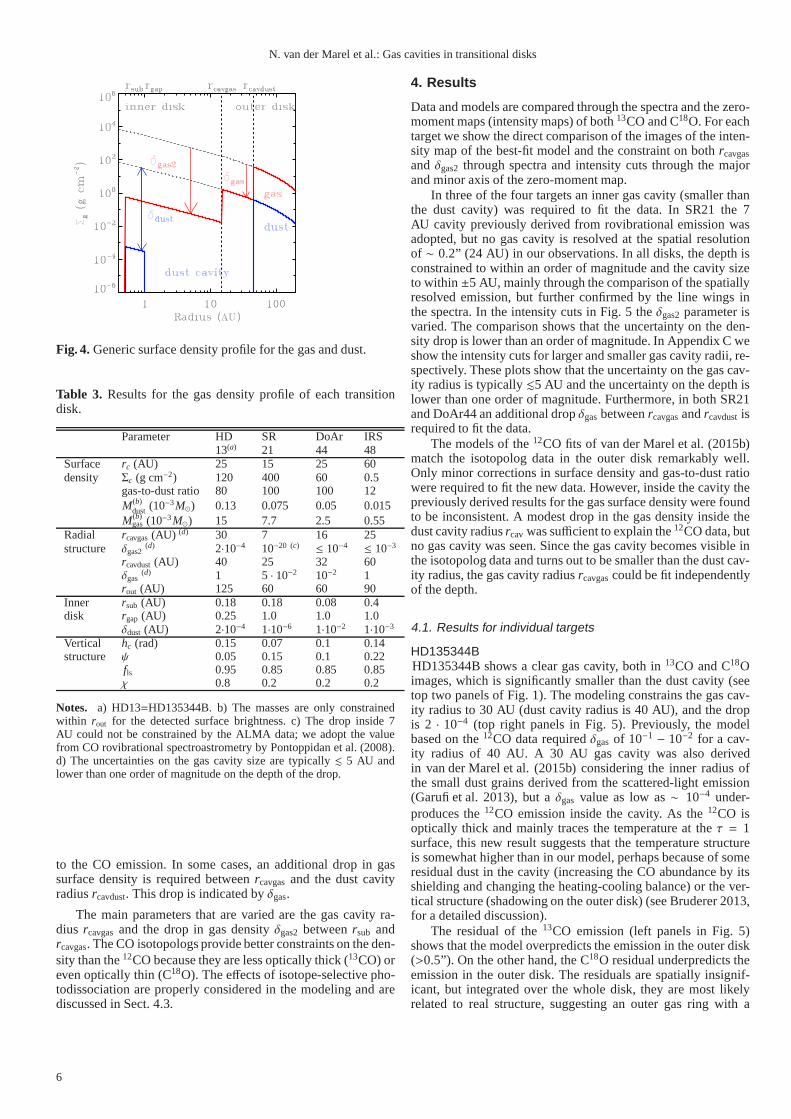
The gas and dust follow the same density profile, but the gas-to-dust ratio is varied throughout the disk, as shown in Fig. 4. Insidethe cavity, the dust density is zero, except for the inner disk,which is set byδdust. The gas density inside the cavity is variedwith dropsδgas. In the outer disk, the gas-to-dust ratio is fit bya constant number. The vertical structure is defined by the scaleheighthc and the flaring angleψ, following h(r) = hc(r/rc)ψ. Thefraction of large grainsfls and the scale height of the large grainsχ are used to describe the settling. More details on the star, theadopted stellar UV radiation, the dust composition, and verticalstructure are given in van der Marel et al. (2015b).
3.2. Model-fitting approach
The best-fit models from Table 4 in van der Marel et al. (2015b)were used as initial model for the vertical structure and dust den-sity structure for SR21 and HD135344B, based on a combina-tion of SED, dust 690 GHz continuum visibility, and12CO 6–5modeling. These models were fit by eye, starting from a surfacedensity and cavity size consistent with the millimeter visibilitycurve, followed by small adjustments on the inner disk parame-ter (δdust) and vertical structure to fit the SED. For the fit to the12CO data, the gas surface density was taken initially assuminga gas-to-dust ratio of 100, and the amount of gas inside the cav-ity was subsequently constrained by varying theδgas parameter,whereΣgas = δgasΣgas for r < rcav. The dust density inside thecavity (betweenrgap andrcavdust) was set to be entirely empty ofdust grains. SR21 is an exception: a small amount of dust wasincluded between 7 and 25 AU, following van der Marel et al.(2015b). The dust structure of DoAr44 is analyzed in a similarway in Appendix B through SED and dust 345 GHz continuumvisiblity modeling. For IRS48, we used the model derived byBruderer et al. (2014), although we chose to use an exponentialpower-law density profile instead of a normal power-law, to beconsistent with the other three disks in this study.
With the new CO isotopolog data, we used the initial duststructure model and only varied a small number of parametersto fit the CO emission by eye by subsequent adjustments of thesurface density, gas-to-dust ratio, outer radius, and theδ parame-ters to fit the amount of gas inside the cavity. These are showntobe the most relevant parameters by our previous modeling. Wedid not use aχ2 or Markov chain Monte Carlo (MCMC) methodbecause the computational time of the models is too long and thenumber of parameters too large. Formal uncertainties of modelparameters, the uniqueness of the fit and correlation between pa-rameters cannot be computed directly, but the density andδ pa-rameters are estimated to be within an order of magnitude andthe radial parameters to within 5 AU based on a small model grid(see also Figs. 5 and C.1).
The outer disk CO emission and submillimeter continuumflux were fit simultaneously by varyingΣc and the gas-to-dustratio. The outer radiusrout was set by fitting the CO spectrum(the maxima in the spectra or double peaks that arise from theKeplerian motion) and provides outer boundaries for computingthe gas masses. Using this surface density profile, the emissioninside the cavity is constrained by theδ parameters (Fig. 4). Thenear-infrared excess determines the dust density in the inner diskthroughδdust. The gas cavity radiusrcavgasand dropδgas2were fit
5
N. van der Marel et al.: Gas cavities in transitional disks
Fig. 4. Generic surface density profile for the gas and dust.
Table 3. Results for the gas density profile of each transitiondisk.
Parameter HD SR DoAr IRS13(a) 21 44 48
Surface rc (AU) 25 15 25 60density Σc (g cm−2) 120 400 60 0.5
gas-to-dust ratio 80 100 100 12M(b)
dust (10−3M⊙) 0.13 0.075 0.05 0.015M(b)
gas (10−3M⊙) 15 7.7 2.5 0.55Radial rcavgas(AU) (d) 30 7 16 25structure δgas2
(d) 2·10−4 10−20 (c) ≤ 10−4 ≤ 10−3
rcavdust(AU) 40 25 32 60δgas
(d) 1 5 · 10−2 10−2 1rout (AU) 125 60 60 90
Inner rsub (AU) 0.18 0.18 0.08 0.4disk rgap (AU) 0.25 1.0 1.0 1.0
δdust (AU) 2·10−4 1·10−6 1·10−2 1·10−3
Vertical hc (rad) 0.15 0.07 0.1 0.14structure ψ 0.05 0.15 0.1 0.22
fls 0.95 0.85 0.85 0.85χ 0.8 0.2 0.2 0.2
Notes. a) HD13=HD135344B. b) The masses are only constrainedwithin rout for the detected surface brightness. c) The drop inside 7AU could not be constrained by the ALMA data; we adopt the valuefrom CO rovibrational spectroastrometry by Pontoppidan etal. (2008).d) The uncertainties on the gas cavity size are typically. 5 AU andlower than one order of magnitude on the depth of the drop.
to the CO emission. In some cases, an additional drop in gassurface density is required betweenrcavgasand the dust cavityradiusrcavdust. This drop is indicated byδgas.
The main parameters that are varied are the gas cavity ra-dius rcavgasand the drop in gas densityδgas2 betweenrsub andrcavgas. The CO isotopologs provide better constraints on the den-sity than the12CO because they are less optically thick (13CO) oreven optically thin (C18O). The effects of isotope-selective pho-todissociation are properly considered in the modeling andarediscussed in Sect. 4.3.
4. Results
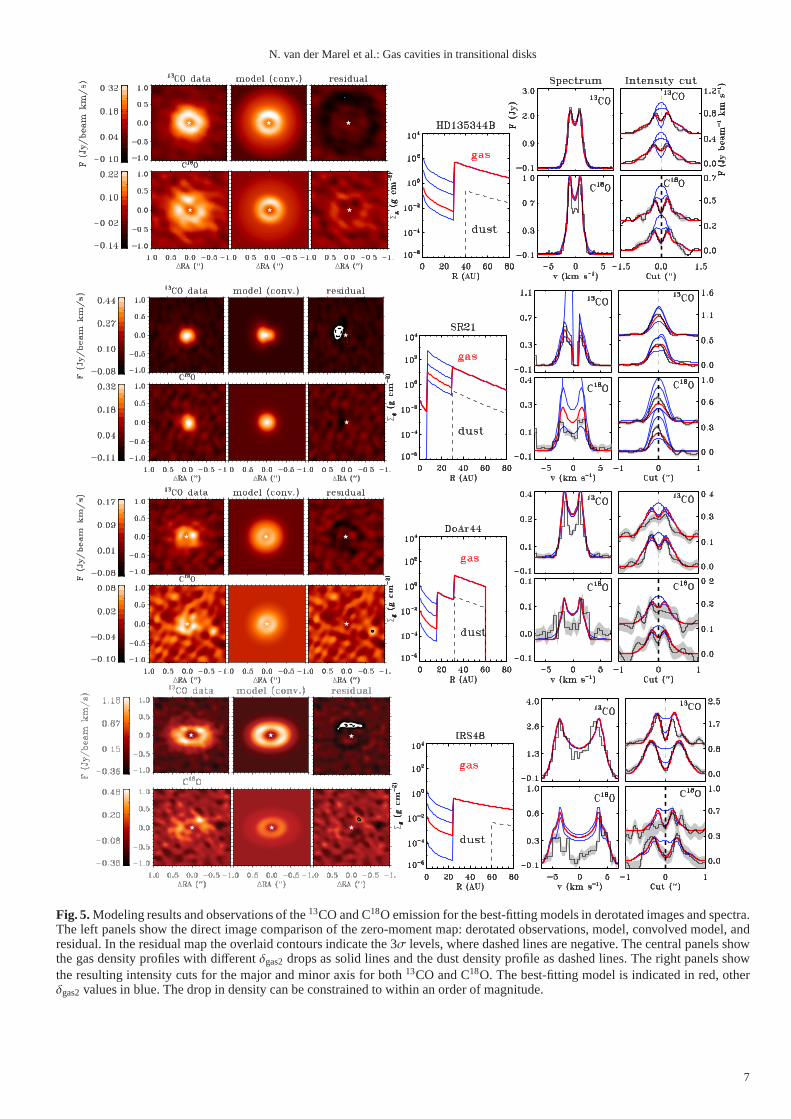
Data and models are compared through the spectra and the zero-moment maps (intensity maps) of both13CO and C18O. For eachtarget we show the direct comparison of the images of the inten-sity map of the best-fit model and the constraint on bothrcavgasandδgas2 through spectra and intensity cuts through the majorand minor axis of the zero-moment map.
In three of the four targets an inner gas cavity (smaller thanthe dust cavity) was required to fit the data. In SR21 the 7AU cavity previously derived from rovibrational emission wasadopted, but no gas cavity is resolved at the spatial resolutionof ∼ 0.2” (24 AU) in our observations. In all disks, the depth isconstrained to within an order of magnitude and the cavity sizeto within±5 AU, mainly through the comparison of the spatiallyresolved emission, but further confirmed by the line wings inthe spectra. In the intensity cuts in Fig. 5 theδgas2parameter isvaried. The comparison shows that the uncertainty on the den-sity drop is lower than an order of magnitude. In Appendix C weshow the intensity cuts for larger and smaller gas cavity radii, re-spectively. These plots show that the uncertainty on the gascav-ity radius is typically.5 AU and the uncertainty on the depth islower than one order of magnitude. Furthermore, in both SR21and DoAr44 an additional dropδgasbetweenrcavgasandrcavdustisrequired to fit the data.
The models of the12CO fits of van der Marel et al. (2015b)match the isotopolog data in the outer disk remarkably well.Only minor corrections in surface density and gas-to-dust ratiowere required to fit the new data. However, inside the cavity thepreviously derived results for the gas surface density werefoundto be inconsistent. A modest drop in the gas density inside thedust cavity radiusrcav was sufficient to explain the12CO data, butno gas cavity was seen. Since the gas cavity becomes visible inthe isotopolog data and turns out to be smaller than the dust cav-ity radius, the gas cavity radiusrcavgascould be fit independentlyof the depth.
4.1. Results for individual targets
HD135344BHD135344B shows a clear gas cavity, both in13CO and C18Oimages, which is significantly smaller than the dust cavity (seetop two panels of Fig. 1). The modeling constrains the gas cav-ity radius to 30 AU (dust cavity radius is 40 AU), and the dropis 2 · 10−4 (top right panels in Fig. 5). Previously, the modelbased on the12CO data requiredδgas of 10−1 − 10−2 for a cav-ity radius of 40 AU. A 30 AU gas cavity was also derivedin van der Marel et al. (2015b) considering the inner radius ofthe small dust grains derived from the scattered-light emission(Garufi et al. 2013), but aδgas value as low as∼ 10−4 under-produces the12CO emission inside the cavity. As the12CO isoptically thick and mainly traces the temperature at theτ = 1surface, this new result suggests that the temperature structureis somewhat higher than in our model, perhaps because of someresidual dust in the cavity (increasing the CO abundance by itsshielding and changing the heating-cooling balance) or thever-tical structure (shadowing on the outer disk) (see Bruderer2013,for a detailed discussion).
The residual of the13CO emission (left panels in Fig. 5)shows that the model overpredicts the emission in the outer disk(>0.5”). On the other hand, the C18O residual underpredicts theemission in the outer disk. The residuals are spatially insignif-icant, but integrated over the whole disk, they are most likelyrelated to real structure, suggesting an outer gas ring witha
6
N. van der Marel et al.: Gas cavities in transitional disks
Fig. 5. Modeling results and observations of the13CO and C18O emission for the best-fitting models in derotated images and spectra.The left panels show the direct image comparison of the zero-moment map: derotated observations, model, convolved model, andresidual. In the residual map the overlaid contours indicate the 3σ levels, where dashed lines are negative. The central panelsshowthe gas density profiles with differentδgas2drops as solid lines and the dust density profile as dashed lines. The right panels showthe resulting intensity cuts for the major and minor axis forboth13CO and C18O. The best-fitting model is indicated in red, otherδgas2values in blue. The drop in density can be constrained to within an order of magnitude.
7

N. van der Marel et al.: Gas cavities in transitional disks
possible gap. The radius of∼ 100 AU coincides with a sug-gested planet that is launching one of the spiral arms observed inscattered-light observations (Muto et al. 2012). If there is indeeda planet at this large orbit, it is expected to clear a gap in the gas,which might explain the structure in the outer disk. As the focusof this study is on the emission inside the dust cavity, this is notinvestigated further.
SR21Unlike the other disks, the CO emission in SR21 does not appearto have a cavity. Rovibrational CO emission suggests a gas cav-ity of 7 AU radius (Pontoppidan et al. 2008) that remains unre-solved at the ALMA spatial resolution (14 AU diameter∼0.12”).The physical model includes this 7 AU cavity. The12CO emis-sion already indicated a drop in density between 7 AU and thedust cavity radius of 25 AU. The intensity cuts of the CO iso-topologs also suggests a drop in density considering the strengthof the emission (right panels in Fig. 5). According to the modelfitting, this drop is of about two orders of magnitudes.
DoAr44DoAr44 is the only disk in this study with a symmetric dust ring.The dust cavity radius was found to be 32 AU (see AppendixB), using the same modeling approach as in van der Marel et al.(2015b). The cavity size and disk mass are similar to previousstudies of SMA 345 GHz continuum data (Andrews et al. 2011).The drop in dust density inside the cavity (δdustcav) is at least afactor 1000. The CO isotopolog intensity maps have a lower S/Nthan the other disks, probably because of the lower disk mass,but still show a gas cavity that is only half the size of the dustcavity: 16 AU. Theδgas2 inside 16 AU is at most 10−4. An ad-ditional drop in gas density between 16 and 32 AU of 10−2 isrequired to fit the emission (right panels in Fig. 5).
IRS48The CO isotopolog emission in IRS48 confirms the presence ofa gas cavity with a considerably smaller radius than that of thepeak of the dust asymmetry (60 AU), as found by Bruderer et al.(2014), consistent with the 30 AU gas ring found in rovibra-tion CO emission (Brown et al. 2012). To be consistent with themodels of the other disks, we assumed a radial power-law withexponential cut-off instead of a simple power-law as done byBruderer et al. (2014), but a similar vertical structure, densitystructure, and mass are found as in their study. Because DALIconsiders only axisymmetric models, the millimeter continuumasymmetry is not fit: the total submillimeter flux, the VISIR18µm image and the SED are again used to constrain the dustdensity and dust cavity radius. The gas cavity radius is foundto be 25 instead of the 20 AU found by Bruderer et al. (2014),but this is within the uncertainty on the radius, and no additionaldrop between 25 and 60 AU in density is required to fit the emis-sion (right panels in Fig. 5).
13CO shows a full ring of emission. However, the emissionis weaker at the location of the dust trap, as seen in the residualimage (left panels in Fig. 5). The13CO emission is barely opti-cally thick at the dust trap radius of 60 AU (theτ = 1 surface isat the midplane), and the drop in emission is most likely due tothe continuum optical depth or a drop in temperature caused bythe local increase of dust density. The S/N of the C18O emissionis too low to show the gas ring or this local drop in emission, butthe data were used to set constraints on the gas density.
4.2. Gradual drop
The structure with two gas density drops inside the cavity foundin DoAr44 and SR21 (and previously in IRS 48, Bruderer et al.2014) has been interpreted as the result of multiple planetsatdifferent orbits. An alternative explanation is a gradual drop orincreasing surface density profile inside the cavity. To investi-gate this, we ran additional models and replaced the exponentialpower-lawΣ(r) by an increasing exponential law betweenrcavdustandrcavgas, motivated by planet-disk interaction models, follow-ing
Σ(r) = Σ(rcav) · e(r−rcav2)/w, (2)
where the widthw is given by
w =rcav− rcav2
ln(Σ(rcav)/δgas2Σ(rcav2). (3)
The width was chosen to connectΣ(r) at rcavdustandrcavgas, fit-ting δgas2, and no new parameters were introduced. This straightconnection is further motivated by the shape of the gaps in Fig.7 in de Juan Ovelar et al. (2013) of planet-disk interaction mod-els. Using the above relation and the derived cavity radii, thedrop in density is derived again for the best-fitting model (seeFig. 6). The best-fitting values are within a factor of 2 of theδgas2values in the vertical drop model (Table 3): we find 2·10−4,10−3, 2·10−4 , and 5·10−2 for HD135344B, SR21, DoAr44, andIRS48 respectively, although IRS48 is a poor fit compared to thedouble-drop model. However, the outer radius of the slope (rcav)of 60 AU has been constrained from the SED and VISIR imageinstead of from the millimeter continuum, as in the other disks,because of the asymmetric structure. This makes this approachrather uncertain. Another possibility is that a combination withother clearing mechanisms is responsible for the different dropshapes.
4.3. Isotope-selective photodissociation
The main process regulating the survival of CO in disks, pho-todissociation, does not equally affect different CO isotopologs(van Dishoeck & Black 1988).12CO becomes optically thickat low column densities and shields itself throughout the diskfrom the photodissociating flux. On the other hand, less abun-dant isotopologs, like C18O, are not self-shielded until muchdeeper into the disk and continue to be photodissociated. Thisresults in regions where C18O is less abundant than predictedby a constant [16O/18O] ratio found in the interstellar medium.Accordingly, this leads to reduced C18O line intensities. The im-portance of isotope-selective effects varies depending on diskparameters, dust properties, and the stellar far-ultraviolet field(Miotello et al. 2014). The UV field is calculated at each positionin the DALI model taking into account the local dust density.
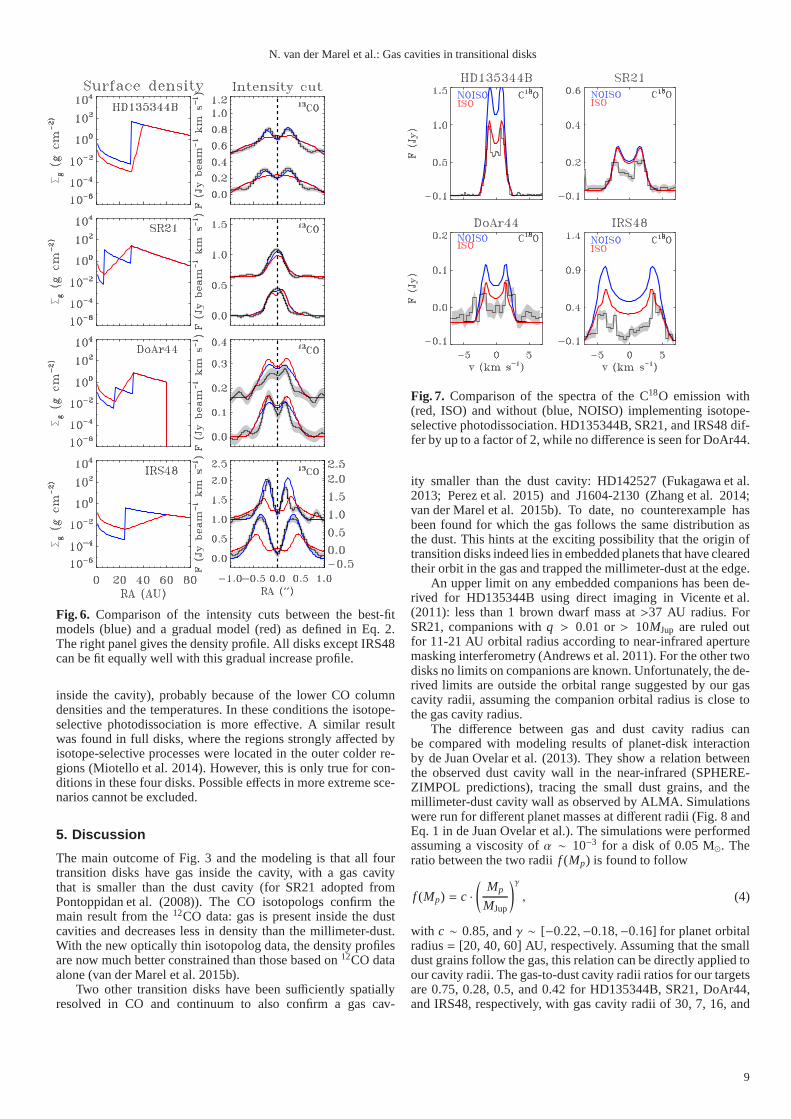
For this reason, isotope-selective photodissociation hasbeenimplemented in the modeling of all disks in our sample. Isotope-selective effects are substantial only for C18O line emission andin the outer disk regions, where the bulk of the gas phase COis located (Fig. 7). The effect on the outer disk emission is notdetectable for SR21. On the other hand, IRS48 has an even lowerdisk mass but shows a significant difference. This may be relatedto the low gas-to-dust ratio in this disk. This shows that isotope-selective photodissociation depends on the combination ofdiskand stellar parameters and not only on the total disk gas mass.
Interestingly, isotope-selective photodissociation only af-fects the CO isotopolog emission in the outer disk (instead of
8
N. van der Marel et al.: Gas cavities in transitional disks
Fig. 6. Comparison of the intensity cuts between the best-fitmodels (blue) and a gradual model (red) as defined in Eq. 2.The right panel gives the density profile. All disks except IRS48can be fit equally well with this gradual increase profile.
inside the cavity), probably because of the lower CO columndensities and the temperatures. In these conditions the isotope-selective photodissociation is more effective. A similar resultwas found in full disks, where the regions strongly affected byisotope-selective processes were located in the outer colder re-gions (Miotello et al. 2014). However, this is only true for con-ditions in these four disks. Possible effects in more extreme sce-narios cannot be excluded.
5. Discussion
The main outcome of Fig. 3 and the modeling is that all fourtransition disks have gas inside the cavity, with a gas cavitythat is smaller than the dust cavity (for SR21 adopted fromPontoppidan et al. (2008)). The CO isotopologs confirm themain result from the12CO data: gas is present inside the dustcavities and decreases less in density than the millimeter-dust.With the new optically thin isotopolog data, the density profilesare now much better constrained than those based on12CO dataalone (van der Marel et al. 2015b).
Two other transition disks have been sufficiently spatiallyresolved in CO and continuum to also confirm a gas cav-
Fig. 7. Comparison of the spectra of the C18O emission with(red, ISO) and without (blue, NOISO) implementing isotope-selective photodissociation. HD135344B, SR21, and IRS48 dif-fer by up to a factor of 2, while no difference is seen for DoAr44.
ity smaller than the dust cavity: HD142527 (Fukagawa et al.2013; Perez et al. 2015) and J1604-2130 (Zhang et al. 2014;van der Marel et al. 2015b). To date, no counterexample hasbeen found for which the gas follows the same distribution asthe dust. This hints at the exciting possibility that the origin oftransition disks indeed lies in embedded planets that have clearedtheir orbit in the gas and trapped the millimeter-dust at theedge.
An upper limit on any embedded companions has been de-rived for HD135344B using direct imaging in Vicente et al.(2011): less than 1 brown dwarf mass at>37 AU radius. ForSR21, companions withq > 0.01 or > 10MJup are ruled outfor 11-21 AU orbital radius according to near-infrared aperturemasking interferometry (Andrews et al. 2011). For the othertwodisks no limits on companions are known. Unfortunately, thede-rived limits are outside the orbital range suggested by our gascavity radii, assuming the companion orbital radius is close tothe gas cavity radius.
The difference between gas and dust cavity radius canbe compared with modeling results of planet-disk interactionby de Juan Ovelar et al. (2013). They show a relation betweenthe observed dust cavity wall in the near-infrared (SPHERE-ZIMPOL predictions), tracing the small dust grains, and themillimeter-dust cavity wall as observed by ALMA. Simulationswere run for different planet masses at different radii (Fig. 8 andEq. 1 in de Juan Ovelar et al.). The simulations were performedassuming a viscosity ofα ∼ 10−3 for a disk of 0.05 M⊙. Theratio between the two radiif (Mp) is found to follow
f (Mp) = c ·(
Mp
MJup
)γ
, (4)
with c ∼ 0.85, andγ ∼ [−0.22,−0.18,−0.16] for planet orbitalradius= [20, 40, 60] AU, respectively. Assuming that the smalldust grains follow the gas, this relation can be directly applied toour cavity radii. The gas-to-dust cavity radii ratios for our targetsare 0.75, 0.28, 0.5, and 0.42 for HD135344B, SR21, DoAr44,and IRS48, respectively, with gas cavity radii of 30, 7, 16, and
9
N. van der Marel et al.: Gas cavities in transitional disks
25 AU. Using theγ = −0.22 relation (closest to our gas cavityradii), planet masses are predicted to be 2, 11, and 25MJup forHD135344B, DoAr44, and IRS48. For SR21, we extrapolateγfor the 7 AU gas cavity radius to be -0.26, resulting in a planetmass of 71 Jupiter masses. The derived masses remain uncertainbecause of the fixed viscosity in the models: a lower viscositywould result in lower masses.
Another way to compare the observations with planet-diskinteraction models is using theδgas2drop value. The outcome ofthe gradual drop model is particularly interesting becauseit bet-ter resembles the shape of the gap carved by a planet, as seen inplanet-disk interaction simulations (Crida et al. 2006; Zhu et al.2011; de Juan Ovelar et al. 2013; Fung et al. 2014). Fung et al.(2014) have derived an analytical prescription based on theout-come of numerical simulations of the depth of the gap, whichcan set constraints on the mass of the planet in combination withthe viscosity in their Eq. 14:
Σgap/Σ0 = 4.7× 10⁻³( q5× 10−3
)−1 (
α
10−2
)1.26(
h/r0.05
)6.12
, (5)
with q the mass ratio between planet and star,α the viscosityparameter,h/r the scale height, andΣgap/Σ0 the drop in density,or δgas2. The equation is only valid forq = 10−4 − 10−2. A simi-lar relation was recently derived by Kanagawa et al. (2015).Thederived parameters can thus provide an estimate for the planetmass, assuming a certain viscosity value. The relation has averystrong dependence onh/r because of the strong dependenciesof the torque on the disk angular frequency. We note that thedisks of these simulations are isothermal to makeh/r constantas a function of radius. Since the gas temperature has in real-ity a strong vertical gradient that is due to the UV heating, es-pecially at the cavity wall, this makes Eq. 5 uncertain. On theother hand, these processes occur close to the midplane, andtheisothermal approximation is not entirely incorrect. In applyingthe relation to our findings,h/r is only marginally constrainedby our models because of the degeneracies in SED modeling. Ash/r = cs/vk, with the sound speedcs ∝
√T andvk the Keplerian
velocity, it can also be computed directly from the derived mid-plane temperatures. We findh/r in our models at the gas cavityradius of 0.077, 0.063, 0.048, and 0.11 for HD135344B, SR21,DoAr44, and IRS48, respectively, which is generally not toodif-ferent from theh/r derived from our radiative transfer modeling.Using these values forh/r in combination with theδgas2valuesderived for the gradual drop models for our disks, planet massescan be derived forα between 10−2 and 10−4. Forα = 10−2, theq-values are> 0.01 (except for DoAr44), which is beyond therange for which the analytical relation was derived. Higherq-values, implying substellar mass companions, would resultineccentric gaps and/or entire disruption of the disk, which is whythe relation is no longer valid. For reasonable planet masses (upto 10 Jupiter masses) that are consistent with the upper limitsfor companions mentioned above, this implies low viscosityval-ues betweenα ∼ 10−3 and 10−4, much lower than found in theTW Hya and HD163296 disks based on turbulent broadening(Hughes et al. 2011).
The estimates derived here remain highly uncertain becauseof the uncertainties in our modeling and the assumptions in thenumerical models: the relation was empirically derived basedon the outcome of numerical simulations with several importantlimitations: the vertical structure is isothermal, accretion ontothe planet is ignored, and the dust and gas are coupled, whichisnot true for a realistic physical disk. However, theδgasorΣgap/Σ0,has been measured for the first time with an accuracy of better
than an order of magnitude with these new observations. Thisparameter is inversely linear withq or planet mass and sets aconstraint on the properties of these potential embedded planets.
6. Conclusions
We have analyzed high spatial resolution ALMA submillimeterobservations of13CO and C18O line emission from four transi-tion disks using full physical-chemical modeling. Using a pre-viously derived surface density model of the dust, based on theSED and millimeter continuum visibilities, a physical model ofthe gas and dust was derived for each of the disks. The structureand amount of gas inside the cavity is the main point of interestas it gives direct information about potential embedded planets.
1. All four disks show a gas cavity that is up to twice as smallin radius as the dust cavity. Two other examples are knownfrom the literature.
2. All disks can be fit to a gas density model with one or twodrops in the gas density inside the cavity.
3. The gas density inside the cavity drops by at least a factorof1000 compared to the gas surface density profile of the outerdisk.
4. An alternative model with a gradual increase of surface den-sity with radius inside the cavity fits the data equally well forthree of the four disks.
5. The derived values of the gas mass from the CO isotopologsare within a factor of a few compared to previously derivedvalues from spatially resolved12CO observations, submil-limeter continuum, and a gas-to-dust ratio of 100. The iso-topologs are crucial for the gas density profile inside the cav-ity, however.
6. The depth of the gas density drop indicates that the viscosi-ties in these disks are low for reasonable companion masses.
These spatially resolved isotopolog data point to embeddedplan-ets as by far the most likely explanation.
Acknowledgements. The authors would like to thank P. Pinilla for useful dis-cussions. Astrochemistry in Leiden is supported by the Netherlands ResearchSchool for Astronomy (NOVA), by a Royal Netherlands Academyof Artsand Sciences (KNAW) professor prize, and by the European Union A-ERCgrant 291141 CHEMPLAN. This paper makes use of the followingALMAdata: ADS/JAO.ALMA/2012.1.00158.S and ADS/JAO.ALMA /2013.1.00100.S.ALMA is a partnership of ESO (representing its member states), NSF (USA)and NINS (Japan), together with NRC (Canada) and NSC and ASIAA (Taiwan),in cooperation with the Republic of Chile. The Joint ALMA Observatory is op-erated by ESO, AUI/NRAO and NAOJ.
ReferencesAikawa, Y., van Zadelhoff, G. J., van Dishoeck, E. F., & Herbst, E. 2002, A&A,
386, 622Andrews, S. M., Wilner, D. J., Espaillat, C., et al. 2011, ApJ, 732, 42Bally, J. & Langer, W. D. 1982, ApJ, 255, 143Bergin, E., Calvet, N., D’Alessio, P., & Herczeg, G. J. 2003,ApJ, 591, L159Brittain, S. D., Najita, J. R., & Carr, J. S. 2009, ApJ, 702, 85Brown, J. M., Blake, G. A., Qi, C., et al. 2009, ApJ, 704, 496Brown, J. M., Herczeg, G. J., Pontoppidan, K. M., & van Dishoeck, E. F. 2012,
ApJ, 744, 116Bruderer, S. 2013, A&A, 559, A46Bruderer, S., van der Marel, N., van Dishoeck, E. F., & van Kempen, T. A. 2014,
A&A, 562, A26Bruderer, S., van Dishoeck, E. F., Doty, S. D., & Herczeg, G. J. 2012, A&A,
541, A91Canovas, H., Schreiber, M. R., Caceres, C., et al. 2015, ApJ, 805, 21Casassus, S., van der Plas, G., M, S. P., et al. 2013, Nature, 493, 191Clarke, C. J., Gendrin, A., & Sotomayor, M. 2001, MNRAS, 328,485Crida, A., Morbidelli, A., & Masset, F. 2006, Icarus, 181, 587
10

N. van der Marel et al.: Gas cavities in transitional disks
de Juan Ovelar, M., Min, M., Dominik, C., et al. 2013, A&A, 560, A111Dodson-Robinson, S. E. & Salyk, C. 2011, ApJ, 738, 131Dunkin, S. K., Barlow, M. J., & Ryan, S. G. 1997, MNRAS, 290, 165Dutrey, A., Guilloteau, S., Pietu, V., et al. 2008, A&A, 490, L15Espaillat, C., D’Alessio, P., Hernandez, J., et al. 2010, ApJ, 717, 441Espaillat, C., Muzerolle, J., Najita, J., et al. 2014, Protostars and Planets VI, 497Fukagawa, M., Tsukagoshi, T., Momose, M., et al. 2013, PASJ,65, L14Fung, J., Shi, J.-M., & Chiang, E. 2014, ApJ, 782, 88Garufi, A., Quanz, S. P., Avenhaus, H., et al. 2013, A&A, 560, A105Gorti, U. & Hollenbach, D. 2008, ApJ, 683, 287Grady, C. A., Schneider, G., Sitko, M. L., et al. 2009, ApJ, 699, 1822Hartmann, L., Calvet, N., Gullbring, E., & D’Alessio, P. 1998, ApJ, 495, 385Hughes, A. M., Wilner, D. J., Andrews, S. M., Qi, C., & Hogerheijde, M. R.
2011, ApJ, 727, 85Ingleby, L., Calvet, N., Bergin, E., et al. 2009, ApJ, 703, L137Jonkheid, B., Faas, F. G. A., van Zadelhoff, G.-J., & van Dishoeck, E. F. 2004,
A&A, 428, 511Kamp, I. & Dullemond, C. P. 2004, ApJ, 615, 991Kanagawa, K. D., Muto, T., Tanaka, H., et al. 2015, ApJ, 806, L15Kraus, A. L. & Ireland, M. J. 2012, ApJ, 745, 5Lynden-Bell, D. & Pringle, J. E. 1974, MNRAS, 168, 603Lyo, A.-R., Ohashi, N., Qi, C., Wilner, D. J., & Su, Y.-N. 2011, AJ, 142, 151Miotello, A., Bruderer, S., & van Dishoeck, E. F. 2014, A&A, 572, A96Muto, T., Grady, C. A., Hashimoto, J., et al. 2012, ApJ, 748, L22Najita, J. R., Strom, S. E., & Muzerolle, J. 2007, MNRAS, 378,369Perez, L. M., Isella, A., Carpenter, J. M., & Chandler, C. J.2014, ApJ, 783, L13Perez, S., Casassus, S., Menard, F., et al. 2015, ApJ, 798, 85Pietu, V., Guilloteau, S., & Dutrey, A. 2005, A&A, 443, 945Pinilla, P., Benisty, M., & Birnstiel, T. 2012, A&A, 545, A81Pinilla, P., van der Marel, N., Perez, L., et al. 2015, A&A, inrev.Pontoppidan, K. M., Blake, G. A., van Dishoeck, E. F., et al. 2008, ApJ, 684,
1323Prato, L., Greene, T. P., & Simon, M. 2003, ApJ, 584, 853Quanz, S. P., Amara, A., Meyer, M. R., et al. 2015, ApJ, 807, 64Quanz, S. P., Amara, A., Meyer, M. R., et al. 2013, ApJ, 766, L1Regaly, Z., Juhasz, A., Sandor, Z., & Dullemond, C. P. 2012, MNRAS, 419,
1701Salyk, C., Blake, G. A., Boogert, A. C. A., & Brown, J. M. 2009,ApJ, 699, 330Salyk, C., Herczeg, G. J., Brown, J. M., et al. 2013, ApJ, 769,21Valenti, J. A., Basri, G., & Johns, C. M. 1993, AJ, 106, 2024van der Marel, N., Pinilla, P., Tobin, J., et al. 2015a, acc. by ApJLvan der Marel, N., van Dishoeck, E. F., Bruderer, S., et al. 2013, Science, 340,
1199van der Marel, N., van Dishoeck, E. F., Bruderer, S., Perez,L., & Isella, A.
2015b, A&A, 579, A106van Dishoeck, E. F. & Black, J. H. 1988, ApJ, 334, 771van Zadelhoff, G.-J., van Dishoeck, E. F., Thi, W.-F., & Blake, G. A. 2001, A&A,
377, 566Vicente, S., Merın, B., Hartung, M., et al. 2011, A&A, 533, A135Visser, R., van Dishoeck, E. F., & Black, J. H. 2009, A&A, 503,323Williams, J. P. & Cieza, L. A. 2011, ARA&A, 49, 67Zhang, K., Isella, A., Carpenter, J. M., & Blake, G. A. 2014, ApJ, 791, 42Zhu, Z., Nelson, R. P., Hartmann, L., Espaillat, C., & Calvet, N. 2011, ApJ, 729,
47
11
N. van der Marel et al.: Gas cavities in transitional disks
Appendix A: Channel maps
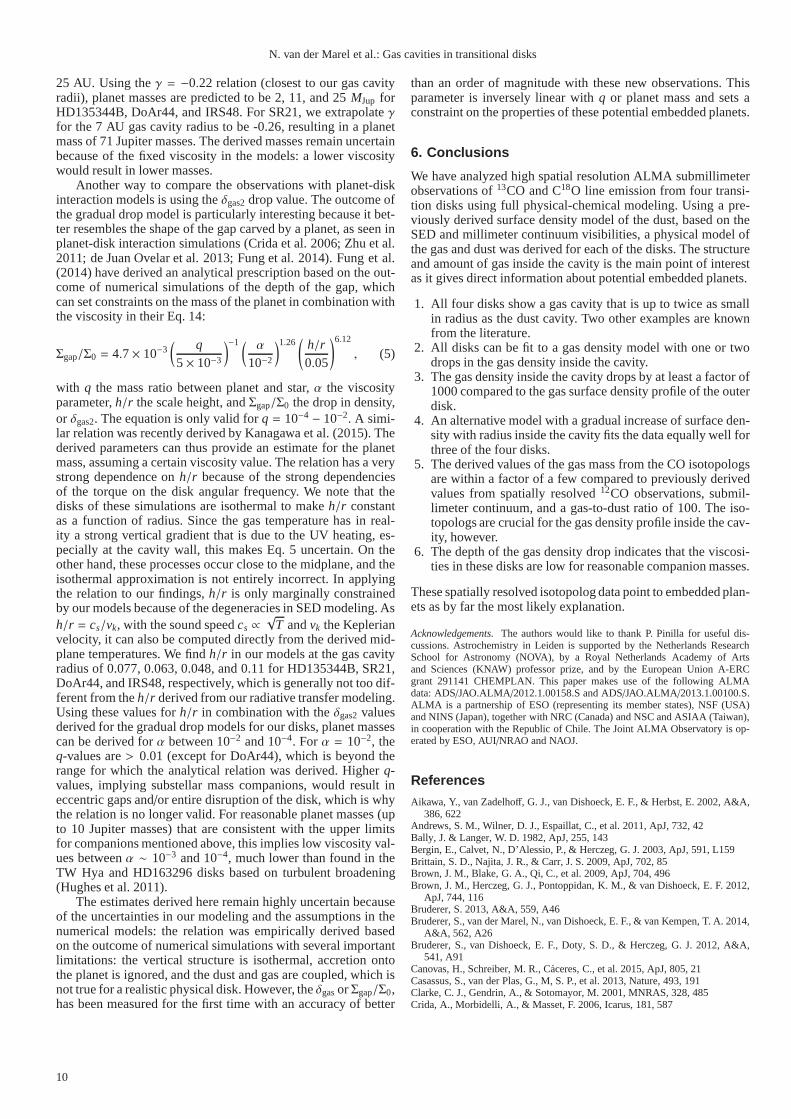
In this section we present the13CO channel maps for each observed target.
Fig. A.1. 13CO channel maps for each observed target. Overlaid in white contours are the Keplerian velocity profiles for the derivedinclination and the given stellar mass.
12
N. van der Marel et al.: Gas cavities in transitional disks
Appendix B: Dust model DoAr44
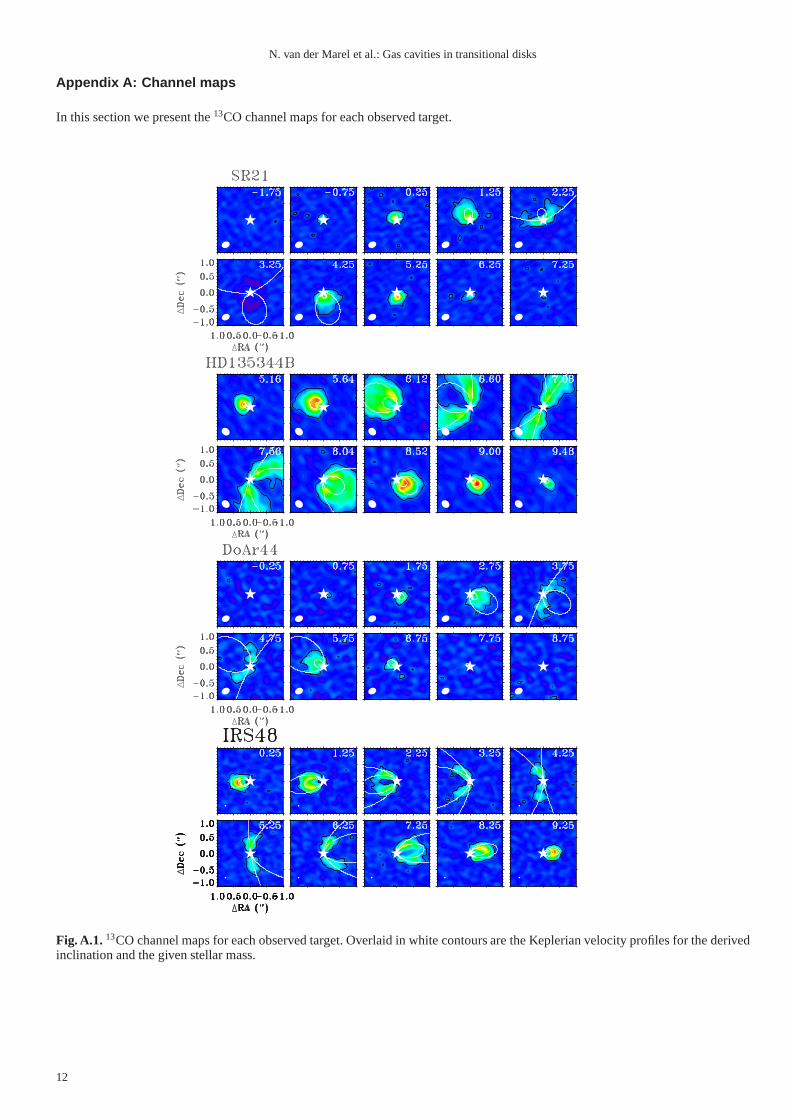
Unlike the other disks, the dust surface density profile of DoAr44 was not yet constrained by ALMA data from previous papers.Using the same approach as in van der Marel et al. (2015b), a model was found by fitting the SED, the 345 GHz continuum visibilitycurve, and the 345 GHz continuum intensity cuts. The cavity size is 32 AU, similar to the previous result by Andrews et al. (2011).The depth of the dust density inside the cavity was constrained by varying theδdustcavbetweenrgap andrcavdust. It was found that thedust density drops by at least a factor 103, similar to the other disks.
Fig. B.1. Modeling results and observations of DoAr44 of the dust surface density, comparingδdustcav ranging between 10−2
and 10−4 as indicated in the right panel. The observations are plotted in black.Left: Spectral energy distribution.Middle left:Amplitude of the 345 GHz continuum visibility for the deprojected baselines. The null line is indicated with a dashed line.Middleright: Normalized intensity cuts through the major (bottom) and minor (top) axis of the 345 GHz continuum image. The modelimages are convolved with the same beam as the ALMA observations.Right: The dust surface density profile. Indicated are theδdust , the drop in density to fit the inner disk through the near-infrared emission, andδdustcav, the minimum drop in dust densityinside the cavity needed to fit the observations.
Appendix C: Additional models
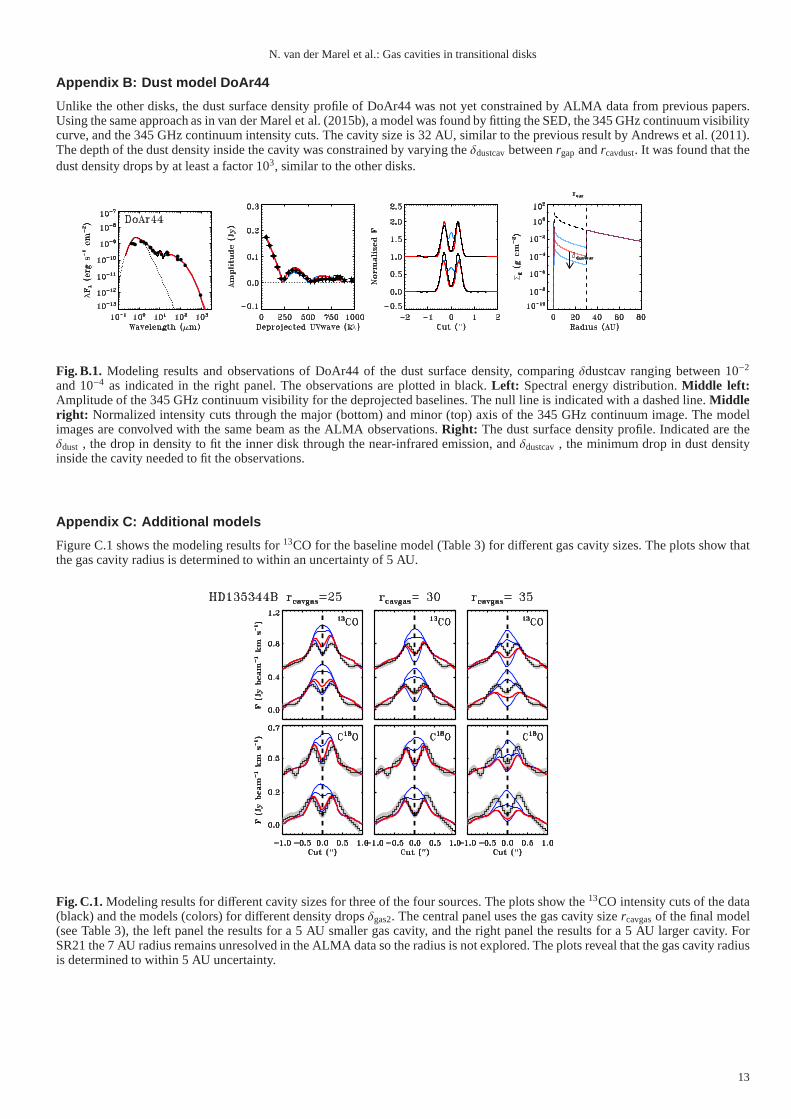
Figure C.1 shows the modeling results for13CO for the baseline model (Table 3) for different gas cavity sizes. The plots show thatthe gas cavity radius is determined to within an uncertaintyof 5 AU.
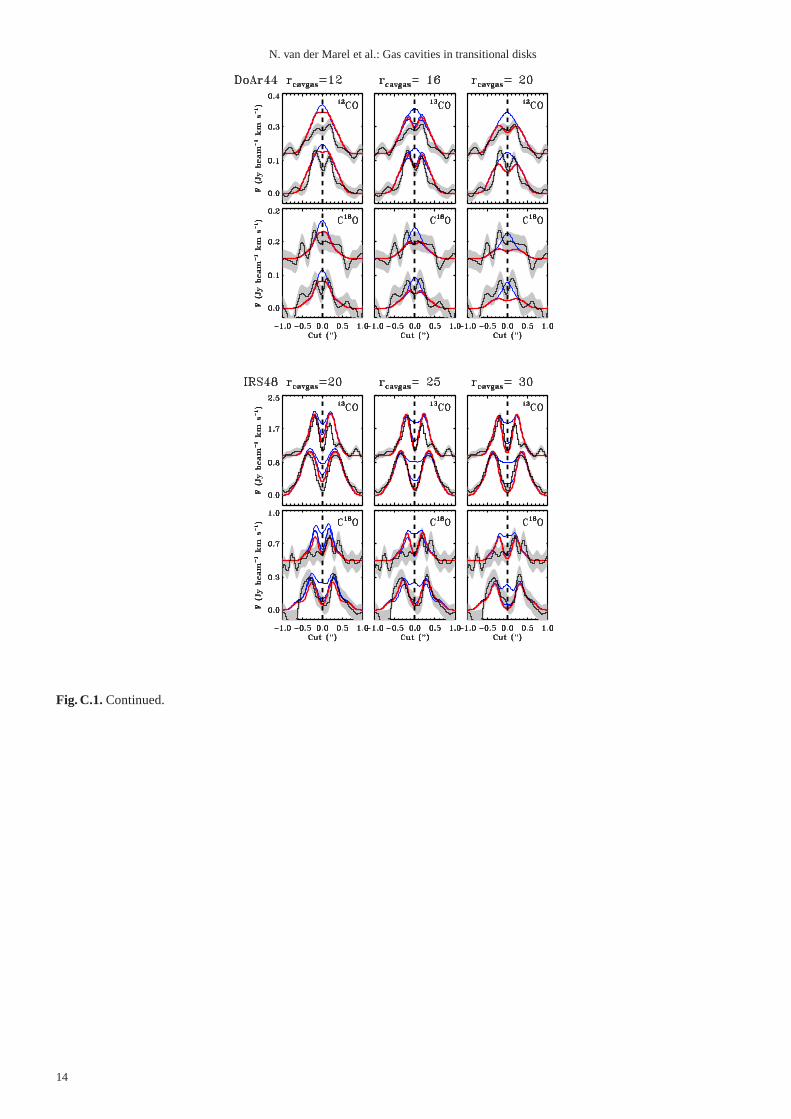
Fig. C.1. Modeling results for different cavity sizes for three of the four sources. The plots show the13CO intensity cuts of the data(black) and the models (colors) for different density dropsδgas2. The central panel uses the gas cavity sizercavgasof the final model(see Table 3), the left panel the results for a 5 AU smaller gascavity, and the right panel the results for a 5 AU larger cavity. ForSR21 the 7 AU radius remains unresolved in the ALMA data so theradius is not explored. The plots reveal that the gas cavity radiusis determined to within 5 AU uncertainty.
13
N. van der Marel et al.: Gas cavities in transitional disks
Fig. C.1. Continued.
14