residual curve mapping and isobaric vapor liquid ... · hexane, cyclohexane, methyl t-butyl ether....
TRANSCRIPT

International Research Journal of Engineering and Technology (IRJET) e-ISSN: 2395 -0056
Volume: 03 Issue: 07 | July-2016 www.irjet.net p-ISSN: 2395-0072
© 2016, IRJET | Impact Factor value: 4.45 | ISO 9001:2008 Certified Journal | Page 889
Residual Curve Mapping and Isobaric Vapor Liquid Equilibrium of
tertiary mixture of Hexane –Cyclohexane-Methyl t-butyl ether.
Shraddha H. Motegaonkar1, Maya mane 2, Rahul k. Kulkarni3, Shambala N. Shinde4
1 Shraddha H. Motegaonkar Master student of chemical engineering, Department of chemical Engineering, Bharati Vidyapeeth Deemed University, College of engineering, pune, Maharashtra, India
[email protected] 2 Maya mane Master student of chemical engineering, Department of chemical Engineering, Bharati Vidyapeeth
Deemed University, College of engineering, pune, Maharashtra, India [email protected] 3Rahul k. Kulkarni, Assistant professor, Department of chemical Engineering, Bharati Vidyapeeth Deemed
University, College of engineering pune, Maharashtra, India [email protected] 4Shambala N. Shinde, d Associate professor, Department of chemical engineering, Bharati Vidyapeeth deemed
university, college of engineering pune, Maharashtra,India [email protected]
---------------------------------------------------------------------***---------------------------------------------------------------------
Abstract - Isobaric or isothermal Vapor-liquid equilibrium data of any tertiary or quaternary systems may be evaluated when they are calculated as activity coefficients. Residual curve mapping is a triangular diagram which is used to describe the relationship between ternary systems. The VLE of this ternary system has evaluated experimentally by using Othmer still at 101.3 kPa. This ternary system does not form any azeotrope.
Key Words: VLE, Residue Curve Map, Ternary system, Hexane, Cyclohexane, Methyl t-butyl ether. 1. INTRODUCTION Distillation is a unit operation which is very common in chemical engineering. It involves separation of two or more liquid components based on their boiling points, when a mixture of compounds is boiling; it will give vapour and liquid components and both should have different compositions. The graph of the molar fractions of the more volatile components in vapour and liquid phases of the mixture in relation to the temperature of the boiling mixture is the vapour-liquid equilibrium curve for the mixture. [1, 2]
1.1 VLE The VLE data for constant temperature and pressure can be gained from dew point diagram and boiling point diagram. Binary mixtures vapour liquid data is obtained as a plot
above shown in fig.1. This diagram shows the bubble point and dew point of the binary mixture at constant pressure. Vle can be finding out by two ways at constant temperature and at constant pressure. This specific VLE data shows the uniform vapor liquid equilibrium binary mixture which is easy to separate. The vapour liquid equilibrium line at particular pressure which gives the composition of liquid and vapor which are in equilibrium. Azeotrope is also important concept in VLE. If the equilibrium curve crosses the diagonal line then it should be considered that there are azeotropic points where the azeotrope occurs. When temperature pressure and compositions have to find out the basis of it is to apply the thermodynamic concept to the vapor liquid equilibrium.[3]
VLE can be calculated as two different ways:
(a) The temperature should be constant:
Suppose any system are having binary components A and B with respect to Routs law,
PA = XA P0A (1)
PB = XBP0B (2)
The sum of the all partial pressures is called as total pressure, with respect to Dalton’s law, this equation is given by: P = XA P0
A + XBP0B (3)
This is two component system , so that substitute XB = (1-XA) P = XA (P0
A- P0B)+ P0
B (4) With respect to Dalton’s law the equation becomes,
pA = yAp (5) pB = yBp = (1 – yA) p (6)
/ = = = α (7)
Relative volatility is the constant which is independent upon composition denoted by α. This is the case for ideal solution.
International Research Journal of Engineering and Technology (IRJET) e-ISSN: 2395 -0056
Volume: 03 Issue: 07 | July-2016 www.irjet.net p-ISSN: 2395-0072
© 2016, IRJET | Impact Factor value: 4.45 | ISO 9001:2008 Certified Journal | Page 890
Relative volatility is also called as “enrichment ratio”. When the constant temperature is dependent upon the total pressure of the vapors phase which is given by,
p = (8)
The relation between the liquid mole fraction of A that of the vapour mole fraction of A which is given by,
yA = (9)
(b) The pressure should be constant In distillation isobaric VLE means pressure has to be constant has a wide importance. The total pressure is given by, (10)
(10) The relation which gives vapors liquid dependence between their constituents which is given by,
yA = (11)
A is a function of temperature; as the temperature varies the ratio of the vapour pressures of the pure constituents also varies but in small range. Because of this α is oftenly considered as constant for the entire calculation of phase equilibrium. None of the data can be accomplished without models for the behavior of systems in vapor liquid equilibrium. [4]
2. Residue curve mapping RCM is used to investigate and visualize vapors liquid equilibrium properties dealing with the distillation modeling and the column for liquid liquid extraction. Many times commercial process simulation software are used to generate the RCMs such as Aspen Plus, Aspen HYSIS or DISTIL. A residue curve map shows the composition of the residue which involves the particular three components over the period of time. According to the time it also indicates the liquid as well as vapors residue composition. When for any ternary system is being plotted on a triangular type of graph which is called as or known as “Residue curve mapping”. In this plot from different starting compositions, different the residue lines show the results. A collection of these curves for a given ternary system is called a “residue curve map” [5]
Fig 2 Basic principal of residue curve mappings
The residue curve mappings are having two main basic characteristics which are as follows:
1. The presence of azeotrope which cannot be crossed by a residue curve that should create the distillation boundaries. These type of distillation boundries can represent the lower boiling pure component residue curves which are the light or starting residue composition. Higher pure component is the heavy or ending composition residue.
2. On the graph any azeotrope for the pure component should connected to some points but not all the pure component points and azeotrope. Those boundaries are thermodynamic in natures which are connected form distillation boundaries.
3. In the distillation regions the boundaries of these distillations can make the partition for the map. [6,7]
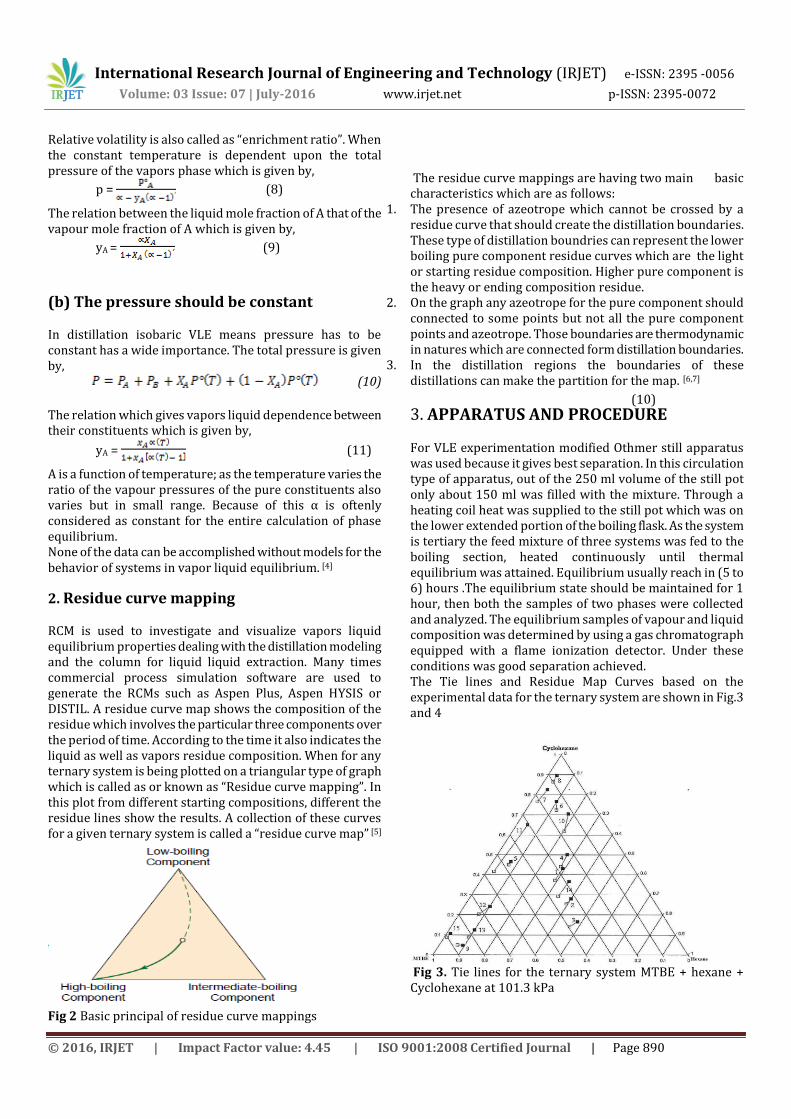
3. APPARATUS AND PROCEDURE For VLE experimentation modified Othmer still apparatus was used because it gives best separation. In this circulation type of apparatus, out of the 250 ml volume of the still pot only about 150 ml was filled with the mixture. Through a heating coil heat was supplied to the still pot which was on the lower extended portion of the boiling flask. As the system is tertiary the feed mixture of three systems was fed to the boiling section, heated continuously until thermal equilibrium was attained. Equilibrium usually reach in (5 to 6) hours .The equilibrium state should be maintained for 1 hour, then both the samples of two phases were collected and analyzed. The equilibrium samples of vapour and liquid composition was determined by using a gas chromatograph equipped with a flame ionization detector. Under these conditions was good separation achieved. The Tie lines and Residue Map Curves based on the experimental data for the ternary system are shown in Fig.3 and 4
Fig 3. Tie lines for the ternary system MTBE + hexane + Cyclohexane at 101.3 kPa
International Research Journal of Engineering and Technology (IRJET) e-ISSN: 2395 -0056
Volume: 03 Issue: 07 | July-2016 www.irjet.net p-ISSN: 2395-0072
© 2016, IRJET | Impact Factor value: 4.45 | ISO 9001:2008 Certified Journal | Page 891
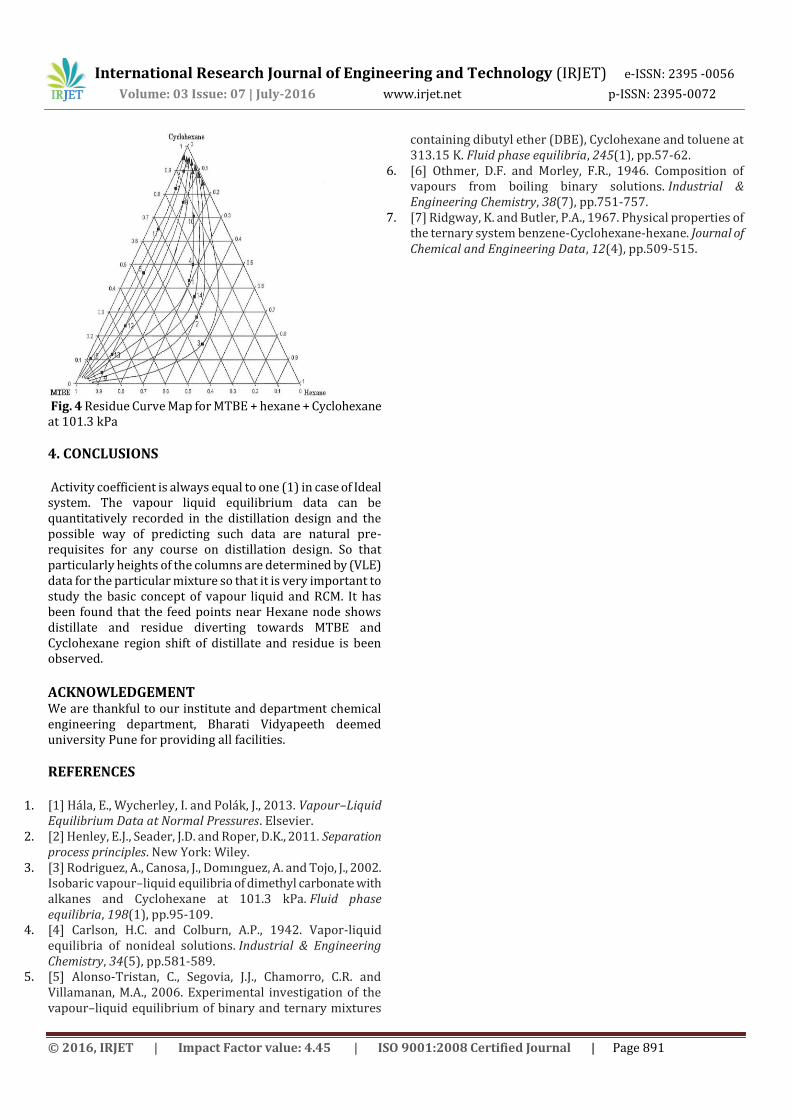
Fig. 4 Residue Curve Map for MTBE + hexane + Cyclohexane at 101.3 kPa
4. CONCLUSIONS Activity coefficient is always equal to one (1) in case of Ideal system. The vapour liquid equilibrium data can be quantitatively recorded in the distillation design and the possible way of predicting such data are natural pre-requisites for any course on distillation design. So that particularly heights of the columns are determined by (VLE) data for the particular mixture so that it is very important to study the basic concept of vapour liquid and RCM. It has been found that the feed points near Hexane node shows distillate and residue diverting towards MTBE and Cyclohexane region shift of distillate and residue is been observed.
ACKNOWLEDGEMENT We are thankful to our institute and department chemical engineering department, Bharati Vidyapeeth deemed university Pune for providing all facilities.
REFERENCES
1. [1] Hála, E., Wycherley, I. and Polák, J., 2013. Vapour–Liquid Equilibrium Data at Normal Pressures. Elsevier.
2. [2] Henley, E.J., Seader, J.D. and Roper, D.K., 2011. Separation process principles. New York: Wiley.
3. [3] Rodriguez, A., Canosa, J., Domınguez, A. and Tojo, J., 2002. Isobaric vapour–liquid equilibria of dimethyl carbonate with alkanes and Cyclohexane at 101.3 kPa. Fluid phase equilibria, 198(1), pp.95-109.
4. [4] Carlson, H.C. and Colburn, A.P., 1942. Vapor-liquid equilibria of nonideal solutions. Industrial & Engineering Chemistry, 34(5), pp.581-589.
5. [5] Alonso-Tristan, C., Segovia, J.J., Chamorro, C.R. and Villamanan, M.A., 2006. Experimental investigation of the vapour–liquid equilibrium of binary and ternary mixtures
containing dibutyl ether (DBE), Cyclohexane and toluene at 313.15 K. Fluid phase equilibria, 245(1), pp.57-62.
6. [6] Othmer, D.F. and Morley, F.R., 1946. Composition of vapours from boiling binary solutions. Industrial & Engineering Chemistry, 38(7), pp.751-757.
7. [7] Ridgway, K. and Butler, P.A., 1967. Physical properties of the ternary system benzene-Cyclohexane-hexane. Journal of Chemical and Engineering Data, 12(4), pp.509-515.