research white paper maritime satellite communications & applications 2016€¦ · ·...
TRANSCRIPT
Maritime Satell ite C o m m u n i c a t i o n s & Applications 2016
Research White Paper
futurenauticsr e s e a r c h
in association with

Maritime Satellite Communications & Applications 2016 | Research White Paperfuturenauticsr e s e a r c h
Published by ©Futurenautics Ltd. 2016 | Suite 4b, 43 Berkeley Square, Mayfair, London, W1J 5FJ, UK For research, consultancy and editorial enquiries T: +44 (0) 20 7 125 0090/ F: +44 (0) 20 7 125 0193 E: [email protected] | www.futurenautics.com
Disclaimer: While every reasonable precaution has been taken in the preparation of this document, neither those quoted nor Futurenautics assume responsibility for errors or omissions, or for damages resulting from the use of the information contained herein.

Maritime Satellite Communications & Applications 2016 | Research White Paper futurenauticsr e s e a r c h
In April 2015 Intelsat, the leading provider of satellite services worldwide, commissioned Futurenautics Research, a leading provider of maritime research and insight to undertake a survey of ship operators and crew within the maritime market.
The objective of the survey was to understand the satellite service implications arising from the maritime market’s current and future deployment of software applications at sea and ashore.
This survey provides insight into the range of satellite solutions and applications currently deployed, and future predicted trends in bandwidth, satellite and application solutions deployment.
The key fi ndings are reproduced here with kind permission of Intelsat.
Introduction
03
Maritime Satellite Communications & Applications 2016 | Research White Paperfuturenauticsr e s e a r c h
The shipping market has traditionally been cyclical in nature, and as a result analysts across industry sectors have been predicting recovery from the pro-longed 2008/9 trough for some time.
However, there is increasing evidence of the de-coupling of GDP growth from demand for world seaborne trade, together with structural changes in the global economy taking place which are making it increasingly diffi cult for ship operators to predict demand.
There is growing acknowledgment that ship-ping has to accept a 'new normal' of low margins and depressed freight rates, but in fact the implica-tions are far greater. It is likely that conditions will become even more challenging in shipping in the future, and in response operators need to funda-mentally change the way that they approach their businesses.
Shipping is an industry where counter-cyclical investments in tonnage rather than a strong focus on delivering value to customers has become the norm and where business decisions can be based on gut-feel rather than solid data. The recent fi nan-cial woes of shipping are well-known, but when the performance of the industry is compared against others over a prolonged period, the results are stark.
Over the past fi fteen years the container ship-ping sector’s return on net assets (RONA) has only been around 3 per cent* compared to the 9 per cent RONA of the S&P 500 over the same period.
The maritime market
challenges
04
* Boston Consulting Group Research
Maritime Satellite Communications & Applications 2016 | Research White Paper futurenauticsr e s e a r c h
Not only is that far lower, it’s also nowhere near enough to cover the approximately 7 per cent cost of capital needed to fi nance the assets deployed, which means value in those companies is actually being destroyed.
Industries everywhere are being disrupted and re-shaped by technology and service innovation, and yet in shipping technology innovation and adoption has tradi-tionally been driven by regulation and compliance, mov-ing at the pace of the slowest.
Operators believe that they are not rewarded for op-erating their vessels beyond compliance and often view technology as a necessary cost of compliance rather than an investment that can drive cross-business effi -ciencies and innovations in the way they operate assets and deliver value to customers.
That view needs to change and there is evidence that it is already beginning to among some operators. We are seeing the emergence of evidence-based decision making in areas such as route optimisation and condi-tion based maintenance, and this is part of the wider Big Data wave in maritime.
Newbuilds are routinely fi tted with large numbers of sensors, and retrofi tting them to older vessels is afford-able. With every sensor reporting data it is conceivable that a vessel could generate up to 60GB of data per day.
05 Industries everywhere are being disrupted and re-shaped by technology and service innovation.
In shipping technology innovation and adoption has traditionally been driven by regulation and compliance, moving at the pace of the slowest.

Maritime Satellite Communications & Applications 2016 | Research White Paperfuturenauticsr e s e a r c h
With fi gures like that it is understandable that some operators feel overwhelmed, but the reality is that pre-qualifying data onboard can signifi cantly reduce the amount which needs to be transmitted ashore to form part of a Big Data initiative.
But the falling cost of microprocessors and the development of the Industrial Internet of Things (IIoT) is seeing the rapid growth of Fog or Edge computing. In this fog/edge model, processing and computing moves to the edge of the network, removing the need for data to be transmitted to a central processor, analysed and commands sent back to the device.
Although new for land-based industries, in many respects it's a concept shipping will fi nd familiar. Traditionally operators have tried to contain operations within the vessel to avoid the high cost of legacy connectivity solutions, so the move towards edge computing should be less challenging.
It is likely that, as more equipment on board begins to generate data, more of the processing of that data will take place on board—a trend that will run alongside and support greater automation and autonomy. The rise of these Smart Ships will see the amount of data it will be neces-sary to transmit fall dramatically, bringing it well within manageable levels.
With these developments in mind, it is perhaps understandable that at the moment Big Data is too often seen as an IT wave and is fi nding traction mainly in traditionally engineering-led disciplines.
But Big Data is actually a business transforma-tion wave and its real value to shipping and maritime will be realised when it is applied cross-business and includes commercial and enterprise datasets.
06Big Data is a business transformation wave
Maritime Satellite Communications & Applications 2016 | Research White Paper futurenauticsr e s e a r c h
There is an urgent requirement for shipping to view itself in the context of the wider logistics channel and identify where operators can add value as part of new, smart, data-enabled supply and value chains.
Smart Ships are just one part of the equation: they re-quire integration with Smart Ports and the growing number of Smart Cities—Hamburg being a good example. But the level of co-ordination, data sharing and interaction that will be required in the future has to be underpinned by enter-prise-grade connectivity.
Fortunately the maritime industry is entering a new age of enhanced connectivity with previously unheard of levels of bandwidth on offer via the launch of high-throughput sat-ellite networks such as Intelsat EpicNG.
Shipping will see a revolution not just in bandwidth but in the fl exibility of service delivery. Intelsat's FLEX is likely to drive major changes in the connectivity ecosystem bring-ing in new stakeholders and suppliers offering innovative new applications and services.
There is however one thing which could act as a brake on technology-adoption in the maritime industry. Fear of cyber attack and its impact on technology-adoption was identifi ed at the World Economic Forum in Davos in 2015 as potentially costing the world economy $3 trillion.
As the evidence of maritime and shipping's unprepar-edness grows, cyber security and—as importantly—cyber resilience has to become a priority.
There is an urgent need for shipping to view itself in the context of the wider logistics channel, where operators can add value as part of new, smart, data-enabled supply and value chains.
That requires enterprise-grade connectivity
07
Maritime Satellite Communications & Applications 2016 | Research White Paperfuturenauticsr e s e a r c h
According to the 2015 Crew Connectivity survey, 43 per cent of crew have sailed on a vessel that had been compromised by a cyber incident, yet almost 90 per cent of crew had never received any cyber security or hygiene training or guide-lines.
Cyber resilience is not an IT risk, it is an in-evitable downside risk of the industry's increas-ing dependence on technology, and it has to be managed by boards, and a culture of cyber awareness embedded throughout organisations across the sector.
It's essential that ship operators acknowledge the fact that cyber attacks now target users rath-er than infrastructure, and our greatest threats remain our employees, crew and suppliers.
IBM’s 2015 Cyber Security Intelligence in-dex showed that 95 per cent of breaches were caused by human error.
However, as the 2015 Crew Connectivity sur-vey demonstrated, crews at least are a highly-IT literate workforce, so the opportunity to harness that capacity and leverage it across organisa-tions is clear.
0843% of crew have sailed on a vessel compromised by a cyber incident
Maritime Satellite Communications & Applications 2016 | Research White Paper futurenauticsr e s e a r c h
09
summary In summary, to date there has been lit-tle focus on leveraging technology to break the counter-cyclical investment cycle and drive improvements in the way assets are operated and services deliv-ered.
That is, and must change if the in-dustry is to remake itself for the 21st century, and connectivity is the back-bone and the gateway for operators who want to thrive in the future.
Using data to make evidence-based decisions, improve effi ciency, add value for customers, and collaborate across the logistics channel, and algorithms to help predict when and where to place or-ders for ships and even capacity in order to mitigate the effects of the cycle, is all within shipping's reach.
Not everyone will grasp the opportu-nity, but for those who do their connec-tivity investment will be one of the most strategically critical, and should deliver some of the highest returns.
Maritime Satellite Communications & Applications 2016 | Research White Paperfuturenauticsr e s e a r c h
Key fi ndingsAnnual IT Expenditure
◊ The average annual IT expenditure per vessel across all respondent companies was $23,947 with the ma-jority of companies interviewed (58%) spending between $10,000 and $50,000 annually per vessel on IT.
◊ The average annual vessel IT expenditure showed signifi cant regional variation with companies in Asia spend-ing approximately one fi fth of those located in Europe or the rest of the world.
Distribution of Satellite Communications Systems
◊ Inmarsat FleetBroadband was the most commonly fi tted satellite communication solution across respondents' fl eets. 82% of the fl eets within the survey had Inmarsat Fleet-Broadband terminals fi tted.
◊ VSAT solutions were present in 57% of fl eets now making them the second most common satellite solution fi t-ted in the commercial maritime sector.
◊ Only VSAT solutions were exclusively used 100% of the time as the primary data solution on-board.
◊ The average expenditure on L-Band solutions ranged from $50 to $3,500 USD/month. The majority of ex-penditure was in the range $0-$250 USD/month for those back-up systems such as Iridium and Thuraya.
◊ Inmarsat Fleet and FleetBroadband expenditure was concentrated around the $750-$1,500 USD/month range.
◊ Average expenditure for VSAT varied according to the type of solution fi tted. Regional/mini-VSAT installations were in the range of $750-$1,000/vessel/month.
◊ Typically, Ku-Band system expenditure was around the $2,750-$3,500/vessel/month range – with just over half the fl eets spending in this range.
◊ All VSAT units were used as the primary data de-vice both deep sea and in port/coastal waters.
Reasons for choosing existing satellite solutions
◊ Operational effi ciency is the most important reason for choosing a particular communications solution—for the fi rst time more important than cost reduction. It potentially marks a very important shift in mind-set from a focus on fi t-ting solutions to reduce cost, to understanding that they can deliver value across the business and drive competitive ad-vantage.
◊ Crew welfare, so frequently cited in the past as a primary reason for fi tting VSAT, was only chosen by 3% of respondents as the most important reason for fi tting.
◊ This is in stark contrast to the requirements of crew. 72% of crew thought that the level of connectivity provided on board was a factor in choosing which ship operator they worked for. Of that 72% of respondents 78% said that it was a strong, or very strong infl uence on which contract they de-cided to take.
Data Growth
◊ On average ship operators believe that ship-to-shore data traffi c would increase by nearly 60% over the next 2-3 years.
Satellite solution upgrade path
◊ Respondents overwhelmingly thought that VSAT and next generation VSAT solutions (Intelsat EPIC, Inmarsat
10
Maritime Satellite Communications & Applications 2016 | Research White Paper futurenauticsr e s e a r c h
GX etc.) would be the most suitable solution for their fl eet’s future data requirements. When asked which solution they would upgrade to next and for which vessel type, only 18% of respondents choose an L-Band solution.
◊ There has been a signifi cant shift in perception and acceptance of VSAT and HTS services by all sectors of the maritime market.
Future Crew requirements
◊ On average, crew take 3 devices on-board. The most popular devices are Smartphones, laptops and external hard drives.
◊ Internet access is still the most demanded service with 73% of respondents believing that adequate crew Inter-net service could only be achieved with bandwidth of 512kbps or above, putting it well outside existing L-Band capabilities.
◊ The future service most wanted by crew was free in-port WiFi.
Current Software Deployment
◊ Operational applications (HSEQ, Safety Manage-ment, cargo management, crew management and tracking/positioning) are the most commonly deployed group of ap-plications today, followed by commercial applications such as ERP, E-Procurement, E-Docs and risk/performance manage-ment systems.
◊ Operational and commercial applications were seen to deliver the most value to ship operators whilst IT/Network applications delivered most cost saving.
◊ Only 23% of respondent companies used any form of cloud based applications despite wide proliferation of sup-
plier companies providing cloud based versions of their soft-ware solutions.
◊ Half of the ship operator respondents indicated that they did undertake some form of data analytics on the data collected from their on-board sensors and applications. IT/Network analytics and operational data were the most com-mon analytics undertaken.
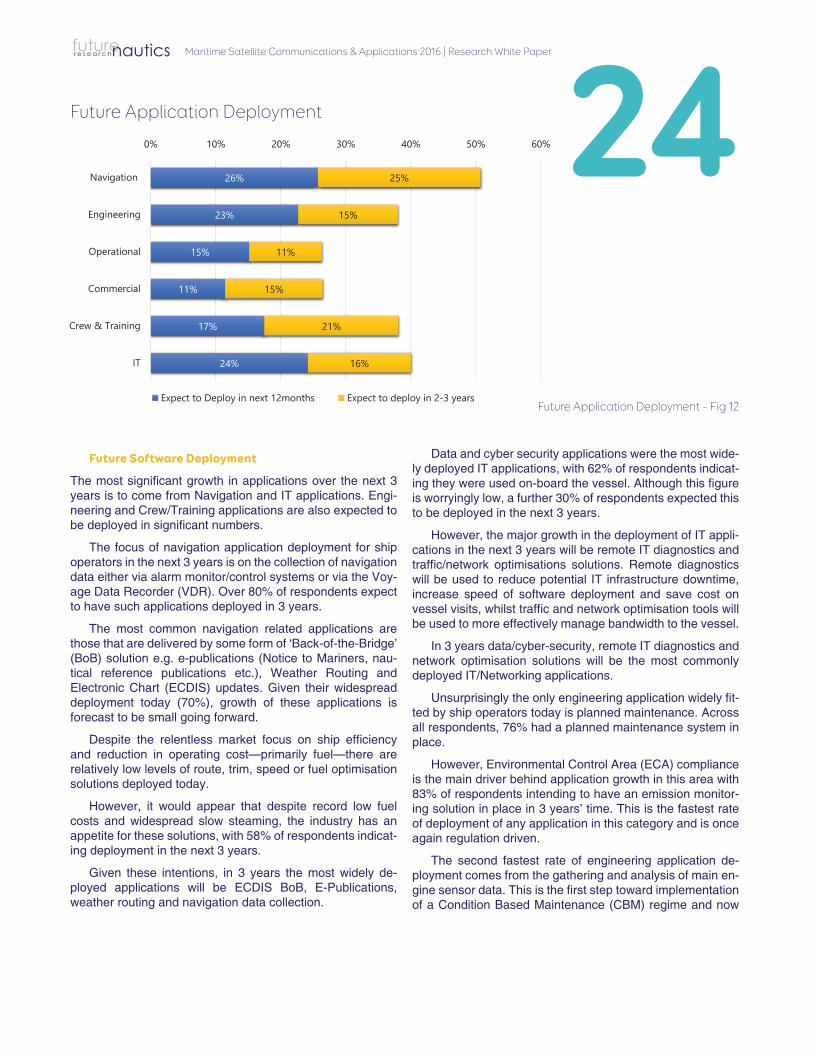
Future Software Deployment
◊ The most signifi cant growth in applications over the next 3 years is to come from Navigation and IT as well as Engineering and Crew/Training applications.
◊ The most widely deployed navigation applications in 3 years will be ECDIS, Back of Bridge, E-Publications, weath-er routing and navigation data collection.
◊ Data/cyber-security, remote IT diagnostics and net-work optimisation solutions will be the most commonly de-ployed IT/Networking applications in 3 years.
◊ Environment Control Areas (ECA’s) will be a driver for deployment of engineering applications—specifi cally emissions monitoring and gathering and analysis of main en-gine sensor data will lead to adoption of CBM.
◊ Growth in crew application deployment will be fo-cussed on online training and content services.
11Key fi ndings
Maritime Satellite Communications & Applications 2016 | Research White Paperfuturenauticsr e s e a r c h
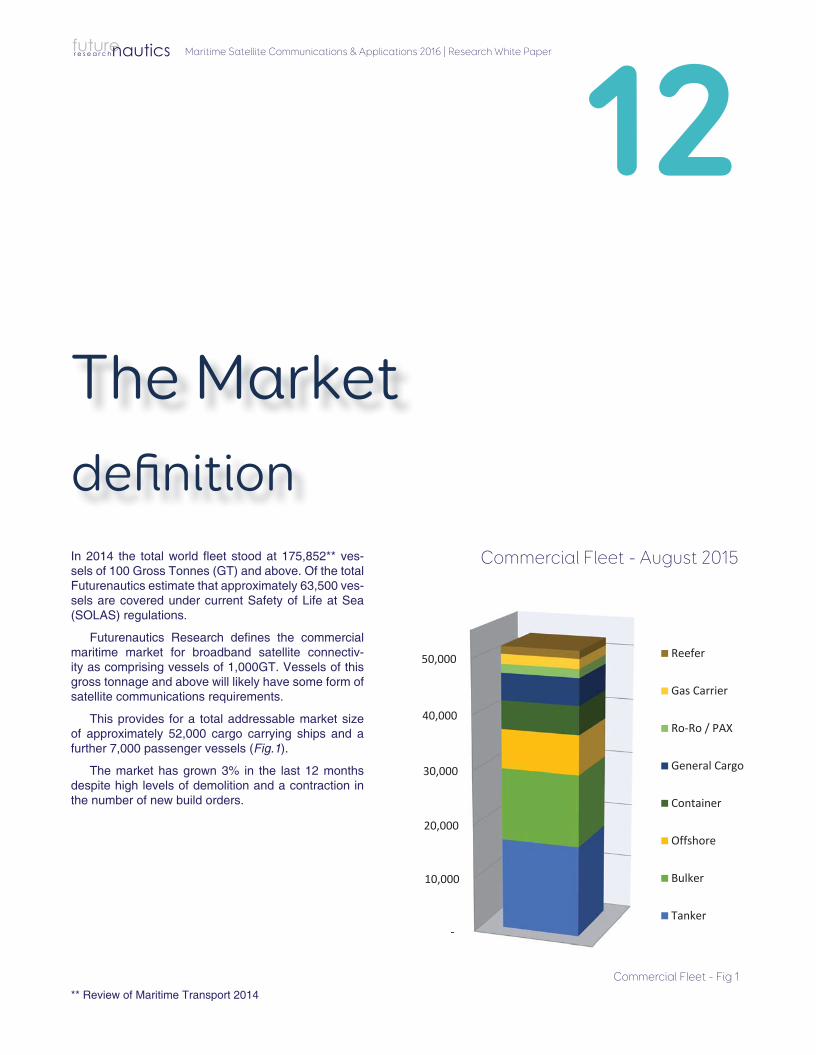
In 2014 the total world fl eet stood at 175,852** ves-sels of 100 Gross Tonnes (GT) and above. Of the total Futurenautics estimate that approximately 63,500 ves-sels are covered under current Safety of Life at Sea (SOLAS) regulations.
Futurenautics Research defi nes the commercial maritime market for broadband satellite connectiv-ity as comprising vessels of 1,000GT. Vessels of this gross tonnage and above will likely have some form of satellite communications requirements.
This provides for a total addressable market size of approximately 52,000 cargo carrying ships and a further 7,000 passenger vessels (Fig.1).
The market has grown 3% in the last 12 months despite high levels of demolition and a contraction in the number of new build orders.
The Market
12
-
10,000
20,000
30,000
40,000
50,000 Reefer
Gas Carrier
Ro-Ro / PAX
General Cargo
Container
Offshore
Bulker
Tanker
Commercial Fleet - Fig 1
Commercial Fleet - August 2015
defi nition
** Review of Maritime Transport 2014
Maritime Satellite Communications & Applications 2016 | Research White Paper futurenauticsr e s e a r c h
market conditions - primary shipping sectorsThe shipping market sectors are experiencing mixed fortunes with the wet bulk market (crude & product) experiencing strong demand and rates whilst dry bulk, container and off-shore sectors are all struggling with weak demand.
Given current and potential levels of overcapacity in nearly all sectors the industry remains vulnerable at least in the short to medium term and won’t return to full health any time soon.
Dry Bulk
There is still signifi cant oversupply in the dry bulk sector and freight rates hit an historic low early this year. Despite rates staying low—and predicted to stay so for the next 2-3 years— dry bulk capacity has grown by more than 2% over the last twelve months.
Analysts predict that fl eet growth will end up at around 4% by the end of 2015. Negative volume growth on many trades and the slowdown in the Chinese economy means that de-mand growth in this sector will be limited to around 1%.
With poor short and medium term prospects for the sector it is likely that investment in technology within this sector is likely to be impacted.
Wet Bulk
The crude market has been relatively strong throughout 2015 despite falling oil prices which have boosted transportation requirements as refi neries increase production levels.
This demand has meant healthy rates but there is concern that this is not a true refl ection of underlying demand in this sector. If this concern turns out to be well founded the arrival of new tonnage and very low demolition rates in 2015 could leave the crude sector vulnerable.
The product market has been similarly strong given the increase in refi nery production levels and short term seasonal demand looks likely to maintain this position.
However, analysts warn that the infl ow of new builds and weakening demand, especially from markets like China, could lead this sector, like others, into oversupply and soften-ing rates.
13
Maritime Satellite Communications & Applications 2016 | Research White Paperfuturenauticsr e s e a r c h
Container
Currently there are only two profi table positions within the container market, those of the scale leaders (e.g. Maersk & CMA-CGM) and niche focussed specialists (e.g. Wan Hai & SITC).
Market consolidation is still missing despite scale lead-ers applying additional pressure to mid-market operators through economies of scale gained from large ships and slow steaming.
Overcapacity within the container sector is also signifi -cant with 5%*** of the fl eet laid-up and supply poised to in-crease still further.
Additional margin that could have been brought to market from reduced oil prices has been passed onto the customer in reduced box rates.
Long term, container volumes are at risk from changing manufacturing processes (additive manufacturing and robot-ics) and consumption patterns that could seriously disrupt traditional routes.
14Long term, container volumes are at risk from changing manufacturing processes like additive manufacturing and also robotics. Together with consumption patterns they could cause serious disruption to traditional routes
*** Danish Ship Finance: Shipping Market Review –November 2015
Maritime Satellite Communications & Applications 2016 | Research White Paper futurenauticsr e s e a r c h
15
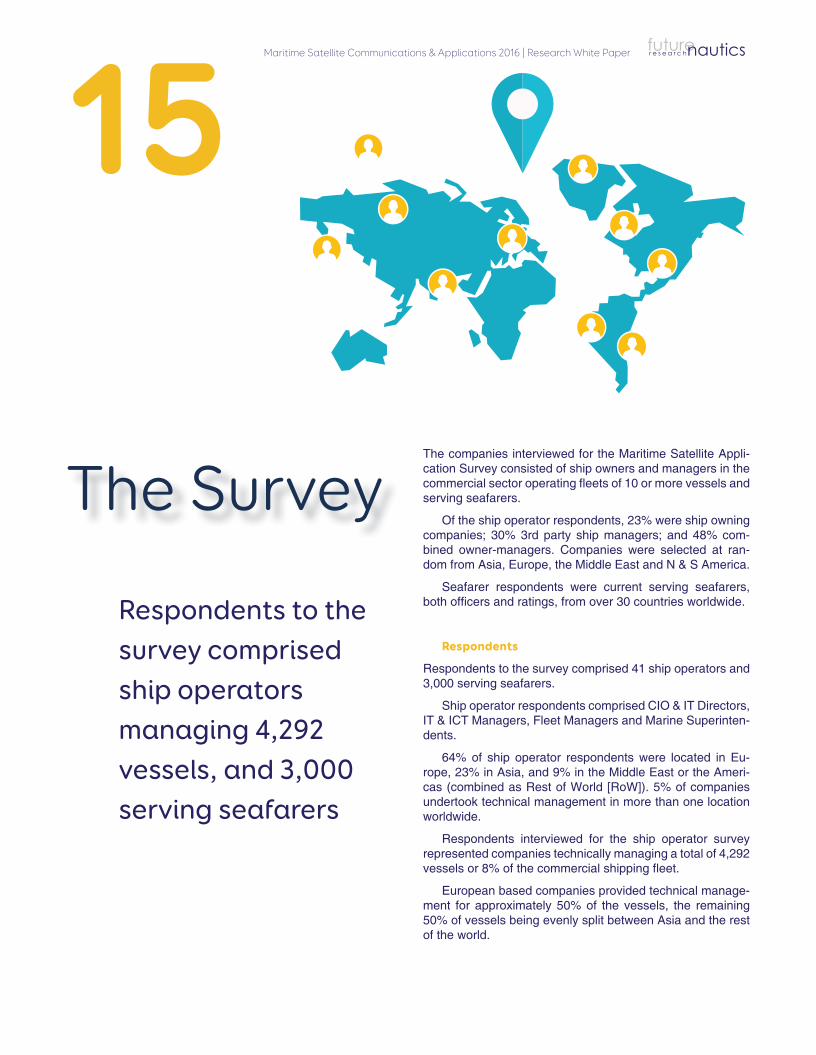
The companies interviewed for the Maritime Satellite Appli-cation Survey consisted of ship owners and managers in the commercial sector operating fl eets of 10 or more vessels and serving seafarers.
Of the ship operator respondents, 23% were ship owning companies; 30% 3rd party ship managers; and 48% com-bined owner-managers. Companies were selected at ran-dom from Asia, Europe, the Middle East and N & S America.
Seafarer respondents were current serving seafarers, both offi cers and ratings, from over 30 countries worldwide.
Respondents
Respondents to the survey comprised 41 ship operators and 3,000 serving seafarers.
Ship operator respondents comprised CIO & IT Directors, IT & ICT Managers, Fleet Managers and Marine Superinten-dents.
64% of ship operator respondents were located in Eu-rope, 23% in Asia, and 9% in the Middle East or the Ameri-cas (combined as Rest of World [RoW]). 5% of companies undertook technical management in more than one location worldwide.
Respondents interviewed for the ship operator survey represented companies technically managing a total of 4,292 vessels or 8% of the commercial shipping fl eet.
European based companies provided technical manage-ment for approximately 50% of the vessels, the remaining 50% of vessels being evenly split between Asia and the rest of the world.
The Survey
Respondents to the survey comprised ship operators managing 4,292 vessels, and 3,000 serving seafarers
Maritime Satellite Communications & Applications 2016 | Research White Paperfuturenauticsr e s e a r c h
16
Less than $5,0007%
$5,000-$10,00011%
$10,001-$20,00018%
$20,001-$40,00025%
$40,001-$60,00032%
More than $60,0007%
$19,714
$26,517 $24,782
$0
$5,000
$10,000
$15,000
$20,000
$25,000
$30,000
Manager Owner Owner & Manager
Average Annual IT Expenditure by Company
Type
$28,050
$4,860
$25,667
$0
$5,000
$10,000
$15,000
$20,000
$25,000
$30,000
Europe Asia RoW
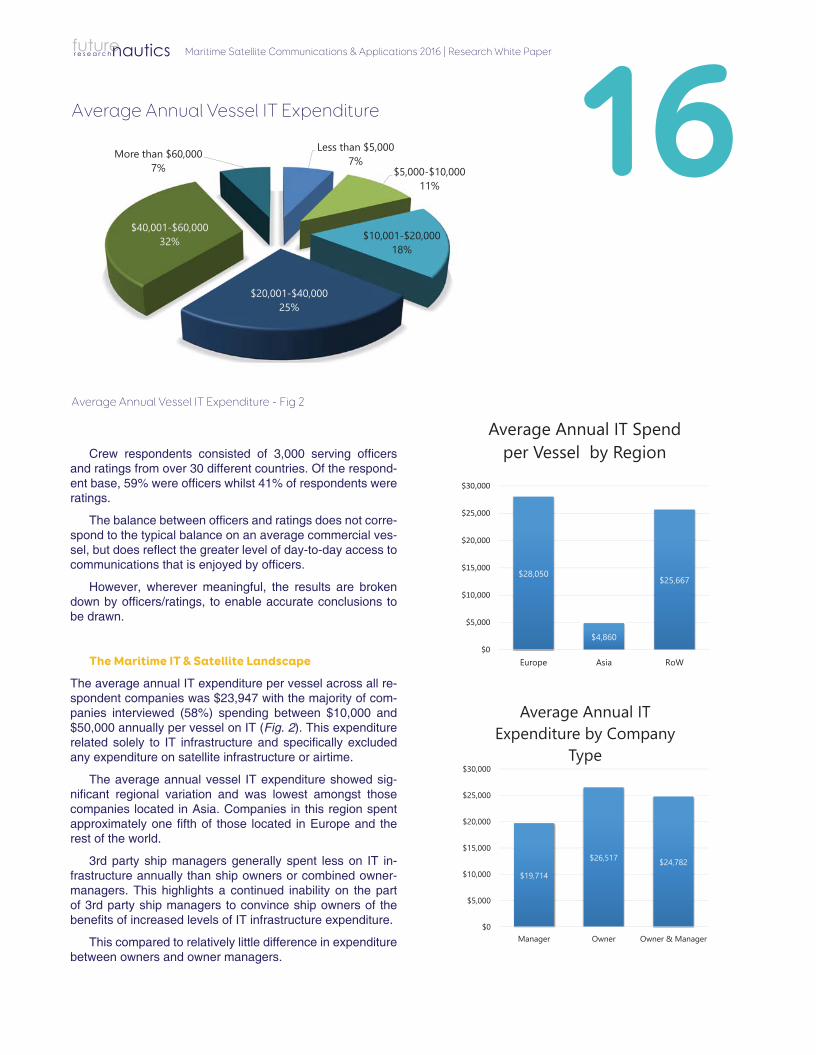
Average Annual IT Spend per Vessel by RegionCrew respondents consisted of 3,000 serving offi cers
and ratings from over 30 different countries. Of the respond-ent base, 59% were offi cers whilst 41% of respondents were ratings.
The balance between offi cers and ratings does not corre-spond to the typical balance on an average commercial ves-sel, but does refl ect the greater level of day-to-day access to communications that is enjoyed by offi cers.
However, wherever meaningful, the results are broken down by offi cers/ratings, to enable accurate conclusions to be drawn.
The Maritime IT & Satellite Landscape
The average annual IT expenditure per vessel across all re-spondent companies was $23,947 with the majority of com-panies interviewed (58%) spending between $10,000 and $50,000 annually per vessel on IT (Fig. 2). This expenditure related solely to IT infrastructure and specifi cally excluded any expenditure on satellite infrastructure or airtime.
The average annual vessel IT expenditure showed sig-nifi cant regional variation and was lowest amongst those companies located in Asia. Companies in this region spent approximately one fi fth of those located in Europe and the rest of the world.
3rd party ship managers generally spent less on IT in-frastructure annually than ship owners or combined owner-managers. This highlights a continued inability on the part of 3rd party ship managers to convince ship owners of the benefi ts of increased levels of IT infrastructure expenditure.
This compared to relatively little difference in expenditure between owners and owner managers.
Average Annual Vessel IT Expenditure - Fig 2
Average Annual Vessel IT Expenditure
Maritime Satellite Communications & Applications 2016 | Research White Paper futurenauticsr e s e a r c h
17
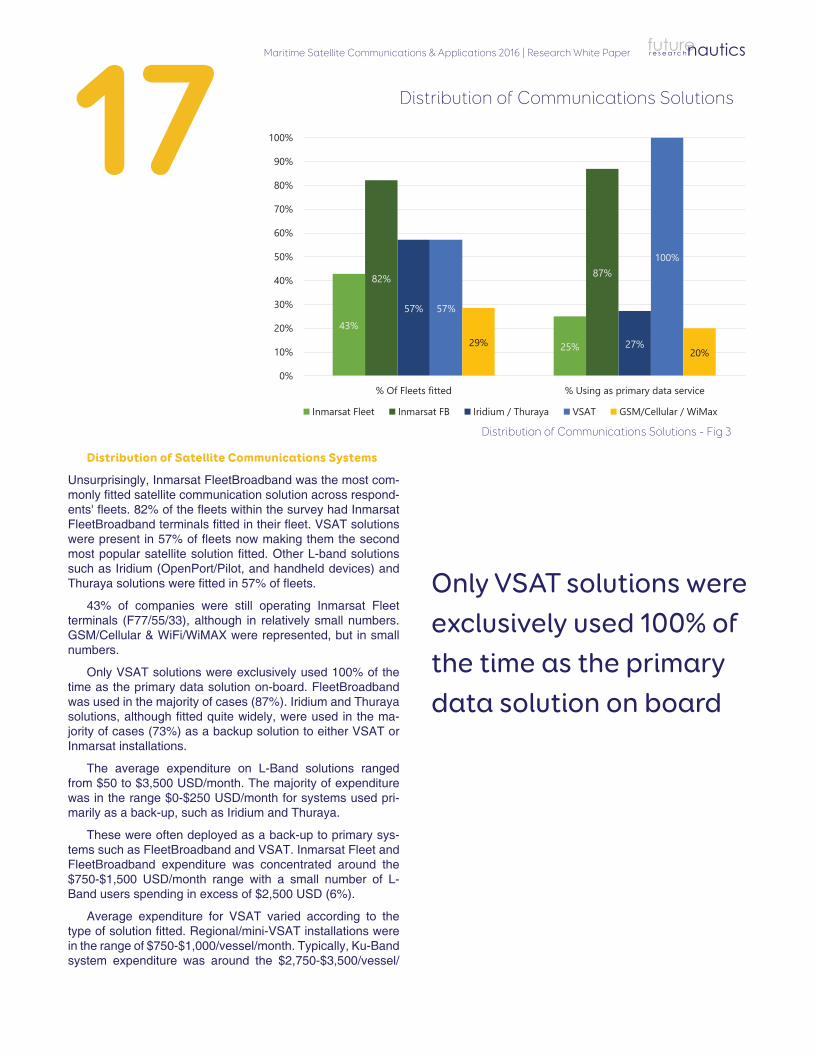
Distribution of Satellite Communications Systems
Unsurprisingly, Inmarsat FleetBroadband was the most com-monly fi tted satellite communication solution across respond-ents' fl eets. 82% of the fl eets within the survey had Inmarsat FleetBroadband terminals fi tted in their fl eet. VSAT solutions were present in 57% of fl eets now making them the second most popular satellite solution fi tted. Other L-band solutions such as Iridium (OpenPort/Pilot, and handheld devices) and Thuraya solutions were fi tted in 57% of fl eets.
43% of companies were still operating Inmarsat Fleet terminals (F77/55/33), although in relatively small numbers. GSM/Cellular & WiFi/WiMAX were represented, but in small numbers.
Only VSAT solutions were exclusively used 100% of the time as the primary data solution on-board. FleetBroadband was used in the majority of cases (87%). Iridium and Thuraya solutions, although fi tted quite widely, were used in the ma-jority of cases (73%) as a backup solution to either VSAT or Inmarsat installations.
The average expenditure on L-Band solutions ranged from $50 to $3,500 USD/month. The majority of expenditure was in the range $0-$250 USD/month for systems used pri-marily as a back-up, such as Iridium and Thuraya.
These were often deployed as a back-up to primary sys-tems such as FleetBroadband and VSAT. Inmarsat Fleet and FleetBroadband expenditure was concentrated around the $750-$1,500 USD/month range with a small number of L-Band users spending in excess of $2,500 USD (6%).
Average expenditure for VSAT varied according to the type of solution fi tted. Regional/mini-VSAT installations were in the range of $750-$1,000/vessel/month. Typically, Ku-Band system expenditure was around the $2,750-$3,500/vessel/
43%
25%
82% 87%
57%
27%
57%
100%
29%20%
0%
10%
20%
30%
40%
50%
60%
70%
80%
90%
100%
% Of Fleets fitted % Using as primary data service
Inmarsat Fleet Inmarsat FB Iridium / Thuraya VSAT GSM/Cellular / WiMax
Only VSAT solutions were exclusively used 100% of the time as the primary data solution on board
Distribution of Communications Solutions
Distribution of Communications Solutions - Fig 3
Maritime Satellite Communications & Applications 2016 | Research White Paperfuturenauticsr e s e a r c h
month, with just over half the fl eets spending in this range.
All VSAT units were used as the primary data device both deep sea and in port/coastal waters. The majority of fl eets with VSAT were located in Europe and were predominantly owner-manager fl eets.
Given the expenditure differential between typical L-Band and VSAT users it is signifi cant that the majority of respond-ents (57%) already had VSAT fi tted in their fl eets, and across all sectors very clearly saw VSAT and HTS systems as the natural upgrade path (see Satellite Solution Upgrade Path).
This is an initial indication that ship operators are see-ing value creation from investment in higher bandwidth tech-nologies.
Reasons for choosing existing satellite solutions
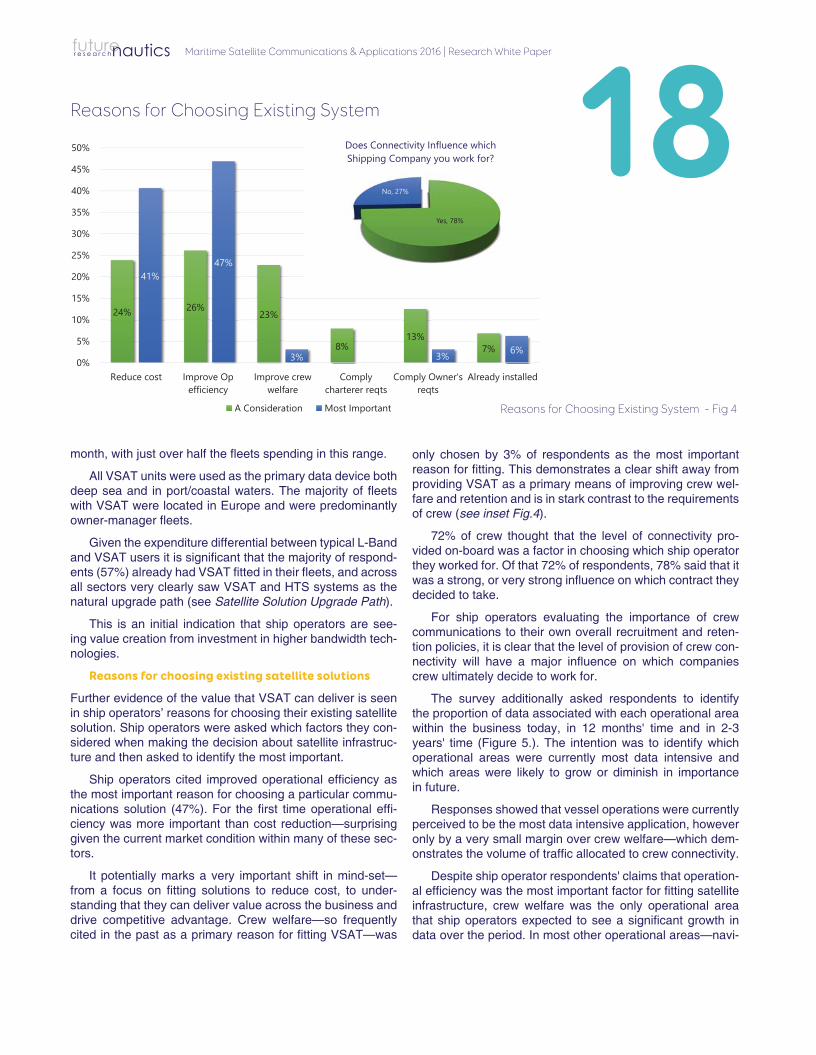
Further evidence of the value that VSAT can deliver is seen in ship operators’ reasons for choosing their existing satellite solution. Ship operators were asked which factors they con-sidered when making the decision about satellite infrastruc-ture and then asked to identify the most important.
Ship operators cited improved operational effi ciency as the most important reason for choosing a particular commu-nications solution (47%). For the fi rst time operational effi -ciency was more important than cost reduction—surprising given the current market condition within many of these sec-tors.
It potentially marks a very important shift in mind-set— from a focus on fi tting solutions to reduce cost, to under-standing that they can deliver value across the business and drive competitive advantage. Crew welfare—so frequently cited in the past as a primary reason for fi tting VSAT—was
only chosen by 3% of respondents as the most important reason for fi tting. This demonstrates a clear shift away from providing VSAT as a primary means of improving crew wel-fare and retention and is in stark contrast to the requirements of crew (see inset Fig.4).
72% of crew thought that the level of connectivity pro-vided on-board was a factor in choosing which ship operator they worked for. Of that 72% of respondents, 78% said that it was a strong, or very strong infl uence on which contract they decided to take.
For ship operators evaluating the importance of crew communications to their own overall recruitment and reten-tion policies, it is clear that the level of provision of crew con-nectivity will have a major infl uence on which companies crew ultimately decide to work for.
The survey additionally asked respondents to identify the proportion of data associated with each operational area within the business today, in 12 months' time and in 2-3 years' time (Figure 5.). The intention was to identify which operational areas were currently most data intensive and which areas were likely to grow or diminish in importance in future.
Responses showed that vessel operations were currently perceived to be the most data intensive application, however only by a very small margin over crew welfare—which dem-onstrates the volume of traffi c allocated to crew connectivity.
Despite ship operator respondents' claims that operation-al effi ciency was the most important factor for fi tting satellite infrastructure, crew welfare was the only operational area that ship operators expected to see a signifi cant growth in data over the period. In most other operational areas—navi-
24% 26% 23%
8%13%
7%
41%47%
3% 3% 6%0%
5%
10%
15%
20%
25%
30%
35%
40%
45%
50%
Reduce cost Improve Opefficiency
Improve crewwelfare
Complycharterer reqts
Comply Owner'sreqts
Already installed
g g y
A Consideration Most Important
Yes, 78%
No, 27%
Does Connectivity Influence which Shipping Company you work for? 18Reasons for Choosing Existing System
Reasons for Choosing Existing System - Fig 4
Maritime Satellite Communications & Applications 2016 | Research White Paper futurenauticsr e s e a r c h
1925%
14%
8%
14%16%
24%
20%
14%
8%
13%
17%
28%
19%
12%
7%
12%
16%
34%
0%
5%
10%
15%
20%
25%
30%
35%
Vessel Operations Commercial Regulatory Maintenance Navigation Crew Welfare
Currently Next 12 months Next 2-3 Yrs
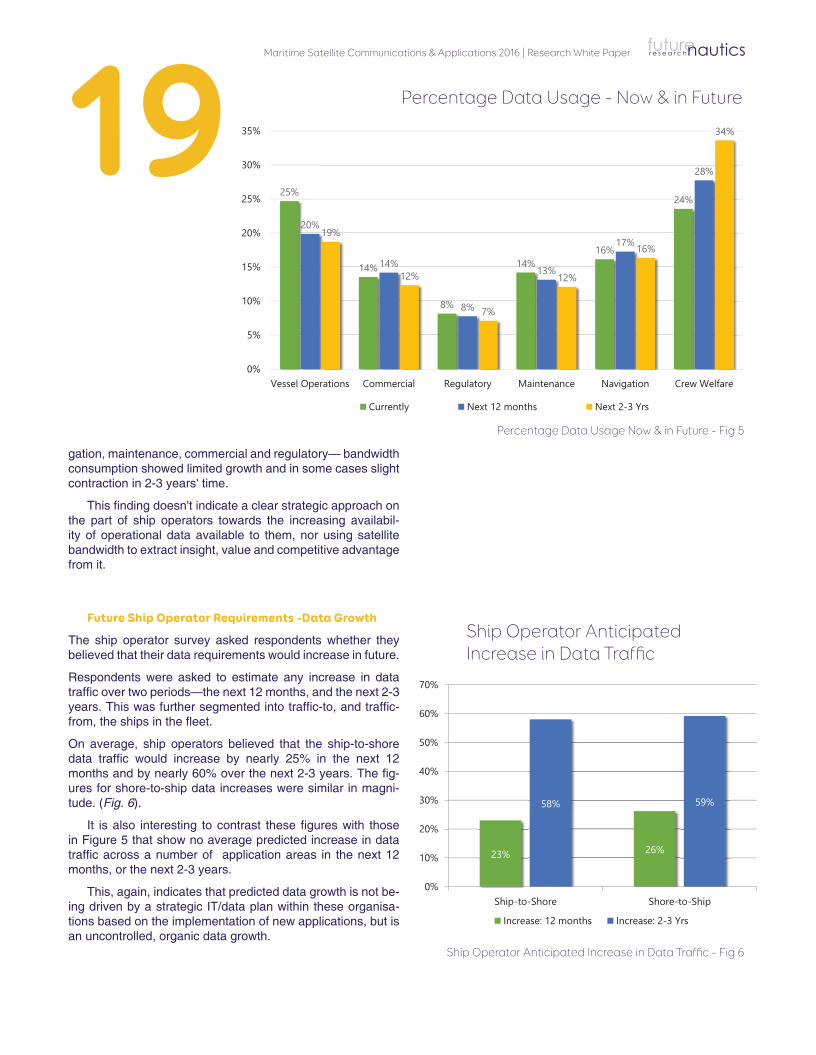
gation, maintenance, commercial and regulatory— bandwidth consumption showed limited growth and in some cases slight contraction in 2-3 years' time.
This fi nding doesn't indicate a clear strategic approach on the part of ship operators towards the increasing availabil-ity of operational data available to them, nor using satellite bandwidth to extract insight, value and competitive advantage from it.
Future Ship Operator Requirements -Data Growth
The ship operator survey asked respondents whether they believed that their data requirements would increase in future.
Respondents were asked to estimate any increase in data traffi c over two periods—the next 12 months, and the next 2-3 years. This was further segmented into traffi c-to, and traffi c- from, the ships in the fl eet.
On average, ship operators believed that the ship-to-shore data traffi c would increase by nearly 25% in the next 12 months and by nearly 60% over the next 2-3 years. The fi g-ures for shore-to-ship data increases were similar in magni-tude. (Fig. 6).
It is also interesting to contrast these fi gures with those in Figure 5 that show no average predicted increase in data traffi c across a number of application areas in the next 12 months, or the next 2-3 years.
This, again, indicates that predicted data growth is not be-ing driven by a strategic IT/data plan within these organisa-tions based on the implementation of new applications, but is an uncontrolled, organic data growth.
23% 26%
58% 59%
0%
10%
20%
30%
40%
50%
60%
70%
Ship-to-Shore Shore-to-Ship
Increase: 12 months Increase: 2-3 Yrs
Percentage Data Usage - Now & in Future
Percentage Data Usage Now & in Future - Fig 5
Ship Operator Anticipated Increase in Data Traffi c
Ship Operator Anticipated Increase in Data Traffi c - Fig 6
Maritime Satellite Communications & Applications 2016 | Research White Paperfuturenauticsr e s e a r c h
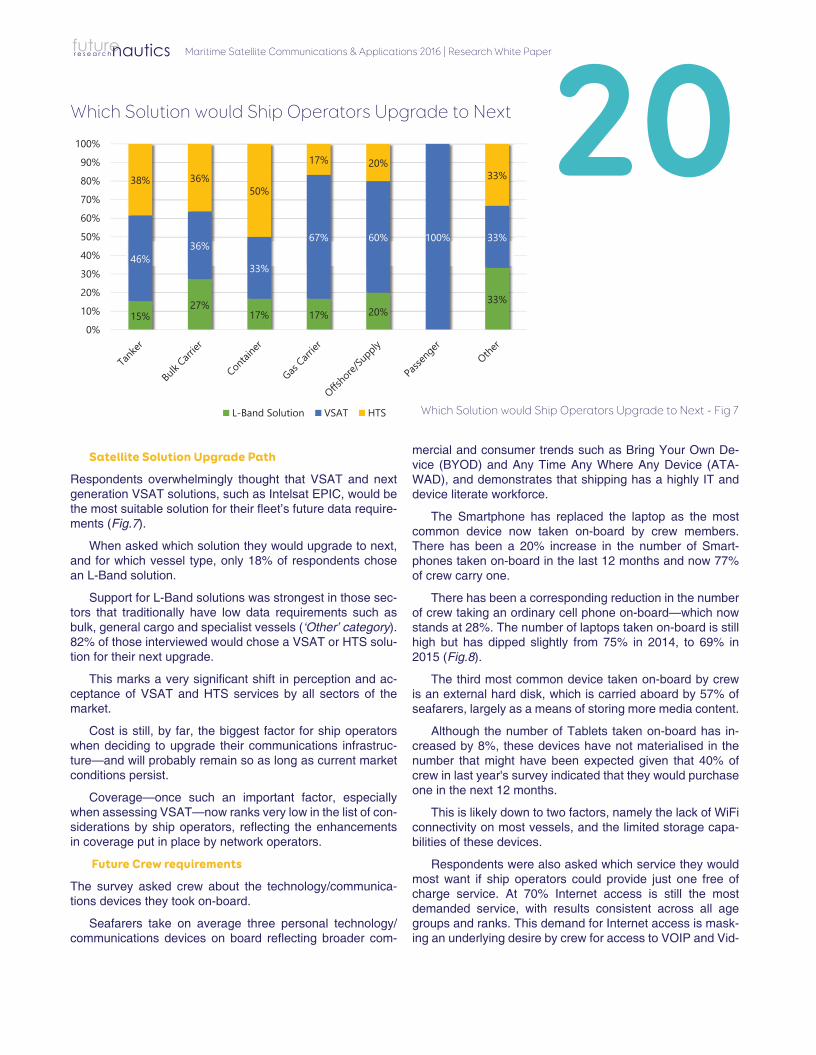
Satellite Solution Upgrade Path
Respondents overwhelmingly thought that VSAT and next generation VSAT solutions, such as Intelsat EPIC, would be the most suitable solution for their fl eet’s future data require-ments (Fig.7).
When asked which solution they would upgrade to next, and for which vessel type, only 18% of respondents chose an L-Band solution.
Support for L-Band solutions was strongest in those sec-tors that traditionally have low data requirements such as bulk, general cargo and specialist vessels (‘Other’ category). 82% of those interviewed would chose a VSAT or HTS solu-tion for their next upgrade.
This marks a very signifi cant shift in perception and ac-ceptance of VSAT and HTS services by all sectors of the market.
Cost is still, by far, the biggest factor for ship operators when deciding to upgrade their communications infrastruc-ture—and will probably remain so as long as current market conditions persist.
Coverage—once such an important factor, especially when assessing VSAT—now ranks very low in the list of con-siderations by ship operators, refl ecting the enhancements in coverage put in place by network operators.
Future Crew requirements
The survey asked crew about the technology/communica-tions devices they took on-board.
Seafarers take on average three personal technology/communications devices on board refl ecting broader com-
20
15%27%
17% 17% 20%33%
46%36%
33%
67% 60% 100% 33%
38% 36%50%
17% 20%33%
0%
10%
20%
30%
40%
50%
60%
70%
80%
90%
100%
L-Band Solution VSAT HTS
mercial and consumer trends such as Bring Your Own De-vice (BYOD) and Any Time Any Where Any Device (ATA-WAD), and demonstrates that shipping has a highly IT and device literate workforce.
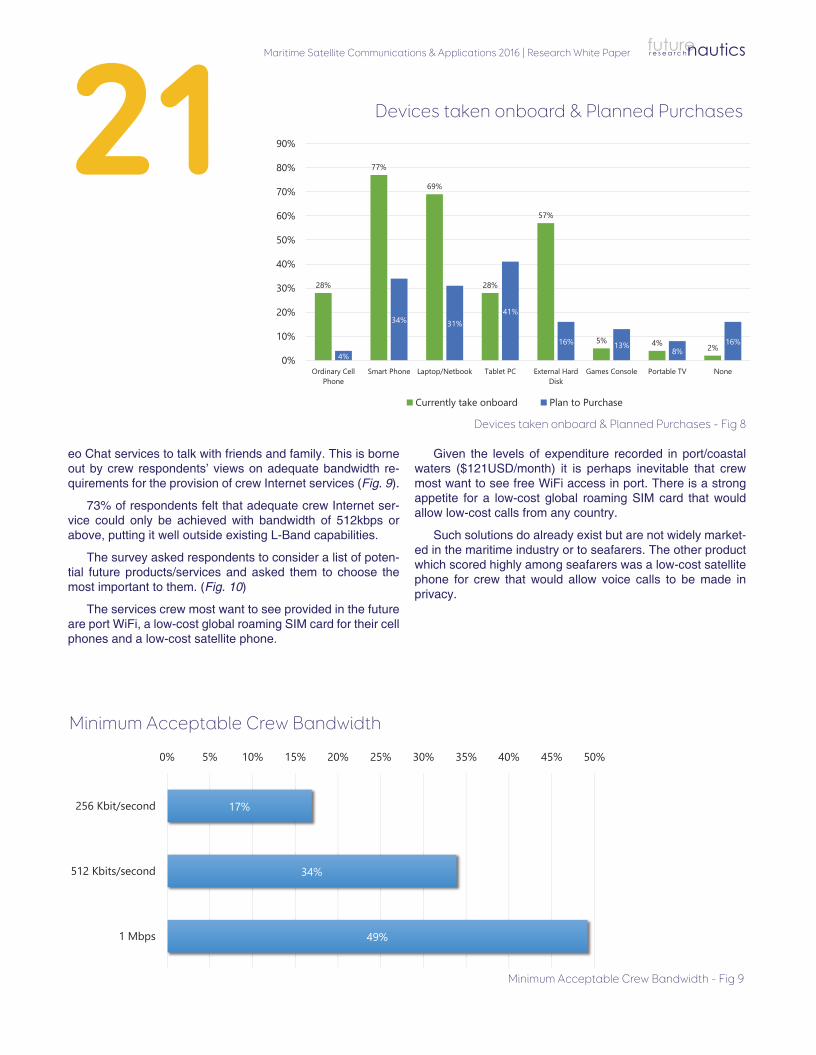
The Smartphone has replaced the laptop as the most common device now taken on-board by crew members. There has been a 20% increase in the number of Smart-phones taken on-board in the last 12 months and now 77% of crew carry one.
There has been a corresponding reduction in the number of crew taking an ordinary cell phone on-board—which now stands at 28%. The number of laptops taken on-board is still high but has dipped slightly from 75% in 2014, to 69% in 2015 (Fig.8).
The third most common device taken on-board by crew is an external hard disk, which is carried aboard by 57% of seafarers, largely as a means of storing more media content.
Although the number of Tablets taken on-board has in-creased by 8%, these devices have not materialised in the number that might have been expected given that 40% of crew in last year's survey indicated that they would purchase one in the next 12 months.
This is likely down to two factors, namely the lack of WiFi connectivity on most vessels, and the limited storage capa-bilities of these devices.
Respondents were also asked which service they would most want if ship operators could provide just one free of charge service. At 70% Internet access is still the most demanded service, with results consistent across all age groups and ranks. This demand for Internet access is mask-ing an underlying desire by crew for access to VOIP and Vid-
Which Solution would Ship Operators Upgrade to Next
Which Solution would Ship Operators Upgrade to Next - Fig 7
Maritime Satellite Communications & Applications 2016 | Research White Paper futurenauticsr e s e a r c h
21
28%
77%
69%
28%
57%
5% 4% 2%4%
34% 31%41%
16% 13%8%
16%
0%
10%
20%
30%
40%
50%
60%
70%
80%
90%
Ordinary CellPhone
Smart Phone Laptop/Netbook Tablet PC External HardDisk
Games Console Portable TV None
Currently take onboard Plan to Purchase
eo Chat services to talk with friends and family. This is borne out by crew respondents’ views on adequate bandwidth re-quirements for the provision of crew Internet services (Fig. 9).
73% of respondents felt that adequate crew Internet ser-vice could only be achieved with bandwidth of 512kbps or above, putting it well outside existing L-Band capabilities.
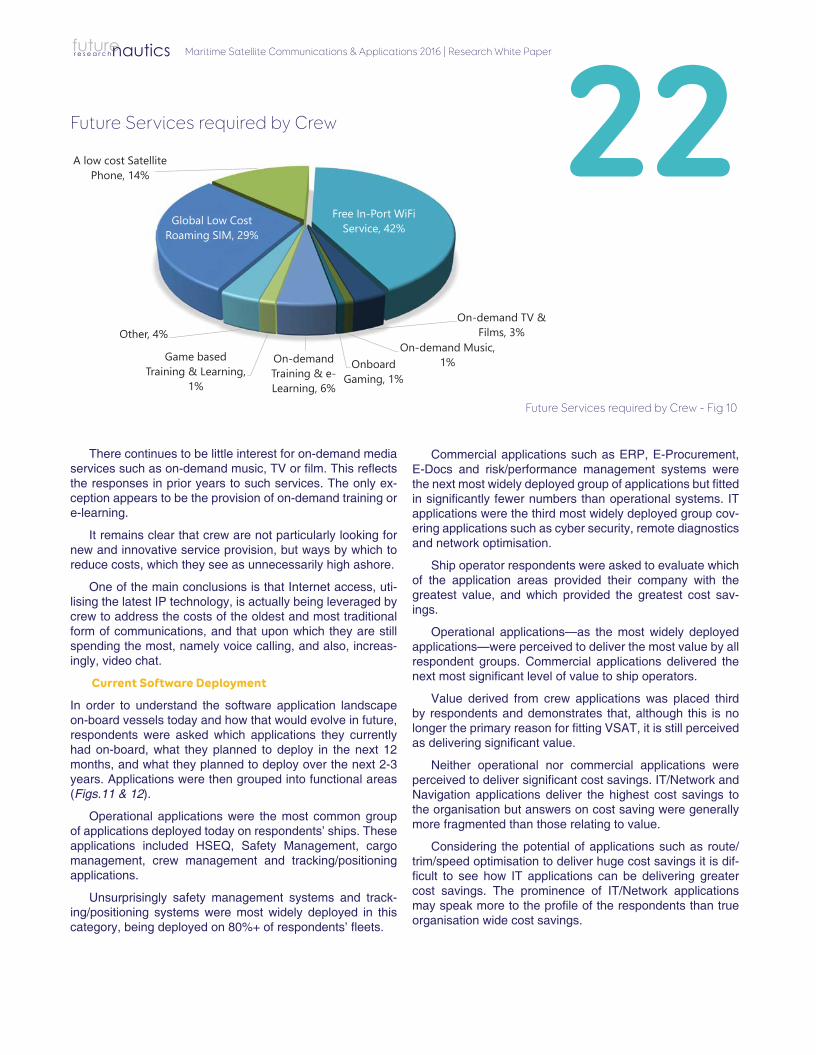
The survey asked respondents to consider a list of poten-tial future products/services and asked them to choose the most important to them. (Fig. 10)
The services crew most want to see provided in the future are port WiFi, a low-cost global roaming SIM card for their cell phones and a low-cost satellite phone.
17%
34%
49%
0% 5% 10% 15% 20% 25% 30% 35% 40% 45% 50%
256 Kbit/second
512 Kbits/second
1 Mbps
Given the levels of expenditure recorded in port/coastal waters ($121USD/month) it is perhaps inevitable that crew most want to see free WiFi access in port. There is a strong appetite for a low-cost global roaming SIM card that would allow low-cost calls from any country.
Such solutions do already exist but are not widely market-ed in the maritime industry or to seafarers. The other product which scored highly among seafarers was a low-cost satellite phone for crew that would allow voice calls to be made in privacy.
Devices taken onboard & Planned Purchases
Devices taken onboard & Planned Purchases - Fig 8
Minimum Acceptable Crew Bandwidth
Minimum Acceptable Crew Bandwidth - Fig 9
Maritime Satellite Communications & Applications 2016 | Research White Paperfuturenauticsr e s e a r c h
There continues to be little interest for on-demand media services such as on-demand music, TV or fi lm. This refl ects the responses in prior years to such services. The only ex-ception appears to be the provision of on-demand training or e-learning.
It remains clear that crew are not particularly looking for new and innovative service provision, but ways by which to reduce costs, which they see as unnecessarily high ashore.
One of the main conclusions is that Internet access, uti-lising the latest IP technology, is actually being leveraged by crew to address the costs of the oldest and most traditional form of communications, and that upon which they are still spending the most, namely voice calling, and also, increas-ingly, video chat.
Current Software Deployment
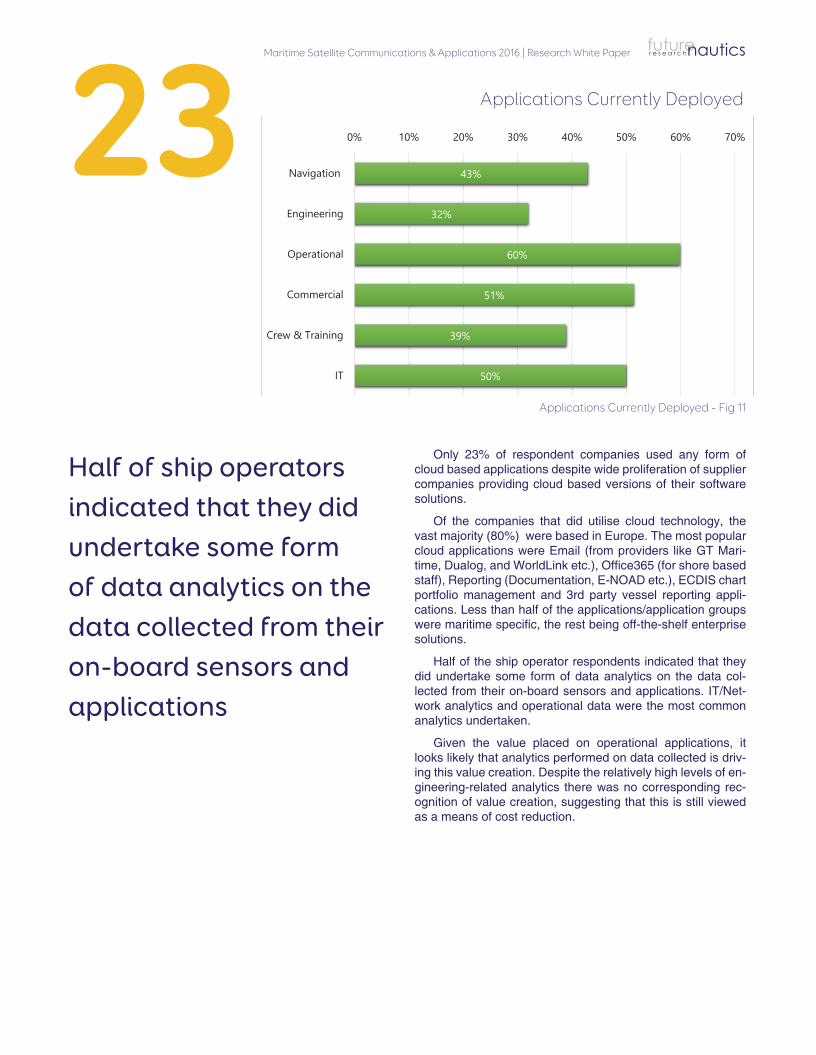
In order to understand the software application landscape on-board vessels today and how that would evolve in future, respondents were asked which applications they currently had on-board, what they planned to deploy in the next 12 months, and what they planned to deploy over the next 2-3 years. Applications were then grouped into functional areas (Figs.11 & 12).
Operational applications were the most common group of applications deployed today on respondents’ ships. These applications included HSEQ, Safety Management, cargo management, crew management and tracking/positioning applications.
Unsurprisingly safety management systems and track-ing/positioning systems were most widely deployed in this category, being deployed on 80%+ of respondents’ fl eets.
22
Global Low Cost Roaming SIM, 29%
A low cost Satellite Phone, 14%
Free In-Port WiFi Service, 42%
On-demand TV & Films, 3%
On-demand Music, 1%Onboard
Gaming, 1%
On-demand Training & e-Learning, 6%
Game based Training & Learning,
1%
Other, 4%
Commercial applications such as ERP, E-Procurement, E-Docs and risk/performance management systems were the next most widely deployed group of applications but fi tted in signifi cantly fewer numbers than operational systems. IT applications were the third most widely deployed group cov-ering applications such as cyber security, remote diagnostics and network optimisation.
Ship operator respondents were asked to evaluate which of the application areas provided their company with the greatest value, and which provided the greatest cost sav-ings.
Operational applications—as the most widely deployed applications—were perceived to deliver the most value by all respondent groups. Commercial applications delivered the next most signifi cant level of value to ship operators.
Value derived from crew applications was placed third by respondents and demonstrates that, although this is no longer the primary reason for fi tting VSAT, it is still perceived as delivering signifi cant value.
Neither operational nor commercial applications were perceived to deliver signifi cant cost savings. IT/Network and Navigation applications deliver the highest cost savings to the organisation but answers on cost saving were generally more fragmented than those relating to value.
Considering the potential of applications such as route/trim/speed optimisation to deliver huge cost savings it is dif-fi cult to see how IT applications can be delivering greater cost savings. The prominence of IT/Network applications may speak more to the profi le of the respondents than true organisation wide cost savings.
Future Services required by Crew
Future Services required by Crew - Fig 10
Maritime Satellite Communications & Applications 2016 | Research White Paper futurenauticsr e s e a r c h
23 43%
32%
60%
51%
39%
50%
0% 10% 20% 30% 40% 50% 60% 70%
Navigation
Engineering
Operational
Commercial
Crew & Training
IT
Only 23% of respondent companies used any form of cloud based applications despite wide proliferation of supplier companies providing cloud based versions of their software solutions.
Of the companies that did utilise cloud technology, the vast majority (80%) were based in Europe. The most popular cloud applications were Email (from providers like GT Mari-time, Dualog, and WorldLink etc.), Offi ce365 (for shore based staff), Reporting (Documentation, E-NOAD etc.), ECDIS chart portfolio management and 3rd party vessel reporting appli-cations. Less than half of the applications/application groups were maritime specifi c, the rest being off-the-shelf enterprise solutions.
Half of the ship operator respondents indicated that they did undertake some form of data analytics on the data col-lected from their on-board sensors and applications. IT/Net-work analytics and operational data were the most common analytics undertaken.
Given the value placed on operational applications, it looks likely that analytics performed on data collected is driv-ing this value creation. Despite the relatively high levels of en-gineering-related analytics there was no corresponding rec-ognition of value creation, suggesting that this is still viewed as a means of cost reduction.
Half of ship operators indicated that they did undertake some form of data analytics on the data collected from their on-board sensors and applications
Applications Currently Deployed
Applications Currently Deployed - Fig 11
Maritime Satellite Communications & Applications 2016 | Research White Paperfuturenauticsr e s e a r c h
Future Software Deployment
The most signifi cant growth in applications over the next 3 years is to come from Navigation and IT applications. Engi-neering and Crew/Training applications are also expected to be deployed in signifi cant numbers.
The focus of navigation application deployment for ship operators in the next 3 years is on the collection of navigation data either via alarm monitor/control systems or via the Voy-age Data Recorder (VDR). Over 80% of respondents expect to have such applications deployed in 3 years.
The most common navigation related applications are those that are delivered by some form of ‘Back-of-the-Bridge’ (BoB) solution e.g. e-publications (Notice to Mariners, nau-tical reference publications etc.), Weather Routing and Electronic Chart (ECDIS) updates. Given their widespread deployment today (70%), growth of these applications is forecast to be small going forward.
Despite the relentless market focus on ship effi ciency and reduction in operating cost—primarily fuel—there are relatively low levels of route, trim, speed or fuel optimisation solutions deployed today.
However, it would appear that despite record low fuel costs and widespread slow steaming, the industry has an appetite for these solutions, with 58% of respondents indicat-ing deployment in the next 3 years.
Given these intentions, in 3 years the most widely de-ployed applications will be ECDIS BoB, E-Publications, weather routing and navigation data collection.
26%
23%
15%
11%
17%
24%
25%
15%
11%
15%
21%
16%
0% 10% 20% 30% 40% 50% 60%
Navigation
Engineering
Operational
Commercial
Crew & Training
IT
Expect to Deploy in next 12months Expect to deploy in 2-3 years
24
Data and cyber security applications were the most wide-ly deployed IT applications, with 62% of respondents indicat-ing they were used on-board the vessel. Although this fi gure is worryingly low, a further 30% of respondents expected this to be deployed in the next 3 years.
However, the major growth in the deployment of IT appli-cations in the next 3 years will be remote IT diagnostics and traffi c/network optimisations solutions. Remote diagnostics will be used to reduce potential IT infrastructure downtime, increase speed of software deployment and save cost on vessel visits, whilst traffi c and network optimisation tools will be used to more effectively manage bandwidth to the vessel.
In 3 years data/cyber-security, remote IT diagnostics and network optimisation solutions will be the most commonly deployed IT/Networking applications.
Unsurprisingly the only engineering application widely fi t-ted by ship operators today is planned maintenance. Across all respondents, 76% had a planned maintenance system in place.
However, Environmental Control Area (ECA) compliance is the main driver behind application growth in this area with 83% of respondents intending to have an emission monitor-ing solution in place in 3 years’ time. This is the fastest rate of deployment of any application in this category and is once again regulation driven.
The second fastest rate of engineering application de-ployment comes from the gathering and analysis of main en-gine sensor data. This is the fi rst step toward implementation of a Condition Based Maintenance (CBM) regime and now
Future Application Deployment
Future Application Deployment - Fig 12
Maritime Satellite Communications & Applications 2016 | Research White Paper futurenauticsr e s e a r c h
25
routinely provided by engine manufacturers. In many cases this also forms part of a wider vessel performance monitoring solution.
The most common crew related application was crew email, with 79% of respondents indicating that these services were provided to crew whilst on-board—largely in line with crew responses. Approximately half of crew were provided this service free of charge by ship operators.
Growth in application deployment over the next 3 years in this category comes mainly from online training (46%), and content services (40%) as ship operators anticipate higher connectivity speeds and bandwidth from new satellite solu-tions.
Although content services generally don’t rate highly with crew, they did rate online training/learning as the most impor-tant of these content services.
The major growth in the deployment of IT applications in the next 3 years will be
remote IT diagnostics and traffi c/network optimisation solutions.
In 3 years these—plus data/cyber-security applications—will be the most commonly deployed
Maritime Satellite Communications & Applications 2016 | Research White Paperfuturenauticsr e s e a r c h
26
Recognised for its leading-edge data and interpreta-tion and strategic insight Futurenautics occupies a unique position, working both independently and in association with major industry partners, undertaking studies to address gaps in understanding, identify trends and quantify risks and opportunities for shipping and maritime companies, seafarers and stakeholders, and those seeking to enter or evaluate the sector.
In addition to producing a variety of market research and insight reports Futurenautics Research also work with individual clients in a strategic capacity at board level, us-ing its expertise in maritime customers, stakeholders and markets, and crucial technological, economic and regulatory issues. The company also publishes the quarterly journal 'Futurenautics' which has been described as 'Shipping's Economist'.
Intelsat operates the world’s fi rst Globalized Network, delivering high-quality, cost-effective video and broadband services anywhere in the world. Intelsat’s Globalized Net-work combines the world’s largest satellite backbone with terrestrial infrastructure, managed services and an open, interoperable architecture to enable customers to drive revenue and reach through a new generation of network services.
Thousands of organizations serving billions of people worldwide rely on Intelsat to provide ubiquitous broadband connectivity, multi-format video broadcasting, secure satel-lite communications and seamless mobility services. The end result is an entirely new world, one that allows us to envision the impossible, connect without boundaries and transform the ways in which we live.
futurenauticsr e s e a r c h

Maritime Satellite Communications & Applications 2016 | Research White Paper futurenauticsr e s e a r c h
27
Small, but perfectly informed
Shaping a strategy for the future is incredibly complex, but there's a simple step you can take today to improve your odds of success. Futurenautics offers analysis, insight and comment every quarter identifying the trends, threats and opportunities shipping's technol-ogy-enabled future holds.
Take out your free subscription today. www.futurenautics.com/subscribe/
Looking for a lightbulb moment?

Maritime Satellite Communications & Applications 2016 | Research White Paperfuturenauticsr e s e a r c h
© Futurenautics Ltd. 2016
www.futurenautics.com