research report different brain activation … publications/brain... · journal of integrative...
TRANSCRIPT
Journal of Integrative Neuroscience, Vol. 6, No. 1 (2007) 175–190c© Imperial College Press
Research Report
DIFFERENT BRAIN ACTIVATION PATTERNS IN DYSLEXICCHILDREN: EVIDENCE FROM EEG POWER AND
COHERENCE PATTERNS FOR THE DOUBLE-DEFICITTHEORY OF DYSLEXIA
MARTIJN ARNS∗
The Brain Resource Company B.V./Brainquiry B.V.Nijmegen, 6525 EC, The Netherlands
SYLVIA PETERS
Radboud University Nijmegen, Educational SciencesNijmegen, 6525 EC, The Netherlands
RIEN BRETELER
Radboud University Nijmegen/EEG Resource InstituteNijmegen, 6525 EC, The Netherlands
LUDO VERHOEVEN
Radboud University Nijmegen/Behavioral Science InstituteNijmegen, 6525 EC, The Netherlands
Received 23 October 2006Revised 20 December 2006
Aims: QEEG and neuropsychological tests were used to investigate the underlying neuralprocesses in dyslexia.
Methods: A group of dyslexic children were compared with a matched control group fromthe Brain Resource International Database on measures of cognition and brain function(EEG and coherence).
Results: The dyslexic group showed increased slow activity (Delta and Theta) in the frontaland right temporal regions of the brain. Beta-1 was specifically increased at F7. EEGcoherence was increased in the frontal, central and temporal regions for all frequency bands.There was a symmetric increase in coherence for the lower frequency bands (Delta andTheta) and a specific right-temporocentral increase in coherence for the higher frequencybands (Alpha and Beta). Significant correlations were observed between subtests such as
∗Corresponding author.
175
176 Arns et al.
Rapid Naming Letters, Articulation, Spelling and Phoneme Deletion and EEG coherenceprofiles.
Discussion: The results support the double-deficit theory of dyslexia and demonstratethat the differences between the dyslexia and control group might reflect compensatorymechanisms.
Integrative Significance: These findings point to a potential compensatory mechanism ofbrain function in dyslexia and helps to separate real dysfunction in dyslexia from acquiredcompensatory mechanisms.
Keywords: Dyslexia; EEG; QEEG; coherence; double-deficit theory.
1. Introduction
Developmental dyslexia is characterized by difficulties with accurate and/or fluentword recognition, by poor spelling and decoding abilities. These difficulties typi-cally result from a deficit in the phonological component of language that is oftenunrelated to other cognitive abilities [20]. Dyslexia is probably the most commonneurobiological disorder affecting children, with prevalence rates ranging from 5 to10 percent, and is a persistent, chronic condition [33].
Reading problems manifest themselves mainly in the following areas: difficultyin learning to utilize correspondence regularities between graphemes and phonemes[12, 37] poor phonological awareness, i.e., awareness of the sound structure of words,especially phonemic awareness as manifested in the ability to analyze and manipu-late sounds within a syllable [34] and poor use of orthographic word reading strate-gies; and consequently inaccurate and non-fluent word identification [22, 26]. As aresult of these difficulties, full alphabetic or phonological reading skills are oftennot attained. A large body of research has been conducted on the relation betweenphonological awareness and learning to read. Strong support has been provided thatlack of phonological awareness can cause difficulties with the acquisition of readingand writing [29, 36]. Being able to distinguish and identify the different phonemesin a word is part of this awareness. Research in the past decades has provided ampleevidence that dyslexic children have problems with phonological awareness and otheraspects of phonological processing. There is a general agreement that this phonolog-ical processing deficit has to do with problems in phonological encoding [34]. Poorreaders are less precise in phonemic discrimination, they have problems on a varietyof phoneme segmentation and awareness tasks [40], and they are slower in rapidnaming of objects, digits and letters [42, 43], as well as in producing rhyming words[15]. It can be hypothesized that dyslexia is fundamentally a linguistic problemwhich involves a deficit in phonological encoding. Elbro, Borstrøm and Petersen [6]tested this hypothesis by predicting dyslexia from phonological processing abilitiesof kindergarteners. It was shown that three language measures contributed indepen-dently to predict dyslexia: letter naming, phoneme identification, and distinctness ofphonological representations. The results further indicated that the quality of phono-logical representations in the child’s mental lexicon may also be a determinant of the
EEG Power and Coherence in Dyslexia: Double-Deficit 177
development of phonemic awareness. Alternatively, there is the claim that readingproblems originate from a more general temporal processing deficit [35].
Dyslexia has been attributed to deficiencies in visual, linguistic, and low levelsensory functions but most studies have been falsified empirically and logically[38]. Most research emphasizes the phonological deficit in children with dyslexia[1, 20, 33, 34], that is segmenting spoken words into their underlying phonologicalelements and linking each letter to its corresponding sound. A number of studies alsosupport the double-deficit theory. The double-deficit theory proposes that readingdisabilities can be the result of: 1) poor phonological awareness and/or, 2) auto-matic naming skills. Poor phonological awareness refers to disabilities in identifyingand manipulating sounds in speech, whereas poor automatic naming implies the dis-ability to translate visual information into a phonological code. The double-deficithypothesis proposes that accordingly, subtypes of dyslexia can be distinguishedshowing a deficit in either one or both of these skills [4, 43]. It is also claimedthat a deficit in both skills yields the lowest reading performance. The dyslexic sub-types could be produced by differential processing deficits in the frontal-cerebellarphonological system [4]. The unique contribution of each frontal and cerebellar mea-sure to the classification of dyslexic participants and the prediction of phonologicaland naming performance support this view.
Previous research has also linked dyslexia and reading disabilities to neurologi-cal data. There are anatomical studies [7, 13] which show an absence of the usualleft-right hemisphere asymmetry of the planum temporale in dyslexia or suggest apossible role of the left inferior frontal gyrus in speech perception and rapid audi-tory processing, as well as in phonological aspects of reading [13], although no strongeffects have been reported [13]. Eckert et al. [4] found anatomical anomalies under-lying the double-deficit subtype of dyslexia. Their findings suggest that impairmentsin a frontal-cerebellar network may play a role in delayed reading development indyslexia.
To study the neural factors of dyslexia, functional neuroimaging has been used.However, there is not much evidence with respect to developmental dyslexia sincethis research has focused on (young) adults [13]. Only Shaywitz and Shaywitz [32, 33]used children in their neuroimaging studies in order to examine the neural systemsfor reading during the acquisition of literacy. These reports show a failure of lefthemisphere posterior brain systems to function properly during reading [32, 33].The majority of studies show increased activation in the basal surface of the tempo-ral lobe, the posterior portion of the superior and middle temporal gyri, extendinginto temporoparietal areas and the inferior frontal lobe during tasks requiring read-ing and phonological processing [38]. Shaywitz et al. [32] supports these findings,however they show evidence of right hemisphere activation in the posterior temporalparietal regions. This could reflect compensatory processes or could indicate thatother nonlinguistic factors are related to reading disability [32, 33, 38].
A few studies have focused on event related EEG changes in tasks directly relatedto the reading difficulties of dyslexic children. Rippon and Brunswick [28] found
178 Arns et al.
that dyslexic children showed increased frontal theta activity in a phonological task,whereas there were no differences between the dyslexic group and the control groupin a visual task. Furthermore, there was a marked parieto-occipital right greater thanleft asymmetry in beta EEG activity in the dyslexic group with respect to the phono-logical task and the visual task. Klimesch et al. [17] found that dyslexics have a lackof attentional control during the encoding of words at left occipital sites and a lack ofa selective topographic activation pattern during the semantic encoding of words.
EEG coherence is a measure which displays functional connectivity between brainareas, and could hence be an interesting measure to demonstrate deviation in func-tional connectivity. To date, few EEG studies have considered EEG coherence. Sklaret al. [31] found higher intrahemispheric coherence and lower interhemispheric coher-ence during text processing in dyslexics compared with normals. This was also sup-ported by Leisman and Ashkenazi [19]. During rest, Shiota, Koeda, and Takeshita[30] reported both increased intra- and inter-hemispheric coherence in dyslexic chil-dren. Furthermore, Marosi et al. [23] found a frequency-dependent effect on EEGcoherence at rest where differences between children with poor reading/writing abil-ities were compared with children with good reading/writing abilities, with the for-mer showing higher coherence in the delta, theta and beta bands and lower coherencein the alpha bands during rest [39].
Weiss and Mueller [39] proposed that EEG coherence in the different frequencybands played different roles: increased coherence in the theta band correlates withlanguage-related mnemonic processes and theta coherence was increased if taskdemands increased and more efficient information processing was required. Alphacoherence seemed important for sensory processing and higher alpha coherence forsemantic processing. Beta and gamma coherence has been linked with more complexlinguistic sub-processes such as syntax or semantics [39].
Our aim was to compare brain function of dyslexic children with non-dyslexicchildren on different neurophysiological and neuropsychological measures. Our ques-tion focused on whether different EEG activation patterns can be found in dyslexia,and to what extent correlations between reading and spelling abilities and specifictasks for rapid naming and phonological awareness, can be found to address thedouble-deficit theory of dyslexia [43]. We also assessed neuropsychological functionin these groups in order to exclude further cognitive differences between the groupspotentially confounding the EEG findings. Our hypothesis was that the groups willnot show differences on neuropsychological measures, but that children with dyslexiawill show increased inter- and intrahemispheric coherence.
2. Materials and Methods
2.1. Subjects
Nineteen children with dyslexia (11 males and 8 females; average age = 10.33; range8.0–15.98) and nineteen control children (matched on age, gender and education;
EEG Power and Coherence in Dyslexia: Double-Deficit 179
11 males and 8 females; average age 10.34; range 8.01–16.03) were used to inves-tigate the differences in brain function and neuropsychological performance. Alldyslexic children went to regular schools. They were diagnosed with dyslexia bytheir remedial teachers, who worked with a structured protocol for diagnosing chil-dren with dyslexia on the basis of their reading and spelling development fromgrade 1 [44]. The control group was drawn from the Brain Resource InternationalDatabase (BRID: www.brainresource.com, for more details also see [9, 10]) andchildren were chosen from this database who did not have dyslexia or learningdisorders.
Exclusion criteria included a personal or family history of mental illness, braininjury, neurological disorder, serious medical condition, drug/alcohol addiction; anda family history of genetic disorder. All subjects voluntarily gave written informedconsent.
Subjects were seated in a sound and light attenuated room, controlled at anambient temperature of 22◦C/72◦F. Electroencephalographic and neuropsychologi-cal assessments were completed in order.
2.2. Language tests
The group of children with dyslexia was submitted to a range of tests to inves-tigate correlations between EEG and neuropsychological findings of dyslexia. Theincluded tests were measures of tasks related to reading: Rapid Naming of Letters,Articulation, Phoneme deletion [16] and Spelling [8].
2.3. Electroencephalographic data acquisition
Participants were seated in a sound and light attenuated room, controlled at anambient temperature of 22◦C. EEG data were acquired from 28 channels: Fp1, Fp2,F7, F3, Fz, F4, F8, FC3, FCz, FC4, T3, C3, Cz, C4, T4, CP3, CPz, CP4, T5,P3, Pz, P4, T6, O1, Oz and O2 (Quikcap; NuAmps; 10–20 electrode internationalsystem). Data were referenced to averaged mastoids with a ground at Fpz. Horizontaleye-movements were recorded with electrodes placed 1.5 cm lateral to the outercanthus of each eye. Vertical eye movements were recorded with electrodes placed3 mm above the middle of the left eyebrow and 1.5 cm below the middle of theleft bottom eye-lid. Skin resistance was < 5K Ohms and above 1K Ohm for allelectrodes. A continuous acquisition system was employed and EEG data were EOGcorrected offline [11]. The sampling rate of all channels was 500 Hz. A low passfilter with attenuation of 40 dB per decade above 100 Hz was employed prior todigitization.
The EEG data were recorded for two minutes with eyes open (EO). Subjects wereasked to sit quietly. Subjects were asked to fix their eyes on a red dot presented ona computer screen.
180 Arns et al.
2.4. Electroencephalographic variables
Each two minute epoch was divided into adjacent intervals of four seconds. Powerspectral analysis was performed on each four second interval by first applying aWelch window to the data, and then performing a Fast Fourier Transform (FFT),next the average power spectra were calculated.
The power was calculated in the following frequency bands delta (1.5–3.5 Hz),theta (4–7.5 Hz), alpha (8–13 Hz), alpha1 (8–11 Hz), alpha2 (11–13 Hz), SMR(12–15 Hz), beta (14.5–30 Hz), beta1 (14.5–20 Hz), beta2 (20–25 Hz) and beta3 (25–30 Hz). The data were then square-root transformed to approximate the normaldistributional assumptions required by parametric statistical methods.
2.5. Neuropsychology
Neuropsychological assessment was done using a touch screen monitor. Besides thesubtests for dyslexia, other neuropsychological tests were included in order to estab-lish that the children were otherwise completely normal. Measures included: memoryrecall and memory recognition (number of correctly reproduced words on trials 1, 5,6, 7; number or correctly recognized words), verbal interference test — equivalentto the Stroop test (Number correct text and color condition), tapping test (Numberof taps with the dominant and nondominant hand), timing test (proportional bias)and switching of Attention test part A and B (equivalent to the WAIS Trails Aand B; time to complete the A and B form) (see [9, 10] for details of these tests).All tests were fully computerized and subjects’ responses were recorded via touch-screen presses. Reliability and validity data of these tasks are reported elsewhere[2, 10, 25].
3. Statistical Analysis
3.1. Missing values
If missing values were present for a given statistical test, those cases were excludedfor that analysis. The number of missing values per group are included in the resultssections.
3.2. Statistical analyses
Since we expected quite local effects on some measures due to the localized differ-ences in brain function for dyslexia, we did not perform the traditional GLM, sincesmall localized effects could average out in the overall tests. Therefore, we performedone-way ANOVA’s but used very stringent alpha correction. Significance levels wereset as follows: for the EEG power data, the significance level was set to p < 0.05 andfor the coherence data, significance levels were set to p < 0.001. For EEG coherencethere were many more data points per frequency band (> 100 coherence values),hence the lower p value for coherence compared to EEG power.
EEG Power and Coherence in Dyslexia: Double-Deficit 181
The obtained significant differences between the dyslexia and control group werethen submitted to a bivariate correlation analysis together with the severity ques-tionnaire data, and a correlation matrix was obtained for correlations between vari-ables within the group of dyslexic children.
4. Results
4.1. EEG power
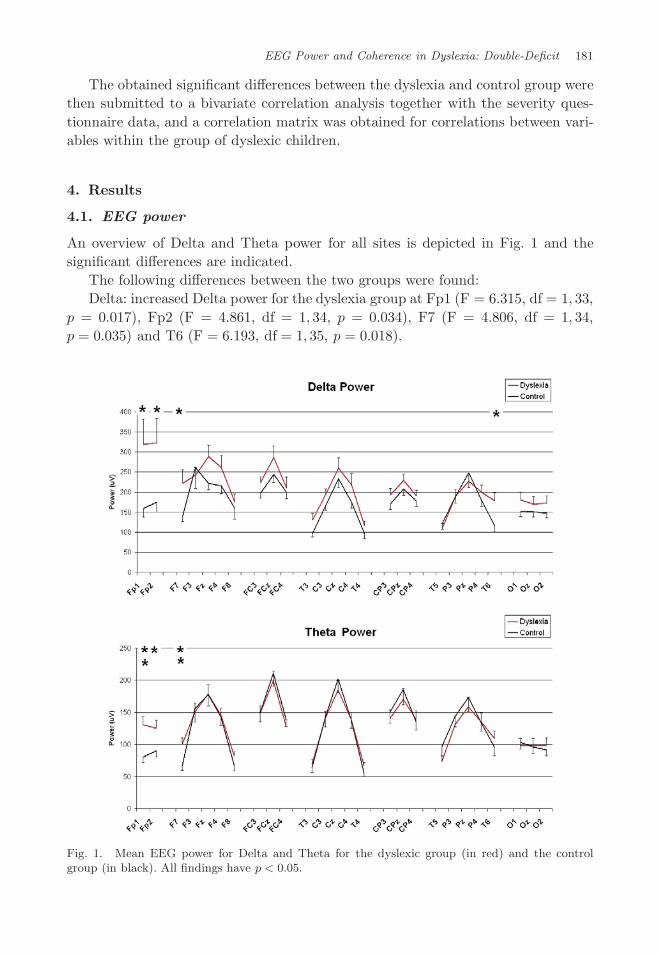
An overview of Delta and Theta power for all sites is depicted in Fig. 1 and thesignificant differences are indicated.
The following differences between the two groups were found:Delta: increased Delta power for the dyslexia group at Fp1 (F = 6.315, df = 1, 33,
p = 0.017), Fp2 (F = 4.861, df = 1, 34, p = 0.034), F7 (F = 4.806, df = 1, 34,p = 0.035) and T6 (F = 6.193, df = 1, 35, p = 0.018).
Fig. 1. Mean EEG power for Delta and Theta for the dyslexic group (in red) and the controlgroup (in black). All findings have p < 0.05.
182 Arns et al.
Theta: increased Theta at Fp1 (F = 11.072, df = 1, 33, p = 0.002), Fp2 (F =5.074, df = 1, 34, p = 0.031) and F7 (F = 8.267, df = 1, 34, p = 0.007).
Beta 1: increased beta-1 at F7 (F = 4.450, df = 1, 34, p = 0.042).
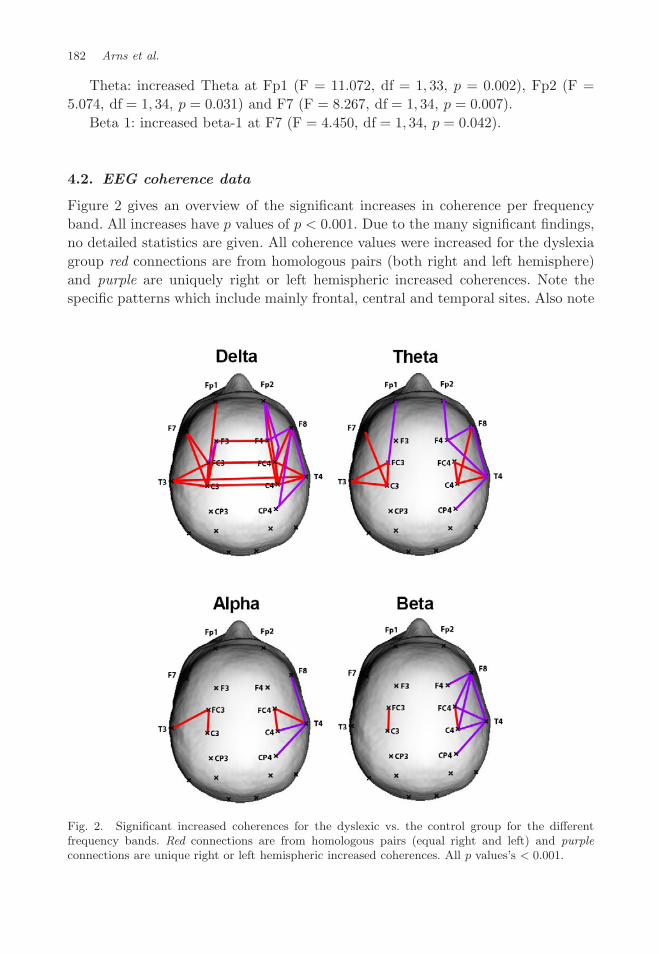
4.2. EEG coherence data
Figure 2 gives an overview of the significant increases in coherence per frequencyband. All increases have p values of p < 0.001. Due to the many significant findings,no detailed statistics are given. All coherence values were increased for the dyslexiagroup red connections are from homologous pairs (both right and left hemisphere)and purple are uniquely right or left hemispheric increased coherences. Note thespecific patterns which include mainly frontal, central and temporal sites. Also note
Fig. 2. Significant increased coherences for the dyslexic vs. the control group for the differentfrequency bands. Red connections are from homologous pairs (equal right and left) and purpleconnections are unique right or left hemispheric increased coherences. All p values’s < 0.001.
EEG Power and Coherence in Dyslexia: Double-Deficit 183
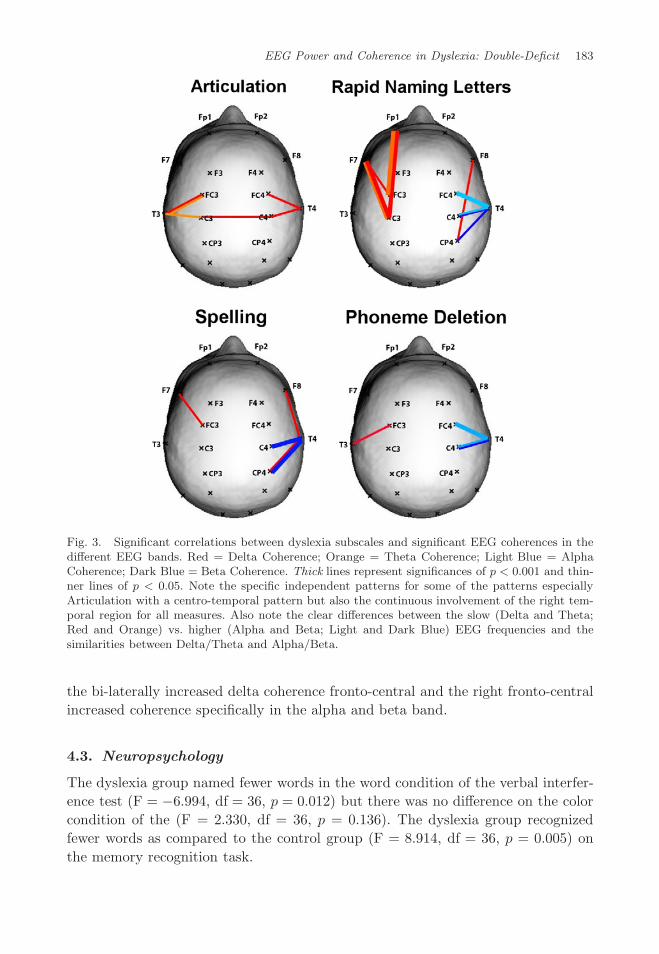
Fig. 3. Significant correlations between dyslexia subscales and significant EEG coherences in thedifferent EEG bands. Red = Delta Coherence; Orange = Theta Coherence; Light Blue = AlphaCoherence; Dark Blue = Beta Coherence. Thick lines represent significances of p < 0.001 and thin-ner lines of p < 0.05. Note the specific independent patterns for some of the patterns especiallyArticulation with a centro-temporal pattern but also the continuous involvement of the right tem-poral region for all measures. Also note the clear differences between the slow (Delta and Theta;Red and Orange) vs. higher (Alpha and Beta; Light and Dark Blue) EEG frequencies and thesimilarities between Delta/Theta and Alpha/Beta.
the bi-laterally increased delta coherence fronto-central and the right fronto-centralincreased coherence specifically in the alpha and beta band.
4.3. Neuropsychology
The dyslexia group named fewer words in the word condition of the verbal interfer-ence test (F = −6.994, df = 36, p = 0.012) but there was no difference on the colorcondition of the (F = 2.330, df = 36, p = 0.136). The dyslexia group recognizedfewer words as compared to the control group (F = 8.914, df = 36, p = 0.005) onthe memory recognition task.
184 Arns et al.
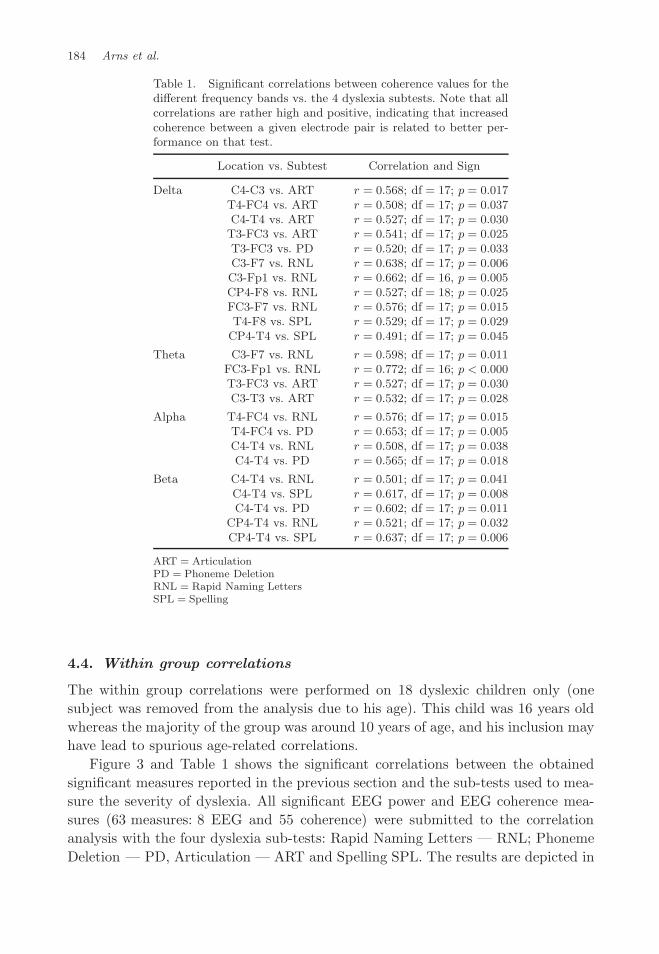
Table 1. Significant correlations between coherence values for thedifferent frequency bands vs. the 4 dyslexia subtests. Note that allcorrelations are rather high and positive, indicating that increasedcoherence between a given electrode pair is related to better per-formance on that test.
Location vs. Subtest Correlation and Sign
Delta C4-C3 vs. ART r = 0.568; df = 17; p = 0.017T4-FC4 vs. ART r = 0.508; df = 17; p = 0.037C4-T4 vs. ART r = 0.527; df = 17; p = 0.030T3-FC3 vs. ART r = 0.541; df = 17; p = 0.025T3-FC3 vs. PD r = 0.520; df = 17; p = 0.033C3-F7 vs. RNL r = 0.638; df = 17; p = 0.006C3-Fp1 vs. RNL r = 0.662; df = 16, p = 0.005CP4-F8 vs. RNL r = 0.527; df = 18; p = 0.025FC3-F7 vs. RNL r = 0.576; df = 17; p = 0.015T4-F8 vs. SPL r = 0.529; df = 17; p = 0.029
CP4-T4 vs. SPL r = 0.491; df = 17; p = 0.045
Theta C3-F7 vs. RNL r = 0.598; df = 17; p = 0.011FC3-Fp1 vs. RNL r = 0.772; df = 16; p < 0.000T3-FC3 vs. ART r = 0.527; df = 17; p = 0.030C3-T3 vs. ART r = 0.532; df = 17; p = 0.028
Alpha T4-FC4 vs. RNL r = 0.576; df = 17; p = 0.015T4-FC4 vs. PD r = 0.653; df = 17; p = 0.005C4-T4 vs. RNL r = 0.508, df = 17; p = 0.038C4-T4 vs. PD r = 0.565; df = 17; p = 0.018
Beta C4-T4 vs. RNL r = 0.501; df = 17; p = 0.041C4-T4 vs. SPL r = 0.617, df = 17; p = 0.008C4-T4 vs. PD r = 0.602; df = 17; p = 0.011
CP4-T4 vs. RNL r = 0.521; df = 17; p = 0.032CP4-T4 vs. SPL r = 0.637; df = 17; p = 0.006
ART = ArticulationPD = Phoneme DeletionRNL = Rapid Naming LettersSPL = Spelling
4.4. Within group correlations
The within group correlations were performed on 18 dyslexic children only (onesubject was removed from the analysis due to his age). This child was 16 years oldwhereas the majority of the group was around 10 years of age, and his inclusion mayhave lead to spurious age-related correlations.
Figure 3 and Table 1 shows the significant correlations between the obtainedsignificant measures reported in the previous section and the sub-tests used to mea-sure the severity of dyslexia. All significant EEG power and EEG coherence mea-sures (63 measures: 8 EEG and 55 coherence) were submitted to the correlationanalysis with the four dyslexia sub-tests: Rapid Naming Letters — RNL; PhonemeDeletion — PD, Articulation — ART and Spelling SPL. The results are depicted in
EEG Power and Coherence in Dyslexia: Double-Deficit 185
four different colors, each depicting a significant correlation between that variable,between those locations for the given frequency band. The thickness of the line alsodepicts the significance level (thin p < 0.05; thick p ≤ 0.001).
Interestingly, there were no significant correlations between the EEG power dataand the EEG coherence data within frequency bands, hence the increased coherencefor dyslexic children cannot be explained by the increased delta and theta frontally.
There was only one significant correlation, between EEG power and the severityof dyslexia: the power of Theta at FP1 and spelling (r = 0.510; df = 16; p = 0.044).
For coherence the significant differences are depicted in Table 1 and are alsovisually depicted in Fig. 3.
5. Discussion
This study focused on brain function patterns and neuropsychological findings inchildren with developmental dyslexia and aimed to establish a link between EEGparameters and dyslexia relevant constructs. EEG findings showed an increased (left)frontal and right temporal slow activity in the Delta and Theta bands and increasedBeta 1 power at F7. Since all EEG data have been EOG corrected using Grattonet al. [11], it is very unlikely the frontal increased Delta and Theta is due to resid-ual EOG. EEG Coherence data showed increased coherence in frontal, central andtemporal regions. However, the increased coherences seemed to show a frequencyspecific effect, where the slower frequencies (delta and theta) showed a more sym-metrical increase in right and left frontal, central and temporal networks, whereasthe higher frequencies (alpha and beta) showed a more specific right-hemisphericeffect originating at T4 and F8. Correlational analysis showed that these increasedcoherences were an effect in itself, since there were no correlations between theincreased delta and theta power on the one hand and the increased coherence inthe according band on the other hand; hence the increased delta and theta powerwere not the cause of the increased coherence findings. High coherence betweentwo EEG signals suggests high cooperation and synchronization between underlyingbrain regions within a certain frequency band [39]. Increased coherence can thus beinterpreted as increased functional connectivity. This could implicate that dyslexicchildren have increased activity within frontal, central and temporal networks.
There were also significant differences between the dyslexic and the control groupon the verbal interference tests (similar to the Stroop test) and the memory recog-nition test. These findings are directly related to the dyslexic problems experiencedby this group, since dyslexic children have decoding problems. The dyslexic childrennamed fewer words on the verbal interference test than the control children buthad no impairment when required to name the color of the word relative to normalchildren. Dyslexic children also recognized fewer words on a memory recognitiontest whereas spontaneous memory recall was not affected at all. These findings sug-gest that interpretation of neuropsychological data derived from these specific testsshould always be treated with caution, and may be that dyslexic status should be
186 Arns et al.
incorporated into the interpretation of neuropsychological data to safeguard falsepositive findings on these tests.
Correlational analyses revealed significant correlations between the obtained sig-nificant EEG findings and the tests: articulation, rapid naming of letters, spellingand phoneme deletion. The correlated patterns (as depicted in Fig. 3) showed quitespecific patterns for all these 4 sub-tests. Interestingly, all these correlations werepositive and high (explaining > 30% of the variance), suggesting that better perfor-mance on these tests was associated with increased coherence. Given the fact that allthe coherence findings were increased in comparison to the control group, it might beconcluded that these patterns reflect compensatory mechanisms and do not explainthe deficit per se (where negative correlations would be expected). The EEG in thisstudy was not recorded during the completion of the dyslexia specific tests, hencewe recorded resting state eyes open EEG which correlated highly with these tests.This further supports the fact that these patterns can be considered compensatorypatterns since they are also present at rest. Furthermore, this demonstrates thatclear associations can be found between passive brain states and deviant behavior,demonstrating the utility of integrative approaches.
There seems to be a clear distinction between delta coherence on the one handand beta coherence on the other. The increased coherence for dyslexic childrenwas prominent and symmetric for the delta band; but localized to the left hemi-sphere for the beta band. The correlations also demonstrate this; a slow (delta andtheta) coherent network over left frontal and central regions, and a faster (alpha andbeta) network originating at T4. Although EEG coherence between different corticalregions is largely established by cortico-cortical and thalamo-cortical interactions[24], subcortical brain areas also contribute to both inter- and intra-hemisphericfunctional communication [3]. Lower bandwidths such as delta frequency in the EEGcoherence spectrum have particularly been associated with limbic contributions tocortico-cortical coupling [18], hence these increased low-frequency coherences couldindicate a limbic contribution.
The core dysfunction in dyslexia seems to consist of increased slow activity atleft frontal and right temporal (T6) regions, and bilateral increased coherence inthe slower frequency bands (delta and theta), as opposed to acquired-compensatorymechanisms consisting of right-hemispheric increased coherences in the higher fre-quency bands (alpha and beta) and a left frontal increased coherence in slower bandsoriginating from C3 and FC3. The increases in coherence in the delta band fronto-central suggest a strong limbic involvement as part of the core deficit in dyslexia,although this requires further study.
In this study, children showed delays in both rapid naming and phonologicalawareness. These delays correlated with the activation in the frontal-cerebellarphonological system. The EEG findings in our study showed an increased activationpattern in dyslexic children, mainly in frontal and temporal lobes. Furthermore, thecorrelation analyses showed significant correlations with spelling, phonological skillsand rapid naming with quite different topographical representations, suggesting
EEG Power and Coherence in Dyslexia: Double-Deficit 187
involvement of different neural mechanisms. It can tentatively be concluded thatthe frontal-cerebellar network may be critical to the precise timing of mechanismsthat underlie the double-deficit theory of dyslexia, suggesting the existence of threesubtypes of reading disability: dyslexics with deficiencies in phonological skills, poorrapid naming skills or a combination of both types. Thus, the present study supportsthe theory of Eckart et al. [4] hypothesizing that impairments in a frontal-cerebellarnetwork may play a role in delayed reading impairment in dyslexia. These authorsreported that anomalies in a cerebellar-frontal circuit are associated with rapidautomatic naming and phonological processing.
Previous EEG studies have shown different findings. Rippon and Brunswick [28]found no specific activation patterns with respect to dyslexic children. Weiss andMueller [39] have proposed several roles for coherence in the different frequencybands (also see introduction), however in this study, we did not use a task-relatedprotocol, making comparison to this study difficult.
This study contributes to the theory that neurobiological causes underliedyslexia. The increased activation patterns of dyslexic children seem to be associ-ated with the double deficit type of dyslexia. In future research, it will be importantto examine the relation between EEG data and the phonological or orthographicdeficits. Outcomes of these studies might further contribute to the diagnosis of sub-types of dyslexia.
Finally, this study demonstrated that increased EEG power could not explainthe increased coherence findings in dyslexia, suggesting these measures reflect dif-ferent neural networks. The positive correlations between coherence and the differ-ent tests demonstrated that these increased coherences might reflect compensatorymechanisms rather then being part of the real core dysfunction in dyslexia, whereasthe increased slow activity might be part of the core dysfunction in dyslexia. Thisshould be taken into account in future studies to elucidate dysfunctional networks indyslexia. These dysfunctional networks can be dissociated from acquired compen-satory mechanisms. Also, treatments focused on normalizing brain function (e.g.,rTMS, EEG Biofeedback or Neurofeedback) will benefit from this given they couldtarget the deficit rather than target acquired compensatory mechanisms.
Acknowledgments
Data from The Brain Resource International Database were provided by the BrainResource Company (BRC: www.brainresource.com). We would also like to thanklocal BRC clinics for data collection of the control group. All scientific decisionsare made independent of Brain Resource Company’s commercial decisions, via theindependently operated scientific division BRAINnet, which is overseen by the inde-pendently funded Brain Dynamics Center and scientist members. We would alsolike to acknowledge the contributions from Ine Giepmans and Minnie War for thedata collection and Sabine de Aukje Bootsma and Hanneke Friesen for acquiringthe QEEG and neuropsychological data.
188 Arns et al.
References
[1] Bishop DVM, Cerebellar abnormalities in developmental dyslexia: Cause, correlate orconsequence? Cortex 38:491–498, 2000.
[2] Clark CR, Paul RH, Williams LM, Arns M, Fallahpour K, Handmer C, Gordon E,Standardized assessment of cognitive functioning during development and ageing usingan automated touchscreen battery, Arch Clin Neuropsychol 21(5):449–467, 2006.
[3] Davey MP, Victor JD, Schiff ND, Power spectra and coherence in the EEG of a vegeta-tive patient with severe asymmetric brain damage, Clin Neurophysiol 111:1949–1954,2000.
[4] Eckert M, Leonard C, Richards TL, Aylward E, Thomson J, Berninger V, Anatomicalcorrelates of dyslexia: Frontal and cerebellar findings, Brain 126:482–494, 2003.
[5] Elbro C, Scarborough HS, Early identification, in Bryant P, Nunes T (eds.), Interna-tional Handbook of Children’s Reading, Dordrecht, Kluwer, pp. 339–359, 2003.
[6] Elbro C, Borstrøm I, Petersen DK, Predicting dyslexia from kindergarten. The impor-tance of distinctness of phonological representations of lexical items, Read Res Quart33(1):36–60, 1998.
[7] Galaburda AM, Sherman GP, Rosen GD, Aboitiz F, Geschwind N, Developmentaldyslexia: Four consecutive patients with cortical anomalies, Ann Neurol 18:222–233,1985.
[8] Geelhoed J, Reitsma P, PI-dictee, Lisse, Swets and Zeitlinger, 1999.[9] Gordon E, Integrative neuroscience in psychiatry: The role of a standardized database,
Aust Psychiat 11(2):156–163, 2003.[10] Gordon E, Cooper N, Rennie C, Hermens D, Williams L, Integrative neuroscience: The
role of a standardized database, Clin EEG Neurosci 36:64–75, 2005.[11] Gratton G, Coles MG, Donchin E, A new method for off-line removal of ocular artifact,
Electroen Clin Neuro 55:468–484, 1983.[12] Gough PB, Ehri L, Treiman R (eds.), Reading Acquisition, Lawrence Erlbaum Asso-
ciates, Hillsdale, NJ, 1992.[13] Habib M, The neurological basis of developmental dyslexia. An overview and working
hypothesis, Brain 123:2373–2399, 2000.[14] Horwitz B, Rumsey JM, Donohue BC, Functional connectivity of the angular gyrus in
normal reading and dyslexia, Proc Natl Acad Sci USA 95:8939–8944, 1998.[15] Høien T, Lundberg I, Dyslexia: From Theory to Intervention, Dordrecht, 2000.[16] Instituut voor Orthopedagogiek & Cito. Normeringsonderzoek Screeningstest voor
Taal- en Leesproblemen basisonderwijs jaargroep 1 tot en met 8. Nijmegen/Arnhem:Instituut voor orthopedagogiek/Cito, 2004.
[17] Klimesch W, Doppelmayr M, Wimmer H, Gruber W, Rohm D, Schwaiger J, Hutzler F,Alpha en beta band power changes in normal and dyslexic children, Clin Neurophysiol112:1186–1195, 2001.
[18] Locatelli T, Cursi M, Liberati D et al., EEG coherence in Alzheimer’s disease, ElectroenClin Neuro 106:229–237, 1998.
[19] Leisman G, Ashkenazi M, Aetiological factors in dyslexia: IV, Cerebral hemispheresare functionally equivalent, Int J Neurosci 11:157–164, 1980.
[20] Lyon GR, Shaywitz SE, Shaywitz BA, A definition of dyslexia, Ann Dyslexia 53:1–14,2003.
EEG Power and Coherence in Dyslexia: Double-Deficit 189
[21] Mann VA, Phoneme awareness and future reading ability, J Learn Disabil 26:259–269,1993.
[22] Manis FR, Doi LM, Bhadha B, Naming speed, phonological awareness, and ortho-graphic knowledge in second graders, J Learn Disabil 33(4):325, 2000.
[23] Marosi E, Harmony T, Becker J, Reyes A, Bernal J, Fernandez, Rodriguez, Silva, Guer-rero, Electroencephalographic coherences discriminate between children with differentpedagogical evaluation, Int J Psychophysiol 19(1):23–32, 1995.
[24] Nunez PL, Srinivasan R, Westdorp AF, Wijesinghe RS, Tucker DM, Siberstein RB,Cadusch PJ, EEG coherency I: Statistics, reference electrode, volume conduction,Laplacians, cortical imaging, and interpretation at multiple scales, Electroen Clin Neuro103:499–515, 1997.
[25] Paul RH, Lawrence J, Williams LM, Clark RC, Cooper N, Gordon E, The validity of“IntegNeuro”: A new computerized and standardized battery of neurocognitive tests,In J Neurosci 115:1549–1567, 2005.
[26] Plaut DC, McClelland JL, Seidenberg MS, Patterson K, Understanding normal andimpaired word reading: Computational principles in quasi-regular domains, Psych Rev103:56–115, 1996.
[27] Pugh KR, Mencl WE, Jenner AR, Katz L, Frost SJ, Lee JR, Shaywitz SE, ShaywitzBA, Functional Neuroimaging studies of reading and reading disability (DevelopmentalDyslexia), Ment Retard Dev D R 6:207–213, 2000.
[28] Rippon G, Brunswick N, Trait and stait EEG indices of information processing indevelopmental dyslexia, Int J Psychophysiol 36:151–165, 2000.
[29] Scarborough HS, Children at risk for reading disabilities. Phonological awareness andsome other promising predictors, in Shapiro BK, Accardo PJ, Capute AJ (eds.), SpecificReading Disability: A View of the Spectrum, York Press, Timonium, MD, pp. 75–119,1998.
[30] Shiota M, Koeda T, Takeshita K, Cognitive and neurophysiological evaluation ofJapanese dyslexia, Brain Dev 22:421–426, 2000.
[31] Sklar B, Hanley J, Simmons WW, An EEG experiment aimed toward identifyingdyslexic children, Nature 240:414–416, 1972.
[32] Shaywitz BA, Shaywitz SE, Pugh KR, Mencl WE, Fullbright RK, Skudlarski P et al.,Disruption of posterior brain systems for reading in children with developmentaldyslexia, Biol Psychiat 52:101–110, 2002.
[33] Shaywitz SE, Shaywitz BA, Dyslexia (Specific Reading Disability), Biol Psychiat57:1301–1309, 2005.
[34] Snowling MJ, Language and literacy skills: Who is at risk and why? in Bishop DVM,Leonard LB (eds.), Speech and Language Impairment in Children: Causes, Character-istics, Interventions and Outcome, Psychology Press, Hove, UK, pp. 245–260, 2000.
[35] Tallal P, Experimental studies of language learning impairments: From research toremediation, in Bishop D, Leonard L (eds.), Speech and Language Impairments inChildren, Psychology Press, Hove, pp. 131–155, 2000.
[36] Torgesen JK, Wagner RK, Rashotte CA, Prevention and remediation of severe readingdisabilities: Keeping the eye in mind, Sci Stud Read 1:217–234, 1997.
[37] Van Orden GC, Phonological mediation is fundamental to reading, in Besner D,Huphreys GW (eds.), Basic Processes in Reading, Lawrence Erlbaum, Hillsdale, NJ,pp. 77–103, 1991.
190 Arns et al.
[38] Vellutino FR, Fletcher JM, Snowling MJ, Scanlon DM, Specific reading disability(dyslexia): What have we learned in the past four decades? J Child Psychol Psyc45:2–40, 2004.
[39] Weiss S, Mueller HM, The contribution of EEG coherence to the investigation of lan-guage, Brain Lang 85:325–343, 2003.
[40] Wagner RK, Torgesen JK, Rashotte CA, Hecht SA, Barker TA, Burgess SR, Donahue J,Garon T, Changing relations between phonological processing abilities and word-levelreading as children develop from beginning to skilled readers: A 5-year longitudinalstudy, Dev Psychol 33(5):468–479, 1997.
[41] Wolf M, Obregon M, Early naming deficits, developmental dyslexia, and a specificdeficit hypothesis, Brain Lang 42:219–247, 1992.
[42] Wolf M, Bowers P, The question of naming speed deficits in developmental readingdisabilities: An introduction to the double-deficit hypothesis, J Learn Disabil 33:322–324, 2000.
[43] Wentink H, Verhoeven L, Protocol leesproblemen en dyslexie [Protocol for screeningreading problems and dyslexia], Nijmegen. Expertisecentrum Nederlands, 2001.