research laboratory neural network-based sensor … · research laboratory neural network-based...
TRANSCRIPT
NASA / TM-- 1998-208824
U.S. ARMY
RESEARCH LABORATORY
Neural Network-Based Sensor
Validation for Turboshaft Engines
ARL-TR-1817
AIAA-98-3605
James C. Moller
Miami University, Oxford, Ohio
Jonathan S. Litt and Ten-Huei Guo
Lewis Research Center, Cleveland, Ohio
Prepared for the
34th Joint Propulsion Conference and Exhibit
cosponsored by the AIAA, ASME, SAE, and ASEE
Cleveland, Ohio, July 13-15, 1998
National Aeronautics and
Space Administration
Lewis Research Center
November 1998
https://ntrs.nasa.gov/search.jsp?R=19990008960 2019-03-07T22:51:55+00:00Z
Acknowledgments
The authors would like to thank the U.S. Army Strategic and Advanced Computing Center,
formerly the U.S. Army Artificial Intelligence Center for supporting this work.
Trade names or manufacturers' names are used in this report for
identification only. This usage does not constitute an official
endorsement, either expressed or implied, by the National
Aeronautics and Space Admit istration.
NASA Center for Aerospace Information7121 Standard Drive
Hanover, MD 21076Price Code: A03
Available from
National Technical Information Service
5285 Port Royal Road
Springfield, VA 22100Price Code: A03
AIAA-98-3605
NEURAL NETWORK-BASED SENSOR VALIDATION FOR TURBOSHAFT ENGINES
James C. Moiler
Department of Manufacturing Engineering
Miami UniversityOxford, OH 45056
Jonathan S. Litt
U.S. Army Research Laboratory
Vehicle Technology CenterLewis Research Center
Cleveland, Ohio 44135
Ten-Huei Guo
Member AIAALewis Research Center
National Aeronautics and Space AdministrationCleveland, OH 44135
ABSTRACT
Sensor failure detection, isolation, and accommodation
using a neural network approach is described. Anautoassociative neural network is configured to perform
dimensionality reduction on the sensor measurementvector and provide estimated sensor values. The sensorvalidation scheme is applied in a simulation of the
T700 turboshaft engine in closed loop operation.Performance is evaluated based on the ability to detect
faults correctly and maintain stable and responsive
engine operation. The set of sensor outputs used forengine control forms the network input vector.Analytical redundancy is verified by training networksof successively smaller bottleneck layer sizes. Training
data generation and strategy are discussed. The enginemaintained stable behavior in the presence of sensorhard failures. With proper selection of faultdetermination thresholds, stability was maintained in
the presence of sensor soft failures.
Variable
Ng
Ng'
Np
P_QsT2T4_Wf
NOMENCLATURE
Description% of gas generator design speed
% of gas generator design speedindicated in cockpit
% of power turbine design speedCompressor exit pressure
Shaft torqueCompressor inlet temperature
Interturbine gas temperatureFuel flow rate
INTRODUCTION
On-line fault detection and diagnosis is an area withgreat potential. The ability to detect and isolate a fault
as it happens allows immediate decisions to be madeabout system availability and likelihood of missioncompletion. In a battlefield environment, for example,
This paper is declared a work of the U.S. Government and isnot subject to copyright protection in the United States.
system unavailability may well have more direconsequences than the loss of some information.Sensor malfunctions are particularly pernicious in that
they may lead to mission termination when all systemsare in fact functioning properly.
Variables in complex systems are often correlated andthis information can be used to detect, isolate and
recover incorrect sensor readings. Dunia, et al. 1havecategorized sensor faults into four classes: total failure,
drift, 10ss of precision, and fixed bias. An earlytechnique used to perform detection, isolation, andrecovery was Kalman filtering. 2"3'4The success of this
approach is dependent upon the fidelity of the enginemodel embedded in the filter. 5 Another successful
approach uses linear fault models. 6 Additionally, Guoand Nurre 7have demonstrated how lost or incorrect
sensor values can be recovered using the remainingvalid measurements through a neural network, a
precursor to this work.
The fault detection, isolation, and accommodation
(FDIA) method selected here was to integrate anautoassociative neural network into the path ofinformation passed from the sensors back to the
controlling entities. Responses to total failure and driftfaults have been investigated here. Autoassociativeneural networks have the general feature of being able
to perform functional mappings. Kramer 8 and Saund 9have introduced and applied a specific networkarchitecture that is effective for filtering and fault
isolation. Among the principal advantages of thisapproach over competing methods is that identification,isolation, and accommodation can be done with a single
passage of information through the network.
T700 SYSTEM OPERATION
The T700 is a turboshaft engine. It is used in the
Blackhawk and Apache helicopter airframes. Theprincipal input from the cockpit is the percent ofcollective stick. Engine operation is controlled by the
1
American Institute of Aeronautics and Astronautics
QUANTITY
% power turbine speed ( Np ) '
Compressor inlet temperature ( I"2 )
% gas generator speed ( N s )
% gas generator speed ( Ng' )
Shaft torque ( Qs )
Turbine inlet temperature ( T,5 )
Compressor exit pressure ( Pe )
Trim signal
RECEIVING UNIT /PRINCIPAL PURPOSE
TYPE
ECU / Trim Proximity
HMU / Fuel schedule Thermo-mechanical (bellows)
HMU / Fuel schedule Mechanical (fly weights)
Cockpit / Display Inductive
ECU / Load sharing Proximity
T/CECU / OvertemperatureprotectionHMU / Fuel schedule
HMU / Np governing
Pneumo-mechanical (bellows)
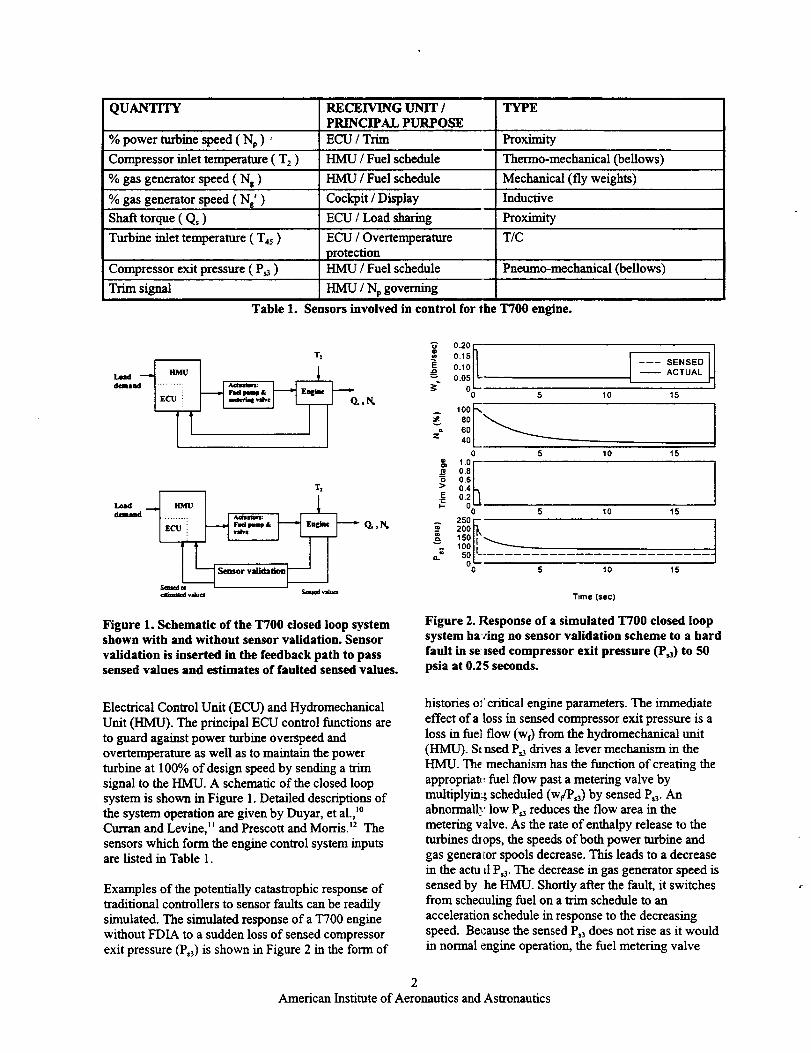
Table 1. Sensors involved in control for the T700 engine.
T2
T_
dcmaad
5em_l efcremated vdms Sea_l valuta
Figure 1. Schematic of the T700 closed loop systemshown with and without sensor validation. Sensor
validation is inserted in the feedback path to passsensed values and estimates of faulted sensed values.
0.20h0.151[
O.lOll0.05 E
_" o°
I ---- SENSED 1ACTUAL
5 10 15
0 5 10 15
IN 0.8_ 0.6> 0.4E 0.2t-
OO 5 10 15
5 10 15
250 •
200 [k_5Ol;"lOOli _-
j SOL'.0o
Time (sec)
Figure 2. Response of a simulated T700 closed loopsystem hating no sensor validation scheme to a hardfault in sensed compressor exit pressure (P,3) to 50psia at 0.25 seconds.
Electrical Control Unit (ECU) and HydromechanicalUnit (HMU). The principal ECU control functions are
to guard against power turbine overspeed andovertemperamre as well as to maintain the power
turbine at 100% of design speed by sending a trimsignal to the HMU. A schematic of the closed loopsystem is shown in Figure 1. Detailed descriptions ofthe system operation are given by Duyar, et al., '°Curt'an and Levine, _1and Prescott and Morris) 2 The
sensors which form the engine control system inputsare listed in Table 1.
Examples of the potentially catastrophic response of
traditional controllers to sensor faults can be readilysimulated. The simulated response of a T700 enginewithout FDIA to a sudden loss of sensed compressor
exit pressure (Ps3) is shown in Figure 2 in the form of
histories of critical engine parameters. The immediateeffect of a loss in sensed compressor exit pressure is a
loss in fue] flow (wf) from the hydromechanical unit(HMU). Scnsed P_ drives a lever mechanism in theHMU. The mechanism has the function of creating the
appropriatt,, fuel flow past a metering valve bymultiplying scheduled (w(P,3) by sensed P,3- Anabnormally low P_3reduces the flow area in the
metering valve. As the rate of enthalpy release to theturbines chops, the speeds of both power turbine andgas generator spools decrease. This leads to a decrease
in the actud P,3- The decrease in gas generator speed issensed by he HMU. Shortly after the fault, it switches
from scheclulmg fuel on a u_n schedule to anacceleration schedule in response to the decreasingspeed. Because the sensed P,3 does not rise as it would
in normal engine operation, the fuel metering valve
2
American Institute of Aeronautics and Astronautics
i_pias _u_iDs
Bottleaeek
Output Estimated s_ssorScareroucpv| layer valuevectorvaluevcctor
Nv Np
T: (_) T.,
N. (_) N.
Q. C) Q,
T. (_ T.
P, P,
Trim T_o
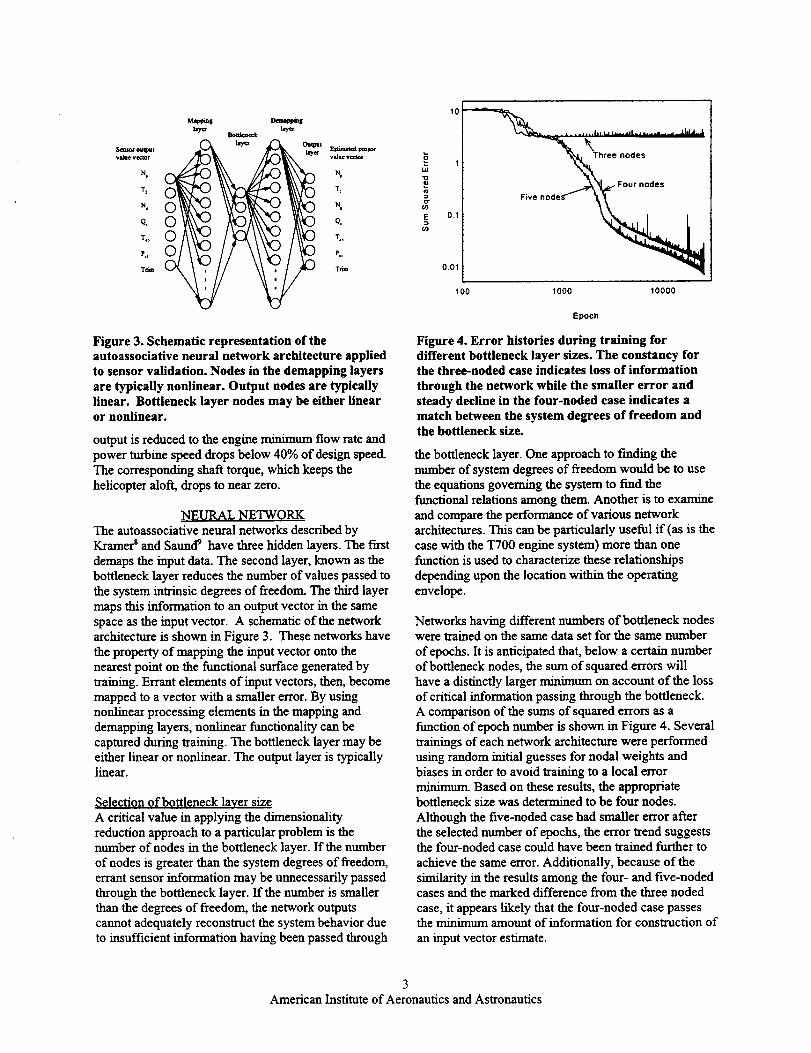
Figure 3. Schematic representation of theautoassociative neural network architecture appliedto sensor validation. Nodes in the demapping layers
are typically nonlinear. Output nodes are typicallylinear. Bottleneck layer nodes may be either linearor nonlinear.
output is reduced to the engine minimum flow rate and
power turbine speed drops below 40% of design speed.The corresponding shaft torque, which keeps the
helicopter aloft, drops to near zero.
NEURAL NETWORK
The autoassociative neural networks described by
Kramer s and Saund 9 have three hidden layers. The fast
demaps the input data. The second layer, known as thebottleneck layer reduces the number of values passed tothe system intrinsic degrees of freedom. The third layer
maps this information to an output vector in the samespace as the input vector. A schematic of the networkarchitecture is shown in Figure 3. These networks have
the property of mapping the input vector onto thenearest point on the functional surface generated bytraining. Errant elements of input vectors, then, become
mapped to a vector with a smaller error. By usingnonlinear processing elements in the mapping anddemapping layers, nonlinear functionality can be
captured during training. The bottleneck layer may beeither linear or nonlinear. The output layer is typicallylinear.
Selection of bottleneck layer sizeA critical value in applying the dimensionality
reduction approach to a particular problem is thenumber of nodes in the bottleneck layer. If the numberof nodes is greater than the system degrees of freedom,
errant sensor information may be unnecessarily passedthrough the bottleneck layer. If the number is smallerthan the degrees of freedom, the network outputs
cannot adequately reconstruct the system behavior dueto insufficient information having been passed through
uJ
¢e
gcO
10
1
0.1
0.01
Five nodes'-
100 1000 10000
Epoch
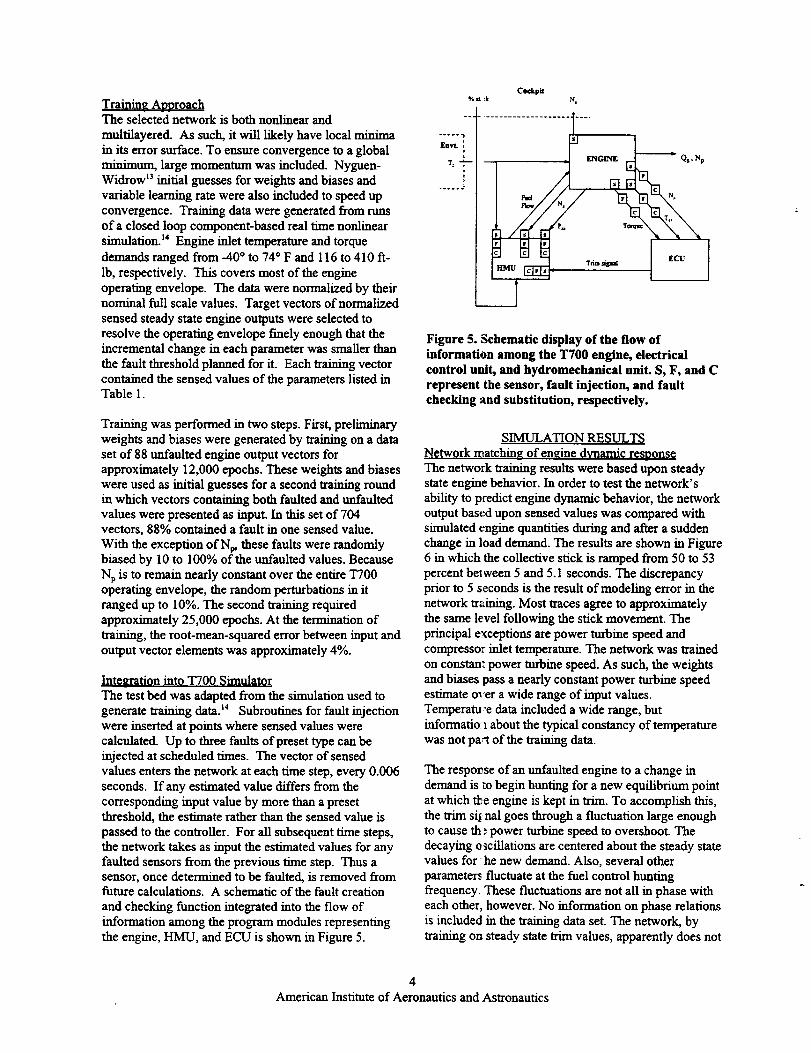
Figure 4. Error histories during training fordifferent bottleneck layer sizes. The constancy forthe three-noded case indicates loss of information
through the network while the smaller error andsteady decline in the four-noded case indicates amatch between the system degrees of freedom andthe bottleneck size.
the bottleneck layer. One approach to finding the
number of system degrees of freedom would be to usethe equations governing the system to fred thefunctional relations among them. Another is to examine
and compare the performance of various networkarchitectures. This can be particularly useful if (as is the
case with the TT00 engine system) more than onefunction is used to characterize these relationships
depending upon the location within the operatingenvelope.
Networks having different numbers of bottleneck nodeswere trained on the same data set for the same number
of epochs. It is anticipated that, below a certain numberof bottleneck nodes, the sum of squared errors will
have a distinctly larger minimum on account of the lossof critical information passing through the bottleneck.
A comparison of the sums of squared errors as afunction of epoch number is shown in Figure 4. Several
trainings of each network architecture were performedusing random initial guesses for nodal weights andbiases in order to avoid training to a local errorminimum. Based on these results, the appropriatebottleneck size was determined to be four nodes.
Although the five-noded case had smaller error afterthe selected number of epochs, the error trend suggeststhe four-noded case could have been trained further to
achieve the same error. Additionally, because of the
similarity in the results among the four- and five-nodedcases and the marked difference from the three noded
case, it appears likely that the four-noded case passesthe minimum amount of information for construction of
an input vector estimate.
3American Institute of Aeronautics and Astronautics
Training AL_proachThe selected network is both nonlinear and
multilayered. As such, it will likely have local minima
in its error surface. To ensure convergence to a globalminimum, large momentum was included. Nyguen-Widrow 'a initial guesses for weights and biases and
variable learning rate were also included to speed upconvergence. Training data were generated from runs
of a closed loop component-based real time nonlinearsimulation.'4 Engine inlet temperature and torque
demands ranged from -40 ° to 74 ° F and 116 to 410 ft-
Ib, respectively. This covers most of the engineoperating envelope. The data were normalized by their
nominal full scale values. Target vectors of normalizedsensed steady state engine outputs were selected to
resolve the operating envelope trmely enough that theincremental change in each parameter was smaller thanthe fault threshold planned for it. Each training vector
contained the sensed values of the parameters listed inTable 1.
Training was performed in two steps. First, preliminaryweights and biases were generated by training on a data
set of 88 unSaulted engine output vectors forapproximately 12,000 epochs. These weights and biaseswere used as initial guesses for a second training roundin which vectors containing both faulted and unfaulted
values were presented as input. In this set of 704vectors, 88% contained a fault in one sensed value.
With the exception of No, these faults were randomlybiased by 10 to 100% of the uafaulted values. Because
Np is to remain nearly constant over the entire T700operating envelope, the random perturbations in itranged up to 10%. The second training required
approximately 25,000 epochs. At the termination oftraining, the root-mean-squared error between input and
output vector elements was approximately 4%.
Intearation into T700 Simulator
The test bed was adapted from the simulation used togenerate training data. '4 Subroutines for fault injection
were inserted at points where sensed values werecalculated. Up to three faults of preset type can beinjected at scheduled times. The vector of sensed
values enters the network at each time step, every 0.006seconds. If any estimated value differs from the
corresponding input value by more than a presetthreshold, the estimate rather than the sensed value is
passed to the controller. For all subsequent time steps,
the network takes as input the estimated values for anyfaulted sensors from the previous time step. Thus asensor, once determined to be faulted, is removed fromfuture calculations. A schematic of the fault creation
and checking function integrated into the flow of
information among the program modules representingthe engine, HMU, and ECU is shown in Figure 5.
Ceckp/t
% _ :k N.
i
T, ;. t
D..... ;
Flow Nm
_A
][NG[_ _ Qs, NO
EOIJTrim -J_
Figure 5. Schematic display of the flow ofinformation among the T700 engine, electrical
control unit, and hydromechanical unit. S, F, and Crepresent the sensor, fault injection, and fault
checking and substitution, respectively.
SIMULATION RESULTS
Network matching of engine dynamic responseThe network training results were based upon steadystate engine behavior. In order to test the network'sability to predict engine dynamic behavior, the network
output based upon sensed values was compared withsimulated engine quantities during and after a suddenchange in load demand. The results are shown in Figure6 in which the collective stick is ramped from 50 to 53
percent between 5 and 5.1 seconds. The discrepancyprior to 5 seconds is the result of modeling error in the
network training. Most traces agree to approximatelythe same level following the stick movement. Theprincipal exceptions are power turbine speed and
compressor inlet temperature. The network was trainedon constan_ power turbine speed. As such, the weights
and biases pass a nearly constant power turbine speedestimate over a wide range of input values.Temperatu:e data included a wide range, but
informatio_l about the typical constancy of temperaturewas not pa_ of the training data.
The respor_se of an unfanlted engine to a change indemand is to begin hunting for a new equilibrium point
at which _e engine is kept in trim. To accomplish this,the trim si_ hal goes through a fluctuation large enough
to cause th ."power turbine speed to overshoot. Thedecaying o scillations are centered about the steady statevalues for -he new demand. Also, several otherparameters fluctuate at the fuel control hunting
frequency. These fluctuations are not all in phase witheach other, however. No information on phase relationsis included in the training data set. The network, by
training on steady state trim values, apparently does not
4
American Institute of Aeronautics and Astronautics
E-=..
==
0.25 I0.20 Io._51o.lol0.05 I
0 o
102
101
100
99
98
0.8m 0.6]
0.4> 0.2E 0_- -0.2
A
..... ESTIMATED-- ACTUAL
---- SENSED10
5 10 15
5 10 15
2'°1230[
220 t ................
2104 5 10 15
O.
Time (sec)
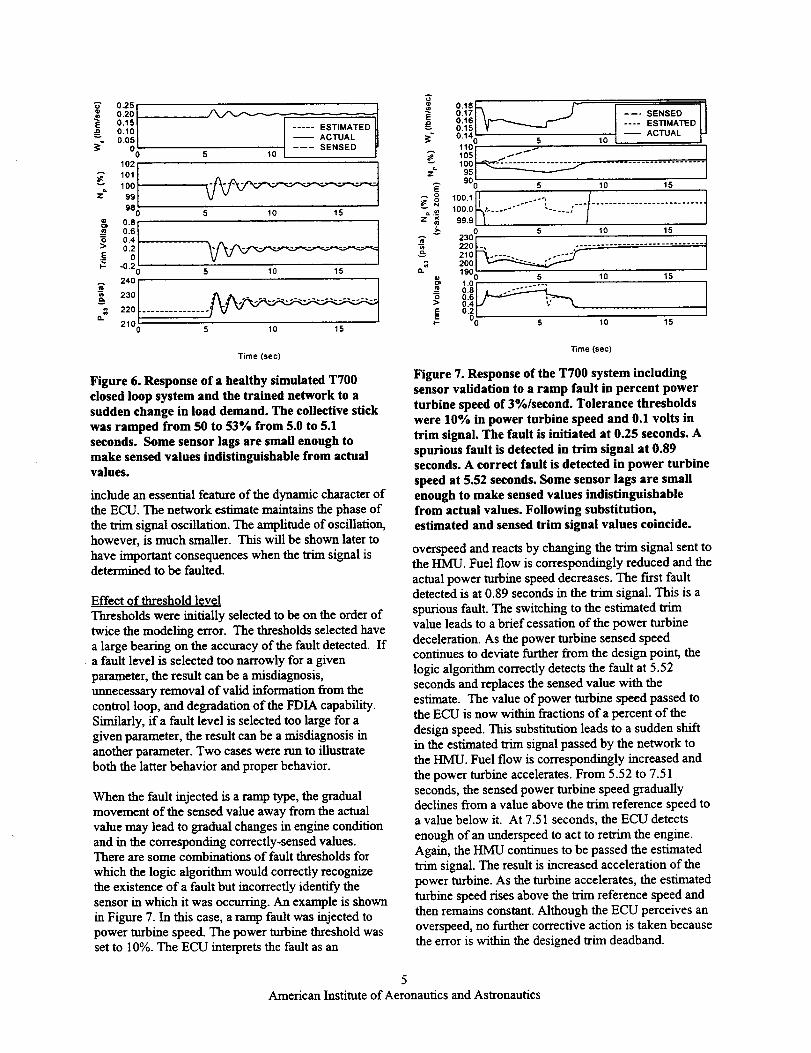
Figure 6. Response of a healthy simulated T700
closed loop system and the trained network to asudden change in load demand. The collective stickwas ramped from 50 to 53% from 5.0 to 5.1
seconds. Some sensor lags are small enough tomake sensed values indistinguishable from actualvalues.
include an essential feature of the dynamic character of
the ECU. The network estimate maintains the phase of
the trim signal oscillation. The amplitude of oscillation,however, is much smaller. This will be shown later to
have important consequences when the trim signal isdetermined to be faulted.
Effect of threshold level
Thresholds were initially selected to be on the order of
twice the modeling error. The thresholds selected havea large bearing on the accuracy of the fault detected. If
• a fault level is selected too narrowly for a given
parameter, the result can be a misdiagnosis,unnecessary removal of valid information from thecontrol loop, and degradation of the FDIA capability.
Similarly, if a fault level is selected too large for agiven parameter, the result can be a misdiagnosis in
another parameter. Two cases were run to illustrateboth the latter behavior and proper behavior.
When the fault injected is a ramp type, the gradualmovement of the sensed value away from the actualvalue may lead to gradual changes in engine condition
and in the corresponding correctly-sensed values.There are some combinations of fault thresholds for
which the logic algorithm would correctly recognizethe existence of a fault but incorrectly identify the
sensor in which it was occurring. An example is shownin Figure 7. In this case, a ramp fault was injected to
power turbine speed. The power turbine threshold wasset to 10%. The ECU interprets the fault as an
E
z_
0.181.-, /"- '
o0'14 L_d_-- _ -- ACTUAL
• 0 5 10 __110j _- I105l _ t _ I
,oo ......................I904 5 10 15
=_ ° 100"111 ...... :" :"'/..... t0. _ 100.0 .... "°"
z _ 99.91 I0 5 10 15
-_" 230 /220 I--, ..... _........................ /21o_ ........ ..--y-- ]2°°119o_ /10 15
51.0 .... _ I
IE o._ " _-=_ 5 10 15
Time (sec)
Figure 7. Response of the TT00 system includingsensor validation to a ramp fault in percent power
turbine speed of 3%/second. Tolerance thresholdswere 10% in power turbine speed and 0.1 volts in
trim signal. The fault is initiated at 0.25 seconds. Aspurious fault is detected in trim signal at 0.89seconds. A correct fault is detected in power turbine
speed at 5.52 seconds. Some sensor lags are smallenough to make sensed values indistinguishablefrom actual values. Following substitution,estimated and sensed trim signal values coincide.
overspeed and reacts by changing the trim signal sent tothe HMU. Fuel flow is correspondingly reduced and the
actual power turbine speed decreases. The first faultdetected is at 0.89 seconds in the trim signal. This is a
spurious fault. The switching to the estimated trimvalue leads to a brief cessation of the power turbine
deceleration. As the power turbine sensed speedcontinues to deviate further from the design point, the
logic algorithm correctly detects the fault at 5.52seconds and replaces the sensed value with theestimate. The value of power turbine speed passed tothe ECU is now within fractions of a percent of the
design speed. This substitution leads to a sudden shiftin the estimated trim signal passed by the network to
the HMU. Fuel flow is correspondingly increased and
the power turbine accelerates. From 5.52 to 7.51seconds, the sensed power turbine speed graduallydeclines from a value above the m_m reference speed toa value below it. At 7.51 seconds, the ECU detects
enough of an underspeed to act to retrim the engine.Again, the HMU continues to be passed the estimatedtrim signal. The result is increased acceleration of the
power turbine. As the turbine accelerates, the estimatedturbine speed rises above the trim reference speed andthen remains constant. Although the ECU perceives an
overspeed, no further corrective action is taken becausethe error is within the designed trim deadband.
5
American Institute of Aeronautics and Astronautics
g 0.201 T
0.19| 1 SENSED
0.18Lo.171_/, ..... ESTIMATED0.161 " ACTUAL
0.15(_ 5 10 15
102, •
,°,1/ I
== 99!- I98 5 10 15
g °So_ t
a 0.5
0.4. ..................................
E 0.3
_- 0.2 5 10 15
2z°/ I22o_. .................................................. I
= 2'°Iv IQ" 200_ 5 10 15
Time (see)
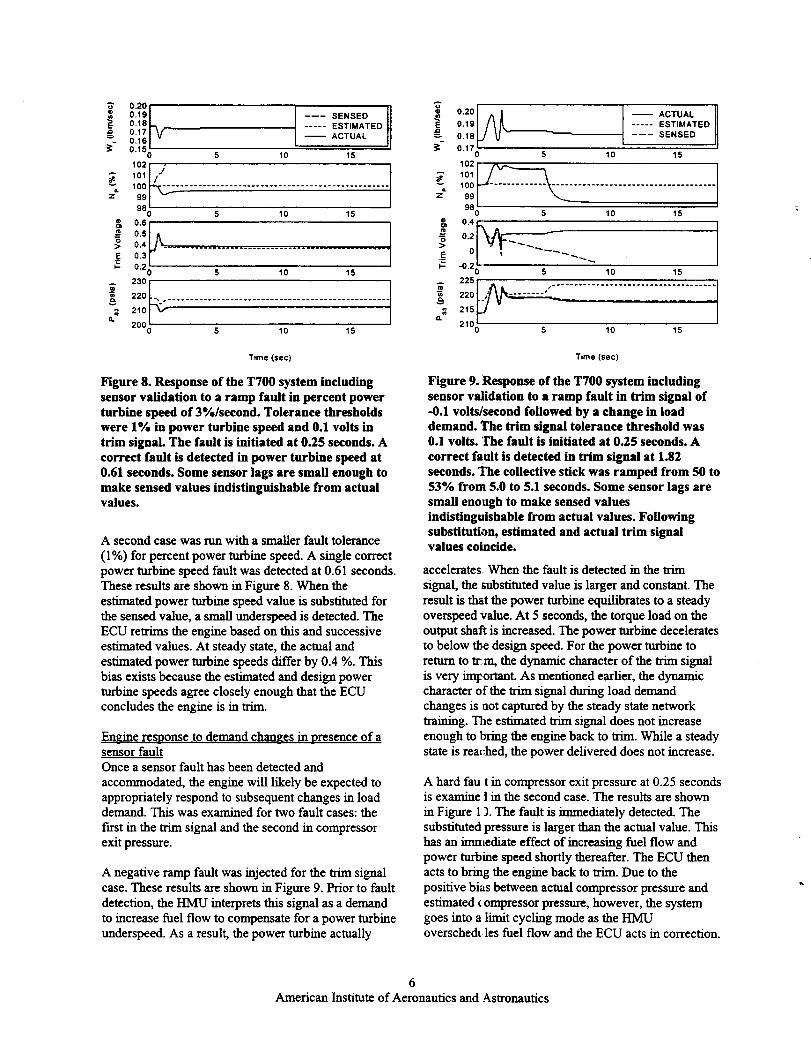
Figure 8. Response of the T700 system includingsensor validation to a ramp fault in percent power
turbine speed of 3%/second. Tolerance thresholdswere 1% in power turbine speed and 0.1 volts intrim signal. The fault is initiated at 0.25 seconds. A
correct fault is detected in power turbine speed at0.61 seconds. Some sensor lags are small enough to
make sensed values indistinguishable from actualvalues.
A second case was run with a smaller fault tolerance
(1%) for percent power turbine speed. A single correctpower turbine speed fault was detected at 0.61 seconds.These results are shown ill Figure 8. When the
estimated power turbine speed value is substituted forthe sensed value, a small underspeed is detected. The
ECU retrims the engine based on this and successiveestimated values. At steady state, the actual andestimated power turbine speeds differ by 0.4 %. This
bias exists because the estimated and design powerturbine speeds agree closely enough that the ECUconcludes the engine is in trim.
Engine response to demand changes in presence of asensor faultOnce a sensor fault has been detected and
accommodated, the engine will likely be expected to
appropriately respond to subsequent changes in loaddemand. This was examined for two fault cases: the
first in the trim signal and the second in compressorexit pressure.
A negative ramp fault was injected for the trim signalcase. These results are shown in Figure 9. Prior to fault
detection, the HMU interprets this signal as a demandto increase fuel flow to compensate for a power turbine
underspeed. As a result, the power turbine actually
A
o.2ol •.. _ AC,UA,E ..... ESTIMATED
-- 0.18 _/ U -- SENSED;_ 0.17
0 5 10 15
1°21 _
_" 101[ / \-- 100_- _ ............. _ ....................................
Z_ 99!98 5 10 15
0.2
_- -0. 5 10 15
225,
215_/(L
2101__5 10 15
Time (sec)
Figure 9. Response of the T700 system including
sensor validation to a ramp fault in trim signal of-0.1 volts/second followed by a change in loaddemand. The trim signal tolerance threshold was0.1 volts. The fault is initiated at 0.25 seconds. A
correct fault is detected in trim signal at 1.82seconds. The collective stick was ramped from 50 to
53% from 5.0 to 5.1 seconds. Some sensor lags aresmall enough to make sensed values
indistinguishable from actual values. Followingsubstitution, estimated and actual trim signalvalues coincide.
accelerates. When the fault is detected in the trim
signal, the substituted value is larger and constant. Theresult is that the power turbine equilibrates to a steady
overspeed Value. At 5 seconds, the torque load on theoutput shaft is increased. The power turbine deceleratesto below the design speed. For the power turbine to
return to _m, the dynamic character of the trim signalis very iml:ortant. As mentioned earlier, the dynanficcharacter of the trim signal during load demand
changes is aot captured by the steady state networktraining. The estimated trim signal does not increaseenough to bring the engine back to trim. While a steady
state is reached, the power delivered does not increase.
A hard fau t in compressor exit pressure at 0.25 secondsis examine! in the second case. The results are shown
in Figure 13. The fault is immediately detected. The
substituted pressure is larger than the actual value. Thishas an immediate effect of increasing fuel flow andpower turbine speed shortly thereafter. The ECU then
acts to bring the engine back to trim. Due to thepositive bias between actual compressor pressure and
estimated compressor pressure, however, the systemgoes into a limit cycling mode as the HMUoverschedi les fuel flow and the ECU acts in correction.
6
American Institute of Aeronautics and Astronautics
E.D
z_
0,25 I
0.20
0.151 ---- SENSED0 101 ..... ESTIMATED
• 0 5 10 _ ACTUAL
102 r
101 I _
loo1_._.=_ _ .........
,:oL5 10 15
0•2 .........
E O.
_- 5 10 15
240 I230, ,- .................................22o__21011 ....
o. 200_)' 5 10 15
0.25 I-
== o.2o1 o.15
_" 0.10 _
z_
---- SENSED 1..... ESTIMATED
ACTUAL
0 5 10 15
lO2 I
101 _ A _ _
lOOi-..=._...i_-_ - ................................99 t I
98_ i ,
0.5
0.4>E 0.3
_- 0.2
230
"_ 220
,_ 210o.
5 10 15
5 10 15
I
20001 5 10 15
Time (sec)
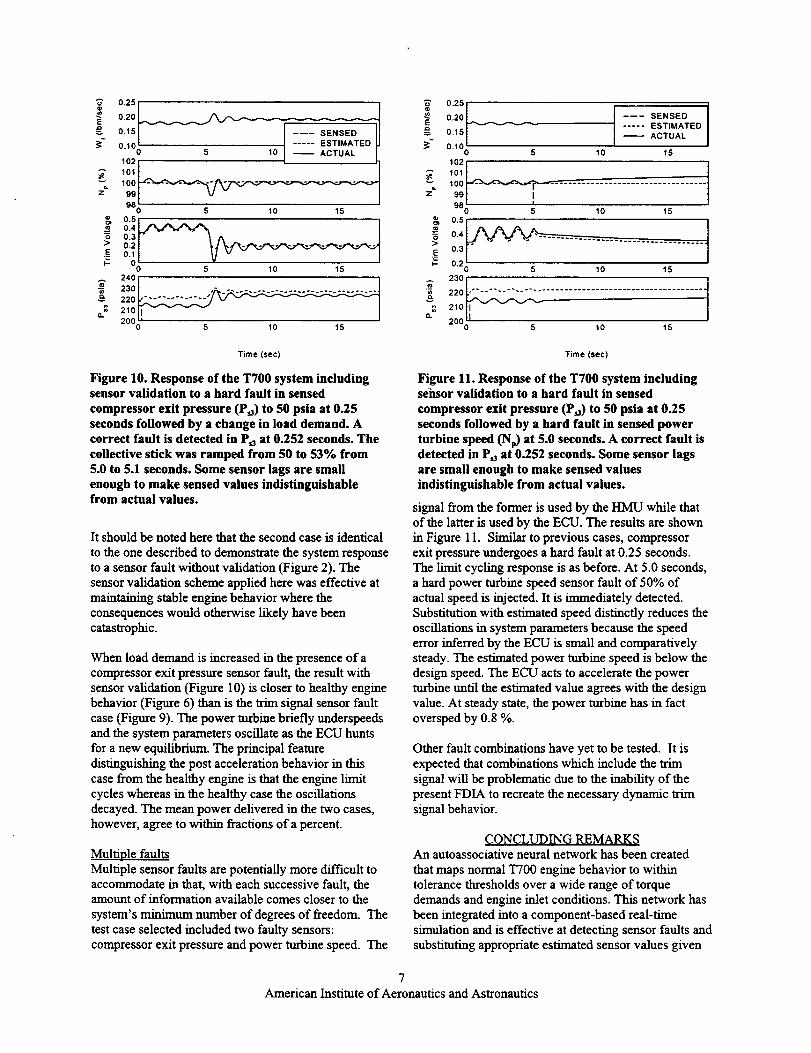
Figure 10. Response of the T700 system includingsensor validation to a hard fault in sensed
compressor exit pressure (P,3) to 50 psia at 0.25
seconds followed by a change in load demand. Acorrect fault is detected in P,3 at 0.252 seconds. Thecollective stick was ramped from 50 to 53% from
5.0 to 5.1 seconds. Some sensor lags are smallenough to make sensed values indistinguishablefrom actual values.
It should be noted here that the second case is identical
to the one described to demonstrate the system response
to a sensor fault without validation (Figure 2). Thesensor validation scheme applied here was effective atmaintaining stable engine behavior where the
consequences would otherwise likely have beencatastrophic.
When load demand is increased in the presence of a
compressor exit pressure sensor fault, the result withsensor validation (Figure 10) is closer to healthy enginebehavior (Figure 6) than is the trim signal sensor fault
case (Figure 9). The power turbine briefly tmderspeedsand the system parameters oscillate as the ECU hunts
for a new equilibrium. The principal featuredistinguishing the post acceleration behavior in thiscase from the healthy engine is that the engine limit
cycles whereas in the healthy case the oscillationsdecayed. The mean power delivered in the two cases,however, agree to within fractions of a percent.
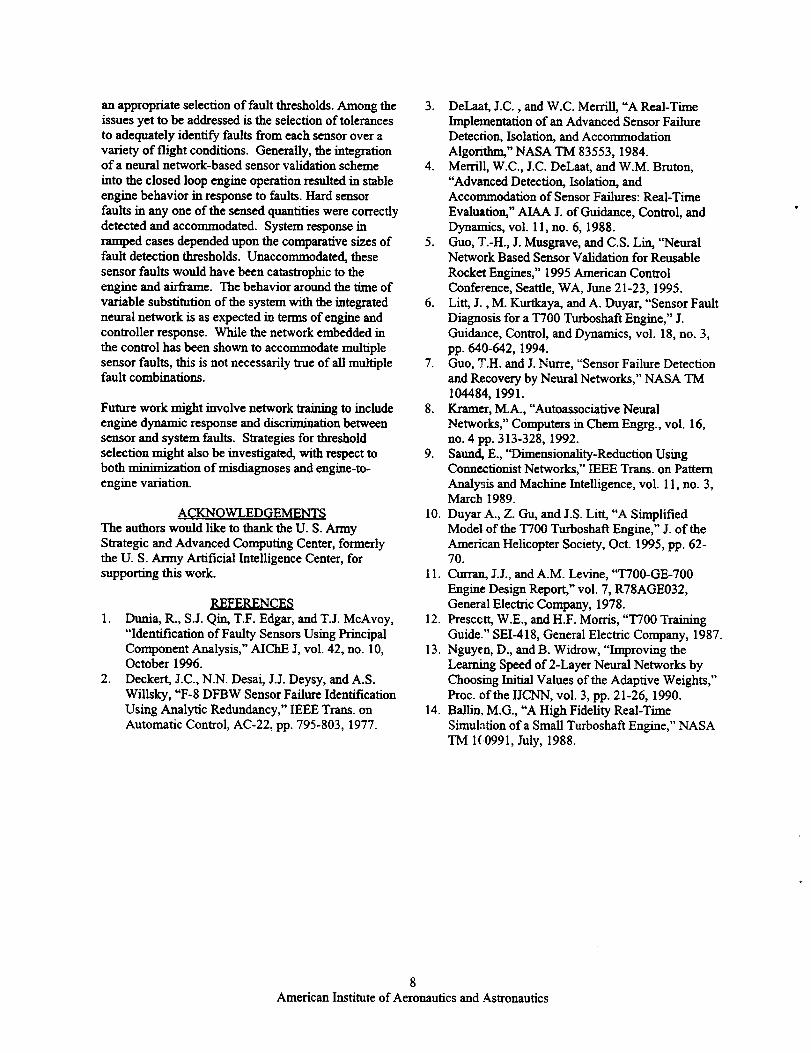
Multiple faultsMultiple sensor faults are potentially more difficult toaccommodate in that, with each successive fault, theamount of information available comes closer to the
system's minimum number of degrees of freedom. The
test case selected included two faulty sensors:compressor exit pressure and power turbine speed. The
Time (see)
Figure 11. Response of the T700 system includingsensor validation to a hard fault in sensed
compressor exit pressure (P,3) to 50 psia at 0.25
seconds followed by a hard fault in sensed power
turbine speed (Np) at 5.0 seconds. A correct fault isdetected in P,3 at 0.252 seconds. Some sensor lags
are small enough to make sensed valuesindistinguishable from actual values.
signal from the former is used by the HMU while that
of the latter is used by the ECU. The results are shownin Figure 11. Similar to previous cases, compressorexit pressure undergoes a hard fault at 0.25 seconds.
The limit cycling response is as before. At 5.0 seconds,a hard power turbine speed sensor fault of 50% ofactual speed is injected. It is immediately detected.
Substitution with estimated speed distinctly reduces theoscillations in system parameters because the speederror inferred by the ECU is small and comparativelysteady. The estimated power turbine speed is below the
design speed. The ECU acts to accelerate the powerturbine until the estimated value agrees with the design
value. At steady state, the power turbine has in factoversped by 0.8 %.
Other fault combinations have yet to be tested. It is
expected that combinations which include the trirnsignal will be problematic due to the inability of the
present FDIA to recreate the necessary dynamic trimsignal behavior.
CONCLUDING REMARKSAn autoassociative neural network has been created
that maps normal T700 engine behavior to withintolerance thresholds over a wide range of torquedemands and engine inlet conditions. This network has
been integrated into a component-based real-timesimulation and is effective at detecting sensor faults andsubstituting appropriate estimated sensor values given
7
American Institute of Aeronautics and Aslronautics
anappropriate selection of fault thresholds. Among theissues yet to be addressed is the selection of tolerancesto adequately identify faults from each sensor over a
variety of flight conditions. Generally, the integrationof a neural network-based sensor validation scheme
into the dosed loop engine operation resulted in stable
engine behavior in response to faults. Hard sensorfaults in any one of the sensed quantities were correctly
detected and accommodated. System response inramped cases depended upon the comparative sizes offault detection thresholds. Unaccommodated, these
sensor faults would have been catastrophic to theengine and airframe. The behavior around the time of
variable substitution of the system with the integratedneural network is as expected m terms of engine and
controller response. While the network embedded inthe control has been shown to accommodate multiple
sensor faults, this is not necessarily true of all multiplefault combinations.
Future work might involve network training to includeengine dynamic response and discrimination betweensensor and system faults. Swategies for thresholdselection might also be investigated, with respect to
both minimization of misdiagnoses and engine-to-engine variation.
AeKNOWLEDGEM_qT$The authors would like to thank the U. S. ArmyStrategic and Advanced Computing Center, formerly
the U. S. Army Artificial Intelligence Center, forsupporting this work.
REFERENCES
I. Dunia, R_, S.J. Qin, T.F. Edgar, and T.J. McAvoy,
"Identification of Faulty Sensors Using FrincipalComponent Analysis," AIChE J, vol. 42, no. I0,October 1996.
2. Deckert, J.C., N.N. Desai, J.J. Deysy) and A.S.Willsky, "F-8 DFBW Sensor Failure IdentificationUsing Analytic Redundancy," IEEE Trans. on
Automatic Control, AC-22, pp. 795-803, 1977.
3. DeLaat, J.C., and W.C. Merrill, "A Real-TimeImplementation of an Advanced Sensor FailureDetection, Isolation, and Accommodation
Algorithm," NASA TM 83553, 1984.4. Merrill, W.C., J.C. DeLaat, and W.M. Bruton,
"Advanced Detection, Isolation, andAccommodation of Sensor Failures: Real-Time
Evaluation," AIAA J. of Guidance, Control, andDynamics, vol. 11, no. 6, 1988.
5. Guo, T.-H., J. Musgrave, and C.S. Lin, "NeuralNetwork Based Sensor Validation for Reusable
Rocket Engines," 1995 American ControlConference, Seattle, WA, June 21-23, 1995.
6. Litt, J., M. Kurtkaya, and A. Duyar, "Sensor FaultDiagnosis for a T700 Turboshaft Engine," J.Guidance, Control, and Dynamics, vol. 18, no. 3,
pp. 640-642, 1994.7. Guo, T.H. and J. Nun-e, "Sensor Failure Detection
and Recovery by Neural Networks," NASA TM104484, 1991.
8. Kramer, M.A., "Autoassociative Neural
Networks," Computers in Chem Engrg., vol. 16,no. 4 pp. 313-328, 1992.
9. Saund, E., "Dimensionality-Reduction UsingConnectiomst Networks," IEEE Trans. on Pattern
Analysis and Machine Intelligence, vol. 11, no. 3,March 1989.
10. Duyar A., Z. Gu, and J.S. Litt, "A Simplified
Model of the T700 Turboshaft Engine," J. of theAmerican Helicopter Society, Oct. 1995, pp. 62-70.
1 1. _ J.J., and A.M. Levine, "T700-GE-700
Engine Design Report," vol. 7, R78AGE032,General Electric Company, 1978.
12. Prescctt, W.E., and H.F. Morris, "T700 TrainingGuide" SEI-418, General Electric Company, 1987.
13. Nguyen, D., and B. Widrow, "Improving the
Learning Speed of 2-Layer Neural Networks byChoosing Initial Values of the Adaptive Weights,"
Proc. of the IJCNN, vol. 3, pp. 21-26, 1990.14. Ballin, M.G., "A High Fidelity Real-Time
Simulation of a Small Turboshaft Engine," NASA
TM 1(0991, July, 1988.
8
American Institute of Aeronautics and Astronautics

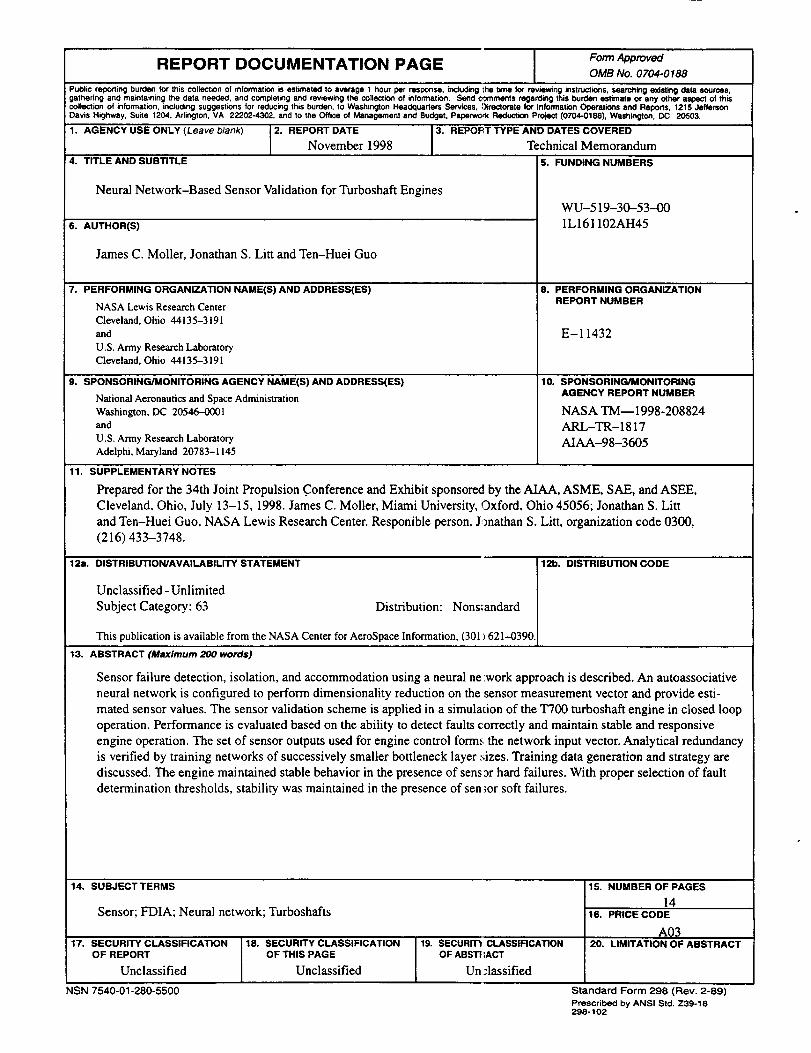
REPORT DOCUMENTATION PAGE Fo=ApprovedOMB No. 0704-0188
Publicreportingburdanforthiscollectionof informationis estimatedto average1 hourperresponse,including_hetimeforreview=nginstructions,searchinge_dstingdatasources,gatheringandmaintainingthedataneeded,andcompletingandreviewingthecollectionof information.Sendcommentsregardingthisburdenestimateor anyotheraspectofthiscollectionof information,includingsuggestionsforreducingthisburden,to WashingtonHeadquartersServices.-'_irentorsteforinformationOperationsandReports,1215JeffersonDavisHighway,Suite1204,Arlington,VA 22202-4302,and to theOfficeof ManagementandBudget.Papan_:_kReductionProject(0704-0188),Washington.DC 20503.
1. AGENCY USE ONLY (Leave blank) 2. REPORT DATE 3. REPOPT TYPE AND DATES COVERED
4. TITLE AND SUBTITLE
November 1998 Technical Memorandum
5. FUNDING NUMBERS
Neural Network-Based Sensor Validation for Turboshaft Engines
6. AOTHOR(S)
James C. Moller, Jonathan S. Litt and Ten-Huei Guo
7. PERFORMING ORGANIZATION NAME(S) AND ADDRESS(ES)
NASA Lewis Research CenterCleveland, Ohio 44135-3191
and
U.S. Army Research Laboratory
Cleveland. Ohio 44135-3191
9. SPONSORING/MONITORING AGENCY NAME(S) AND ADDRESS(ES)
National Aeronautics and Space Administration
Washington. DC 20546--0001and
U.S. Army Research Laboratory
Adelphi, Maryland 20783-1145
WU-519-30-53-00
1L161102AH45
8. PERFORMING ORGANIZATIONREPORT NUMBER
E-11432
10. SPONSORING/MONITORINGAGENCY REPORT NUMBER
NASA TM--1998-208824
ARL-TR-1817
AIAA-98-3605
11. SUPPLEMENTARY NOTES
Prepared for the 34th Joint Propulsion Conference and Exhibit sponsored by the AIAA, ASME, SAE, and ASEE,
Cleveland, Ohio, July 13-15, 1998. James C. Moiler, Miami University, Oxford, Ohio 45056; Jonathan S. Litt
and Ten-Huei Guo, NASA Lewis Research Center. Responible person, J,_nathan S. Litt, organization code 0300,
(216) 433-3748.
12a. DISTRIBUTION/AVAILABILITY STATEMENT
Unclassified - Unlimited
Subject Category: 63 Distribution: Nonstandard
This publication is available from the NASA Center for AeroSpace Information, (301) 621---0390.
12b. DISTRIBUTION CODE
13. ABSTRACT (Maximum 200 words)
Sensor failure detection, isolation, and accommodation using a neural ne :work approach is described. An autoassociative
neural network is configured to perform dimensionality reduction on the sensor measurement vector and provide esti-
mated sensor values. The sensor validation scheme is applied in a simulation of the T700 turboshaft engine in closed loop
operation. Performance is evaluated based on the ability to detect faults correctly and maintain stable and responsive
engine operation. The set of sensor outputs used for engine control forms the network input vector. Analytical redundancy
is verified by training networks of successively smaller bottleneck layer sizes. Training data generation and strategy are
discussed. The engine maintained stable behavior in the presence of sens or hard failures. With proper selection of fault
determination thresholds, stability was maintained in the presence of sen ;or soft failures.
14. SUBJECT TERMS
Sensor; FDIA; Neural network; Turboshafts
17. SECURITY CLASSIFICATION 18. SECURITY CLASSIFICATIONOF REPORT OF THIS PAGE
Unclassified Unclassified
NSN 7540-01-280-5500
19. SECURIT_ CLASSIRCATIONOF ABSTItACT
Un :lassified
15. NUMBER OF PAGES
1416. PRICE CODE
20. LIMITATION OF ABSTRACT
Standard Form 298 (Rev. 2-89)PrescribedbyANSI Std. Z39-18298-102