research excellence framework (ref) impact toolkitresearch excellence framework (ref) impact toolkit...
TRANSCRIPT
Research Excellence Framework (REF) impact toolkit
Helen Tilley Louise Ball Caroline Cassidy
March 2018
CONTENTS
Module 1 Understanding impact
Module 2 Identifying your impact objective
Module 3 Stakeholder mapping
Module 4 Developing a theory of change
Module 5 Communicating your research
Module 6 Monitoring and learning
2
AIMS AUDIENCE AND USESThis guide provides a simple step-by-step approach to planning for impact in six modules It is based on the ODIrsquos Research and Policy in Development (RAPID) Outcome Mapping Approach (ROMA) and draws heavily on the DFID-ESRC Growth Research Programme (DEGRP) guidance on achieving policy impact (Young et al 2014 DEGRP 2017 Shaxson 2016) These resources are grounded in Outcome Mapping see Box 1
The step-by-step approach presented here aims to help researchers think in a structured way about how to monitor and improve the impact research will have on policy and practice It will help researchers understand their impact pathways and develop a suite of indicators they can use to monitor impact over the lifetime of their research project and for some years afterwards
The modules provide guidance in (1) formulating aspects of the Pathways to Impact statement (2) developing a monitoring plan and collecting evidence to inform the reporting of impact in Research Excellence Framework (REF) case studies and (3) writing a REF case study A clear Pathways to Impact statement will help define a good research communications strategy to ensure messages from research reach those who can make a difference throughout the decision-making processes During the research and implementation of the communications strategy monitoring impact and collecting evidence will inform the writing of the impact case study for REF2021
The modules are intended to be used in a flexible manner depending on the purpose and characteristics of the research project If the research project structure (ie who the partners are or how the work is divided between them) or the context within which it operates changes plans should be revisited and if necessary adapted Researchers wanting to dive into this in more detail can ask for support from the RAPID team who can review and comment on impact plans or have one-on-one discussions
Box 1 Outcome Mapping
Outcome Mapping (OM) was first introduced by Sarah Earl Fred Carden and Terry Smutylo from the International Development Research Centre (Earl et al 2001) It focuses on outcomes as defined as changes in behaviour relationships activities and actions and in doing so recognises early changes and progress towards higher-level goals OM differs from conventional logic models by recognising that different actors affected by activities exist in different environments and it is explicitly designed for non-linear systemic change processes (Young et al 2001 Jones and Hearn 2009) It does not try to attribute outcomes but rather explores plausible contributory links between interventions and behaviour changes therefore allowing for complex and non-linear relationships between activities and results
MODULE 1
UNDERSTANDING IMPACT
4
Introduction
There are increasing demands upon researchers to define and demonstrate impact in order to secure funding for research We recognise the importance of conducting research to produce long-term contributions to the knowledge base and to intellectual conversations and our aim is not to convert you to the impact agenda However if you have picked up this guide then it is likely you are interested in influencing policy and practice with your research
The impact of research on funding takes place through two mechanisms First the REF exercise in 2014 and the forthcoming 2021 exercise directly link the assessment of impact case studies to annual Quality-Related (QR) research funding with funding bodies using it to allocate the university block grant between universities1 In 201617 the block grant was pound158 billion (HEFCE 2016) Second research councils award competitive grants on the basis of funding applications that require a Pathways to Impact statement outlining interventions that will enable your research to realise potential impact
In this introductory module we discuss different definitions of impact and the challenges of measuring it Measuring change is a challenging area for researchers As well as the complexities involved in understanding contribution and causal chains there are no standard metrics and funders often set their own measures of success For instance publication and citation data are often used as a measure of research output but they do not consider the impact research may have on policy and practice
Impact and the challenges of measuring it
What does research impact mean and how can you achieve it Just as the term lsquoimpactrsquo is being used more widely there are increasing numbers of definitions of how it can be applied2 In statistics impact is defined as the measured difference in a predefined indicator before the intervention and after the intervention3 The Development Assistance Committee of the Organisation for Economic Co-operation and Development (OECD-DAC) uses a broader definition of impact as any long-term effect whether intended unintended positive negative direct or indirect4
In the 2014 REF impact is defined as an effect on or change or benefit to the economy society culture public policy or services health the environment or quality of life beyond academia (REF2014 2014) Research Councils UK (RCUK) defines impact as academic economic and societal and highlights the importance of balancing these rather than just focusing on academic impact5 This recognises both the contribution research can make to academic advances and the more diverse ways in which research can contribute to economic performance within and outside of the UK increasing the effectiveness of public policy and improving quality of life RCUK also includes public engagement as an impact pathway see Module 5
Here we apply the Economic and Social Research Council (ESRC)-preferred definition summarised in Table 1 as this is research-focused and therefore considers the ways in which research can have an impact
1 For more information see wwwgovukgovernmentnewsgovernment-launches-review-to-improve-university-research-funding accessed 31 May 2017
2 For a summary of definitions of impact used in international development see Hearn and Buffardi (2009) httpswwwodiorgsitesodiorgukfilesodi-assetspublications-opinion-files10302pdf accessed 12 June 2017
3 For example the World Bankrsquos definition lsquothe indicator of interest with and without the intervention Y1 - Y0rsquo White (2009) www3ieimpactorgmediafiler_public20120507Working_Paper_3pdf accessed 20 May 2017
4 For examples of intended positive negative and unintended see Hearn and Buffardi (2009 p9) wwwodiorgsitesodiorgukfilesodi-assetspublications-opinion-files10302pdf also see Hearn (2016) httpwwwresearchtoactionorg201602what-do-we-mean-by-impact accessed 30 May 2017
5 For a discussion on pathways to impact see httpwwwrcukacukinnovationimpacts accessed 31 May 2017
Take-away messages
bull Start thinking about impact and how you will measure it at the start of your research This will help you understand and capture impact when it arises Also revisit your plan regularly to adjust it as necessary
bull Your role in achieving impact may not be straightforward Your influence may be direct but it may also be indirect It may be that you only contribute to broad changes
bull Assessing the context is important when considering impact Consider complexities such as unexpected impact impact over the longer term contribution and co-creation and contextual factors
5
ESRC defines impact as conceptual instrumental and capacity-building6 We include enduring connectivity to recognise that lsquoresearch does not happen in isolationrsquo ndash as achieving impact includes lsquobuilding networks of people and organisations able to understand the research and make use of itrsquo during the research and after the research has ended
Table 1 Definitions of impact7
Conceptual Impacts on knowledge understanding and attitudes
Instrumental Impacts on changes in policy and practice
Capacity-building Impacts on the ability of researchers to conduct similar work in future
Enduring connectivity Impacts on the existence and strength of networks of people and organisations who understand and can make use of the research
Identifying different types of impact
Research projects may be able to demonstrate all types of impact during their lifetime but not in any predetermined proportion or order It is up to researchers to develop their argument on how to prioritise the different types of impact and how much effort to put into achieving each one This toolkit offers guidance on doing this
Identifying the type of impact you are aiming for can help in recognising when a contribution has been achieved However this early thinking perhaps as part of developing your Pathways to Impact should not be at the expense of being open to new and unexpected types of impact that may arise during the course of your research In both policy and practice it is usually impossible to predict which types of impact will be achieved and on what scale recognised in OECD-DACrsquos broad definition which includes unintended and indirect impact
Policy change impact (within RCUKrsquos economic and societal definition of impact) is often overemphasised although individual research projects are not expected to directly influence decision-making Instead research is expected to make a plausible contribution to decisions via the lsquoweb of influencersquo through which research impact can be felt (British Academy 2016)
In understanding impact it is important to consider complexities such as unexpected impact impact over the longer term contribution and co-creation and contextual factors These make measuring impact particularly challenging Indeed the 2014 REF case studies were assessed in terms of their (1) reach ndash lsquothe spread or breadth of influence or effect on the relevant constituenciesrsquo and (2) significance ndash lsquothe intensity or the influence or effectrsquo Therefore these are key elements of impact that as far as possible should be planned for and monitored during the research
Contribution
What role do you as the researcher play in achieving impact It may be that your influence is direct or it may be indirect In some cases we may be able to establish a direct link between a piece of research and a particular change as the impact may result directly from one research paper for example
However in other cases the impact may result from a body of research involving many different researchers It may be the case that the impact is not realised until sometime after the research is finalised This longer-term impact is assessed by the REF exercise as lsquohistoric evidence of impactrsquo (RCUK 2014)
Demonstrating change and the significance of the change is therefore important with proxies such as co-production being used to illustrate contribution In assessing the nature of your contribution it is helpful to systematically consider how direct or indirect the influence of your research on the impact has been and whether there are other social or cultural factors that may have played an important role It may be possible to discern the following types of contribution or influence
6 For the ESRC-preferred definitions of impact see wwwesrcacukresearchimpact-toolkitwhat-is-impact accessed 30 May 2017
7 These come from ESRC-preferred definitions of impact as set out in Meagher L (2012) lsquoRELU societal and economic impact evaluationrsquo Evaluation prepared by Technology Development Group (mimeo) (wwwreluacukresearchInnovation20in20Prog20ManagementRelu_Impact_Evaluation_Final_Report_tcm8-22271[1]pdf) The fifth category used to evaluate RELU fostering interdisciplinarity is not used here as it is not a focus of impact in REF
6
bull lsquoDirect attributable impactsrsquo such that without the research there would have been no impact bull lsquoPlausible and distinct contributions to sustainable changersquo such that there has been a plausible contribution to lasting change and your
contribution can be distinguished from other contributions (see Pasanen and Shaxson 2016) bull lsquoPlausible and indistinct contributionsrsquo where it is not possible to separate the contribution of your research from other influences yet
its influence is likely to be merged with others and so therefore contributes to the combined impact
Contextual factors
Impact through the production of evidence does not take place through a neutral bureaucratic process of identifying and implementing a lsquobest practicersquo option Decision-making processes are affected by the context in which they take place how different stakeholders use evidence to inform their positions how they relate to each other and how evidence is brokered between them (Jones et al 2012)
Du Toit (2012) points out that it is not simply about providing evidence it is about ensuring these rigorous analyses inform goals strategy policy design and implementation by adding value to what is already being done lsquoPro-poor policy interventions take place in complex dynamic open social systemsrsquo (ibid p3) and they are generally implemented via messy partnerships (Guijt 2008) Hearn and Buffardi (2016) present dimensions of impact to arrive at a contextually appropriate understanding
Some factors to consider when assessing the context specific to each research project include the following (Table 2)
Table 2 Assessing the context
1 Who are the key policy actors and decision-makers in the field
2 Is there a demand for research and new ideas among these actors
3 What are the sources of resistance to evidence-based policy-making
4 What is the policy environment
1 What are the policy-making structures
2 What are the policy-making processes
3 What is the relevant legalpolicy framework
4 What are the opportunities and timing for input into formal processes
5 How do global national and local political social and economic structures and interests affect the room for manoeuvre of policy-makers
6 Who shapes the aims and outputs of policies
7 How do assumptions influence policy-making To what extent are decisions routine incremental fundamental or emergent and who supports or resists change
Planning for impact
It is important to understand the likely impact of research at an early stage by developing a Pathways to Impact statement as it helps in understanding lsquowhat you will do and how you will act to enable your research to connect with others and make a difference conceptually and instrumentallyrsquo (ESRC 2017) It is also an important requirement of funding as lsquoResearch Councils require academics to consider the future impact of research at the point of applying for fundingrsquo (RCUK 2014b) Describing your Pathways to Impact is a requirement for the vast majority of funding proposals and even in the exceptional cases where it is not required the lsquoPathways to Impact statement should be used to fully justify the reasons why this is not possiblersquo (ESRC 2017)
This is not to suggest that the expected impact will remain constant throughout the research rather it should be updated and adapted as the context changes and the research trajectory unfolds Indeed research councils (RCs) lsquorecognise the emergent and long-term nature of research and of research outcomesrsquo and seek to support flexibility and autonomy in lsquoproject definition management collaboration participation promotion and the communication of research outputsrsquo (RCUK 2014a)
7
TASK understanding impact in your research project
Time 10ndash20 minutes
Resources 1 x flip chart paper and pen per group
Purpose To start thinking about what impact means for your research project
Activity In your research team consider the following questions
1 What do you understand by impact
2 What does impact mean for your research
3 How does your organisation define or understand impact
4 What are the differences between each of these
5 Are these definitions written down or discussed
Notes
MODULE 2
IDENTIFYING YOUR IMPACT OBJECTIVE
9
lsquoImpact objectives revolve around getting your research known and used amongst those who can benefit most from itrsquo (ESRC 2017)
To have impact with your research you need to be clear about what sort of change you want to see and what lsquoimpactrsquo means for your research An impact objective is a statement of how you intend to do this and it is required by the Pathways to Impact statement and the impact summary in which you need to outline who will benefit from the research and how This will also help define a good research communications strategy to ensure messages from research reach those who can make a difference throughout the decision-making processes It will determine the types of evidence you will collect during the research and implementation of the communications strategy and in turn the monitoring of impact will inform the writing of the impact case study for REF 2021
To identify your impact objective it is important to situate your research within a broader policy context A good impact-oriented objective should be clear about why the changes you are proposing are important who they affect what needs to be done about it and where you stand in relation to others who are also trying to bring about change (adapted from ROMA Young et al 2014)
In this module we provide guidance on determining your impact objective considering what you can reasonably expect to be able to influence and how you may achieve such influence
Take-away messages
bull Developing an impact objective helps you be clear about the change you are aiming for and what lsquoimpactrsquo means for you This will guide your communications strategy and the evidence you need to collect
bull Most research is done in collaboration with others Building the capacity of others along the way may involve working in partnership or as part of a coalition
bull Having a good understanding of the wider policy context is necessary before you can formulate your impact objective
Figure 1 Sphere of influence
Outputsinputs
activities
Sphere ofCONTROL
Sphere ofINFLUENCE
Sphere ofCONCERN
Outcomeschanges inbehaviour
Impactand
context
Box 2 The importance of collaboration
Most research is done in collaboration with others and particularly in international development there is a desire to build your partnersrsquo capacity along the way This may involve working in partnership or as part of a coalition ndash particularly if you are working on a complex problem that involves a large number of actors
The process of working together will involve discussions about objectives aims and terminology These may highlight different values language and assumptions partners have
This process brings those involved together by developing a commitment to common values rather than tightly defined objectives This helps provide the flexibility to navigate the implementation path and observe impact as it arises particularly where it may differ from the type of impact originally expected The initial objective for the coalition therefore should be quite broad leaving room for each coalition partner to formulate sub-objectives that better reflect their particular goal and anticipated impact
Source Young et al (2014)
10
What you can reasonably expect to influence
The sphere of influence framework is useful to determine what is and what is not within our power to influence It originates from Outcome Mapping (OM) developed by Sarah Earl Fred Carden and Terry Smutylo from the International Development Research Centre (Earl et al 2001) OM is a way of planning international development work and measuring its results It is concerned with results ndash or lsquooutcomesrsquo ndash that fall strictly within the programmersquos sphere of influence The focus is on changes in behaviour relationships actions and activities of the people groups and organisations you work with directly (Young et al 2014)8
Inputs activities or outputs within the sphere of control are those where we have complete control over our actions The sphere of influence is where events are not completely in our control but where we do have the power to change the outcomes (Tsui et al 2014) On the other hand the sphere of concern focuses on events occurring over which we have no control They often represent actions taken by others or the results of a cascading set of external factors Although this is where the results that really matter lie (such as better education quality health care secure livelihoods) to have an influence in this sphere you have to work with others Results within the sphere of control and sphere of influence are those that you can measure and can use to guide your strategy and engagement plan (Young et al 2014)
Table 3 FINER criteria for a good research question
F Feasible bull Adequate number of subjects bull Adequate technical expertise
bull Affordable in time and money
bull Manageable in scope
I Interesting bull Getting the answer intrigues investigator peers and community
N Novel bull Confirms refutes or extends previous findings
E Ethical bull Amenable to a study that institutional review board will approve
R Relevant bull To progressing knowledge in your field bull To policy development
bull To future research
Source Adapted from Hulley et al (2007) cited in Farrugia et al (2010)
8 For more information visit the OM Learning Community wwwoutcomemappingca
Box 4 Grounding your impact objective in the context
A relevant impact objective should be appropriate to the wider policy context Therefore having a good understanding of the wider policy context is necessary before you can formulate your impact objective Understanding the context includes not just the nature of the problem but also the direction that current policy is taking (which may be no direction at all) or it may be that there are competing policy directions (eg from different political parties) that need to be considered
Box 3 The results chain
Research councils recognise that it is important to capture the outputs outcomes and impact of the research they fund to demonstrate the wider value of the research to the UK society and economy (RCUK 2014)
The lsquoresults chainrsquo refers to the order in which results arise starting with activities and inputs that produce outputs which in turn lead to outcomes Outcomes can be described as lsquointermediatersquo and either lsquofinalrsquo or lsquolonger termrsquo These interact with contextual features to produce impacts the figure below illustrates the order
Figure 2 The results chain
Activitiesinputs Outputs Outcomes Impacts
Source Young et al (2014)
11
TASK identify your impact objective
Time 20ndash40 minutes
Resources 1 x flip chart paper and pen per group
Purpose To develop a clear and concise impact objective
Activity In your research team answer these seven questions
1 What is your research question andor hypothesis
See Table 3 for guidance on developing a strong research question
2 What wider policy problem or issue does this feed into
For example if your research is on youth perceptions on agriculture in eastern Uganda the wider policy problem may be youth unemployment in the region
3 How can your research contribute to understanding or solving this problem or issue
What information or perspective will your research bring to light What influence do you expect this to have Will you engage or encourage participation from local stakeholders
4 Who will benefit from this research How will they benefit Rather than just listing stakeholders or making broad statements about how your research will lsquoprovide new insightsrsquo or lsquoincrease understandingrsquo the purpose of this exercise is to dig deeper How will new insights or greater understanding make a difference to peoplersquos lives Will the research achieve this by engaging with local stakeholders For example a greater understanding of how young people perceive agriculture in eastern Uganda may help policy-makers create policies that incentivise young people to access available jobs in agriculture ndash this will help young people build a sustainable livelihood and feed their families
5 What is your high-level impact objective
This is the ultimate impact objective you would like to see the research achieve This may take place beyond the end of the research and it may be outside your sphere of influence Critically think about this and how you may need to adjust it to reflect your responses to questions 1ndash4 It could be that you have more than one high-level impact objective
6 What are your impact objectives within your sphere of influence
Examples may be to build awareness of the research among a target audience secure the commitment of a target group of stakeholders to the research aims influence specific policies or policy-makers on key aspects or encourage participation among researchers or partner bodies (ESRC 2016)
7 What would you point to to indicate that change has happened and that your research has made a difference
What observable changes among these groups might you see Is it plausible that your research has contributed to these Think about this for your impact objectives both within your sphere of influence and for high-level impacts
Notes
MODULE 3
STAKEHOLDER MAPPING
13
Stakeholder mapping has various uses in developing effective Pathways to Impact and for putting in place an effective strategy for achieving impact It can be used to identify
bull research users to consult during the research planning stage to discuss the role they may play in planning the research such as co-investigators
bull opportunities for building strategic partnerships and strengthening relationships bull and actively engage relevant users of research and stakeholders at appropriate stages
Developing maps of how well the various stakeholders are aligned with the research and the degree of interest they have in the issue is a valuable exercise Building relationships and partnerships can greatly enhance the quality of research and can enhance impact as these stakeholders may influence change
An Alignment Interest and Influence Matrix (AIIM) can help ensure you consider the full range of stakeholders who may be influenced by your research in some way It is a simple stakeholder mapping tool with three dimensions the degree of interest in the research topic the degree of alignment with the thrust of the research and the degree of influence they have within the policy-making process
Stakeholder mapping is best done in a group so you can draw out discussions and perspectives around who may be interested in your work and who you need to reach to achieve your impact objective
14
Box 5 Alignment interest influence
Definitions
Alignment is the research likely to lead to policy the stakeholders broadly agree with Do they share the same sense of potential importance and agree with your approach
Interest are they interested in the issue your research is addressing Are they committing resources to the issue Do they want change Are they speaking about the issue
Influence how important are they to making change happen Are they in a position of authority Can they put pressure on a decision-maker
Groupings
Top right quadrant stakeholders in this quadrant are both interested in your issue and aligned with your approach These people are your collaborators and allies You may want to lsquowork in partnershiprsquo with this group Perhaps you could form a community of practice or set up meetings with key organisations or individuals to share ideas or coordinate activities
Top left quadrant stakeholders in this quadrant agree with your approach but they are not interested or prioritising the issue This could be for several reasons ndash they may not know much about the issue have limited capacity or have competing priorities If there are influential stakeholders in this group start to think about how you can develop their interest or capacity to get involved
Bottom right quadrant stakeholders in this quadrant are interested and perhaps active in your issue area but they donrsquot agree with your approach or position If you need to get stakeholders from this group on board yoursquoll need to challenge their current thinking and persuade them of your position Evidence usually works best for this group Working through champions who are aligned with your position can also be effective
Bottom left quadrant stakeholders in this quadrant do not know much about the project or if they do they are not very interested and probably do not agree with your views If they are not influential in your projectrsquos success you may prefer to ignore them as a group Ultimately you cannot do everything and may need to focus your energies on the actors in the other three quadrants It may also be hard to know who these actors are because they might not even be known to you If they are potentially influential you may need to just monitor them to ensure that they donrsquot move into another quadrant and start to cause your project harm
WORK IN PARTNERSHIP
CHALLENGE OR PERSUADE
IGNOREOR MONITOR
DEVELOP INTEREST OR CAPACITY
High alignment with approach
Low alignment with approach
High interest orengagement in issues
Low interest or engagement in issues
Source Young et al (2014)
15
TASK map your stakeholders
To get the most out of this activity it is best to do it as a group exercise either with your immediate team or with those working closely with you If possible have a good variety of people in the group including research communications and monitoring and evaluation staff or the implementation team The greater the range of people the more detailed your analysis will be If your group is larger than eight people it may be helpful to allocate someone the role of facilitator
Time 60 minutes
Resources 1 x flip chart paper marker pen up to 20 sticky notes per group
Purpose To identify
bull research users to consult during the research planning stage
bull opportunities for building strategic partnerships and strengthening relationships
bull relevant users of research and stakeholders
Activity 1 Place the flip chart paper on the wall or in the middle of the table and draw the matrix Write your policy objective at the top of the page
2 For your policy objective list all the stakeholders you can think of Write them down on the sticky notes (one per note) Be specific and refer to different individuals or teams rather than just saying the Ministry of Agriculture This is important as different teams may have different positioning
3 Select those stakeholders who have the highest or the lowest interest or alignment
4 Take turns to place the sticky notes on the matrix placing the notes for the four stakeholders that are at the most extreme points so most interestedmost aligned least interestedleast aligned most interestedleast aligned etc This allows an analysis of their relative rather than absolute levels and prevents all stakeholders being concentrated in the top right hand corner of the matrix
5 As you place the sticky notes explain to the group why you are placing the stakeholder in that position Discuss whether people agree or not Remember you can have more than one sticky note per organisation if an individual or team has a different degree of interest alignment or influence separate them out
6 Add dots to the sticky notes to show how influential the stakeholder is to the success of your research Add three dots if they have a lot of power or influence two dots for reasonable influence one dot for minimal influence and no dots for no influence This will help you prioritise your efforts and resources later on
7 Once all stakeholders are on the matrix start to look at the groupings Refer to Box 5 Alignment interest influence matrix ndash groupings Look at the individuals and groups that are most influential to you Are they where you want them to be on the matrix If not use the pens to draw arrows to where you would like them to move to
8 Now add a lsquotickrsquo to any sticky note you have already had contact with or have access to
9 Think about what strategies you may want to implement to respond to your findings
Notes
16
Box 6 AIIM in action
An AIIM analysis was conducted to support the objective of passing legislation that supports mothers to breastfeed for up to two years in Indonesia This highlighted which stakeholders could be most effectively worked with and those whose perspectives were conflicting ndash for example stakeholders supporting the supply of powdered milk instead of encouraging mothers to breastfeed Other stakeholders changed their position on the matrix at different stages of policy implementation For example parts of the government supported breastfeeding after the legislation was passed but were not active in supporting the legislation to be enacted at the district level
Figure 3 Example of an AIIM map in action
Source The regional pastoralist livelihoods advocacy project June 2008 London ODI
MODULE 4
DEVELOPING A THEORY OF CHANGE
18
Outlining a Pathway to Impact involves understanding how change can come about and this in turn will underpin the changes that are captured in the impact case study
Developing a theory of change (TOC) involves refining ideas of how the research projectrsquos work with stakeholders may lead to change Such change usually happens as stakeholders engage with the research subsequently take on board the key messages and finally internalise the issues to such an extent that they can effectively act on behalf of the researchers to spread the message themselves This means developing a TOC9 There are many different types of TOC In this module we provide guidance on one that reflects the underlying Outcome Mapping-based principles of our approach
There are three steps in developing a TOC
1 Analyse the current context what are the current ideas interest groups and processes How do these influence policy-making
2 For the key stakeholders examine the changes in behaviour you woulda expect to see to indicate initial engagement with the researchb like to see to indicate that the messages are being taken on boardc love to see to indicate that the messages have been deeply internalised
3 Identify what the research project and others will do and check assumptions about how these are related
Theories of change are not static it is worth revisiting them annually or more frequently if things are changing rapidly to assess whether plans need to be revised This is particularly important for long-term research projects when there may be changes in context or partners The same three steps would be followed asking has the context changed Have the roles of key stakeholders changed and what does this mean for the changes you would expect like and love to see Does this affect what the research project does or what others will need to do to bring about change
Change does not have to be positive Interesting lessons are often learnt from recognising negative changes or where there has not been any change Often the most interesting observations and lessons result from exploring why no change or negative outcomes may have arisen If in your Alignment Interest and Influence Matrix (AIIM) yoursquove identified that a stakeholder is very interested but not aligned with your approach you may expect a backlash from them or critical comments as they disagree with your approach This may be a good thing if yoursquove anticipated it and it happens and you have a plan to deal with it then it can be framed as an expected reaction and logged as an achievement The more political the issue you are working on the more likely you are to encounter this sort of reaction Box 8 considers orders of change in terms of the link between ideas and impact in a policy context
9 What is presented here is one version of what a theory of change may be See Vogel (2012) for a comprehensive review of theories of change wwwgovukgovernmentnewsdfid-research-review-of-the-use-of-theory-of-change-in-international-development
Take-away messages
bull Theories of change are not static it is worth revisiting them at least annually to assess whether plans need to be revised
bull Change is not always positive capturing instances of no change or negative change often provides valuable insights If you succeed in anticipating a backlash or criticism then you will be armed with a response
Box 7 What is a theory of change
A TOC helps researchers conceptualise what impacts they may have and how they may be sequenced and achieved given the wider context within which the project operates In Vogel (2012) Julian Barr from Itad defines a TOC as follows
A TOC is analogous to lsquoGoogle mapsmdashthis is the territory this is how we see our bit of the territory and this is the route that we think is best to take through it (though like Google Maps we recognise there may be a couple of different routes across the territory but we have explicitly chosen one) Based on our understanding of how the territory along the road works this is how we shall approach the journey and these are some of the landmarks we expect to see along the wayrsquo
19
Step 1 Analysing the current context
This first step is often overlooked but it helps develop a good baseline and thus a more accurate analysis of how change may happen and the impacts that may be possible The depth of analysis done at this stage may range from a full-blown political economy analysis to a more focused understanding of the relationship between research evidence and policy10
The key issues to consider are
1 Knowledge and information What knowledge is currently used in debates around the policy issue For example is it knowledge from formal research from past experience perhaps published in evaluations or else taken as lsquocommon knowledgersquo is it widely shared opinions or do ideas come largely from ideologies and beliefs Which of these types of knowledge dominates
2 Actors and stakeholders Whose voices are the strongest in debates Whose evidence is currently seen as credible and why What networks exist between different stakeholders Are there stakeholders whose voices are marginalised Who decides what knowledge counts who arbitrates between contrary facts and opinions
3 Knowledge intermediaries Are there actors who broker debates bringing new ideas into the discussions synthesising evolving understanding and communicating with stakeholders Are there other active brokers such as lobby groups civil society organisations or press and the media who actively participate in debates around the issue
For all of these three issues consider the processes through which impact can take place For instance how does knowledge circulate Is it written down is it oral Is it public or do critical debates and decisions take place in private networks behind closed doors Does the political context affect how knowledge of your issue flows around debates11
The point is to look for any major aspects of the current context that may affect how change happens particularly the sorts of changes you may want to see as a result of your research This analysis will also help you identify and capture unanticipated changes if they arise
10 See DFIDrsquos how-to note wwwgsdrcorgdocsopenPO58pdf
11 This does not necessarily mean party political issues (though could include them) it means issues where the balance of power between stakeholders is an important consideration in how they act and how they relate to each other
Box 8 How policy change happens
Orders of change were originally described by Hall (1993) to discuss the process of social learning He explores the link between ideas and impact in terms of policy-making This is most useful at the planning phase to understand how deep and transformational the impact is that you are anticipating Hall separates policy change into three levels
bull First order change focuses on incremental changes An example would be to increase the minimum labour wage in response to protests
bull Second order change occurs when policy instruments are completely altered Following on with the above example the government would use a living wage instead of a minimum wage as a form of a social safety net
bull Third order change takes place when a new hierarchy of policy-making goals is created Hall calls this a lsquoparadigm shiftrsquo For example the minimum wage and the living wage policy would no longer be a priority as other goals would be a higher priority such as taking account of non-economic social contributions in assigning benefits
It is important to remember that first and second order policy changes occur in normal policy-making First and second orders of change often may not lead to the third order of policy change
However it may be that people are so resistant to change that a lsquolove to seersquo change may only be what Hall refers to as a first order change Depending on the policy context it may be sufficiently ambitious to aim for a first order change
Sources Adapted from Tsui et al (2014) and Hall (1993)
20
Step 2 Developing theories of change
We are encouraging an approach to developing theories of change based on the principles of OM (Earl et al 2001) This looks at changes in peoplersquos actions and behaviours not changes in the things that are produced It distinguishes between three different levels of change
1 Changes we would expect to see the early positive responses to your work (such as attending meetings convened by the research programme giving feedback on a publication)
2 Changes we would like to see active engagement with what you are doing (such as inviting you to attend one of their meetings asking for information on research-related issues)
3 Changes we would love to see deeper transformations in behaviour that indicate that your messages have been completely internalised (such as co-opting a collaborator onto a standing committee incorporating one or more messages from your research into a strategy document or taking a decision about resource allocation)
The lines between the different changes are blurred and it is a matter of judgement as to which change falls into which category
Figure 4 represents an example of how a research project may have outlined the expect like and love to see for one of their key stakeholders the UK Department for International Development (DFID)12
Table 4 Progress markers
Expect to see We would expect to see that the Drivers of Change conceptual framework is published in a DFID how-to note as it responds to DFIDrsquos need to identify lsquothe long term structural and institutional factors which enable or constrain reform in different countriesrsquo and lsquoto improve policy-making and programming by identifying short- and medium-term opportunities to support strategic changersquo
Like to see We would like to see the framework captured in DFIDrsquos guidance notes such that DFIDrsquos approach changes from one of providing lsquoassistance to promote particular agendas around governance growth or service deliveryrsquo to consider how to provide support taking political feasibility into account
Love to see We would love to see the framework informing DFIDrsquos white papers to allow DFID to influence others eg through membership of the OECD Development Assistance Committee
Theories of change can be presented in table form as below in Table 5 It is helpful to separate out your general statement of what the changes will look like (lsquoDepartment X begins to actively seek out emerging research resultsrsquo) from more specific indicators (lsquolocal collaborator is invited onto the standing committee for issue Xrsquo) which can be tracked Working into the specific indicators of change and ensuring their sequence is logical can be a helpful way of checking the overarching logic of the TOC
12 This comes from the REF case study on Thinking and Working Politically from the University of York available at httpimpactrefacukCaseStudiesCaseStudyaspxId=43466
Figure 4 Using Outcome Mapping to develop a theory of change
Given our understanding of the current context these are the behaviours we wouldhellip
hellipexpect to see
Early positive responsesto the research
Active engagement with the research results
Deep transformation in behaviour
helliplike to see
helliploveto see
21
It is important not to assume that all behaviours in the same category must happen at the same time across the different TOCs Change in social processes is decidedly non-linear people may block change for reasons that arenrsquot immediately clear or they may suddenly get the point as a result of several things happening simultaneously most of which are outside your control Developing different TOCs for different stakeholders helps you unpick the assumptions about how change happens Research Councils UK (RCUK) note how impact can occur at any stage of the research and often as a result of unexpected actions (RCUK 2014) Therefore continual monitoring and updating of your TOC can help capture such surprises when they arise
Table 5 An initial theory of change
General statement of change Which stakeholders are involved Specific indicators
Current context
Expect to see early positive response
Like to see active engagement
Love to see deep transformation in behaviour
Step 3 Identifying the research projects role and checking assumptions
The final step looks at the contributions to change made by the research and by others This adds on two columns The first sets out what the research will contribute the second looks at what we are assuming about how others will contribute
Table 6 A final theory of change
General statement of change
Which stakeholders are involved
Specific indicators
What will the research contribute
What will others contribute
Current context
Expect to see early positive response
Like to see active engagement
Love to see deep transformation in behaviour
Having gone through these three steps it should now be possible to revise the research projectrsquos impact pathway refining your understanding of the different types of impact your research can have being clear about the limits of your research what needs to be achieved through others developing some concrete indicators of impact including for the longer-term impacts of your research
The Climate Development Knowledge Network (CDKN) has used progress markers to develop its monitoring and learning framework based on changes in behaviour in local communities One of CDKNs main goals has been to influence countries in their climate change negotiations Table 7 shows the progress markers it developed as an example
22
Table 7 Example progress markers
Outcome challenge the programme intends to see local communities recognise the importance of and engage in the planning of resource management activities in partnership with other resource users in their region These communities have gained the trust of the other members of the partnership and the recognition of government officials so they can contribute constructively to debate and decision-making processes
They are able to clearly plan and articulate a vision of their forest management activities and goals that is relevant to their context and needs They call upon external technical support and expertise as appropriate They act as champions for model forest concepts in their communities and motivate others in the partnership to continue their collaborative work
Expect to see local communities
1 Participating in regular model forest partnership meetings
2 Establishing a structure for cooperation in the partnership that ensures that all local interests are represented (mechanics of setting up the structure)
3 Acquiring new skills for involvement in the model forest
4 Contributing the minimum human and financial resources necessary to get the model forest operational
Like to see local communities
5 Articulating a vision for the model forest that is locally relevant
6 Promoting the model forest concept and their experiences with model forests
7 Expanding the partnership to include all the main forest users
8 Calling upon external experts when necessary to provide information or meet technical needs
9 Requesting new opportunities for collaboration with other institutions and actors
10 Identifying opportunities for collaboration with other institutions and actors
11 Identifying opportunities for and successfully obtaining funding from a range of sources
Love to see local communities
12 Playing a lead role in resource management with a view to medium- and long-term benefits
13 Sharing lessons and experiences with other communities nationally and internationally to encourage other model forests
Source Hamza-Goodacre et al (2013)
MODULE 5
COMMUNICATING YOUR RESEARCH
24
Your research will only have real world impact if it reaches the right people Therefore when planning your communications itrsquos important to think beyond one-directional lsquodisseminationrsquo of research findings Communications is much broader itrsquos about engagement and knowledge exchange Research Councils UK (RCUK) defines it as a lsquomulti-way exchange of knowledge between academia and research users in business public and third sectorsrsquo (RCUK 2014)
When we talk about lsquocommunicationsrsquo we use the word in the broadest sense Communication can take many forms ndash formal and informal This includes digital engagement social media publications field visits public events emails or private meetings This takes investment lsquogrowing effective knowledge exchange with non-academic communities takes time skills confidence and moneyrsquo (ESRC 2017)
The key to any communications activity seeking to engage someone with your work is to know who you want to reach know what you want to do and work out how you want to reach them ndash this means thinking about the channels and tools you will use and to what messages they will relate
It is often assumed that communications are done at the end of a research project In fact knowledge exchange and engagement play an important role throughout the project and research lifetime Engaging audiences early in the research process can help ensure relationships have crystallised by the time you come to actually communicate your findings It also gives you more time to plan adapt and above all understand your audiences
This module covers
1 Knowing your audience2 Crafting effective messages3 Planning your outputs and activities4 Presenting your research
Step 1 Knowing your audience
The audience is (or should be) at the heart of any communication Before you can begin communicating your research you need to be clear about your aims who do you want to reach and what do you want them to do with the information Effective communication material needs to be carefully tailored and adapted for different audiences
It is helpful at this point to look back at your impact objective and reflect on the following
1 Is there a problem you are working to address2 Are you offering a solution (or several solutions)3 Are you providing new information to support others to find solutions4 What do you want your communications to achieve5 Who do you need to engage with to achieve your goal
Take-away messages
bull Think lsquoengagementrsquo not dissemination We talk a lot about research lsquodisseminationrsquo but this is one-directional and communication is much broader itrsquos about engagement and knowledge exchange
bull Donrsquot leave it to the end Communications is often left to the end of the research process but it plays a critical role throughout the projectrsquos lifetime
25
TASK identify your audiences
You will have already identified your key stakeholders and courses of action for each as part of Modules 3 and 4 of this toolkit This exercise allows you to identify your specific audiences for communications and engagement activities Remember that your audiences and communications objectives may change throughout the lifetime of your research For example at the beginning your communications may be about building partnerships and later on it may be about influencing action It is helpful to have a facilitator for this exercise
Time 60 minutes
Resources 1 x flip chart paper marker pen up to 20 sticky notes per group
Purpose To develop a clear and concise impact objective
Activity 1 Write your impact objective on a large piece of flip chart paper so everyone can see it
2 Put four sheets of flip chart paper on the wall Label the first lsquoAudiencersquo the second lsquoObjectiversquo the third lsquoMessagersquo and the fourth lsquoWhenrsquo and distribute sticky notes to participants
3 Invite participants to write a key audience on a sticky note contributing up to three each Be as specific as possible (ie rather than writing lsquopolicy-makersrsquo write lsquothe Minister of Educationrsquo)
4 Invite participants to place their sticky notes one by one on the first flip chart paper
5 Invite one or two participants to cluster the notes into groups and explain why they have chosen that particular grouping (You may also want to refer to your stakeholder maps)
6 Get into groups of three or four people and think about why you want to engage with that audience Is it to bring them on board as a partner Is it because you want them to share your research with others Or is it because you want to influence their actions with your research
7 Invite one participant from each group to add the objectives to the second flip chart paper so that they are aligned with the respective audience groups This may lead to some discussion try to reach a consensus
8 In those same groups think about what kind of information the different audiences will most likely be interested in or need Write them down on sticky notes
9 Invite each group to add their ideas to the third flip chart paper for each audience group Again this may lead to some discussion and debate among the groups try to reach a consensus
10 In the same groups think about when you will want to engage with that audience This will link to the objective for example if your objective is to build a partnership you may want to do that early in the research process You may find that you need to engage with some audiences throughout the research
Notes
26
Step 2 Crafting effective messages
Identify your key message
A strong message should be at the core of any good report presentation or other piece of communication Research frequently focuses on facts and data but it is important to explore ways to tell a story through your messaging as well Audiences from academics to decision-makers are far more likely to want to interact with new information if they can relate to it in some way
Key messages are lsquojust the tip of the icebergrsquo (Young and Quinn 2012) They are what your audience most needs to know and are supported by the main information (the rest of the iceberg) as needed If you give readers all the information in one go they are unlikely to absorb it
When planning your key messages think about your audience Who are they What sort of message do you need to communicate to them and why Thinking through several questions can help you shape the message then the channel for best conveying it
1 Who are the audience What role do they play Are they specialists in the topic or are they non-technical Are they people who you already know
2 What do they need to know What are they currently working on How can they use your information Did they ask for the information If so are you delivering what they wanted Do they need to know more
3 How do they best receive information Do you know how they tend to prefer to receive communications What has worked well in the past (and what has not) Is it better to approach them for a meeting or to send a report
Make your message stick
There are multiple ways to develop strong messages One great example is from Heath and Heath (2007) They talk about six dimensions to a good message which can be applied to all types of messaging including evidence into policy They are
Simple The best messages are always simple This does not mean dumbed down Rather you are pulling out the key message your audience needs to know Keep it concise and donrsquot over-elaborate
Unexpected If you can make people sit up and listen yoursquore more likely to have impact Counter-intuitive messages a surprising fact or a different angle can be one way to do this
Concrete Donrsquot be too abstract Make your message tangible relating to real life examples where possible For example rather than saying 25 say one in four people
Credible Your message can be clear concise and well-constructed but if it isnrsquot credible the audience is unlikely to listen Is your message backed up by evidence Is it believable
Emotional We know emotions provoke reaction Is there a way to explore emotions with your audience make them connect or care about the human story behind your research
Stories We use storytelling all the time for effective communications Can your message tell a story rather than just hard facts Whatrsquos the impact of the evidence
Next time you read a blog you find interesting or inspiring a good exercise can be to spend some time looking at how much the author uses the above dimensions when they try to convey their key messages
27
Step 3 Planning your outputs and activities
Every research project needs to think about outputs and activities While research may be published in an academic journal if you want to have an impact beyond academia you will need to think how to achieve this and explore other communication channels
Remember that effective engagement is more than one-way communication As the Engineering and Physical Sciences Research Council (EPSRC) writes lsquodone well public engagement can build trust and understanding between the research community and a wide range of groups from policy-makers through to young peoplersquo (EPSRC nd) Engaging stakeholders with your research can improve the quality of your research outputs and the impact raise your profile and develop your skills Communication activities therefore are some of the most important actions you can take to increase the impact of your research
The outputs channels and activities you use will depend on what impact you want to have who your audience is and what resources you have If you have communications support involve them in the research planning stage to help identify early on what outputs are likely to have the most impact and to make sure you have the resources to do it
Box 9 A spectrum of knowledge communication activities
This is a helpful framework to reflect on the different types of knowledge roles you can play This may change throughout your research lifetime depending on what yoursquore trying to achieve and your resources If you are clear about what your role is and what you can achieve you can then see where your limits are and where others can help
Source Shaxon L (2016)
INFORMATIONINTERMEDIARY
KNOWLEDGETRANSLATOR
KNOWLEDGEBROKER
INNOVATIONBROKER
Making information available putting research results into the public domain
Linear disseminationof knowledge from producer to user
Co-production of knowledgesocial learning and innovation
Translating research evidence for non-specialist audiences giving seminars writing policy briefs
Actively engaging in policy and practice debates taking part inmeetings matchmaking convening networking
Inuencing the wider context to reduce transaction costs and enable innovation build local capacity change incentive structures to use research
Take-away messages
bull Create packages not publications Your impact will be limited if you just produce one product you need to tailor outputs and activities for different audiences
bull Be strategically opportunistic Identify policy windows and plan your research timetable to make the most of these opportunities However unexpected or unplanned opportunities will also emerge and you need to be ready to respond
bull Donrsquot forget the messenger Sometimes you may not be the appropriate messenger For example you may not have the right profile access or skills You may need to partner up with other organisations or individuals
28
Traditionally we have always identified four key channels for communicating research ndash publications events digital and media However today the lines between these channels are very blurred as digital communications becomes increasingly central to strategies
Table 8 Example outputs channels and activities
Types of output Why use it
Written formats
Journal article It presents your full research methodology and analysis It is likely to be read by other academics or students so the language can be technical (although should always be as clear as possible)
Research report It presents your full research and evidence It is likely to have a broader audience than just other academics so it needs to provide a comprehensive and accessible overview of your research
Brief Short sharp targeted briefs can help communicate key recommendations to policy audiences
Toolkit It presents practical tools insights or experiences in a way that can be easily used or applied by other people
Blogs and op-eds They can be used to provide an accessible and engaging lsquoway inrsquo to bigger pieces of research or learning as well as reaching broader or targeted audiences
Media release Designed to communicate key information to regional national and international media outlets it may be picked up by online and print media publications Media is especially useful for reaching influential people and policy-makers as well as the general public (depending on what media outlet picks up your work)
Digital tools
Website It can provide a central platform to host resources and make your work publicly available By hosting everything in one place you can track downloads or page views and find out who is interacting with your work
Data visualisation It is used to present data visually making it easier to understand or compare to tell compelling stories or to draw attention to key messages and statistics
Online networks Tapping into existing or established online networks of people interested in research yoursquore working on is a good way to reach wider but targeted audience groups Newsletters can target a mass audience It may be far more effective to ensure your research appears in other newsletters for example a university newsletter
Email Often overlooked email plays a critical communications role A personal email from a researcher to a contact can be one of the most effective ways to share research
Events and meetings
Public events They are one of the most common ways to showcase research on a public platform They can be part of a conference a public panel or keynote event Events may be streamed online or available for users afterwards through a video or podcast
Policy dialogues They convene a range of policy stakeholders from different interest groups and with different perspectives to focus on a policy issue
Workshops They can be a good method to engage directly with key stakeholders and encourage small-group discussions
Bi-lateral meetings Meetings are one of the most common ways to engage people early on with your project and to showcase results to several key stakeholders particularly decision-makers and donors
Webinars Webinars can be a way to present new research online to audiences in different countries and particularly can encourage new learning andor guidance for users
Multimedia
Social media It allows you to reach larger networks of people who may be interested in reading or using your research This could be on Twitter LinkedIn and Facebook as well as WhatsApp and SnapChat
Multimedia This media may be better for reaching some audiences such as young people or policy-makers It can include videos podcasts and animation but also photography
Radio TV broadcast Radio and TV have enormous potential to communicate to a wide audience For example in some developing and emerging countries community radio can be a critical way to reach key audiences
29
TASK map your communications activities
This exercise builds on TASK 1 lsquoIdentify your audiencersquo In this task you will start to identify the outputs channels and activities you need to reach your priority audiences You can then determine who will do what and whether you have sufficient resources to deliver your strategy It is useful to note any capacity shortfalls you may be facing and possible interim strategies to address these Activities often take longer than you think particularly those requiring working with external actors such as developing partnerships
If you have communications teams or support it is important to include them in mapping your activities It is also important to include leadership of senior staff to draw on their experience RCUK notes lsquocommitment to include principal and senior investigator time on knowledge exchange and impact activities recognising that collaboration with users often requires a depth of experience and level of understanding of the kind held by established researchers and which complements the skills of research associatesrsquo (RCUK nd)
Time 30-40 minutes
Resources 2 x flip chart paper marker pens and sticky notes
Purpose To develop communication strategies for each audience group
Activity 1 Look back at the flip chart papers from the previous task Re-familiarise yourself with your audiences why you want to engage with them and why
2 Add a fifth flip chart to the wall titled lsquoCommunications activitiesrsquo
3 In the same groups identify what communications outputs and channels may be best to reach the different audience groups (eg a report a policy brief the media an event a face-to-face meeting email) Write these on sticky notes
4 Invite participants to add their sticky notes to the flip chart paper
5 Next think about your resources (time expertise and budget) Which of these activities are a lsquomustrsquo Which are a lsquonice to haversquo Do you have the time expertise and budget to deliver these activities
6 Take a new flip chart paper and turn it landscape Draw out the example table below (Table 9) and start filling it in
Notes
30
Table 9 Mapping activities example
Outputactivity List all planned communications outputs and activities
1 Workshop 2 Journal article 3 Policy brief
Audience Who do you want to engage with this output or activity
Ministry X Academics in X field Minister of X
Objective Why are you producing this output or carrying out the activity Relate this to your audience
To establish a relationship with the ministry to get a better understanding of the policy context for the research and to identify the ministryrsquos policy needs to inform our research question
To inform other academics working in this research area to support their work and share learning
To inform the minister of our research results ahead of its annual budget setting
Staff time required How much ndash and whose ndash staff time is realistically needed to deliver this work
15 days for lead researcher to plan facilitate and write up workshop
30 days for lead researcher to write and coordinate peer review
5 days for internal review
5 days lead researcher to write
3 days for communications support
Additional budget required What direct costs are involved Flights accommodation sustenance
Venue catering
Copy-edit
Peer review
Copy-edit
Design
Proof-reading
Deadline By when does this output or activity need to be delivered (to meet the objective and to meet your funding requirements)
End of scoping phase (day month year)
End of research phase one (day month year)
End of research phase two (day month year)
Priorityresources Is this a must have or a nice to have Again think back to your overall impact objective
Step 4 Presenting your research
Presentations
At some point during your research you are likely to need to present it ndash either formally or informally This section examines some of the ways in which you can improve your presentation skills and effectively share your key messages
Tips for presenting well
bull Be clear about the purpose and audience for the presentation This will help you focus on the information you most need to prioritise your key messages
bull Structure your presentation Can you identify one overarching message and three key points to share The beginning should capture your audience ndash quotes or surprising facts can work well Then introduce the outline of your presentation To close highlight your key points and any recommendations or next steps
bull Plan your presentation and practice Even the most experienced presenters practise practise and practise bull Make sure it is clear and accessible lsquoIf you canrsquot explain it simply you donrsquot understandrsquo ndash so goes the quote by Einstein
Try practising what you want to say with someone who does not know very much about the topic (a relative friend spouse or colleague) and get them to give you honest feedback
bull Stick to your time limit Find out how long you will have to speak and prepare for less time than this as it is normal to overrun Also try to keep presentations short or break it up with time for questions Donrsquot just speak non-stop at the audience ndash they will switch off
bull Find your passion Stakeholders are more likely to listen to you if you sound confident but above all interested in what you are saying
31
What not to do (common mistakes)
bull Donrsquot use your slides as a crutch Slides are there to enhance your presentation not duplicate it People canrsquot listen and read at the same time If you need to make notes donrsquot read your slides
bull Donrsquot overload your slides Avoid putting too much information on one slide Break up text with images videos or quotes Lots of studies show people respond better to visual stimuli than text (Gallo 2014) Be careful with graphs and data they can be helpful but can be difficult to read (see tips on data visualisation) Short videos can also be a good way to break up the presentation
bull Donrsquot use PowerPoint until you have a structure It pays off to spend time identifying your key messages and structuring your presentation Donrsquot start making your PowerPoint presentation until yoursquove got a proper structure in place
bull Do not assume PowerPoint is the only format There may be other formats that are more appropriate for the presenting your context and getting your message across For example Prezi is a visual tool that allows a different structure
Briefs
Briefs donrsquot replace reports as you still need to be able to provide the detailed evidence Instead briefs are a useful tool to reach specific audiences particularly when they may not have time to read the full report or just need key information They help present your findings and recommendations in a way that is digestible
The policy brief is a common form of brief used to target policy-makers It typically has four functions to explainconvey the urgency of an issue to present policy recommendations or implications on the issue to provide evidence to support the reasoning behind the brief and to point the reader to additional resources on the issue
Here are four main steps to help plan a policy brief
1 Identify the purpose and overarching message of the brief2 Determine three recommendationsimplications if relevant3 Construct a logical line of argument for making these recommendations (your results or conclusions) When you are thinking
about your line of argument you can ask what is the problem and how does my research fit into this Why is it urgenttimelyimportant Why should the target audience know more
4 Based on an understanding of the context around the issue identify one or two entry points or hooks for the message These are commonly used at the beginning of reports summaries or briefs to entice the reader into continuing to read
Data visualisation and infographics
Data visualisation the graphic representation of data or knowledge can add value to your research by (ODI internal infographic guidelines)
1 Making data or information easier to understand or compare2 Telling complex stories in a condensed and compelling way3 Drawing attention to key audiences4 Engaging a wider audience
Data visualisations showcase data or information in visual form so there are a wide variety of options that fall under this category At the simplest level a data visualisation could be a graph or chart a timeline a map or an illustration
Box 10 Pecha Kucha
Pecha Kucha means lsquochit chatrsquo in Japanese Itrsquos a presentation technique developed by two Japanese architects who felt that architects had a hard time lsquogetting to the pointrsquo Pecha Kucha presentations are 20 slides 20 seconds per slide 6 minutes 40 seconds in total
The 2020 format gives you a structure to plan your presentation You have only 20 seconds per slide before it automatically moves to the next one so it forces you to really identify the most important thing you want to say It does however take some practice and discipline Pecha Kucha presentations work best when the slides are just images with limited or no text
Watch Pecha Kucha presentations httpwwwpechakuchaorgwatch
32
Figure 5 Types of data visualisation
ODI Infographic guidelines 2
Introduction
TyTT pes of data visualisationData visualisation at ODI
Data visualisation is the graphic representationof information data or knowledge This can add value to ODIrsquos research by
bull making datainformation easierto compare and understand
bull telling complex stories in a condensed and compelling way
bull drawing attention to key messages
bull engaging a wider audience
The type of data visualisation depends on the content you are working with the desired outcomes and the target audience
This guide is for anyone involved in the process of creating or commissioninginfographics ODI infographics mustbe accurate consistent and effective
Charts and graphsCriteria data setGood for visualising and simplifying data highlighting trends andmaking comparisons
IllustrationCriteria concept idea or processGood for visualising and simplifying qualitative information
Map basedCriteria datainformation linkedto multiple locationsGood for showing geographical trendsdistribution
InfographicCriteria data set with a clear messageGood for highlighting a surprising piece of data a key message or visualising a research finding
Narrative infographicCriteria datainformation that tells a self-contained storyGood for summarising a piece ofresearch a concept or process succinctly
TimelineCriteria series of events or dataat regular time periodsGood for showing changes over time
A B
C
Source ODI infographics guidelines
Box 11 Quick tips for producing data visualisations
1 Know your audience purpose and the message2 Allow adequate time and budget3 Double check the data its interpretation and sources4 Keep it simple
If you donrsquot have in-house expertise or budget to commission something here are a few tools you could try
bull Picktochart ndash a tool to develop charts and infographics (wwwpiktochartcom) bull Google Fusion tables ndash a tool to turn data into charts or maps bull Datawrapper ndash helps you create maps and charts (wwwdatawrapperde) bull Tiki-toki ndash helps you develop timelines (wwwtiki-tokicom) bull Ttdatavis ndash resources and tools for data visualisation creation (wwwttdatavisonthinktanksorgdata-visualisation-resources)
According the UK Office for National Statistics an infographic is lsquoa self-contained visual story presenting information data or knowledge with clear meaning and context and without biasrsquo (Office for National Statistics nd) Infographics use visuals to tell a story or relay a key message
The type of data visualisation you use depends on the content yoursquore working with and the desired impact and target audience
MODULE 6
MONITORING AND LEARNING
34
There has been discussion lsquoabout the link between underpinning research and impact and the need to articulate this link in the impact case studiesrsquo as the links between research and impact were sometimes lsquotenuousrsquo (Manville et al 2015) Putting in place simple monitoring mechanisms early on can help pin down these links even over the longer term Also ensuring there is evidence to underpin the narrative in case studies is critical as lsquothe risk of relying on narratives to assess impact is that they often lack the evidence required to judge whether the research and impact are linked appropriatelyrsquo (Penfield et al 2014)
Monitoring and learning (MampL) was therefore designed to respond to these demands MampL covers
1 Monitoring to provide the evidence to demonstrate impact2 Learning to improve what you are doing and3 Accountability to prove to different stakeholders what you
are doing is valuable
Putting simple systems in place helps you prepare for unanticipated opportunities a plan allows you to emphasise reflection and aims to identify and respond to unanticipated opportunities that arise during the research You can include space and funding for events if necessary for reflection for the research team as a group or as individuals during the research with research users if helpful
An MampL framework helps you outline the planning and management of associated activities including timing personnel skills budget deliverables and feasibility and it describes the system for doing this It outlines (1) what is to be monitored (2) how the monitoring will be conducted (3) who is responsible for what (4) when will the monitoring take place (ongoing andor at key intervals) and (5) the resources required
This module outlines
1 Six levels of monitoring2 Gathering and generating evidence3 A task to develop an MampL framework4 Methods for capturing impact
Six levels of monitoring
Six levels of monitoring are strategy and direction management outputs uptake outcomes and impact and context ndash see Box 12 (Pasanen and Shaxson 2016) It may be that not each of these needs equal emphasis for example it may be that management systems could be lighter but there may be more emphasis on outputs such as journal articles The six levels offer guidance on developing indicators and specific monitoring tools that can be considered at each level and provide a useful check to ensure nothing has been overlooked
Gathering and generating evidence
As well as gathering evidence as it arises (this is much easier than trying to find it much later when for example people may have changed positions) it may be necessary to generate evidence We talk about each of these here
Take-away messages
bull Thinking about what information is required and for what purpose who will use the information and how often where it can be found will help determine resource needs for collecting data and what gaps exist
bull It may be necessary to gather and generate evidence
Box 12 Six levels for monitoring strategy and management
1 Strategy and direction the basic plan the research projectprogrammeorganisation is following in order to reach its intended goals
2 Management the systems and processes the projectprogrammeorganisation has in place to ensure the overall strategy is carried out and high-quality policy research is produced (eg systems of peeruser review quality assurance planning cycles etc)
3 Outputs the tangible goods and services a research projectprogrammeorganisation produces (eg working papers journal articles policy briefs website meetings events networks etc)
4 Uptake direct responses to the research projectprogrammeorganisation (eg its research is mentioned in a government policy paper on a range of websites referred to in a newspaper article etc)
5 Outcomes and impact changes in behaviour knowledge policies capacities andor practices that the research has contributed to directly or indirectly (eg a change in government policy implementation improved businesses etc)
6 Context changes in the political economic and organisational climate that have an impact on plans These are exogenous and cannot be expected to be influenced by the project or organisation however they will have an important impact on how things work and what is possible
Source Pasanen and Shaxson (2016)
35
Gathering evidence
You have identified the areas where you need to collect data by developing your progress markers and associated indicators from Module 4 Starting with these ensures the information gathered will be directly applicable to monitoring performance A good performance question for each level of the objective hierarchy outlines the questions you would need to answer to know the extent to which you are achieving the objective and to explain the success or failure of actual results
In response to these decide what information is required who will use the information where it can be found and how often You can then identify data sources for your indicators Some may be collected at regular intervals such as at the end of a research phase through a six-monthly download or through citation figures others may be collected on an ad hoc basis through a feedback log (Box 13) Then determine who is responsible for collecting these data and how they will report (where to whom and for impact learning or accountability purposes) Alongside this note any areas where you need more resources or inputs
Generating evidence
It may be necessary to purposefully produce evidence for example by conducting a survey or requesting testimonies Survey Monkey or SurveyGismo could be used to conduct an online survey although be prepared for response rates as low as 10 Following up with contacts to request testimonies is likely to elicit a higher response although the content will be specific to the involvement of the respondent It is worth investing time in carefully considering the questions you ask to ensure the replies provide useful evidence to support the demonstration of impact Asking a question that will provide specific feedback on the anticipated future impact could be particularly useful When seeking testimonies open questions are most useful It may be that an initial contact by the researcher that is directly followed up by support staff would elicit a fuller response
Box 13 A feedback log
A feedback log is a simple way to systematically record reports of the impact you are having You can then analyse the records to understand the nature of the work you are doing and how others perceive it The log is simple it is easy for others to contribute to requires minimum effort to maintain and can be easily used to demonstrate the work you do
The type of information you collect can cover a range of outreach activities or it can focus on particular areas To record impact you can simply forward emails to the log The unstructured nature of this approach makes it very easy to submit evidence of the uptake of research outputs and feedback from audiences but it does require a little effort to maintain for example to compile into an Excel spreadsheet or table and to systematically use the data in reports
36
TASK develop a MampE framework
Complete the table below by indicating the priority purposes of the monitoring and describing where and when information is needed and who needs to be involved
Short description of the policy-influencing goal and outline strategy
Purpose of the monitoring Priority What information is needed Who will use the information When is the information needed
Being financially accountable
Improving researchproject operation
Adjusting strategy
Strengthening capacity
Understanding the context
Deepening understanding
Building and sustaining trustpartnerships
Lobbying and advocacy
Determine which if any data are necessary to provide a picture at the start of the research Identifying these baseline data will make it easier to demonstrate the impact of the research on any improvements
It is useful to circulate and obtain comments on your framework from stakeholders and those who will be involved in data collection This will help identify any gaps or challenges that might arise during implementation
Methods for capturing impact
A possible low-intensity approach may use a combination of the following (1) monitoring planned impacts against indicators in the logframe at the end of the MampE phase (2) if available using a Social Network Map to review the number of relationships that have been strengthened over the past MampE phase and hence the current scope of your possible impact and (3) extracting examples of actual impact from your feedback logs
A possible high-intensity approach may involve collecting stories related to the research at the end of the MampE phase and going through a systematic selection process to arrive at the stories that most appropriately capture the kinds of impact for which you are aiming
Writing impact case studies
Simple clear and linear narratives scored highly in REF 2014 For example when they (1) identified a problem (2) outlined the research conducted and (3) described how the problem was alleviated (University of Cambridge nd) Impact stories are a great way to tell clear narratives This involves taking information you have gathered and generated and using it to tell a story about your impact These are sometimes called Stories of Change and the guidance has been adapted to REF impact requirements
37
Your impact case study can be structured as follows
4
A summary containing key data and outlining the impact
The problem and the context before your research started
The research conducted
Describe the nature of the research methodology and key findings
Summarise any underpinning research
Highlight collaborative work
Show you meet the qualifying criteria including publication timing and researcher location For collaborative research describe your specific contribution
1
2
3
a
b
c
d
a
b
c
d
e
4 Impact
Structure by beneficiary or impact type and explain how the beneficiaries were engaged in the research
Report systematically against your progress markers also highlighting unintended impacts
Include evidence such as quotes from interviewees and references
Report both quantitative and qualitative evidence
Clarify the contribution of the research to the impact and describe other influences upon the impact observed
38
REFERENCES AND FURTHER READINGAdemokun A Dennis A Hayter E Richards C Runceanu L-E Suliman S Kovacs M Liebnitzky J and
Cassidy C (2016) Evidence-informed policy-making toolkit Oxford INASP Available at httpswwwodiorgpublications10444-evidence-informed-policy-making-toolkit
British Academy (2016) Lord Sternrsquos review of the Research Excellence Framework A response from the British Academy London British Academy Available at httpwwwbritacacuksitesdefaultfilesBritish20Academy20Full2020Response20Lord20Stern27s20Review20of20REFpdf
Cassidy C and Ball L (2018) Communications monitoring evaluation and learning toolkit London Overseas Development Institute Available at httpswwwodiorgpublications11040-communications-monitoring-evaluation-and-learning-toolkit
DEGRP ndash DFID-ESRC Growth Research Programme (2017) lsquoProject Guidelinesrsquo London DFID- ESRC (httpdegrpsquarespacecomimpact)Du Toit A (2012) lsquoMaking Sense of Evidence Notes on the Discursive Politics of Research and Pro-Poor Policy Makingrsquo Cape Town
Institute for Poverty Land and Agrarian Studies University of the Western Cape Available at httpwwwplaasorgzasitesdefaultfilespublications-pdfPLAAS_WorkingPaper21dutoit_0pdf
Earl S Carden F and Smutylo T (2001) Outcome Mapping Ottawa International Development Research Centre Available at httpswwwidrccaenbookoutcome-mapping-building-learning-and-reflection-development-programs EPSRC (nd) lsquoPathways to Impactrsquo Engineering and Physical Sciences Research Council (httpswwwepsrcacukfunding
applicationprocesspreparingwritingresourcesimpact)ESRC (2017) lsquoDeveloping a communications and impact strategyrsquo Swindon Economic and Social Research Council (httpwwwesrcacuk
researchimpact-toolkitdeveloping-a-communications-and-impact-strategy)ESRC (2017) lsquoDeveloping Pathways to Impactrsquo Swindon Economic and Social Research Council (httpwwwesrcacukresearch
impact-toolkitdeveloping-pathways-to-impact)Farrugia P Petrisor B Farrokhyar F and Bhandari M (2010) lsquoResearch questions hypotheses and objectivesrsquo Canadian Journal of
Surgery 53(4) 278ndash281 Available at httpswwwncbinlmnihgovpmcarticlesPMC2912019b2-0530278Gallo C (2014) Talk like Ted London MacmillanGuijt I (2008) Seeking Surprise Rethinking monitoring for collective learning in rural resource management Wageningen Wageningen
University Available at httpedepotwurnl139860Hall P (1993) lsquoPolicy paradigms social learning and the state The case of economic policymaking in Britainrsquo Comparative Politics 24(3) 275ndash96Hamza-Goodacre D Jefford S and Simister N (2013) lsquoSupporting International Climate Negotiators a monitoring and evaluation
frameworkrsquo CDKN Working Paper London Climate and Development Knowledge Network Available at httpscdknorgwp-contentuploads201311CDKN_Working_Paper-ME-_Final_WEBpdf
Hearn S and Buffardi AL (2016) lsquoWhat is impactrsquo ODI Working Paper London Overseas Development Institute Available at httpswwwodiorgsitesodiorgukfilesodi-assetspublications-opinion-files10302pdf
Heath C and Heath D (2007) Made to stick why some ideas take hold and others come unstuck London Random House BooksHEFCE (2016) lsquoHow we fund researchrsquo London Higher Education Funding Council for England (httpwwwhefceacukrsrchfunding)IFC GTZ DFID (2008) Monitoring and Evaluation for Business Environment Reform A Handbook for Practitioners Investment Climate
Department Washington DC The World Bank Available at httpwwwpublicprivatedialogueorgmonitoring_and_evaluationMampE20Handbook20July2016202008pdf
Jones H and Hearn S (2009) lsquoOutcome Mapping a realistic alternative for planning monitoring and evaluationrsquo ODI Background Note London ODI Available at httpswwwodiorgsitesodiorgukfilesodi-assetspublications-opinion-files5058pdf
Jones H Jones N Shaxson L and Walker D (2012) Knowledge policy and power in international development a practical guide Bristol Policy Press
Manville C Guthrie S Hanham M-L Garrod B Sousa S Kirtley A Castle-Clarke S and Ling T (2015) Assessing impact submissions for REF 2014 An evaluation RAND SFC HEFCW and DEL Santa Monica RAND Corporation Available at httpwwwhefceacukmediaHEFCE2014ContentPubsIndependentresearch2015REFimpactsubmissionsREF_assessing_impact_submissionspdf
Office for National Statistics (nd) lsquoInfographic Guidelines Version 10rsquo London Office for National Statistics (httpsgsscivilservicegovukwp-contentuploads201212infographics-guidelinespdf)
Pasanen T and Shaxson L (2016) lsquoHow to design a monitoring and evaluation framework for a policy research projectrsquo ODI Working Paper London Overseas Development Institute Available at httpwwwodiorgpublications10284-how-design-monitoring-and- evaluation-framework-policy-research-project
Penfield T Baker MJ Scoble R and Wykes MC (2014) Assessment evaluations and definitions of research impact A review Research Evaluation 23 (1) 21ndash32 Available at httpsacademicoupcomrevarticle231212889056
RCUK (nd) lsquoESRC ndash Specific Requirementsrsquo Swindon Economic and Social Research Council (httpsje-srcukacukhandbookpagesGuidanceonCompletingaStandardGCaseforSupportandAttachmentsESRCSpecificRequirementshtm)
39
RCUK (2014a) lsquoImpact through knowledge exchange RCUK position and expectationrsquo Swindon Research Councils UK Available at httpwwwrcukacukdocumentsinnovationkeposition-pdf
RCUK (2014b) Pathways to Impactrsquo Swindon Research Councils UK (httpwwwrcukacukinnovationimpacts)REF2014 (2014) lsquoAssessment framework and guidance on submissionsrsquo (httpwwwrefacukpubs2011-02)Shaxson L (2016) lsquoAchieving Policy Impactrsquo Guidance Note London DFID-ESRC Growth Resarch Programme Available at
httpdegrpsquarespacecomimpactTsui J Hearn S and Young J (2014) lsquoMonitoring and evaluation of policy influence and advocacyrsquo ODI Working Paper 395 London
Overseas Development Institute Available at httpwwwodiorgpublications8265-gates-monitoring-evaluating-advocacyUniversity of Cambridge (nd) lsquoImpact Case Studies Lessons Learned from REF 2014rsquo Cambridge University of Cambridge
(httpwwwresearch-strategyadmincamacukfilesimpact_recommendationsv3docx) Young E and Quinn L (2012) Making research evidence matter a guide to policy advocacy in transition countries Budapest Open
Society FoundationsYoung J Shaxson L Jones H Hearn S Datta A and Cassidy C (2014) ROMA a guide to policy engagement and influence London
Overseas Development Institute Available at httpswwwodiorgsitesodiorgukfilesodi-assetspublications-opinion-files9011pdf
ODI is the UKrsquos leading independent think tank on international development and humanitarian issues
Readers are encouraged to reproduce material for their own publications as long as they are not being sold commercially As copyright holder ODI requests due acknowledgement and a copy of the publication For online use we ask readers to link to the original resource on the ODI website The views presented in this paper are those of the author(s) and do not necessarily represent the views of ODI or our partners
copy Overseas Development Institute 2018 This work is licensed under a Creative Commons Attribution-NonCommercial Licence (CC BY-NC 40)
All ODI publications are available from wwwodiorg
Overseas Development Institute203 Blackfriars Road London SE1 8NJTel +44 (0) 20 7922 0300 Fax +44 (0) 20 7922 0399
Shaping policy for development odiorg | ODIdev
2
AIMS AUDIENCE AND USESThis guide provides a simple step-by-step approach to planning for impact in six modules It is based on the ODIrsquos Research and Policy in Development (RAPID) Outcome Mapping Approach (ROMA) and draws heavily on the DFID-ESRC Growth Research Programme (DEGRP) guidance on achieving policy impact (Young et al 2014 DEGRP 2017 Shaxson 2016) These resources are grounded in Outcome Mapping see Box 1
The step-by-step approach presented here aims to help researchers think in a structured way about how to monitor and improve the impact research will have on policy and practice It will help researchers understand their impact pathways and develop a suite of indicators they can use to monitor impact over the lifetime of their research project and for some years afterwards
The modules provide guidance in (1) formulating aspects of the Pathways to Impact statement (2) developing a monitoring plan and collecting evidence to inform the reporting of impact in Research Excellence Framework (REF) case studies and (3) writing a REF case study A clear Pathways to Impact statement will help define a good research communications strategy to ensure messages from research reach those who can make a difference throughout the decision-making processes During the research and implementation of the communications strategy monitoring impact and collecting evidence will inform the writing of the impact case study for REF2021
The modules are intended to be used in a flexible manner depending on the purpose and characteristics of the research project If the research project structure (ie who the partners are or how the work is divided between them) or the context within which it operates changes plans should be revisited and if necessary adapted Researchers wanting to dive into this in more detail can ask for support from the RAPID team who can review and comment on impact plans or have one-on-one discussions
Box 1 Outcome Mapping
Outcome Mapping (OM) was first introduced by Sarah Earl Fred Carden and Terry Smutylo from the International Development Research Centre (Earl et al 2001) It focuses on outcomes as defined as changes in behaviour relationships activities and actions and in doing so recognises early changes and progress towards higher-level goals OM differs from conventional logic models by recognising that different actors affected by activities exist in different environments and it is explicitly designed for non-linear systemic change processes (Young et al 2001 Jones and Hearn 2009) It does not try to attribute outcomes but rather explores plausible contributory links between interventions and behaviour changes therefore allowing for complex and non-linear relationships between activities and results
MODULE 1
UNDERSTANDING IMPACT
4
Introduction
There are increasing demands upon researchers to define and demonstrate impact in order to secure funding for research We recognise the importance of conducting research to produce long-term contributions to the knowledge base and to intellectual conversations and our aim is not to convert you to the impact agenda However if you have picked up this guide then it is likely you are interested in influencing policy and practice with your research
The impact of research on funding takes place through two mechanisms First the REF exercise in 2014 and the forthcoming 2021 exercise directly link the assessment of impact case studies to annual Quality-Related (QR) research funding with funding bodies using it to allocate the university block grant between universities1 In 201617 the block grant was pound158 billion (HEFCE 2016) Second research councils award competitive grants on the basis of funding applications that require a Pathways to Impact statement outlining interventions that will enable your research to realise potential impact
In this introductory module we discuss different definitions of impact and the challenges of measuring it Measuring change is a challenging area for researchers As well as the complexities involved in understanding contribution and causal chains there are no standard metrics and funders often set their own measures of success For instance publication and citation data are often used as a measure of research output but they do not consider the impact research may have on policy and practice
Impact and the challenges of measuring it
What does research impact mean and how can you achieve it Just as the term lsquoimpactrsquo is being used more widely there are increasing numbers of definitions of how it can be applied2 In statistics impact is defined as the measured difference in a predefined indicator before the intervention and after the intervention3 The Development Assistance Committee of the Organisation for Economic Co-operation and Development (OECD-DAC) uses a broader definition of impact as any long-term effect whether intended unintended positive negative direct or indirect4
In the 2014 REF impact is defined as an effect on or change or benefit to the economy society culture public policy or services health the environment or quality of life beyond academia (REF2014 2014) Research Councils UK (RCUK) defines impact as academic economic and societal and highlights the importance of balancing these rather than just focusing on academic impact5 This recognises both the contribution research can make to academic advances and the more diverse ways in which research can contribute to economic performance within and outside of the UK increasing the effectiveness of public policy and improving quality of life RCUK also includes public engagement as an impact pathway see Module 5
Here we apply the Economic and Social Research Council (ESRC)-preferred definition summarised in Table 1 as this is research-focused and therefore considers the ways in which research can have an impact
1 For more information see wwwgovukgovernmentnewsgovernment-launches-review-to-improve-university-research-funding accessed 31 May 2017
2 For a summary of definitions of impact used in international development see Hearn and Buffardi (2009) httpswwwodiorgsitesodiorgukfilesodi-assetspublications-opinion-files10302pdf accessed 12 June 2017
3 For example the World Bankrsquos definition lsquothe indicator of interest with and without the intervention Y1 - Y0rsquo White (2009) www3ieimpactorgmediafiler_public20120507Working_Paper_3pdf accessed 20 May 2017
4 For examples of intended positive negative and unintended see Hearn and Buffardi (2009 p9) wwwodiorgsitesodiorgukfilesodi-assetspublications-opinion-files10302pdf also see Hearn (2016) httpwwwresearchtoactionorg201602what-do-we-mean-by-impact accessed 30 May 2017
5 For a discussion on pathways to impact see httpwwwrcukacukinnovationimpacts accessed 31 May 2017
Take-away messages
bull Start thinking about impact and how you will measure it at the start of your research This will help you understand and capture impact when it arises Also revisit your plan regularly to adjust it as necessary
bull Your role in achieving impact may not be straightforward Your influence may be direct but it may also be indirect It may be that you only contribute to broad changes
bull Assessing the context is important when considering impact Consider complexities such as unexpected impact impact over the longer term contribution and co-creation and contextual factors
5
ESRC defines impact as conceptual instrumental and capacity-building6 We include enduring connectivity to recognise that lsquoresearch does not happen in isolationrsquo ndash as achieving impact includes lsquobuilding networks of people and organisations able to understand the research and make use of itrsquo during the research and after the research has ended
Table 1 Definitions of impact7
Conceptual Impacts on knowledge understanding and attitudes
Instrumental Impacts on changes in policy and practice
Capacity-building Impacts on the ability of researchers to conduct similar work in future
Enduring connectivity Impacts on the existence and strength of networks of people and organisations who understand and can make use of the research
Identifying different types of impact
Research projects may be able to demonstrate all types of impact during their lifetime but not in any predetermined proportion or order It is up to researchers to develop their argument on how to prioritise the different types of impact and how much effort to put into achieving each one This toolkit offers guidance on doing this
Identifying the type of impact you are aiming for can help in recognising when a contribution has been achieved However this early thinking perhaps as part of developing your Pathways to Impact should not be at the expense of being open to new and unexpected types of impact that may arise during the course of your research In both policy and practice it is usually impossible to predict which types of impact will be achieved and on what scale recognised in OECD-DACrsquos broad definition which includes unintended and indirect impact
Policy change impact (within RCUKrsquos economic and societal definition of impact) is often overemphasised although individual research projects are not expected to directly influence decision-making Instead research is expected to make a plausible contribution to decisions via the lsquoweb of influencersquo through which research impact can be felt (British Academy 2016)
In understanding impact it is important to consider complexities such as unexpected impact impact over the longer term contribution and co-creation and contextual factors These make measuring impact particularly challenging Indeed the 2014 REF case studies were assessed in terms of their (1) reach ndash lsquothe spread or breadth of influence or effect on the relevant constituenciesrsquo and (2) significance ndash lsquothe intensity or the influence or effectrsquo Therefore these are key elements of impact that as far as possible should be planned for and monitored during the research
Contribution
What role do you as the researcher play in achieving impact It may be that your influence is direct or it may be indirect In some cases we may be able to establish a direct link between a piece of research and a particular change as the impact may result directly from one research paper for example
However in other cases the impact may result from a body of research involving many different researchers It may be the case that the impact is not realised until sometime after the research is finalised This longer-term impact is assessed by the REF exercise as lsquohistoric evidence of impactrsquo (RCUK 2014)
Demonstrating change and the significance of the change is therefore important with proxies such as co-production being used to illustrate contribution In assessing the nature of your contribution it is helpful to systematically consider how direct or indirect the influence of your research on the impact has been and whether there are other social or cultural factors that may have played an important role It may be possible to discern the following types of contribution or influence
6 For the ESRC-preferred definitions of impact see wwwesrcacukresearchimpact-toolkitwhat-is-impact accessed 30 May 2017
7 These come from ESRC-preferred definitions of impact as set out in Meagher L (2012) lsquoRELU societal and economic impact evaluationrsquo Evaluation prepared by Technology Development Group (mimeo) (wwwreluacukresearchInnovation20in20Prog20ManagementRelu_Impact_Evaluation_Final_Report_tcm8-22271[1]pdf) The fifth category used to evaluate RELU fostering interdisciplinarity is not used here as it is not a focus of impact in REF
6
bull lsquoDirect attributable impactsrsquo such that without the research there would have been no impact bull lsquoPlausible and distinct contributions to sustainable changersquo such that there has been a plausible contribution to lasting change and your
contribution can be distinguished from other contributions (see Pasanen and Shaxson 2016) bull lsquoPlausible and indistinct contributionsrsquo where it is not possible to separate the contribution of your research from other influences yet
its influence is likely to be merged with others and so therefore contributes to the combined impact
Contextual factors
Impact through the production of evidence does not take place through a neutral bureaucratic process of identifying and implementing a lsquobest practicersquo option Decision-making processes are affected by the context in which they take place how different stakeholders use evidence to inform their positions how they relate to each other and how evidence is brokered between them (Jones et al 2012)
Du Toit (2012) points out that it is not simply about providing evidence it is about ensuring these rigorous analyses inform goals strategy policy design and implementation by adding value to what is already being done lsquoPro-poor policy interventions take place in complex dynamic open social systemsrsquo (ibid p3) and they are generally implemented via messy partnerships (Guijt 2008) Hearn and Buffardi (2016) present dimensions of impact to arrive at a contextually appropriate understanding
Some factors to consider when assessing the context specific to each research project include the following (Table 2)
Table 2 Assessing the context
1 Who are the key policy actors and decision-makers in the field
2 Is there a demand for research and new ideas among these actors
3 What are the sources of resistance to evidence-based policy-making
4 What is the policy environment
1 What are the policy-making structures
2 What are the policy-making processes
3 What is the relevant legalpolicy framework
4 What are the opportunities and timing for input into formal processes
5 How do global national and local political social and economic structures and interests affect the room for manoeuvre of policy-makers
6 Who shapes the aims and outputs of policies
7 How do assumptions influence policy-making To what extent are decisions routine incremental fundamental or emergent and who supports or resists change
Planning for impact
It is important to understand the likely impact of research at an early stage by developing a Pathways to Impact statement as it helps in understanding lsquowhat you will do and how you will act to enable your research to connect with others and make a difference conceptually and instrumentallyrsquo (ESRC 2017) It is also an important requirement of funding as lsquoResearch Councils require academics to consider the future impact of research at the point of applying for fundingrsquo (RCUK 2014b) Describing your Pathways to Impact is a requirement for the vast majority of funding proposals and even in the exceptional cases where it is not required the lsquoPathways to Impact statement should be used to fully justify the reasons why this is not possiblersquo (ESRC 2017)
This is not to suggest that the expected impact will remain constant throughout the research rather it should be updated and adapted as the context changes and the research trajectory unfolds Indeed research councils (RCs) lsquorecognise the emergent and long-term nature of research and of research outcomesrsquo and seek to support flexibility and autonomy in lsquoproject definition management collaboration participation promotion and the communication of research outputsrsquo (RCUK 2014a)
7
TASK understanding impact in your research project
Time 10ndash20 minutes
Resources 1 x flip chart paper and pen per group
Purpose To start thinking about what impact means for your research project
Activity In your research team consider the following questions
1 What do you understand by impact
2 What does impact mean for your research
3 How does your organisation define or understand impact
4 What are the differences between each of these
5 Are these definitions written down or discussed
Notes
MODULE 2
IDENTIFYING YOUR IMPACT OBJECTIVE
9
lsquoImpact objectives revolve around getting your research known and used amongst those who can benefit most from itrsquo (ESRC 2017)
To have impact with your research you need to be clear about what sort of change you want to see and what lsquoimpactrsquo means for your research An impact objective is a statement of how you intend to do this and it is required by the Pathways to Impact statement and the impact summary in which you need to outline who will benefit from the research and how This will also help define a good research communications strategy to ensure messages from research reach those who can make a difference throughout the decision-making processes It will determine the types of evidence you will collect during the research and implementation of the communications strategy and in turn the monitoring of impact will inform the writing of the impact case study for REF 2021
To identify your impact objective it is important to situate your research within a broader policy context A good impact-oriented objective should be clear about why the changes you are proposing are important who they affect what needs to be done about it and where you stand in relation to others who are also trying to bring about change (adapted from ROMA Young et al 2014)
In this module we provide guidance on determining your impact objective considering what you can reasonably expect to be able to influence and how you may achieve such influence
Take-away messages
bull Developing an impact objective helps you be clear about the change you are aiming for and what lsquoimpactrsquo means for you This will guide your communications strategy and the evidence you need to collect
bull Most research is done in collaboration with others Building the capacity of others along the way may involve working in partnership or as part of a coalition
bull Having a good understanding of the wider policy context is necessary before you can formulate your impact objective
Figure 1 Sphere of influence
Outputsinputs
activities
Sphere ofCONTROL
Sphere ofINFLUENCE
Sphere ofCONCERN
Outcomeschanges inbehaviour
Impactand
context
Box 2 The importance of collaboration
Most research is done in collaboration with others and particularly in international development there is a desire to build your partnersrsquo capacity along the way This may involve working in partnership or as part of a coalition ndash particularly if you are working on a complex problem that involves a large number of actors
The process of working together will involve discussions about objectives aims and terminology These may highlight different values language and assumptions partners have
This process brings those involved together by developing a commitment to common values rather than tightly defined objectives This helps provide the flexibility to navigate the implementation path and observe impact as it arises particularly where it may differ from the type of impact originally expected The initial objective for the coalition therefore should be quite broad leaving room for each coalition partner to formulate sub-objectives that better reflect their particular goal and anticipated impact
Source Young et al (2014)
10
What you can reasonably expect to influence
The sphere of influence framework is useful to determine what is and what is not within our power to influence It originates from Outcome Mapping (OM) developed by Sarah Earl Fred Carden and Terry Smutylo from the International Development Research Centre (Earl et al 2001) OM is a way of planning international development work and measuring its results It is concerned with results ndash or lsquooutcomesrsquo ndash that fall strictly within the programmersquos sphere of influence The focus is on changes in behaviour relationships actions and activities of the people groups and organisations you work with directly (Young et al 2014)8
Inputs activities or outputs within the sphere of control are those where we have complete control over our actions The sphere of influence is where events are not completely in our control but where we do have the power to change the outcomes (Tsui et al 2014) On the other hand the sphere of concern focuses on events occurring over which we have no control They often represent actions taken by others or the results of a cascading set of external factors Although this is where the results that really matter lie (such as better education quality health care secure livelihoods) to have an influence in this sphere you have to work with others Results within the sphere of control and sphere of influence are those that you can measure and can use to guide your strategy and engagement plan (Young et al 2014)
Table 3 FINER criteria for a good research question
F Feasible bull Adequate number of subjects bull Adequate technical expertise
bull Affordable in time and money
bull Manageable in scope
I Interesting bull Getting the answer intrigues investigator peers and community
N Novel bull Confirms refutes or extends previous findings
E Ethical bull Amenable to a study that institutional review board will approve
R Relevant bull To progressing knowledge in your field bull To policy development
bull To future research
Source Adapted from Hulley et al (2007) cited in Farrugia et al (2010)
8 For more information visit the OM Learning Community wwwoutcomemappingca
Box 4 Grounding your impact objective in the context
A relevant impact objective should be appropriate to the wider policy context Therefore having a good understanding of the wider policy context is necessary before you can formulate your impact objective Understanding the context includes not just the nature of the problem but also the direction that current policy is taking (which may be no direction at all) or it may be that there are competing policy directions (eg from different political parties) that need to be considered
Box 3 The results chain
Research councils recognise that it is important to capture the outputs outcomes and impact of the research they fund to demonstrate the wider value of the research to the UK society and economy (RCUK 2014)
The lsquoresults chainrsquo refers to the order in which results arise starting with activities and inputs that produce outputs which in turn lead to outcomes Outcomes can be described as lsquointermediatersquo and either lsquofinalrsquo or lsquolonger termrsquo These interact with contextual features to produce impacts the figure below illustrates the order
Figure 2 The results chain
Activitiesinputs Outputs Outcomes Impacts
Source Young et al (2014)
11
TASK identify your impact objective
Time 20ndash40 minutes
Resources 1 x flip chart paper and pen per group
Purpose To develop a clear and concise impact objective
Activity In your research team answer these seven questions
1 What is your research question andor hypothesis
See Table 3 for guidance on developing a strong research question
2 What wider policy problem or issue does this feed into
For example if your research is on youth perceptions on agriculture in eastern Uganda the wider policy problem may be youth unemployment in the region
3 How can your research contribute to understanding or solving this problem or issue
What information or perspective will your research bring to light What influence do you expect this to have Will you engage or encourage participation from local stakeholders
4 Who will benefit from this research How will they benefit Rather than just listing stakeholders or making broad statements about how your research will lsquoprovide new insightsrsquo or lsquoincrease understandingrsquo the purpose of this exercise is to dig deeper How will new insights or greater understanding make a difference to peoplersquos lives Will the research achieve this by engaging with local stakeholders For example a greater understanding of how young people perceive agriculture in eastern Uganda may help policy-makers create policies that incentivise young people to access available jobs in agriculture ndash this will help young people build a sustainable livelihood and feed their families
5 What is your high-level impact objective
This is the ultimate impact objective you would like to see the research achieve This may take place beyond the end of the research and it may be outside your sphere of influence Critically think about this and how you may need to adjust it to reflect your responses to questions 1ndash4 It could be that you have more than one high-level impact objective
6 What are your impact objectives within your sphere of influence
Examples may be to build awareness of the research among a target audience secure the commitment of a target group of stakeholders to the research aims influence specific policies or policy-makers on key aspects or encourage participation among researchers or partner bodies (ESRC 2016)
7 What would you point to to indicate that change has happened and that your research has made a difference
What observable changes among these groups might you see Is it plausible that your research has contributed to these Think about this for your impact objectives both within your sphere of influence and for high-level impacts
Notes
MODULE 3
STAKEHOLDER MAPPING
13
Stakeholder mapping has various uses in developing effective Pathways to Impact and for putting in place an effective strategy for achieving impact It can be used to identify
bull research users to consult during the research planning stage to discuss the role they may play in planning the research such as co-investigators
bull opportunities for building strategic partnerships and strengthening relationships bull and actively engage relevant users of research and stakeholders at appropriate stages
Developing maps of how well the various stakeholders are aligned with the research and the degree of interest they have in the issue is a valuable exercise Building relationships and partnerships can greatly enhance the quality of research and can enhance impact as these stakeholders may influence change
An Alignment Interest and Influence Matrix (AIIM) can help ensure you consider the full range of stakeholders who may be influenced by your research in some way It is a simple stakeholder mapping tool with three dimensions the degree of interest in the research topic the degree of alignment with the thrust of the research and the degree of influence they have within the policy-making process
Stakeholder mapping is best done in a group so you can draw out discussions and perspectives around who may be interested in your work and who you need to reach to achieve your impact objective
14
Box 5 Alignment interest influence
Definitions
Alignment is the research likely to lead to policy the stakeholders broadly agree with Do they share the same sense of potential importance and agree with your approach
Interest are they interested in the issue your research is addressing Are they committing resources to the issue Do they want change Are they speaking about the issue
Influence how important are they to making change happen Are they in a position of authority Can they put pressure on a decision-maker
Groupings
Top right quadrant stakeholders in this quadrant are both interested in your issue and aligned with your approach These people are your collaborators and allies You may want to lsquowork in partnershiprsquo with this group Perhaps you could form a community of practice or set up meetings with key organisations or individuals to share ideas or coordinate activities
Top left quadrant stakeholders in this quadrant agree with your approach but they are not interested or prioritising the issue This could be for several reasons ndash they may not know much about the issue have limited capacity or have competing priorities If there are influential stakeholders in this group start to think about how you can develop their interest or capacity to get involved
Bottom right quadrant stakeholders in this quadrant are interested and perhaps active in your issue area but they donrsquot agree with your approach or position If you need to get stakeholders from this group on board yoursquoll need to challenge their current thinking and persuade them of your position Evidence usually works best for this group Working through champions who are aligned with your position can also be effective
Bottom left quadrant stakeholders in this quadrant do not know much about the project or if they do they are not very interested and probably do not agree with your views If they are not influential in your projectrsquos success you may prefer to ignore them as a group Ultimately you cannot do everything and may need to focus your energies on the actors in the other three quadrants It may also be hard to know who these actors are because they might not even be known to you If they are potentially influential you may need to just monitor them to ensure that they donrsquot move into another quadrant and start to cause your project harm
WORK IN PARTNERSHIP
CHALLENGE OR PERSUADE
IGNOREOR MONITOR
DEVELOP INTEREST OR CAPACITY
High alignment with approach
Low alignment with approach
High interest orengagement in issues
Low interest or engagement in issues
Source Young et al (2014)
15
TASK map your stakeholders
To get the most out of this activity it is best to do it as a group exercise either with your immediate team or with those working closely with you If possible have a good variety of people in the group including research communications and monitoring and evaluation staff or the implementation team The greater the range of people the more detailed your analysis will be If your group is larger than eight people it may be helpful to allocate someone the role of facilitator
Time 60 minutes
Resources 1 x flip chart paper marker pen up to 20 sticky notes per group
Purpose To identify
bull research users to consult during the research planning stage
bull opportunities for building strategic partnerships and strengthening relationships
bull relevant users of research and stakeholders
Activity 1 Place the flip chart paper on the wall or in the middle of the table and draw the matrix Write your policy objective at the top of the page
2 For your policy objective list all the stakeholders you can think of Write them down on the sticky notes (one per note) Be specific and refer to different individuals or teams rather than just saying the Ministry of Agriculture This is important as different teams may have different positioning
3 Select those stakeholders who have the highest or the lowest interest or alignment
4 Take turns to place the sticky notes on the matrix placing the notes for the four stakeholders that are at the most extreme points so most interestedmost aligned least interestedleast aligned most interestedleast aligned etc This allows an analysis of their relative rather than absolute levels and prevents all stakeholders being concentrated in the top right hand corner of the matrix
5 As you place the sticky notes explain to the group why you are placing the stakeholder in that position Discuss whether people agree or not Remember you can have more than one sticky note per organisation if an individual or team has a different degree of interest alignment or influence separate them out
6 Add dots to the sticky notes to show how influential the stakeholder is to the success of your research Add three dots if they have a lot of power or influence two dots for reasonable influence one dot for minimal influence and no dots for no influence This will help you prioritise your efforts and resources later on
7 Once all stakeholders are on the matrix start to look at the groupings Refer to Box 5 Alignment interest influence matrix ndash groupings Look at the individuals and groups that are most influential to you Are they where you want them to be on the matrix If not use the pens to draw arrows to where you would like them to move to
8 Now add a lsquotickrsquo to any sticky note you have already had contact with or have access to
9 Think about what strategies you may want to implement to respond to your findings
Notes
16
Box 6 AIIM in action
An AIIM analysis was conducted to support the objective of passing legislation that supports mothers to breastfeed for up to two years in Indonesia This highlighted which stakeholders could be most effectively worked with and those whose perspectives were conflicting ndash for example stakeholders supporting the supply of powdered milk instead of encouraging mothers to breastfeed Other stakeholders changed their position on the matrix at different stages of policy implementation For example parts of the government supported breastfeeding after the legislation was passed but were not active in supporting the legislation to be enacted at the district level
Figure 3 Example of an AIIM map in action
Source The regional pastoralist livelihoods advocacy project June 2008 London ODI
MODULE 4
DEVELOPING A THEORY OF CHANGE
18
Outlining a Pathway to Impact involves understanding how change can come about and this in turn will underpin the changes that are captured in the impact case study
Developing a theory of change (TOC) involves refining ideas of how the research projectrsquos work with stakeholders may lead to change Such change usually happens as stakeholders engage with the research subsequently take on board the key messages and finally internalise the issues to such an extent that they can effectively act on behalf of the researchers to spread the message themselves This means developing a TOC9 There are many different types of TOC In this module we provide guidance on one that reflects the underlying Outcome Mapping-based principles of our approach
There are three steps in developing a TOC
1 Analyse the current context what are the current ideas interest groups and processes How do these influence policy-making
2 For the key stakeholders examine the changes in behaviour you woulda expect to see to indicate initial engagement with the researchb like to see to indicate that the messages are being taken on boardc love to see to indicate that the messages have been deeply internalised
3 Identify what the research project and others will do and check assumptions about how these are related
Theories of change are not static it is worth revisiting them annually or more frequently if things are changing rapidly to assess whether plans need to be revised This is particularly important for long-term research projects when there may be changes in context or partners The same three steps would be followed asking has the context changed Have the roles of key stakeholders changed and what does this mean for the changes you would expect like and love to see Does this affect what the research project does or what others will need to do to bring about change
Change does not have to be positive Interesting lessons are often learnt from recognising negative changes or where there has not been any change Often the most interesting observations and lessons result from exploring why no change or negative outcomes may have arisen If in your Alignment Interest and Influence Matrix (AIIM) yoursquove identified that a stakeholder is very interested but not aligned with your approach you may expect a backlash from them or critical comments as they disagree with your approach This may be a good thing if yoursquove anticipated it and it happens and you have a plan to deal with it then it can be framed as an expected reaction and logged as an achievement The more political the issue you are working on the more likely you are to encounter this sort of reaction Box 8 considers orders of change in terms of the link between ideas and impact in a policy context
9 What is presented here is one version of what a theory of change may be See Vogel (2012) for a comprehensive review of theories of change wwwgovukgovernmentnewsdfid-research-review-of-the-use-of-theory-of-change-in-international-development
Take-away messages
bull Theories of change are not static it is worth revisiting them at least annually to assess whether plans need to be revised
bull Change is not always positive capturing instances of no change or negative change often provides valuable insights If you succeed in anticipating a backlash or criticism then you will be armed with a response
Box 7 What is a theory of change
A TOC helps researchers conceptualise what impacts they may have and how they may be sequenced and achieved given the wider context within which the project operates In Vogel (2012) Julian Barr from Itad defines a TOC as follows
A TOC is analogous to lsquoGoogle mapsmdashthis is the territory this is how we see our bit of the territory and this is the route that we think is best to take through it (though like Google Maps we recognise there may be a couple of different routes across the territory but we have explicitly chosen one) Based on our understanding of how the territory along the road works this is how we shall approach the journey and these are some of the landmarks we expect to see along the wayrsquo
19
Step 1 Analysing the current context
This first step is often overlooked but it helps develop a good baseline and thus a more accurate analysis of how change may happen and the impacts that may be possible The depth of analysis done at this stage may range from a full-blown political economy analysis to a more focused understanding of the relationship between research evidence and policy10
The key issues to consider are
1 Knowledge and information What knowledge is currently used in debates around the policy issue For example is it knowledge from formal research from past experience perhaps published in evaluations or else taken as lsquocommon knowledgersquo is it widely shared opinions or do ideas come largely from ideologies and beliefs Which of these types of knowledge dominates
2 Actors and stakeholders Whose voices are the strongest in debates Whose evidence is currently seen as credible and why What networks exist between different stakeholders Are there stakeholders whose voices are marginalised Who decides what knowledge counts who arbitrates between contrary facts and opinions
3 Knowledge intermediaries Are there actors who broker debates bringing new ideas into the discussions synthesising evolving understanding and communicating with stakeholders Are there other active brokers such as lobby groups civil society organisations or press and the media who actively participate in debates around the issue
For all of these three issues consider the processes through which impact can take place For instance how does knowledge circulate Is it written down is it oral Is it public or do critical debates and decisions take place in private networks behind closed doors Does the political context affect how knowledge of your issue flows around debates11
The point is to look for any major aspects of the current context that may affect how change happens particularly the sorts of changes you may want to see as a result of your research This analysis will also help you identify and capture unanticipated changes if they arise
10 See DFIDrsquos how-to note wwwgsdrcorgdocsopenPO58pdf
11 This does not necessarily mean party political issues (though could include them) it means issues where the balance of power between stakeholders is an important consideration in how they act and how they relate to each other
Box 8 How policy change happens
Orders of change were originally described by Hall (1993) to discuss the process of social learning He explores the link between ideas and impact in terms of policy-making This is most useful at the planning phase to understand how deep and transformational the impact is that you are anticipating Hall separates policy change into three levels
bull First order change focuses on incremental changes An example would be to increase the minimum labour wage in response to protests
bull Second order change occurs when policy instruments are completely altered Following on with the above example the government would use a living wage instead of a minimum wage as a form of a social safety net
bull Third order change takes place when a new hierarchy of policy-making goals is created Hall calls this a lsquoparadigm shiftrsquo For example the minimum wage and the living wage policy would no longer be a priority as other goals would be a higher priority such as taking account of non-economic social contributions in assigning benefits
It is important to remember that first and second order policy changes occur in normal policy-making First and second orders of change often may not lead to the third order of policy change
However it may be that people are so resistant to change that a lsquolove to seersquo change may only be what Hall refers to as a first order change Depending on the policy context it may be sufficiently ambitious to aim for a first order change
Sources Adapted from Tsui et al (2014) and Hall (1993)
20
Step 2 Developing theories of change
We are encouraging an approach to developing theories of change based on the principles of OM (Earl et al 2001) This looks at changes in peoplersquos actions and behaviours not changes in the things that are produced It distinguishes between three different levels of change
1 Changes we would expect to see the early positive responses to your work (such as attending meetings convened by the research programme giving feedback on a publication)
2 Changes we would like to see active engagement with what you are doing (such as inviting you to attend one of their meetings asking for information on research-related issues)
3 Changes we would love to see deeper transformations in behaviour that indicate that your messages have been completely internalised (such as co-opting a collaborator onto a standing committee incorporating one or more messages from your research into a strategy document or taking a decision about resource allocation)
The lines between the different changes are blurred and it is a matter of judgement as to which change falls into which category
Figure 4 represents an example of how a research project may have outlined the expect like and love to see for one of their key stakeholders the UK Department for International Development (DFID)12
Table 4 Progress markers
Expect to see We would expect to see that the Drivers of Change conceptual framework is published in a DFID how-to note as it responds to DFIDrsquos need to identify lsquothe long term structural and institutional factors which enable or constrain reform in different countriesrsquo and lsquoto improve policy-making and programming by identifying short- and medium-term opportunities to support strategic changersquo
Like to see We would like to see the framework captured in DFIDrsquos guidance notes such that DFIDrsquos approach changes from one of providing lsquoassistance to promote particular agendas around governance growth or service deliveryrsquo to consider how to provide support taking political feasibility into account
Love to see We would love to see the framework informing DFIDrsquos white papers to allow DFID to influence others eg through membership of the OECD Development Assistance Committee
Theories of change can be presented in table form as below in Table 5 It is helpful to separate out your general statement of what the changes will look like (lsquoDepartment X begins to actively seek out emerging research resultsrsquo) from more specific indicators (lsquolocal collaborator is invited onto the standing committee for issue Xrsquo) which can be tracked Working into the specific indicators of change and ensuring their sequence is logical can be a helpful way of checking the overarching logic of the TOC
12 This comes from the REF case study on Thinking and Working Politically from the University of York available at httpimpactrefacukCaseStudiesCaseStudyaspxId=43466
Figure 4 Using Outcome Mapping to develop a theory of change
Given our understanding of the current context these are the behaviours we wouldhellip
hellipexpect to see
Early positive responsesto the research
Active engagement with the research results
Deep transformation in behaviour
helliplike to see
helliploveto see
21
It is important not to assume that all behaviours in the same category must happen at the same time across the different TOCs Change in social processes is decidedly non-linear people may block change for reasons that arenrsquot immediately clear or they may suddenly get the point as a result of several things happening simultaneously most of which are outside your control Developing different TOCs for different stakeholders helps you unpick the assumptions about how change happens Research Councils UK (RCUK) note how impact can occur at any stage of the research and often as a result of unexpected actions (RCUK 2014) Therefore continual monitoring and updating of your TOC can help capture such surprises when they arise
Table 5 An initial theory of change
General statement of change Which stakeholders are involved Specific indicators
Current context
Expect to see early positive response
Like to see active engagement
Love to see deep transformation in behaviour
Step 3 Identifying the research projects role and checking assumptions
The final step looks at the contributions to change made by the research and by others This adds on two columns The first sets out what the research will contribute the second looks at what we are assuming about how others will contribute
Table 6 A final theory of change
General statement of change
Which stakeholders are involved
Specific indicators
What will the research contribute
What will others contribute
Current context
Expect to see early positive response
Like to see active engagement
Love to see deep transformation in behaviour
Having gone through these three steps it should now be possible to revise the research projectrsquos impact pathway refining your understanding of the different types of impact your research can have being clear about the limits of your research what needs to be achieved through others developing some concrete indicators of impact including for the longer-term impacts of your research
The Climate Development Knowledge Network (CDKN) has used progress markers to develop its monitoring and learning framework based on changes in behaviour in local communities One of CDKNs main goals has been to influence countries in their climate change negotiations Table 7 shows the progress markers it developed as an example
22
Table 7 Example progress markers
Outcome challenge the programme intends to see local communities recognise the importance of and engage in the planning of resource management activities in partnership with other resource users in their region These communities have gained the trust of the other members of the partnership and the recognition of government officials so they can contribute constructively to debate and decision-making processes
They are able to clearly plan and articulate a vision of their forest management activities and goals that is relevant to their context and needs They call upon external technical support and expertise as appropriate They act as champions for model forest concepts in their communities and motivate others in the partnership to continue their collaborative work
Expect to see local communities
1 Participating in regular model forest partnership meetings
2 Establishing a structure for cooperation in the partnership that ensures that all local interests are represented (mechanics of setting up the structure)
3 Acquiring new skills for involvement in the model forest
4 Contributing the minimum human and financial resources necessary to get the model forest operational
Like to see local communities
5 Articulating a vision for the model forest that is locally relevant
6 Promoting the model forest concept and their experiences with model forests
7 Expanding the partnership to include all the main forest users
8 Calling upon external experts when necessary to provide information or meet technical needs
9 Requesting new opportunities for collaboration with other institutions and actors
10 Identifying opportunities for collaboration with other institutions and actors
11 Identifying opportunities for and successfully obtaining funding from a range of sources
Love to see local communities
12 Playing a lead role in resource management with a view to medium- and long-term benefits
13 Sharing lessons and experiences with other communities nationally and internationally to encourage other model forests
Source Hamza-Goodacre et al (2013)
MODULE 5
COMMUNICATING YOUR RESEARCH
24
Your research will only have real world impact if it reaches the right people Therefore when planning your communications itrsquos important to think beyond one-directional lsquodisseminationrsquo of research findings Communications is much broader itrsquos about engagement and knowledge exchange Research Councils UK (RCUK) defines it as a lsquomulti-way exchange of knowledge between academia and research users in business public and third sectorsrsquo (RCUK 2014)
When we talk about lsquocommunicationsrsquo we use the word in the broadest sense Communication can take many forms ndash formal and informal This includes digital engagement social media publications field visits public events emails or private meetings This takes investment lsquogrowing effective knowledge exchange with non-academic communities takes time skills confidence and moneyrsquo (ESRC 2017)
The key to any communications activity seeking to engage someone with your work is to know who you want to reach know what you want to do and work out how you want to reach them ndash this means thinking about the channels and tools you will use and to what messages they will relate
It is often assumed that communications are done at the end of a research project In fact knowledge exchange and engagement play an important role throughout the project and research lifetime Engaging audiences early in the research process can help ensure relationships have crystallised by the time you come to actually communicate your findings It also gives you more time to plan adapt and above all understand your audiences
This module covers
1 Knowing your audience2 Crafting effective messages3 Planning your outputs and activities4 Presenting your research
Step 1 Knowing your audience
The audience is (or should be) at the heart of any communication Before you can begin communicating your research you need to be clear about your aims who do you want to reach and what do you want them to do with the information Effective communication material needs to be carefully tailored and adapted for different audiences
It is helpful at this point to look back at your impact objective and reflect on the following
1 Is there a problem you are working to address2 Are you offering a solution (or several solutions)3 Are you providing new information to support others to find solutions4 What do you want your communications to achieve5 Who do you need to engage with to achieve your goal
Take-away messages
bull Think lsquoengagementrsquo not dissemination We talk a lot about research lsquodisseminationrsquo but this is one-directional and communication is much broader itrsquos about engagement and knowledge exchange
bull Donrsquot leave it to the end Communications is often left to the end of the research process but it plays a critical role throughout the projectrsquos lifetime
25
TASK identify your audiences
You will have already identified your key stakeholders and courses of action for each as part of Modules 3 and 4 of this toolkit This exercise allows you to identify your specific audiences for communications and engagement activities Remember that your audiences and communications objectives may change throughout the lifetime of your research For example at the beginning your communications may be about building partnerships and later on it may be about influencing action It is helpful to have a facilitator for this exercise
Time 60 minutes
Resources 1 x flip chart paper marker pen up to 20 sticky notes per group
Purpose To develop a clear and concise impact objective
Activity 1 Write your impact objective on a large piece of flip chart paper so everyone can see it
2 Put four sheets of flip chart paper on the wall Label the first lsquoAudiencersquo the second lsquoObjectiversquo the third lsquoMessagersquo and the fourth lsquoWhenrsquo and distribute sticky notes to participants
3 Invite participants to write a key audience on a sticky note contributing up to three each Be as specific as possible (ie rather than writing lsquopolicy-makersrsquo write lsquothe Minister of Educationrsquo)
4 Invite participants to place their sticky notes one by one on the first flip chart paper
5 Invite one or two participants to cluster the notes into groups and explain why they have chosen that particular grouping (You may also want to refer to your stakeholder maps)
6 Get into groups of three or four people and think about why you want to engage with that audience Is it to bring them on board as a partner Is it because you want them to share your research with others Or is it because you want to influence their actions with your research
7 Invite one participant from each group to add the objectives to the second flip chart paper so that they are aligned with the respective audience groups This may lead to some discussion try to reach a consensus
8 In those same groups think about what kind of information the different audiences will most likely be interested in or need Write them down on sticky notes
9 Invite each group to add their ideas to the third flip chart paper for each audience group Again this may lead to some discussion and debate among the groups try to reach a consensus
10 In the same groups think about when you will want to engage with that audience This will link to the objective for example if your objective is to build a partnership you may want to do that early in the research process You may find that you need to engage with some audiences throughout the research
Notes
26
Step 2 Crafting effective messages
Identify your key message
A strong message should be at the core of any good report presentation or other piece of communication Research frequently focuses on facts and data but it is important to explore ways to tell a story through your messaging as well Audiences from academics to decision-makers are far more likely to want to interact with new information if they can relate to it in some way
Key messages are lsquojust the tip of the icebergrsquo (Young and Quinn 2012) They are what your audience most needs to know and are supported by the main information (the rest of the iceberg) as needed If you give readers all the information in one go they are unlikely to absorb it
When planning your key messages think about your audience Who are they What sort of message do you need to communicate to them and why Thinking through several questions can help you shape the message then the channel for best conveying it
1 Who are the audience What role do they play Are they specialists in the topic or are they non-technical Are they people who you already know
2 What do they need to know What are they currently working on How can they use your information Did they ask for the information If so are you delivering what they wanted Do they need to know more
3 How do they best receive information Do you know how they tend to prefer to receive communications What has worked well in the past (and what has not) Is it better to approach them for a meeting or to send a report
Make your message stick
There are multiple ways to develop strong messages One great example is from Heath and Heath (2007) They talk about six dimensions to a good message which can be applied to all types of messaging including evidence into policy They are
Simple The best messages are always simple This does not mean dumbed down Rather you are pulling out the key message your audience needs to know Keep it concise and donrsquot over-elaborate
Unexpected If you can make people sit up and listen yoursquore more likely to have impact Counter-intuitive messages a surprising fact or a different angle can be one way to do this
Concrete Donrsquot be too abstract Make your message tangible relating to real life examples where possible For example rather than saying 25 say one in four people
Credible Your message can be clear concise and well-constructed but if it isnrsquot credible the audience is unlikely to listen Is your message backed up by evidence Is it believable
Emotional We know emotions provoke reaction Is there a way to explore emotions with your audience make them connect or care about the human story behind your research
Stories We use storytelling all the time for effective communications Can your message tell a story rather than just hard facts Whatrsquos the impact of the evidence
Next time you read a blog you find interesting or inspiring a good exercise can be to spend some time looking at how much the author uses the above dimensions when they try to convey their key messages
27
Step 3 Planning your outputs and activities
Every research project needs to think about outputs and activities While research may be published in an academic journal if you want to have an impact beyond academia you will need to think how to achieve this and explore other communication channels
Remember that effective engagement is more than one-way communication As the Engineering and Physical Sciences Research Council (EPSRC) writes lsquodone well public engagement can build trust and understanding between the research community and a wide range of groups from policy-makers through to young peoplersquo (EPSRC nd) Engaging stakeholders with your research can improve the quality of your research outputs and the impact raise your profile and develop your skills Communication activities therefore are some of the most important actions you can take to increase the impact of your research
The outputs channels and activities you use will depend on what impact you want to have who your audience is and what resources you have If you have communications support involve them in the research planning stage to help identify early on what outputs are likely to have the most impact and to make sure you have the resources to do it
Box 9 A spectrum of knowledge communication activities
This is a helpful framework to reflect on the different types of knowledge roles you can play This may change throughout your research lifetime depending on what yoursquore trying to achieve and your resources If you are clear about what your role is and what you can achieve you can then see where your limits are and where others can help
Source Shaxon L (2016)
INFORMATIONINTERMEDIARY
KNOWLEDGETRANSLATOR
KNOWLEDGEBROKER
INNOVATIONBROKER
Making information available putting research results into the public domain
Linear disseminationof knowledge from producer to user
Co-production of knowledgesocial learning and innovation
Translating research evidence for non-specialist audiences giving seminars writing policy briefs
Actively engaging in policy and practice debates taking part inmeetings matchmaking convening networking
Inuencing the wider context to reduce transaction costs and enable innovation build local capacity change incentive structures to use research
Take-away messages
bull Create packages not publications Your impact will be limited if you just produce one product you need to tailor outputs and activities for different audiences
bull Be strategically opportunistic Identify policy windows and plan your research timetable to make the most of these opportunities However unexpected or unplanned opportunities will also emerge and you need to be ready to respond
bull Donrsquot forget the messenger Sometimes you may not be the appropriate messenger For example you may not have the right profile access or skills You may need to partner up with other organisations or individuals
28
Traditionally we have always identified four key channels for communicating research ndash publications events digital and media However today the lines between these channels are very blurred as digital communications becomes increasingly central to strategies
Table 8 Example outputs channels and activities
Types of output Why use it
Written formats
Journal article It presents your full research methodology and analysis It is likely to be read by other academics or students so the language can be technical (although should always be as clear as possible)
Research report It presents your full research and evidence It is likely to have a broader audience than just other academics so it needs to provide a comprehensive and accessible overview of your research
Brief Short sharp targeted briefs can help communicate key recommendations to policy audiences
Toolkit It presents practical tools insights or experiences in a way that can be easily used or applied by other people
Blogs and op-eds They can be used to provide an accessible and engaging lsquoway inrsquo to bigger pieces of research or learning as well as reaching broader or targeted audiences
Media release Designed to communicate key information to regional national and international media outlets it may be picked up by online and print media publications Media is especially useful for reaching influential people and policy-makers as well as the general public (depending on what media outlet picks up your work)
Digital tools
Website It can provide a central platform to host resources and make your work publicly available By hosting everything in one place you can track downloads or page views and find out who is interacting with your work
Data visualisation It is used to present data visually making it easier to understand or compare to tell compelling stories or to draw attention to key messages and statistics
Online networks Tapping into existing or established online networks of people interested in research yoursquore working on is a good way to reach wider but targeted audience groups Newsletters can target a mass audience It may be far more effective to ensure your research appears in other newsletters for example a university newsletter
Email Often overlooked email plays a critical communications role A personal email from a researcher to a contact can be one of the most effective ways to share research
Events and meetings
Public events They are one of the most common ways to showcase research on a public platform They can be part of a conference a public panel or keynote event Events may be streamed online or available for users afterwards through a video or podcast
Policy dialogues They convene a range of policy stakeholders from different interest groups and with different perspectives to focus on a policy issue
Workshops They can be a good method to engage directly with key stakeholders and encourage small-group discussions
Bi-lateral meetings Meetings are one of the most common ways to engage people early on with your project and to showcase results to several key stakeholders particularly decision-makers and donors
Webinars Webinars can be a way to present new research online to audiences in different countries and particularly can encourage new learning andor guidance for users
Multimedia
Social media It allows you to reach larger networks of people who may be interested in reading or using your research This could be on Twitter LinkedIn and Facebook as well as WhatsApp and SnapChat
Multimedia This media may be better for reaching some audiences such as young people or policy-makers It can include videos podcasts and animation but also photography
Radio TV broadcast Radio and TV have enormous potential to communicate to a wide audience For example in some developing and emerging countries community radio can be a critical way to reach key audiences
29
TASK map your communications activities
This exercise builds on TASK 1 lsquoIdentify your audiencersquo In this task you will start to identify the outputs channels and activities you need to reach your priority audiences You can then determine who will do what and whether you have sufficient resources to deliver your strategy It is useful to note any capacity shortfalls you may be facing and possible interim strategies to address these Activities often take longer than you think particularly those requiring working with external actors such as developing partnerships
If you have communications teams or support it is important to include them in mapping your activities It is also important to include leadership of senior staff to draw on their experience RCUK notes lsquocommitment to include principal and senior investigator time on knowledge exchange and impact activities recognising that collaboration with users often requires a depth of experience and level of understanding of the kind held by established researchers and which complements the skills of research associatesrsquo (RCUK nd)
Time 30-40 minutes
Resources 2 x flip chart paper marker pens and sticky notes
Purpose To develop communication strategies for each audience group
Activity 1 Look back at the flip chart papers from the previous task Re-familiarise yourself with your audiences why you want to engage with them and why
2 Add a fifth flip chart to the wall titled lsquoCommunications activitiesrsquo
3 In the same groups identify what communications outputs and channels may be best to reach the different audience groups (eg a report a policy brief the media an event a face-to-face meeting email) Write these on sticky notes
4 Invite participants to add their sticky notes to the flip chart paper
5 Next think about your resources (time expertise and budget) Which of these activities are a lsquomustrsquo Which are a lsquonice to haversquo Do you have the time expertise and budget to deliver these activities
6 Take a new flip chart paper and turn it landscape Draw out the example table below (Table 9) and start filling it in
Notes
30
Table 9 Mapping activities example
Outputactivity List all planned communications outputs and activities
1 Workshop 2 Journal article 3 Policy brief
Audience Who do you want to engage with this output or activity
Ministry X Academics in X field Minister of X
Objective Why are you producing this output or carrying out the activity Relate this to your audience
To establish a relationship with the ministry to get a better understanding of the policy context for the research and to identify the ministryrsquos policy needs to inform our research question
To inform other academics working in this research area to support their work and share learning
To inform the minister of our research results ahead of its annual budget setting
Staff time required How much ndash and whose ndash staff time is realistically needed to deliver this work
15 days for lead researcher to plan facilitate and write up workshop
30 days for lead researcher to write and coordinate peer review
5 days for internal review
5 days lead researcher to write
3 days for communications support
Additional budget required What direct costs are involved Flights accommodation sustenance
Venue catering
Copy-edit
Peer review
Copy-edit
Design
Proof-reading
Deadline By when does this output or activity need to be delivered (to meet the objective and to meet your funding requirements)
End of scoping phase (day month year)
End of research phase one (day month year)
End of research phase two (day month year)
Priorityresources Is this a must have or a nice to have Again think back to your overall impact objective
Step 4 Presenting your research
Presentations
At some point during your research you are likely to need to present it ndash either formally or informally This section examines some of the ways in which you can improve your presentation skills and effectively share your key messages
Tips for presenting well
bull Be clear about the purpose and audience for the presentation This will help you focus on the information you most need to prioritise your key messages
bull Structure your presentation Can you identify one overarching message and three key points to share The beginning should capture your audience ndash quotes or surprising facts can work well Then introduce the outline of your presentation To close highlight your key points and any recommendations or next steps
bull Plan your presentation and practice Even the most experienced presenters practise practise and practise bull Make sure it is clear and accessible lsquoIf you canrsquot explain it simply you donrsquot understandrsquo ndash so goes the quote by Einstein
Try practising what you want to say with someone who does not know very much about the topic (a relative friend spouse or colleague) and get them to give you honest feedback
bull Stick to your time limit Find out how long you will have to speak and prepare for less time than this as it is normal to overrun Also try to keep presentations short or break it up with time for questions Donrsquot just speak non-stop at the audience ndash they will switch off
bull Find your passion Stakeholders are more likely to listen to you if you sound confident but above all interested in what you are saying
31
What not to do (common mistakes)
bull Donrsquot use your slides as a crutch Slides are there to enhance your presentation not duplicate it People canrsquot listen and read at the same time If you need to make notes donrsquot read your slides
bull Donrsquot overload your slides Avoid putting too much information on one slide Break up text with images videos or quotes Lots of studies show people respond better to visual stimuli than text (Gallo 2014) Be careful with graphs and data they can be helpful but can be difficult to read (see tips on data visualisation) Short videos can also be a good way to break up the presentation
bull Donrsquot use PowerPoint until you have a structure It pays off to spend time identifying your key messages and structuring your presentation Donrsquot start making your PowerPoint presentation until yoursquove got a proper structure in place
bull Do not assume PowerPoint is the only format There may be other formats that are more appropriate for the presenting your context and getting your message across For example Prezi is a visual tool that allows a different structure
Briefs
Briefs donrsquot replace reports as you still need to be able to provide the detailed evidence Instead briefs are a useful tool to reach specific audiences particularly when they may not have time to read the full report or just need key information They help present your findings and recommendations in a way that is digestible
The policy brief is a common form of brief used to target policy-makers It typically has four functions to explainconvey the urgency of an issue to present policy recommendations or implications on the issue to provide evidence to support the reasoning behind the brief and to point the reader to additional resources on the issue
Here are four main steps to help plan a policy brief
1 Identify the purpose and overarching message of the brief2 Determine three recommendationsimplications if relevant3 Construct a logical line of argument for making these recommendations (your results or conclusions) When you are thinking
about your line of argument you can ask what is the problem and how does my research fit into this Why is it urgenttimelyimportant Why should the target audience know more
4 Based on an understanding of the context around the issue identify one or two entry points or hooks for the message These are commonly used at the beginning of reports summaries or briefs to entice the reader into continuing to read
Data visualisation and infographics
Data visualisation the graphic representation of data or knowledge can add value to your research by (ODI internal infographic guidelines)
1 Making data or information easier to understand or compare2 Telling complex stories in a condensed and compelling way3 Drawing attention to key audiences4 Engaging a wider audience
Data visualisations showcase data or information in visual form so there are a wide variety of options that fall under this category At the simplest level a data visualisation could be a graph or chart a timeline a map or an illustration
Box 10 Pecha Kucha
Pecha Kucha means lsquochit chatrsquo in Japanese Itrsquos a presentation technique developed by two Japanese architects who felt that architects had a hard time lsquogetting to the pointrsquo Pecha Kucha presentations are 20 slides 20 seconds per slide 6 minutes 40 seconds in total
The 2020 format gives you a structure to plan your presentation You have only 20 seconds per slide before it automatically moves to the next one so it forces you to really identify the most important thing you want to say It does however take some practice and discipline Pecha Kucha presentations work best when the slides are just images with limited or no text
Watch Pecha Kucha presentations httpwwwpechakuchaorgwatch
32
Figure 5 Types of data visualisation
ODI Infographic guidelines 2
Introduction
TyTT pes of data visualisationData visualisation at ODI
Data visualisation is the graphic representationof information data or knowledge This can add value to ODIrsquos research by
bull making datainformation easierto compare and understand
bull telling complex stories in a condensed and compelling way
bull drawing attention to key messages
bull engaging a wider audience
The type of data visualisation depends on the content you are working with the desired outcomes and the target audience
This guide is for anyone involved in the process of creating or commissioninginfographics ODI infographics mustbe accurate consistent and effective
Charts and graphsCriteria data setGood for visualising and simplifying data highlighting trends andmaking comparisons
IllustrationCriteria concept idea or processGood for visualising and simplifying qualitative information
Map basedCriteria datainformation linkedto multiple locationsGood for showing geographical trendsdistribution
InfographicCriteria data set with a clear messageGood for highlighting a surprising piece of data a key message or visualising a research finding
Narrative infographicCriteria datainformation that tells a self-contained storyGood for summarising a piece ofresearch a concept or process succinctly
TimelineCriteria series of events or dataat regular time periodsGood for showing changes over time
A B
C
Source ODI infographics guidelines
Box 11 Quick tips for producing data visualisations
1 Know your audience purpose and the message2 Allow adequate time and budget3 Double check the data its interpretation and sources4 Keep it simple
If you donrsquot have in-house expertise or budget to commission something here are a few tools you could try
bull Picktochart ndash a tool to develop charts and infographics (wwwpiktochartcom) bull Google Fusion tables ndash a tool to turn data into charts or maps bull Datawrapper ndash helps you create maps and charts (wwwdatawrapperde) bull Tiki-toki ndash helps you develop timelines (wwwtiki-tokicom) bull Ttdatavis ndash resources and tools for data visualisation creation (wwwttdatavisonthinktanksorgdata-visualisation-resources)
According the UK Office for National Statistics an infographic is lsquoa self-contained visual story presenting information data or knowledge with clear meaning and context and without biasrsquo (Office for National Statistics nd) Infographics use visuals to tell a story or relay a key message
The type of data visualisation you use depends on the content yoursquore working with and the desired impact and target audience
MODULE 6
MONITORING AND LEARNING
34
There has been discussion lsquoabout the link between underpinning research and impact and the need to articulate this link in the impact case studiesrsquo as the links between research and impact were sometimes lsquotenuousrsquo (Manville et al 2015) Putting in place simple monitoring mechanisms early on can help pin down these links even over the longer term Also ensuring there is evidence to underpin the narrative in case studies is critical as lsquothe risk of relying on narratives to assess impact is that they often lack the evidence required to judge whether the research and impact are linked appropriatelyrsquo (Penfield et al 2014)
Monitoring and learning (MampL) was therefore designed to respond to these demands MampL covers
1 Monitoring to provide the evidence to demonstrate impact2 Learning to improve what you are doing and3 Accountability to prove to different stakeholders what you
are doing is valuable
Putting simple systems in place helps you prepare for unanticipated opportunities a plan allows you to emphasise reflection and aims to identify and respond to unanticipated opportunities that arise during the research You can include space and funding for events if necessary for reflection for the research team as a group or as individuals during the research with research users if helpful
An MampL framework helps you outline the planning and management of associated activities including timing personnel skills budget deliverables and feasibility and it describes the system for doing this It outlines (1) what is to be monitored (2) how the monitoring will be conducted (3) who is responsible for what (4) when will the monitoring take place (ongoing andor at key intervals) and (5) the resources required
This module outlines
1 Six levels of monitoring2 Gathering and generating evidence3 A task to develop an MampL framework4 Methods for capturing impact
Six levels of monitoring
Six levels of monitoring are strategy and direction management outputs uptake outcomes and impact and context ndash see Box 12 (Pasanen and Shaxson 2016) It may be that not each of these needs equal emphasis for example it may be that management systems could be lighter but there may be more emphasis on outputs such as journal articles The six levels offer guidance on developing indicators and specific monitoring tools that can be considered at each level and provide a useful check to ensure nothing has been overlooked
Gathering and generating evidence
As well as gathering evidence as it arises (this is much easier than trying to find it much later when for example people may have changed positions) it may be necessary to generate evidence We talk about each of these here
Take-away messages
bull Thinking about what information is required and for what purpose who will use the information and how often where it can be found will help determine resource needs for collecting data and what gaps exist
bull It may be necessary to gather and generate evidence
Box 12 Six levels for monitoring strategy and management
1 Strategy and direction the basic plan the research projectprogrammeorganisation is following in order to reach its intended goals
2 Management the systems and processes the projectprogrammeorganisation has in place to ensure the overall strategy is carried out and high-quality policy research is produced (eg systems of peeruser review quality assurance planning cycles etc)
3 Outputs the tangible goods and services a research projectprogrammeorganisation produces (eg working papers journal articles policy briefs website meetings events networks etc)
4 Uptake direct responses to the research projectprogrammeorganisation (eg its research is mentioned in a government policy paper on a range of websites referred to in a newspaper article etc)
5 Outcomes and impact changes in behaviour knowledge policies capacities andor practices that the research has contributed to directly or indirectly (eg a change in government policy implementation improved businesses etc)
6 Context changes in the political economic and organisational climate that have an impact on plans These are exogenous and cannot be expected to be influenced by the project or organisation however they will have an important impact on how things work and what is possible
Source Pasanen and Shaxson (2016)
35
Gathering evidence
You have identified the areas where you need to collect data by developing your progress markers and associated indicators from Module 4 Starting with these ensures the information gathered will be directly applicable to monitoring performance A good performance question for each level of the objective hierarchy outlines the questions you would need to answer to know the extent to which you are achieving the objective and to explain the success or failure of actual results
In response to these decide what information is required who will use the information where it can be found and how often You can then identify data sources for your indicators Some may be collected at regular intervals such as at the end of a research phase through a six-monthly download or through citation figures others may be collected on an ad hoc basis through a feedback log (Box 13) Then determine who is responsible for collecting these data and how they will report (where to whom and for impact learning or accountability purposes) Alongside this note any areas where you need more resources or inputs
Generating evidence
It may be necessary to purposefully produce evidence for example by conducting a survey or requesting testimonies Survey Monkey or SurveyGismo could be used to conduct an online survey although be prepared for response rates as low as 10 Following up with contacts to request testimonies is likely to elicit a higher response although the content will be specific to the involvement of the respondent It is worth investing time in carefully considering the questions you ask to ensure the replies provide useful evidence to support the demonstration of impact Asking a question that will provide specific feedback on the anticipated future impact could be particularly useful When seeking testimonies open questions are most useful It may be that an initial contact by the researcher that is directly followed up by support staff would elicit a fuller response
Box 13 A feedback log
A feedback log is a simple way to systematically record reports of the impact you are having You can then analyse the records to understand the nature of the work you are doing and how others perceive it The log is simple it is easy for others to contribute to requires minimum effort to maintain and can be easily used to demonstrate the work you do
The type of information you collect can cover a range of outreach activities or it can focus on particular areas To record impact you can simply forward emails to the log The unstructured nature of this approach makes it very easy to submit evidence of the uptake of research outputs and feedback from audiences but it does require a little effort to maintain for example to compile into an Excel spreadsheet or table and to systematically use the data in reports
36
TASK develop a MampE framework
Complete the table below by indicating the priority purposes of the monitoring and describing where and when information is needed and who needs to be involved
Short description of the policy-influencing goal and outline strategy
Purpose of the monitoring Priority What information is needed Who will use the information When is the information needed
Being financially accountable
Improving researchproject operation
Adjusting strategy
Strengthening capacity
Understanding the context
Deepening understanding
Building and sustaining trustpartnerships
Lobbying and advocacy
Determine which if any data are necessary to provide a picture at the start of the research Identifying these baseline data will make it easier to demonstrate the impact of the research on any improvements
It is useful to circulate and obtain comments on your framework from stakeholders and those who will be involved in data collection This will help identify any gaps or challenges that might arise during implementation
Methods for capturing impact
A possible low-intensity approach may use a combination of the following (1) monitoring planned impacts against indicators in the logframe at the end of the MampE phase (2) if available using a Social Network Map to review the number of relationships that have been strengthened over the past MampE phase and hence the current scope of your possible impact and (3) extracting examples of actual impact from your feedback logs
A possible high-intensity approach may involve collecting stories related to the research at the end of the MampE phase and going through a systematic selection process to arrive at the stories that most appropriately capture the kinds of impact for which you are aiming
Writing impact case studies
Simple clear and linear narratives scored highly in REF 2014 For example when they (1) identified a problem (2) outlined the research conducted and (3) described how the problem was alleviated (University of Cambridge nd) Impact stories are a great way to tell clear narratives This involves taking information you have gathered and generated and using it to tell a story about your impact These are sometimes called Stories of Change and the guidance has been adapted to REF impact requirements
37
Your impact case study can be structured as follows
4
A summary containing key data and outlining the impact
The problem and the context before your research started
The research conducted
Describe the nature of the research methodology and key findings
Summarise any underpinning research
Highlight collaborative work
Show you meet the qualifying criteria including publication timing and researcher location For collaborative research describe your specific contribution
1
2
3
a
b
c
d
a
b
c
d
e
4 Impact
Structure by beneficiary or impact type and explain how the beneficiaries were engaged in the research
Report systematically against your progress markers also highlighting unintended impacts
Include evidence such as quotes from interviewees and references
Report both quantitative and qualitative evidence
Clarify the contribution of the research to the impact and describe other influences upon the impact observed
38
REFERENCES AND FURTHER READINGAdemokun A Dennis A Hayter E Richards C Runceanu L-E Suliman S Kovacs M Liebnitzky J and
Cassidy C (2016) Evidence-informed policy-making toolkit Oxford INASP Available at httpswwwodiorgpublications10444-evidence-informed-policy-making-toolkit
British Academy (2016) Lord Sternrsquos review of the Research Excellence Framework A response from the British Academy London British Academy Available at httpwwwbritacacuksitesdefaultfilesBritish20Academy20Full2020Response20Lord20Stern27s20Review20of20REFpdf
Cassidy C and Ball L (2018) Communications monitoring evaluation and learning toolkit London Overseas Development Institute Available at httpswwwodiorgpublications11040-communications-monitoring-evaluation-and-learning-toolkit
DEGRP ndash DFID-ESRC Growth Research Programme (2017) lsquoProject Guidelinesrsquo London DFID- ESRC (httpdegrpsquarespacecomimpact)Du Toit A (2012) lsquoMaking Sense of Evidence Notes on the Discursive Politics of Research and Pro-Poor Policy Makingrsquo Cape Town
Institute for Poverty Land and Agrarian Studies University of the Western Cape Available at httpwwwplaasorgzasitesdefaultfilespublications-pdfPLAAS_WorkingPaper21dutoit_0pdf
Earl S Carden F and Smutylo T (2001) Outcome Mapping Ottawa International Development Research Centre Available at httpswwwidrccaenbookoutcome-mapping-building-learning-and-reflection-development-programs EPSRC (nd) lsquoPathways to Impactrsquo Engineering and Physical Sciences Research Council (httpswwwepsrcacukfunding
applicationprocesspreparingwritingresourcesimpact)ESRC (2017) lsquoDeveloping a communications and impact strategyrsquo Swindon Economic and Social Research Council (httpwwwesrcacuk
researchimpact-toolkitdeveloping-a-communications-and-impact-strategy)ESRC (2017) lsquoDeveloping Pathways to Impactrsquo Swindon Economic and Social Research Council (httpwwwesrcacukresearch
impact-toolkitdeveloping-pathways-to-impact)Farrugia P Petrisor B Farrokhyar F and Bhandari M (2010) lsquoResearch questions hypotheses and objectivesrsquo Canadian Journal of
Surgery 53(4) 278ndash281 Available at httpswwwncbinlmnihgovpmcarticlesPMC2912019b2-0530278Gallo C (2014) Talk like Ted London MacmillanGuijt I (2008) Seeking Surprise Rethinking monitoring for collective learning in rural resource management Wageningen Wageningen
University Available at httpedepotwurnl139860Hall P (1993) lsquoPolicy paradigms social learning and the state The case of economic policymaking in Britainrsquo Comparative Politics 24(3) 275ndash96Hamza-Goodacre D Jefford S and Simister N (2013) lsquoSupporting International Climate Negotiators a monitoring and evaluation
frameworkrsquo CDKN Working Paper London Climate and Development Knowledge Network Available at httpscdknorgwp-contentuploads201311CDKN_Working_Paper-ME-_Final_WEBpdf
Hearn S and Buffardi AL (2016) lsquoWhat is impactrsquo ODI Working Paper London Overseas Development Institute Available at httpswwwodiorgsitesodiorgukfilesodi-assetspublications-opinion-files10302pdf
Heath C and Heath D (2007) Made to stick why some ideas take hold and others come unstuck London Random House BooksHEFCE (2016) lsquoHow we fund researchrsquo London Higher Education Funding Council for England (httpwwwhefceacukrsrchfunding)IFC GTZ DFID (2008) Monitoring and Evaluation for Business Environment Reform A Handbook for Practitioners Investment Climate
Department Washington DC The World Bank Available at httpwwwpublicprivatedialogueorgmonitoring_and_evaluationMampE20Handbook20July2016202008pdf
Jones H and Hearn S (2009) lsquoOutcome Mapping a realistic alternative for planning monitoring and evaluationrsquo ODI Background Note London ODI Available at httpswwwodiorgsitesodiorgukfilesodi-assetspublications-opinion-files5058pdf
Jones H Jones N Shaxson L and Walker D (2012) Knowledge policy and power in international development a practical guide Bristol Policy Press
Manville C Guthrie S Hanham M-L Garrod B Sousa S Kirtley A Castle-Clarke S and Ling T (2015) Assessing impact submissions for REF 2014 An evaluation RAND SFC HEFCW and DEL Santa Monica RAND Corporation Available at httpwwwhefceacukmediaHEFCE2014ContentPubsIndependentresearch2015REFimpactsubmissionsREF_assessing_impact_submissionspdf
Office for National Statistics (nd) lsquoInfographic Guidelines Version 10rsquo London Office for National Statistics (httpsgsscivilservicegovukwp-contentuploads201212infographics-guidelinespdf)
Pasanen T and Shaxson L (2016) lsquoHow to design a monitoring and evaluation framework for a policy research projectrsquo ODI Working Paper London Overseas Development Institute Available at httpwwwodiorgpublications10284-how-design-monitoring-and- evaluation-framework-policy-research-project
Penfield T Baker MJ Scoble R and Wykes MC (2014) Assessment evaluations and definitions of research impact A review Research Evaluation 23 (1) 21ndash32 Available at httpsacademicoupcomrevarticle231212889056
RCUK (nd) lsquoESRC ndash Specific Requirementsrsquo Swindon Economic and Social Research Council (httpsje-srcukacukhandbookpagesGuidanceonCompletingaStandardGCaseforSupportandAttachmentsESRCSpecificRequirementshtm)
39
RCUK (2014a) lsquoImpact through knowledge exchange RCUK position and expectationrsquo Swindon Research Councils UK Available at httpwwwrcukacukdocumentsinnovationkeposition-pdf
RCUK (2014b) Pathways to Impactrsquo Swindon Research Councils UK (httpwwwrcukacukinnovationimpacts)REF2014 (2014) lsquoAssessment framework and guidance on submissionsrsquo (httpwwwrefacukpubs2011-02)Shaxson L (2016) lsquoAchieving Policy Impactrsquo Guidance Note London DFID-ESRC Growth Resarch Programme Available at
httpdegrpsquarespacecomimpactTsui J Hearn S and Young J (2014) lsquoMonitoring and evaluation of policy influence and advocacyrsquo ODI Working Paper 395 London
Overseas Development Institute Available at httpwwwodiorgpublications8265-gates-monitoring-evaluating-advocacyUniversity of Cambridge (nd) lsquoImpact Case Studies Lessons Learned from REF 2014rsquo Cambridge University of Cambridge
(httpwwwresearch-strategyadmincamacukfilesimpact_recommendationsv3docx) Young E and Quinn L (2012) Making research evidence matter a guide to policy advocacy in transition countries Budapest Open
Society FoundationsYoung J Shaxson L Jones H Hearn S Datta A and Cassidy C (2014) ROMA a guide to policy engagement and influence London
Overseas Development Institute Available at httpswwwodiorgsitesodiorgukfilesodi-assetspublications-opinion-files9011pdf
ODI is the UKrsquos leading independent think tank on international development and humanitarian issues
Readers are encouraged to reproduce material for their own publications as long as they are not being sold commercially As copyright holder ODI requests due acknowledgement and a copy of the publication For online use we ask readers to link to the original resource on the ODI website The views presented in this paper are those of the author(s) and do not necessarily represent the views of ODI or our partners
copy Overseas Development Institute 2018 This work is licensed under a Creative Commons Attribution-NonCommercial Licence (CC BY-NC 40)
All ODI publications are available from wwwodiorg
Overseas Development Institute203 Blackfriars Road London SE1 8NJTel +44 (0) 20 7922 0300 Fax +44 (0) 20 7922 0399
Shaping policy for development odiorg | ODIdev

4
Introduction
There are increasing demands upon researchers to define and demonstrate impact in order to secure funding for research We recognise the importance of conducting research to produce long-term contributions to the knowledge base and to intellectual conversations and our aim is not to convert you to the impact agenda However if you have picked up this guide then it is likely you are interested in influencing policy and practice with your research
The impact of research on funding takes place through two mechanisms First the REF exercise in 2014 and the forthcoming 2021 exercise directly link the assessment of impact case studies to annual Quality-Related (QR) research funding with funding bodies using it to allocate the university block grant between universities1 In 201617 the block grant was pound158 billion (HEFCE 2016) Second research councils award competitive grants on the basis of funding applications that require a Pathways to Impact statement outlining interventions that will enable your research to realise potential impact
In this introductory module we discuss different definitions of impact and the challenges of measuring it Measuring change is a challenging area for researchers As well as the complexities involved in understanding contribution and causal chains there are no standard metrics and funders often set their own measures of success For instance publication and citation data are often used as a measure of research output but they do not consider the impact research may have on policy and practice
Impact and the challenges of measuring it
What does research impact mean and how can you achieve it Just as the term lsquoimpactrsquo is being used more widely there are increasing numbers of definitions of how it can be applied2 In statistics impact is defined as the measured difference in a predefined indicator before the intervention and after the intervention3 The Development Assistance Committee of the Organisation for Economic Co-operation and Development (OECD-DAC) uses a broader definition of impact as any long-term effect whether intended unintended positive negative direct or indirect4
In the 2014 REF impact is defined as an effect on or change or benefit to the economy society culture public policy or services health the environment or quality of life beyond academia (REF2014 2014) Research Councils UK (RCUK) defines impact as academic economic and societal and highlights the importance of balancing these rather than just focusing on academic impact5 This recognises both the contribution research can make to academic advances and the more diverse ways in which research can contribute to economic performance within and outside of the UK increasing the effectiveness of public policy and improving quality of life RCUK also includes public engagement as an impact pathway see Module 5
Here we apply the Economic and Social Research Council (ESRC)-preferred definition summarised in Table 1 as this is research-focused and therefore considers the ways in which research can have an impact
1 For more information see wwwgovukgovernmentnewsgovernment-launches-review-to-improve-university-research-funding accessed 31 May 2017
2 For a summary of definitions of impact used in international development see Hearn and Buffardi (2009) httpswwwodiorgsitesodiorgukfilesodi-assetspublications-opinion-files10302pdf accessed 12 June 2017
3 For example the World Bankrsquos definition lsquothe indicator of interest with and without the intervention Y1 - Y0rsquo White (2009) www3ieimpactorgmediafiler_public20120507Working_Paper_3pdf accessed 20 May 2017
4 For examples of intended positive negative and unintended see Hearn and Buffardi (2009 p9) wwwodiorgsitesodiorgukfilesodi-assetspublications-opinion-files10302pdf also see Hearn (2016) httpwwwresearchtoactionorg201602what-do-we-mean-by-impact accessed 30 May 2017
5 For a discussion on pathways to impact see httpwwwrcukacukinnovationimpacts accessed 31 May 2017
Take-away messages
bull Start thinking about impact and how you will measure it at the start of your research This will help you understand and capture impact when it arises Also revisit your plan regularly to adjust it as necessary
bull Your role in achieving impact may not be straightforward Your influence may be direct but it may also be indirect It may be that you only contribute to broad changes
bull Assessing the context is important when considering impact Consider complexities such as unexpected impact impact over the longer term contribution and co-creation and contextual factors
5
ESRC defines impact as conceptual instrumental and capacity-building6 We include enduring connectivity to recognise that lsquoresearch does not happen in isolationrsquo ndash as achieving impact includes lsquobuilding networks of people and organisations able to understand the research and make use of itrsquo during the research and after the research has ended
Table 1 Definitions of impact7
Conceptual Impacts on knowledge understanding and attitudes
Instrumental Impacts on changes in policy and practice
Capacity-building Impacts on the ability of researchers to conduct similar work in future
Enduring connectivity Impacts on the existence and strength of networks of people and organisations who understand and can make use of the research
Identifying different types of impact
Research projects may be able to demonstrate all types of impact during their lifetime but not in any predetermined proportion or order It is up to researchers to develop their argument on how to prioritise the different types of impact and how much effort to put into achieving each one This toolkit offers guidance on doing this
Identifying the type of impact you are aiming for can help in recognising when a contribution has been achieved However this early thinking perhaps as part of developing your Pathways to Impact should not be at the expense of being open to new and unexpected types of impact that may arise during the course of your research In both policy and practice it is usually impossible to predict which types of impact will be achieved and on what scale recognised in OECD-DACrsquos broad definition which includes unintended and indirect impact
Policy change impact (within RCUKrsquos economic and societal definition of impact) is often overemphasised although individual research projects are not expected to directly influence decision-making Instead research is expected to make a plausible contribution to decisions via the lsquoweb of influencersquo through which research impact can be felt (British Academy 2016)
In understanding impact it is important to consider complexities such as unexpected impact impact over the longer term contribution and co-creation and contextual factors These make measuring impact particularly challenging Indeed the 2014 REF case studies were assessed in terms of their (1) reach ndash lsquothe spread or breadth of influence or effect on the relevant constituenciesrsquo and (2) significance ndash lsquothe intensity or the influence or effectrsquo Therefore these are key elements of impact that as far as possible should be planned for and monitored during the research
Contribution
What role do you as the researcher play in achieving impact It may be that your influence is direct or it may be indirect In some cases we may be able to establish a direct link between a piece of research and a particular change as the impact may result directly from one research paper for example
However in other cases the impact may result from a body of research involving many different researchers It may be the case that the impact is not realised until sometime after the research is finalised This longer-term impact is assessed by the REF exercise as lsquohistoric evidence of impactrsquo (RCUK 2014)
Demonstrating change and the significance of the change is therefore important with proxies such as co-production being used to illustrate contribution In assessing the nature of your contribution it is helpful to systematically consider how direct or indirect the influence of your research on the impact has been and whether there are other social or cultural factors that may have played an important role It may be possible to discern the following types of contribution or influence
6 For the ESRC-preferred definitions of impact see wwwesrcacukresearchimpact-toolkitwhat-is-impact accessed 30 May 2017
7 These come from ESRC-preferred definitions of impact as set out in Meagher L (2012) lsquoRELU societal and economic impact evaluationrsquo Evaluation prepared by Technology Development Group (mimeo) (wwwreluacukresearchInnovation20in20Prog20ManagementRelu_Impact_Evaluation_Final_Report_tcm8-22271[1]pdf) The fifth category used to evaluate RELU fostering interdisciplinarity is not used here as it is not a focus of impact in REF
6
bull lsquoDirect attributable impactsrsquo such that without the research there would have been no impact bull lsquoPlausible and distinct contributions to sustainable changersquo such that there has been a plausible contribution to lasting change and your
contribution can be distinguished from other contributions (see Pasanen and Shaxson 2016) bull lsquoPlausible and indistinct contributionsrsquo where it is not possible to separate the contribution of your research from other influences yet
its influence is likely to be merged with others and so therefore contributes to the combined impact
Contextual factors
Impact through the production of evidence does not take place through a neutral bureaucratic process of identifying and implementing a lsquobest practicersquo option Decision-making processes are affected by the context in which they take place how different stakeholders use evidence to inform their positions how they relate to each other and how evidence is brokered between them (Jones et al 2012)
Du Toit (2012) points out that it is not simply about providing evidence it is about ensuring these rigorous analyses inform goals strategy policy design and implementation by adding value to what is already being done lsquoPro-poor policy interventions take place in complex dynamic open social systemsrsquo (ibid p3) and they are generally implemented via messy partnerships (Guijt 2008) Hearn and Buffardi (2016) present dimensions of impact to arrive at a contextually appropriate understanding
Some factors to consider when assessing the context specific to each research project include the following (Table 2)
Table 2 Assessing the context
1 Who are the key policy actors and decision-makers in the field
2 Is there a demand for research and new ideas among these actors
3 What are the sources of resistance to evidence-based policy-making
4 What is the policy environment
1 What are the policy-making structures
2 What are the policy-making processes
3 What is the relevant legalpolicy framework
4 What are the opportunities and timing for input into formal processes
5 How do global national and local political social and economic structures and interests affect the room for manoeuvre of policy-makers
6 Who shapes the aims and outputs of policies
7 How do assumptions influence policy-making To what extent are decisions routine incremental fundamental or emergent and who supports or resists change
Planning for impact
It is important to understand the likely impact of research at an early stage by developing a Pathways to Impact statement as it helps in understanding lsquowhat you will do and how you will act to enable your research to connect with others and make a difference conceptually and instrumentallyrsquo (ESRC 2017) It is also an important requirement of funding as lsquoResearch Councils require academics to consider the future impact of research at the point of applying for fundingrsquo (RCUK 2014b) Describing your Pathways to Impact is a requirement for the vast majority of funding proposals and even in the exceptional cases where it is not required the lsquoPathways to Impact statement should be used to fully justify the reasons why this is not possiblersquo (ESRC 2017)
This is not to suggest that the expected impact will remain constant throughout the research rather it should be updated and adapted as the context changes and the research trajectory unfolds Indeed research councils (RCs) lsquorecognise the emergent and long-term nature of research and of research outcomesrsquo and seek to support flexibility and autonomy in lsquoproject definition management collaboration participation promotion and the communication of research outputsrsquo (RCUK 2014a)
7
TASK understanding impact in your research project
Time 10ndash20 minutes
Resources 1 x flip chart paper and pen per group
Purpose To start thinking about what impact means for your research project
Activity In your research team consider the following questions
1 What do you understand by impact
2 What does impact mean for your research
3 How does your organisation define or understand impact
4 What are the differences between each of these
5 Are these definitions written down or discussed
Notes
MODULE 2
IDENTIFYING YOUR IMPACT OBJECTIVE
9
lsquoImpact objectives revolve around getting your research known and used amongst those who can benefit most from itrsquo (ESRC 2017)
To have impact with your research you need to be clear about what sort of change you want to see and what lsquoimpactrsquo means for your research An impact objective is a statement of how you intend to do this and it is required by the Pathways to Impact statement and the impact summary in which you need to outline who will benefit from the research and how This will also help define a good research communications strategy to ensure messages from research reach those who can make a difference throughout the decision-making processes It will determine the types of evidence you will collect during the research and implementation of the communications strategy and in turn the monitoring of impact will inform the writing of the impact case study for REF 2021
To identify your impact objective it is important to situate your research within a broader policy context A good impact-oriented objective should be clear about why the changes you are proposing are important who they affect what needs to be done about it and where you stand in relation to others who are also trying to bring about change (adapted from ROMA Young et al 2014)
In this module we provide guidance on determining your impact objective considering what you can reasonably expect to be able to influence and how you may achieve such influence
Take-away messages
bull Developing an impact objective helps you be clear about the change you are aiming for and what lsquoimpactrsquo means for you This will guide your communications strategy and the evidence you need to collect
bull Most research is done in collaboration with others Building the capacity of others along the way may involve working in partnership or as part of a coalition
bull Having a good understanding of the wider policy context is necessary before you can formulate your impact objective
Figure 1 Sphere of influence
Outputsinputs
activities
Sphere ofCONTROL
Sphere ofINFLUENCE
Sphere ofCONCERN
Outcomeschanges inbehaviour
Impactand
context
Box 2 The importance of collaboration
Most research is done in collaboration with others and particularly in international development there is a desire to build your partnersrsquo capacity along the way This may involve working in partnership or as part of a coalition ndash particularly if you are working on a complex problem that involves a large number of actors
The process of working together will involve discussions about objectives aims and terminology These may highlight different values language and assumptions partners have
This process brings those involved together by developing a commitment to common values rather than tightly defined objectives This helps provide the flexibility to navigate the implementation path and observe impact as it arises particularly where it may differ from the type of impact originally expected The initial objective for the coalition therefore should be quite broad leaving room for each coalition partner to formulate sub-objectives that better reflect their particular goal and anticipated impact
Source Young et al (2014)
10
What you can reasonably expect to influence
The sphere of influence framework is useful to determine what is and what is not within our power to influence It originates from Outcome Mapping (OM) developed by Sarah Earl Fred Carden and Terry Smutylo from the International Development Research Centre (Earl et al 2001) OM is a way of planning international development work and measuring its results It is concerned with results ndash or lsquooutcomesrsquo ndash that fall strictly within the programmersquos sphere of influence The focus is on changes in behaviour relationships actions and activities of the people groups and organisations you work with directly (Young et al 2014)8
Inputs activities or outputs within the sphere of control are those where we have complete control over our actions The sphere of influence is where events are not completely in our control but where we do have the power to change the outcomes (Tsui et al 2014) On the other hand the sphere of concern focuses on events occurring over which we have no control They often represent actions taken by others or the results of a cascading set of external factors Although this is where the results that really matter lie (such as better education quality health care secure livelihoods) to have an influence in this sphere you have to work with others Results within the sphere of control and sphere of influence are those that you can measure and can use to guide your strategy and engagement plan (Young et al 2014)
Table 3 FINER criteria for a good research question
F Feasible bull Adequate number of subjects bull Adequate technical expertise
bull Affordable in time and money
bull Manageable in scope
I Interesting bull Getting the answer intrigues investigator peers and community
N Novel bull Confirms refutes or extends previous findings
E Ethical bull Amenable to a study that institutional review board will approve
R Relevant bull To progressing knowledge in your field bull To policy development
bull To future research
Source Adapted from Hulley et al (2007) cited in Farrugia et al (2010)
8 For more information visit the OM Learning Community wwwoutcomemappingca
Box 4 Grounding your impact objective in the context
A relevant impact objective should be appropriate to the wider policy context Therefore having a good understanding of the wider policy context is necessary before you can formulate your impact objective Understanding the context includes not just the nature of the problem but also the direction that current policy is taking (which may be no direction at all) or it may be that there are competing policy directions (eg from different political parties) that need to be considered
Box 3 The results chain
Research councils recognise that it is important to capture the outputs outcomes and impact of the research they fund to demonstrate the wider value of the research to the UK society and economy (RCUK 2014)
The lsquoresults chainrsquo refers to the order in which results arise starting with activities and inputs that produce outputs which in turn lead to outcomes Outcomes can be described as lsquointermediatersquo and either lsquofinalrsquo or lsquolonger termrsquo These interact with contextual features to produce impacts the figure below illustrates the order
Figure 2 The results chain
Activitiesinputs Outputs Outcomes Impacts
Source Young et al (2014)
11
TASK identify your impact objective
Time 20ndash40 minutes
Resources 1 x flip chart paper and pen per group
Purpose To develop a clear and concise impact objective
Activity In your research team answer these seven questions
1 What is your research question andor hypothesis
See Table 3 for guidance on developing a strong research question
2 What wider policy problem or issue does this feed into
For example if your research is on youth perceptions on agriculture in eastern Uganda the wider policy problem may be youth unemployment in the region
3 How can your research contribute to understanding or solving this problem or issue
What information or perspective will your research bring to light What influence do you expect this to have Will you engage or encourage participation from local stakeholders
4 Who will benefit from this research How will they benefit Rather than just listing stakeholders or making broad statements about how your research will lsquoprovide new insightsrsquo or lsquoincrease understandingrsquo the purpose of this exercise is to dig deeper How will new insights or greater understanding make a difference to peoplersquos lives Will the research achieve this by engaging with local stakeholders For example a greater understanding of how young people perceive agriculture in eastern Uganda may help policy-makers create policies that incentivise young people to access available jobs in agriculture ndash this will help young people build a sustainable livelihood and feed their families
5 What is your high-level impact objective
This is the ultimate impact objective you would like to see the research achieve This may take place beyond the end of the research and it may be outside your sphere of influence Critically think about this and how you may need to adjust it to reflect your responses to questions 1ndash4 It could be that you have more than one high-level impact objective
6 What are your impact objectives within your sphere of influence
Examples may be to build awareness of the research among a target audience secure the commitment of a target group of stakeholders to the research aims influence specific policies or policy-makers on key aspects or encourage participation among researchers or partner bodies (ESRC 2016)
7 What would you point to to indicate that change has happened and that your research has made a difference
What observable changes among these groups might you see Is it plausible that your research has contributed to these Think about this for your impact objectives both within your sphere of influence and for high-level impacts
Notes
MODULE 3
STAKEHOLDER MAPPING
13
Stakeholder mapping has various uses in developing effective Pathways to Impact and for putting in place an effective strategy for achieving impact It can be used to identify
bull research users to consult during the research planning stage to discuss the role they may play in planning the research such as co-investigators
bull opportunities for building strategic partnerships and strengthening relationships bull and actively engage relevant users of research and stakeholders at appropriate stages
Developing maps of how well the various stakeholders are aligned with the research and the degree of interest they have in the issue is a valuable exercise Building relationships and partnerships can greatly enhance the quality of research and can enhance impact as these stakeholders may influence change
An Alignment Interest and Influence Matrix (AIIM) can help ensure you consider the full range of stakeholders who may be influenced by your research in some way It is a simple stakeholder mapping tool with three dimensions the degree of interest in the research topic the degree of alignment with the thrust of the research and the degree of influence they have within the policy-making process
Stakeholder mapping is best done in a group so you can draw out discussions and perspectives around who may be interested in your work and who you need to reach to achieve your impact objective
14
Box 5 Alignment interest influence
Definitions
Alignment is the research likely to lead to policy the stakeholders broadly agree with Do they share the same sense of potential importance and agree with your approach
Interest are they interested in the issue your research is addressing Are they committing resources to the issue Do they want change Are they speaking about the issue
Influence how important are they to making change happen Are they in a position of authority Can they put pressure on a decision-maker
Groupings
Top right quadrant stakeholders in this quadrant are both interested in your issue and aligned with your approach These people are your collaborators and allies You may want to lsquowork in partnershiprsquo with this group Perhaps you could form a community of practice or set up meetings with key organisations or individuals to share ideas or coordinate activities
Top left quadrant stakeholders in this quadrant agree with your approach but they are not interested or prioritising the issue This could be for several reasons ndash they may not know much about the issue have limited capacity or have competing priorities If there are influential stakeholders in this group start to think about how you can develop their interest or capacity to get involved
Bottom right quadrant stakeholders in this quadrant are interested and perhaps active in your issue area but they donrsquot agree with your approach or position If you need to get stakeholders from this group on board yoursquoll need to challenge their current thinking and persuade them of your position Evidence usually works best for this group Working through champions who are aligned with your position can also be effective
Bottom left quadrant stakeholders in this quadrant do not know much about the project or if they do they are not very interested and probably do not agree with your views If they are not influential in your projectrsquos success you may prefer to ignore them as a group Ultimately you cannot do everything and may need to focus your energies on the actors in the other three quadrants It may also be hard to know who these actors are because they might not even be known to you If they are potentially influential you may need to just monitor them to ensure that they donrsquot move into another quadrant and start to cause your project harm
WORK IN PARTNERSHIP
CHALLENGE OR PERSUADE
IGNOREOR MONITOR
DEVELOP INTEREST OR CAPACITY
High alignment with approach
Low alignment with approach
High interest orengagement in issues
Low interest or engagement in issues
Source Young et al (2014)
15
TASK map your stakeholders
To get the most out of this activity it is best to do it as a group exercise either with your immediate team or with those working closely with you If possible have a good variety of people in the group including research communications and monitoring and evaluation staff or the implementation team The greater the range of people the more detailed your analysis will be If your group is larger than eight people it may be helpful to allocate someone the role of facilitator
Time 60 minutes
Resources 1 x flip chart paper marker pen up to 20 sticky notes per group
Purpose To identify
bull research users to consult during the research planning stage
bull opportunities for building strategic partnerships and strengthening relationships
bull relevant users of research and stakeholders
Activity 1 Place the flip chart paper on the wall or in the middle of the table and draw the matrix Write your policy objective at the top of the page
2 For your policy objective list all the stakeholders you can think of Write them down on the sticky notes (one per note) Be specific and refer to different individuals or teams rather than just saying the Ministry of Agriculture This is important as different teams may have different positioning
3 Select those stakeholders who have the highest or the lowest interest or alignment
4 Take turns to place the sticky notes on the matrix placing the notes for the four stakeholders that are at the most extreme points so most interestedmost aligned least interestedleast aligned most interestedleast aligned etc This allows an analysis of their relative rather than absolute levels and prevents all stakeholders being concentrated in the top right hand corner of the matrix
5 As you place the sticky notes explain to the group why you are placing the stakeholder in that position Discuss whether people agree or not Remember you can have more than one sticky note per organisation if an individual or team has a different degree of interest alignment or influence separate them out
6 Add dots to the sticky notes to show how influential the stakeholder is to the success of your research Add three dots if they have a lot of power or influence two dots for reasonable influence one dot for minimal influence and no dots for no influence This will help you prioritise your efforts and resources later on
7 Once all stakeholders are on the matrix start to look at the groupings Refer to Box 5 Alignment interest influence matrix ndash groupings Look at the individuals and groups that are most influential to you Are they where you want them to be on the matrix If not use the pens to draw arrows to where you would like them to move to
8 Now add a lsquotickrsquo to any sticky note you have already had contact with or have access to
9 Think about what strategies you may want to implement to respond to your findings
Notes
16
Box 6 AIIM in action
An AIIM analysis was conducted to support the objective of passing legislation that supports mothers to breastfeed for up to two years in Indonesia This highlighted which stakeholders could be most effectively worked with and those whose perspectives were conflicting ndash for example stakeholders supporting the supply of powdered milk instead of encouraging mothers to breastfeed Other stakeholders changed their position on the matrix at different stages of policy implementation For example parts of the government supported breastfeeding after the legislation was passed but were not active in supporting the legislation to be enacted at the district level
Figure 3 Example of an AIIM map in action
Source The regional pastoralist livelihoods advocacy project June 2008 London ODI
MODULE 4
DEVELOPING A THEORY OF CHANGE
18
Outlining a Pathway to Impact involves understanding how change can come about and this in turn will underpin the changes that are captured in the impact case study
Developing a theory of change (TOC) involves refining ideas of how the research projectrsquos work with stakeholders may lead to change Such change usually happens as stakeholders engage with the research subsequently take on board the key messages and finally internalise the issues to such an extent that they can effectively act on behalf of the researchers to spread the message themselves This means developing a TOC9 There are many different types of TOC In this module we provide guidance on one that reflects the underlying Outcome Mapping-based principles of our approach
There are three steps in developing a TOC
1 Analyse the current context what are the current ideas interest groups and processes How do these influence policy-making
2 For the key stakeholders examine the changes in behaviour you woulda expect to see to indicate initial engagement with the researchb like to see to indicate that the messages are being taken on boardc love to see to indicate that the messages have been deeply internalised
3 Identify what the research project and others will do and check assumptions about how these are related
Theories of change are not static it is worth revisiting them annually or more frequently if things are changing rapidly to assess whether plans need to be revised This is particularly important for long-term research projects when there may be changes in context or partners The same three steps would be followed asking has the context changed Have the roles of key stakeholders changed and what does this mean for the changes you would expect like and love to see Does this affect what the research project does or what others will need to do to bring about change
Change does not have to be positive Interesting lessons are often learnt from recognising negative changes or where there has not been any change Often the most interesting observations and lessons result from exploring why no change or negative outcomes may have arisen If in your Alignment Interest and Influence Matrix (AIIM) yoursquove identified that a stakeholder is very interested but not aligned with your approach you may expect a backlash from them or critical comments as they disagree with your approach This may be a good thing if yoursquove anticipated it and it happens and you have a plan to deal with it then it can be framed as an expected reaction and logged as an achievement The more political the issue you are working on the more likely you are to encounter this sort of reaction Box 8 considers orders of change in terms of the link between ideas and impact in a policy context
9 What is presented here is one version of what a theory of change may be See Vogel (2012) for a comprehensive review of theories of change wwwgovukgovernmentnewsdfid-research-review-of-the-use-of-theory-of-change-in-international-development
Take-away messages
bull Theories of change are not static it is worth revisiting them at least annually to assess whether plans need to be revised
bull Change is not always positive capturing instances of no change or negative change often provides valuable insights If you succeed in anticipating a backlash or criticism then you will be armed with a response
Box 7 What is a theory of change
A TOC helps researchers conceptualise what impacts they may have and how they may be sequenced and achieved given the wider context within which the project operates In Vogel (2012) Julian Barr from Itad defines a TOC as follows
A TOC is analogous to lsquoGoogle mapsmdashthis is the territory this is how we see our bit of the territory and this is the route that we think is best to take through it (though like Google Maps we recognise there may be a couple of different routes across the territory but we have explicitly chosen one) Based on our understanding of how the territory along the road works this is how we shall approach the journey and these are some of the landmarks we expect to see along the wayrsquo
19
Step 1 Analysing the current context
This first step is often overlooked but it helps develop a good baseline and thus a more accurate analysis of how change may happen and the impacts that may be possible The depth of analysis done at this stage may range from a full-blown political economy analysis to a more focused understanding of the relationship between research evidence and policy10
The key issues to consider are
1 Knowledge and information What knowledge is currently used in debates around the policy issue For example is it knowledge from formal research from past experience perhaps published in evaluations or else taken as lsquocommon knowledgersquo is it widely shared opinions or do ideas come largely from ideologies and beliefs Which of these types of knowledge dominates
2 Actors and stakeholders Whose voices are the strongest in debates Whose evidence is currently seen as credible and why What networks exist between different stakeholders Are there stakeholders whose voices are marginalised Who decides what knowledge counts who arbitrates between contrary facts and opinions
3 Knowledge intermediaries Are there actors who broker debates bringing new ideas into the discussions synthesising evolving understanding and communicating with stakeholders Are there other active brokers such as lobby groups civil society organisations or press and the media who actively participate in debates around the issue
For all of these three issues consider the processes through which impact can take place For instance how does knowledge circulate Is it written down is it oral Is it public or do critical debates and decisions take place in private networks behind closed doors Does the political context affect how knowledge of your issue flows around debates11
The point is to look for any major aspects of the current context that may affect how change happens particularly the sorts of changes you may want to see as a result of your research This analysis will also help you identify and capture unanticipated changes if they arise
10 See DFIDrsquos how-to note wwwgsdrcorgdocsopenPO58pdf
11 This does not necessarily mean party political issues (though could include them) it means issues where the balance of power between stakeholders is an important consideration in how they act and how they relate to each other
Box 8 How policy change happens
Orders of change were originally described by Hall (1993) to discuss the process of social learning He explores the link between ideas and impact in terms of policy-making This is most useful at the planning phase to understand how deep and transformational the impact is that you are anticipating Hall separates policy change into three levels
bull First order change focuses on incremental changes An example would be to increase the minimum labour wage in response to protests
bull Second order change occurs when policy instruments are completely altered Following on with the above example the government would use a living wage instead of a minimum wage as a form of a social safety net
bull Third order change takes place when a new hierarchy of policy-making goals is created Hall calls this a lsquoparadigm shiftrsquo For example the minimum wage and the living wage policy would no longer be a priority as other goals would be a higher priority such as taking account of non-economic social contributions in assigning benefits
It is important to remember that first and second order policy changes occur in normal policy-making First and second orders of change often may not lead to the third order of policy change
However it may be that people are so resistant to change that a lsquolove to seersquo change may only be what Hall refers to as a first order change Depending on the policy context it may be sufficiently ambitious to aim for a first order change
Sources Adapted from Tsui et al (2014) and Hall (1993)
20
Step 2 Developing theories of change
We are encouraging an approach to developing theories of change based on the principles of OM (Earl et al 2001) This looks at changes in peoplersquos actions and behaviours not changes in the things that are produced It distinguishes between three different levels of change
1 Changes we would expect to see the early positive responses to your work (such as attending meetings convened by the research programme giving feedback on a publication)
2 Changes we would like to see active engagement with what you are doing (such as inviting you to attend one of their meetings asking for information on research-related issues)
3 Changes we would love to see deeper transformations in behaviour that indicate that your messages have been completely internalised (such as co-opting a collaborator onto a standing committee incorporating one or more messages from your research into a strategy document or taking a decision about resource allocation)
The lines between the different changes are blurred and it is a matter of judgement as to which change falls into which category
Figure 4 represents an example of how a research project may have outlined the expect like and love to see for one of their key stakeholders the UK Department for International Development (DFID)12
Table 4 Progress markers
Expect to see We would expect to see that the Drivers of Change conceptual framework is published in a DFID how-to note as it responds to DFIDrsquos need to identify lsquothe long term structural and institutional factors which enable or constrain reform in different countriesrsquo and lsquoto improve policy-making and programming by identifying short- and medium-term opportunities to support strategic changersquo
Like to see We would like to see the framework captured in DFIDrsquos guidance notes such that DFIDrsquos approach changes from one of providing lsquoassistance to promote particular agendas around governance growth or service deliveryrsquo to consider how to provide support taking political feasibility into account
Love to see We would love to see the framework informing DFIDrsquos white papers to allow DFID to influence others eg through membership of the OECD Development Assistance Committee
Theories of change can be presented in table form as below in Table 5 It is helpful to separate out your general statement of what the changes will look like (lsquoDepartment X begins to actively seek out emerging research resultsrsquo) from more specific indicators (lsquolocal collaborator is invited onto the standing committee for issue Xrsquo) which can be tracked Working into the specific indicators of change and ensuring their sequence is logical can be a helpful way of checking the overarching logic of the TOC
12 This comes from the REF case study on Thinking and Working Politically from the University of York available at httpimpactrefacukCaseStudiesCaseStudyaspxId=43466
Figure 4 Using Outcome Mapping to develop a theory of change
Given our understanding of the current context these are the behaviours we wouldhellip
hellipexpect to see
Early positive responsesto the research
Active engagement with the research results
Deep transformation in behaviour
helliplike to see
helliploveto see
21
It is important not to assume that all behaviours in the same category must happen at the same time across the different TOCs Change in social processes is decidedly non-linear people may block change for reasons that arenrsquot immediately clear or they may suddenly get the point as a result of several things happening simultaneously most of which are outside your control Developing different TOCs for different stakeholders helps you unpick the assumptions about how change happens Research Councils UK (RCUK) note how impact can occur at any stage of the research and often as a result of unexpected actions (RCUK 2014) Therefore continual monitoring and updating of your TOC can help capture such surprises when they arise
Table 5 An initial theory of change
General statement of change Which stakeholders are involved Specific indicators
Current context
Expect to see early positive response
Like to see active engagement
Love to see deep transformation in behaviour
Step 3 Identifying the research projects role and checking assumptions
The final step looks at the contributions to change made by the research and by others This adds on two columns The first sets out what the research will contribute the second looks at what we are assuming about how others will contribute
Table 6 A final theory of change
General statement of change
Which stakeholders are involved
Specific indicators
What will the research contribute
What will others contribute
Current context
Expect to see early positive response
Like to see active engagement
Love to see deep transformation in behaviour
Having gone through these three steps it should now be possible to revise the research projectrsquos impact pathway refining your understanding of the different types of impact your research can have being clear about the limits of your research what needs to be achieved through others developing some concrete indicators of impact including for the longer-term impacts of your research
The Climate Development Knowledge Network (CDKN) has used progress markers to develop its monitoring and learning framework based on changes in behaviour in local communities One of CDKNs main goals has been to influence countries in their climate change negotiations Table 7 shows the progress markers it developed as an example
22
Table 7 Example progress markers
Outcome challenge the programme intends to see local communities recognise the importance of and engage in the planning of resource management activities in partnership with other resource users in their region These communities have gained the trust of the other members of the partnership and the recognition of government officials so they can contribute constructively to debate and decision-making processes
They are able to clearly plan and articulate a vision of their forest management activities and goals that is relevant to their context and needs They call upon external technical support and expertise as appropriate They act as champions for model forest concepts in their communities and motivate others in the partnership to continue their collaborative work
Expect to see local communities
1 Participating in regular model forest partnership meetings
2 Establishing a structure for cooperation in the partnership that ensures that all local interests are represented (mechanics of setting up the structure)
3 Acquiring new skills for involvement in the model forest
4 Contributing the minimum human and financial resources necessary to get the model forest operational
Like to see local communities
5 Articulating a vision for the model forest that is locally relevant
6 Promoting the model forest concept and their experiences with model forests
7 Expanding the partnership to include all the main forest users
8 Calling upon external experts when necessary to provide information or meet technical needs
9 Requesting new opportunities for collaboration with other institutions and actors
10 Identifying opportunities for collaboration with other institutions and actors
11 Identifying opportunities for and successfully obtaining funding from a range of sources
Love to see local communities
12 Playing a lead role in resource management with a view to medium- and long-term benefits
13 Sharing lessons and experiences with other communities nationally and internationally to encourage other model forests
Source Hamza-Goodacre et al (2013)
MODULE 5
COMMUNICATING YOUR RESEARCH
24
Your research will only have real world impact if it reaches the right people Therefore when planning your communications itrsquos important to think beyond one-directional lsquodisseminationrsquo of research findings Communications is much broader itrsquos about engagement and knowledge exchange Research Councils UK (RCUK) defines it as a lsquomulti-way exchange of knowledge between academia and research users in business public and third sectorsrsquo (RCUK 2014)
When we talk about lsquocommunicationsrsquo we use the word in the broadest sense Communication can take many forms ndash formal and informal This includes digital engagement social media publications field visits public events emails or private meetings This takes investment lsquogrowing effective knowledge exchange with non-academic communities takes time skills confidence and moneyrsquo (ESRC 2017)
The key to any communications activity seeking to engage someone with your work is to know who you want to reach know what you want to do and work out how you want to reach them ndash this means thinking about the channels and tools you will use and to what messages they will relate
It is often assumed that communications are done at the end of a research project In fact knowledge exchange and engagement play an important role throughout the project and research lifetime Engaging audiences early in the research process can help ensure relationships have crystallised by the time you come to actually communicate your findings It also gives you more time to plan adapt and above all understand your audiences
This module covers
1 Knowing your audience2 Crafting effective messages3 Planning your outputs and activities4 Presenting your research
Step 1 Knowing your audience
The audience is (or should be) at the heart of any communication Before you can begin communicating your research you need to be clear about your aims who do you want to reach and what do you want them to do with the information Effective communication material needs to be carefully tailored and adapted for different audiences
It is helpful at this point to look back at your impact objective and reflect on the following
1 Is there a problem you are working to address2 Are you offering a solution (or several solutions)3 Are you providing new information to support others to find solutions4 What do you want your communications to achieve5 Who do you need to engage with to achieve your goal
Take-away messages
bull Think lsquoengagementrsquo not dissemination We talk a lot about research lsquodisseminationrsquo but this is one-directional and communication is much broader itrsquos about engagement and knowledge exchange
bull Donrsquot leave it to the end Communications is often left to the end of the research process but it plays a critical role throughout the projectrsquos lifetime
25
TASK identify your audiences
You will have already identified your key stakeholders and courses of action for each as part of Modules 3 and 4 of this toolkit This exercise allows you to identify your specific audiences for communications and engagement activities Remember that your audiences and communications objectives may change throughout the lifetime of your research For example at the beginning your communications may be about building partnerships and later on it may be about influencing action It is helpful to have a facilitator for this exercise
Time 60 minutes
Resources 1 x flip chart paper marker pen up to 20 sticky notes per group
Purpose To develop a clear and concise impact objective
Activity 1 Write your impact objective on a large piece of flip chart paper so everyone can see it
2 Put four sheets of flip chart paper on the wall Label the first lsquoAudiencersquo the second lsquoObjectiversquo the third lsquoMessagersquo and the fourth lsquoWhenrsquo and distribute sticky notes to participants
3 Invite participants to write a key audience on a sticky note contributing up to three each Be as specific as possible (ie rather than writing lsquopolicy-makersrsquo write lsquothe Minister of Educationrsquo)
4 Invite participants to place their sticky notes one by one on the first flip chart paper
5 Invite one or two participants to cluster the notes into groups and explain why they have chosen that particular grouping (You may also want to refer to your stakeholder maps)
6 Get into groups of three or four people and think about why you want to engage with that audience Is it to bring them on board as a partner Is it because you want them to share your research with others Or is it because you want to influence their actions with your research
7 Invite one participant from each group to add the objectives to the second flip chart paper so that they are aligned with the respective audience groups This may lead to some discussion try to reach a consensus
8 In those same groups think about what kind of information the different audiences will most likely be interested in or need Write them down on sticky notes
9 Invite each group to add their ideas to the third flip chart paper for each audience group Again this may lead to some discussion and debate among the groups try to reach a consensus
10 In the same groups think about when you will want to engage with that audience This will link to the objective for example if your objective is to build a partnership you may want to do that early in the research process You may find that you need to engage with some audiences throughout the research
Notes
26
Step 2 Crafting effective messages
Identify your key message
A strong message should be at the core of any good report presentation or other piece of communication Research frequently focuses on facts and data but it is important to explore ways to tell a story through your messaging as well Audiences from academics to decision-makers are far more likely to want to interact with new information if they can relate to it in some way
Key messages are lsquojust the tip of the icebergrsquo (Young and Quinn 2012) They are what your audience most needs to know and are supported by the main information (the rest of the iceberg) as needed If you give readers all the information in one go they are unlikely to absorb it
When planning your key messages think about your audience Who are they What sort of message do you need to communicate to them and why Thinking through several questions can help you shape the message then the channel for best conveying it
1 Who are the audience What role do they play Are they specialists in the topic or are they non-technical Are they people who you already know
2 What do they need to know What are they currently working on How can they use your information Did they ask for the information If so are you delivering what they wanted Do they need to know more
3 How do they best receive information Do you know how they tend to prefer to receive communications What has worked well in the past (and what has not) Is it better to approach them for a meeting or to send a report
Make your message stick
There are multiple ways to develop strong messages One great example is from Heath and Heath (2007) They talk about six dimensions to a good message which can be applied to all types of messaging including evidence into policy They are
Simple The best messages are always simple This does not mean dumbed down Rather you are pulling out the key message your audience needs to know Keep it concise and donrsquot over-elaborate
Unexpected If you can make people sit up and listen yoursquore more likely to have impact Counter-intuitive messages a surprising fact or a different angle can be one way to do this
Concrete Donrsquot be too abstract Make your message tangible relating to real life examples where possible For example rather than saying 25 say one in four people
Credible Your message can be clear concise and well-constructed but if it isnrsquot credible the audience is unlikely to listen Is your message backed up by evidence Is it believable
Emotional We know emotions provoke reaction Is there a way to explore emotions with your audience make them connect or care about the human story behind your research
Stories We use storytelling all the time for effective communications Can your message tell a story rather than just hard facts Whatrsquos the impact of the evidence
Next time you read a blog you find interesting or inspiring a good exercise can be to spend some time looking at how much the author uses the above dimensions when they try to convey their key messages
27
Step 3 Planning your outputs and activities
Every research project needs to think about outputs and activities While research may be published in an academic journal if you want to have an impact beyond academia you will need to think how to achieve this and explore other communication channels
Remember that effective engagement is more than one-way communication As the Engineering and Physical Sciences Research Council (EPSRC) writes lsquodone well public engagement can build trust and understanding between the research community and a wide range of groups from policy-makers through to young peoplersquo (EPSRC nd) Engaging stakeholders with your research can improve the quality of your research outputs and the impact raise your profile and develop your skills Communication activities therefore are some of the most important actions you can take to increase the impact of your research
The outputs channels and activities you use will depend on what impact you want to have who your audience is and what resources you have If you have communications support involve them in the research planning stage to help identify early on what outputs are likely to have the most impact and to make sure you have the resources to do it
Box 9 A spectrum of knowledge communication activities
This is a helpful framework to reflect on the different types of knowledge roles you can play This may change throughout your research lifetime depending on what yoursquore trying to achieve and your resources If you are clear about what your role is and what you can achieve you can then see where your limits are and where others can help
Source Shaxon L (2016)
INFORMATIONINTERMEDIARY
KNOWLEDGETRANSLATOR
KNOWLEDGEBROKER
INNOVATIONBROKER
Making information available putting research results into the public domain
Linear disseminationof knowledge from producer to user
Co-production of knowledgesocial learning and innovation
Translating research evidence for non-specialist audiences giving seminars writing policy briefs
Actively engaging in policy and practice debates taking part inmeetings matchmaking convening networking
Inuencing the wider context to reduce transaction costs and enable innovation build local capacity change incentive structures to use research
Take-away messages
bull Create packages not publications Your impact will be limited if you just produce one product you need to tailor outputs and activities for different audiences
bull Be strategically opportunistic Identify policy windows and plan your research timetable to make the most of these opportunities However unexpected or unplanned opportunities will also emerge and you need to be ready to respond
bull Donrsquot forget the messenger Sometimes you may not be the appropriate messenger For example you may not have the right profile access or skills You may need to partner up with other organisations or individuals
28
Traditionally we have always identified four key channels for communicating research ndash publications events digital and media However today the lines between these channels are very blurred as digital communications becomes increasingly central to strategies
Table 8 Example outputs channels and activities
Types of output Why use it
Written formats
Journal article It presents your full research methodology and analysis It is likely to be read by other academics or students so the language can be technical (although should always be as clear as possible)
Research report It presents your full research and evidence It is likely to have a broader audience than just other academics so it needs to provide a comprehensive and accessible overview of your research
Brief Short sharp targeted briefs can help communicate key recommendations to policy audiences
Toolkit It presents practical tools insights or experiences in a way that can be easily used or applied by other people
Blogs and op-eds They can be used to provide an accessible and engaging lsquoway inrsquo to bigger pieces of research or learning as well as reaching broader or targeted audiences
Media release Designed to communicate key information to regional national and international media outlets it may be picked up by online and print media publications Media is especially useful for reaching influential people and policy-makers as well as the general public (depending on what media outlet picks up your work)
Digital tools
Website It can provide a central platform to host resources and make your work publicly available By hosting everything in one place you can track downloads or page views and find out who is interacting with your work
Data visualisation It is used to present data visually making it easier to understand or compare to tell compelling stories or to draw attention to key messages and statistics
Online networks Tapping into existing or established online networks of people interested in research yoursquore working on is a good way to reach wider but targeted audience groups Newsletters can target a mass audience It may be far more effective to ensure your research appears in other newsletters for example a university newsletter
Email Often overlooked email plays a critical communications role A personal email from a researcher to a contact can be one of the most effective ways to share research
Events and meetings
Public events They are one of the most common ways to showcase research on a public platform They can be part of a conference a public panel or keynote event Events may be streamed online or available for users afterwards through a video or podcast
Policy dialogues They convene a range of policy stakeholders from different interest groups and with different perspectives to focus on a policy issue
Workshops They can be a good method to engage directly with key stakeholders and encourage small-group discussions
Bi-lateral meetings Meetings are one of the most common ways to engage people early on with your project and to showcase results to several key stakeholders particularly decision-makers and donors
Webinars Webinars can be a way to present new research online to audiences in different countries and particularly can encourage new learning andor guidance for users
Multimedia
Social media It allows you to reach larger networks of people who may be interested in reading or using your research This could be on Twitter LinkedIn and Facebook as well as WhatsApp and SnapChat
Multimedia This media may be better for reaching some audiences such as young people or policy-makers It can include videos podcasts and animation but also photography
Radio TV broadcast Radio and TV have enormous potential to communicate to a wide audience For example in some developing and emerging countries community radio can be a critical way to reach key audiences
29
TASK map your communications activities
This exercise builds on TASK 1 lsquoIdentify your audiencersquo In this task you will start to identify the outputs channels and activities you need to reach your priority audiences You can then determine who will do what and whether you have sufficient resources to deliver your strategy It is useful to note any capacity shortfalls you may be facing and possible interim strategies to address these Activities often take longer than you think particularly those requiring working with external actors such as developing partnerships
If you have communications teams or support it is important to include them in mapping your activities It is also important to include leadership of senior staff to draw on their experience RCUK notes lsquocommitment to include principal and senior investigator time on knowledge exchange and impact activities recognising that collaboration with users often requires a depth of experience and level of understanding of the kind held by established researchers and which complements the skills of research associatesrsquo (RCUK nd)
Time 30-40 minutes
Resources 2 x flip chart paper marker pens and sticky notes
Purpose To develop communication strategies for each audience group
Activity 1 Look back at the flip chart papers from the previous task Re-familiarise yourself with your audiences why you want to engage with them and why
2 Add a fifth flip chart to the wall titled lsquoCommunications activitiesrsquo
3 In the same groups identify what communications outputs and channels may be best to reach the different audience groups (eg a report a policy brief the media an event a face-to-face meeting email) Write these on sticky notes
4 Invite participants to add their sticky notes to the flip chart paper
5 Next think about your resources (time expertise and budget) Which of these activities are a lsquomustrsquo Which are a lsquonice to haversquo Do you have the time expertise and budget to deliver these activities
6 Take a new flip chart paper and turn it landscape Draw out the example table below (Table 9) and start filling it in
Notes
30
Table 9 Mapping activities example
Outputactivity List all planned communications outputs and activities
1 Workshop 2 Journal article 3 Policy brief
Audience Who do you want to engage with this output or activity
Ministry X Academics in X field Minister of X
Objective Why are you producing this output or carrying out the activity Relate this to your audience
To establish a relationship with the ministry to get a better understanding of the policy context for the research and to identify the ministryrsquos policy needs to inform our research question
To inform other academics working in this research area to support their work and share learning
To inform the minister of our research results ahead of its annual budget setting
Staff time required How much ndash and whose ndash staff time is realistically needed to deliver this work
15 days for lead researcher to plan facilitate and write up workshop
30 days for lead researcher to write and coordinate peer review
5 days for internal review
5 days lead researcher to write
3 days for communications support
Additional budget required What direct costs are involved Flights accommodation sustenance
Venue catering
Copy-edit
Peer review
Copy-edit
Design
Proof-reading
Deadline By when does this output or activity need to be delivered (to meet the objective and to meet your funding requirements)
End of scoping phase (day month year)
End of research phase one (day month year)
End of research phase two (day month year)
Priorityresources Is this a must have or a nice to have Again think back to your overall impact objective
Step 4 Presenting your research
Presentations
At some point during your research you are likely to need to present it ndash either formally or informally This section examines some of the ways in which you can improve your presentation skills and effectively share your key messages
Tips for presenting well
bull Be clear about the purpose and audience for the presentation This will help you focus on the information you most need to prioritise your key messages
bull Structure your presentation Can you identify one overarching message and three key points to share The beginning should capture your audience ndash quotes or surprising facts can work well Then introduce the outline of your presentation To close highlight your key points and any recommendations or next steps
bull Plan your presentation and practice Even the most experienced presenters practise practise and practise bull Make sure it is clear and accessible lsquoIf you canrsquot explain it simply you donrsquot understandrsquo ndash so goes the quote by Einstein
Try practising what you want to say with someone who does not know very much about the topic (a relative friend spouse or colleague) and get them to give you honest feedback
bull Stick to your time limit Find out how long you will have to speak and prepare for less time than this as it is normal to overrun Also try to keep presentations short or break it up with time for questions Donrsquot just speak non-stop at the audience ndash they will switch off
bull Find your passion Stakeholders are more likely to listen to you if you sound confident but above all interested in what you are saying
31
What not to do (common mistakes)
bull Donrsquot use your slides as a crutch Slides are there to enhance your presentation not duplicate it People canrsquot listen and read at the same time If you need to make notes donrsquot read your slides
bull Donrsquot overload your slides Avoid putting too much information on one slide Break up text with images videos or quotes Lots of studies show people respond better to visual stimuli than text (Gallo 2014) Be careful with graphs and data they can be helpful but can be difficult to read (see tips on data visualisation) Short videos can also be a good way to break up the presentation
bull Donrsquot use PowerPoint until you have a structure It pays off to spend time identifying your key messages and structuring your presentation Donrsquot start making your PowerPoint presentation until yoursquove got a proper structure in place
bull Do not assume PowerPoint is the only format There may be other formats that are more appropriate for the presenting your context and getting your message across For example Prezi is a visual tool that allows a different structure
Briefs
Briefs donrsquot replace reports as you still need to be able to provide the detailed evidence Instead briefs are a useful tool to reach specific audiences particularly when they may not have time to read the full report or just need key information They help present your findings and recommendations in a way that is digestible
The policy brief is a common form of brief used to target policy-makers It typically has four functions to explainconvey the urgency of an issue to present policy recommendations or implications on the issue to provide evidence to support the reasoning behind the brief and to point the reader to additional resources on the issue
Here are four main steps to help plan a policy brief
1 Identify the purpose and overarching message of the brief2 Determine three recommendationsimplications if relevant3 Construct a logical line of argument for making these recommendations (your results or conclusions) When you are thinking
about your line of argument you can ask what is the problem and how does my research fit into this Why is it urgenttimelyimportant Why should the target audience know more
4 Based on an understanding of the context around the issue identify one or two entry points or hooks for the message These are commonly used at the beginning of reports summaries or briefs to entice the reader into continuing to read
Data visualisation and infographics
Data visualisation the graphic representation of data or knowledge can add value to your research by (ODI internal infographic guidelines)
1 Making data or information easier to understand or compare2 Telling complex stories in a condensed and compelling way3 Drawing attention to key audiences4 Engaging a wider audience
Data visualisations showcase data or information in visual form so there are a wide variety of options that fall under this category At the simplest level a data visualisation could be a graph or chart a timeline a map or an illustration
Box 10 Pecha Kucha
Pecha Kucha means lsquochit chatrsquo in Japanese Itrsquos a presentation technique developed by two Japanese architects who felt that architects had a hard time lsquogetting to the pointrsquo Pecha Kucha presentations are 20 slides 20 seconds per slide 6 minutes 40 seconds in total
The 2020 format gives you a structure to plan your presentation You have only 20 seconds per slide before it automatically moves to the next one so it forces you to really identify the most important thing you want to say It does however take some practice and discipline Pecha Kucha presentations work best when the slides are just images with limited or no text
Watch Pecha Kucha presentations httpwwwpechakuchaorgwatch
32
Figure 5 Types of data visualisation
ODI Infographic guidelines 2
Introduction
TyTT pes of data visualisationData visualisation at ODI
Data visualisation is the graphic representationof information data or knowledge This can add value to ODIrsquos research by
bull making datainformation easierto compare and understand
bull telling complex stories in a condensed and compelling way
bull drawing attention to key messages
bull engaging a wider audience
The type of data visualisation depends on the content you are working with the desired outcomes and the target audience
This guide is for anyone involved in the process of creating or commissioninginfographics ODI infographics mustbe accurate consistent and effective
Charts and graphsCriteria data setGood for visualising and simplifying data highlighting trends andmaking comparisons
IllustrationCriteria concept idea or processGood for visualising and simplifying qualitative information
Map basedCriteria datainformation linkedto multiple locationsGood for showing geographical trendsdistribution
InfographicCriteria data set with a clear messageGood for highlighting a surprising piece of data a key message or visualising a research finding
Narrative infographicCriteria datainformation that tells a self-contained storyGood for summarising a piece ofresearch a concept or process succinctly
TimelineCriteria series of events or dataat regular time periodsGood for showing changes over time
A B
C
Source ODI infographics guidelines
Box 11 Quick tips for producing data visualisations
1 Know your audience purpose and the message2 Allow adequate time and budget3 Double check the data its interpretation and sources4 Keep it simple
If you donrsquot have in-house expertise or budget to commission something here are a few tools you could try
bull Picktochart ndash a tool to develop charts and infographics (wwwpiktochartcom) bull Google Fusion tables ndash a tool to turn data into charts or maps bull Datawrapper ndash helps you create maps and charts (wwwdatawrapperde) bull Tiki-toki ndash helps you develop timelines (wwwtiki-tokicom) bull Ttdatavis ndash resources and tools for data visualisation creation (wwwttdatavisonthinktanksorgdata-visualisation-resources)
According the UK Office for National Statistics an infographic is lsquoa self-contained visual story presenting information data or knowledge with clear meaning and context and without biasrsquo (Office for National Statistics nd) Infographics use visuals to tell a story or relay a key message
The type of data visualisation you use depends on the content yoursquore working with and the desired impact and target audience
MODULE 6
MONITORING AND LEARNING
34
There has been discussion lsquoabout the link between underpinning research and impact and the need to articulate this link in the impact case studiesrsquo as the links between research and impact were sometimes lsquotenuousrsquo (Manville et al 2015) Putting in place simple monitoring mechanisms early on can help pin down these links even over the longer term Also ensuring there is evidence to underpin the narrative in case studies is critical as lsquothe risk of relying on narratives to assess impact is that they often lack the evidence required to judge whether the research and impact are linked appropriatelyrsquo (Penfield et al 2014)
Monitoring and learning (MampL) was therefore designed to respond to these demands MampL covers
1 Monitoring to provide the evidence to demonstrate impact2 Learning to improve what you are doing and3 Accountability to prove to different stakeholders what you
are doing is valuable
Putting simple systems in place helps you prepare for unanticipated opportunities a plan allows you to emphasise reflection and aims to identify and respond to unanticipated opportunities that arise during the research You can include space and funding for events if necessary for reflection for the research team as a group or as individuals during the research with research users if helpful
An MampL framework helps you outline the planning and management of associated activities including timing personnel skills budget deliverables and feasibility and it describes the system for doing this It outlines (1) what is to be monitored (2) how the monitoring will be conducted (3) who is responsible for what (4) when will the monitoring take place (ongoing andor at key intervals) and (5) the resources required
This module outlines
1 Six levels of monitoring2 Gathering and generating evidence3 A task to develop an MampL framework4 Methods for capturing impact
Six levels of monitoring
Six levels of monitoring are strategy and direction management outputs uptake outcomes and impact and context ndash see Box 12 (Pasanen and Shaxson 2016) It may be that not each of these needs equal emphasis for example it may be that management systems could be lighter but there may be more emphasis on outputs such as journal articles The six levels offer guidance on developing indicators and specific monitoring tools that can be considered at each level and provide a useful check to ensure nothing has been overlooked
Gathering and generating evidence
As well as gathering evidence as it arises (this is much easier than trying to find it much later when for example people may have changed positions) it may be necessary to generate evidence We talk about each of these here
Take-away messages
bull Thinking about what information is required and for what purpose who will use the information and how often where it can be found will help determine resource needs for collecting data and what gaps exist
bull It may be necessary to gather and generate evidence
Box 12 Six levels for monitoring strategy and management
1 Strategy and direction the basic plan the research projectprogrammeorganisation is following in order to reach its intended goals
2 Management the systems and processes the projectprogrammeorganisation has in place to ensure the overall strategy is carried out and high-quality policy research is produced (eg systems of peeruser review quality assurance planning cycles etc)
3 Outputs the tangible goods and services a research projectprogrammeorganisation produces (eg working papers journal articles policy briefs website meetings events networks etc)
4 Uptake direct responses to the research projectprogrammeorganisation (eg its research is mentioned in a government policy paper on a range of websites referred to in a newspaper article etc)
5 Outcomes and impact changes in behaviour knowledge policies capacities andor practices that the research has contributed to directly or indirectly (eg a change in government policy implementation improved businesses etc)
6 Context changes in the political economic and organisational climate that have an impact on plans These are exogenous and cannot be expected to be influenced by the project or organisation however they will have an important impact on how things work and what is possible
Source Pasanen and Shaxson (2016)
35
Gathering evidence
You have identified the areas where you need to collect data by developing your progress markers and associated indicators from Module 4 Starting with these ensures the information gathered will be directly applicable to monitoring performance A good performance question for each level of the objective hierarchy outlines the questions you would need to answer to know the extent to which you are achieving the objective and to explain the success or failure of actual results
In response to these decide what information is required who will use the information where it can be found and how often You can then identify data sources for your indicators Some may be collected at regular intervals such as at the end of a research phase through a six-monthly download or through citation figures others may be collected on an ad hoc basis through a feedback log (Box 13) Then determine who is responsible for collecting these data and how they will report (where to whom and for impact learning or accountability purposes) Alongside this note any areas where you need more resources or inputs
Generating evidence
It may be necessary to purposefully produce evidence for example by conducting a survey or requesting testimonies Survey Monkey or SurveyGismo could be used to conduct an online survey although be prepared for response rates as low as 10 Following up with contacts to request testimonies is likely to elicit a higher response although the content will be specific to the involvement of the respondent It is worth investing time in carefully considering the questions you ask to ensure the replies provide useful evidence to support the demonstration of impact Asking a question that will provide specific feedback on the anticipated future impact could be particularly useful When seeking testimonies open questions are most useful It may be that an initial contact by the researcher that is directly followed up by support staff would elicit a fuller response
Box 13 A feedback log
A feedback log is a simple way to systematically record reports of the impact you are having You can then analyse the records to understand the nature of the work you are doing and how others perceive it The log is simple it is easy for others to contribute to requires minimum effort to maintain and can be easily used to demonstrate the work you do
The type of information you collect can cover a range of outreach activities or it can focus on particular areas To record impact you can simply forward emails to the log The unstructured nature of this approach makes it very easy to submit evidence of the uptake of research outputs and feedback from audiences but it does require a little effort to maintain for example to compile into an Excel spreadsheet or table and to systematically use the data in reports
36
TASK develop a MampE framework
Complete the table below by indicating the priority purposes of the monitoring and describing where and when information is needed and who needs to be involved
Short description of the policy-influencing goal and outline strategy
Purpose of the monitoring Priority What information is needed Who will use the information When is the information needed
Being financially accountable
Improving researchproject operation
Adjusting strategy
Strengthening capacity
Understanding the context
Deepening understanding
Building and sustaining trustpartnerships
Lobbying and advocacy
Determine which if any data are necessary to provide a picture at the start of the research Identifying these baseline data will make it easier to demonstrate the impact of the research on any improvements
It is useful to circulate and obtain comments on your framework from stakeholders and those who will be involved in data collection This will help identify any gaps or challenges that might arise during implementation
Methods for capturing impact
A possible low-intensity approach may use a combination of the following (1) monitoring planned impacts against indicators in the logframe at the end of the MampE phase (2) if available using a Social Network Map to review the number of relationships that have been strengthened over the past MampE phase and hence the current scope of your possible impact and (3) extracting examples of actual impact from your feedback logs
A possible high-intensity approach may involve collecting stories related to the research at the end of the MampE phase and going through a systematic selection process to arrive at the stories that most appropriately capture the kinds of impact for which you are aiming
Writing impact case studies
Simple clear and linear narratives scored highly in REF 2014 For example when they (1) identified a problem (2) outlined the research conducted and (3) described how the problem was alleviated (University of Cambridge nd) Impact stories are a great way to tell clear narratives This involves taking information you have gathered and generated and using it to tell a story about your impact These are sometimes called Stories of Change and the guidance has been adapted to REF impact requirements
37
Your impact case study can be structured as follows
4
A summary containing key data and outlining the impact
The problem and the context before your research started
The research conducted
Describe the nature of the research methodology and key findings
Summarise any underpinning research
Highlight collaborative work
Show you meet the qualifying criteria including publication timing and researcher location For collaborative research describe your specific contribution
1
2
3
a
b
c
d
a
b
c
d
e
4 Impact
Structure by beneficiary or impact type and explain how the beneficiaries were engaged in the research
Report systematically against your progress markers also highlighting unintended impacts
Include evidence such as quotes from interviewees and references
Report both quantitative and qualitative evidence
Clarify the contribution of the research to the impact and describe other influences upon the impact observed
38
REFERENCES AND FURTHER READINGAdemokun A Dennis A Hayter E Richards C Runceanu L-E Suliman S Kovacs M Liebnitzky J and
Cassidy C (2016) Evidence-informed policy-making toolkit Oxford INASP Available at httpswwwodiorgpublications10444-evidence-informed-policy-making-toolkit
British Academy (2016) Lord Sternrsquos review of the Research Excellence Framework A response from the British Academy London British Academy Available at httpwwwbritacacuksitesdefaultfilesBritish20Academy20Full2020Response20Lord20Stern27s20Review20of20REFpdf
Cassidy C and Ball L (2018) Communications monitoring evaluation and learning toolkit London Overseas Development Institute Available at httpswwwodiorgpublications11040-communications-monitoring-evaluation-and-learning-toolkit
DEGRP ndash DFID-ESRC Growth Research Programme (2017) lsquoProject Guidelinesrsquo London DFID- ESRC (httpdegrpsquarespacecomimpact)Du Toit A (2012) lsquoMaking Sense of Evidence Notes on the Discursive Politics of Research and Pro-Poor Policy Makingrsquo Cape Town
Institute for Poverty Land and Agrarian Studies University of the Western Cape Available at httpwwwplaasorgzasitesdefaultfilespublications-pdfPLAAS_WorkingPaper21dutoit_0pdf
Earl S Carden F and Smutylo T (2001) Outcome Mapping Ottawa International Development Research Centre Available at httpswwwidrccaenbookoutcome-mapping-building-learning-and-reflection-development-programs EPSRC (nd) lsquoPathways to Impactrsquo Engineering and Physical Sciences Research Council (httpswwwepsrcacukfunding
applicationprocesspreparingwritingresourcesimpact)ESRC (2017) lsquoDeveloping a communications and impact strategyrsquo Swindon Economic and Social Research Council (httpwwwesrcacuk
researchimpact-toolkitdeveloping-a-communications-and-impact-strategy)ESRC (2017) lsquoDeveloping Pathways to Impactrsquo Swindon Economic and Social Research Council (httpwwwesrcacukresearch
impact-toolkitdeveloping-pathways-to-impact)Farrugia P Petrisor B Farrokhyar F and Bhandari M (2010) lsquoResearch questions hypotheses and objectivesrsquo Canadian Journal of
Surgery 53(4) 278ndash281 Available at httpswwwncbinlmnihgovpmcarticlesPMC2912019b2-0530278Gallo C (2014) Talk like Ted London MacmillanGuijt I (2008) Seeking Surprise Rethinking monitoring for collective learning in rural resource management Wageningen Wageningen
University Available at httpedepotwurnl139860Hall P (1993) lsquoPolicy paradigms social learning and the state The case of economic policymaking in Britainrsquo Comparative Politics 24(3) 275ndash96Hamza-Goodacre D Jefford S and Simister N (2013) lsquoSupporting International Climate Negotiators a monitoring and evaluation
frameworkrsquo CDKN Working Paper London Climate and Development Knowledge Network Available at httpscdknorgwp-contentuploads201311CDKN_Working_Paper-ME-_Final_WEBpdf
Hearn S and Buffardi AL (2016) lsquoWhat is impactrsquo ODI Working Paper London Overseas Development Institute Available at httpswwwodiorgsitesodiorgukfilesodi-assetspublications-opinion-files10302pdf
Heath C and Heath D (2007) Made to stick why some ideas take hold and others come unstuck London Random House BooksHEFCE (2016) lsquoHow we fund researchrsquo London Higher Education Funding Council for England (httpwwwhefceacukrsrchfunding)IFC GTZ DFID (2008) Monitoring and Evaluation for Business Environment Reform A Handbook for Practitioners Investment Climate
Department Washington DC The World Bank Available at httpwwwpublicprivatedialogueorgmonitoring_and_evaluationMampE20Handbook20July2016202008pdf
Jones H and Hearn S (2009) lsquoOutcome Mapping a realistic alternative for planning monitoring and evaluationrsquo ODI Background Note London ODI Available at httpswwwodiorgsitesodiorgukfilesodi-assetspublications-opinion-files5058pdf
Jones H Jones N Shaxson L and Walker D (2012) Knowledge policy and power in international development a practical guide Bristol Policy Press
Manville C Guthrie S Hanham M-L Garrod B Sousa S Kirtley A Castle-Clarke S and Ling T (2015) Assessing impact submissions for REF 2014 An evaluation RAND SFC HEFCW and DEL Santa Monica RAND Corporation Available at httpwwwhefceacukmediaHEFCE2014ContentPubsIndependentresearch2015REFimpactsubmissionsREF_assessing_impact_submissionspdf
Office for National Statistics (nd) lsquoInfographic Guidelines Version 10rsquo London Office for National Statistics (httpsgsscivilservicegovukwp-contentuploads201212infographics-guidelinespdf)
Pasanen T and Shaxson L (2016) lsquoHow to design a monitoring and evaluation framework for a policy research projectrsquo ODI Working Paper London Overseas Development Institute Available at httpwwwodiorgpublications10284-how-design-monitoring-and- evaluation-framework-policy-research-project
Penfield T Baker MJ Scoble R and Wykes MC (2014) Assessment evaluations and definitions of research impact A review Research Evaluation 23 (1) 21ndash32 Available at httpsacademicoupcomrevarticle231212889056
RCUK (nd) lsquoESRC ndash Specific Requirementsrsquo Swindon Economic and Social Research Council (httpsje-srcukacukhandbookpagesGuidanceonCompletingaStandardGCaseforSupportandAttachmentsESRCSpecificRequirementshtm)
39
RCUK (2014a) lsquoImpact through knowledge exchange RCUK position and expectationrsquo Swindon Research Councils UK Available at httpwwwrcukacukdocumentsinnovationkeposition-pdf
RCUK (2014b) Pathways to Impactrsquo Swindon Research Councils UK (httpwwwrcukacukinnovationimpacts)REF2014 (2014) lsquoAssessment framework and guidance on submissionsrsquo (httpwwwrefacukpubs2011-02)Shaxson L (2016) lsquoAchieving Policy Impactrsquo Guidance Note London DFID-ESRC Growth Resarch Programme Available at
httpdegrpsquarespacecomimpactTsui J Hearn S and Young J (2014) lsquoMonitoring and evaluation of policy influence and advocacyrsquo ODI Working Paper 395 London
Overseas Development Institute Available at httpwwwodiorgpublications8265-gates-monitoring-evaluating-advocacyUniversity of Cambridge (nd) lsquoImpact Case Studies Lessons Learned from REF 2014rsquo Cambridge University of Cambridge
(httpwwwresearch-strategyadmincamacukfilesimpact_recommendationsv3docx) Young E and Quinn L (2012) Making research evidence matter a guide to policy advocacy in transition countries Budapest Open
Society FoundationsYoung J Shaxson L Jones H Hearn S Datta A and Cassidy C (2014) ROMA a guide to policy engagement and influence London
Overseas Development Institute Available at httpswwwodiorgsitesodiorgukfilesodi-assetspublications-opinion-files9011pdf
ODI is the UKrsquos leading independent think tank on international development and humanitarian issues
Readers are encouraged to reproduce material for their own publications as long as they are not being sold commercially As copyright holder ODI requests due acknowledgement and a copy of the publication For online use we ask readers to link to the original resource on the ODI website The views presented in this paper are those of the author(s) and do not necessarily represent the views of ODI or our partners
copy Overseas Development Institute 2018 This work is licensed under a Creative Commons Attribution-NonCommercial Licence (CC BY-NC 40)
All ODI publications are available from wwwodiorg
Overseas Development Institute203 Blackfriars Road London SE1 8NJTel +44 (0) 20 7922 0300 Fax +44 (0) 20 7922 0399
Shaping policy for development odiorg | ODIdev
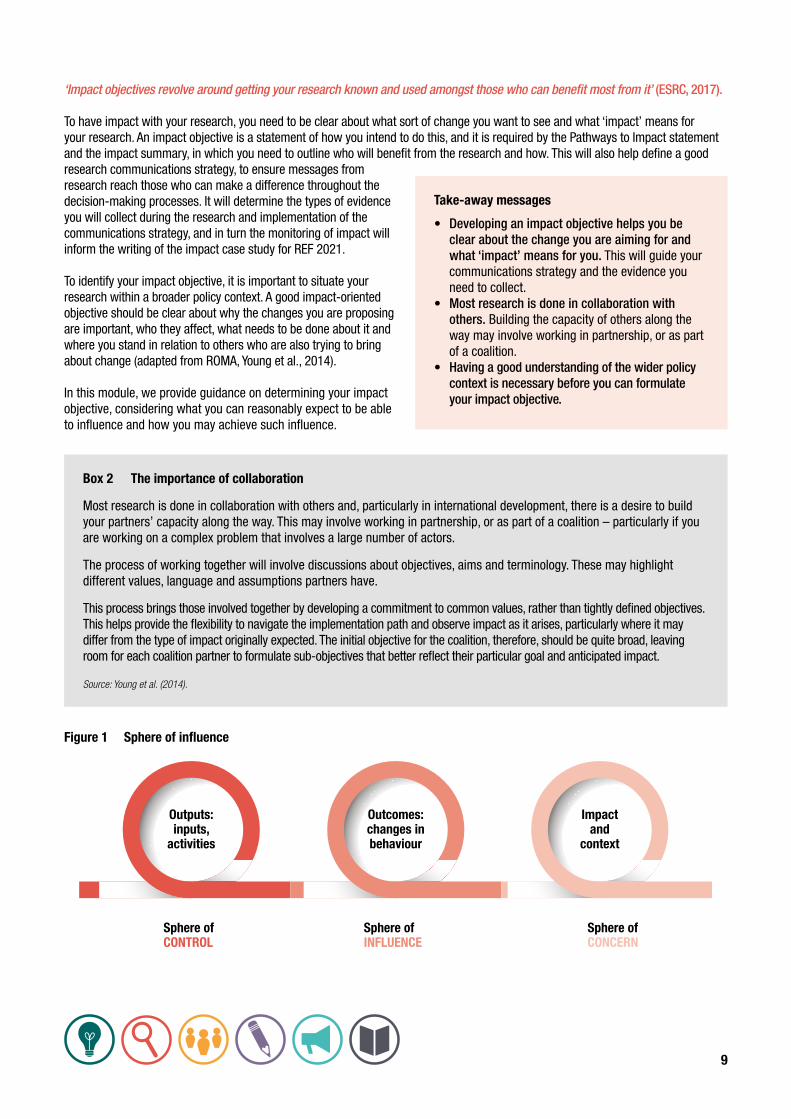
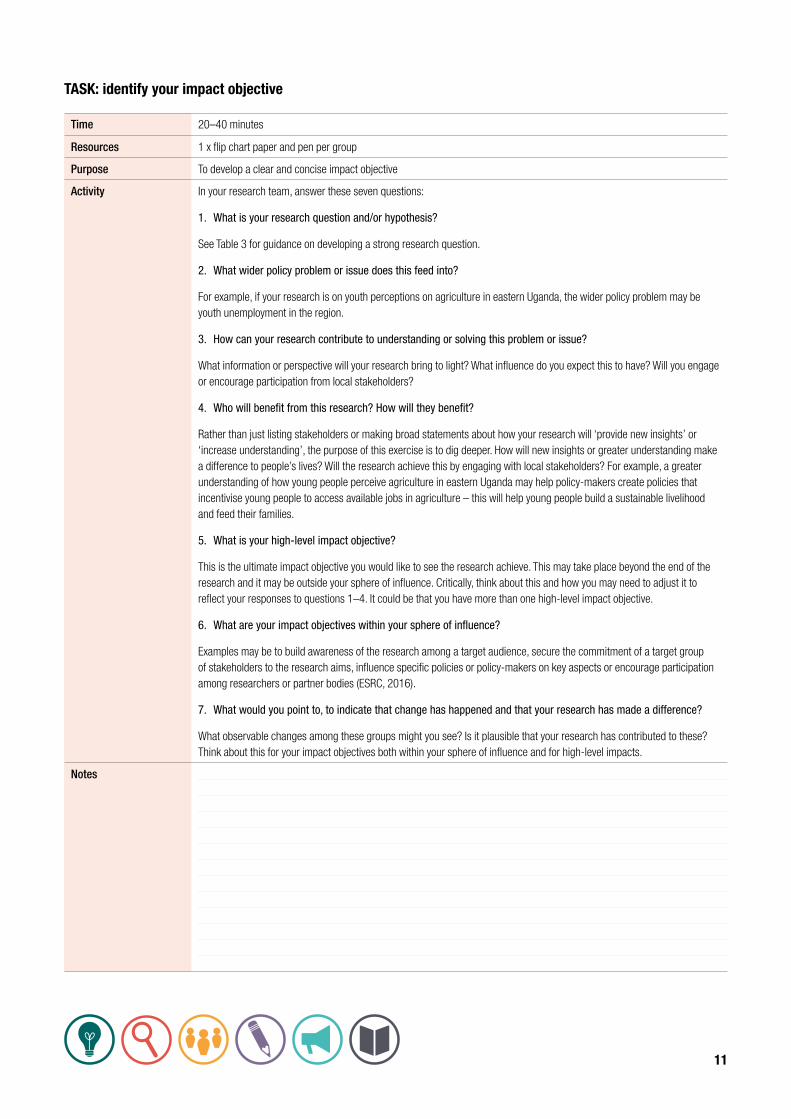
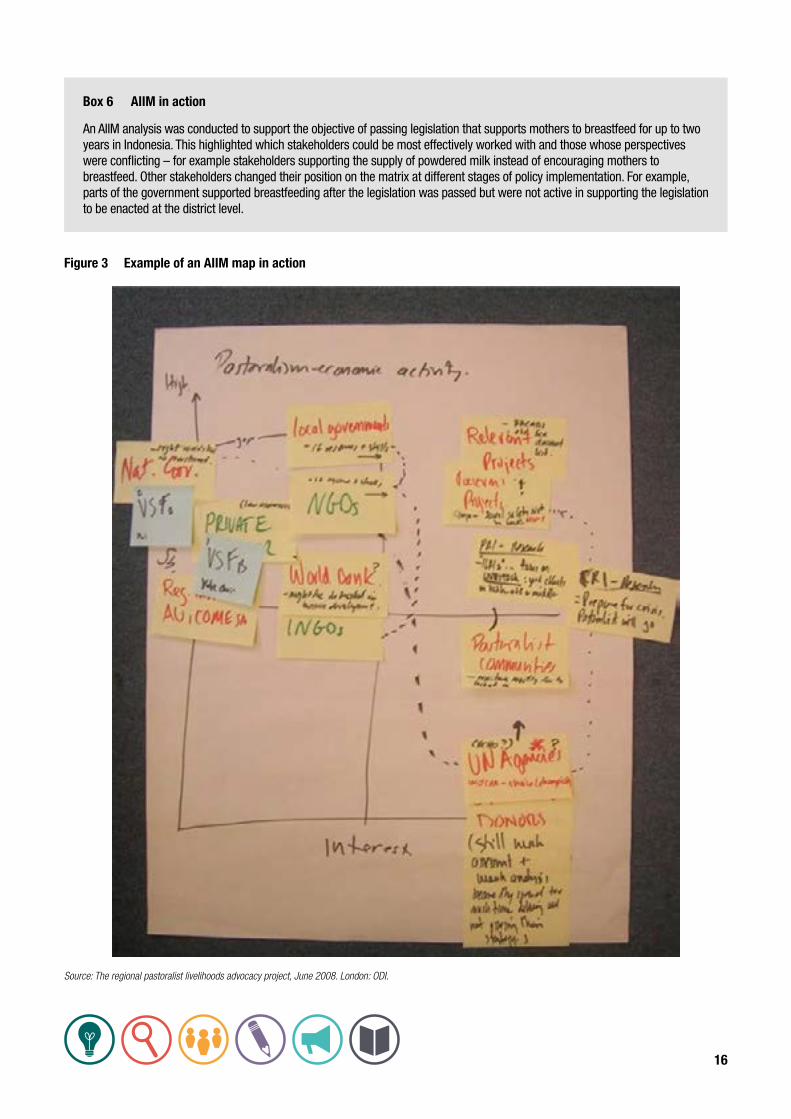
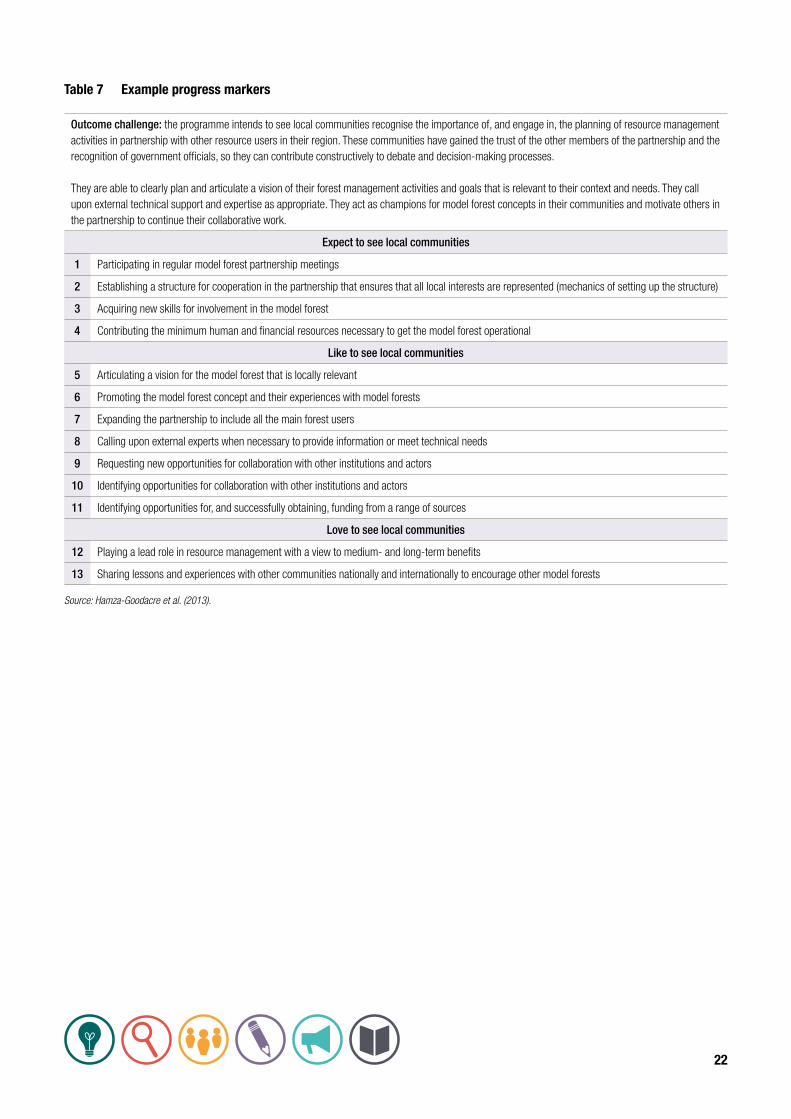
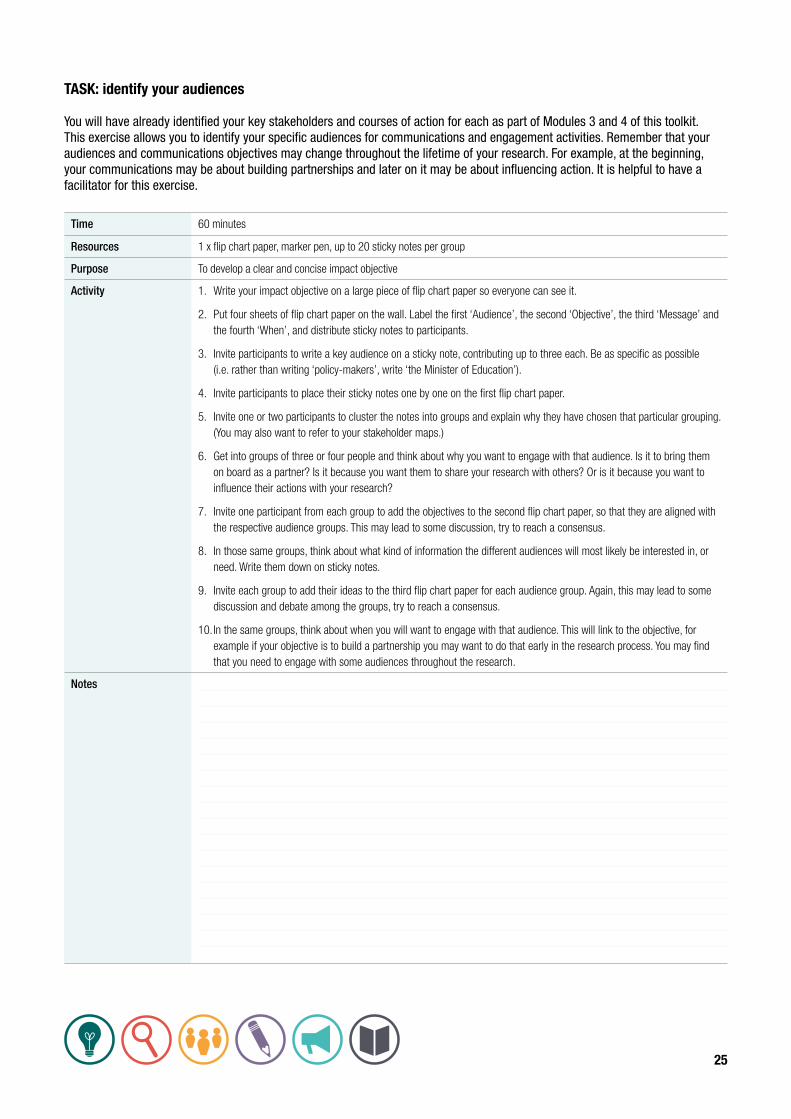
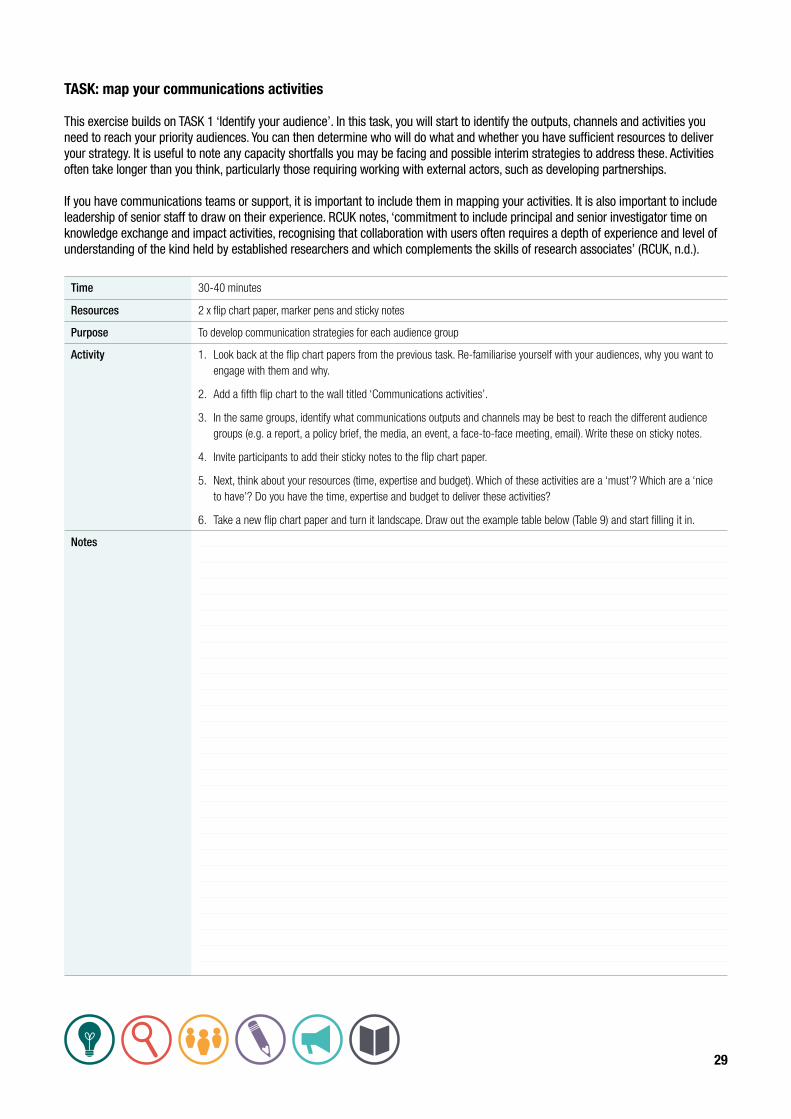
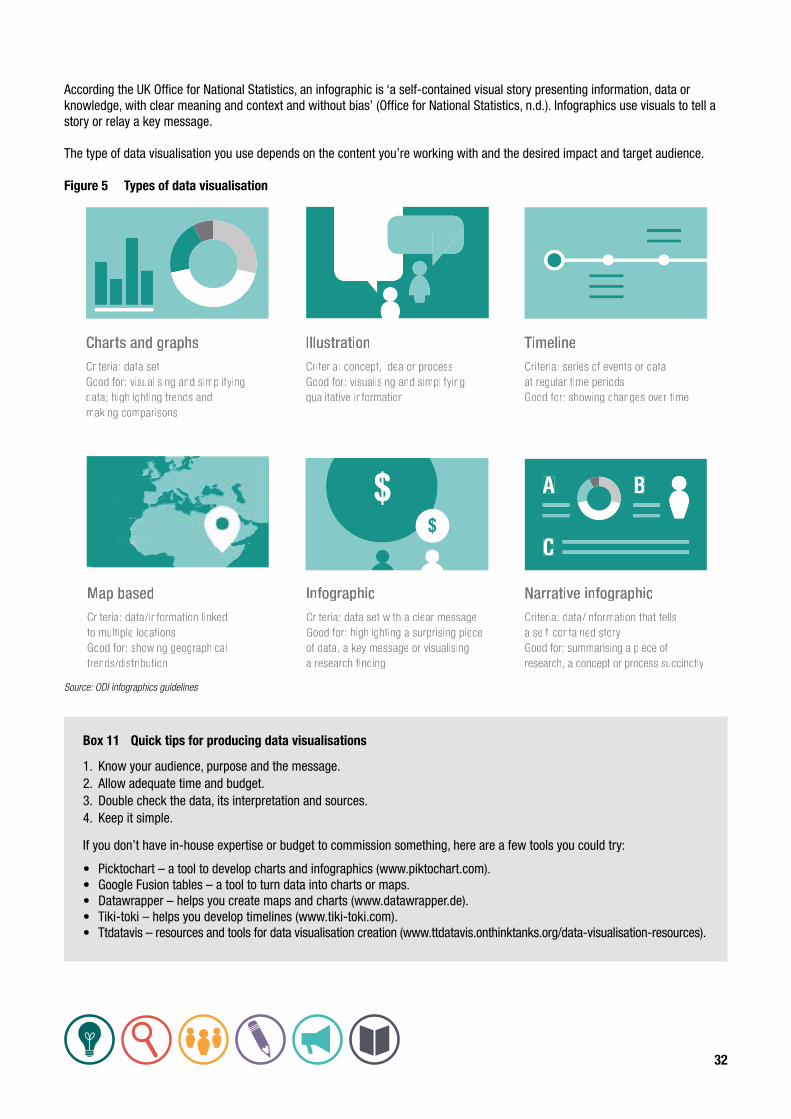