research article open access molars and … · research article open access molars and incisors:...
TRANSCRIPT
Laugel-Haushalter et al. BMC Research Notes 2013, 6:113http://www.biomedcentral.com/1756-0500/6/113
RESEARCH ARTICLE Open Access
Molars and incisors: show your microarray IDsVirginie Laugel-Haushalter1, Marie Paschaki1, Christelle Thibault-Carpentier2, Doulaye Dembelé2, Pascal Dollé1
and Agnès Bloch-Zupan1,3,4*
Abstract
Background: One of the key questions in developmental biology is how, from a relatively small number ofconserved signaling pathways, is it possible to generate organs displaying a wide range of shapes, tissueorganization, and function. The dentition and its distinct specific tooth types represent a valuable system to addressthe issues of differential molecular signatures. To identify such signatures, we performed a comparativetranscriptomic analysis of developing murine lower incisors, mandibular molars and maxillary molars at thedevelopmental cap stage (E14.5).
Results: 231 genes were identified as being differentially expressed between mandibular incisors and molars, witha fold change higher than 2 and a false discovery rate lower than 0.1, whereas only 96 genes were discovered asbeing differentially expressed between mandibular and maxillary molars. Numerous genes belonging to specificsignaling pathways (the Hedgehog, Notch, Wnt, FGF, TGFβ/BMP, and retinoic acid pathways), and/or to thehomeobox gene superfamily, were also uncovered when a less stringent fold change threshold was used.Differential expressions for 10 out of 12 (mandibular incisors versus molars) and 9 out of 10 selected genes wereconfirmed by quantitative reverse transcription-PCR (qRT-PCR). A bioinformatics tool (Ingenuity Pathway Analysis)used to analyze biological functions and pathways on the group of incisor versus molar differentially expressedgenes revealed that 143 genes belonged to 9 networks with intermolecular connections. Networks with the highestsignificance scores were centered on the TNF/NFκB complex and the ERK1/2 kinases. Two networks ERK1/2 kinasesand tretinoin were involved in differential molar morphogenesis.
Conclusion: These data allowed us to build several regulatory networks that may distinguish incisor versus molaridentity, and may be useful for further investigations of these tooth-specific ontogenetic programs. These programsmay be dysregulated in transgenic animal models and related human diseases leading to dental anomalies.
Keywords: Tooth development, Molar, Incisor, Gene expression, Mouse, Microarray
BackgroundA key question in developmental biology is how severalshared molecular pathways can give rise to distinctorgans, differing in their shape and tissue organization.The dentition represents a valuable system to addressthe issue of differential gene expression leading to thegeneration of specific tooth types. The mouse dentition
* Correspondence: [email protected] Biology and Stem Cells Department, Institut de Génétiqueet de Biologie Moléculaire et Cellulaire (IGBMC), Centre National de laRecherche Scientifique (UMR 7104), Institut National de la Santé et de laRecherche Médicale (U 964), Fédération de Médecine Translationnelle deStrasbourg (FMTS), Université de Strasbourg, BP 10142, 1 rue Laurent Fries,Illkirch Cedex 67404, France3University of Strasbourg, Faculty of Dentistry, 1 place de l'Hôpital,Strasbourg, FranceFull list of author information is available at the end of the article
© 2013 Laugel-Haushalter et al.; licensee BioMCreative Commons Attribution License (http:/distribution, and reproduction in any medium
is composed of one incisor and three molars on eachhemiquadrant, separated by a toothless gap called dia-stema. Although molars and incisors develop accordingto the same basic developmental sequences, they displayseveral important differences. Rodent incisors have acontinuously growing ability through life, linked to thepresence of an active stem cell niche located within theapical cervical loops [1]. They also exhibit asymmetricaldevelopment: ameloblasts differentiate and deposit enamelmatrix only on the labial side, whereas the lingual sidefunctions as a root analogue generating odontoblasts [2].Odontogenesis proceeds through several stages. It
initiates at the dental lamina stage by the appearance of athickened area in the oral ectoderm, and proceeds to bud,cap and bell stages, odontoblasts and ameloblasts terminaldifferentiations, dentin and enamel matrix deposition and
ed Central Ltd. This is an Open Access article distributed under the terms of the/creativecommons.org/licenses/by/2.0), which permits unrestricted use,, provided the original work is properly cited.
Laugel-Haushalter et al. BMC Research Notes 2013, 6:113 Page 2 of 15http://www.biomedcentral.com/1756-0500/6/113
mineralization, root formation and finally tooth eruption.Odontogenesis is controlled by epithelio-mesenchymal in-teractions between neural crest-derived ectomesenchymalcells and oral ectoderm [3-9], and is regulated by con-served signaling pathways (FGF, BMP, Shh, Wnt, TGFβ,Notch, TNF/NFκB) [10-16]. Transcription factors inclu-ding several homeobox gene products [17-21] and genesfrom the retinoic acid pathway [22] also play a role intooth development.The differential location, identity, shape and size of
teeth are determined by several pathways acting at earlystages of development [23]. At mouse embryonic dayE10.5 the first molecular signals (BMP4, FGF8) initiatingdifferential tooth morphogenesis are found in the oralectoderm in mutually exclusive and complementaryterritories [9,24], which will trigger subsequent mesen-chymal signaling. Already at this stage presumptivemolar and incisor fields are well defined [25]. Toothdevelopment was postulated not to involve any Hox(Antennapedia-like homeobox) gene [26], although re-cent studies showed specific expression of some Hoxgenes in distinct tooth bud tissues [27]. A number ofother homeobox genes are expressed, however, in nestedpatterns across the developing jaws. The mandible isdivided into oral (expressing Lhx6 and 7), aboral (express-ing Gsc), distal (presumptive incisor, expressing Msx1 and2) and proximal (presumptive molar, expressing Dlx1 and2, Barx1, Pitx1) domains [17-19]. These expression pat-terns are defined by positive and negative signals from theoral epithelium. Bmp4, for example, is initially expressedin the distal epithelium and induces expression of Msx1 inthe underlying (presumptive incisor) mesenchyme, whileat the same time it negatively regulates expression ofBarx1, so as to restrict its expression to the presumptivemolar region [18]. Fgf8, meanwhile, is expressed adjacentto Bmp4 in the proximal oral epithelium and positivelyinduces Barx1 expression in the underlying presumptivemolar epithelium [18]. Other genes display also a differen-tial expression pattern [28,29].Tooth shape specification from the dental lamina stage
is contained within the ectomesenchyme. At the cap stage(E14.5 in the mouse) the condensing dental mesenchymalpapilla controls the growth and folding of the inner dentalepithelium. Mesenchymal signals induce within the en-amel organ the formation of a signaling center called theprimary enamel knot. It is a transitory structure of nonproliferative cells, which produces several signaling mole-cules [30] and is essential to crown and cusps develop-ment and shape. The patterning role of the mesenchymeand dental papilla has also been addressed by hetero-logous recombination experiments from E13 to E16between molar and incisor dental papilla and enamelorgans, allowing the development of teeth of shape andtype corresponding to the mesenchymal identity [31,32].
Many genes have a dynamic expression pattern duringodontogenesis, and by the E14.5 cap stage a lot of genesthat have earlier been linked to either the incisor or molarregions are expressed in all tooth germs and may not any-more be differentially expressed.Alterations of these precisely regulated molecular and
cellular sequences of development lead to dental ano-malies, i.e. anomalies of teeth number, shape and size, ofhard structures (enamel and dentin), of root formationand eruption. These malformations are observed intransgenic mouse models [33,34] mimicking humandiseases and within the clinical phenotypes of syndromesor rare genetic diseases [35,36]. Indeed, at least 900 ofthe ~ 7000 known rare diseases or syndromes includeoro-dental anomalies. In some syndromes only molarsand canines are affected, like in oto-dental syndromecaused by deletions of the FGF3 gene and characterizedby grossly enlarged molar teeth (globodontia) [37]. Inother syndromes, only incisors are affected like in KBGsyndrome caused by mutation in ANKRD11 and charac-terized by intellectual disability associated with shortstature, facial dysmorphism and macrodontia of theupper central incisors, often with an agenesis of maxi-llary lateral incisors [38]. SATB2 was involved in dentalanomalies like incisor agenesis both in human in the2q33.1 microdeletion syndrome [39] and in the corre-sponding mouse model [40]. We also recently identifiedSMOC2, a gene causing when mutated severe develop-mental dental defects with a dentin dysplasia phenotypeassociated to major microdontia, oligodontia, and shapeabnormalities [41]. Furthermore, we showed a differen-tial expression of this gene between molars and incisors.In order to discover new candidate genes involved in
the molecular events responsible for differential histomor-phogenesis of the molars and incisors, we performed atranscriptomic analysis of developing murine lower inci-sors, mandibular molars and maxillary molars at the capstage of development (E14.5). Here we report a globalanalysis of the identified differentially expressed genes.These data allowed us to build several regulatory networksthat may distinguish incisor versus molar development,and may be useful for further investigations of thesetooth-specific ontogenetic programs, some of which maybe dysregulated in human diseases.
Results and discussionAnalysis of tooth specific transcriptional profilesWe decided to compare gene expression profiles indeveloping murine lower incisor and molars, as well asbetween the lower and upper (mandibular and maxillary)first molars. The developing tooth buds were collectedby microdissection from E14.5 wild-type C57BL6 mice,and total RNA was extracted with the RNAeasy microKit (Qiagen, see Materials and Methods), after pooling 4
Laugel-Haushalter et al. BMC Research Notes 2013, 6:113 Page 3 of 15http://www.biomedcentral.com/1756-0500/6/113
tooth germs per sample in order to obtain enough RNAfor microarray hybridization. Altogether, 4 lower incisorssamples, 4 maxillary molars samples, and 8 mandibularmolars samples were hybridized on Affymetrix mousegene 1.0 ST microarrays. Principal component analysis(PCA) was performed using the Partek Software toassess the consistency of the results. According to thisanalysis, the transcriptional profiles of three incisorssamples (one sample of dubious quality was discarded)and eight mandibular molars samples showed that sam-ples segregated in two distinct groups, showing relevanttranscriptional differences between mandibular molarsand lower incisors (Additional file 1). PCA performedon transcriptional profiles of eight mandibular molarssamples and four maxillary molars samples also showeda clear segregation of samples between the two groups.This analysis indicated that transcriptional differencesexisted both between lower incisors and molars, as wellas between mandibular and maxillary molars.Our microarray data analysis allowed identification of
several genes already known to be involved in toothdevelopment (see Introduction), which did not showstatistically different expression levels between distincttooth samples. For instance, there was no significantdifference in Bmp4, Fgf8, Msx1, Pitx1, Pitx2, Gsc, Dlx2,Runx2, Msx2, Lhx6, Hand1 or Satb2 expression betweenlower incisors and mandibular molars, and in Bmp4,Fgf8, Msx1, Dlx2, Runx2, Msx2 and Satb2 expressionbetween mandibular and maxillary molars. Altogether,these data validated the sensitivity of the microarrayanalysis, and confirmed that several important regulatorsof tooth development were expressed at comparablelevels in distinct tooth types at the stage analyzed.Many genes exhibited statistically significant differen-
tial expression levels between specific tooth types. The
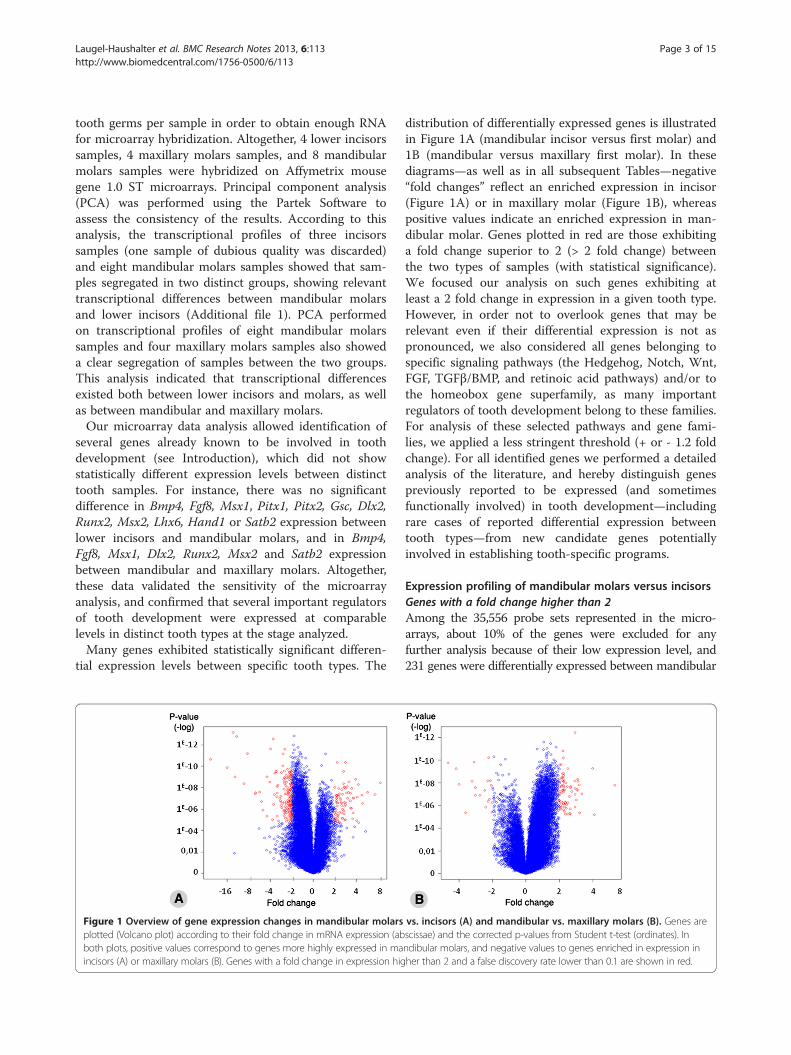
Figure 1 Overview of gene expression changes in mandibular molarsplotted (Volcano plot) according to their fold change in mRNA expression (abboth plots, positive values correspond to genes more highly expressed in maincisors (A) or maxillary molars (B). Genes with a fold change in expression hig
distribution of differentially expressed genes is illustratedin Figure 1A (mandibular incisor versus first molar) and1B (mandibular versus maxillary first molar). In thesediagrams—as well as in all subsequent Tables—negative“fold changes” reflect an enriched expression in incisor(Figure 1A) or in maxillary molar (Figure 1B), whereaspositive values indicate an enriched expression in man-dibular molar. Genes plotted in red are those exhibitinga fold change superior to 2 (> 2 fold change) betweenthe two types of samples (with statistical significance).We focused our analysis on such genes exhibiting atleast a 2 fold change in expression in a given tooth type.However, in order not to overlook genes that may berelevant even if their differential expression is not aspronounced, we also considered all genes belonging tospecific signaling pathways (the Hedgehog, Notch, Wnt,FGF, TGFβ/BMP, and retinoic acid pathways) and/or tothe homeobox gene superfamily, as many importantregulators of tooth development belong to these families.For analysis of these selected pathways and gene fami-lies, we applied a less stringent threshold (+ or - 1.2 foldchange). For all identified genes we performed a detailedanalysis of the literature, and hereby distinguish genespreviously reported to be expressed (and sometimesfunctionally involved) in tooth development—includingrare cases of reported differential expression betweentooth types—from new candidate genes potentiallyinvolved in establishing tooth-specific programs.
Expression profiling of mandibular molars versus incisorsGenes with a fold change higher than 2Among the 35,556 probe sets represented in the micro-arrays, about 10% of the genes were excluded for anyfurther analysis because of their low expression level, and231 genes were differentially expressed between mandibular
vs. incisors (A) and mandibular vs. maxillary molars (B). Genes arescissae) and the corrected p-values from Student t-test (ordinates). Inndibular molars, and negative values to genes enriched in expression inher than 2 and a false discovery rate lower than 0.1 are shown in red.
Laugel-Haushalter et al. BMC Research Notes 2013, 6:113 Page 4 of 15http://www.biomedcentral.com/1756-0500/6/113
incisor and molar, with a fold change higher than 2 and afalse discovery rate lower than 0.1 (corresponding to ap-value lower than 6.89E-04) (Figure 1A). The top tengenes exhibiting the highest expression in mandibularmolars were Barx1, C1qtnf3, Adcy8, Cntn6, Six2, Tcfap2b,Odz1, Vstm2a, Nptx1 and Has2. The top ten genes sho-wing highest expression in incisors were Hpse2, Alx1,Hand2, Sfrp4, Pax3, Alx3, Isl1, Mcpt2, Cacna2d3 and Irx4(Table 1A). Interestingly, among these genes, four werealready known to be differentially expressed, with Barx1and Six2 preferentially expressed in molars [42,43] andIsl1 and Hand2 in incisors [29,44].Additional literature searches revealed that, among the
remaining 231 genes, only 22 were previously describedas being expressed during tooth development, including9 genes known to be differentially expressed betweenmolar and incisors. Thus, our analysis revealed nearly 200“new”, potentially interesting genes not previouslydescribed as differentially expressed between developingincisors and molars (a complete list is given in Additionalfile 2). Table 1B provides data for selected genes with highfold change and/or belonging to families for which othermember(s) are involved in odontogenesis. Sfrp2 and Sfrp4,for example, belong to the family of secreted frizzled-related proteins, for which Sfpr1 was already known to beexpressed in teeth [65,66]. Tlx2 and Bmp5 also have twoparalogues, Tlx1 and Bmp4, that were previously des-cribed as being differentially expressed between toothtypes [62,67]. Two Alx genes, Alx1 and Alx3 were differ-entially expressed in our microarray experiments, withvery high fold changes. The corresponding human genesare mutated in frontonsal dysplasia affecting the midlinefacial structures [68]. We also found two members of theIroquois homeobox gene family, Irx4 and Irx6, suggestinga role of these genes in defining incisor identity.
Genes from selected pathways or familiesFrom the 3078 genes exhibiting a fold change higherthan 1.2 and a false discovery rate lower than 0.1, 107belonged to pathways or families selected as beingimportant for tooth development (the FGF, TGFβ/BMP,Wnt, Hedgehog, retinoic acid, and Notch pathways, andthe homeobox gene superfamily: see Introduction).Among these, 88 had not been reported to be expressedin teeth and were considered as new potential genesinvolved in tooth development (Table 2). Nineteen geneswere already known to be expressed in teeth (Table 2,gene names in bold), and among them 11 were knownto be differentially expressed between the two toothtypes (Table 2, underlined). Considering genes not previ-ously known to be expressed in teeth, and genes not yetdescribed to be differentially expressed between toothtypes, we found in total 99 genes not yet involved indifferential tooth morphogenesis.
Quantitative RT-PCR analysisTwelve of these 99 genes were selected for validation ofthe microarray data by quantitative RT-PCR (qRT-PCR).These were candidates from interesting signaling path-ways: Ihh (from the hedgehog pathway), Dll1 (from theNotch pathway), Sfrp1 and Sfrp2 (from the Wnt pathway),Fgf12 (from the FGF pathway), Bmp5 (from the TGFβpathway/superfamily), Cyp26c1 and Cyp1b1 (encodingtwo retinoic acid-metabolizing enzymes), Alx1 and Shox2(members of the homeobox gene superfamily). We alsodecided to verify two genes known to be expressed inteeth and exhibiting a fold change higher than 2: Smoc2because we recently detected by in situ hybridization adifferential expression between molars and incisors [41]and Prkcq, which belongs to the NFκB pathway (Table 1B).qRT-PCR was performed on RNA samples distinct fromthose used for microarray hybridization. From these 12genes, 10 were found to be differentially expressed bet-ween molar and incisors by qRT-PCR, in agreement withthe microarray data (Figure 2). The two exceptions wereIhh, which did not exhibit differential expression, andDll1, which displayed an opposite expression (molar >incisor, not statistically significant) when compared to themicroarray data.
Gene network analysisRelevant networks when considering all genes with afold change higher than 2 To gain insight into interac-tions that may occur between the differentially expressedgenes and/or proteins, we constructed biologically relevantnetworks using the Ingenuity pathway analysis software.From the 231 differentially expressed genes with a foldchange higher than 2, 143 genes were mapped in ninenetworks. The most relevant network (score=48) wascentered on the NFκB complex and contained 24 differen-tially expressed genes (Figure 3A). Barx1, Dlx1, Sox2,Cited1, Nr2f1, Nr2f2, Vsnl1, Cxcl6, Dusp6, Has2, Lpl,Tfap2b, Rgs5, Sfrp1 and Sfrp2 were more strongly ex-pressed in mandibular molars than in incisors. Otx1, Isl1,Cyp2c19, Foxa3, Pappa, Rgs7, Rgs20, Cyp17a1 and Sfrp4were more expressed in incisors. This network highlightedtwo genes from the nuclear receptor superfamily (Nr2f1and Nr2f2, also known as COUP-TFI and II), bothexpressed at higher levels in molars. On the other hand,several genes from the Sfrp family were differentiallyexpressed, with Sfrp1 and Sfrp2 being more expressed inmandibular molars and Sfrp4 more expressed in incisors(Figure 3A). The second network (score=42) was centeredon ERK1/2 and contained 22 differentially expressed genes(Figure 3B). Hdac9, Entpd1, Ampa Receptor, Grp andGria2 were expressed at higher levels in mandibular mo-lars, whereas Hand1, Hand2, Myocd, Cacna1d, Ppargc1a,C1qtnf2, Ptprr, Ace2, Nts, SSt, Alx3, Ins1, Glis3, Nlrp5,Dsc1, Tlx1 and Reln were preferentially expressed in lower
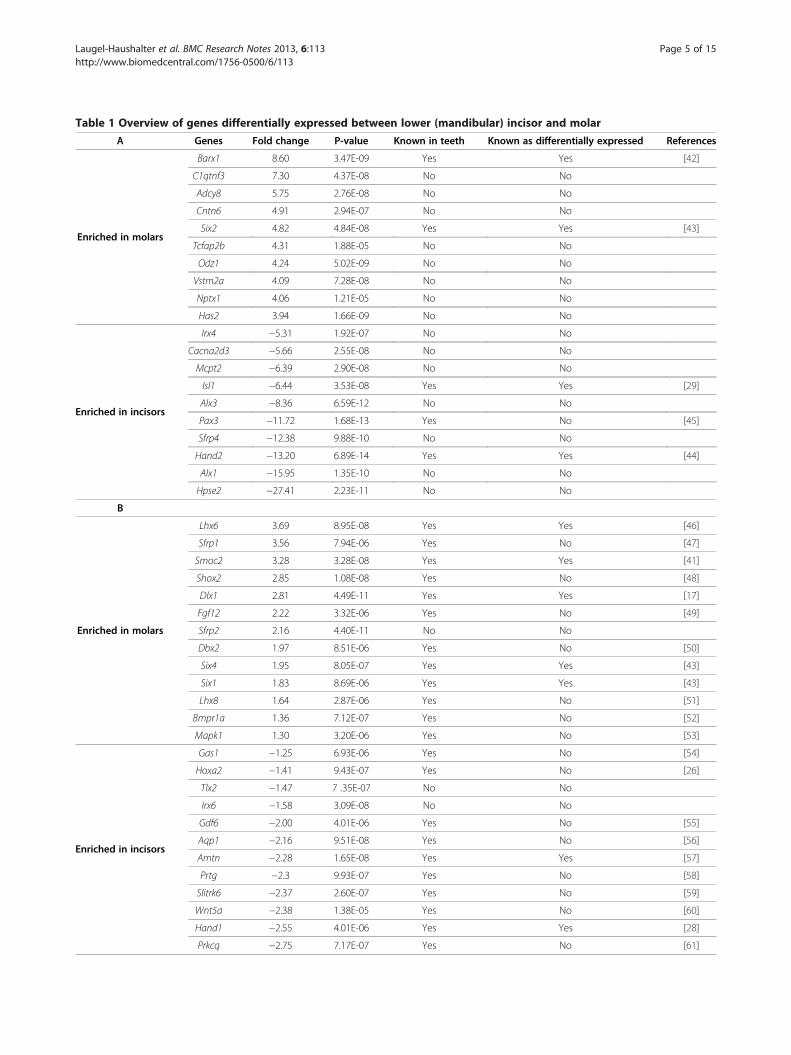
Table 1 Overview of genes differentially expressed between lower (mandibular) incisor and molar
A Genes Fold change P-value Known in teeth Known as differentially expressed References
Enriched in molars
Barx1 8.60 3.47E-09 Yes Yes [42]
C1qtnf3 7.30 4.37E-08 No No
Adcy8 5.75 2.76E-08 No No
Cntn6 4.91 2.94E-07 No No
Six2 4.82 4.84E-08 Yes Yes [43]
Tcfap2b 4.31 1.88E-05 No No
Odz1 4.24 5.02E-09 No No
Vstm2a 4.09 7.28E-08 No No
Nptx1 4.06 1.21E-05 No No
Has2 3.94 1.66E-09 No No
Enriched in incisors
Irx4 −5.31 1.92E-07 No No
Cacna2d3 −5.66 2.55E-08 No No
Mcpt2 −6.39 2.90E-08 No No
Isl1 −6.44 3.53E-08 Yes Yes [29]
Alx3 −8.36 6.59E-12 No No
Pax3 −11.72 1.68E-13 Yes No [45]
Sfrp4 −12.38 9.88E-10 No No
Hand2 −13.20 6.89E-14 Yes Yes [44]
Alx1 −15.95 1.35E-10 No No
Hpse2 −27.41 2.23E-11 No No
B
Enriched in molars
Lhx6 3.69 8.95E-08 Yes Yes [46]
Sfrp1 3.56 7.94E-06 Yes No [47]
Smoc2 3.28 3.28E-08 Yes Yes [41]
Shox2 2.85 1.08E-08 Yes No [48]
Dlx1 2.81 4.49E-11 Yes Yes [17]
Fgf12 2.22 3.32E-06 Yes No [49]
Sfrp2 2.16 4.40E-11 No No
Dbx2 1.97 8.51E-06 Yes No [50]
Six4 1.95 8.05E-07 Yes Yes [43]
Six1 1.83 8.69E-06 Yes Yes [43]
Lhx8 1.64 2.87E-06 Yes No [51]
Bmpr1a 1.36 7.12E-07 Yes No [52]
Mapk1 1.30 3.20E-06 Yes No [53]
Enriched in incisors
Gas1 −1.25 6.93E-06 Yes No [54]
Hoxa2 −1.41 9.43E-07 Yes No [26]
Tlx2 −1.47 7 .35E-07 No No
Irx6 −1.58 3.09E-08 No No
Gdf6 −2.00 4.01E-06 Yes No [55]
Aqp1 −2.16 9.51E-08 Yes No [56]
Amtn −2.28 1.65E-08 Yes Yes [57]
Prtg −2.3 9.93E-07 Yes No [58]
Slitrk6 −2.37 2.60E-07 Yes No [59]
Wnt5a −2.38 1.38E-05 Yes No [60]
Hand1 −2.55 4.01E-06 Yes Yes [28]
Prkcq −2.75 7.17E-07 Yes No [61]
Laugel-Haushalter et al. BMC Research Notes 2013, 6:113 Page 5 of 15http://www.biomedcentral.com/1756-0500/6/113
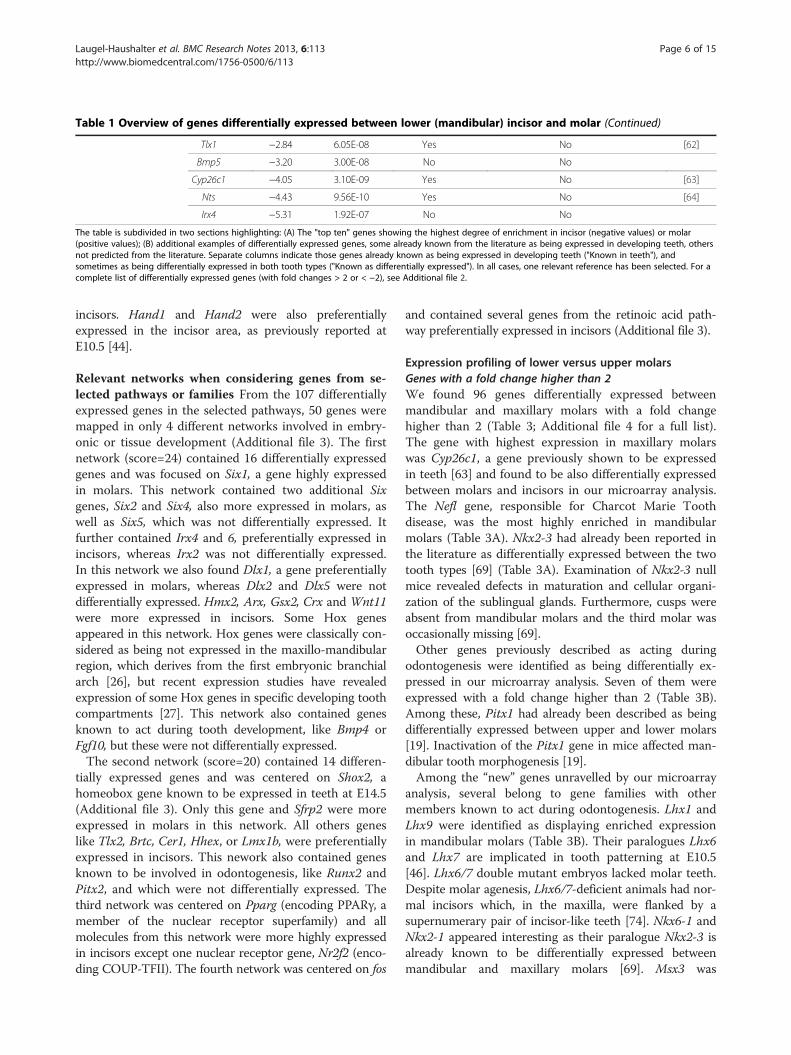
Table 1 Overview of genes differentially expressed between lower (mandibular) incisor and molar (Continued)
Tlx1 −2.84 6.05E-08 Yes No [62]
Bmp5 −3.20 3.00E-08 No No
Cyp26c1 −4.05 3.10E-09 Yes No [63]
Nts −4.43 9.56E-10 Yes No [64]
Irx4 −5.31 1.92E-07 No No
The table is subdivided in two sections highlighting: (A) The "top ten" genes showing the highest degree of enrichment in incisor (negative values) or molar(positive values); (B) additional examples of differentially expressed genes, some already known from the literature as being expressed in developing teeth, othersnot predicted from the literature. Separate columns indicate those genes already known as being expressed in developing teeth ("Known in teeth"), andsometimes as being differentially expressed in both tooth types ("Known as differentially expressed"). In all cases, one relevant reference has been selected. For acomplete list of differentially expressed genes (with fold changes > 2 or < −2), see Additional file 2.
Laugel-Haushalter et al. BMC Research Notes 2013, 6:113 Page 6 of 15http://www.biomedcentral.com/1756-0500/6/113
incisors. Hand1 and Hand2 were also preferentiallyexpressed in the incisor area, as previously reported atE10.5 [44].
Relevant networks when considering genes from se-lected pathways or families From the 107 differentiallyexpressed genes in the selected pathways, 50 genes weremapped in only 4 different networks involved in embry-onic or tissue development (Additional file 3). The firstnetwork (score=24) contained 16 differentially expressedgenes and was focused on Six1, a gene highly expressedin molars. This network contained two additional Sixgenes, Six2 and Six4, also more expressed in molars, aswell as Six5, which was not differentially expressed. Itfurther contained Irx4 and 6, preferentially expressed inincisors, whereas Irx2 was not differentially expressed.In this network we also found Dlx1, a gene preferentiallyexpressed in molars, whereas Dlx2 and Dlx5 were notdifferentially expressed. Hmx2, Arx, Gsx2, Crx and Wnt11were more expressed in incisors. Some Hox genesappeared in this network. Hox genes were classically con-sidered as being not expressed in the maxillo-mandibularregion, which derives from the first embryonic branchialarch [26], but recent expression studies have revealedexpression of some Hox genes in specific developing toothcompartments [27]. This network also contained genesknown to act during tooth development, like Bmp4 orFgf10, but these were not differentially expressed.The second network (score=20) contained 14 differen-
tially expressed genes and was centered on Shox2, ahomeobox gene known to be expressed in teeth at E14.5(Additional file 3). Only this gene and Sfrp2 were moreexpressed in molars in this network. All others geneslike Tlx2, Brtc, Cer1, Hhex, or Lmx1b, were preferentiallyexpressed in incisors. This nework also contained genesknown to be involved in odontogenesis, like Runx2 andPitx2, and which were not differentially expressed. Thethird network was centered on Pparg (encoding PPARγ, amember of the nuclear receptor superfamily) and allmolecules from this network were more highly expressedin incisors except one nuclear receptor gene, Nr2f2 (enco-ding COUP-TFII). The fourth network was centered on fos
and contained several genes from the retinoic acid path-way preferentially expressed in incisors (Additional file 3).
Expression profiling of lower versus upper molarsGenes with a fold change higher than 2We found 96 genes differentially expressed betweenmandibular and maxillary molars with a fold changehigher than 2 (Table 3; Additional file 4 for a full list).The gene with highest expression in maxillary molarswas Cyp26c1, a gene previously shown to be expressedin teeth [63] and found to be also differentially expressedbetween molars and incisors in our microarray analysis.The Nefl gene, responsible for Charcot Marie Toothdisease, was the most highly enriched in mandibularmolars (Table 3A). Nkx2-3 had already been reported inthe literature as differentially expressed between the twotooth types [69] (Table 3A). Examination of Nkx2-3 nullmice revealed defects in maturation and cellular organi-zation of the sublingual glands. Furthermore, cusps wereabsent from mandibular molars and the third molar wasoccasionally missing [69].Other genes previously described as acting during
odontogenesis were identified as being differentially ex-pressed in our microarray analysis. Seven of them wereexpressed with a fold change higher than 2 (Table 3B).Among these, Pitx1 had already been described as beingdifferentially expressed between upper and lower molars[19]. Inactivation of the Pitx1 gene in mice affected man-dibular tooth morphogenesis [19].Among the “new” genes unravelled by our microarray
analysis, several belong to gene families with othermembers known to act during odontogenesis. Lhx1 andLhx9 were identified as displaying enriched expressionin mandibular molars (Table 3B). Their paralogues Lhx6and Lhx7 are implicated in tooth patterning at E10.5[46]. Lhx6/7 double mutant embryos lacked molar teeth.Despite molar agenesis, Lhx6/7-deficient animals had nor-mal incisors which, in the maxilla, were flanked by asupernumerary pair of incisor-like teeth [74]. Nkx6-1 andNkx2-1 appeared interesting as their paralogue Nkx2-3 isalready known to be differentially expressed betweenmandibular and maxillary molars [69]. Msx3 was
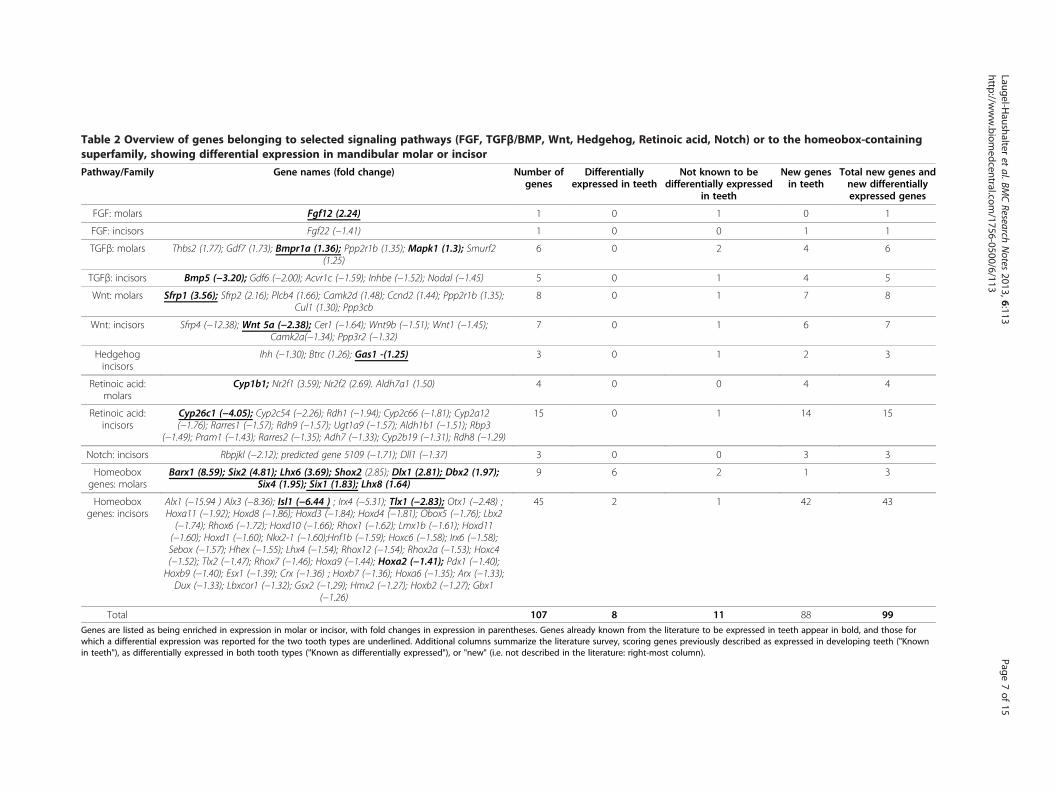
Table 2 Overview of genes belonging to selected signaling pathways (FGF, TGFβ/BMP, Wnt, Hedgehog, Retinoic acid, Notch) or to the homeobox-containingsuperfamily, showing differential expression in mandibular molar or incisor
Pathway/Family Gene names (fold change) Number ofgenes
Differentiallyexpressed in teeth
Not known to bedifferentially expressed
in teeth
New genesin teeth
Total new genes andnew differentiallyexpressed genes
FGF: molars Fgf12 (2.24) 1 0 1 0 1
FGF: incisors Fgf22 (−1.41) 1 0 0 1 1
TGFβ: molars Thbs2 (1.77); Gdf7 (1.73); Bmpr1a (1.36); Ppp2r1b (1.35); Mapk1 (1.3); Smurf2(1.25)
6 0 2 4 6
TGFβ: incisors Bmp5 (−3.20); Gdf6 (−2.00); Acvr1c (−1.59); Inhbe (−1.52); Nodal (−1.45) 5 0 1 4 5
Wnt: molars Sfrp1 (3.56); Sfrp2 (2.16); Plcb4 (1.66); Camk2d (1.48); Ccnd2 (1.44); Ppp2r1b (1.35);Cul1 (1.30); Ppp3cb
8 0 1 7 8
Wnt: incisors Sfrp4 (−12.38); Wnt 5a (−2.38); Cer1 (−1.64); Wnt9b (−1.51); Wnt1 (−1.45);Camk2a(−1.34); Ppp3r2 (−1.32)
7 0 1 6 7
Hedgehogincisors
Ihh (−1.30); Btrc (1.26); Gas1 -(1.25) 3 0 1 2 3
Retinoic acid:molars
Cyp1b1; Nr2f1 (3.59); Nr2f2 (2.69). Aldh7a1 (1.50) 4 0 0 4 4
Retinoic acid:incisors
Cyp26c1 (−4.05); Cyp2c54 (−2.26); Rdh1 (−1.94); Cyp2c66 (−1.81); Cyp2a12(−1.76); Rarres1 (−1.57); Rdh9 (−1.57); Ugt1a9 (−1.57); Aldh1b1 (−1.51); Rbp3
(−1.49); Pram1 (−1.43); Rarres2 (−1.35); Adh7 (−1.33); Cyp2b19 (−1.31); Rdh8 (−1.29)
15 0 1 14 15
Notch: incisors Rbpjkl (−2.12); predicted gene 5109 (−1.71); Dll1 (−1.37) 3 0 0 3 3
Homeoboxgenes: molars
Barx1 (8.59); Six2 (4.81); Lhx6 (3.69); Shox2 (2.85); Dlx1 (2.81); Dbx2 (1.97);Six4 (1.95); Six1 (1.83); Lhx8 (1.64)
9 6 2 1 3
Homeoboxgenes: incisors
Alx1 (−15.94 ) Alx3 (−8.36); Isl1 (−6.44 ) ; Irx4 (−5.31); Tlx1 (−2.83); Otx1 (−2.48) ;Hoxa11 (−1.92); Hoxd8 (−1.86); Hoxd3 (−1.84); Hoxd4 (−1.81); Obox5 (−1.76); Lbx2(−1.74); Rhox6 (−1.72); Hoxd10 (−1.66); Rhox1 (−1.62); Lmx1b (−1.61); Hoxd11(−1.60); Hoxd1 (−1.60); Nkx2-1 (−1.60);Hnf1b (−1.59); Hoxc6 (−1.58); Irx6 (−1.58);Sebox (−1.57); Hhex (−1.55); Lhx4 (−1.54); Rhox12 (−1.54); Rhox2a (−1.53); Hoxc4(−1.52); Tlx2 (−1.47); Rhox7 (−1.46); Hoxa9 (−1.44); Hoxa2 (−1.41); Pdx1 (−1.40);Hoxb9 (−1.40); Esx1 (−1.39); Crx (−1.36) ; Hoxb7 (−1.36); Hoxa6 (−1.35); Arx (−1.33);Dux (−1.33); Lbxcor1 (−1.32); Gsx2 (−1.29); Hmx2 (−1.27); Hoxb2 (−1.27); Gbx1
(−1.26)
45 2 1 42 43
Total 107 8 11 88 99Genes are listed as being enriched in expression in molar or incisor, with fold changes in expression in parentheses. Genes already known from the literature to be expressed in teeth appear in bold, and those forwhich a differential expression was reported for the two tooth types are underlined. Additional columns summarize the literature survey, scoring genes previously described as expressed in developing teeth ("Knownin teeth"), as differentially expressed in both tooth types ("Known as differentially expressed"), or "new" (i.e. not described in the literature: right-most column).
Laugel-Haushalter
etal.BM
CResearch
Notes
2013,6:113Page
7of
15http://w
ww.biom
edcentral.com/1756-0500/6/113
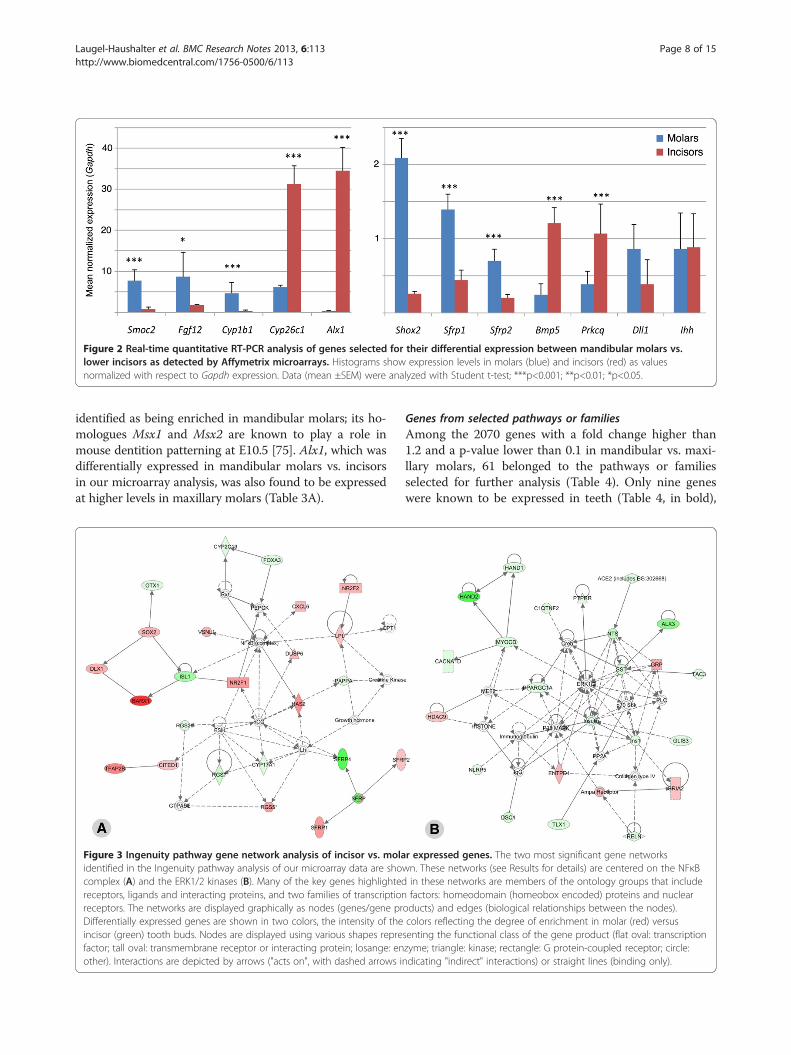
Figure 2 Real-time quantitative RT-PCR analysis of genes selected for their differential expression between mandibular molars vs.lower incisors as detected by Affymetrix microarrays. Histograms show expression levels in molars (blue) and incisors (red) as valuesnormalized with respect to Gapdh expression. Data (mean ±SEM) were analyzed with Student t-test; ***p<0.001; **p<0.01; *p<0.05.
Laugel-Haushalter et al. BMC Research Notes 2013, 6:113 Page 8 of 15http://www.biomedcentral.com/1756-0500/6/113
identified as being enriched in mandibular molars; its ho-mologues Msx1 and Msx2 are known to play a role inmouse dentition patterning at E10.5 [75]. Alx1, which wasdifferentially expressed in mandibular molars vs. incisorsin our microarray analysis, was also found to be expressedat higher levels in maxillary molars (Table 3A).
Figure 3 Ingenuity pathway gene network analysis of incisor vs. molaidentified in the Ingenuity pathway analysis of our microarray data are shocomplex (A) and the ERK1/2 kinases (B). Many of the key genes highlightedreceptors, ligands and interacting proteins, and two families of transcriptionreceptors. The networks are displayed graphically as nodes (genes/gene prDifferentially expressed genes are shown in two colors, the intensity of theincisor (green) tooth buds. Nodes are displayed using various shapes reprefactor; tall oval: transmembrane receptor or interacting protein; losange: enother). Interactions are depicted by arrows ("acts on", with dashed arrows i
Genes from selected pathways or familiesAmong the 2070 genes with a fold change higher than1.2 and a p-value lower than 0.1 in mandibular vs. maxi-llary molars, 61 belonged to the pathways or familiesselected for further analysis (Table 4). Only nine geneswere known to be expressed in teeth (Table 4, in bold),
r expressed genes. The two most significant gene networkswn. These networks (see Results for details) are centered on the NFκBin these networks are members of the ontology groups that includefactors: homeodomain (homeobox encoded) proteins and nuclear
oducts) and edges (biological relationships between the nodes).colors reflecting the degree of enrichment in molar (red) versussenting the functional class of the gene product (flat oval: transcriptionzyme; triangle: kinase; rectangle: G protein-coupled receptor; circle:ndicating "indirect" interactions) or straight lines (binding only).
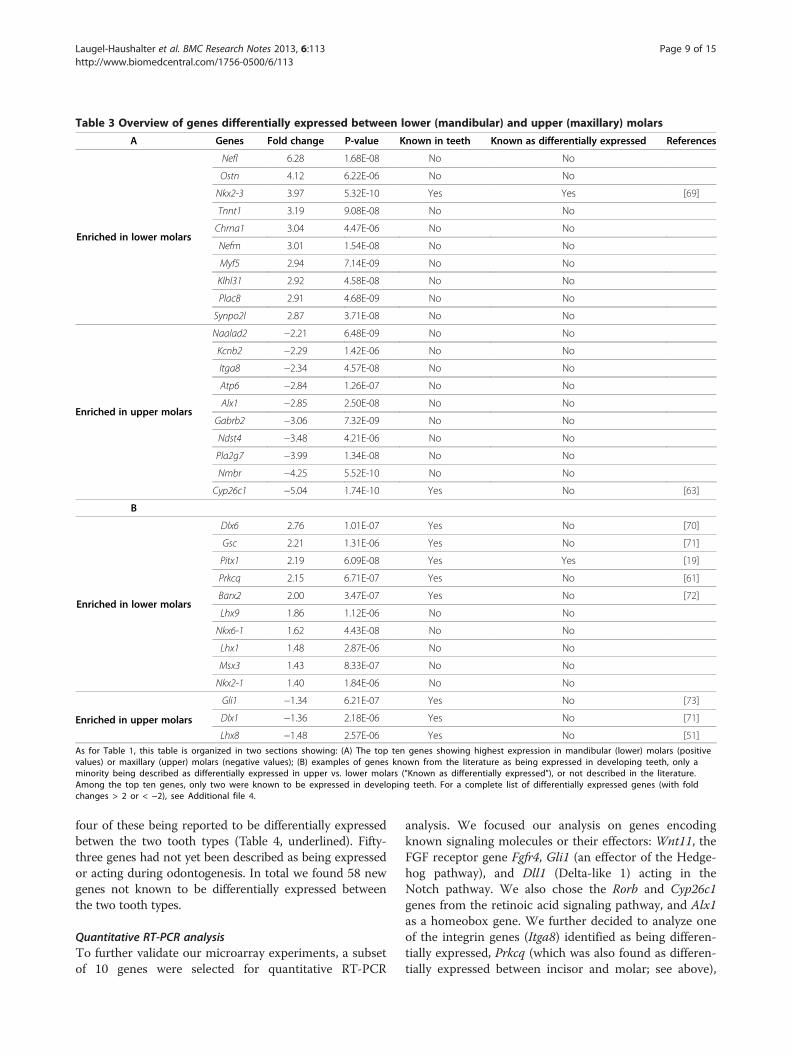
Table 3 Overview of genes differentially expressed between lower (mandibular) and upper (maxillary) molars
A Genes Fold change P-value Known in teeth Known as differentially expressed References
Enriched in lower molars
Nefl 6.28 1.68E-08 No No
Ostn 4.12 6.22E-06 No No
Nkx2-3 3.97 5.32E-10 Yes Yes [69]
Tnnt1 3.19 9.08E-08 No No
Chrna1 3.04 4.47E-06 No No
Nefm 3.01 1.54E-08 No No
Myf5 2.94 7.14E-09 No No
Klhl31 2.92 4.58E-08 No No
Plac8 2.91 4.68E-09 No No
Synpo2l 2.87 3.71E-08 No No
Enriched in upper molars
Naalad2 −2.21 6.48E-09 No No
Kcnb2 −2.29 1.42E-06 No No
Itga8 −2.34 4.57E-08 No No
Atp6 −2.84 1.26E-07 No No
Alx1 −2.85 2.50E-08 No No
Gabrb2 −3.06 7.32E-09 No No
Ndst4 −3.48 4.21E-06 No No
Pla2g7 −3.99 1.34E-08 No No
Nmbr −4.25 5.52E-10 No No
Cyp26c1 −5.04 1.74E-10 Yes No [63]
B
Enriched in lower molars
Dlx6 2.76 1.01E-07 Yes No [70]
Gsc 2.21 1.31E-06 Yes No [71]
Pitx1 2.19 6.09E-08 Yes Yes [19]
Prkcq 2.15 6.71E-07 Yes No [61]
Barx2 2.00 3.47E-07 Yes No [72]
Lhx9 1.86 1.12E-06 No No
Nkx6-1 1.62 4.43E-08 No No
Lhx1 1.48 2.87E-06 No No
Msx3 1.43 8.33E-07 No No
Nkx2-1 1.40 1.84E-06 No No
Enriched in upper molars
Gli1 −1.34 6.21E-07 Yes No [73]
Dlx1 −1.36 2.18E-06 Yes No [71]
Lhx8 −1.48 2.57E-06 Yes No [51]
As for Table 1, this table is organized in two sections showing: (A) The top ten genes showing highest expression in mandibular (lower) molars (positivevalues) or maxillary (upper) molars (negative values); (B) examples of genes known from the literature as being expressed in developing teeth, only aminority being described as differentially expressed in upper vs. lower molars ("Known as differentially expressed"), or not described in the literature.Among the top ten genes, only two were known to be expressed in developing teeth. For a complete list of differentially expressed genes (with foldchanges > 2 or < −2), see Additional file 4.
Laugel-Haushalter et al. BMC Research Notes 2013, 6:113 Page 9 of 15http://www.biomedcentral.com/1756-0500/6/113
four of these being reported to be differentially expressedbetwen the two tooth types (Table 4, underlined). Fifty-three genes had not yet been described as being expressedor acting during odontogenesis. In total we found 58 newgenes not known to be differentially expressed betweenthe two tooth types.
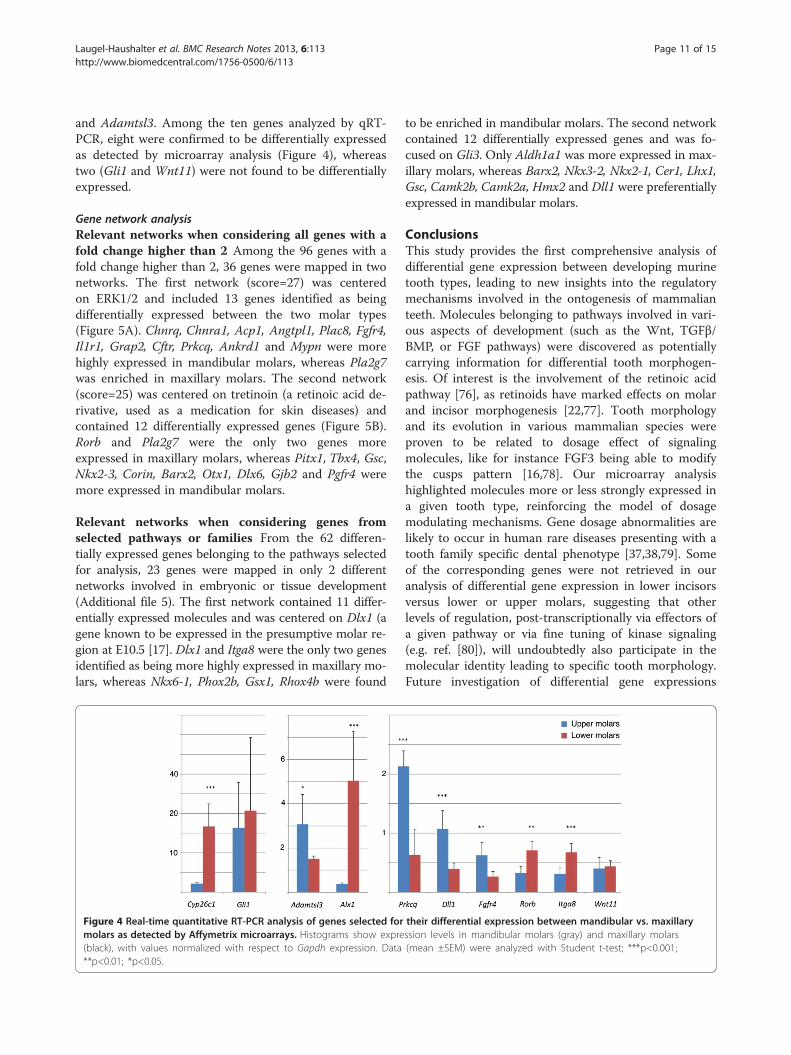
Quantitative RT-PCR analysisTo further validate our microarray experiments, a subsetof 10 genes were selected for quantitative RT-PCR
analysis. We focused our analysis on genes encodingknown signaling molecules or their effectors: Wnt11, theFGF receptor gene Fgfr4, Gli1 (an effector of the Hedge-hog pathway), and Dll1 (Delta-like 1) acting in theNotch pathway. We also chose the Rorb and Cyp26c1genes from the retinoic acid signaling pathway, and Alx1as a homeobox gene. We further decided to analyze oneof the integrin genes (Itga8) identified as being differen-tially expressed, Prkcq (which was also found as differen-tially expressed between incisor and molar; see above),
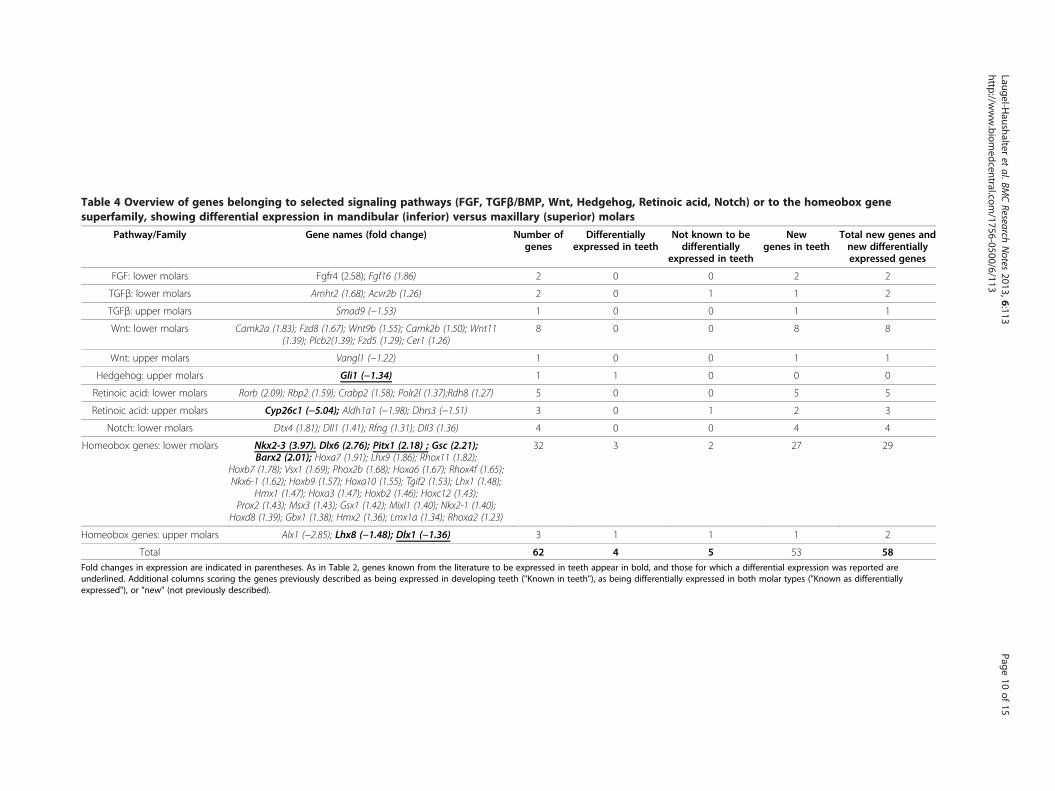
Table 4 Overview of genes belonging to selected signaling pathways (FGF, TGFβ/BMP, Wnt, Hedgehog, Retinoic acid, Notch) or to the homeobox genesuperfamily, showing differential expression in mandibular (inferior) versus maxillary (superior) molars
Pathway/Family Gene names (fold change) Number ofgenes
Differentiallyexpressed in teeth
Not known to bedifferentially
expressed in teeth
Newgenes in teeth
Total new genes andnew differentiallyexpressed genes
FGF: lower molars Fgfr4 (2.58); Fgf16 (1.86) 2 0 0 2 2
TGFβ: lower molars Amhr2 (1.68); Acvr2b (1.26) 2 0 1 1 2
TGFβ: upper molars Smad9 (−1.53) 1 0 0 1 1
Wnt: lower molars Camk2a (1.83); Fzd8 (1.67); Wnt9b (1.55); Camk2b (1.50); Wnt11(1.39); Plcb2(1.39); Fzd5 (1.29); Cer1 (1.26)
8 0 0 8 8
Wnt: upper molars Vangl1 (−1.22) 1 0 0 1 1
Hedgehog: upper molars Gli1 (−1.34) 1 1 0 0 0
Retinoic acid: lower molars Rorb (2.09); Rbp2 (1.59); Crabp2 (1.58); Polr2l (1.37);Rdh8 (1.27) 5 0 0 5 5
Retinoic acid: upper molars Cyp26c1 (−5.04); Aldh1a1 (−1.98); Dhrs3 (−1.51) 3 0 1 2 3
Notch: lower molars Dtx4 (1.81); Dll1 (1.41); Rfng (1.31); Dll3 (1.36) 4 0 0 4 4
Homeobox genes: lower molars Nkx2-3 (3.97). Dlx6 (2.76); Pitx1 (2.18) ; Gsc (2.21);Barx2 (2.01); Hoxa7 (1.91); Lhx9 (1.86); Rhox11 (1.82);
Hoxb7 (1.78); Vsx1 (1.69); Phox2b (1.68); Hoxa6 (1.67); Rhox4f (1.65);Nkx6-1 (1.62); Hoxb9 (1.57); Hoxa10 (1.55); Tgif2 (1.53); Lhx1 (1.48);
Hmx1 (1.47); Hoxa3 (1.47); Hoxb2 (1.46); Hoxc12 (1.43);Prox2 (1.43); Msx3 (1.43); Gsx1 (1.42); Mixl1 (1.40); Nkx2-1 (1.40);
Hoxd8 (1.39); Gbx1 (1.38); Hmx2 (1.36); Lmx1a (1.34); Rhoxa2 (1.23)
32 3 2 27 29
Homeobox genes: upper molars Alx1 (−2.85); Lhx8 (−1.48); Dlx1 (−1.36) 3 1 1 1 2
Total 62 4 5 53 58Fold changes in expression are indicated in parentheses. As in Table 2, genes known from the literature to be expressed in teeth appear in bold, and those for which a differential expression was reported areunderlined. Additional columns scoring the genes previously described as being expressed in developing teeth ("Known in teeth"), as being differentially expressed in both molar types ("Known as differentiallyexpressed"), or "new" (not previously described).
Laugel-Haushalter
etal.BM
CResearch
Notes
2013,6:113Page
10of
15http://w
ww.biom
edcentral.com/1756-0500/6/113
Laugel-Haushalter et al. BMC Research Notes 2013, 6:113 Page 11 of 15http://www.biomedcentral.com/1756-0500/6/113
and Adamtsl3. Among the ten genes analyzed by qRT-PCR, eight were confirmed to be differentially expressedas detected by microarray analysis (Figure 4), whereastwo (Gli1 and Wnt11) were not found to be differentiallyexpressed.
Gene network analysisRelevant networks when considering all genes with afold change higher than 2 Among the 96 genes with afold change higher than 2, 36 genes were mapped in twonetworks. The first network (score=27) was centeredon ERK1/2 and included 13 genes identified as beingdifferentially expressed between the two molar types(Figure 5A). Chnrq, Chnra1, Acp1, Angtpl1, Plac8, Fgfr4,Il1r1, Grap2, Cftr, Prkcq, Ankrd1 and Mypn were morehighly expressed in mandibular molars, whereas Pla2g7was enriched in maxillary molars. The second network(score=25) was centered on tretinoin (a retinoic acid de-rivative, used as a medication for skin diseases) andcontained 12 differentially expressed genes (Figure 5B).Rorb and Pla2g7 were the only two genes moreexpressed in maxillary molars, whereas Pitx1, Tbx4, Gsc,Nkx2-3, Corin, Barx2, Otx1, Dlx6, Gjb2 and Pgfr4 weremore expressed in mandibular molars.
Relevant networks when considering genes fromselected pathways or families From the 62 differen-tially expressed genes belonging to the pathways selectedfor analysis, 23 genes were mapped in only 2 differentnetworks involved in embryonic or tissue development(Additional file 5). The first network contained 11 differ-entially expressed molecules and was centered on Dlx1 (agene known to be expressed in the presumptive molar re-gion at E10.5 [17]. Dlx1 and Itga8 were the only two genesidentified as being more highly expressed in maxillary mo-lars, whereas Nkx6-1, Phox2b, Gsx1, Rhox4b were found
Figure 4 Real-time quantitative RT-PCR analysis of genes selected formolars as detected by Affymetrix microarrays. Histograms show expre(black), with values normalized with respect to Gapdh expression. Data**p<0.01; *p<0.05.
to be enriched in mandibular molars. The second networkcontained 12 differentially expressed genes and was fo-cused on Gli3. Only Aldh1a1 was more expressed in max-illary molars, whereas Barx2, Nkx3-2, Nkx2-1, Cer1, Lhx1,Gsc, Camk2b, Camk2a, Hmx2 and Dll1 were preferentiallyexpressed in mandibular molars.
ConclusionsThis study provides the first comprehensive analysis ofdifferential gene expression between developing murinetooth types, leading to new insights into the regulatorymechanisms involved in the ontogenesis of mammalianteeth. Molecules belonging to pathways involved in vari-ous aspects of development (such as the Wnt, TGFβ/BMP, or FGF pathways) were discovered as potentiallycarrying information for differential tooth morphogen-esis. Of interest is the involvement of the retinoic acidpathway [76], as retinoids have marked effects on molarand incisor morphogenesis [22,77]. Tooth morphologyand its evolution in various mammalian species wereproven to be related to dosage effect of signalingmolecules, like for instance FGF3 being able to modifythe cusps pattern [16,78]. Our microarray analysishighlighted molecules more or less strongly expressed ina given tooth type, reinforcing the model of dosagemodulating mechanisms. Gene dosage abnormalities arelikely to occur in human rare diseases presenting with atooth family specific dental phenotype [37,38,79]. Someof the corresponding genes were not retrieved in ouranalysis of differential gene expression in lower incisorsversus lower or upper molars, suggesting that otherlevels of regulation, post-transcriptionally via effectors ofa given pathway or via fine tuning of kinase signaling(e.g. ref. [80]), will undoubtedly also participate in themolecular identity leading to specific tooth morphology.Future investigation of differential gene expressions
their differential expression between mandibular vs. maxillaryssion levels in mandibular molars (gray) and maxillary molars(mean ±SEM) were analyzed with Student t-test; ***p<0.001;
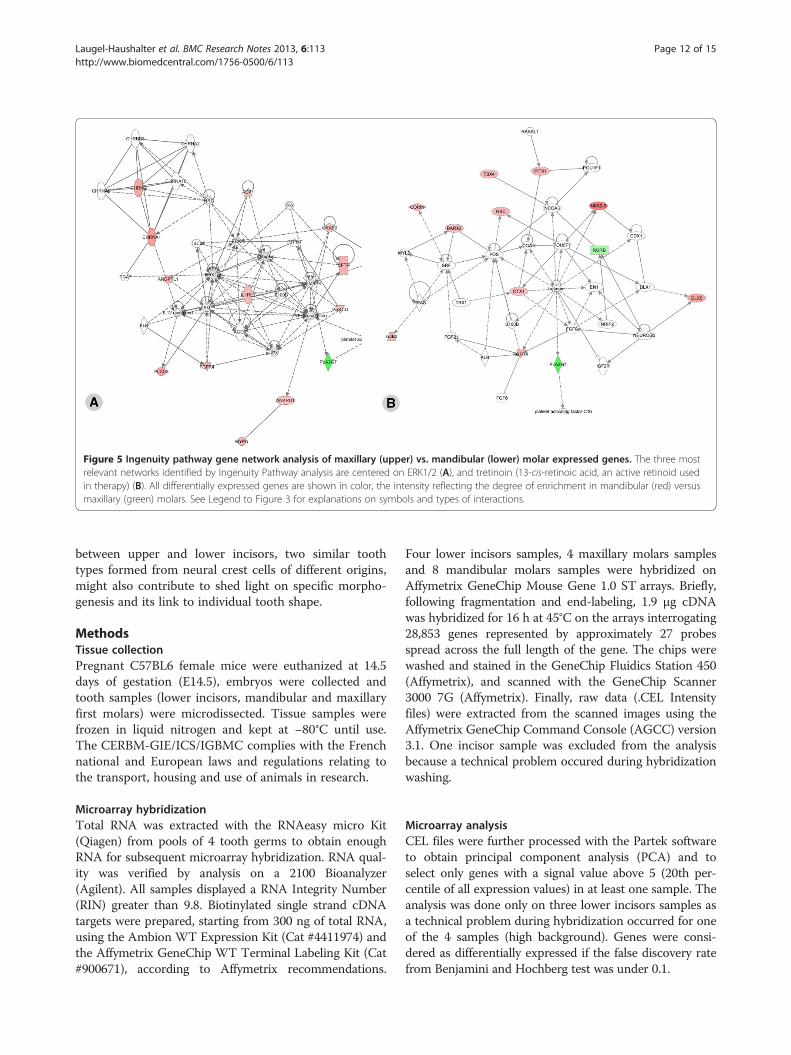
Figure 5 Ingenuity pathway gene network analysis of maxillary (upper) vs. mandibular (lower) molar expressed genes. The three mostrelevant networks identified by Ingenuity Pathway analysis are centered on ERK1/2 (A), and tretinoin (13-cis-retinoic acid, an active retinoid usedin therapy) (B). All differentially expressed genes are shown in color, the intensity reflecting the degree of enrichment in mandibular (red) versusmaxillary (green) molars. See Legend to Figure 3 for explanations on symbols and types of interactions.
Laugel-Haushalter et al. BMC Research Notes 2013, 6:113 Page 12 of 15http://www.biomedcentral.com/1756-0500/6/113
between upper and lower incisors, two similar toothtypes formed from neural crest cells of different origins,might also contribute to shed light on specific morpho-genesis and its link to individual tooth shape.
MethodsTissue collectionPregnant C57BL6 female mice were euthanized at 14.5days of gestation (E14.5), embryos were collected andtooth samples (lower incisors, mandibular and maxillaryfirst molars) were microdissected. Tissue samples werefrozen in liquid nitrogen and kept at −80°C until use.The CERBM-GIE/ICS/IGBMC complies with the Frenchnational and European laws and regulations relating tothe transport, housing and use of animals in research.
Microarray hybridizationTotal RNA was extracted with the RNAeasy micro Kit(Qiagen) from pools of 4 tooth germs to obtain enoughRNA for subsequent microarray hybridization. RNA qual-ity was verified by analysis on a 2100 Bioanalyzer(Agilent). All samples displayed a RNA Integrity Number(RIN) greater than 9.8. Biotinylated single strand cDNAtargets were prepared, starting from 300 ng of total RNA,using the Ambion WT Expression Kit (Cat #4411974) andthe Affymetrix GeneChip WT Terminal Labeling Kit (Cat#900671), according to Affymetrix recommendations.
Four lower incisors samples, 4 maxillary molars samplesand 8 mandibular molars samples were hybridized onAffymetrix GeneChip Mouse Gene 1.0 ST arrays. Briefly,following fragmentation and end-labeling, 1.9 μg cDNAwas hybridized for 16 h at 45°C on the arrays interrogating28,853 genes represented by approximately 27 probesspread across the full length of the gene. The chips werewashed and stained in the GeneChip Fluidics Station 450(Affymetrix), and scanned with the GeneChip Scanner3000 7G (Affymetrix). Finally, raw data (.CEL Intensityfiles) were extracted from the scanned images using theAffymetrix GeneChip Command Console (AGCC) version3.1. One incisor sample was excluded from the analysisbecause a technical problem occured during hybridizationwashing.
Microarray analysisCEL files were further processed with the Partek softwareto obtain principal component analysis (PCA) and toselect only genes with a signal value above 5 (20th per-centile of all expression values) in at least one sample. Theanalysis was done only on three lower incisors samples asa technical problem during hybridization occurred for oneof the 4 samples (high background). Genes were consi-dered as differentially expressed if the false discovery ratefrom Benjamini and Hochberg test was under 0.1.
Laugel-Haushalter et al. BMC Research Notes 2013, 6:113 Page 13 of 15http://www.biomedcentral.com/1756-0500/6/113
Ingenuity pathways analysisBiologically relevant networks were created using the In-genuity Pathway Analysis software (http://www.Ingenuity.com). Based on the algorithmically generated connectivitybetween gene–gene, gene–protein, and protein–proteininteractions, the program develops functional molecularnetworks that overlay genes in the dataset. This programcalculated p-values for each network by comparing thenumber of genes that were mapped in a given network,relative to the total number of occurrences of those genesin all networks. The score for each network is given as thenegative log of the p-value, which indicates the likelihoodof finding a set of genes in the network by random chance.For instance, a score of 20 indicates that there is a 10-20
chance that the genes in focus would be in a networkbecause of random chance. Networks taking in accountdirect and indirect interactions have been generated forgenes with a fold change higher than 2, whereas networksinvolving only direct interactions have been created forgenes that were selected as members of pathways orfamilies of interest with a fold change higher than 1.2.
Real-time quantitative RT-PCRRT-PCR assays were performed in duplicate on threeRNA samples for each tooth type, distinct from the onesused for microarray hybridization. RNA extractions wereperformed as previously described. Oligo-dT primedcDNAs were generated using the Superscript II kit(Invitrogen) according to the manufacturer’s protocol.Quantitative real-time PCR was achieved using Sybr-Green and LightCycler 480 (Roche). The sequences ofprimers used for the various tested genes are given inAdditional file 6. A probe set for detection of mouseGapdh (a housekeeping gene) was used for normalisa-tion. For each sample the ratio between signals for thegene of interest and Gapdh was calculated to normalizeconcentration values. To verify if genes were differen-tially expressed in different tooth types, the average ofratios calculated for lower incisors, mandibular molarsand maxillary molars were then compared.
Availability of supporting dataThe data discussed in this publication have been depo-sited in NCBI's Gene Expression Omnibus (GEO) [81]and are accessible through GEO Series accession num-ber GSE43144. (http://www.ncbi.nlm.nih.gov/geo/query/acc.cgi?acc=GSE43144).
Additional files
Additional file 1: Principal component analysis (PCA) of mandibularmolar vs. lower incisor samples (A), and mandibular vs. maxillarymolar samples (B). Mandibular molar samples are represented in red,and incisor or maxillary molar samples in blue. The units are data-
dependent and are generated by the software, which gives coordinatesto each sample according to three axes that relate to the weight (inertia)of the decomposition into 3 principal components. For both analyses,samples segregate in two distinct groups, showing relevanttranscriptional differences between the two tooth types.
Additional file 2: This table presents an overview of genes showingdifferential expression in developing mandibular incisors versusmolars. Only the genes exhibiting at least a two fold change inexpression according to Affymetrix microarray analysis are listed. Geneswith the highest expression in incisors (positive values) or molars(negative values) appear on top and bottom of the list, respectively.
Additional file 3: Ingenuity pathway gene network analysis ofgenes belonging to selected pathways and/or superfamily(homeobox genes), showing differential expression in incisor ormolar tooth buds. Four relevant networks were constructed byIngenuity pathway analysis. The networks are displayed graphically asnodes (genes/gene products) and edges (biological relationshipsbetween the nodes). Differentially expressed genes are shown in twocolors, the intensity of the colors reflecting the degree of enrichment inmolar (red) versus incisor (green) tooth buds. Nodes are displayed usingvarious shapes representing the functional class of the gene product (flatoval: transcription factor; tall oval: transmembrane receptor or interactingprotein; losange: enzyme; triangle: kinase; rectangle: G protein-coupledreceptor; circle: other). Interactions are depicted by arrows ("acts on", withdashed arrows indicating "indirect" interactions) or straight lines (binding only).
Additional file 4: Overview of genes showing differentialexpression in developing mandibular (lower) versus maxillary(upper) molars. Only the genes exhibiting at least a two fold change inexpression according to Affymetrix microarray analysis are listed. Geneswith the highest expression in upper molars (positive values) or lowermolars (negative values) appear on top and bottom of the list,respectively.
Additional file 5: Ingenuity pathway gene network analysis ofgenes belonging to selected pathways and/or superfamily(homeobox genes), showing differential expression in upper versuslower molars. Two relevant networks are centered on Dlx1 (network 1)and Gli3 (network 2). See Legend to Additional file 3 for key andexplanations.
Additional file 6: Sequences of primers used for real-time qRT-PCRassays.
Competing interestsThe authors declare that they have no competing interests.
Authors’ contributionsAll authors contributed to the overall experimental design. VLH and MPperformed the tissue collection, RNA extraction, and real-time RT-PCRexperiments. CTC did the microarray hybridization. VLH and DD performedall statistical analyses. VLH, PD and ABZ wrote the manuscript. All authorsread, contributed to, and approved the final manuscript.
AcknowledgmentsWe thank V. Fraulob, B. Schuhbaur, and members of the IGBMC microarraycore facility, for technical assistance. This work was supported by grants fromthe University of Strasbourg, the Hôpitaux Universitaires de Strasbourg (API,2009–2012, “Development of the oral cavity: from gene to clinical phenotypein Human”) by IFRO (Institut Français pour la Recherche Odontologique),from Offensive Sciences, a Science Initiative in the Trinational MetropolitanRegion of the Upper Rhine, FEDER (European fund for regionaldevelopment), Program INTERREG IV Upper Rhine, Project A27 Oro-dentalmanifestations of rare diseases and by institutional funds from the CentreNational de la Recherche Scientifique (CNRS) and Institut National de laSanté et de la Recherche Médicale (INSERM). V.L-H. was the recipient of aPhD fellowship from the Ministère Français de la Recherche. M.P. wassupported by a grant from the Fondation pour la Recherche Médicale (FRM).
Author details1Developmental Biology and Stem Cells Department, Institut de Génétiqueet de Biologie Moléculaire et Cellulaire (IGBMC), Centre National de la
Laugel-Haushalter et al. BMC Research Notes 2013, 6:113 Page 14 of 15http://www.biomedcentral.com/1756-0500/6/113
Recherche Scientifique (UMR 7104), Institut National de la Santé et de laRecherche Médicale (U 964), Fédération de Médecine Translationnelle deStrasbourg (FMTS), Université de Strasbourg, BP 10142, 1 rue Laurent Fries,Illkirch Cedex 67404, France. 2Microarray and Sequencing Platform, Institut deGénétique et de Biologie Moléculaire et Cellulaire (IGBMC), Centre Nationalde la Recherche Scientifique (UMR 7104), Institut National de la Santé et dela Recherche Médicale (U 964), Université de Strasbourg, Illkirch-Strasbourg,France. 3University of Strasbourg, Faculty of Dentistry, 1 place de l'Hôpital,Strasbourg, France. 4Reference Centre for Orodental Manifestations of RareDiseases, Pôle de Médecine et Chirurgie Bucco-dentaires, HôpitauxUniversitaires de Strasbourg (HUS), Strasbourg, France.
Received: 17 September 2012 Accepted: 8 March 2013Published: 26 March 2013
References1. Harada H, Kettunen P, Jung HS, Mustonen T, Wang YA, Thesleff I:
Localization of putative stem cells in dental epithelium and theirassociation with Notch and FGF signaling. J Cell Biol 1999, 147(1):105–120.
2. Tummers M, Thesleff I: Observations on continuously growing roots ofthe sloth and the K14-Eda transgenic mice indicate that epithelial stemcells can give rise to both the ameloblast and root epithelium celllineage creating distinct tooth patterns. Evol Dev 2008, 10(2):187–195.
3. Cobourne MT, Mitsiadis T: Neural crest cells and patterning of themammalian dentition. J Exp Zoolog B Mol Dev Evol 2006, 306(3):251–260.
4. Knight RD, Schilling TF: Cranial neural crest and development of the headskeleton. Adv Exp Med Biol 2006, 589:120–133.
5. Noden DM, Schneider RA: Neural crest cells and the community of planfor craniofacial development: historical debates and currentperspectives. Adv Exp Med Biol 2006, 589:1–23.
6. Peters H, Balling R T: Where and how to make them. Trends Genet 1999,15(2):59–65.
7. Thesleff I: Epithelial-mesenchymal signalling regulating toothmorphogenesis. J Cell Sci 2003, 116(9):1647–1648.
8. Thesleff I, Aberg T: Molecular regulation of tooth development. Bone1999, 25(1):123–125.
9. Tucker AS, Sharpe PT: Molecular genetics of tooth morphogenesis andpatterning: the right shape in the right place. J Dent Res 1999, 78(4):826–834.
10. Cobourne MT, Sharpe PT: Sonic hedgehog signaling and the developingtooth. Curr Top Dev Biol 2005, 65:255–287.
11. Dassule HR, Lewis P, Bei M, Maas R, McMahon AP: Sonic hedgehogregulates growth and morphogenesis of the tooth. Development 2000,127(22):4775–4785.
12. Hardcastle Z, Hui CC, Sharpe PT: The Shh signalling pathway in earlytooth development. Cell Mol Biol (Noisy-le-Grand) 1999, 45(5):567–578.
13. Nie X, Luukko K, Kettunen P: BMP signalling in craniofacial development.Int J Dev Biol 2006, 50(6):511–521.
14. Nie X, Luukko K, Kettunen P: FGF signalling in craniofacial developmentand developmental disorders. Oral Dis 2006, 12(2):102–111.
15. Pispa J, Mikkola ML, Mustonen T, Thesleff I: Ectodysplasin, Edar andTNFRSF19 are expressed in complementary and overlapping patternsduring mouse embryogenesis. Gene Expr Patterns 2003, 3(5):675–679.
16. Tummers M, Thesleff I: The importance of signal pathway modulation inall aspects of tooth development. J Exp Zoolog B Mol Dev Evol 2009, 312B(4):309–319.
17. Thomas BL, Tucker AS, Qui M, Ferguson CA, Hardcastle Z, Rubenstein JL,Sharpe PT: Role of Dlx-1 and Dlx-2 genes in patterning of the murinedentition. Development 1997, 124(23):4811–4818.
18. Tucker AS, Al Khamis A, Sharpe PT: Interactions between Bmp-4 andMsx-1 act to restrict gene expression to odontogenic mesenchyme.Dev Dyn 1998, 212(4):533–539.
19. Mitsiadis TA, Drouin J: Deletion of the Pitx1 genomic locus affectsmandibular tooth morphogenesis and expression of the Barx1 and Tbx1genes. Dev Biol 2008, 313(2):887–896.
20. Mucchielli ML, Mitsiadis TA, Raffo S, Brunet JF, Proust JP, Goridis C: MouseOtlx2/RIEG expression in the odontogenic epithelium precedes toothinitiation and requires mesenchyme-derived signals for its maintenance.Dev Biol 1997, 189(2):275–284.
21. Lu MF, Pressman C, Dyer R, Johnson RL, Martin JF: Function of Riegersyndrome gene in left-right asymmetry and craniofacial development.Nature 1999, 401(6750):276–278.
22. Mark MP, Bloch-Zupan A, Ruch JV: Effects of retinoids on tooth morphogenesisand cytodifferentiations, in vitro. Int J Dev Biol 1992, 36(4):517–526.
23. Jernvall J, Thesleff I: Reiterative signaling and patterning duringmammalian tooth morphogenesis. Mech Dev 2000, 92(1):19–29.
24. Tucker AS, Yamada G, Grigoriou M, Pachnis V, Sharpe PT: Fgf-8 determinesrostral-caudal polarity in the first branchial arch. Development 1999,126(1):51–61.
25. Coudert AE, Pibouin L, Vi-Fane B, Thomas BL, Macdougall M, Choudhury A,Robert B, Sharpe PT, Berdal A, Lezot F: Expression and regulation of theMsx1 natural antisense transcript during development. Nucleic Acids Res2005, 33(16):5208–5218.
26. James CT, Ohazama A, Tucker AS, Sharpe PT: Tooth development isindependent of a Hox patterning programme. Dev Dyn 2002, 225(3):332–335.
27. Uchibe K, Shimizu H, Yokoyama S, Kuboki T, Asahara H: Identification ofnovel transcription-regulating genes expressed during murine molardevelopment. Dev Dyn 2012, 241(7):1217–1226.
28. Barbosa AC, Funato N, Chapman S, McKee MD, Richardson JA, Olson EN,Yanagisawa H: Hand transcription factors cooperatively regulatedevelopment of the distal midline mesenchyme. Dev Biol 2007,310(1):154–168.
29. Mitsiadis TA, Angeli I, James C, Lendahl U, Sharpe PT: Role of Islet1 in thepatterning of murine dentition. Development 2003, 130(18):4451–4460.
30. Thesleff I, Jernvall J: The enamel knot: a putative signaling centerregulating tooth development. Cold Spring Harb Symp Quant Biol 1997,62:257–267.
31. Kollar EJ, Baird GR: The influence of the dental papilla on thedevelopment of tooth shape in embryonic mouse tooth germs.J Embryol Exp Morphol 1969, 21(1):131–148.
32. Kollar EJ, Baird GR: Tissue interactions in embryonic mouse tooth germs.II. The inductive role of the dental papilla. J Embryol Exp Morphol 1970,24(1):173–186.
33. Caton J, Tucker AS: Current knowledge of tooth development: patterningand mineralization of the murine dentition. J Anat 2009, 214(4):502–515.
34. Fleischmannova J, Matalova E, Tucker AS, Sharpe PT: Mouse models oftooth abnormalities. Eur J Oral Sci 2008, 116(1):1–10.
35. Bloch-Zupan A, Sedano H, Scully C: Dento/Oro/Craniofacial Anomalies andGenetics. 1st edition. London: Elsevier Inc; 2012.
36. Hennekam JRCM, Krantz I, Allanson J: Gorlin's Syndromes of the Head andNeck. 5th edition. USA: Oxford University Press; 2010.
37. Gregory-Evans CY, Moosajee M, Hodges MD, Mackay DS, Game L, Vargesson N,Bloch-Zupan A, Ruschendorf F, Santos-Pinto L, Wackens G, et al: SNP genomescanning localizes oto-dental syndrome to chromosome 11q13 andmicrodeletions at this locus implicate FGF3 in dental and inner-ear diseaseand FADD in ocular coloboma. Hum Mol Genet 2007, 16(20):3482–3493.
38. Sirmaci A, Spiliopoulos M, Brancati F, Powell E, Duman D, Abrams A,Bademci G, Agolini E, Guo S, Konuk B, et al: Mutations in ANKRD11 CauseKBG Syndrome, Characterized by Intellectual Disability, SkeletalMalformations, and Macrodontia. Am J Hum Genet 2011, 89(2):289–294.
39. Rosenfeld JA, Ballif BC, Lucas A, Spence EJ, Powell C, Aylsworth AS, TorchiaBA, Shaffer LG: Small deletions of SATB2 cause some of the clinicalfeatures of the 2q33.1 microdeletion syndrome. PLoS One 2009,4(8):e6568.
40. Britanova O, Depew MJ, Schwark M, Thomas BL, Miletich I, Sharpe P,Tarabykin V: Satb2 haploinsufficiency phenocopies 2q32-q33 deletions,whereas loss suggests a fundamental role in the coordination of jawdevelopment. Am J Hum Genet 2006, 79(4):668–678.
41. Bloch-Zupan A, Jamet X, Etard C, Laugel V, Muller J, Geoffroy V, Strauss JP,Pelletier V, Marion V, Poch O, et al: Homozygosity mapping and candidateprioritization identify mutations, missed by whole-exome sequencing, inSMOC2, causing major dental developmental defects. Am J Hum Genet2011, 89(6):773–781.
42. Tissier-Seta JP, Mucchielli ML, Mark M, Mattei MG, Goridis C, Brunet JF: Barx1, anew mouse homeodomain transcription factor expressed in cranio-facialectomesenchyme and the stomach. Mech Dev 1995, 51(1):3–15.
43. Nonomura K, Takahashi M, Wakamatsu Y, Takano-Yamamoto T, Osumi N:Dynamic expression of Six family genes in the dental mesenchyme andthe epithelial ameloblast stem/progenitor cells during murine toothdevelopment. J Anat 2010, 216(1):80–91.
44. Abe M, Tamamura Y, Yamagishi H, Maeda T, Kato J, Tabata MJ, Srivastava D,Wakisaka S, Kurisu K: Tooth-type specific expression of dHAND/Hand2:
Laugel-Haushalter et al. BMC Research Notes 2013, 6:113 Page 15 of 15http://www.biomedcentral.com/1756-0500/6/113
possible involvement in murine lower incisor morphogenesis. Cell TissueRes 2002, 310(2):201–212.
45. Haldeman-Englert CR, Biser A, Zackai EH, Ming JE: A 223-kb de novodeletion of PAX9 in a patient with oligodontia. J Craniofac Surg 2010,21(3):837–839.
46. Grigoriou M, Tucker AS, Sharpe PT, Pachnis V: Expression and regulation ofLhx6 and Lhx7, a novel subfamily of LIM homeodomain encoding genes,suggests a role in mammalian head development. Development 1998,125(11):2063–2074.
47. Li J, Huang X, Xu X, Mayo J, Bringas P Jr, Jiang R, Wang S, Chai Y: SMAD4-mediated WNT signaling controls the fate of cranial neural crest cellsduring tooth morphogenesis. Development 2011, 138(10):1977–1989.
48. Lin D, Huang Y, He F, Gu S, Zhang G, Chen Y, Zhang Y: Expression surveyof genes critical for tooth development in the human embryonic toothgerm. Dev Dyn 2007, 236(5):1307–1312.
49. Kettunen P, Furmanek T, Chaulagain R, Kvinnsland IH, Luukko K:Developmentally regulated expression of intracellular Fgf11-13,hormone-like Fgf15 and canonical Fgf16, -17 and −20 mRNAs in thedeveloping mouse molar tooth. Acta Odontol Scand 2011, 69(6):360–366.
50. Shoji H, Ito T, Wakamatsu Y, Hayasaka N, Ohsaki K, Oyanagi M, Kominami R,Kondoh H, Takahashi N: Regionalized expression of the Dbx familyhomeobox genes in the embryonic CNS of the mouse. Mech Dev 1996,56(1–2):25–39.
51. Shibaguchi T, Kato J, Abe M, Tamamura Y, Tabata MJ, Liu JG, Iwamoto M,Wakisaka S, Wanaka A, Kurisu K: Expression and role of Lhx8 in murinetooth development. Arch Histol Cytol 2003, 66(1):95–108.
52. Nadiri A, Kuchler-Bopp S, Perrin-Schmitt F, Lesot H: Expression patterns ofBMPRs in the developing mouse molar. Cell Tissue Res 2006, 324(1):33–40.
53. Cho KW, Cai J, Kim HY, Hosoya A, Ohshima H, Choi KY, Jung HS: ERKactivation is involved in tooth development via FGF10 signaling. J ExpZool B Mol Dev Evol 2009, 312(8):901–911.
54. Cobourne MT, Miletich I, Sharpe PT: Restriction of sonic hedgehogsignalling during early tooth development. Development 2004,131(12):2875–2885.
55. Nakashima M, Toyono T, Murakami T, Akamine A: Transforming growthfactor-beta superfamily members expressed in rat incisor pulp. Arch OralBiol 1998, 43(9):745–751.
56. Wang W, Hart PS, Piesco NP, Lu X, Gorry MC, Hart TC: Aquaporinexpression in developing human teeth and selected orofacial tissues.Calcif Tissue Int 2003, 72(3):222–227.
57. Iwasaki K, Bajenova E, Somogyi-Ganss E, Miller M, Nguyen V, Nourkeyhani H,Gao Y, Wendel M, Ganss B: Amelotin–a Novel Secreted, Ameloblast-specific Protein. J Dent Res 2005, 84(12):1127–1132.
58. Takahashi KF, Kiyoshima T, Kobayashi I, Xie M, Yamaza H, Fujiwara H,Ookuma Y, Nagata K, Wada H, Sakai T, et al: Protogenin, a new member ofthe immunoglobulin superfamily, is implicated in the development ofthe mouse lower first molar. BMC Dev Biol 2010, 10:115.
59. Aruga J: Slitrk6 expression profile in the mouse embryo and itsrelationship to that of Nlrr3. Gene Expr Patterns 2003, 3(6):727–733.
60. Paiva KB, Silva-Valenzuela M, Massironi SM, Ko GM, Siqueira FM, Nunes FD:Differential Shh, Bmp and Wnt gene expressions during craniofacialdevelopment in mice. Acta Histochem 2010, 112(5):508–517.
61. Park KH, Han DI, Rhee YH, Jeong SJ, Kim SH, Park YG: Protein kinase CbetaII and delta/theta play critical roles in bone morphogenic protein-4-stimulated osteoblastic differentiation of MC3T3-E1 cells. BiochemBiophys Res Commun 2010, 403(1):7–12.
62. Raju K, Tang S, Dube ID, Kamel-Reid S, Bryce DM, Breitman ML:Characterization and developmental expression of Tlx-1, the murinehomolog of HOX11. Mech Dev 1993, 44(1):51–64.
63. Tahayato A, Dolle P, Petkovich M: Cyp26C1 encodes a novel retinoicacid-metabolizing enzyme expressed in the hindbrain, inner ear, firstbranchial arch and tooth buds during murine development. Gene ExprPatterns 2003, 3(4):449–454.
64. Mizuno N, Shiba H, Xu WP, Inui T, Fujita T, Kajiya M, Takeda K, Hasegawa N,Kawaguchi H, Kurihara H: Effect of neurotrophins on differentiation,calcification and proliferation in cultures of human pulp cells. Cell Biol Int2007, 31(12):1462–1469.
65. Liu D, Yao S, Wise GE: Regulation of SFRP-1 expression in the rat dentalfollicle. Connect Tissue Res 2012, 53(5):366–372.
66. Liu D, Wise GE: A DNA microarray analysis of chemokine and receptorgenes in the rat dental follicle–role of secreted frizzled-related protein-1in osteoclastogenesis. Bone 2007, 41(2):266–272.
67. Maas R, Bei M: The genetic control of early tooth development. Crit RevOral Biol Med 1997, 8(1):4–39.
68. Uz E, Alanay Y, Aktas D, Vargel I, Gucer S, Tuncbilek G, von Eggeling F,Yilmaz E, Deren O, Posorski N, et al: Disruption of ALX1 causes extrememicrophthalmia and severe facial clefting: expanding the spectrum ofautosomal-recessive ALX-related frontonasal dysplasia. Am J Hum Genet2010, 86(5):789–796.
69. Biben C, Wang CC, Harvey RP: NK-2 class homeobox genes andpharyngeal/oral patterning: Nkx2-3 is required for salivary gland andtooth morphogenesis. Int J Dev Biol 2002, 46(4):415–422.
70. Lezot F, Thomas B, Greene SR, Hotton D, Yuan ZA, Castaneda B, Bolanos A,Depew M, Sharpe P, Gibson CW, et al: Physiological implications of DLXhomeoproteins in enamel formation. J Cell Physiol 2008, 216(3):688–697.
71. Cobourne MT, Sharpe PT: Tooth and jaw: molecular mechanisms ofpatterning in the first branchial arch. Arch Oral Biol 2003, 48(1):1–14.
72. Sperber SM, Dawid IB: barx1 is necessary for ectomesenchymeproliferation and osteochondroprogenitor condensation in the zebrafishpharyngeal arches. Dev Biol 2008, 321(1):101–110.
73. Hardcastle Z, Mo R, Hui CC, Sharpe PT: The Shh signalling pathway intooth development: defects in Gli2 and Gli3 mutants. Development 1998,125(15):2803–2811.
74. Denaxa M, Sharpe PT, Pachnis V: The LIM homeodomain transcriptionfactors Lhx6 and Lhx7 are key regulators of mammalian dentition. DevBiol 2009, 333(2):324–336.
75. Tucker A, Sharpe P: The cutting-edge of mammalian development; howthe embryo makes teeth. Nat Rev Genet 2004, 5(7):499–508.
76. Bloch-Zupan A, Decimo D, Loriot M, Mark MP, Ruch JV: Expression ofnuclear retinoic acid receptors during mouse odontogenesis.Differentiation 1994, 57(3):195–203.
77. Bloch-Zupan A, Mark MP, Weber B, Ruch JV: In vitro effects of retinoic acidon mouse incisor development. Arch Oral Biol 1994, 39(10):891–900.
78. Charles C, Lazzari V, Tafforeau P, Schimmang T, Tekin M, Klein O, Viriot L:Modulation of Fgf3 dosage in mouse and men mirrors evolution ofmammalian dentition. Proc Natl Acad Sci U S A 2009, 106(52):22364–22368.
79. Kantaputra PN, Gorlin RJ: Double dens invaginatus of molarized maxillarycentral incisors, premolarization of maxillary lateral incisors,multituberculism of the mandibular incisors, canines and first premolar,and sensorineural hearing loss. Clin Dysmorphol 1992, 1(3):128–136.
80. Charles C, Hovorakova M, Ahn Y, Lyons DB, Marangoni P, Churava S, Biehs B,Jheon A, Lesot H, Balooch G, et al: Regulation of tooth number by fine-tuning levels of receptor-tyrosine kinase signaling. Development 2011,138(18):4063–4073.
81. Edgar R, Domrachev M, Lash AE: Gene Expression Omnibus: NCBI geneexpression and hybridization array data repository. Nucleic Acids Res 2002,30(1):207–210.
doi:10.1186/1756-0500-6-113Cite this article as: Laugel-Haushalter et al.: Molars and incisors: showyour microarray IDs. BMC Research Notes 2013 6:113.
Submit your next manuscript to BioMed Centraland take full advantage of:
• Convenient online submission
• Thorough peer review
• No space constraints or color figure charges
• Immediate publication on acceptance
• Inclusion in PubMed, CAS, Scopus and Google Scholar
• Research which is freely available for redistribution
Submit your manuscript at www.biomedcentral.com/submit