research article open access mesencephalic dopaminergic...
TRANSCRIPT
Grison et al. BMC Genomics 2014, 15:729http://www.biomedcentral.com/1471-2164/15/729
RESEARCH ARTICLE Open Access
Mesencephalic dopaminergic neurons express arepertoire of olfactory receptors and respond toodorant-like moleculesAlice Grison1†, Silvia Zucchelli1,2†, Alice Urzì1, Ilaria Zamparo3, Dejan Lazarevic1,4, Giovanni Pascarella1,5,6,Paola Roncaglia1,14, Alejandro Giorgetti7,8, Paula Garcia-Esparcia9, Christina Vlachouli1, Roberto Simone1,Francesca Persichetti2, Alistair RR Forrest5,6, Yoshihide Hayashizaki5,6,10, Paolo Carloni7,11,12, Isidro Ferrer9,Claudia Lodovichi3, Charles Plessy5,6, the FANTOM Consortium, Piero Carninci5,6* and Stefano Gustincich1,13*
Abstract
Background: The mesencephalic dopaminergic (mDA) cell system is composed of two major groups of projectingcells in the Substantia Nigra (SN) (A9 neurons) and the Ventral Tegmental Area (VTA) (A10 cells). Selectivedegeneration of A9 neurons occurs in Parkinson’s disease (PD) while abnormal function of A10 cells has beenlinked to schizophrenia, attention deficit and addiction. The molecular basis that underlies selective vulnerability ofA9 and A10 neurons is presently unknown.
Results: By taking advantage of transgenic labeling, laser capture microdissection coupled to nano Cap-Analysisof Gene Expression (nanoCAGE) technology on isolated A9 and A10 cells, we found that a subset of OlfactoryReceptors (OR)s is expressed in mDA neurons. Gene expression analysis was integrated with the FANTOM5 HelicosCAGE sequencing datasets, showing the presence of these ORs in selected tissues and brain areas outside of theolfactory epithelium. OR expression in the mesencephalon was validated by RT-PCR and in situ hybridization. Byscreening 16 potential ligands on 5 mDA ORs recombinantly expressed in an heterologous in vitro system, weidentified carvone enantiomers as agonists at Olfr287 and able to evoke an intracellular Ca2+ increase in solitarymDA neurons. ORs were found expressed in human SN and down-regulated in PD post mortem brains.
Conclusions: Our study indicates that mDA neurons express ORs and respond to odor-like molecules providingnew opportunities for pharmacological intervention in disease.
Keywords: NanoCAGE, Odors, Odorant receptors, Dopaminergic neurons, Ventral midbrain
BackgroundDopaminergic (DA) neurons are an anatomically andfunctionally heterogeneous group of cells involved in awide range of neuronal network activities and behavior[1]. Among them, mesencephalic dopaminergic neurons(mDA) are the major source of dopamine in the brain.They present two major groups of projecting cells: theA9 neurons of the Substantia Nigra (SN) that form themesostriatal system and the A10 cells of the Ventral
* Correspondence: [email protected]; [email protected]†Equal contributors5RIKEN Omics Science Center, Yokohama, Kanagawa 230-0045, Japan1SISSA, Area of Neuroscience, via Bonomea 265, 34136 Trieste, ItalyFull list of author information is available at the end of the article
© 2014 Grison et al.; licensee BioMed CentralCommons Attribution License (http://creativecreproduction in any medium, provided the orDedication waiver (http://creativecommons.orunless otherwise stated.
Tegmental Area (VTA) that constitute the mesocortico-limbic pathway [2]. SN neurons are involved in regulatingvoluntary movements and postural reflexes while VTAcells play a fundamental role in reward and attention.Dysfunction of DA neurons has been implicated in sev-
eral neurodegenerative and psychiatric disorders. Selectivedegeneration of A9 cells leads to Parkinson’s Disease (PD)[3], while altered function of A10 cells has been linked toschizophrenia, attention deficit disorder and addiction [4].These cells share many characteristics including the en-
zymatic pathways involved in dopamine synthesis, releaseand metabolism. They also present common intrinsic elec-trophysiological properties like a spontaneous pacemakeractivity when in absence of synaptic inputs.
Ltd. This is an Open Access article distributed under the terms of the Creativeommons.org/licenses/by/2.0), which permits unrestricted use, distribution, andiginal work is properly credited. The Creative Commons Public Domaing/publicdomain/zero/1.0/) applies to the data made available in this article,
Grison et al. BMC Genomics 2014, 15:729 Page 2 of 16http://www.biomedcentral.com/1471-2164/15/729
The description of the repertoire of genes expressed inmDA neurons may provide crucial information on theirphysiology and on the mechanisms of cell-type specificdysfunction [5-7].Cap Analysis of Gene Expression (CAGE) technology
was previously developed for the systematic analysis ofTranscription Start Sites (TSS)s in eukaryotic cells andtissues [8]. It is based on sequencing cDNA copies of the5′ends of mRNAs, of which the integrity is inferred bythe presence of their cap. These sequences—referred toas tags—are sufficiently long to be aligned in most casesat a single location in the genome. The first position ofthis alignment identifies a base pair where transcriptionis initiated defining a TSS. The number of times a giventag is represented in a library gives an estimate of theexpression level of the corresponding transcript. Ourprevious analysis with CAGE has shown that promoterscan vary in shape, with some genes having a strong pref-erence for initiating transcription from a single genomicposition (sharp promoters), while others use a broadcollection of TSSs within a region of approximately onehundred bases [9,10].In the current FANTOM5 project, a modified protocol
of CAGE for high-throughput single molecule next-generation sequencing with Helicos (hCAGE) has beenapplied to a wide range of human and mouse tissuesproviding an unprecedented dataset for promoter usageanalysis [11]. Although very broad, the study was limitedto samples where 1-5 μg of total RNA could be obtained.To expand this analysis to tiny amounts of ex vivo tissueand to the polyA− fraction of RNAs, we developednanoCAGE, a technology that miniaturizes the require-ment of CAGE for RNA material to the nanogram rangeand which can be used on fixed tissues [12].NanoCAGE has been recently applied to identify the
genome-wide collection of active TSSs of the mouseOlfactory Epithelium (OE) [13]. In this tissue the detectionof a vast repertoire of volatile compounds (odors) is ac-complished by a large family of Olfactory Receptors (ORs),with more than 1100 intact genes in mouse and about 350in human. NanoCAGE revealed the map and architectureof promoters for 87.5% of the mouse OR genes [13].To gain further insights into the physiology and
dysfunction of mDA neurons, we have carried out lasercapture microdissection (LCM) combined with nanoCAGEtechnology to profile the genes expressed in A9 and A10DA cells.Here we show that a repertoire of OR genes is
expressed in mDA neurons (mDA-ORs). We then dem-onstrate that selected odor molecules stimulate recombi-nantly expressed mDA-ORs in heterologous cells andtrigger Ca2+ signaling in isolated primary mDA neurons.Finally, we identify several ORs that are expressed in thehuman SN and down-regulated in PD.
This work is part of the FANTOM5 project. Datadownloads, genomic tools and co-published manuscriptsare summarized here: http://fantom.gsc.riken.jp/5/.
ResultsIdentification of ORs transcripts by expression analysis ofmDA neuronsWe have determined the gene expression profiles of mDAneurons with nanoCAGE technology. To this purpose wetook advantage of transgenic mice that selectively expressgreen fluorescent protein (GFP) in catecholaminergic cellsunder the control of tyrosine hydroxylase (TH) gene pro-moter (TH-GFP mice) [14]. In this mouse line we canidentify the majority of mDA neurons for their GFP label-ing. Furthermore, we can distinguish A9 neurons fromA10 for their anatomical localization. Thus, LCM andpressure catapulting were used to harvest A9 and A10cells after fixation with a zinc fix-based method thatassured the preservation of both tissue morphology andRNA integrity. RNA was then used as template for nanoC-AGE library synthesis. The complete description of A9 andA10-specific transcriptional landscape is presented else-where (Lazarevic D, Bertin N, Franke V, Vlachouli C,Caiazzo M, Plessy C, Akalin A, Vatta P, Simone R, RoncagliaP, Daub CO, Faulkner GJ, Broccoli V, Lenhard B, Carninci P,Gustincich S: The promotorome of adult dopaminergicneurons of the mouse Substantia Nigra identifies newgene networks for cell conversion. Submitted).These results have been integrated with Affymetrix-
based gene expression datasets of A9 and A10 cellsavailable in the laboratory [15].Surprisingly, transcripts for OR genes have been found
expressed in mDA neurons (Additional file 1: Table S1).Nine ORs were validated with RT-PCR from ventralmidbrain (MB) with the appropriate controls (Figure 1a).Cloning and sequencing of PCR products verified theiridentity.5 out of 6 ORs identified by nanoCAGE and validated
by RT-PCR display in mDA neurons a TSS very similarif not identical to the canonical TSS found in OE [13](Figure 1b). OR promoters in mDA cells were of a sharptype, with a single dominant TSS, as in the OE. Expres-sion values, measured as number of tags per million(TPM), ranged from 4.29 (Olfr316) to 1.3 (Olfr1288).Since in the OE the functional activation of ORs re-
quires Gαolf and Adenyl Cyclase III (Adcy3), we monitoredtheir expression in our datasets showing that both signal-ing molecules were present in A9 and A10 mDA neurons(Additional file 2: Figure S1a). Their expression was alsodetected in FANTOM5 libraries derived from mouse SN(Additional file 2: Figure S1b).Altogether our results indicate that OR genes as well as
components of the olfactory signaling system are expressedin mDA neurons.
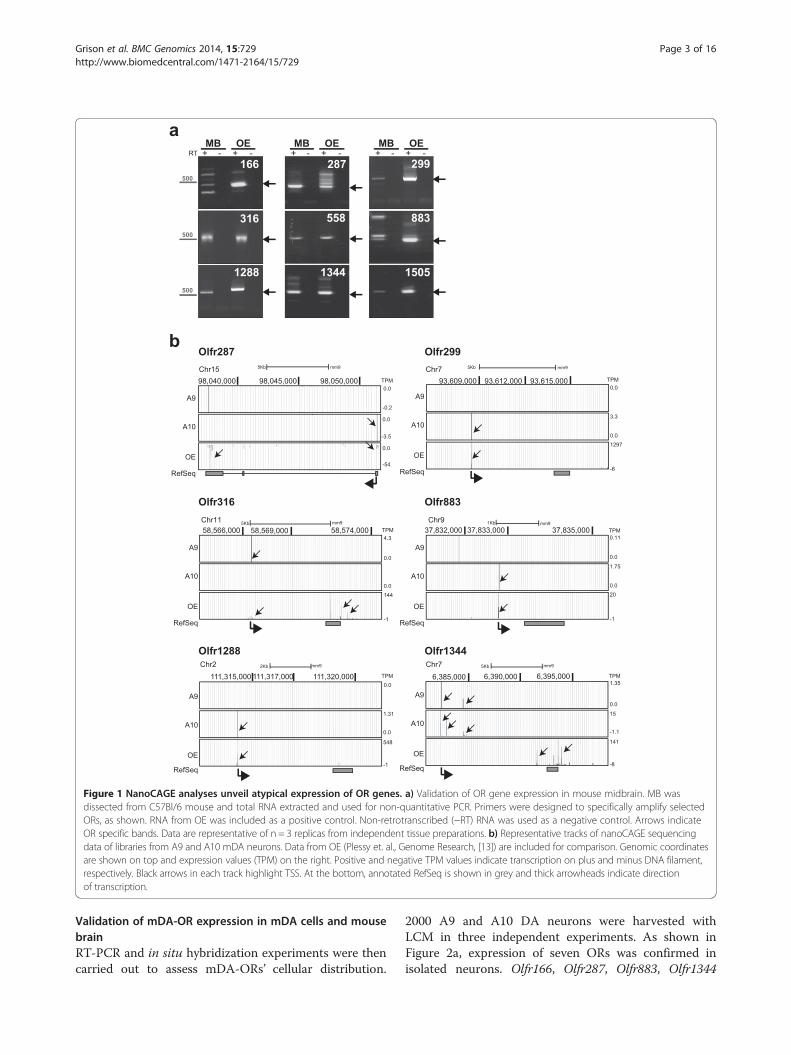
Figure 1 NanoCAGE analyses unveil atypical expression of OR genes. a) Validation of OR gene expression in mouse midbrain. MB wasdissected from C57Bl/6 mouse and total RNA extracted and used for non-quantitative PCR. Primers were designed to specifically amplify selectedORs, as shown. RNA from OE was included as a positive control. Non-retrotranscribed (−RT) RNA was used as a negative control. Arrows indicateOR specific bands. Data are representative of n = 3 replicas from independent tissue preparations. b) Representative tracks of nanoCAGE sequencingdata of libraries from A9 and A10 mDA neurons. Data from OE (Plessy et. al., Genome Research, [13]) are included for comparison. Genomic coordinatesare shown on top and expression values (TPM) on the right. Positive and negative TPM values indicate transcription on plus and minus DNA filament,respectively. Black arrows in each track highlight TSS. At the bottom, annotated RefSeq is shown in grey and thick arrowheads indicate directionof transcription.
Grison et al. BMC Genomics 2014, 15:729 Page 3 of 16http://www.biomedcentral.com/1471-2164/15/729
Validation of mDA-OR expression in mDA cells and mousebrainRT-PCR and in situ hybridization experiments were thencarried out to assess mDA-ORs’ cellular distribution.
2000 A9 and A10 DA neurons were harvested withLCM in three independent experiments. As shown inFigure 2a, expression of seven ORs was confirmed inisolated neurons. Olfr166, Olfr287, Olfr883, Olfr1344
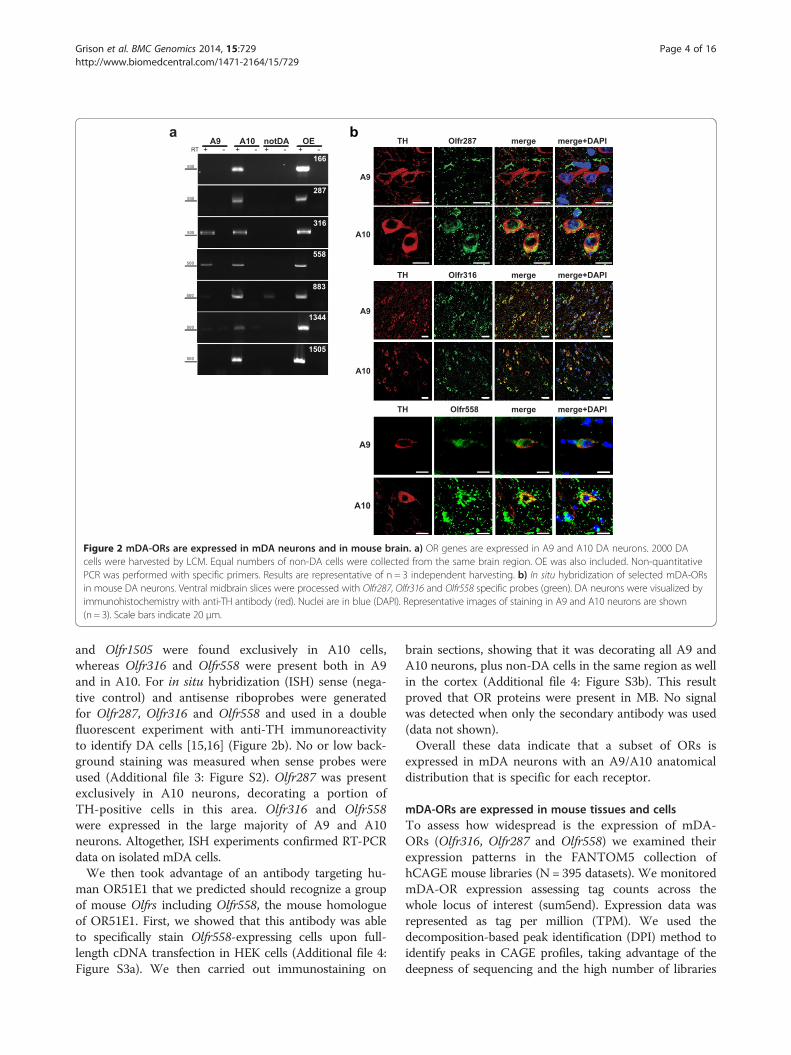
Figure 2 mDA-ORs are expressed in mDA neurons and in mouse brain. a) OR genes are expressed in A9 and A10 DA neurons. 2000 DAcells were harvested by LCM. Equal numbers of non-DA cells were collected from the same brain region. OE was also included. Non-quantitativePCR was performed with specific primers. Results are representative of n = 3 independent harvesting. b) In situ hybridization of selected mDA-ORsin mouse DA neurons. Ventral midbrain slices were processed with Olfr287, Olfr316 and Olfr558 specific probes (green). DA neurons were visualized byimmunohistochemistry with anti-TH antibody (red). Nuclei are in blue (DAPI). Representative images of staining in A9 and A10 neurons are shown(n = 3). Scale bars indicate 20 μm.
Grison et al. BMC Genomics 2014, 15:729 Page 4 of 16http://www.biomedcentral.com/1471-2164/15/729
and Olfr1505 were found exclusively in A10 cells,whereas Olfr316 and Olfr558 were present both in A9and in A10. For in situ hybridization (ISH) sense (nega-tive control) and antisense riboprobes were generatedfor Olfr287, Olfr316 and Olfr558 and used in a doublefluorescent experiment with anti-TH immunoreactivityto identify DA cells [15,16] (Figure 2b). No or low back-ground staining was measured when sense probes wereused (Additional file 3: Figure S2). Olfr287 was presentexclusively in A10 neurons, decorating a portion ofTH-positive cells in this area. Olfr316 and Olfr558were expressed in the large majority of A9 and A10neurons. Altogether, ISH experiments confirmed RT-PCRdata on isolated mDA cells.We then took advantage of an antibody targeting hu-
man OR51E1 that we predicted should recognize a groupof mouse Olfrs including Olfr558, the mouse homologueof OR51E1. First, we showed that this antibody was ableto specifically stain Olfr558-expressing cells upon full-length cDNA transfection in HEK cells (Additional file 4:Figure S3a). We then carried out immunostaining on
brain sections, showing that it was decorating all A9 andA10 neurons, plus non-DA cells in the same region as wellin the cortex (Additional file 4: Figure S3b). This resultproved that OR proteins were present in MB. No signalwas detected when only the secondary antibody was used(data not shown).Overall these data indicate that a subset of ORs is
expressed in mDA neurons with an A9/A10 anatomicaldistribution that is specific for each receptor.
mDA-ORs are expressed in mouse tissues and cellsTo assess how widespread is the expression of mDA-ORs (Olfr316, Olfr287 and Olfr558) we examined theirexpression patterns in the FANTOM5 collection ofhCAGE mouse libraries (N = 395 datasets). We monitoredmDA-OR expression assessing tag counts across thewhole locus of interest (sum5end). Expression data wasrepresented as tag per million (TPM). We used thedecomposition-based peak identification (DPI) method toidentify peaks in CAGE profiles, taking advantage of thedeepness of sequencing and the high number of libraries
Grison et al. BMC Genomics 2014, 15:729 Page 5 of 16http://www.biomedcentral.com/1471-2164/15/729
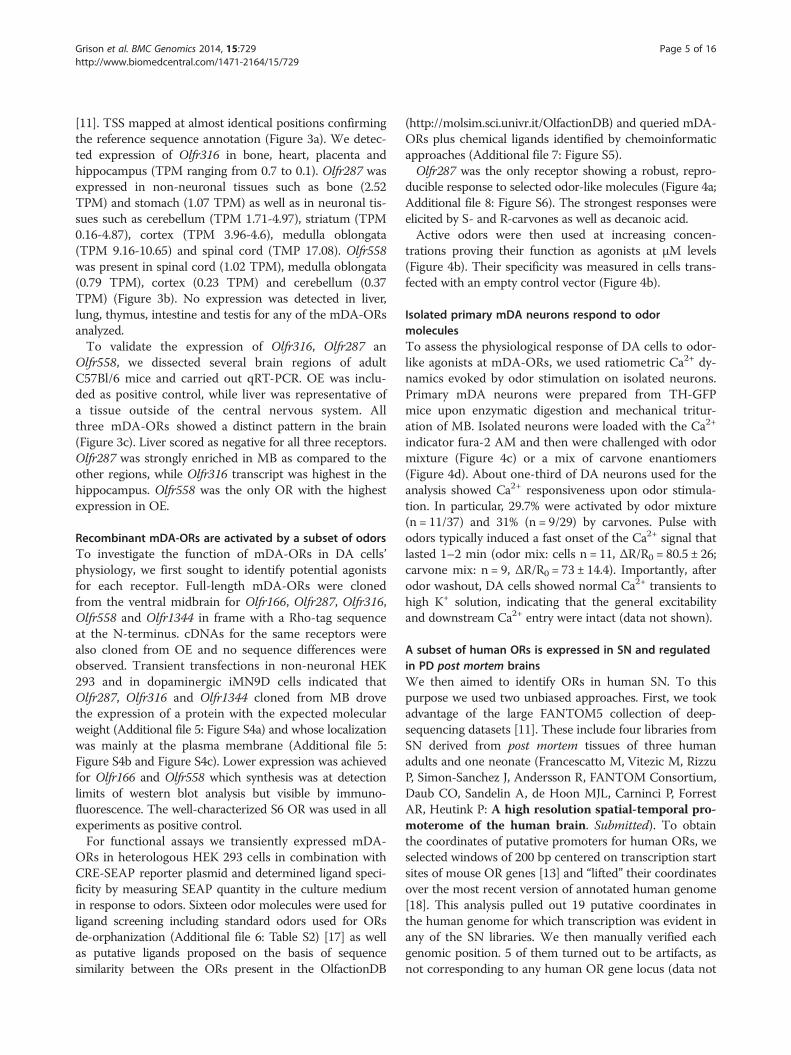
[11]. TSS mapped at almost identical positions confirmingthe reference sequence annotation (Figure 3a). We detec-ted expression of Olfr316 in bone, heart, placenta andhippocampus (TPM ranging from 0.7 to 0.1). Olfr287 wasexpressed in non-neuronal tissues such as bone (2.52TPM) and stomach (1.07 TPM) as well as in neuronal tis-sues such as cerebellum (TPM 1.71-4.97), striatum (TPM0.16-4.87), cortex (TPM 3.96-4.6), medulla oblongata(TPM 9.16-10.65) and spinal cord (TMP 17.08). Olfr558was present in spinal cord (1.02 TPM), medulla oblongata(0.79 TPM), cortex (0.23 TPM) and cerebellum (0.37TPM) (Figure 3b). No expression was detected in liver,lung, thymus, intestine and testis for any of the mDA-ORsanalyzed.To validate the expression of Olfr316, Olfr287 an
Olfr558, we dissected several brain regions of adultC57Bl/6 mice and carried out qRT-PCR. OE was inclu-ded as positive control, while liver was representative ofa tissue outside of the central nervous system. Allthree mDA-ORs showed a distinct pattern in the brain(Figure 3c). Liver scored as negative for all three receptors.Olfr287 was strongly enriched in MB as compared to theother regions, while Olfr316 transcript was highest in thehippocampus. Olfr558 was the only OR with the highestexpression in OE.
Recombinant mDA-ORs are activated by a subset of odorsTo investigate the function of mDA-ORs in DA cells’physiology, we first sought to identify potential agonistsfor each receptor. Full-length mDA-ORs were clonedfrom the ventral midbrain for Olfr166, Olfr287, Olfr316,Olfr558 and Olfr1344 in frame with a Rho-tag sequenceat the N-terminus. cDNAs for the same receptors werealso cloned from OE and no sequence differences wereobserved. Transient transfections in non-neuronal HEK293 and in dopaminergic iMN9D cells indicated thatOlfr287, Olfr316 and Olfr1344 cloned from MB drovethe expression of a protein with the expected molecularweight (Additional file 5: Figure S4a) and whose localizationwas mainly at the plasma membrane (Additional file 5:Figure S4b and Figure S4c). Lower expression was achievedfor Olfr166 and Olfr558 which synthesis was at detectionlimits of western blot analysis but visible by immuno-fluorescence. The well-characterized S6 OR was used in allexperiments as positive control.For functional assays we transiently expressed mDA-
ORs in heterologous HEK 293 cells in combination withCRE-SEAP reporter plasmid and determined ligand speci-ficity by measuring SEAP quantity in the culture mediumin response to odors. Sixteen odor molecules were used forligand screening including standard odors used for ORsde-orphanization (Additional file 6: Table S2) [17] as wellas putative ligands proposed on the basis of sequencesimilarity between the ORs present in the OlfactionDB
(http://molsim.sci.univr.it/OlfactionDB) and queried mDA-ORs plus chemical ligands identified by chemoinformaticapproaches (Additional file 7: Figure S5).Olfr287 was the only receptor showing a robust, repro-
ducible response to selected odor-like molecules (Figure 4a;Additional file 8: Figure S6). The strongest responses wereelicited by S- and R-carvones as well as decanoic acid.Active odors were then used at increasing concen-
trations proving their function as agonists at μM levels(Figure 4b). Their specificity was measured in cells trans-fected with an empty control vector (Figure 4b).
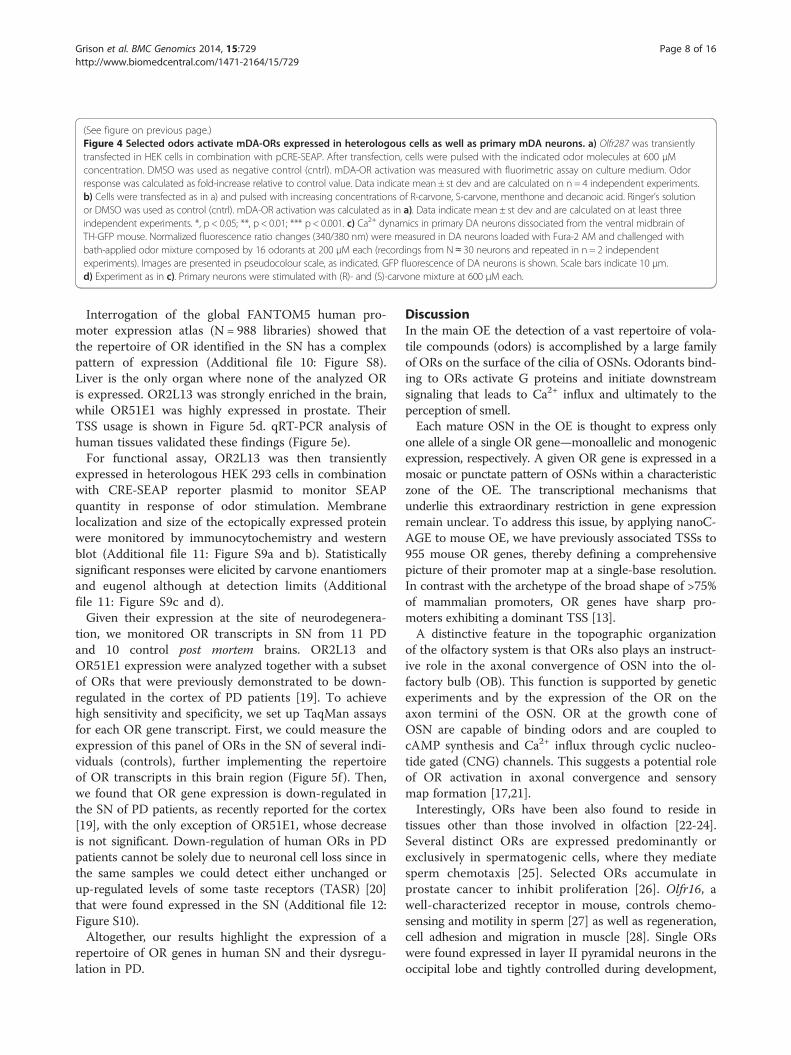
Isolated primary mDA neurons respond to odormoleculesTo assess the physiological response of DA cells to odor-like agonists at mDA-ORs, we used ratiometric Ca2+ dy-namics evoked by odor stimulation on isolated neurons.Primary mDA neurons were prepared from TH-GFPmice upon enzymatic digestion and mechanical tritur-ation of MB. Isolated neurons were loaded with the Ca2+
indicator fura-2 AM and then were challenged with odormixture (Figure 4c) or a mix of carvone enantiomers(Figure 4d). About one-third of DA neurons used for theanalysis showed Ca2+ responsiveness upon odor stimula-tion. In particular, 29.7% were activated by odor mixture(n = 11/37) and 31% (n = 9/29) by carvones. Pulse withodors typically induced a fast onset of the Ca2+ signal thatlasted 1–2 min (odor mix: cells n = 11, ΔR/R0 = 80.5 ± 26;carvone mix: n = 9, ΔR/R0 = 73 ± 14.4). Importantly, afterodor washout, DA cells showed normal Ca2+ transients tohigh K+ solution, indicating that the general excitabilityand downstream Ca2+ entry were intact (data not shown).
A subset of human ORs is expressed in SN and regulatedin PD post mortem brainsWe then aimed to identify ORs in human SN. To thispurpose we used two unbiased approaches. First, we tookadvantage of the large FANTOM5 collection of deep-sequencing datasets [11]. These include four libraries fromSN derived from post mortem tissues of three humanadults and one neonate (Francescatto M, Vitezic M, RizzuP, Simon-Sanchez J, Andersson R, FANTOM Consortium,Daub CO, Sandelin A, de Hoon MJL, Carninci P, ForrestAR, Heutink P: A high resolution spatial-temporal pro-moterome of the human brain. Submitted). To obtainthe coordinates of putative promoters for human ORs, weselected windows of 200 bp centered on transcription startsites of mouse OR genes [13] and “lifted” their coordinatesover the most recent version of annotated human genome[18]. This analysis pulled out 19 putative coordinates inthe human genome for which transcription was evident inany of the SN libraries. We then manually verified eachgenomic position. 5 of them turned out to be artifacts, asnot corresponding to any human OR gene locus (data not
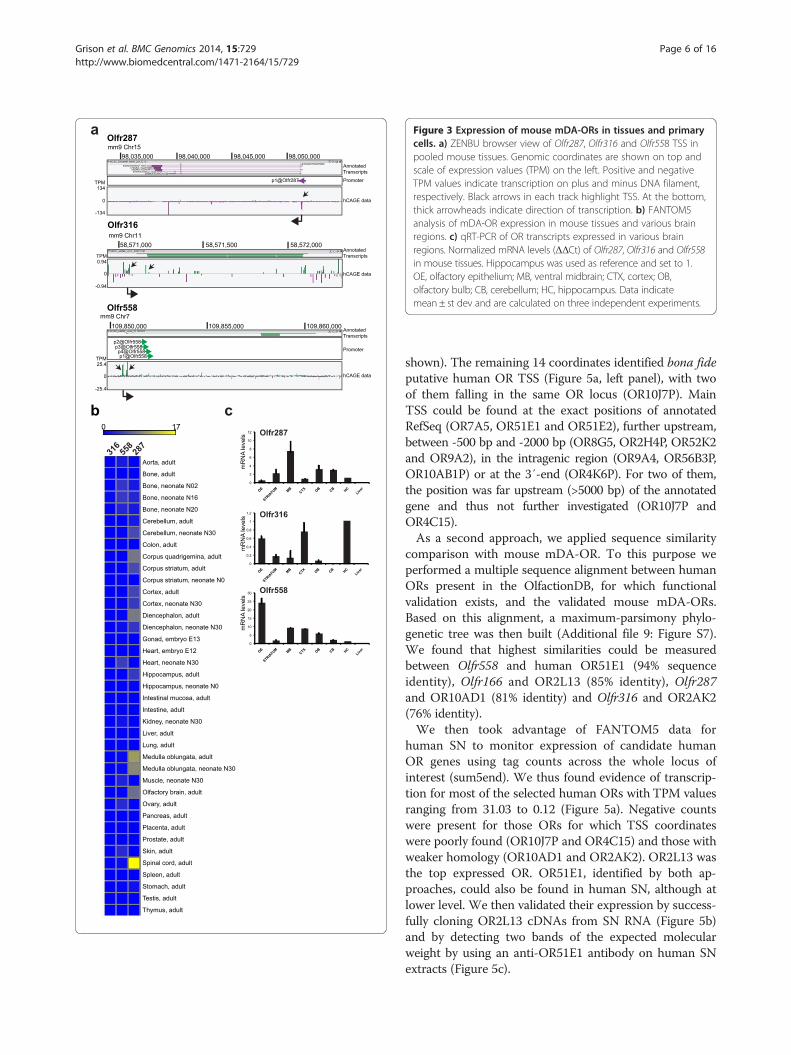
Figure 3 Expression of mouse mDA-ORs in tissues and primarycells. a) ZENBU browser view of Olfr287, Olfr316 and Olfr558 TSS inpooled mouse tissues. Genomic coordinates are shown on top andscale of expression values (TPM) on the left. Positive and negativeTPM values indicate transcription on plus and minus DNA filament,respectively. Black arrows in each track highlight TSS. At the bottom,thick arrowheads indicate direction of transcription. b) FANTOM5analysis of mDA-OR expression in mouse tissues and various brainregions. c) qRT-PCR of OR transcripts expressed in various brainregions. Normalized mRNA levels (ΔΔCt) of Olfr287, Olfr316 and Olfr558in mouse tissues. Hippocampus was used as reference and set to 1.OE, olfactory epithelium; MB, ventral midbrain; CTX, cortex; OB,olfactory bulb; CB, cerebellum; HC, hippocampus. Data indicatemean ± st dev and are calculated on three independent experiments.
Grison et al. BMC Genomics 2014, 15:729 Page 6 of 16http://www.biomedcentral.com/1471-2164/15/729
shown). The remaining 14 coordinates identified bona fideputative human OR TSS (Figure 5a, left panel), with twoof them falling in the same OR locus (OR10J7P). MainTSS could be found at the exact positions of annotatedRefSeq (OR7A5, OR51E1 and OR51E2), further upstream,between -500 bp and -2000 bp (OR8G5, OR2H4P, OR52K2and OR9A2), in the intragenic region (OR9A4, OR56B3P,OR10AB1P) or at the 3′-end (OR4K6P). For two of them,the position was far upstream (>5000 bp) of the annotatedgene and thus not further investigated (OR10J7P andOR4C15).As a second approach, we applied sequence similarity
comparison with mouse mDA-OR. To this purpose weperformed a multiple sequence alignment between humanORs present in the OlfactionDB, for which functionalvalidation exists, and the validated mouse mDA-ORs.Based on this alignment, a maximum-parsimony phylo-genetic tree was then built (Additional file 9: Figure S7).We found that highest similarities could be measuredbetween Olfr558 and human OR51E1 (94% sequenceidentity), Olfr166 and OR2L13 (85% identity), Olfr287and OR10AD1 (81% identity) and Olfr316 and OR2AK2(76% identity).We then took advantage of FANTOM5 data for
human SN to monitor expression of candidate humanOR genes using tag counts across the whole locus ofinterest (sum5end). We thus found evidence of transcrip-tion for most of the selected human ORs with TPM valuesranging from 31.03 to 0.12 (Figure 5a). Negative countswere present for those ORs for which TSS coordinateswere poorly found (OR10J7P and OR4C15) and those withweaker homology (OR10AD1 and OR2AK2). OR2L13 wasthe top expressed OR. OR51E1, identified by both ap-proaches, could also be found in human SN, although atlower level. We then validated their expression by success-fully cloning OR2L13 cDNAs from SN RNA (Figure 5b)and by detecting two bands of the expected molecularweight by using an anti-OR51E1 antibody on human SNextracts (Figure 5c).
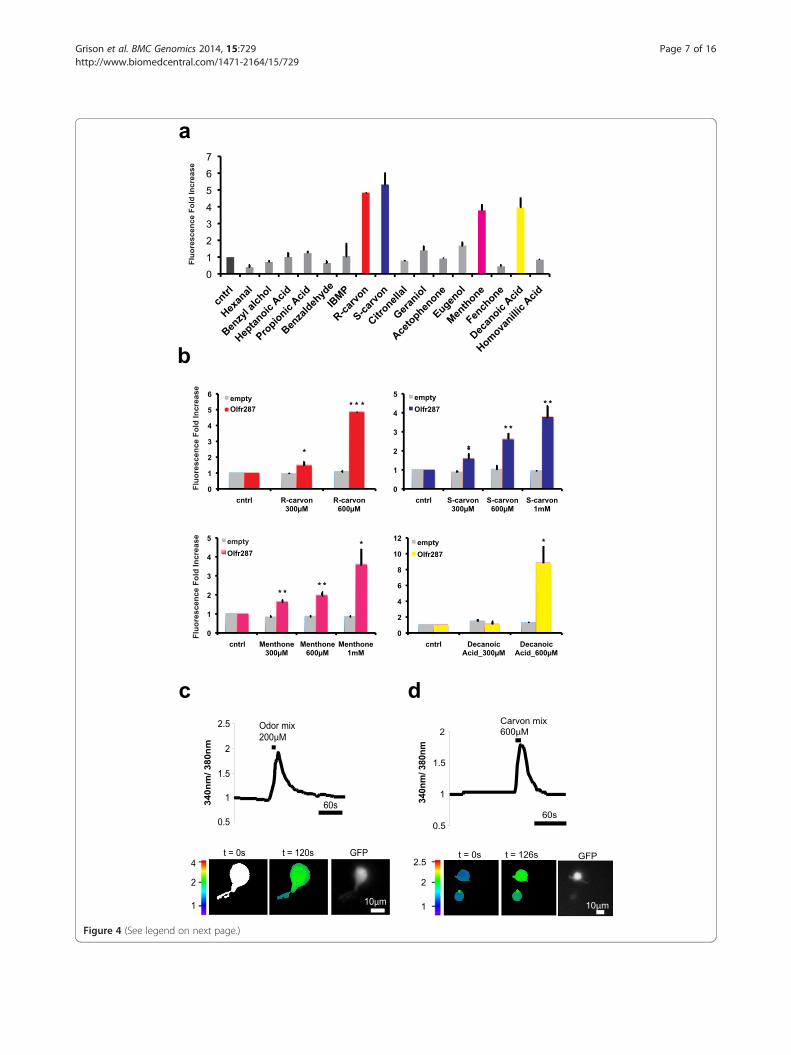
Figure 4 (See legend on next page.)
Grison et al. BMC Genomics 2014, 15:729 Page 7 of 16http://www.biomedcentral.com/1471-2164/15/729
(See figure on previous page.)Figure 4 Selected odors activate mDA-ORs expressed in heterologous cells as well as primary mDA neurons. a) Olfr287 was transientlytransfected in HEK cells in combination with pCRE-SEAP. After transfection, cells were pulsed with the indicated odor molecules at 600 μMconcentration. DMSO was used as negative control (cntrl). mDA-OR activation was measured with fluorimetric assay on culture medium. Odorresponse was calculated as fold-increase relative to control value. Data indicate mean ± st dev and are calculated on n = 4 independent experiments.b) Cells were transfected as in a) and pulsed with increasing concentrations of R-carvone, S-carvone, menthone and decanoic acid. Ringer’s solutionor DMSO was used as control (cntrl). mDA-OR activation was calculated as in a). Data indicate mean ± st dev and are calculated on at least threeindependent experiments. *, p < 0.05; **, p < 0.01; *** p < 0.001. c) Ca2+ dynamics in primary DA neurons dissociated from the ventral midbrain ofTH-GFP mouse. Normalized fluorescence ratio changes (340/380 nm) were measured in DA neurons loaded with Fura-2 AM and challenged withbath-applied odor mixture composed by 16 odorants at 200 μM each (recordings from N ≈ 30 neurons and repeated in n = 2 independentexperiments). Images are presented in pseudocolour scale, as indicated. GFP fluorescence of DA neurons is shown. Scale bars indicate 10 μm.d) Experiment as in c). Primary neurons were stimulated with (R)- and (S)-carvone mixture at 600 μM each.
Grison et al. BMC Genomics 2014, 15:729 Page 8 of 16http://www.biomedcentral.com/1471-2164/15/729
Interrogation of the global FANTOM5 human pro-moter expression atlas (N = 988 libraries) showed thatthe repertoire of OR identified in the SN has a complexpattern of expression (Additional file 10: Figure S8).Liver is the only organ where none of the analyzed ORis expressed. OR2L13 was strongly enriched in the brain,while OR51E1 was highly expressed in prostate. TheirTSS usage is shown in Figure 5d. qRT-PCR analysis ofhuman tissues validated these findings (Figure 5e).For functional assay, OR2L13 was then transiently
expressed in heterologous HEK 293 cells in combinationwith CRE-SEAP reporter plasmid to monitor SEAPquantity in response of odor stimulation. Membranelocalization and size of the ectopically expressed proteinwere monitored by immunocytochemistry and westernblot (Additional file 11: Figure S9a and b). Statisticallysignificant responses were elicited by carvone enantiomersand eugenol although at detection limits (Additionalfile 11: Figure S9c and d).Given their expression at the site of neurodegenera-
tion, we monitored OR transcripts in SN from 11 PDand 10 control post mortem brains. OR2L13 andOR51E1 expression were analyzed together with a subsetof ORs that were previously demonstrated to be down-regulated in the cortex of PD patients [19]. To achievehigh sensitivity and specificity, we set up TaqMan assaysfor each OR gene transcript. First, we could measure theexpression of this panel of ORs in the SN of several indi-viduals (controls), further implementing the repertoireof OR transcripts in this brain region (Figure 5f ). Then,we found that OR gene expression is down-regulated inthe SN of PD patients, as recently reported for the cortex[19], with the only exception of OR51E1, whose decreaseis not significant. Down-regulation of human ORs in PDpatients cannot be solely due to neuronal cell loss since inthe same samples we could detect either unchanged orup-regulated levels of some taste receptors (TASR) [20]that were found expressed in the SN (Additional file 12:Figure S10).Altogether, our results highlight the expression of a
repertoire of OR genes in human SN and their dysregu-lation in PD.
DiscussionIn the main OE the detection of a vast repertoire of vola-tile compounds (odors) is accomplished by a large familyof ORs on the surface of the cilia of OSNs. Odorants bind-ing to ORs activate G proteins and initiate downstreamsignaling that leads to Ca2+ influx and ultimately to theperception of smell.Each mature OSN in the OE is thought to express only
one allele of a single OR gene—monoallelic and monogenicexpression, respectively. A given OR gene is expressed in amosaic or punctate pattern of OSNs within a characteristiczone of the OE. The transcriptional mechanisms thatunderlie this extraordinary restriction in gene expressionremain unclear. To address this issue, by applying nanoC-AGE to mouse OE, we have previously associated TSSs to955 mouse OR genes, thereby defining a comprehensivepicture of their promoter map at a single-base resolution.In contrast with the archetype of the broad shape of >75%of mammalian promoters, OR genes have sharp pro-moters exhibiting a dominant TSS [13].A distinctive feature in the topographic organization
of the olfactory system is that ORs also plays an instruct-ive role in the axonal convergence of OSN into the ol-factory bulb (OB). This function is supported by geneticexperiments and by the expression of the OR on theaxon termini of the OSN. OR at the growth cone ofOSN are capable of binding odors and are coupled tocAMP synthesis and Ca2+ influx through cyclic nucleo-tide gated (CNG) channels. This suggests a potential roleof OR activation in axonal convergence and sensorymap formation [17,21].Interestingly, ORs have been also found to reside in
tissues other than those involved in olfaction [22-24].Several distinct ORs are expressed predominantly orexclusively in spermatogenic cells, where they mediatesperm chemotaxis [25]. Selected ORs accumulate inprostate cancer to inhibit proliferation [26]. Olfr16, awell-characterized receptor in mouse, controls chemo-sensing and motility in sperm [27] as well as regeneration,cell adhesion and migration in muscle [28]. Single ORswere found expressed in layer II pyramidal neurons in theoccipital lobe and tightly controlled during development,
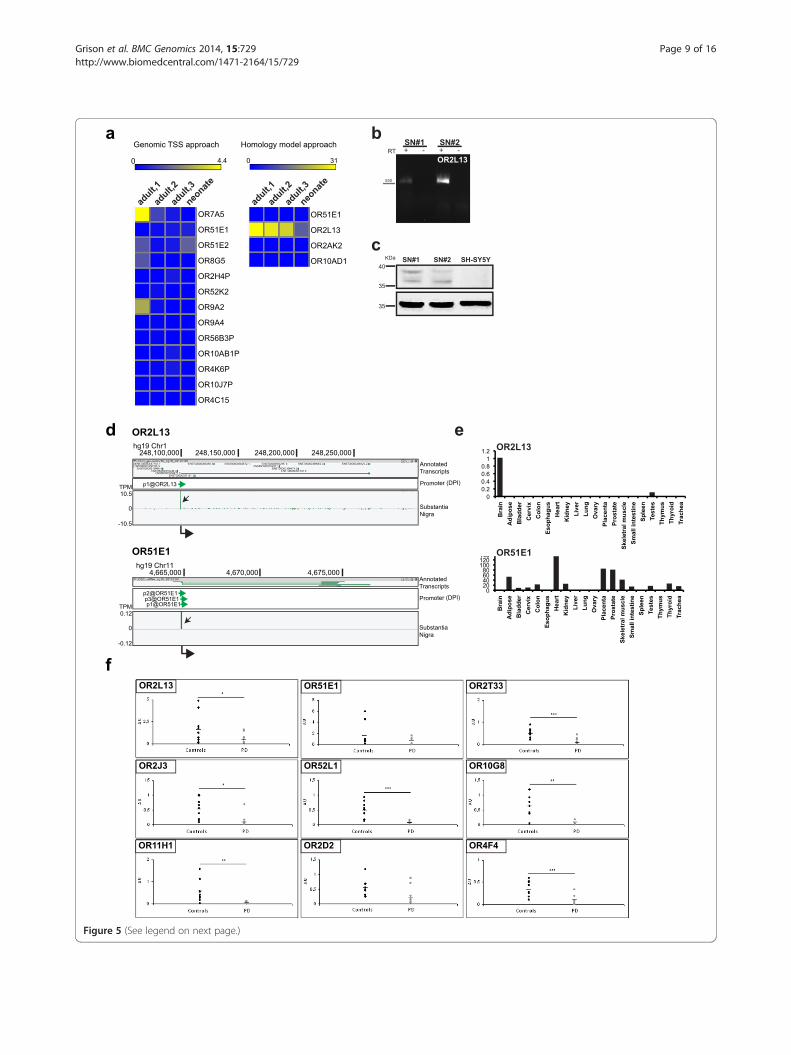
Figure 5 (See legend on next page.)
Grison et al. BMC Genomics 2014, 15:729 Page 9 of 16http://www.biomedcentral.com/1471-2164/15/729
(See figure on previous page.)Figure 5 A subset of human ORs is expressed in SN and down-regulated in PD post mortem brains. a) FANTOM5 CAGE data in human SNsamples. Heat map graphical representation of human ORs expression in adult and neonate samples, as indicated. List of human ORs identifiedby genomic approach (left) and by homology search (right). b) Complete open reading frame for human OR2L13 was cloned from RNA extractedfrom SN of two individuals (SN#1 and SN#2), not affected by neurodegenerative disorders (controls). c) Proteins were extracted from post mortemmaterial. Western blot analysis was performed with anti-OR51E1 antibody. Protein extract from SH-SY5Y cells was included as negative control.β-actin was used as loading control. Images are representative of n = 2 independent experiment with n = 2 independent SN samples. d) ZENBUgenome browser view of CAGE signals for OR2L13 and OR51E1 in human SN. Genomic coordinates are shown on top and scale of expressionvalues (TPM) on the left. Black arrows in each track highlight transcription start sites (TSS). At the bottom, thick arrowheads indicate direction oftranscription. e) qRT-PCR validation of human mDA-ORs expression in human tissues. A panel of human RNAs from various tissues was used tovalidate atypical expression of OR2L13 and OR51E1. Brain was arbitrarily set as 1. f) qRT-PCR of SN from control and PD post mortem brainsamples. *p < 0.05; **p < 0.01; ***p < 0.001.
Grison et al. BMC Genomics 2014, 15:729 Page 10 of 16http://www.biomedcentral.com/1471-2164/15/729
possibly contributing to axon guidance [29]. More re-cently, by taking advantage of mRNA-Seq data of 16 hu-man tissues available from Illumina Body Map project 2.0,111 OR genes were shown expressed outside of OE.Interestingly, OR51E1 and OR2W3 were expressed in allthe tissues analyzed while others showed a more restrictedpattern with several examples of expression in only onetissue [23]. Therefore, it is becoming evident that non-olfactory cells can hijack ORs as a general signaling path-way to achieve other cell-specific functions.Here we show that multiple ORs are expressed by
mouse mDA neurons, a cell system that is involved inmovement control and reward behavior. Interestingly,OR gene expression is also present in other regions aswell as outside of the mouse brain. Global transcriptomeanalysis, cDNA full-length cloning and quantitativeRT-PCR indicate that OR transcripts can be also found inhuman SN.NanoCAGE [12] is a next-generation sequencing tech-
nology for unbiased 5′-end transcriptome profiling andhave provided measurement of the expression level ofORs transcripts along with the precise definition of theirTSSs from purified mDA cells. Being a single-nucleotideresolution technology, it greatly differs in terms of quan-titative and qualitative output from microarray platformsor from PCR screenings based on degenerated oligonu-cleotides. While the expression of a significant numberof Olfrs has been confirmed both with nanoCAGE ana-lysis of LCM-purified cells and RT-PCR from MB, somediscrepancies have been noticed that may be explainedas follows. First, A9 and particularly A10 DA cell groupsare highly heterogeneous. On the basis of morphologyand connectivity 13 different A10 neuronal cell typeshave been described. The low associated TPM scoresmay thus be interpreted as RNAs transcribed by a spe-cific DA subtype leading to expression under detectionthreshold in total MB analysis. This has been alreadyshown by the comparison of the DeepCAGE data within situ hybridization for the hippocampus [30] and re-ported for ORs in the gut, where they were expressedexclusively in gastrointestinal enterochromaffin cells,which constitute only a minor proportion of the total
intestinal epithelium [31]. Importantly, nanoCAGE datado not offer any description of the anatomy of the tran-script. Gisselmann and collegues [23] showed that humanORs give raise to a plethora of transcripts with surprisingfeatures: unexpected internal introns, truncated orchimeric RNAs with adjacent genes and 5′ ends derivedfrom distant, previously undescribed TSSs. While wehave provided full-length cDNAs of validated mDA-ORscloned from MB, a detailed analysis of transcript anatomyfor every single gene presenting nanoCAGE tags will as-sess this important issue.As in OE, validated mDA-ORs present sharp promoters
in mDA cells. Most importantly, the very same TSS isoften used in both tissues. Sharp promoters without CpGislands are often bound by TFs within a constrainedspacing range. ORs promoters are no exceptions showingpositional preferences for specific motifs such as forMef2a, EBF1/HOX and SOX [13]. This transcription fac-tor binding site code can also be relevant for their tran-scriptional control in mDA cells as well as in the brain.This may suggest that the promoter architecture of ORsmay be under evolutionary pressure to drive transcriptionboth in OE and in other tissues strongly challenging theidea that OR expression outside OE is “atypical” or“ectopic”.Deorphanization of ORs is a very important task that
has been attempted at different scales. While virtualHigh-Throughput Screening (HTS) has been successfulto identify novel ligands [32], large efforts have beendedicated to the optimization of heterologous expressionsystems for efficient ectopic membrane localization ofORs and detection of responses to odor-like molecules.Among the most successful HTSs, 93 odorants have beentested on 464 ORs expressed in heterologous cells identi-fying agonists for 52 mouse and 10 human ORs [33,34].In this study, the screening has been limited to 16 po-
tential ligands and 5 ORs cDNAs. Odor-like moleculeshave been chosen for representing the major chemicalmoieties and putative ligands proposed on the basis ofsequence similarity between mDA-ORs and those presentin the OlfactionDB plus chemical ligands identified bychemoinformatic approaches.
Grison et al. BMC Genomics 2014, 15:729 Page 11 of 16http://www.biomedcentral.com/1471-2164/15/729
While Olfr287 was the only ORs showing convincingresponses, analysis of Olfr166 and Olfr558 were limitedby their low expression at the cell membrane.Despite these limitations we have been able to identify
the first odor-like molecule that act on mDA cells.Carvones are monocyclic monoterpene with antioxi-dant, antimicrobial, anticonvulsant, and antitumor activ-ities. (R)-(−)-carvone is the main constituent of spearmintoil (Mentha spicata var. crispa) while (S)-(+)-carvone is amajor component of caraway and dill seed oils. We provethat they elicited a strong response in Olfr287 expressedin the heterologous system and that they triggered Ca2+
responsiveness in solitary mDA neurons. A formal provethat mDA neurons response is mediated by Olfr287requires further experiments that are beyond the scope ofthis work.These results suggest a potential role of OR activation
in mDA physiology. However, the identity of the endogen-ous ligands for mDA-ORs remains unknown.A further optimization of heterologous expression of
mDA-ORs and a largest repertory of odor-like moleculeswill probably lead to the discovery of additional agonistsat mDA cells and therefore to new molecular tools tomanipulate mDA subtypes’ activities.This concept can be extended to any ORs expressed
outside the OE and to any expressing neuronal celltypes. Odor-like molecules may thus represent new op-portunities for developing neuroactive drugs that act on adefined repertoire of cells. If coupled with radioisotopes,they might also serve as probes for in vivo imaging.Since in the OE the functional activation of ORs
requires Gαolf and Adcy3, it is important that we de-tected the expression of these signaling molecules inmDA neurons as well. Many evidences position Gαolfat a crucial crossroad of the dopaminergic system inhealth and disease [35]. So far Gαolf–mediated pheno-types have been interpreted for its ability to mediatedopamine receptor 1 signaling in striatal medium spinyneurons [36]. According to our work, it will be alsoimportant to assess the contribution of signaling initi-ated at ORs.Albeit limited by the small size of patients’ samples
available for this study, we have shown that the largemajority of human ORs expressed in SN are down-regulated in PD post mortem brains. Interestingly, in thesame PD samples TASR are up-regulated, thus suggest-ing that OR down-regulation is not entirely due to neur-onal cells loss. For some of the ORs expressed in humanSN such as OR51E1, OR2J3 and OR51E2, HTS have ledto the identification of potential agonists. It will be thusinteresting assaying, respectively, nonanoic acid andbutyl butyryllacetate, cys-3-hexen-1-ol and cynnamalde-hyde as well as propionic acid for their activities onhuman DA cells.
Early-stage PD has been associated to a significantsmell dysfunction in some monogenic forms as well asin sporadic PD cases, with a prevalence of approximately90% [37]. Unlike cells in the SN, periglomerular DA cellsof the olfactory bulb do not degenerate but increase innumber with a concomitant induction of TH expression.The basis for olfactory dysfunction in PD is currentlyunknown. It remains to be determined whether ORsdown-regulation in SN has a role in the olfactory dys-function observed in PD patients [37].
ConclusionBy nanoCAGE transcriptome profiling we demonstratethat a subset of ORs is expressed in isolated A9 and A10mDA neurons. In these cells, odor-like stimuli are ableto evoke Ca2+−signals. Expression of ORs is also detectedin human SN, the site of neurodegeneration in PD, andis found regulated in PD post mortem brains.ORs might thus contribute to the normal physiology
of mDA neurons in mammals and potentially be targetof pharmacological manipulation with odor-like mole-cules in disease.
MethodsAnimalsAll animal experiments were performed in accordancewith European guidelines for animal care and followingSISSA Ethical Committee permissions. Mice were housedand bred in SISSA non-SPF animal facility, with 12 hoursdark/light cycles and controlled temperature and humid-ity. Mice had ad libitum access to food and water.LCM was performed on 12 weeks-old female TH-GFP/
21-31 mice [14] (n = 3). C57BL/6 female mice (n = 5),12 weeks old, were used for in situ hybridization and im-munohistochemistry experiments. Intra-cardiac perfusionswere done under total anaesthesia.Isolated mDA neurons were prepared from P9-P10
TH-GFP pups (n = 8).
NanoCAGE library preparation and data analysisSynthesis of nanoCAGE libraries, sequencing and bio-informatic analysis were carried out as in Plessy et al.[12,13] and Lazarevic et al. (Lazarevic D, Bertin N, FrankeV, Vlachouli C, Caiazzo M, Plessy C, Akalin A, Vatta P,Simone R, Roncaglia P, Daub CO, Faulkner GJ, Broccoli V,Lenhard B, Carninci P, Gustincich S: The promotoromeof adult dopaminergic neurons of the mouse Substan-tia Nigra identifies new gene networks for cell conver-sion. Submitted).
PCR, quantitative RT-PCR (qRT-PCR) and cloningTotal RNA was extracted from cells and tissue usingTrizol (Invitrogen) according to manufacturer’s instruc-tion. RNA was extracted from LCM- purified cells with
Grison et al. BMC Genomics 2014, 15:729 Page 12 of 16http://www.biomedcentral.com/1471-2164/15/729
Absolutely RNA Nanoprep Kit (Stratagene). RNA sam-ples were treated with DNAseI (Ambion). A panel ofpurified DNAse-treated human tissue-specific RNAs wasobtained from Life Sciences (FirstChoice® Human TotalRNA Survey Panel). cDNA was prepared from 1 μg ofRNA using the iSCRIPT™ cDNA Synthesis Kit (Bio-Rad)according to manufacturer’s instructions. Non-quantitativeRT-PCR was performed with standard protocol. qRT-PCRwas performed in triplicate using SYBR-Green PCR MasterMix (Applied Biosystem) and an iCycler IQ Real time PCRSystem (Bio-Rad). Relative gene expression was calculatedwith ΔΔCt method.A heat map graphical representation of rescaled nor-
malized fold expression (ΔΔCt/ΔΔCtMAX) was obtainedusing the Matrix2png software (http://www.bioinformatics.ubc.ca/matrix2png/).Full-length mDA-ORs were cloned from ventral mid-
brain and inserted into pcDNA3.1-Rho vector kindly pro-vided by Prof. Liberles. Cloned mDA-ORs were verifiedupon sequencing.The complete list of oligonucleotides used for PCR
and RT-qPCR is in Additional file 13: Table S3. Allamplicons were sequenced.
In situ hybridization (ISH)Sense and antisense probes were generated by in vitrotranscription from the cDNA encoding Olfr287, Olfr316and Olfr558. Riboprobe synthesis and hybridization wereperformed as in Carrieri et al. [16]. Probes were labelledwith biotin (BIO-labelling mix, Roche) and were usedat a concentration of 4 μg/ml at 60°C for 16 h. Listof primers used for generating probes is in Additionalfile 13: Table S3.
Phylogenetic tree and in silico ligand identificationThe evolutionary history was inferred using the MaximumParsimony method. The MP tree was obtained using theClose-Neighbour-Interchange algorithm, with search level0 in which the initial trees were obtained with the randomaddition of sequences (10 replicates). The analysis in-volved 87 amino acid sequences. All positions containinggaps and missing data were eliminated. There were a totalof 285 positions in the final dataset. Evolutionary analyseswere conducted using MEGA5 [38]. The structures ofodorant ligands and their cognate receptors were takenfrom the OlfactionDB database (http://molsim.sci.univr.it/OlfactionDB). Structurally similar ligands were identifiedby virtual screening of the ‘ligand.info’ database [39].This database contains <1,160,000 ligands. Structuralsimilarity was estimated by the Tanimoto’s equationusing the ROCS algorithm in the OpenEye suite of pro-grams (www.eyesopen.com). For each template, the 100best hits were selected.
Cell lines and transfectionHuman embryonic kidney 293 cells (HEK 293) were grownas in Carrieri et al. [16]. MN9D-Nurr1Tet-On cells (iMN9D)[40] were kindly provided by Professor Perlmann andmaintained as in Biagioli et al. [15].Transfection was performed with Fugene HD (Promega)
following manufacturer’s instructions.
Western blot48 h after transfection, cells were lysed in Lysis Buffer(20 mM Tris–HCl pH 7.5, 150 mM NaCl, 1 mM EDTA,1% TritonX-100). The lysates were incubated 30′ on iceand clarified by centrifugation at 13.000 rpm for 20′.Cell pellets were resuspended in Sample Buffer 2×. Totalprotein lysates from mouse organs were prepared byhomogenization in Lysis Buffer (140 mM NaCl, 5 mMKCl, 5 mM NaHCO3, 1.2 mM Na2HPO4, 1 mM MgCl2,20 mM HEPES pH 7.4, 10 mM dextrose, 1.8 mMCaCl2). Proteins from human samples were extractedusing Trizol reagent and following manufacturer’s in-structions. Equal amount of proteins were separated in10% SDS-polyacrilamide gel and transferred to nitrocel-lulose membrane. Immunoblotting was performed withthe following primary antibodies: anti-Rhodopsin tag(Novus Biological), anti-βactin (A5441, Sigma) and anti-OR51E1 (Thermo Scientific). Signals were revealed afterincubation with secondary antibodies conjugated withhorseradish peroxidase by using Immobilon (Millipore).
Immunohistochemistry and immunocytochemistryImmunohistochemistry was performed as previouslydescribed on 16 μm-thick cryo-slices prepared from12 weeks old C57BL/6 mice (n = 3) [15]. Primary anti-bodies anti-OR51E1 1:1000 (Novus Biologicals) andanti-TH 1:1000 (SIGMA) were used.For immunocytochemistry experiments, 48 h after
transfection, cells were fixed in 4% paraformaldehyde for10 minutes, washed with PBS and treated with 0.1 Mglycine for 4 minutes. After washing, cells were blockedin the non-permeabilizing buffer (0.2% BSA, 1% NGS, inPBS). Cells were incubated with anti-Rho tag antibody1:1000 in blocking solution for 90 minutes at roomtemperature. After washes in PBS, cells were incubatedwith secondary antibody Alexa Fluor-488 (MolecularProbes-Invitrogen,) for 1 h. Nuclei were visualized with1 μg/ml DAPI. Cells were mounted with Vectashield(Vector laboratories) and analyzed at confocal microscope(Leica).
mDA-ORs functional assaysFunctional assays were performed as described previously[41]. Briefly, 80,000 HEK 293 cells were plated in 24-wellplates and co-transfected with 400 ng of pCDNA3.1-RhomDA-OR construct and 400 ng of pCRE-SEAP reporter
Grison et al. BMC Genomics 2014, 15:729 Page 13 of 16http://www.biomedcentral.com/1471-2164/15/729
plasmid. 16 hours after transfection cells were treated withodors for 48 hours. SEAP was detected using GreatEscapeSEAP kit (Clontech) according to manufacturer’s instruc-tions. Fluorescence was measured with a FluorimeterSpectramax M5 multi-mode microplate reader. For testcompounds, see Additional file 6: Table S2.
Calcium Imaging in primary mDA neuronsIsolation of mDA neurons was performed as described pre-viously [15,42]. Briefly, ventral midbrain was isolated andthe pieces containing the SN were enzymatically dissoci-ated with Papain (SIGMA) under continuous oxygenation(5% CO2 and 95% O2 gas mixture) with slow stirring at35°. After 40 minutes, the reaction was stopped with 1 mg/ml trypsin inhibitor (Sigma) and the pieces were trituratedby using p1000 tip and glass pasteur pipette. The cell sus-pensions were centrifuged at 1000 rpm for 3 min and thepellet was resuspended. Dissociated neurons were platedon the slides coated with poly-lysine (1 mg/ml, SIGMA).After 3 hours, Ca2+ imaging was performed.Dissociated neurons were incubated with 8 μM fura-
2 AM, 80 μg/ml Pluronic F127 and sulphinil pyrazone250 μM (Molecular Probes) for 20 minutes.Neurons were constantly perfused in Ringer’s solution
(3 ml/min) except during stimulation applied for 4-10s.Stimuli were a mixture of odors (citronella, citralva,(+)-carvone, (−) carvone, menthone, geraniol, eugenol,acetophenone, benzyl alcohol, benzaldeheyde, propionicacid, heptanoic acid, IBMP) or a mixture containing bothR- and S-carvone enantiomers. All odorants are fromSigma Aldrich.Changes in intracellular Ca2+ were visualized using
380 nm and 340 nm excitation filters and 510/40 nmemission filter and were acquired every 3 s. using a CellR
system. Changes in fluorescence (340 nm /380 nm) wereexpressed as R/R0 where R is the ratio at time t and R0
is the ratio at time = 0 s. Responses (%) were evaluatedas ΔR/R0 × 100 where ΔR = R-R0.
Bioinformatic analysis of olfactory receptors in FANTOM5collection of human librariesWe selected windows of 200 bp on the mouse genome,centered on transcription start sites of olfactory receptorsdetected using nanoCAGE [13] and “lifted” their coordi-nates over the human genome version 19 [18] to obtainputative promoters for human olfactory receptors. Forthree pairs of receptors, Olfr55/Olfr239, Olfr216/Olfr317,and Olfr1507/Olfr1508, the lift produced the same coordi-nates, and we discarded each second member of the pairs.The expression levels of these putative human OR pro-moters was calculated by counting the number of CAGEtags from the FANTOM 5 promoter expression atlas [11]starting in these windows, using scripts available uponrequest, based on tabix [43] and bedtools [44]. Out of 499
regions, 100 had more tags than the 3rd quartile and 15had more than 100 tags, an arbitrary cutoff that we choseafter visual inspection of the data in FANTOM5’s instanceof the ZENBU genomic browser [45], which showed thatlower scores were enriched for apparently spurious accu-mulation of tags near pseudogenes.
Human samplesBrain tissue was obtained from the Institute of Neuro-pathology HUB-ICO-IDIBELL (University Hospital ofBellvitge- IDIBELL Foundation) Bio-Bank following theguidelines of Spanish legislation on this matter and incompliance with the Helsinki Declaration (http://www.wma.net/en/30publications/10policies/b3/index.html).Samples were dissected at autopsy with the informedconsent of patients or their relatives and the institutionalapproval of the local Ethics Committee (HUB-ICO/CEIC),signed by Dr. Enric Sospedra Martinez.Cases analyzed included 10 controls and 11 PD cases
[19]. Samples of SN were dissected at the time ofautopsy, and immediately frozen and stored at −80°Cuntil use. The purification of RNA was carried out withRNeasy Lipid Tissue Mini Kit (Qiagen, DE) followingthe protocol provided by the manufacturer. During puri-fication, samples were treated with RNase-free DNaseSet (Qiagen, DE) to avoid later amplification of genomicDNA. The concentration of each sample was obtainedfrom A260 measurements with Nanodrop 1000. RNAintegrity was tested using the Agilent 2100 BioAnalyzer(Agilent, US). The retrotranscriptase reaction was car-ried out using a High Capacity cDNA Archive kit(Applied Biosystems, US) following the protocol pro-vided by the supplier. Parallel reactions for each RNAsample were run in the absence of MultiScribe ReverseTranscriptase to assess the degree of contaminatinggenomic DNA.TaqMan PCR assays for each gene were performed in
duplicate on cDNA samples in 384-well optical platesusing an ABI Prism 7900 Sequence Detection System(Applied Biosystems, US). For each 20 μl TaqMan reac-tion, 9 μl cDNA was mixed with 1 μl 20× TaqMan GeneExpression Assays and 10 μl of 2× TaqMan Universalpolymerase chain reaction (PCR) Master Mix (AppliedBiosystems, US). The reactions were carried out using thefollowing parameters: 50°C for 2 min, 95°C for10 min, and 40 cycles of 95°C for 15 s and 60°C for1 min. Finally, all TaqMan PCR data were capturedusing the Sequence Detector Software (SDS version1.9, Applied Biosystems, US). Probes used in this studyare listed as follows:
OR2J3: ACCGCCAAGTAGATCACTTTTTCTGOR52L1: CTCAGCAGATCCGCCAGCGAGTGCTOR51E1: TACGGTTGAGCCTCTACCTGCCTGG
Grison et al. BMC Genomics 2014, 15:729 Page 14 of 16http://www.biomedcentral.com/1471-2164/15/729
OR2L13: CTCCAAGCCCAGTTACAGCAGAAAGOR2T33: AACGGTGGCTGGGGACGTGTGTAAAOR11H1: CACTGGGAGACATAAGGCCTTCTCTOR2D2: GTGAGGCCCCTGCACTATTGATCTTOR4F4: TATACACACTGAGGAACAAAGACATTAS2R4: CACCATTTACTGTGGCCTTCATCTCTAS2R5: TTTCTTGTTTCCTCTGGGATGCTGATAS2R10: ACCACAGCCATCTATCCCTGGGGTCTAS2R13: CACCATTTACTGTGGCCTTCATCTCTAS2R14: TTTGTCCCTGGCAATGTTTCTTCTCTAS2R50: AGTCCTAGGAGGCTGCGGAATGACC
Samples were analyzed with the double delta CT(ΔΔCT) method. Delta CT (ΔCT) values representnormalized target gene levels with respect to the in-ternal controls (GUSB, Glucuronidase beta: GCTAC-TACTTGAAGATGGTGATCGC; XPNPEP1, X-prolylaminopeptidase 1: CAAAGAGTGCGACTGGCTCAACAAT; and AARS, alanyl-tRNA synthetase: GCAAAATTTGGGGCTGGATGACACC). Reference genes wereselected because they are very efficient in replicatingmicroarray target gene expression in human post mor-tem brain tissue. ΔΔCT values were calculated as theΔCT of each test sample minus the mean ΔCT of thecalibrator samples for each target gene. The foldchange was calculated using the equation 2(−ΔΔCT).Results were subjected to statistical analysis as de-scribed below.
Statistical analysisStatistical analyses were performed with paired two-tailed Student’s t-test. Results are mean (n ≥3) ± standarddeviation (s.d.). Number of replicas in each experimentis further described in figure legends. qRT-PCR data onhuman samples were analyzed by two-way ANOVAfollowed by Student’s t-test when required. Differencesbetween mean values were considered statistically signifi-cant * p < 0.05; ** p < 0.01; *** p < 0.001.
Data accessNanoCAGE sequences have been submitted to the DNADataBank of Japan Sequence Read Archive (DRA) underaccession number DRA000475. Data will be availableupon release of an accompanying manuscript (LazarevicD, Bertin N, Franke V, Vlachouli C, Caiazzo M,Plessy C, Akalin A, Vatta P, Simone R, Roncaglia P,Daub CO, Faulkner GJ, Broccoli V, Lenhard B, Carninci P,Gustincich S: The promotorome of adult dopaminergicneurons of the mouse Substantia Nigra identifies newgene networks for cell conversion. Submitted). Thiswork is part of the FANTOM5 project. Data downloadsand genomic tools are summarized here http://fantom.gsc.riken.jp/5/.
Additional files
Additional file 1: Table S1. List of mDA-ORs. Complete list of ORsidentified by nanoCAGE in A9 and A10 neurons. Expression values (TPM)measured for each receptor is indicated in the appropriate column. Noexpression is also shown (−). Results from non-quantitative PCR validationin RNA extracted from total midbrain (MB) or from laser capturemicrodissected (LCM) neurons are indicated (−, negative; +, positive; NT,not tested).
Additional file 2: Figure S1. Expression of OR-mediated signaltransduction elements in mouse mDA neurons. a) nanoCAGE datasets.UCSD Genome browser view of Gαolf and Adcy3 expression in A9, A10.Tracks from nanoCAGE of olfactory epithelium (from Plessy et. al,Genome Research, [13]) are included for comparison (OE). Initiation ofannotated RefSeq is shown. Black arrows indicate transcription start sites(TSS). Genomic coordinates are shown on top and expression values (TPM)on the left. Direction of transcription is indicated by a thick arrowhead atthe bottom of each panel. b) FANTOM5 mouse datasets. Zenbu genomebrowser view of Gαolf and Adcy3 expression in neurons from SN and inolfactory brain. TPM values are shown on the left.
Additional file 3: Figure S2. Specificity of expression of ORs in mDAneurons. Specificity of expression of Olfr287, Olfr316 and Olfr558transcripts (green) by ISH in A9 and A10 DA neurons is verified withcontrol sense probes. DA neurons in SN are visualized by anti-THimmuno-staining (red). Nuclei are shown in blue (DAPI). Scale bars indicate20 μm. Data are representative of n = 3 independent experiments.
Additional file 4: Figure S3. Endogenous OR protein is expressed inmDA neurons and in mouse brain. a) Anti-OR51E1 antibody recognizedOlfr558 (green) expressed in heterologous HEK 293 cells. Immunofluorescencein non-permeabilizing conditions. Nuclei are visualized with DAPI (blue). Scalebars indicate 38 μm. White arrows highlight transfected cells. b) EndogenousOR protein is detected in A9 and A10 mDA neurons and in the cortex. mDAneurons were visualized with anti-TH (red) and OR with anti-OR51E1 specificantibody (green). Nuclei are stained with DAPI (blue). Scale bars indicate20 μm. Images are representative of n = 3 independent experiments.
Additional file 5: Figure S4. Overexpression of mDA-ORs in iMN9Dand HEK 293 cells. mDA-ORs were cloned from the ventral midbrain intopCDN3.1-Rho tag vector. Plasmids were transiently transfected in iMN9Dcells. Expression of mDA-ORs (olfr166, olfr287, olfr316, olfr558 and olfr1344) wasverified by western blotting (n = 5) (a) and immunofluorescence (n = 3) (b)with anti-Rho antibody. pCDN3.1- empty vector and S6 OR expressing plasmidwere used as negative and positive controls, respectively. c) HEK 293 cells weretransiently transfected with the indicated mDA-ORs and tested as in b.
Additional file 6: Table S2. List of odors. Complete list of odors usedin this study. Odor formulation and concentration of stock solution areindicated.
Additional file 7: Figure S5. Evolutionary and chemoinformaticscharacterization of mDA-ORs. a) Model of phylogenetic tree distribution ofmDA-ORs. b) Putative ligands for each receptor based on ligands of the clos-est homologue in the phylogenetic tree and by a chemoinformatic search.
Additional file 8: Figure S6. Analysis of mDA-ORs responses toselected odors. mDA-ORs were transiently transfected in HEK cells incombination with pCRE-SEAP. After transfection, cells were pulsed withodor molecules at 600 μM concentration. Nonanoic acid was used at1 mM. Ringer’s solution or DMSO was used as control. mDA-OR activationwas measured with fluorimetric assay on culture medium. mDA-ORs usedin this assays (olfr166, olfr316, olfr558 and olfr1344) are indicated. Dataindicate mean ± st dev and are calculated on four independentexperiments.
Additional file 9: Figure S7. Sequence homology strategy for humanmDA-ORs. Model of phylogenetic tree distribution of mouse mDA-ORsfor the identification of human homologues.
Additional file 10: Figure S8. Expression of human mDA-ORs inselected human FANTOM5 hCAGE libraries. Color-coded representationof OR expression in human FANTOM5 hCAGE libraries. Values areexpressed in tag per million (TPM). SN libraries are in red; tissue librariesthat were validated by qRT-PCR are in blue.
Grison et al. BMC Genomics 2014, 15:729 Page 15 of 16http://www.biomedcentral.com/1471-2164/15/729
Additional file 11: Figure S9. Analysis of OR2L13 response to selectedodors. Expression of human OR2L13 in HEK cells was verified byimmunofluorescence (a) and western blotting (b) with anti-Rho antibody.pCDN3.1-empty vector and S6 OR expressing plasmid were used asnegative and positive controls, respectively. For functional assays, OR2L13was transiently transfected in HEK cells in combination with pCRE-SEAP.After transfection, cells were challenged with odor molecules at 600 μMconcentration (c) or at the indicated quantities (d). Ringer’s solution orDMSO was used as control. mDA-OR activation was measured withfluorometric assay on culture medium. Data indicate mean ± st dev andare calculated on two independent experiments.
Additional file 12: Figure S10. A subset of human Taste Receptors isregulated in PD. qRT-PCR of SN from control and PD post mortem brainsamples. Data indicate mean ± stdev. *p < 0.05.
Additional file 13: Table S3. List of primers. Complete list ofoligonucleotides used in this study for non-quantitative PCR, quantitativeRT-PCR, cloning and in situ hybridization.
AbbreviationsCAGE: Cap analysis of gene expression; TPM: Tag per million; LCM: Laser capturemicrodissection; TH: Tyrosine hydroxylase; mDA neurons: Mesencephalicdopaminergic neurons; PD: Parkinson’s disease; OR: Olfactory receptor;OE: Olfactory epithelium; MB: Ventral midbrain; OSN: Olfactory sensory neurons;SN: Substantia Nigra; VTA: Ventral tegmental area; SEAP: Secreted alkalinephosphatase; CRE: cAMP response element; TASR: Taste receptors; HTS: Highthroughput screening.
Competing interestsThe authors declare that they have no competing interest.
Authors’ contributionsAG designed the experiments, performed the experiments and analyzed thedata; SZ designed the experiments, analyzed the data, performed analysis ofmouse and human FANTOM5 libraries and wrote the manuscript; AU clonedsome mDA-ORs and performed the experiments of odor stimulation in HEKcells; IZ performed the experiments of Ca2+ imaging in isolated neuronstogether with AG and analyzed the data with CL; DL, GP, CV and RS performedLCM isolation of A9 and A10 neurons and performed nanoCAGE analysis; GPanalyzed nanoCAGE data; PR analyzed transcriptome of A9 and A10 neurons;Al.G and PaC performed phylogenetic tree and in silico ligand identification;PG-E performed qRT-PCR on control and PD post mortem brains and togetherwith IF analyzed the data; FP analyzed the data and the manuscript; ARRF andYH provided FANTOM5 datasets for analysis; CP performed bioinformaticsanalysis to obtain putative promoters for human olfactory receptors and analyzetheir expression in human SN samples; PiC analyzed the data and FANTOM5datasets for analysis; SG designed the experiments, analyzed the data and wrotethe manuscript. All authors read and approved the final manuscript.
Authors’ informationthe FANTOM Consortium: Email: [email protected].
AcknowledgmentsWe are indebted to all the members of the SG lab for thought-provokingdiscussions and to Cristina Leonesi for technical support and carefully editingthe manuscript. We are grateful to SISSA technical and administrative staff,especially to H. Krmac, M. Grandolfo and J. Franzot. We thank Prof. S.D.Liberles (Harvard Medical School, Boston, MA USA) for kindly providing thepCDNA3.1-Rho plasmid. This work was supported by the FP7 DOPAMINET toS.G. and P.C., by the Italian Ministry of Education, University and Research(FIRB grant prot. RBAP11FRE9) to S.G. and F.P. and by Seventh FrameworkProgramme of the European Commission, grant agreement 278486:DEVELAGE to I.F.FANTOM5 was made possible by a Research Grant from the JapaneseMinistry of Education, Culture, Sports, Science and Technology (MEXT) to theRIKEN Center for Life Science Technologie. This work was also supported bya research grant for RIKEN Omics Science Center from MEXT to YH, by aGrant of the Innovative Cell Biology by Innovative Technology (CellInnovation Program) from the MEXT to YH, by a research grant from MEXTto RIKEN PMI and by a research grant from MEXT to RIKEN CLST. We wouldlike to thank all members of the FANTOM5 consortium for contributing to
generation of samples and analysis of the data-set and thank GeNAS fordata production.We are indebted to Drs. Peter Heutink (Genome Biology ofNeurodegenerative diseases, DZNE, Standort Tübingen, Germany) andPatrizia Rizzu (Applied Genomics for Neurodegenerative Diseases, DZNE,Standort Tübingen, Germany) for the use of human SN dataset.Note. RIKEN Omics Science Center ceased to exist as of April 1st, 2013,due to RIKEN reorganization.
Author details1SISSA, Area of Neuroscience, via Bonomea 265, 34136 Trieste, Italy.2Department of Health Sciences, University of Eastern Piedmont “A.Avogadro”, via Solaroli 17, 28100 Novara, Italy. 3Venetian Institute ofMolecular Medicine (VIMM), via Orus 2, 35129 Padua, Italy. 4CBM, AREAScience Park, s.s. 14, Km 163.5, Basovizza 34012 Trieste, Italy. 5RIKEN OmicsScience Center, Yokohama, Kanagawa 230-0045, Japan. 6RIKEN Center for LifeScience Technologies, Division of Genomic Technologies, YokohamaInstitute, 1-7-22 Suehiro-cho, Tsurumi-ku, Yokohama, Kanagawa 230-0045,Japan. 7Computational Biophysics, German Research School for SimulationSciences (Joint venture of RWTH Aachen University and ForschungszentrumJülich), Jülich, Germany. 8Department of Biotechnology, University of Verona,Ca’ Vignal 1, Strada Le Grazie 15, 37134 Verona, Italy. 9Institute ofNeuropathology, IDIBELL-University Hospital of Bellvitge, Carrer Feixa Llargasn, 08907 Hospitalet de Llobregat, Spain. 10RIKEN Preventive Medicine andDiagnosis Innovation Program, Wako, Saitama 351-0198, Japan. 11Institute forAdvanced Simulation IAS-5, Computational Biomedicine, ForschungszentrumJülich, Jülich, Germany. 12Computational Biomedicine Section INM-9, Institutefor Neuroscience and Medicine, Jülich, Germany. 13The GiovanniArmenise-Harvard Foundation Laboratory, SISSA, via Bonomea 265, 34136Trieste, Italy. 14Current address: European Molecular Biology Laboratory,European Bioinformatics Institute (EMBL-EBI), Wellcome Trust GenomeCampus, Hixton, Cambridge CB10 1SD, UK.
Received: 12 December 2013 Accepted: 18 August 2014Published: 27 August 2014
References1. Bjorklund A, Dunnett SB: Fifty years of dopamine research. Trends Neurosci
2007, 30(5):185–187.2. Bjorklund A, Dunnett SB: Dopamine neuron systems in the brain: an
update. Trends Neurosci 2007, 30(5):194–202.3. Hirsch E, Graybiel AM, Agid YA: Melanized dopaminergic neurons are
differentially susceptible to degeneration in Parkinson’s disease.Nature 1988, 334(6180):345–348.
4. Meyer-Lindenberg A, Miletich RS, Kohn PD, Esposito G, Carson RE,Quarantelli M, Weinberger DR, Berman KF: Reduced prefrontal activitypredicts exaggerated striatal dopaminergic function in schizophrenia.Nat Neurosci 2002, 5(3):267–271.
5. Chung CY, Seo H, Sonntag KC, Brooks A, Lin L, Isacson O: Cell type-specificgene expression of midbrain dopaminergic neurons reveals moleculesinvolved in their vulnerability and protection. Hum Mol Genet 2005,14(13):1709–1725.
6. Greene JG, Dingledine R, Greenamyre JT: Gene expression profiling of ratmidbrain dopamine neurons: implications for selective vulnerability inparkinsonism. Neurobiol Dis 2005, 18(1):19–31.
7. Grimm J, Mueller A, Hefti F, Rosenthal A: Molecular basis forcatecholaminergic neuron diversity. Proc Natl Acad Sci U S A 2004,101(38):13891–13896.
8. Shiraki T, Kondo S, Katayama S, Waki K, Kasukawa T, Kawaji H, Kodzius R,Watahiki A, Nakamura M, Arakawa T, Fukuda S, Sasaki D, Podhajska A,Harbers M, Kawai J, Carninci P, Hayashizaki Y: Cap analysis gene expressionfor high-throughput analysis of transcriptional starting point andidentification of promoter usage. Proc Natl Acad Sci U S A 2003,100(26):15776–15781.
9. Carninci P, Sandelin A, Lenhard B, Katayama S, Shimokawa K, Ponjavic J,Semple CA, Taylor MS, Engstrom PG, Frith MC, Forrest AR, Alkema WB, Tan SL,Plessy C, Kodzius R, Ravasi T, Kasukawa T, Fukuda S, Kanamori-Katayama M,Kitazume Y, Kawaji H, Kai C, Nakamura M, Konno H, Nakano K, Mottagui-TabarS, Arner P, Chesi A, Gustincich S, Persichetti F, et al: Genome-wide analysis ofmammalian promoter architecture and evolution. Nat Genet 2006,38(6):626–635.
Grison et al. BMC Genomics 2014, 15:729 Page 16 of 16http://www.biomedcentral.com/1471-2164/15/729
10. Gustincich S, Batalov S, Beisel KW, Bono H, Carninci P, Fletcher CF,Grimmond S, Hirokawa N, Jarvis ED, Jegla T, Kawasawa Y, LeMieux J,Miki H, Raviola E, Teasdale RD, Tominaga N, Yagi K, Zimmer A, Hayashizaki Y,Okazaki Y: Analysis of the mouse transcriptome for genes involved in thefunction of the nervous system. Genome Res 2003, 13(6b):1395–1401.
11. FANTOM Consortium and the RIKEN PMI and CLST (DGT), Forrest AR,Kawaji H, Rehli M, Baillie JK, de Hoon MJ, Lassmann T, Itoh M, Summers KM,Suzuki H, Daub CO, Kawai J, Heutink P, Hide W, Freeman TC, Lenhard B,Bajic VB, Taylor MS, Makeev VJ, Sandelin A, Hume DA, Carninci P,Hayashizaki Y: A promoter-level mammalian expression atlas. Nature 2014,507(7493):462–470.
12. Plessy C, Bertin N, Takahashi H, Simone R, Salimullah M, Lassmann T,Vitezic M, Severin J, Olivarius S, Lazarevic D, Hornig N, Orlando V, Bell I,Gao H, Dumais J, Kapranov P, Wang H, Davis CA, Gingeras TR, Kawai J,Daub CO, Hayashizaki Y, Gustincich S, Carninci P: Linking promoters tofunctional transcripts in small samples with nanoCAGE and CAGEscan.Nat Methods 2010, 7(7):528–534.
13. Plessy C, Pascarella G, Bertin N, Akalin A, Carrieri C, Vassalli A, Lazarevic D,Severin J, Vlachouli C, Simone R, Faulkner GJ, Kawai J, Daub CO, Zucchelli S,Hayashizaki Y, Mombaerts P, Lenhard B, Gustincich S, Carninci P: Promoterarchitecture of mouse olfactory receptor genes. Genome Res 2012,22(3):486–497.
14. Sawamoto K, Nakao N, Kobayashi K, Matsushita N, Takahashi H, Kakishita K,Yamamoto A, Yoshizaki T, Terashima T, Murakami F, Itakura T, Okano H:Visualization, direct isolation, and transplantation of midbraindopaminergic neurons. Proc Natl Acad Sci U S A 2001, 98(11):6423–6428.
15. Biagioli M, Pinto M, Cesselli D, Zaninello M, Lazarevic D, Roncaglia P, SimoneR, Vlachouli C, Plessy C, Bertin N, Beltrami A, Kobayashi K, Gallo V, Santoro C,Ferrer I, Rivella S, Beltrami CA, Carninci P, Raviola E, Gustincich S:Unexpected expression of alpha- and beta-globin in mesencephalicdopaminergic neurons and glial cells. Proc Natl Acad Sci U S A 2009,106(36):15454–15459.
16. Carrieri C, Cimatti L, Biagioli M, Beugnet A, Zucchelli S, Fedele S, Pesce E,Ferrer I, Collavin L, Santoro C, Forrest AR, Carninci P, Biffo S, Stupka E,Gustincich S: Long non-coding antisense RNA controls Uchl1 translationthrough an embedded SINEB2 repeat. Nature 2012, 491(7424):454–457.
17. Maritan M, Monaco G, Zamparo I, Zaccolo M, Pozzan T, Lodovichi C:Odorant receptors at the growth cone are coupled to localized cAMPand Ca2+ increases. Proc Natl Acad Sci U S A 2009, 106(9):3537–3542.
18. Hinrichs AS, Karolchik D, Baertsch R, Barber GP, Bejerano G, Clawson H,Diekhans M, Furey TS, Harte RA, Hsu F, Hillman-Jackson J, Kuhn RM,Pedersen JS, Pohl A, Raney BJ, Rosenbloom KR, Siepel A, Smith KE, SugnetCW, Sultan-Qurraie A, Thomas DJ, Trumbower H, Weber RJ, Weirauch M,Zweig AS, Haussler D, Kent WJ: The UCSC genome browser database:update 2006. Nucleic Acids Res 2006, 34(Database issue):D590–598.
19. Garcia-Esparcia P, Schluter A, Carmona M, Moreno J, Ansoleaga B,Torrejon-Escribano B, Gustincich S, Pujol A, Ferrer I: Functional genomicsreveals dysregulation of cortical olfactory receptors in Parkinson disease:novel putative chemoreceptors in the human brain. J Neuropathol ExpNeurol 2013, 72(6):524–539.
20. Ansoleaga B, Garcia-Esparcia P, Llorens F, Moreno J, Aso E, Ferrer I:Dysregulation of brain olfactory and taste receptors in AD, PSP and CJD,and AD-related model. Neuroscience 2013, 248C:369–382.
21. Lodovichi C, Belluscio L: Odorant receptors in the formation of theolfactory bulb circuitry. Physiology (Bethesda) 2012, 27(4):200–212.
22. Feldmesser E, Olender T, Khen M, Yanai I, Ophir R, Lancet D: Widespreadectopic expression of olfactory receptor genes. BMC Genomics 2006,7:121.
23. Flegel C, Manteniotis S, Osthold S, Hatt H, Gisselmann G: Expression profileof ectopic olfactory receptors determined by deep sequencing. PLoS ONE2013, 8(2):e55368.
24. Zhang X, Rogers M, Tian H, Zhang X, Zou DJ, Liu J, Ma M, Shepherd GM,Firestein SJ: High-throughput microarray detection of olfactory receptorgene expression in the mouse. Proc Natl Acad Sci U S A 2004,101(39):14168–14173.
25. Spehr M, Gisselmann G, Poplawski A, Riffell JA, Wetzel CH, Zimmer RK,Hatt H: Identification of a testicular odorant receptor mediating humansperm chemotaxis. Science 2003, 299(5615):2054–2058.
26. Neuhaus EM, Zhang W, Gelis L, Deng Y, Noldus J, Hatt H: Activation of anolfactory receptor inhibits proliferation of prostate cancer cells. J BiolChem 2009, 284(24):16218–16225.
27. Fukuda N, Yomogida K, Okabe M, Touhara K: Functional characterization ofa mouse testicular olfactory receptor and its role in chemosensing andin regulation of sperm motility. J Cell Sci 2004, 117(Pt 24):5835–5845.
28. Griffin CA, Kafadar KA, Pavlath GK: MOR23 promotes muscle regenerationand regulates cell adhesion and migration. Dev Cell 2009, 17(5):649–661.
29. Otaki JM, Yamamoto H, Firestein S: Odorant receptor expression in themouse cerebral cortex. J Neurobiol 2004, 58(3):315–327.
30. Valen E, Pascarella G, Chalk A, Maeda N, Kojima M, Kawazu C, Murata M,Nishiyori H, Lazarevic D, Motti D, Marstrand TT, Tang MH, Zhao X, Krogh A,Winther O, Arakawa T, Kawai J, Wells C, Daub C, Harbers M, Hayashizaki Y,Gustincich S, Sandelin A, Carninci P: Genome-wide detection and analysisof hippocampus core promoters using DeepCAGE. Genome Res 2009,19(2):255–265.
31. Braun T, Voland P, Kunz L, Prinz C, Gratzl M: Enterochromaffin cells of thehuman gut: sensors for spices and odorants. Gastroenterology 2007,132(5):1890–1901.
32. Triballeau N, Van Name E, Laslier G, Cai D, Paillard G, Sorensen PW,Hoffmann R, Bertrand HO, Ngai J, Acher FC: High-potency olfactoryreceptor agonists discovered by virtual high-throughput screening:molecular probes for receptor structure and olfactory function.Neuron 2008, 60(5):767–774.
33. Mainland JD, Keller A, Li YR, Zhou T, Trimmer C, Snyder LL, Moberly AH,Adipietro KA, Liu WL, Zhuang H, Zhan S, Lee SS, Lin A, Matsunami H: Themissense of smell: functional variability in the human odorant receptorrepertoire. Nat Neurosci 2014, 17(1):114–120.
34. Saito H, Chi Q, Zhuang H, Matsunami H, Mainland JD: Odor coding by aMammalian receptor repertoire. Sci Signal 2009, 2(60):ra9.
35. Nishi A, Kuroiwa M, Shuto T: Mechanisms for the modulation ofdopamine d(1) receptor signaling in striatal neurons. Front Neuroanat2011, 5:43.
36. Zhuang X, Belluscio L, Hen R: G(olf)alpha mediates dopamine D1 receptorsignaling. J Neurosci 2000, 20(16):RC91.
37. Doty RL: Olfactory dysfunction in Parkinson disease. Nat Rev Neurol 2012,8(6):329–339.
38. Tamura K, Peterson D, Peterson N, Stecher G, Nei M, Kumar S: MEGA5:molecular evolutionary genetics analysis using maximum likelihood,evolutionary distance, and maximum parsimony methods. Mol Biol Evol2011, 28(10):2731–2739.
39. von Grotthuss M, Koczyk G, Pas J, Wyrwicz LS, Rychlewski L: Ligand. Infosmall-molecule Meta-Database. Comb Chem High Throughput Screen 2004,7(8):757–761.
40. Hermanson E, Joseph B, Castro D, Lindqvist E, Aarnisalo P, Wallen A,Benoit G, Hengerer B, Olson L, Perlmann T: Nurr1 regulates dopaminesynthesis and storage in MN9D dopamine cells. Exp Cell Res 2003,288(2):324–334.
41. Liberles SD, Buck LB: A second class of chemosensory receptors in theolfactory epithelium. Nature 2006, 442(7103):645–650.
42. Puopolo M, Raviola E, Bean BP: Roles of subthreshold calcium current andsodium current in spontaneous firing of mouse midbrain dopamineneurons. J Neurosci 2007, 27(3):645–656.
43. Li H: Tabix: fast retrieval of sequence features from generic TAB-delimitedfiles. Bioinformatics 2011, 27(5):718–719.
44. Quinlan AR, Hall IM: BEDTools: a flexible suite of utilities for comparinggenomic features. Bioinformatics 2010, 26(6):841–842.
45. Severin J, Lizio M, Harshbarger J, Kawaji H, Daub CO, Hayashizaki Y,Bertin N, Forrest AR: Interactive visualization and analysis of large-scalesequencing datasets using ZENBU. Nat Biotechnol 2014, 32(3):217–219.
doi:10.1186/1471-2164-15-729Cite this article as: Grison et al.: Mesencephalic dopaminergic neuronsexpress a repertoire of olfactory receptors and respond to odorant-likemolecules. BMC Genomics 2014 15:729.