research article open access assessing...
TRANSCRIPT
RESEARCH ARTICLE Open Access
Assessing genotype-phenotype associationsin three dorsal colour morphs in themeadow spittlebug Philaenus spumarius (L.)(Hemiptera: Aphrophoridae) using genomicand transcriptomic resourcesAna S. B. Rodrigues1*, Sara E. Silva1, Francisco Pina-Martins1,2, João Loureiro3, Mariana Castro3, Karim Gharbi4,Kevin P. Johnson5, Christopher H. Dietrich5, Paulo A. V. Borges6, José A. Quartau1, Chris D. Jiggins7,Octávio S. Paulo1† and Sofia G. Seabra1†
Abstract
Background: Colour polymorphisms are common among animal species. When combined with geneticand ecological data, these polymorphisms can be excellent systems in which to understand adaptationand the molecular changes underlying phenotypic evolution. The meadow spittlebug, Philaenus spumarius(L.) (Hemiptera, Aphrophoridae), a widespread insect species in the Holarctic region, exhibits a strikingdorsal colour/pattern balanced polymorphism. Although experimental crosses have revealed the Mendelianinheritance of this trait, its genetic basis remains unknown. In this study we aimed to identify candidategenomic regions associated with the colour balanced polymorphism in this species.
Results: By using restriction site-associated DNA (RAD) sequencing we were able to obtain a set of 1,837markers across 33 individuals to test for associations with three dorsal colour phenotypes (typicus, marginellus,and trilineatus). Single and multi-association analyses identified a total of 60 SNPs associated with dorsalcolour morphs. The genome size of P. spumarius was estimated by flow cytometry, revealing a 5.3 Gbgenome, amongst the largest found in insects. A partial genome assembly, representing 24% of the total size,and an 81.4 Mb transcriptome, were also obtained. From the SNPs found to be associated with colour, 35%aligned to the genome and 10% to the transcriptome. Our data suggested that major loci, consisting ofmulti-genomic regions, may be involved in dorsal colour variation among the three dorsal colour morphsanalysed. However, no homology was found between the associated loci and candidate genes known to beresponsible for coloration pattern in other insect species. The associated markers showed stronger differentiation ofthe trilineatus colour phenotype, which has been shown previously to be more differentiated in several life-history andphysiological characteristics as well. It is possible that colour variation and these traits are linked in a complex geneticarchitecture.(Continued on next page)
* Correspondence: [email protected]†Equal contributors1Computational Biology and Population Genomics Group, cE3c – Centre forEcology, Evolution and Environmental Changes, Departamento de BiologiaAnimal, Faculdade de Ciências da Universidade de Lisboa, Campo Grande,Lisbon P-1749-016, PortugalFull list of author information is available at the end of the article
© The Author(s). 2016 Open Access This article is distributed under the terms of the Creative Commons Attribution 4.0International License (http://creativecommons.org/licenses/by/4.0/), which permits unrestricted use, distribution, andreproduction in any medium, provided you give appropriate credit to the original author(s) and the source, provide a link tothe Creative Commons license, and indicate if changes were made. The Creative Commons Public Domain Dedication waiver(http://creativecommons.org/publicdomain/zero/1.0/) applies to the data made available in this article, unless otherwise stated.
Rodrigues et al. BMC Genetics (2016) 17:144 DOI 10.1186/s12863-016-0455-5
(Continued from previous page)
Conclusions: The loci detected to have an association with colour and the genomic and transcriptomic resourcesdeveloped here constitute a basis for further research on the genetic basis of colour pattern in the meadow spittlebugP. spumarius.
Keywords: Association study, Colour polymorphism, de novo genome assembly, de novo transcriptome assembly,Meadow spittlebug
BackgroundUnderstanding the genetic basis underlying phenotypicvariation responsible for evolutionary change and adapta-tion in natural populations remains a major goal and oneof the most interesting challenges in evolutionary biology.Not long ago, despite the development of new moleculartools, establishing genotype-phenotype associations, map-ping adaptive loci, and identifying gene function, was lim-ited to a few taxa due to technological and costconstraints. With the latest advances in sequencing tech-nologies, the relationships between genetic variation andadaptive traits can now be investigated in a broader rangeof species for which, in some cases, there is extensiveknowledge of ecological and evolutionary history, but fewgenomic resources [1–7]. Moreover, with the developmentof population genomics it has become possible not only toassess the genetic basis of adaptation directly at a genomiclevel, but also to distinguish the evolutionary effects offorces acting on the whole genome from those influencingonly particular loci [8, 9].Intraspecific colour variation is commonly found in
many different taxa, including mammals [10], fishes[11], amphibians [12], reptiles [13, 14], birds [15, 16],and many invertebrates (e.g. land snails, spiders, grass-hoppers and butterflies; see [17] for references). Colourpatterns may serve a wide variety of adaptive functions,ranging from a visual signal used in mate choice, tocrypsis or aposematism to avoid predators, to aiding inthe regulation of body temperature [18]. Through theirinteractions with other physiological and/or ecologicaltraits, colour polymorphisms may also influence thehabitat choice, dispersal capability and adaptation to achanging or novel environment, thus influencing theecological success and evolutionary dynamics of popula-tions and species [19]. When combined with genomicand ecological data, these colour polymorphisms can bean excellent system for understanding adaptation andspeciation and for the study of the micro-evolutionaryforces that maintain genetic variation [20]. Negativefrequency-dependent selection, resulting from processessuch as predation or sexual selection [21–23], heterozy-gote advantage [24], and disruptive selection/divergencewith gene-flow [25, 26] are some of the mechanismssuggested to be involved in the maintenance of colourpolymorphisms. Alternative strategies that result in
almost the same fitness values for colour morphs havealso been reported [27].The meadow spittlebug, Philaenus spumarius (Linnaeus,
1758) (Hemiptera, Aphrophoridae), a widespread andhighly polyphagous sap-sucking insect species in theHolarctic region, shows a well studied balanced poly-morphism of dorsal colour/pattern variation [28]. It is themost investigated species of its genus and has high geneticand morphological variation [29]. Sixteen adult colourphenotypes are known to occur in natural populations[30] but only 13 are referred in the literature. These aredivided into non-melanic (populi, typicus, vittatus, trili-neatus and praeustus) and melanic forms (marginellus,flavicollis, gibbus, leucocephalus, lateralis, quadrimacula-tus, albomaculatus and leucopthalmus) [28, 30–32]. Theoccurrence and frequency of the colour phenotypes differamong populations and may result from different selectivepressures such as habitat composition, climatic conditions(including altitudinal and latitudinal gradients), industrialmelanism and predation (reviewed in [30, 32]). Silva andcolleagues [33] have shown higher longevity and fertilityof the trilineatus phenotype in laboratory conditions,which was also found to have the highest reflectance[34] and to be more prone to parasitoid attacks [35],supporting the idea that complex mechanisms are in-volved in the maintenance of this polymorphism.Crossing experiments have revealed the Mendelian in-heritance of this trait, which is mainly controlled byan autosomal locus p with seven alleles, with complexdominance and co-dominance relationships, beinglikely regulated by other loci [31, 36]. The typicusphenotype is the most common (over 90% frequencyin most populations) and it is the bottom double re-cessive form. It is believed to be the ancestral formbecause its main colour pattern characteristics areshared with several other cercopid species [36]. Thecompletely melanic form leucopthalmus is dominantover typicus, and several other forms, with pale headsand/or spots, are dominant over the completely darkform. The trilineatus phenotype, pale with three darkstripes, is controlled by the top dominant allele pT
[36, 37]. Halkka and Lallukka [38] suggested thecolour genes may be linked to genes involved in re-sponse to the physical environment through epistaticinteractions, constituting a supergene, and selection
Rodrigues et al. BMC Genetics (2016) 17:144 Page 2 of 16
may not be directly related to colour. Evidence thatbalanced polymorphisms can result from tight geneticlinkage between multiple functional loci, known assupergenes [39], has been reported in mimetic butter-flies [40, 41], land snails [42] and birds [43]. In P.spumarius the genetic architecture of its balanceddorsal colour polymorphism and the possible exist-ence of a supergene remain to be investigated.A genome-wide association study has the potential to
identify the genetic and/or genomic region(s) associatedwith these dorsal colour patterns. In this study we usedrestriction site-associated DNA (RAD) sequencing [1] toobtain a set of Single Nucleotide Polymorphisms (SNPs)that were tested for associations with three dorsal colourphenotypes in P. spumarius. The phenotypes used were:typicus (TYP), the most common and non-melanic re-cessive phenotype; trilineatus (TRI), the non-melanicdominant phenotype; and marginellus (MAR), the mostcommon melanic phenotype found in the populationfrom which samples were collected. The first partialdraft genome and transcriptome of P. spumarius arepresented here and were used to help the characterisa-tion of the genomic regions found to be associated withcolour variation. The size of the genome of this insectspecies was also estimated by flow cytometry.
MethodsThis research does not involve any endangered or pro-tected species and did not require any permits to obtainthe spittlebug individuals.
Sampling and DNA extractionA total of 36 female specimens of P. spumarius fromthree different colour phenotypes – 12 typicus (TYP), 12trilineatus (TRI), and 12 marginellus (MAR) – were col-lected from a Portuguese population near Foz do Arelholocality (39°25'2.95"N; 9°13'39.18"W) in 2011. Adult in-sects were captured using a sweep net suitable for low-growing vegetation and an entomological aspirator (poo-ter). Specimens were preserved in absolute ethanol andstored at 4°C. The wings and abdomen were removed toavoid DNA contamination by endosymbionts, parasit-oids and parasites and only the thorax and head wereused. Genomic DNA was extracted using the DNeasyBlood & Tissue Kit (Qiagen).
Illumina sequencing of genomic librariesThree RAD libraries with twelve individuals each wereprepared following a modified RAD sequencing protocol[1], using PstI-HF (New England BioLabs) restriction en-zyme to digest 300 ng of genomic DNA per sample.Digested DNA was ligated to P1 barcoded adapters usingtwelve different barcodes for each library. Adapter-ligatedfragments were pooled and sheared targeting a 500 bp
average fragment size using a sonicator. To removeadapter dimers, libraries were purified with AgencourtAMPure XP (Beckman Coulter) magnetic beads after P2adapter ligation with a volume DNA/beads ratio of 1:0.8.After end-repair using a commercial kit (New EnglandBioLab), libraries were amplified by Polymerase ChainReaction (PCR) performing an initial denaturation step at98°C for 30 s, followed by 18 cycles of one denaturationstep at 98°C for 10 s, annealing at 65°C for 30 s, extensionat 72°C for 30 s and a final 5 min extension step. PCR-enriched libraries were purified with AMPure XP beadsand the DNA concentration of each library was quantifiedin a Qubit 2.0 (Invitrogen). Libraries, in a proportionalrepresentation, were paired end sequenced in three lanesof an Illumina HiSeq 2000 at Genepool (AshworthLaboratories).
SNP calling and genotypingRaw reads were trimmed, demultiplexed and alignedusing the pyRAD software pipeline v3.0.5 [44], whichfollows the method of [45]. Reads were first clustered byindividual and highly similar reads assembled into “clus-ters” using the programs MUSCLE v3.8.31 [46] andVSEARCH v1.9.3 [47] that allowed reads within “clus-ters” to vary not only for nucleotide polymorphisms butalso for indels. All bases with a Phred quality scorebelow 20 were converted to N (undetermined base). Foreach individual, consensus sequences based on estimatesof the sequencing error-rate and heterozygosity were ob-tained for each locus. Similarity threshold required tocluster reads together and individuals into a locus was0.88. Minimum “cluster” depth for each individual wassix reads. Only loci with a minimum coverage of nine in-dividuals (25%) were retained in the final dataset. Tolimit the risk of including paralogs in analysis, loci shar-ing more than 50% heterozygous sites were not consid-ered and the maximum number of heterozygous sites ina consensus sequence (locus) allowed was five. Afterclustering sequences, a data matrix for each locus wasgenerated. Further filtering and summary statistics were,posteriorly, performed using VCF Tools v 0.1.13 [48].Loci were excluded from the final matrix based on (i) amissing data higher than 90% per individual, (ii) a minorallele frequency lower than 5% and (iii) a missing dataper loci higher than 25%. Linkage disequilibrium (LD)was also measured using the squared correlation coeffi-cient (r2) in VCFtools. In association analysis, the detec-tion of statistical associations may be affected when amarker is replaced with a highly correlated one [49].Taking this into account, highly correlated SNPs in thesame locus (r2 = 1) were randomly eliminated and onlyone of them was retained in the final VCF matrix. Thefiltered VCF file with the genotypes for each individualwas converted into the file formats needed for further
Rodrigues et al. BMC Genetics (2016) 17:144 Page 3 of 16
analyses using PGDSpider v 2.0.4.0 [50], fcGENE v1.0.7[51] and/or using customised python scripts.
Association with dorsal colour phenotypesFor the SNPs dataset, single-SNP associations betweenallele frequencies and dorsal colour phenotypes weretested using a Fisher’s exact test of allelic association inPLINK v 1.07 [52]. Three pairwise analyses were per-formed: MAR vs. TRI, MAR vs. TYP and TRI vs. TYP.Allele frequencies in each pair, the odds ratio and p-values were obtained for each SNP and a false discoveryrate (FDR) of 5% was applied [53] to each pairwise ana-lysis to test for false positives.To test for single and multi-SNP correlations between
SNPs and colour morphs, a Bayesian Variable SelectionRegression (BVSR) model proposed by [54] was also per-formed in the same three pairs and carried out inpiMASS v 0.9. Generally used for association studieswith continuous response variables, piMASS is also ap-propriate for studies with binary phenotypes [54]. Thismethod uses the phenotype as the response variable andgenetic variants (SNPs) as covariates to evaluate SNPsthat may be associated with a particular phenotype [54].SNPs statistically associated with phenotypic variationare identified by the posterior distribution of γ, or theposterior inclusion probability (PIP). In our multi-locusanalyses, markers with a PIP greater than 99% empiricalquantile (PIP0.99 SNPs) were considered as highly associ-ated with colour morphs. For all PIP0.99 SNPs we re-ported their PIP and the estimates of their phenotypiceffect (β). A positive β in the pairwise morph1-morph2(e.g. MAR-TRI) analysis means that the frequency of theminor allele (maf) is higher in morph2 (TRI in the ex-ample) and a negative β means that maf is higher inmorph1 (MAR in the example). Thus, to investigate thephenotypic effect size of each PIP0.99 SNP, the | β | wasconsidered. The model contains additional parametersthat are estimated from the data: proportion of varianceexplained by the SNPs (PVE), the number of SNPs inthe regression model (nSNPs) and the average pheno-typic effect of a SNP that is in the model (σSNP). For allpairwise analyses, we obtained 4 million Markov ChainMonte Carlo samples from the joint posterior probabilitydistribution of model parameters (recording values every400 iterations) and discarded the first 100,000 samplesas burn-in. piMASS also outperforms a single-SNP ap-proach to detect causal SNPs even in the absence of in-teractions between them [54]. For single-marker tests,SNPs above 95% empirical quantile for Bayes Factor(BF) (BF0.95 SNPs) were considered to be strongly associ-ated to the colour phenotypes. Those above 99% empir-ical quantile for BF (BF0.99 SNPs) were considered tohave the strongest associations. Imputation of the miss-ing genotypes was performed in BIMBAM v1.0 [55].
Genetic differences among populations were testedusing a G–test [56] and estimates of FST were obtainedfollowing the method of [57] implemented in GENEPOPv4.2.2 [58]. To better visualise and explore the correl-ation between significant SNPs, obtained in the severalassociation analyses, and colour phenotypes, a PrincipalComponent Analysis (PCA) was done using R PackageSNPRelate (Bioconductor v3.2; R v3.2.3) implemented inthe vcf2PCA.R script [59].
De novo sequencing and assembly of the meadowspittlebug genomeTo attempt potential de novo assembly of the genome,genomic DNA of one P. spumarius individual fromQuinta do Bom Sucesso, Lagoa de Óbidos (Portugal)was extracted using the DNeasy Blood & Tissue Kit(Qiagen) and sequenced externally in GenoScreen (Lille,France) (http://www.genoscreen.fr/). A whole-genomeshotgun sequencing approach using one lane of IlluminaHiSeq 2000 to generate a paired-end library of approxi-mately 366 million 100 bp reads was carried out. Aftersequencing, the quality of the sequence reads wasassessed in FastQC v0.10.1 [60] and low quality se-quences were trimmed by using Trimmomatic v 0.35[61] and the default parameters. De novo assembly oflarge genomes tends to be computationally demanding,requiring very large amounts of memory to facilitatesuccessful assembly. Taking these conditions into ac-count, the assembler SOAPdenovo2 [62, 63] was chosento assemble the sequenced P. spumarius genome. Thisassembler implements the de Bruijn graph algorithm tai-lored specifically to perform the assembly of short Illu-mina sequences and is optimised for large genomes. Ak-mer parameter of 33 was used for this assembly. Thequality of the assembly results was investigated throughseveral metrics: N50, percentage of gaps, number ofcontigs, number of scaffolds and genome coverage (totalnumber of base pairs).
De novo sequencing and assembly of the meadowspittlebug transcriptomeFresh adult specimens of P. spumarius were obtainedfrom Lexington, Fayette Co., Kentucky, USA in July2013 and frozen at −80°C. Total RNA was extractedfrom 6 adult specimens by first grinding the entire bodyusing a 1 mL glass tissue grinder with 1 mL Trizol (Invi-trogen). This was followed by passing the homogenateover a Qiagen Qiashredder column. The eluate wasextracted with 200 μL chloroform, and the RNA wasprecipitated with 500 μL isopropanol. Pellets were resus-pended in RNAse-free water.Paired-end RNA libraries were prepared using Illumi-
na’s TruSeq Stranded RNA sample preparation kit withan average cDNA size of 250 bp (range 80–550 bp).
Rodrigues et al. BMC Genetics (2016) 17:144 Page 4 of 16
These libraries were sequenced using an IlluminaHiSeq2500 machine with a TruSeq SBS sequencing kitversion 1 analysed with Casava v1.8.2. Raw reads werefiltered for duplicates using a custom script and trimmedfor 5′ bias and 3′ quality using the FASTX-toolkit [64].Transcriptome was assembled using SOAPdenovo-Transv1.02 [65] with a k-mer of 49.
Genome size estimation by flow cytometryGenome size estimates were obtained through flow cy-tometry [66]. A total of 22 individuals were analysed,seven females and six males of P. spumarius, and ninefemales of P. maghresignus, a closely related species ofthe same genus. A suspension of nuclei from both thePhilaenus sample and a reference standard (Solanumlycopersicum, S.l., ‘Stupické’ with 2C = 1.96 pg; [67]) wereprepared by chopping the thorax and the head of the in-sect together with 0.5 cm2 of S. lycopersicum fresh leafwith a razor blade in a Petri dish containing 1 mL ofWPB (0.2 M Tris. HCl, 4 mM MgCl2.6H2O, 1% TritonX-100, 2 mM EDTA Na2.2H2O, 86 mM NaCl, 10 mMmetabisulfite, 1% PVP-10, pH adjusted to 7.5 and storedat 4°C; [68]). The nuclear suspension was filteredthrough a 30 μm nylon filter and 50 μg mL−1 of propi-dium iodide (PI, Fluka, Buchs, Switzerland) and50 μg mL−1 of RNAse (Fluka, Buchs, Switzerland) wereadded to stained DNA and avoid staining of doublestranded RNA, respectively. After 5 minutes of incuba-tion, the nuclear suspension was analysed in a PartecCyFlow Space flow cytometer (532 nm green solid-statelaser, operating at 30 mW; Partec GmbH., Görlitz,Germany). Data was acquired using the Partec FloMaxsoftware v 2.4d (Partec GmbH, Münster, Germany) inthe form of four graphics: histogram of fluorescencepulse integral in linear scale (FL); forward light scatter(FS) vs. side light scatter (SS), both in logarithmic (log)scale; FL vs. time; and FL vs. SS in log scale. To removedebris, the FL histogram was gated using a polygonal re-gion defined in the FL vs. SS histogram. At least 1,300nuclei were analysed per Philaenus’ G1 peak [69]. OnlyCV values of 2C peak of Philaenus below 5% were ac-cepted [70]. The homoploid genome size (2C in pg; [71])was assessed through the formula: sample nuclear DNAcontent (pg) = (sample G1 peak mean/S. lycopersicum G1
peak mean) * genome size of S. lycopersicum. The ob-tained values were expressed in picograms (pg) and ingiga base pairs (Gb), using the formula by [72] (1 pg =0.978 Gb).Differences in genome size between males and females
were evaluated using a one-way analysis of molecularvariance (ANOVA), followed by a Tukey test for multiplecomparisons at P < 0.05. Statistical analyses were per-formed using SigmaPlot for Windows v. 12.5 (SystatSoftware).
Characterisation of RAD lociA consensus sequence, with IUPAC ambiguity codes forvariable sites, was generated for each RAD locus across in-dividuals using the python script loci_consensus.py [73].Homology to non-coding and coding regions was
investigated for the inferred loci by locally queryingconsensus sequences against Arthropoda sequencesavailable in the NCBI nucleotide database (RefSeq re-lease 73, last modified 2 November 2015 and GenBankrelease 211, last modified 14 December 2015), usingBLASTN 2.2.28+ [74]. A protein blast (RefSeq release73, last modified 2 November 2015 and GenBank release211, last modified 14 December 2015), using BLASTX2.2.28+ [75], was also performed. An E-value thresholdof 1e-5 was used.RAD loci were also queried using BLASTN against the
drafts of the P. spumarius genome and transcriptome as-sembled in this study. In this case, an E-value threshold of1e-15 was chosen as the cutoff for restricting the align-ments to the most significant ones. The top five contigsand/or scaffolds were subsequently investigated by query-ing them using BLASTN against Arthropoda sequencesavailable in nucleotide and protein databases of NCBI.
ResultsRAD sequencing and SNPs data matrixThe sequencing set produced a total of 341 millionreads. After filtering reads based on quality scores, 269million reads were retained, corresponding to an averageof 7.4 million reads per individual. Before filtering, indi-viduals yielded 335,767 to 12,711,816 sequenced reads of90 bp each (Additional file 1: Figure S1).The average number of reads per locus per individual
used to estimate a consensus sequence was 51.0(Additional file 1: Figure S2). For the clustering results, atotal of 133,127 loci, consisting of 12,144,351 aligned nu-cleotides, inferred with a minimum of nine individuals(25%) per locus, and a total of 470,470 SNPs with amean percentage of missing data per individual of63.92%, were produced. Aligned loci, including gapsinserted in the course of the alignment, ranged from 90to 109 bp in length (mean = 91 bp). When filtering bypercentage of missing data, three individuals (TYP_5,TYP_13 and TRI_13; Additional file 1: Figure S1, S2 andS3) had more than 90% missing data and were excluded.After filtering, a set of 928 loci, 85,056 bases and 2,195SNPs was retained. However, only 1,837 SNPs on 928loci were considered for the analyses after those in thesame locus sequence with a complete LD (r2 = 1) wererandomly excluded.
Single-SNP associations with colour phenotypesThe dataset was tested for allele frequency differences be-tween pairs of dorsal colour phenotypes – MAR vs. TYP,
Rodrigues et al. BMC Genetics (2016) 17:144 Page 5 of 16
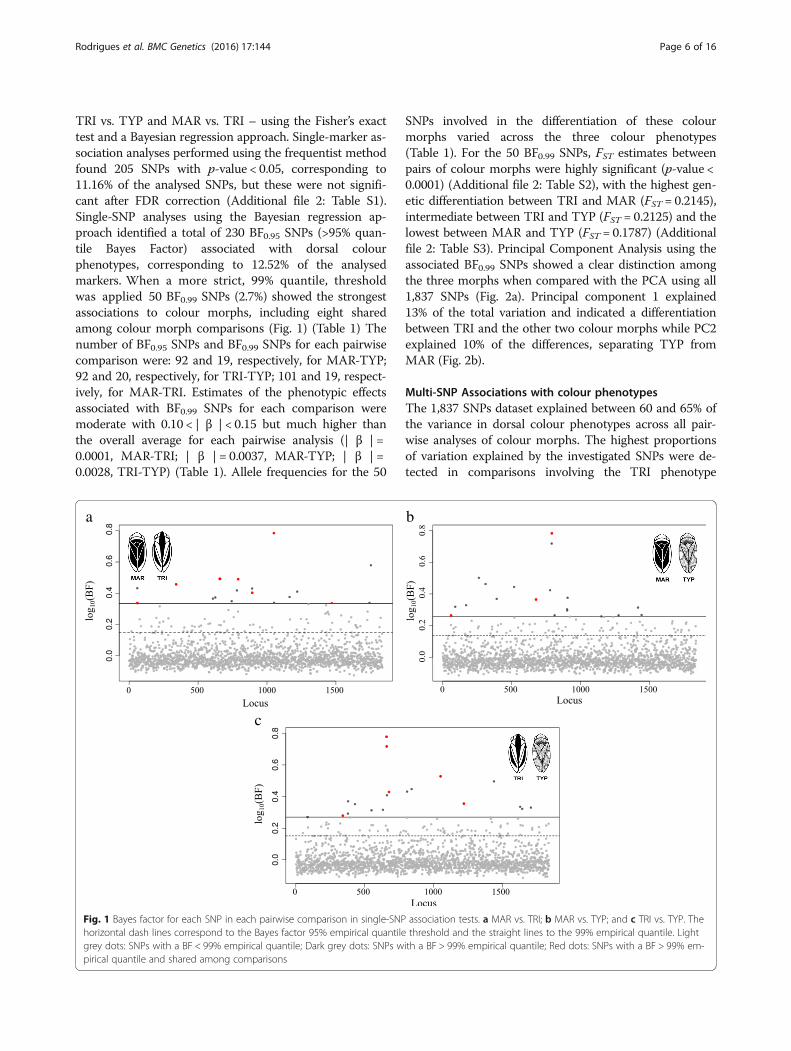
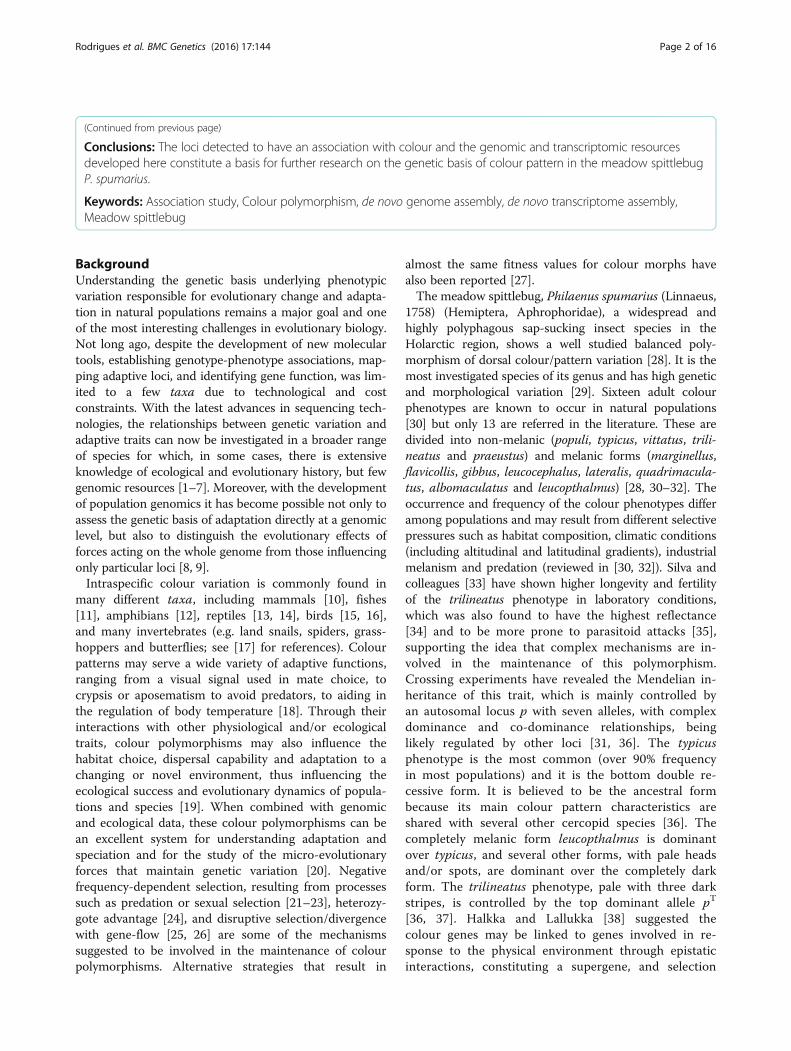
TRI vs. TYP and MAR vs. TRI – using the Fisher’s exacttest and a Bayesian regression approach. Single-marker as-sociation analyses performed using the frequentist methodfound 205 SNPs with p-value < 0.05, corresponding to11.16% of the analysed SNPs, but these were not signifi-cant after FDR correction (Additional file 2: Table S1).Single-SNP analyses using the Bayesian regression ap-proach identified a total of 230 BF0.95 SNPs (>95% quan-tile Bayes Factor) associated with dorsal colourphenotypes, corresponding to 12.52% of the analysedmarkers. When a more strict, 99% quantile, thresholdwas applied 50 BF0.99 SNPs (2.7%) showed the strongestassociations to colour morphs, including eight sharedamong colour morph comparisons (Fig. 1) (Table 1) Thenumber of BF0.95 SNPs and BF0.99 SNPs for each pairwisecomparison were: 92 and 19, respectively, for MAR-TYP;92 and 20, respectively, for TRI-TYP; 101 and 19, respect-ively, for MAR-TRI. Estimates of the phenotypic effectsassociated with BF0.99 SNPs for each comparison weremoderate with 0.10 < | β | < 0.15 but much higher thanthe overall average for each pairwise analysis (| β | =0.0001, MAR-TRI; | β | = 0.0037, MAR-TYP; | β | =0.0028, TRI-TYP) (Table 1). Allele frequencies for the 50
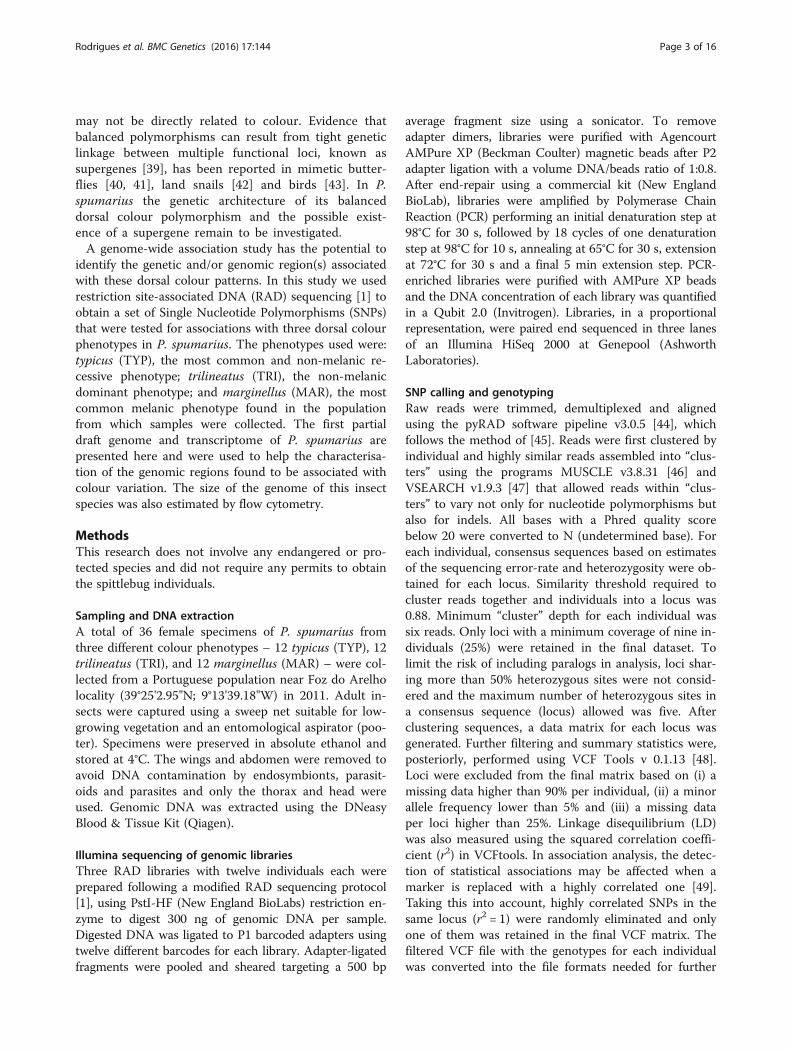
SNPs involved in the differentiation of these colourmorphs varied across the three colour phenotypes(Table 1). For the 50 BF0.99 SNPs, FST estimates betweenpairs of colour morphs were highly significant (p-value <0.0001) (Additional file 2: Table S2), with the highest gen-etic differentiation between TRI and MAR (FST = 0.2145),intermediate between TRI and TYP (FST = 0.2125) and thelowest between MAR and TYP (FST = 0.1787) (Additionalfile 2: Table S3). Principal Component Analysis using theassociated BF0.99 SNPs showed a clear distinction amongthe three morphs when compared with the PCA using all1,837 SNPs (Fig. 2a). Principal component 1 explained13% of the total variation and indicated a differentiationbetween TRI and the other two colour morphs while PC2explained 10% of the differences, separating TYP fromMAR (Fig. 2b).
Multi-SNP Associations with colour phenotypesThe 1,837 SNPs dataset explained between 60 and 65% ofthe variance in dorsal colour phenotypes across all pair-wise analyses of colour morphs. The highest proportionsof variation explained by the investigated SNPs were de-tected in comparisons involving the TRI phenotype
a b
c
Fig. 1 Bayes factor for each SNP in each pairwise comparison in single-SNP association tests. a MAR vs. TRI; b MAR vs. TYP; and c TRI vs. TYP. Thehorizontal dash lines correspond to the Bayes factor 95% empirical quantile threshold and the straight lines to the 99% empirical quantile. Lightgrey dots: SNPs with a BF < 99% empirical quantile; Dark grey dots: SNPs with a BF > 99% empirical quantile; Red dots: SNPs with a BF > 99% em-pirical quantile and shared among comparisons
Rodrigues et al. BMC Genetics (2016) 17:144 Page 6 of 16
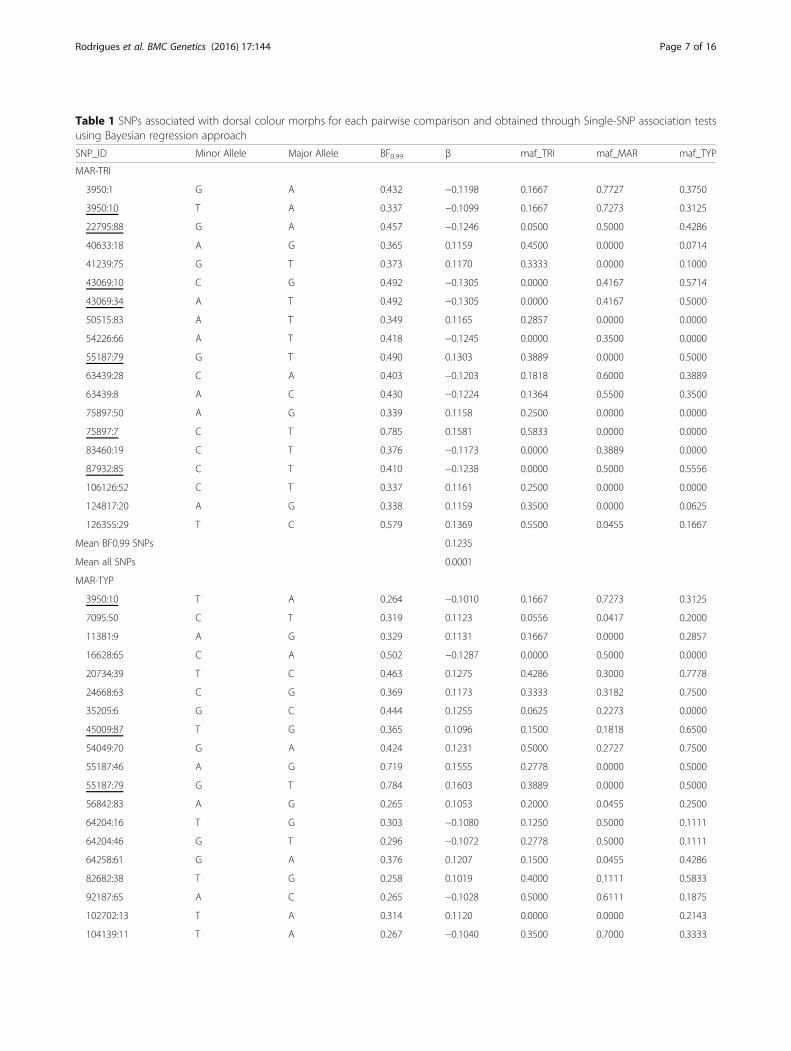
Table 1 SNPs associated with dorsal colour morphs for each pairwise comparison and obtained through Single-SNP association testsusing Bayesian regression approach
SNP_ID Minor Allele Major Allele BF0.99 β maf_TRI maf_MAR maf_TYP
MAR-TRI
3950:1 G A 0.432 −0.1198 0.1667 0.7727 0.3750
3950:10 T A 0.337 −0.1099 0.1667 0.7273 0.3125
22795:88 G A 0.457 −0.1246 0.0500 0.5000 0.4286
40633:18 A G 0.365 0.1159 0.4500 0.0000 0.0714
41239:75 G T 0.373 0.1170 0.3333 0.0000 0.1000
43069:10 C G 0.492 −0.1305 0.0000 0.4167 0.5714
43069:34 A T 0.492 −0.1305 0.0000 0.4167 0.5000
50515:83 A T 0.349 0.1165 0.2857 0.0000 0.0000
54226:66 A T 0.418 −0.1245 0.0000 0.3500 0.0000
55187:79 G T 0.490 0.1303 0.3889 0.0000 0.5000
63439:28 C A 0.403 −0.1203 0.1818 0.6000 0.3889
63439:8 A C 0.430 −0.1224 0.1364 0.5500 0.3500
75897:50 A G 0.339 0.1158 0.2500 0.0000 0.0000
75897:7 C T 0.785 0.1581 0.5833 0.0000 0.0000
83460:19 C T 0.376 −0.1173 0.0000 0.3889 0.0000
87932:85 C T 0.410 −0.1238 0.0000 0.5000 0.5556
106126:52 C T 0.337 0.1161 0.2500 0.0000 0.0000
124817:20 A G 0.338 0.1159 0.3500 0.0000 0.0625
126355:29 T C 0.579 0.1369 0.5500 0.0455 0.1667
Mean BF0.99 SNPs 0.1235
Mean all SNPs 0.0001
MAR-TYP
3950:10 T A 0.264 −0.1010 0.1667 0.7273 0.3125
7095:50 C T 0.319 0.1123 0.0556 0.0417 0.2000
11381:9 A G 0.329 0.1131 0.1667 0.0000 0.2857
16628:65 C A 0.502 −0.1287 0.0000 0.5000 0.0000
20734:39 T C 0.463 0.1275 0.4286 0.3000 0.7778
24668:63 C G 0.369 0.1173 0.3333 0.3182 0.7500
35205:6 G C 0.444 0.1255 0.0625 0.2273 0.0000
45009:87 T G 0.365 0.1096 0.1500 0.1818 0.6500
54049:70 G A 0.424 0.1231 0.5000 0.2727 0.7500
55187:46 A G 0.719 0.1555 0.2778 0.0000 0.5000
55187:79 G T 0.784 0.1603 0.3889 0.0000 0.5000
56842:83 A G 0.265 0.1053 0.2000 0.0455 0.2500
64204:16 T G 0.303 −0.1080 0.1250 0.5000 0.1111
64204:46 G T 0.296 −0.1072 0.2778 0.5000 0.1111
64258:61 G A 0.376 0.1207 0.1500 0.0455 0.4286
82682:38 T G 0.258 0.1019 0.4000 0.1111 0.5833
92187:65 A C 0.265 −0.1028 0.5000 0.6111 0.1875
102702:13 T A 0.314 0.1120 0.0000 0.0000 0.2143
104139:11 T A 0.267 −0.1040 0.3500 0.7000 0.3333
Rodrigues et al. BMC Genetics (2016) 17:144 Page 7 of 16
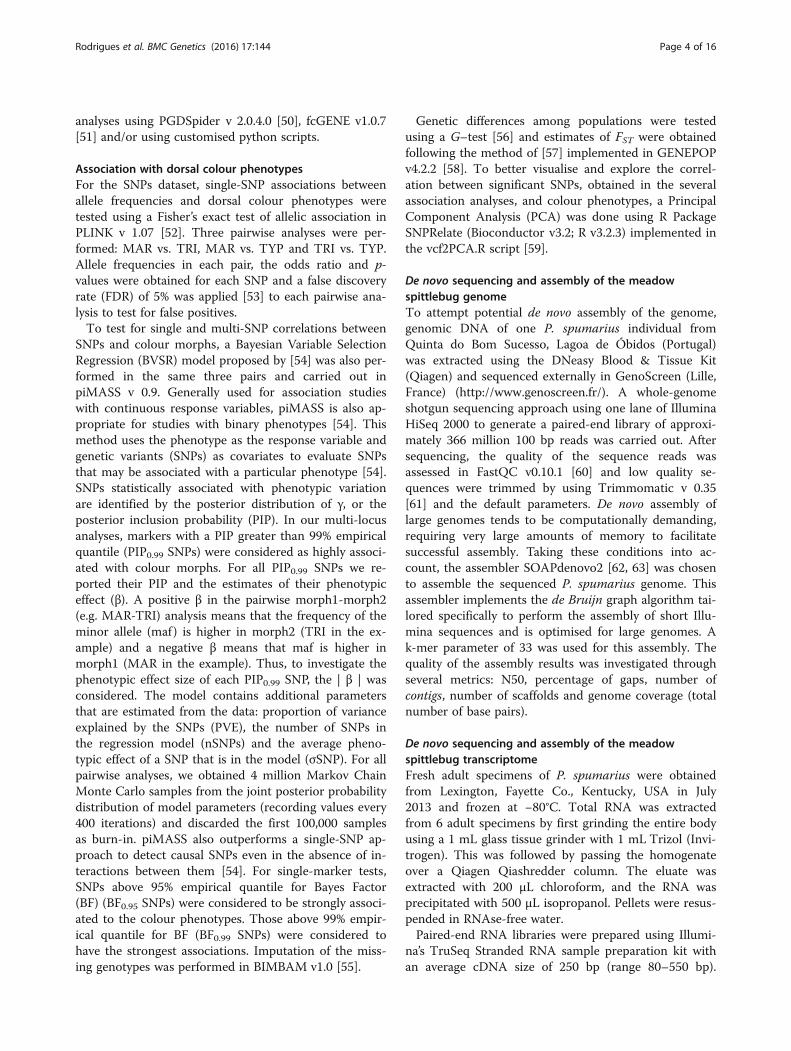
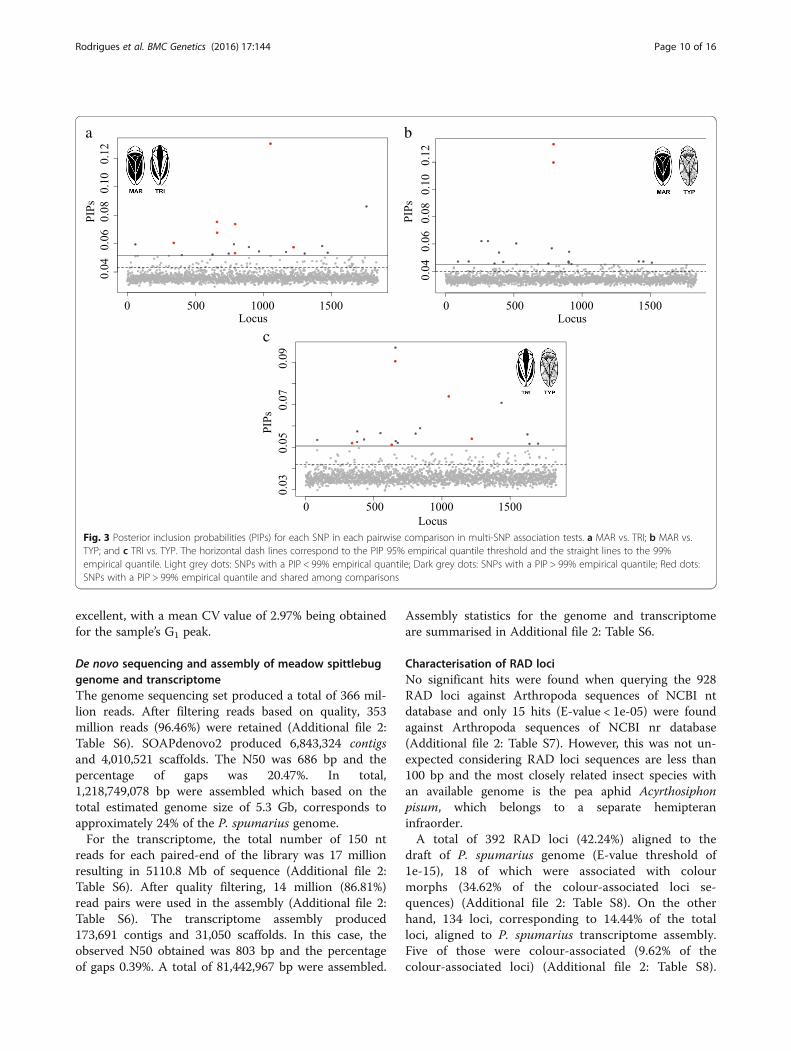
(Table 2). The highest proportion was observed in TRI-TYP analysis (PVE = 0.6515) while the lowest proportionwas found in MAR-TYP analysis (PVE = 0.6018) (Table 2).Estimates of the mean number of SNPs (nSNPs) under-lying dorsal colour variation ranged from 63 to 67(Table 2). However, 95% credible intervals for these pa-rameters estimates were typically large. The average effectof associated SNPs was high and similar among analysesbut once again higher in comparisons involving TRI(σSNP = 1.1200, MAR-TRI; σSNP = 0.9776, TRI-TYP;σSNP = 0.9495, MAR-TYP) (Table 2). When consideringmodels with the highest BFs (log10(BF) > 10) only, themean number of SNPs included in the model (nSNPs_BF)for each comparison decreased up to values between nineand 12 while the mean effect size of the SNPs (σSNP_BF)increased ranging between 2.4 and 4.1 (Table 2). The pos-terior inclusion probabilities (PIPs) for the analysed SNPswere quite similar among all pairwise analyses but slightlyhigher in comparisons involving TRI (PIP = 0.0366, MAR-TRI; PIP = 0.0362, TRI-TYP and PIP = 0.0345, MAR-TYP)
(Fig. 3) (Table 2). A subset of 19 SNPs with the highest in-clusion probabilities (PIP0.99 SNPs) were identified foreach analysis and investigated (Table 3). This number waswithin the 95% credible intervals for the number of SNPsfound to be associated with dorsal colour variation by themodels with the highest BF (Additional file 1: Figure S4)(Table 3). Estimates of the strength of association betweengenotypic variation at individual SNPs and phenotypicvariation (| β |) varied among the analyses and all weregreater than 0.5. We obtained SNPs with larger effect sizesfor MAR-TRI analysis than for all other analyses. SixPIP0.99 SNPs were shared between two pairwise analyses(Table 3). In total, 50 different SNPs revealed a multi-association with colour morphs and, from those, 40 werealso significant in the single-SNP analyses shownpreviously. For the 50 PIP0.99 SNPs, population differenti-ation tests were also highly significant (p-value < 0.000)(Additional file 2: Table S2). Similarly, the highest geneticdifferentiation was observed between TRI and TYP (FST =0.2159), intermediate between TRI and MAR (FST =
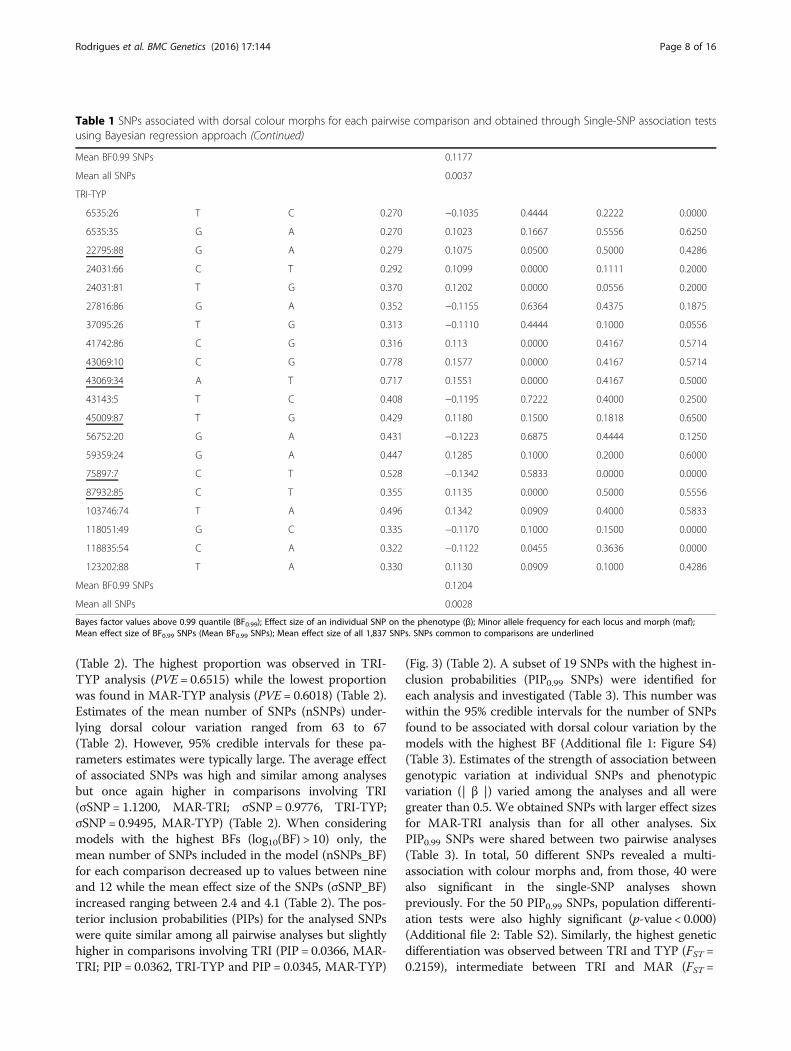
Table 1 SNPs associated with dorsal colour morphs for each pairwise comparison and obtained through Single-SNP association testsusing Bayesian regression approach (Continued)
Mean BF0.99 SNPs 0.1177
Mean all SNPs 0.0037
TRI-TYP
6535:26 T C 0.270 −0.1035 0.4444 0.2222 0.0000
6535:35 G A 0.270 0.1023 0.1667 0.5556 0.6250
22795:88 G A 0.279 0.1075 0.0500 0.5000 0.4286
24031:66 C T 0.292 0.1099 0.0000 0.1111 0.2000
24031:81 T G 0.370 0.1202 0.0000 0.0556 0.2000
27816:86 G A 0.352 −0.1155 0.6364 0.4375 0.1875
37095:26 T G 0.313 −0.1110 0.4444 0.1000 0.0556
41742:86 C G 0.316 0.113 0.0000 0.4167 0.5714
43069:10 C G 0.778 0.1577 0.0000 0.4167 0.5714
43069:34 A T 0.717 0.1551 0.0000 0.4167 0.5000
43143:5 T C 0.408 −0.1195 0.7222 0.4000 0.2500
45009:87 T G 0.429 0.1180 0.1500 0.1818 0.6500
56752:20 G A 0.431 −0.1223 0.6875 0.4444 0.1250
59359:24 G A 0.447 0.1285 0.1000 0.2000 0.6000
75897:7 C T 0.528 −0.1342 0.5833 0.0000 0.0000
87932:85 C T 0.355 0.1135 0.0000 0.5000 0.5556
103746:74 T A 0.496 0.1342 0.0909 0.4000 0.5833
118051:49 G C 0.335 −0.1170 0.1000 0.1500 0.0000
118835:54 C A 0.322 −0.1122 0.0455 0.3636 0.0000
123202:88 T A 0.330 0.1130 0.0909 0.1000 0.4286
Mean BF0.99 SNPs 0.1204
Mean all SNPs 0.0028
Bayes factor values above 0.99 quantile (BF0.99); Effect size of an individual SNP on the phenotype (β); Minor allele frequency for each locus and morph (maf);Mean effect size of BF0.99 SNPs (Mean BF0.99 SNPs); Mean effect size of all 1,837 SNPs. SNPs common to comparisons are underlined
Rodrigues et al. BMC Genetics (2016) 17:144 Page 8 of 16
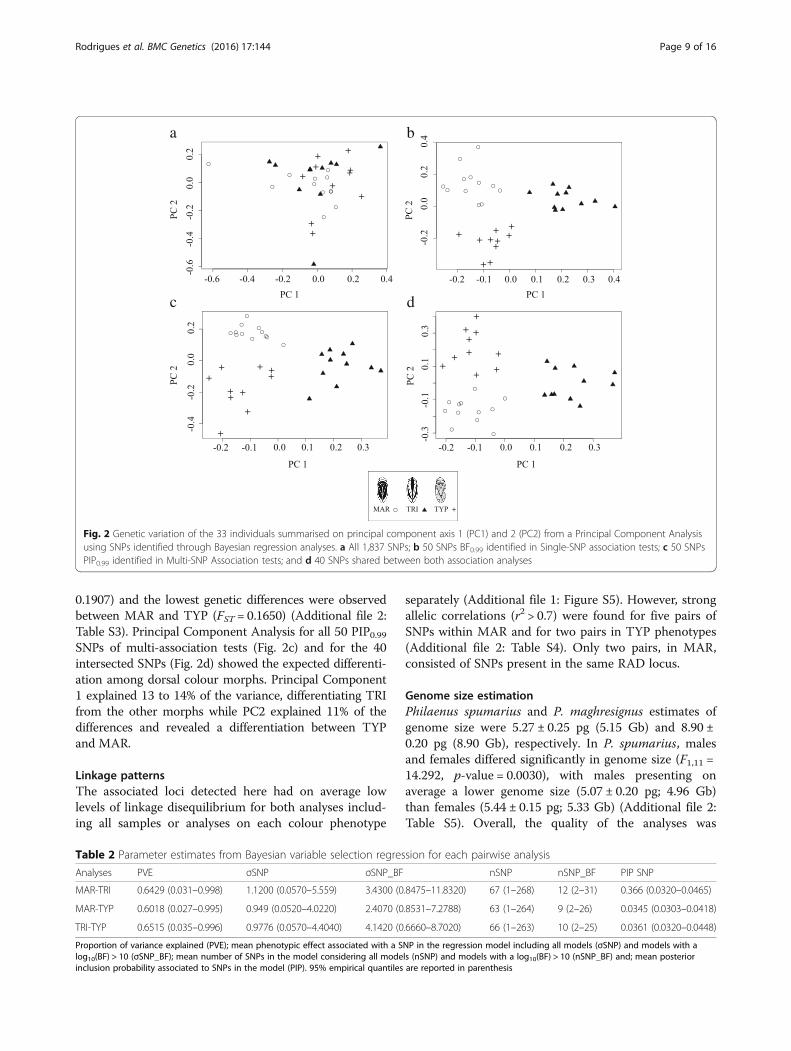
0.1907) and the lowest genetic differences were observedbetween MAR and TYP (FST = 0.1650) (Additional file 2:Table S3). Principal Component Analysis for all 50 PIP0.99SNPs of multi-association tests (Fig. 2c) and for the 40intersected SNPs (Fig. 2d) showed the expected differenti-ation among dorsal colour morphs. Principal Component1 explained 13 to 14% of the variance, differentiating TRIfrom the other morphs while PC2 explained 11% of thedifferences and revealed a differentiation between TYPand MAR.
Linkage patternsThe associated loci detected here had on average lowlevels of linkage disequilibrium for both analyses includ-ing all samples or analyses on each colour phenotype
separately (Additional file 1: Figure S5). However, strongallelic correlations (r2 > 0.7) were found for five pairs ofSNPs within MAR and for two pairs in TYP phenotypes(Additional file 2: Table S4). Only two pairs, in MAR,consisted of SNPs present in the same RAD locus.
Genome size estimationPhilaenus spumarius and P. maghresignus estimates ofgenome size were 5.27 ± 0.25 pg (5.15 Gb) and 8.90 ±0.20 pg (8.90 Gb), respectively. In P. spumarius, malesand females differed significantly in genome size (F1,11 =14.292, p-value = 0.0030), with males presenting onaverage a lower genome size (5.07 ± 0.20 pg; 4.96 Gb)than females (5.44 ± 0.15 pg; 5.33 Gb) (Additional file 2:Table S5). Overall, the quality of the analyses was
a b
c d
Fig. 2 Genetic variation of the 33 individuals summarised on principal component axis 1 (PC1) and 2 (PC2) from a Principal Component Analysisusing SNPs identified through Bayesian regression analyses. a All 1,837 SNPs; b 50 SNPs BF0.99 identified in Single-SNP association tests; c 50 SNPsPIP0.99 identified in Multi-SNP Association tests; and d 40 SNPs shared between both association analyses
Table 2 Parameter estimates from Bayesian variable selection regression for each pairwise analysis
Analyses PVE σSNP σSNP_BF nSNP nSNP_BF PIP SNP
MAR-TRI 0.6429 (0.031–0.998) 1.1200 (0.0570–5.559) 3.4300 (0.8475–11.8320) 67 (1–268) 12 (2–31) 0.366 (0.0320–0.0465)
MAR-TYP 0.6018 (0.027–0.995) 0.949 (0.0520–4.0220) 2.4070 (0.8531–7.2788) 63 (1–264) 9 (2–26) 0.0345 (0.0303–0.0418)
TRI-TYP 0.6515 (0.035–0.996) 0.9776 (0.0570–4.4040) 4.1420 (0.6660–8.7020) 66 (1–263) 10 (2–25) 0.0361 (0.0320–0.0448)
Proportion of variance explained (PVE); mean phenotypic effect associated with a SNP in the regression model including all models (σSNP) and models with alog10(BF) > 10 (σSNP_BF); mean number of SNPs in the model considering all models (nSNP) and models with a log10(BF) > 10 (nSNP_BF) and; mean posteriorinclusion probability associated to SNPs in the model (PIP). 95% empirical quantiles are reported in parenthesis
Rodrigues et al. BMC Genetics (2016) 17:144 Page 9 of 16
excellent, with a mean CV value of 2.97% being obtainedfor the sample’s G1 peak.
De novo sequencing and assembly of meadow spittlebuggenome and transcriptomeThe genome sequencing set produced a total of 366 mil-lion reads. After filtering reads based on quality, 353million reads (96.46%) were retained (Additional file 2:Table S6). SOAPdenovo2 produced 6,843,324 contigsand 4,010,521 scaffolds. The N50 was 686 bp and thepercentage of gaps was 20.47%. In total,1,218,749,078 bp were assembled which based on thetotal estimated genome size of 5.3 Gb, corresponds toapproximately 24% of the P. spumarius genome.For the transcriptome, the total number of 150 nt
reads for each paired-end of the library was 17 millionresulting in 5110.8 Mb of sequence (Additional file 2:Table S6). After quality filtering, 14 million (86.81%)read pairs were used in the assembly (Additional file 2:Table S6). The transcriptome assembly produced173,691 contigs and 31,050 scaffolds. In this case, theobserved N50 obtained was 803 bp and the percentageof gaps 0.39%. A total of 81,442,967 bp were assembled.
Assembly statistics for the genome and transcriptomeare summarised in Additional file 2: Table S6.
Characterisation of RAD lociNo significant hits were found when querying the 928RAD loci against Arthropoda sequences of NCBI ntdatabase and only 15 hits (E-value < 1e-05) were foundagainst Arthropoda sequences of NCBI nr database(Additional file 2: Table S7). However, this was not un-expected considering RAD loci sequences are less than100 bp and the most closely related insect species withan available genome is the pea aphid Acyrthosiphonpisum, which belongs to a separate hemipteraninfraorder.A total of 392 RAD loci (42.24%) aligned to the
draft of P. spumarius genome (E-value threshold of1e-15), 18 of which were associated with colourmorphs (34.62% of the colour-associated loci se-quences) (Additional file 2: Table S8). On the otherhand, 134 loci, corresponding to 14.44% of the totalloci, aligned to P. spumarius transcriptome assembly.Five of those were colour-associated (9.62% of thecolour-associated loci) (Additional file 2: Table S8).
c
a b
Fig. 3 Posterior inclusion probabilities (PIPs) for each SNP in each pairwise comparison in multi-SNP association tests. a MAR vs. TRI; b MAR vs.TYP; and c TRI vs. TYP. The horizontal dash lines correspond to the PIP 95% empirical quantile threshold and the straight lines to the 99%empirical quantile. Light grey dots: SNPs with a PIP < 99% empirical quantile; Dark grey dots: SNPs with a PIP > 99% empirical quantile; Red dots:SNPs with a PIP > 99% empirical quantile and shared among comparisons
Rodrigues et al. BMC Genetics (2016) 17:144 Page 10 of 16
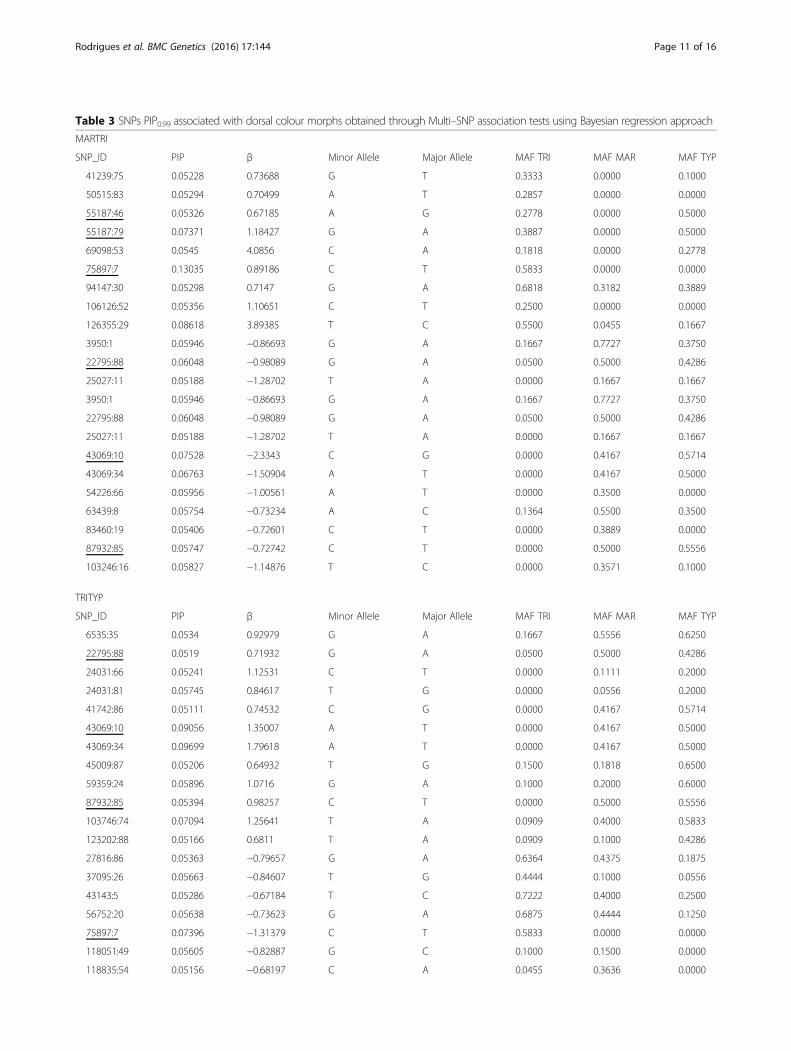
Table 3 SNPs PIP0.99 associated with dorsal colour morphs obtained through Multi–SNP association tests using Bayesian regression approach
MARTRI
SNP_ID PIP β Minor Allele Major Allele MAF TRI MAF MAR MAF TYP
41239:75 0.05228 0.73688 G T 0.3333 0.0000 0.1000
50515:83 0.05294 0.70499 A T 0.2857 0.0000 0.0000
55187:46 0.05326 0.67185 A G 0.2778 0.0000 0.5000
55187:79 0.07371 1.18427 G A 0.3887 0.0000 0.5000
69098:53 0.0545 4.0856 C A 0.1818 0.0000 0.2778
75897:7 0.13035 0.89186 C T 0.5833 0.0000 0.0000
94147:30 0.05298 0.7147 G A 0.6818 0.3182 0.3889
106126:52 0.05356 1.10651 C T 0.2500 0.0000 0.0000
126355:29 0.08618 3.89385 T C 0.5500 0.0455 0.1667
3950:1 0.05946 −0.86693 G A 0.1667 0.7727 0.3750
22795:88 0.06048 −0.98089 G A 0.0500 0.5000 0.4286
25027:11 0.05188 −1.28702 T A 0.0000 0.1667 0.1667
3950:1 0.05946 −0.86693 G A 0.1667 0.7727 0.3750
22795:88 0.06048 −0.98089 G A 0.0500 0.5000 0.4286
25027:11 0.05188 −1.28702 T A 0.0000 0.1667 0.1667
43069:10 0.07528 −2.3343 C G 0.0000 0.4167 0.5714
43069:34 0.06763 −1.50904 A T 0.0000 0.4167 0.5000
54226:66 0.05956 −1.00561 A T 0.0000 0.3500 0.0000
63439:8 0.05754 −0.73234 A C 0.1364 0.5500 0.3500
83460:19 0.05406 −0.72601 C T 0.0000 0.3889 0.0000
87932:85 0.05747 −0.72742 C T 0.0000 0.5000 0.5556
103246:16 0.05827 −1.14876 T C 0.0000 0.3571 0.1000
TRITYP
SNP_ID PIP β Minor Allele Major Allele MAF TRI MAF MAR MAF TYP
6535:35 0.0534 0.92979 G A 0.1667 0.5556 0.6250
22795:88 0.0519 0.71932 G A 0.0500 0.5000 0.4286
24031:66 0.05241 1.12531 C T 0.0000 0.1111 0.2000
24031:81 0.05745 0.84617 T G 0.0000 0.0556 0.2000
41742:86 0.05111 0.74532 C G 0.0000 0.4167 0.5714
43069:10 0.09056 1.35007 A T 0.0000 0.4167 0.5000
43069:34 0.09699 1.79618 A T 0.0000 0.4167 0.5000
45009:87 0.05206 0.64932 T G 0.1500 0.1818 0.6500
59359:24 0.05896 1.0716 G A 0.1000 0.2000 0.6000
87932:85 0.05394 0.98257 C T 0.0000 0.5000 0.5556
103746:74 0.07094 1.25641 T A 0.0909 0.4000 0.5833
123202:88 0.05166 0.6811 T A 0.0909 0.1000 0.4286
27816:86 0.05363 −0.79657 G A 0.6364 0.4375 0.1875
37095:26 0.05663 −0.84607 T G 0.4444 0.1000 0.0556
43143:5 0.05286 −0.67184 T C 0.7222 0.4000 0.2500
56752:20 0.05638 −0.73623 G A 0.6875 0.4444 0.1250
75897:7 0.07396 −1.31379 C T 0.5833 0.0000 0.0000
118051:49 0.05605 −0.82887 G C 0.1000 0.1500 0.0000
118835:54 0.05156 −0.68197 C A 0.0455 0.3636 0.0000
Rodrigues et al. BMC Genetics (2016) 17:144 Page 11 of 16
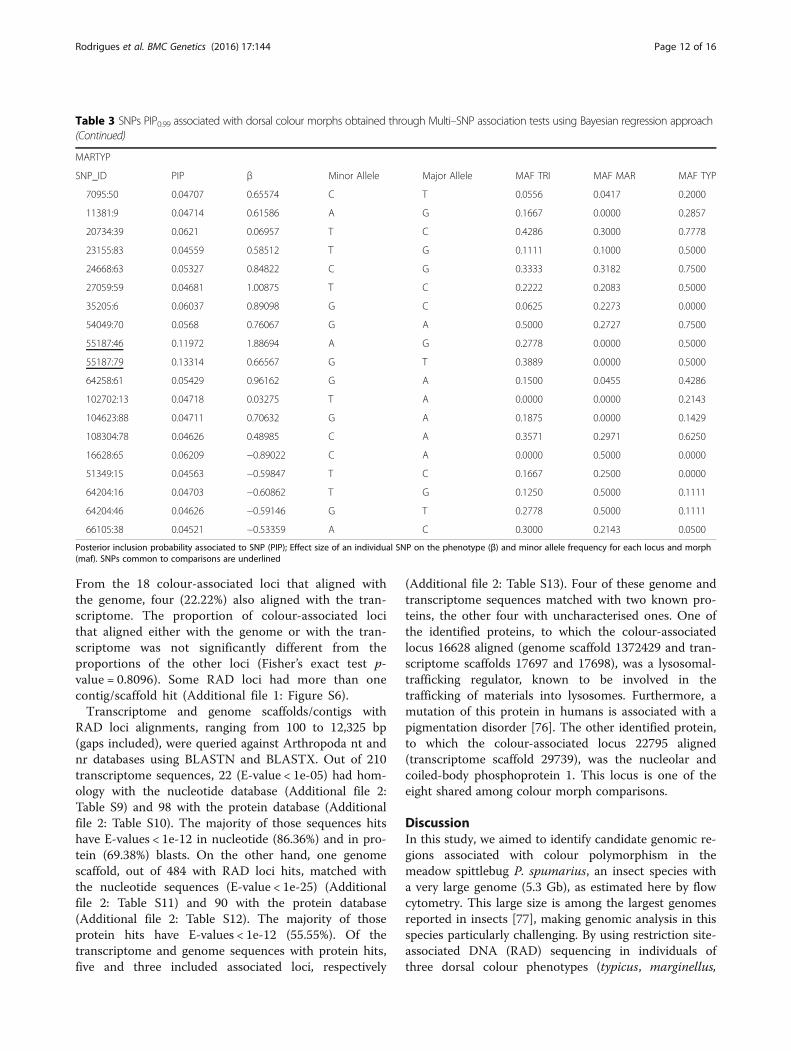
From the 18 colour-associated loci that aligned withthe genome, four (22.22%) also aligned with the tran-scriptome. The proportion of colour-associated locithat aligned either with the genome or with the tran-scriptome was not significantly different from theproportions of the other loci (Fisher’s exact test p-value = 0.8096). Some RAD loci had more than onecontig/scaffold hit (Additional file 1: Figure S6).Transcriptome and genome scaffolds/contigs with
RAD loci alignments, ranging from 100 to 12,325 bp(gaps included), were queried against Arthropoda nt andnr databases using BLASTN and BLASTX. Out of 210transcriptome sequences, 22 (E-value < 1e-05) had hom-ology with the nucleotide database (Additional file 2:Table S9) and 98 with the protein database (Additionalfile 2: Table S10). The majority of those sequences hitshave E-values < 1e-12 in nucleotide (86.36%) and in pro-tein (69.38%) blasts. On the other hand, one genomescaffold, out of 484 with RAD loci hits, matched withthe nucleotide sequences (E-value < 1e-25) (Additionalfile 2: Table S11) and 90 with the protein database(Additional file 2: Table S12). The majority of thoseprotein hits have E-values < 1e-12 (55.55%). Of thetranscriptome and genome sequences with protein hits,five and three included associated loci, respectively
(Additional file 2: Table S13). Four of these genome andtranscriptome sequences matched with two known pro-teins, the other four with uncharacterised ones. One ofthe identified proteins, to which the colour-associatedlocus 16628 aligned (genome scaffold 1372429 and tran-scriptome scaffolds 17697 and 17698), was a lysosomal-trafficking regulator, known to be involved in thetrafficking of materials into lysosomes. Furthermore, amutation of this protein in humans is associated with apigmentation disorder [76]. The other identified protein,to which the colour-associated locus 22795 aligned(transcriptome scaffold 29739), was the nucleolar andcoiled-body phosphoprotein 1. This locus is one of theeight shared among colour morph comparisons.
DiscussionIn this study, we aimed to identify candidate genomic re-gions associated with colour polymorphism in themeadow spittlebug P. spumarius, an insect species witha very large genome (5.3 Gb), as estimated here by flowcytometry. This large size is among the largest genomesreported in insects [77], making genomic analysis in thisspecies particularly challenging. By using restriction site-associated DNA (RAD) sequencing in individuals ofthree dorsal colour phenotypes (typicus, marginellus,
Table 3 SNPs PIP0.99 associated with dorsal colour morphs obtained through Multi–SNP association tests using Bayesian regression approach(Continued)
MARTYP
SNP_ID PIP β Minor Allele Major Allele MAF TRI MAF MAR MAF TYP
7095:50 0.04707 0.65574 C T 0.0556 0.0417 0.2000
11381:9 0.04714 0.61586 A G 0.1667 0.0000 0.2857
20734:39 0.0621 0.06957 T C 0.4286 0.3000 0.7778
23155:83 0.04559 0.58512 T G 0.1111 0.1000 0.5000
24668:63 0.05327 0.84822 C G 0.3333 0.3182 0.7500
27059:59 0.04681 1.00875 T C 0.2222 0.2083 0.5000
35205:6 0.06037 0.89098 G C 0.0625 0.2273 0.0000
54049:70 0.0568 0.76067 G A 0.5000 0.2727 0.7500
55187:46 0.11972 1.88694 A G 0.2778 0.0000 0.5000
55187:79 0.13314 0.66567 G T 0.3889 0.0000 0.5000
64258:61 0.05429 0.96162 G A 0.1500 0.0455 0.4286
102702:13 0.04718 0.03275 T A 0.0000 0.0000 0.2143
104623:88 0.04711 0.70632 G A 0.1875 0.0000 0.1429
108304:78 0.04626 0.48985 C A 0.3571 0.2971 0.6250
16628:65 0.06209 −0.89022 C A 0.0000 0.5000 0.0000
51349:15 0.04563 −0.59847 T C 0.1667 0.2500 0.0000
64204:16 0.04703 −0.60862 T G 0.1250 0.5000 0.1111
64204:46 0.04626 −0.59146 G T 0.2778 0.5000 0.1111
66105:38 0.04521 −0.53359 A C 0.3000 0.2143 0.0500
Posterior inclusion probability associated to SNP (PIP); Effect size of an individual SNP on the phenotype (β) and minor allele frequency for each locus and morph(maf). SNPs common to comparisons are underlined
Rodrigues et al. BMC Genetics (2016) 17:144 Page 12 of 16
and trilineatus), we were able to detect association withcolour in 3% of the analysed SNPs (60 out of 1,837).These phenotypes did not reveal significant genome-wide differences but when considering only the associ-ated SNPs, the three colour morphs were differentiatedand the trilineatus phenotype showed the highest gen-etic differentiation. Interestingly, greater differences in-volving life-history traits such as longevity, number ofeggs, and number of oviposition events are also knownto occur in trilineatus [33]. It may be that the geneticdifferences detected in this morph also reflect some partof the genetic basis of these life-history differencesamong colour morphs. Therefore, we may not only beon the track to finding a colour gene but also perhapsan extensive region, or several regions of the genome,that links colour variation and other life-history orphysiological traits, as previously suggested [38]. Ourfinding of several colour-associated SNPs, some of themmapped to different genome and transcriptome scaf-folds, suggests a complex genetic architecture involvingthis colour polymorphism.In the single-SNP association analyses, the 50 individ-
ual SNPs found to be associated at 99% quantile (BF0.99SNPs) showed moderate phenotypic effects (0.10 < | β |< 0.15). In the multi-SNP association analyses, 50 SNPswith posterior inclusion probabilities at quantile 99%(PIP0.99 SNPs) showed large effects for pairs of colourphenotypes (σSNP > 0.9 and individual PIP0.99 SNPs | β| > 0.5). From these, 40 were common to the SNPs iden-tified in single SNP analyses (BF0.99 SNPs), increasingthe confidence for the detected associations. Althoughinferences about the genetic architecture are only tenta-tive in this study, due to the relatively small proportionof the genome covered, our results suggest that differ-ences among the three dorsal colour phenotypes are as-sociated with several loci with large effects. However, itis still not entirely clear if these constitute the majorlocus determining dorsal colour pattern, revealed byMendelian crosses in P. spumarius [31, 36]. Large effectloci controlling colour pattern have been reported forHeliconius species [78, 79], land snail Cepaea nemoralis[42], and more recently in Timema cristinae stick insects[80]. Several other examples [81–83] have shown thatadaptive traits are affected by loci with large phenotypiceffects and that this genetic architecture may be morecommon than initially thought. The majority of thecolour-associated loci that we detected here did notshow significant allelic correlations, being likely in inde-pendent genomic regions. However, a few loci werestrongly correlated, indicating either physical linkage,random drift of rare alleles, or occurrence of recent mu-tations. The existence of tightly linked loci (a supergene)that can be maintained due to chromosomal rearrange-ments or selection of co-adapted loci with epistatic
effects is also possible. In the mimetic butterfly Helico-nius melpomene, a cluster of three tightly linked loci(HmN, HmYb and HmSb), lying just a few centimorgansapart, as well as other unlinked loci have been shown tocontrol distinct wing colour pattern elements in this spe-cies [84]. In a closely related species Heliconius numata,polymorphic colour variation is controlled by a singlelocus P, forming a supergene, resulting from chromo-somal rearrangements [85]. A single gene, doublesex,with closely linked mutations, also controls supergenemimicry in Papilio polytes [86].Various genes and pathways have been reported to
be involved in insect coloration and pigmentation.These pathways comprise genes regulating the distri-bution of pigments in space and time, as well asgenes that are involved in the synthesis of pigments[87]. Several colour genes have been described, mostlyin Drosophila spp. (see [87] for a review) and areknown to be involved in colour variation in the silkworm Bombyx mori [88] and Papilio spp. [86, 89, 90]as well. Novel and unexpected genes were found tobe responsible for wing colour patterning in Helico-nius species. Red wing elements are associated withexpression of the transcription factor optix [91],which in turn is regulated by two distinct cis-regula-tory loci [92]. Another gene, cortex, a member of aconserved cell cycle regulator family, appears to haveadopted a novel function controlling colour pattern inHeliconius and probably across the Lepidoptera [93].Regulatory regions are also known to control colourpattern in Drosophila flies [94, 95]. However, none ofthe colour-associated loci that we found in our studymatched these candidate genes and/or genomic re-gions of other insects. Approximately 10% of the lociwith colour associations aligned with the P. spumar-ius transcriptome indicating that those loci are incoding regions that are expressed in adult stage. Asimilar proportion of alignment to the transcriptomewas found between associated loci and all loci (Fish-er’s exact test p-value = 0.8096), suggesting that thereis no enrichment/depletion of coding regions in theassociated loci in relation to the total number of loci.Around 35% of the colour-associated loci aligned withthe genome and 22% also aligned with the transcrip-tome. If we assume a good representation of the totaltranscriptome, this result point to the majority of theassociated loci being in non-coding regions. Consider-ing that our assembled genome represents only 24% of thetotal genome size, the low percentage of hits in the gen-ome was expected. Also, the low number of nucleotideand protein matches of genome and transcriptome se-quences is certainly due to the degree of similarity of P.spumarius to other available Arthropoda sequences beingtoo low to allow significant matches. Increasing the
Rodrigues et al. BMC Genetics (2016) 17:144 Page 13 of 16
genomic resources for this or related species will allow ex-ploring the candidate loci here described and provideinsight into some of the key questions that remain to beanswered. What are the specific genes contributing to thisbalanced colour polymorphism? What mutations cause al-lelic differences in these genes and how do they contributeto the different colour phenotypes? Are there epistatic oradditive effects among the alleles responsible for the poly-morphism? Does this constitute a supergene? Are codingor regulatory mutations involved? In the future, it wouldalso be interesting to investigate the evolutionary historyof the colour polymorphism within Philaenus since identi-cal variation in dorsal colour/pattern can be observed inthe other species of the genus, suggesting an ancestralpolymorphism maintained through the speciation process.
ConclusionsThis work was a first approach to investigate the geneticarchitecture of P. spumarius dorsal colour polymorph-ism, by studying single and multi-SNP association withthree of the colour phenotypes. We detected several lociwith large effects occurring in multiple genomic regions.Trilineatus was found to be the most differentiatedcolour phenotype for these loci, and since it is also themost differentiated for several life-history and physio-logical traits, we suggest that genetic bases of colour andof these traits are linked. The development of genomicand transcriptomic resources in this work was a firststep toward characterizing these loci and will be veryuseful for further research on the genetic basis of dorsalcolour pattern variation in P. spumarius.
Additional files
Additional file 1: Figure S1 – S6. Histograms of the total number ofraw reads, mean depth and proportion of missing data per individual andof the R2 values for each colour-associated SNP comparison; scatterplots ofthe number of SNPs in the model as a function of the Bayes factor for eachpairwise comparison in multi-SNP association tests; and number of RAD locihits with genome and transcriptome. (PDF 1411 kb)
Additional file 2: Table S1 – S13. Lists of colour-associated SNPsobtained for each pairwise comparison and association analyses; genicand genotypic differentiation tests; pairwise Fst estimates among dorsalcolour phenotypes; SNP correlation value (r2) in linkage disequilibriumanalyses; Genome size estimates; Assembly statistics for genome andtranscriptome; and lists of blast results. (XLSX 159 kb)
Additional file 3: Data file with 1,837 SNPs. (VCF 287 kb)
AbbreviationsAMOVA: Analysis of molecular variance; BF: Bayes Factor; BF0.95 SNPs: SNPsabove 95% empirical quantile for BF; BF0.99 SNPs: SNPs above 99% empiricalquantile for BF; BVSR: Bayesian variable selection regression; FDR: FalseDiscovery Rate; FL: Histogram of fluorescence pulse integral in linear scale;FS: Forward light scatter; FST: Fixation index; Gb: Giga base pairs; LD: Linkagedisequilibrium; maf: Minor allele frequency; MAR: marginellus; nSNPs: Numberof SNPs in the regression model; PCA: Principal Component Analysis;PCR: Polymerase Chain Reaction; pg: Picograms; PIP: Posterior inclusionprobability; PIP0.99 SNPs: PIP greater than 99% empirical quantile;PVE: Proportion of variance explained; r2: Squared correlation coefficient;
RAD: Restriction site-associated DNA sequencing; SNPs: Single NucleotidePolymorphisms; SS: Side light scatter; TRI: trilineatus; TYP: typicus;β: Phenotypic effect; σSNP: Average phenotypic effect of a SNP that isin the model
AcknowledgmentsWe thank Kimberly Walden (University of Illinois) for assistance with RNAextraction and transcriptome assembly, Simon Baxter, from University ofAdelaide, for assistance with RAD sequencing and Joana Fino and DiogoSilva for bioinformatics assistance.
FundingFinancial support was provided from National Funds throughFCT – Fundação para a Ciência e a Tecnologia, Portugal under projectsPTDC/BIA-BEC/098783/2008 and UID/BIA/00329/2013, and grants SFRH/BD/73879/2010 (attributed to ASR); SFRH/BPD/26365/2006 and SFRH/BPD/108413/2015 (attributed to SGS); SFRH/BD/89617/2012 (attributedto MC). This work was also supported by US NSF grant DEB-1239788to KPJ and CHD.
Availability of data and materialsRaw reads and assemblies of the transcriptome and genome aresubmitted to NCBI under BioProjects PRJNA272277 and PRJNA321110,respectively. Raw reads of the RAD libraries used for association analysesare available from the corresponding author on reasonable request. SNPsdataset generated and analysed during this study are included in thispublished article (Additional file 3).
Authors’ contributionsASBR, PAVB, JAQ, CDJ, OSP and SGS participated in the design of the study.ASBR, SES and SGS were responsible for sampling. ASBR was responsible forDNA extraction and RAD libraries preparation. KG was responsible for nextgeneration sequencing of RAD libraries. ASBR performed the bioinformaticsanalyses, which included the genome and the RAD libraries assembly, theassociation analysis and blasts. FPM participated in the bioinformaticsanalysis. JL and MC were responsible for the genome size estimates by flowcytometry. KPJ and CHD provided sequencing and assembly of thetranscriptome. ASBR wrote the manuscript with contributions from SGS, OSP,CDJ, JL, MC, KPJ, CHD. All authors read and approved the final manuscript.
Competing interestsThe authors declare that they have no competing interests.
Consent for publicationNot applicable.
Ethics approval and consent to participateNot applicable.
Author details1Computational Biology and Population Genomics Group, cE3c – Centre forEcology, Evolution and Environmental Changes, Departamento de BiologiaAnimal, Faculdade de Ciências da Universidade de Lisboa, Campo Grande,Lisbon P-1749-016, Portugal. 2Centro de Estudos do Ambiente e do Mar(CESAM), DBA/FCUL, Lisbon, Portugal. 3Centre for Functional Ecology,Department of Life Sciences, University of Coimbra, Coimbra, Portugal.4Edinburgh Genomics, Ashworth Laboratories, King’s Buildings, The Universityof Edinburgh, Edinburgh EH9 3JT, UK. 5Illinois Natural History Survey, PrairieResearch Institute, University of Illinois, Champaign, IL, USA. 6cE3c – Centrefor Ecology, Evolution and Environmental Changes/Azorean BiodiversityGroup and Universidade dos Açores – Departamento de Ciências eEngenharia do Ambiente, Angra do Heroísmo, Açores, Portugal. 7Departmentof Zoology, University of Cambridge, Downing Street, Cambridge CB2 3EJ, UK.
Received: 24 July 2016 Accepted: 7 November 2016
References1. Baird NA, Etter PD, Atwood TS, Currey MC, Shiver AL, Lewis Z, et al. Rapid
SNP discovery and genetic mapping using sequenced RAD markers. PLoSOne. 2008;3:e3376.
Rodrigues et al. BMC Genetics (2016) 17:144 Page 14 of 16
2. Davey JW, Blaxter ML. RADSeq: next-generation population genetics. BriefFunct Genomics. 2010;9:416–23.
3. Amores A, Catchen J, Ferrara A, Fontenot Q, Postlethwait JH. Genomeevolution and meiotic maps by massively parallel DNA sequencing: spottedgar, an outgroup for the teleost genome duplication. Genetics. 2011;188:799–808.
4. Baxter SW, Davey JW, Johnston JS, Shelton AM, Heckel DG, Jiggins CD, et al.Linkage mapping and comparative genomics using next-generation radsequencing of a non-model organism. PLoS One. 2011;6:e19315.
5. Davey JW, Hohenlohe PA, Etter PD, Boone JQ, Catchen JM, Blaxter ML.Genome-wide genetic marker discovery and genotyping using next-generation sequencing. Nat Rev Genet. 2011;12:499–510.
6. Davey JW, Cezard T, Fuentes-Utrilla P, Eland C, Gharbi K, Blaxter ML. Specialfeatures of RAD Sequencing data: Implications for genotyping. Mol Ecol.2013;22:3151–64.
7. Rowe HC, Renaut S, Guggisberg A. RAD in the realm of next-generationsequencing technologies. Mol Ecol. 2011;20:3499–502.
8. Black WC, Baer CF, Antolin MF, DuTeau NM. Population genomics:genome-wide sampling of insect populations. Annu Rev Entomol. 2001;46:441–69.
9. Stinchcombe JR, Hoekstra HE. Combining population genomics andquantitative genetics: finding the genes underlying ecologically importanttraits. Heredity. 2008;100:158–70.
10. Hoekstra HE, Krenz JG, Nachman MW. Local adaptation in the rock pocketmouse (Chaetodipus intermedius): natural selection and phylogenetichistory of populations. Heredity. 2005;94:217–28.
11. Munday PL, Eyre PJ, Jones GP. Ecological mechanisms for coexistence ofcolour polymorphism in a coral-reef fish: an experimental evaluation.Oecologia. 2003;137:519–26.
12. Hoffman EA, Blouin MS. A review of colour and pattern polymorphisms inanurans. Biol J Linn Soc. 2000;70:633–65.
13. Nunes VL, Miraldo A, Beaumont MA, Butlin RK, Paulo OS. Association ofMc1r variants with ecologically relevant phenotypes in the Europeanocellated lizard, Lacerta lepida. J Evol Biol. 2011;24:2289–98.
14. Perez i de Lanuza G, Font E, Carazo P. Color-assortative mating in a color-polymorphic lacertid lizard. Behav Ecol. 2013;24:273–9.
15. Galeotti P, Rubolini D, Dunn PO, Fasola M. Colour polymorphism in birds:Causes and functions. J Evol Biol. 2003;16:635–46.
16. Roulin A. The evolution, maintenance and adaptive function ofgenetic colour polymorphism in birds. Biol Rev Camb Philos Soc.2004;79:815–48.
17. Bond AB. The evolution of color polymorphism: crypticity, searching images,and apostatic selection. Annu Rev Ecol Evol Syst. 2007;38:489–514.
18. Forsman A, Ahnesjö J, Caesar S, Karlsson M. A model of ecologicaland evolutionary consequences of color polymorphism. Ecology. 2008;89:34–40.
19. Lozier JD, Jackson JM, Dillon ME, Strange JP. Population genomics ofdivergence among extreme and intermediate color forms in a polymorphicinsect. Ecol Evol. 2016;6:1075–91.
20. Gray SM, McKinnon JS. Linking color polymorphism maintenance andspeciation. Trends Ecol Evol. 2007;22:71–9.
21. Punzalan D, Rodd FH, Hughes KA. Perceptual processes and themaintenance of polymorphism through frequency-dependent predation.Evol Ecol. 2005;19:303–20.
22. Svensson EI, Abbott J, Härdling R. Female polymorphism, frequencydependence, and rapid evolutionary dynamics in natural populations. AmNat. 2005;165:567–76.
23. Kusche H, Meyer A. One cost of being gold: selective predation andimplications for the maintenance of the Midas cichlid colour polymorphism(Perciformes: Cichlidae). Biol J Linn Soc. 2014;111:350–8.
24. Vercken E, Clobert J, Sinervo B. Frequency-dependent reproductive successin female common lizards: a real-life hawk–dove–bully game? Oecologia.2010;162:49–58.
25. Jones JS, Leith BH, Rawlings P. Polymorphism in cepaea: a problem withtoo many solutions? Annu Rev Ecol Syst. 1977;8:109–43.
26. Oxford GS. A countrywide survey of colour morph frequencies in the spiderEnoplognatha ovata (Clerck) (Araneae: Theridiidae): evidence for naturalselection. Biol. J. Linn. Soc. 1985;24:103–42.
27. Roulin A, Ducret B, Ravussin PA, Altwegg R. Female colour polymorphismcovaries with reproductive strategies in the tawny owl Strix aluco. J AvianBiol. 2003;34:393–401.
28. Halkka O, Halkka L. Population-genetics of the polymorphic meadowspittlebug, philaenus spumarius (L). Evol Biol. 1990;24:149–91.
29. Rodrigues ASB, Silva SE, Marabuto E, Silva DN, Wilson MR, Thompson V, etal. New mitochondrial and nuclear evidences support recent demographicexpansion and an atypical phylogeographic pattern in the spittlebugPhilaenus spumarius (Hemiptera, Aphrophoridae). PLoS One. 2014;9:1–12.
30. Yurtsever S. On the polymorphic meadow spittlebug, Philaenus spumarius(L.) (Homoptera: Cercopidae). Turkish J Zool. 2000;24:447–59.
31. Stewart AJA, Lees DR. The Colour/Pattern Polymorphism of Philaenusspumarius (L.) (Homoptera: Cercopidae) in England and Wales. Philos TransR Soc B Biol Sci. 1996;351:69–89.
32. Quartau JA, Borges PAV. On the colour polymorphism of Philaenusspumarius (L.) in Portugal. Misc Zool. 1997;2:19–30.
33. Silva SE, Rodrigues ASB, Marabuto E, Yurtserver S, Borges PAV, Quartau JA,et al. Differential survival and reproduction in colour forms of Philaenusspumarius give new insights to the study of its balanced polymorphism.Ecol Entomol. 2015;40:759–66.
34. Berry AJ, Willmer PG. Temperature and the colour polymorphism of Philaenusspumarius (Homoptera: Aphrophoridae). Ecol Entomol. 1986;11:251–9.
35. Harper G, Whittaker JB. The role of natural enemies in the colourpolymorphism of philaenus spumarius (L.). J Anim Ecol. 1976;45:91.
36. Halkka O. The genetic basis of balanced polymorphism in Philaenus(Homoptera). Hereditas. 1973;74:69–80.
37. Stewart AJA, Lees DR. Genetic control of colour/pattern polymorphism inBritish populations of the spittlebug Philaenus spumarius (L.) (Homoptera:Aphrophoridae). Biol. J Linn Soc. 1988;34:57–79.
38. Hallka O, Lallukka R. The origin of balanced polymorphism in the spittlebugs(Philaenus, Homoptera). Ann Zool Fennici. 1969;6:431–4.
39. Thompson MJ, Jiggins CD. Supergenes and their role in evolution. Heredity.2014;113:1–8.
40. Joron M, Wynne IR, Lamas G, Mallet J. Variable selection and the coexistence ofmultiple mimetic forms of the butterfly Heliconius numata. Evol Ecol. 1999;13:721–54.
41. Nijhout HF. Polymorphic mimicry in Papilio dardanus: mosaic dominance,big effects, and origins. Evol Dev. 2003;5:579–92.
42. Richards PM, Liu MM, Lowe N, Davey JW, Blaxter ML, Davison A. RAD-Seqderived markers flank the shell colour and banding loci of the Cepaeanemoralis supergene. Mol Ecol. 2013;22:3077–89.
43. Tuttle EM, Bergland AO, Korody ML, Brewer MS, Newhouse DJ, Minx P, et al.Divergence and Functional Degradation of a Sex Chromosome-likeSupergene. Curr. Biol. 2016;1–7.
44. Eaton DAR. PyRAD: assembly of de novo RADseq loci for phylogeneticanalyses. Bioinformatics. 2014;30:1844–9.
45. Catchen JM, Amores A, Hohenlohe P, Cresko W, Postlethwait JH. Stacks:building and genotyping Loci de novo from short-read sequences. G3(Bethesda). 2011;1:171–82.
46. Edgar RC. MUSCLE: multiple sequence alignment with high accuracy andhigh throughput. Nucleic Acids Res. 2004;32:1792–7.
47. VSEARCH GitHub repository [https://github.com/torognes/vsearch/commit/55b8c583e5e20652c511a6bd40c4456b6778fc02]
48. Danecek P, Auton A, Abecasis G, Albers CA, Banks E, DePristo MA, et al. Thevariant call format and VCFtools. Bioinformatics. 2011;27:2156–8.
49. Pritchard JK, Przeworski M. Linkage disequilibrium in humans: models anddata. Am J Hum Genet. 2001;69:1–14.
50. Lischer HEL, Excoffier L. PGDSpider: an automated data conversion tool forconnecting population genetics and genomics programs. Bioinformatics.2012;28:298–9.
51. Roshyara NR, Scholz M. fcGENE: a versatile tool for processing andtransforming SNP datasets. PLoS One. 2014;9:e97589.
52. Purcell S, Neale B, Todd-Brown K, Thomas L, Ferreira MAR, Bender D, et al.PLINK: a tool set for whole-genome association and population-basedlinkage analyses. Am J Hum Genet. 2007;81:559–75.
53. Benjamini Y, Hochberg Y. Controlling the False Discovery Rate: A Practical andPowerful Approach to Multiple Testing. J. R. Stat. Soc. Ser. B. 1995:p. 289–300.
54. Guan Y, Stephens M. Bayesian variable selection regression for genome-wideassociation studies and other large-scale problems. Ann Appl Stat. 2011;5:1780–815.
55. Servin B, Stephens M. Imputation-based analysis of association studies:candidate regions and quantitative traits. PLoS Genet. Public Library ofScience. 2007;3:e114.
56. Raymond M, Rousset F. An exact test for population differentiation.Evolution. 1995;49:1280.
Rodrigues et al. BMC Genetics (2016) 17:144 Page 15 of 16
57. Weir BS, Cockerham CC. Estimating F-statistics for the analysis of populationstructure. Evolution. 1984;38:1358.
58. Rousset F. genepop’007: a complete re-implementation of the genepopsoftware for Windows and Linux. Mol Ecol Resour. 2008;8:103–6.
59. R_little_scripts repository [https://github.com/Nymeria8/R_little_scripts/commit/0d91d1b89219c27ebf51a3074a32e5f191b19990].
60. Babraham Bioinformatics webpage [http://www.bioinformatics.babraham.ac.uk/projects/fastqc/].
61. Bolger AM, Lohse M, Usadel B. Trimmomatic: a flexible trimmer for Illuminasequence data. Bioinformatics. 2014;30:2114–20.
62. Luo R, Liu B, Xie Y, Li Z, Huang W, Yuan J, et al. SOAPdenovo2: anempirically improved memory-efficient short-read de novo assembler.Gigascience. 2012;1:18.
63. SOAPdenovo2 repository [https://github.com/aquaskyline/SOAPdenovo2/commit/dd6a98ba19bb21c3513a46ad5047d08e57583ab0].
64. FASTX-Toolkit webpage (http://hannonlab.cshl.edu/fastx_toolkit/index.html).65. SOAPdenovo-Trans repository [https://sourceforge.net/projects/
soapdenovotrans/files/SOAPdenovo-Trans].66. Galbraith DW, Harkins KR, Maddox JM, Ayres NM, Sharma DP, Firoozabady E.
Rapid flow cytometric analysis of the cell cycle in intact plant tissues.Science. 1983;220:1049–51.
67. Doležel J, Cíhalíková J, Lucretti S. A high-yield procedure for isolation ofmetaphase chromosomes from root tips of Vicia faba L. Planta. 1992;188:93–8.
68. Loureiro J, Rodriguez E, Dolezel J, Santos C. Two new nuclear isolationbuffers for plant DNA flow cytometry: a test with 37 species. Ann Bot. 2007;100:875–88.
69. Suda J, Kron P, Husband BC, Trávníček P. Flow Cytometry and Ploidy:Applications in Plant Systematics, Ecology and Evolutionary Biology. In:Doležel J, Greilhuber J, Suda J, editors. Flow Cytometry with Plant Cells:Analysis of Genes, Chromosomes and Genomes. Weinheim: Wiley-VCHVerlag GmbH & Co. KGaA; 2007. p. 103–30.
70. Greilhuber J, Temsch E, Loureiro J. Nuclear DNA content measurement.In: Doležel J, Greilhuber J, Suda J, editors. Flow cytometry with plant cells:analysis of genes, chromosomes and genomes. Weinheim: Wiley-VCH VerlagGmbH & Co. KGaA; 2007. p. 67–101.
71. Greilhuber J, Dolezel J, Lysak MA, Bennett MD. The origin, evolution andproposed stabilization of the terms “genome size” and ‘C-value’ to describenuclear DNA contents. Ann Bot. 2005;95:255–60.
72. Dolezel J, Bartos J, Voglmayr H, Greilhuber J. Nuclear DNA content andgenome size of trout and human. Cytometry A. 2003;51:127–8.
73. RAD_Tools repository [https://github.com/CoBiG2/RAD_Tools/commit/425ab4feca895430d30e102d03dcfaa8cb629523].
74. Zhang Z, Schwartz S, Wagner L, Miller W. A greedy algorithm for aligningDNA sequences. J Comput Biol. 2000;7:203–14.
75. Altschul SF, Madden TL, Schäffer AA, Zhang J, Zhang Z, Miller W, et al.Gapped BLAST and PSI-BLAST: a new generation of protein database searchprograms. Nucleic Acids Res. 1997;25:3389–402.
76. Introne W, Boissy RE, Gahl WA. Clinical, molecular, and cell biologicalaspects of chediak–higashi syndrome. Mol Genet Metab. 1999;68:283–303.
77. Gregory TR. Genome Size Evolution in Animals. In: Gregory T, editor. TheEvolution of Genome. Burlington: Elsevier; 2005. p. 3–87.
78. Jiggins CD, McMillan WO. The genetic basis of an adaptive radiation:warning colour in two Heliconius species. Proc R Soc B Biol Sci. 1997;264:1167–75.
79. Joron M, Jiggins CD, Papanicolaou A, McMillan WO. Heliconius wingpatterns: an evo-devo model for understanding phenotypic diversity.Heredity. 2006;97:157–67.
80. Comeault AA, Soria-Carrasco V, Gompert Z, Farkas TE, Buerkle CA, ParchmanTL, et al. Genome-wide association mapping of phenotypic traits subject toa range of intensities of natural selection in timema cristinae *. Am Nat.2014;183:711–27.
81. Bradshaw HD, Schemske DW. Allele substitution at a flower colour locusproduces a pollinator shift in monkeyflowers. Nature. 2003;426:176–8.
82. Colosimo PF, Peichel CL, Nereng K, Blackman BK, Shapiro MD, Schluter D, etal. The genetic architecture of parallel armor plate reduction in threespinesticklebacks. PLoS Biol. 2004;2:e109.
83. Steiner CC, Weber JN, Hoekstra HE. Adaptive variation in beach miceproduced by Two interacting pigmentation genes. PLoS Biol. 2007;5:e219.
84. Joron M, Papa R, Beltrán M, Chamberlain N, Mavárez J, Baxter S, et al.A conserved supergene locus controls colour pattern diversity in heliconiusbutterflies. PLoS Biol. 2006;4:e303.
85. Joron M, Frezal L, Jones RT, Chamberlain NL, Lee SF, Haag CR, et al.Chromosomal rearrangements maintain a polymorphic supergenecontrolling butterfly mimicry. Nature. 2011;477:203–6.
86. Kunte K, Zhang W, Tenger-Trolander A, Palmer DH, Martin A, Reed RD, et al.doublesex is a mimicry supergene. Nature. 2014;507:229–32.
87. Wittkopp PJ, Beldade P. Development and evolution of insect pigmentation:genetic mechanisms and the potential consequences of pleiotropy. SeminCell Dev Biol. 2009;20:65–71.
88. Futahashi R, Sato J, Meng Y, Okamoto S, Daimon T, Yamamoto K, et al.yellow and ebony are the responsible genes for the larval color mutantsof the silkworm Bombyx mori. Genetics. 2008;180:1995–2005.
89. Futahashi R, Fujiwara H. Melanin-synthesis enzymes coregulate stage-specific larval cuticular markings in the swallowtail butterfly, Papilio xuthus.Dev Genes Evol. 2005;215:519–29.
90. Clark R, Brown SM, Collins SC, Jiggins CD, Heckel DG, Vogler AP. Colourpattern specification in the Mocker swallowtail Papilio dardanus: thetranscription factor invected is a candidate for the mimicry locus H.Proc Biol Sci. 2008;275:1181–8.
91. Reed RD, Papa R, Martin A, Hines HM, Counterman BA, Pardo-Diaz C, et al.Optix drives the repeated convergent evolution of butterfly wing patternmimicry. Science. 2011;333:1137–41.
92. Wallbank RWR, Baxter SW, Pardo-Diaz C, Hanly JJ, Martin SH, Mallet J, et al.Evolutionary novelty in a butterfly wing pattern through enhancer shuffling.PLoS Biol. 2016;14:e1002353.
93. Nadeau NJ, Pardo-Diaz C, Whibley A, Supple MA, Saenko SV, Wallbank RWR,et al. The gene cortex controls mimicry and crypsis in butterflies and moths.Nature. 2016;534:106–10.
94. Gompel N, Prud’homme B, Wittkopp PJ, Kassner VA, Carroll SB. Chancecaught on the wing: cis-regulatory evolution and the origin of pigmentpatterns in Drosophila. Nature. 2005;433:481–7.
95. Koshikawa S, Giorgianni MW, Vaccaro K, Kassner VA, Yoder JH, Werner T, etal. Gain of cis -regulatory activities underlies novel domains of winglessgene expression in Drosophila. Proc Natl Acad Sci. 2015;112:7524–9.
• We accept pre-submission inquiries
• Our selector tool helps you to find the most relevant journal
• We provide round the clock customer support
• Convenient online submission
• Thorough peer review
• Inclusion in PubMed and all major indexing services
• Maximum visibility for your research
Submit your manuscript atwww.biomedcentral.com/submit
Submit your next manuscript to BioMed Central and we will help you at every step:
Rodrigues et al. BMC Genetics (2016) 17:144 Page 16 of 16