research article open access analysis of canis ... · research article open access analysis of...
TRANSCRIPT

RESEARCH ARTICLE Open Access
Analysis of Canis mitochondrial DNAdemonstrates high concordance betweenthe control region and ATPase genesLinda Y Rutledge1*, Brent R Patterson2, Bradley N White3
Abstract
Background: Phylogenetic studies of wild Canis species have relied heavily on the mitochondrial DNA controlregion (mtDNA CR) to infer species relationships and evolutionary lineages. Previous analyses of the CR providedevidence for a North American evolved eastern wolf (C. lycaon), that is more closely related to red wolves (C. rufus)and coyotes (C. latrans) than grey wolves (C. lupus). Eastern wolf origins, however, continue to be questioned.Therefore, we analyzed mtDNA from 89 wolves and coyotes across North America and Eurasia at 347 base pairs(bp) of the CR and 1067 bp that included the ATPase6 and ATPase8 genes. Phylogenies and divergence estimateswere used to clarify the evolutionary history of eastern wolves, and regional comparisons of nonsynonomous tosynonomous substitutions (dN/dS) at the ATPase6 and ATPase8 genes were used to elucidate the potential roleof selection in shaping mtDNA geographic distribution.
Results: We found high concordance across analyses between the mtDNA regions studied. Both had a highpercentage of variable sites (CR = 14.6%; ATP = 9.7%) and both phylogenies clustered eastern wolf haplotypesmonophyletically within a North American evolved lineage apart from coyotes. Divergence estimates suggest theputative red wolf sequence is more closely related to coyotes (DxyCR = 0.01982 ± 0.00494 SD; DxyATP = 0.00332 ±0.00097 SD) than the eastern wolf sequences (DxyCR = 0.03047 ± 0.00664 SD; DxyATP = 0.00931 ± 0.00205 SD).Neutrality tests on both genes were indicative of the population expansion of coyotes across eastern NorthAmerica, and dN/dS ratios suggest a possible role for purifying selection in the evolution of North Americanlineages. dN/dS ratios were higher in European evolved lineages from northern climates compared to NorthAmerican evolved lineages from temperate regions, but these differences were not statistically significant.
Conclusions: These results demonstrate high concordance between coding and non-coding regions of mtDNA,and provide further evidence that the eastern wolf possessed distinct mtDNA lineages prior to recent coyoteintrogression. Purifying selection may have influenced North American evolved Canis lineages, but detection ofadaptive selection in response to climate is limited by the power of current statistical tests. Increased sampling anddevelopment of alternative analytical tools will be necessary to disentangle demographic history from processes ofnatural selection.
BackgroundMitochondrial DNA (mtDNA) has been widely used inphylogenetic studies aimed at answering questionsrelated to ecology and evolution. Its maternal inheri-tance, lack of recombination, high copy number, variablesubstitution rates across regions, high mutation ratecompared to nuclear DNA, and role in energy
production [1] make it an attractive genome for researchthat aims to understand species relationships, evolution-ary history, and demographic patterns within both con-temporary and historic contexts. The control region ofthe mitochondria can be particularly useful in under-standing genetic relationships of recently diverged spe-cies because it contains hypervariable regions [2]. Thehigh variation can, however, be problematic for inferringphylogenetic relationships due to mutation rate hetero-geneity among nucleotide sites [3] and high rates of
* Correspondence: [email protected] and Life Sciences Graduate Program, DNA Building, TrentUniversity, 2140 East Bank Drive, Peterborough, ON, K9J 7B8, Canada
Rutledge et al. BMC Evolutionary Biology 2010, 10:215http://www.biomedcentral.com/1471-2148/10/215
© 2010 Rutledge et al; licensee BioMed Central Ltd. This is an Open Access article distributed under the terms of the CreativeCommons Attribution License (http://creativecommons.org/licenses/by/2.0), which permits unrestricted use, distribution, andreproduction in any medium, provided the original work is properly cited.

homoplasy [4,5] that can lead to ambiguous phylogeo-graphic patterns [6]. Although not without its ownpeculiarities [1], coding regions of the mtDNA genomemay help clarify genetic and spatial relationships of spe-cies inferred from the control region alone. Although allregions of mtDNA are linked and the entire mtDNAgenome is inherited as a single molecule without recom-bination, coding and non-coding sections exhibit differ-ent mutation rates due to higher selective forces actingon genes that code for functional proteins [1]. Thus, dif-ferent patterns of diversity, divergence, and phylogeneticclustering may be evident when comparing regionsunder divergent selective forces.In addition to complementing control region phyloge-
nies, analysis of mtDNA coding regions may helpresolve geographical distribution patterns because cod-ing regions of the mtDNA are under strong selectiondue to their fundamental role in energy and heat pro-duction [7,8]. There is growing evidence that purifyingselection on mtDNA coding regions has been importantin shaping the evolution and distribution of mtDNA[8-11]. Additionally, adaptive selection may be important[12] with climatic adaptation acting as an influential fac-tor in mtDNA geographic distribution [13-15], althoughsome have disputed the climate hypothesis [8,16,17].Despite this controversy, most agree that the evolutionof mtDNA is likely more complex than any single factorcould account for. Recent research, however, suggeststhat the mtDNA ATPase genes in particular, may beinfluenced by positive selection [8].To date, studies of North American Canis phyloge-
netics have relied heavily on the mtDNA control regionto infer species relationships and evolutionary history[18-27]. Phylogenetic analysis of the control region pro-vided initial evidence for a North American-evolvedwolf, the eastern wolf (Canis lycaon), that shared anevolutionary history with red wolves (C. rufus) and coy-otes (C. latrans) independent of grey wolves (C. lupus)that evolved in Eurasia and dispersed into North Ameri-can approximately 300,000 years ago [19,20]. Since then,various research has added to the growing evidence sup-porting the eastern wolf as a distinct species [28],including genetic analysis of historic [20] and ancient[25] samples. Despite this, the lineage of the easternwolf continues to be challenged, in part because evi-dence from coding regions that are under selection islacking [29]. Indeed, phylogenetic research on wildcanids has rarely ventured beyond the mtDNA controlregion.Phylogenetic analysis of nuclear Canis markers is
complicated by historic and recent hybridizationbetween coyotes, eastern wolves, and gray wolves[24,25,27]. The advantage of studying a circular, non-recombining marker like mtDNA is that patterns of
evolutionarily independent lineages can be more easilyidentified under complicated demographic histories.Here, we use both the control region and the ATPasecoding region of the mtDNA genome to infer phyloge-netic relationships of the eastern wolf to other Canisspecies. High levels of hybridization and probableincomplete lineage sorting in eastern North AmericanCanis species [24,25,27] also complicate species infer-ences from phylogenetic analysis of mtDNA. We, there-fore, focus on divergence of phylogenetic clades toprovide an understanding of the evolutionary relation-ships and the role that selection has played in the geo-graphic distribution of Canis mtDNA haplotypes. Ourstudy is the first to provide a substantial analysis of themtDNA ATPase region in wild Canis populations. Forclarity, a list of abbreviations is included at the end ofthe manuscript.
Results & DiscussionDiversity and phylogenetic analysisAfter combining sequences obtained from our studywith 9 from Genbank we analyzed 83 control regionsequences (347 bp; h = 29) and 89 ATPase sequences(1067 bp; h = 26) (Table 1). Genbank accession num-bers for sequences generated in this study areHM755678-HM755718. Similar to other studies on thecontrol region [18], we found a higher proportion ofNW coyote clustering haplotypes per sample size atboth the control and ATPase region (0.38, 0.33) com-pared to OW haplotypes (0.29, 0.26). (Haplotype assign-ments to specific samples are shown in Additional File1: Summary of sample locations and mtDNA controlregion and ATPase region haplotypes). Overall, wefound high concordance between results from the con-trol region and those from the ATPase region despitethe different selective forces acting on the two regions.The control region had high variability but only 1.5times more variable sites and 1.6 times higher nucleo-tide diversity per site (Pi) compared to the ATPaseregion (Table 1). Within specific phylogenetic clades,however, Pi was noticeably higher in the control regionthan the ATPase region (Table 1). The higher diversityin the control region is expected since it is not knownto code for functional proteins [30] and has been identi-fied as a mutational hot spot [2]. Recent work, however,suggests that mutational hotspots also occur in codingregions of the mtDNA [31] making the high variationreported here for ATPase genes somewhat less surpris-ing. There were fewer ATPase8 than ATPase6 haplo-types, due to the shorter sequence length of ATPase8,and grey wolves from Sweden, Russian, Spain, andCanada all shared an ATPase8 haplotype (AdditionalFile 1), suggesting that ATPase8 is a highly conservedgene region.
Rutledge et al. BMC Evolutionary Biology 2010, 10:215http://www.biomedcentral.com/1471-2148/10/215
Page 2 of 12

There was a wide geographic distribution of NWcoyote-like ATPase haplotypes (Figure 1). Cladogramsfrom each genetic region had very similar topologies,which is indicative of the haplotype association of thelinked regions. Eastern wolf sequences (Ccr13, Ccr12;Catp13, Catp16) clustered monophyletically with high(> 0.9) posterior probability within the NW clade, butapart from coyotes, whereas the putative red wolfsequence clustered among coyote sequences within theNWCR2coyI/NWATP2coyI clade (Figures 2a, b). Similarclustering of the red wolf control region sequenceamong coyote sequences has been reported [22], but thehaplotype is attributed to red wolves because it is notknown to occur in non-hybridizing coyotes from
western North America. A similar argument has beenmade for coyote-like eastern wolf haplotypes [27,32].These geographic distinctions of coyote-like sequencesin eastern and red wolves combined with evidence ofcoyote-like sequences in eastern wolves prior toEuropean settlement in North America [25] provideevidence for incomplete lineage sorting within the NWlineages, although ancient (~11,000 years ago) hybridiza-tion during the Wisconsin glaciation is difficult to ruleout. This, combined with extensive hybridization in east-ern Canis populations [23,24,26,27,33,34], makes speciesdesignations of wild Canis difficult when based onphylogenetic inference from mtDNA alone. For example,a conspecific nature of eastern wolves and red wolves is
Table 1 Polymorphism within the mtDNA control region (CR) and ATPase regions
Clade Number ofsites analyzed
Samplesize (n)
Number ofhaplotypes (h)
Number of variablesites (%)
Nucleotide diversity(Pi) per site
Pi SD
CR
AllCR 335 83 29 49 (14.6) 0.04257 0.00214
NWCRall 337 56 20 30 (8.9) 0.01718 0.00223
NWCR1ew 341 9 2 4 (1.2) 0.01173 0.00587
NWCR2coyI+CR3coyII 337 47 18 25 (7.4) 0.01424 0.00161
NWCR2coyI 338 16 7 15 (4.4) 0.0155 0.00259
NWCR3coyII 339 31 11 14 (4.1) 0.01019 0.0016
OWCRall 345 24 7 11 (3.2) 0.01408 0.00176
OWCR4gwNA 345 20 3 2 (0.6) 0.00386 0.00129
OWCR5gwEU 345 4 4 7 (2.0) 0.01208 0.00227
ATPase
AllATP 1067 89 26 104 (9.7) 0.02596 0.00177
NWATPall 1067 61 18 42 (3.9) 0.00543 0.00076
NWATP1ew 1067 12 2 5 (0.5) 0.00469 0.00234
NWATP2coyI+ATP3coyII 1067 49 16 33 (3.1) 0.00441 0.00056
NWATP2coyI 1067 37 10 16 (1.5) 0.003 0.00059
NWATP3coyII 1067 12 6 17 (1.6) 0.00594 0.00073
OWATPall 1067 27 7 19 (1.8) 0.00643 0.00157
OWATP4gwNA 1067 22 2 1 (0.09) 0.00094 0.00047
OWATP4gwEU 1067 5 5 17 (1.6) 0.00731 0.00164
ATPase6
AllATP 681 89 23 65 (9.5) 0.02513 0.00016
NWATPall 681 61 16 28 (4.1) 0.00592 0.00079
NWATP1ew 681 12 2 5 (0.7) 0.00734 0.00367
NWATP2coyI+ATP3coyII 681 49 14 22 (3.2) 0.00495 0.00064
OWATPall 681 27 7 16 (2.3) 0.00839 0.00133
OWATP4gwNA 681 22 2 1 (0.1) 0.00147 0.00073
OWATP4gwEU 681 5 5 14 (2.1) 0.00881 0.00142
ATPase8
AllATP 204 89 14 23 (11.3) 0.03507 0.00629
NWATPall 204 61 10 10 (4.9) 0.0111 0.00143
OWATPall 204 27 4 4 (2.0) 0.01062 0.00311
Analysis was conducted in DnaSP v. 5.10 with nucleotide diversity calculated according to [60]. Gaps were excluded in the analysis. The full 1067 bp of theATPase region is section 7729 - 8795 in the Canis complete mtDNA genome (Genbank Accession DQ480510) and includes gene regions ATPase8 (204 bp),ATPase6 (681 bp), plus flanking regions that overlap with COX2 and COX3 genes. Subscripts refer to clade designations in Figures 2a and 2b. CR = controlregion; SD=standard deviation.
Rutledge et al. BMC Evolutionary Biology 2010, 10:215http://www.biomedcentral.com/1471-2148/10/215
Page 3 of 12

Figure 2 Cladograms of Canis mtDNA CR and ATPase sequences. Cladograms of Canis sequences from Bayesian analysis in BEAST of a) 347bp of the mitochondrial DNA (mtDNA) control region and b) 1067 bp from the mtDNA ATPase region. fam is a Husky dog sample from Sweden;* is a wolf from Saudi Arabia; ruf is the red wolf sequence, NW represents New World evolved clades, OW represents Old World evolved clades,NA in b) identifies North American grey wolf samples. Node labels show posterior probabilities rounded to the nearest hundredth. For eachgenetic region the eastern wolf clade is shown in red (NWCR1ew & NWATP1ew), coyote clades I and II are shown in yellow (NWCR2coyI, NWATP2coyI)and orange (NWCR3coyII and NWATP3coyII), and Old World (OW) clades from North America (OWCR4gwNA) and Eurasia (OWCR5gwEU, OWATP4gwNAEU)are shown in blue. Insets show radial view of tree.
Figure 1 Map of ATPase haplotype distribution. Map of sample locations (circles) showing ATPase haplotype distribution. Colours representdifferent major clades indicated in Figures 2a and 2b. Specific locations for Genbank samples from Eurasia, Colorado, and the solitary sampleshown in the Northwest Territories were unavailable so a random location within the country or state of origin was chosen.
Rutledge et al. BMC Evolutionary Biology 2010, 10:215http://www.biomedcentral.com/1471-2148/10/215
Page 4 of 12

suggested by nuclear data [19], but is not demonstratedby analysis of mtDNA. These differences are not unex-pected and do not undermine the conspecific nature ofeastern wolves and red wolves because gene trees basedon mtDNA are not necessarily indicative of specific spe-cies relationships, and discordance is often found whencomparing mtDNA and nuclear genetic signatures [35].Given the recent divergence of NW lineages (see below)these issues are not unexpected [35]. New approaches tophylogenetic analysis that utilize multiple loci, includingnuclear genes, may help reconcile inferred Canis speciesrelationships [35,36], although extensive hybridizationwill likely continue to plague contemporary species des-ignations based on nuclear markers. Regardless, the dis-tinction of the two eastern wolf haplotypes shown inboth the control region and ATPase region is indisputa-ble, providing clear evidence for the presence of a NorthAmerican evolved wolf lineage, distinct from coyotesand grey wolves.
Divergence and TMRCAFixed differences occurred in all but one comparisonbetween groups (NWATP2coyI vs. NWATP3coyII) (Table 2).Whereas comparisons of the percentage of nucleotidedifferences were similar at both mtDNA regions whencomparing deep divergences (ie. NW vs. OW), differ-ences were substantially lower for more recent diver-gence comparisons within NW or OW evolvedsequences (Table 2), indicative of possible homoplasy inthe hypervariable sections of the control region [4,5].Overall patterns of divergence (DxyJC) were similar forthe control and ATPase regions, but estimates were
consistently lower for ATPase compared to the controlregion (Figure 3), reflecting the lower observed mutationrate in ATPase.Based on the control region, divergence of eastern
wolves from coyotes was approximately 3.0%, that of thered wolf sequence from coyotes was 2.0%, and easternwolves compared to red wolves was 2.7% (Figure 3).These values are consistent with those reported for a238 bp control region fragment (3.2%, 2.3%, 2.1%,respectively) [19]. As expected, divergence estimatesfrom the ATPase region were lower (0.9%, 0.3%, and0.8%, respectively) but were proportionally consistentwith that from the control region. These results comple-ment the phylogenetic analysis and show further confir-mation for the eastern wolf lineage. Differences betweenOW evolved North American and Eurasian wolves were1.8% for the control region and 0.6% at the ATPaseregion, suggesting a closer relationship between theselineages than between NW lineages.TMRCA estimates from both genetic regions were
similar and suggest divergence of eastern wolf sequencesfrom other North American evolved sequences atapproximately 486,300 - 548,400 years ago (ya), andNorth American grey wolves from Eurasian wolves at465,600 - 518,100 ya, although the 95% highest posteriordensities (HPD) had wide intervals (Table 3). Thesevalues for NW divergence are higher than previousTMRCA estimates of 150,000 - 300,000 ya [19] butresults are not entirely inconsistent when HPD is con-sidered. Our estimate of NW coalescence is closer tothat proposed for coyotes of 420,000 ya in [18], althoughthat study did not identify distinct eastern wolf
Table 2 Nucleotide differences between clades and putative species
Comparison (Number of haplotypes) Number of sitescompared
Number of fixeddifferences
Average number of nucleotidedifferences between groups (%)
CR
NWCRall (h = 20) vs OWCRall (h = 9) 335 14 26.6 (7.9)
NWCR1(ew) (h = 2) vs NWCR2coyI+CR3coyII (h = 18) 337 3 10.1 (3.0)
NWCR1ew (h = 2) vs RW (h = 1) 341 7 9 (2.6)
RW (h = 1) vs NWCR2coyI+CR3coyII (h = 17) 337 2 6.6 (2.0)
NWCR2coyI (h = 11) vs NWCR3coyII (h = 7) 337 1 5.6 (1.7)
OWCR4gwNA (h = 3) vs OWCR5gwEU (h = 4) 345 3 6.1 (1.8)
ATPase
NWATPall (h = 18) vs OWATPall (h = 7) 1067 42 56.8 (5.3)
NWATP1ew (h = 2) vs NWCR2coyI+CR3coyII (h = 16) 1067 5 9.9 (0.09)
NWATPew (h = 2) vs RW (h = 1) 1067 6 8.5 (0.08)
RW (h = 1) vs NWCR2coyI+CR3coyII (h = 15) 1067 1 3.5 (0.03)
NWATP2coyI (h = 10) vs NWATP3coyII (h = 6) 1067 0 5.4 (0.05)
OWATP4gwNA (h = 3) vs OWATP4gwEU (h = 5) 1067 1 6.5 (0.06)
Calculations were done in DnaSP v. 5.10. Gaps were excluded from the analysis. Comparative groups are identified in Figures 2a and 2b, and RW is the red wolfsequence identified with superscript “ruf” in Figures 2a and 2b. The dog sequence was excluded from analyses and Ccr19 was excluded from the OWCR5gwEU
grouping because it clustered independently from North American and Eurasian lineages (see Figure 2a). NW = New World; OW = Old World; CR = controlregion.
Rutledge et al. BMC Evolutionary Biology 2010, 10:215http://www.biomedcentral.com/1471-2148/10/215
Page 5 of 12

haplotypes because it occurred prior to identification ofeastern wolf sequences [19].
SelectionTests of neutrality showed significance in NW lineages,particularly in the ATPase6 region; for ATPase8, onlyFu’s Fs identified departure from neutrality (Table 4).Over the past 100 years, grey wolves have experienced agenetic bottleneck [37], whereas coyote populationshave expanded across North America [23,27], presentingthe two extremes of demographic history. Significantlynegative values of neutrality statistics can be indicative
of selection but are also consistent with eitherpopulation subdivision or expansion [38], and Fu’s Fs isa particularly powerful test of population growth[39,40]. Therefore, it is difficult to disentangle selectionfrom demographic history when interpreting neutralitytests [1,41] and care should be taken not to over inter-pret results from a rejection of the neutrality hypothesis.The known demographic history, however, suggests thatresults from neutrality tests presented here are indica-tive of the population expansion of coyotes.The high rate of synonomous substitutions (SS) in the
ATPase genes, particularly in the ATPase6 region where
Figure 3 Divergence between populations. Divergence estimates between phylogenetic clades and putative species sequences at the mtDNAcontrol region (347 bp) and ATPase region (1067 bp). Dxy (JC) = average number of nucleotide substitutions per site between populations (withJukes and Cantor correction). Error bars are the standard deviation. NW = New World evolved sequences; OW = Old World evolved sequences,EW = eastern wolf sequences; RW = red wolf sequence; NWcoy = NWcoyI + NWcoyII; NWcoyI and NWcoyII represent the two coyote cladesshown in Figures 2a and 2b; OWNA = Old World sequences from North America; OWEU = Old World sequences from Eurasia. Gaps wereexcluded in the analysis.
Table 3 TMRCA estimates
Diverged Lineages Clades Mean TMRCA (mya) SEM Geometric mean 95% HPD
CR
Eastern wolf-Coyote NWCR1ew-NWCR2coyI+CR3coyII 0.4863 0.0054051 0.3302 0.00091379 - 1.224
NA grey wolf-EU wolf OWCR4gwNA-OWCR5gwEU 0.5181 0.0035853 0.3624 0.0042139 - 1.2689
OW-NW OWCRall-NWCRall 1.3961 0.0018707 1.3704 0.8906 - 1.9061
ATPase
Eastern wolf-Coyote NWATP1ew-NWATP2coyI+ATP3coyII 0.5484 0.0016439 0.4889 0.139 - 1.0834
NA grey wolf-EU wolf OWATP4gwNA-OWATP4gwEU 0.4656 0.0014502 0.4124 0.1153 - 0.9494
OW-NW OWATPall-NWATPall 1.8343 0.0012901 1.8224 1.4352 - 2.2465
Estimates based on Bayesian analysis of mtDNA control region (CR) and ATPase region in BEAST. Eastern wolf is represented by sample CAN004377 fromAlgonquin Provincial Park in Ontario, Canada; Coyote is represented by sample CAN000142 from Texas, United States; North American grey wolf is representedby CAN001806 from the Northwest Territories, Canada, Eurasian wolf is represented by a grey wolf from Russia (Genbank Accession DQ480503). Clades areidentified in Figures 2a and 2b. OW = Old World; NW = New World.
Rutledge et al. BMC Evolutionary Biology 2010, 10:215http://www.biomedcentral.com/1471-2148/10/215
Page 6 of 12

dN/dS ratios were all < 0.3, indicate that purifyingselection has been influential in Canis mtDNA evolu-tion, particularly in NW lineages (Table 5). This excessof synonomous substitutions in mtDNA coding regionsis consistent with that previously found in wolves, coy-otes and dogs [42] and in other mammals includinghumans [17,43] and mice [11]. This pattern is thoughtto mainly affect terminal branches of phylogenetic treessuggesting recently diverged groups show a strongersynonomous substitution signal [16], which is consistentwith the pattern observed in our dataset.The ratio of nonsynonomous to synonomous substitu-
tions (dN/dS ) was highest for OW lineages from north-ern climates in the ATPase6 region, but the samepattern was not observed for ATPase8 (Table 5). Thedifference in dN/dS ratios between OW and NWlineages is not unusual given that mutations can be neu-tral in some lineages but non-neutral in others [44]. Ithas been proposed that amino acid variation in theATPase genes may reduce the efficiency of oxidativephosphorylation, thereby decreasing ATP productionwhile increasing heat production thus conferring a selec-tive advantage for certain haplotypes in colder climates[13-15], although this hypothesis is not without contro-versy [8,16,17]. The higher dN/dS ratios for ATPase6 inOW evolved lineages in northern climates compared toNW lineages from more temperate and subtropical cli-mates (Table 5) hints at a possible role for adaptiveselection in response to climate for Canis mtDNA
Table 4 Tests of neutrality within clades and regions
Clade or Region Sample size Tajima’s D Fu & Li D* Fu & Li F* Fu’s Fs
ATPase6
All 25 -0.20630 (P > 0.10) -1.05880 (P > 0.10) -0.92649 (P > 0.10) -6.0687 (P < 0.05)**
NWATPall 18 -2.23648 (P < 0.01)** -2.90725 (P < 0.02)** -3.14575 (P < 0.02)** -13.0395 (P < 0.001)**
NWATP2coyI+ATP3coyII 16 -2.24950 (P < 0.01)** -3.10889 (P < 0.02)** -3.30776 (P < 0.02)** -11.6113 (P < 0.001)**
NWATP2coyI 10 -1.94429 (P < 0.05)** -2.27595 (P < 0.02)** -2.46830 (P < 0.02)** -4.6976 (P < 0.01)**
NWATP3coyII 6 -1.11000 P > 0.10) -1.19719 (P > 0.10) -1.27471 (P > 0.10) -2.6587 (P < 0.05)**
OWATPall 7 -0.65997 (P > 0.10) -0.71815 (P > 0.10) -0.77484 (P > 0.10) -1.2687 (P > 0.10)
OWATP4north 4 -0.388921 (P > 0.10) -0.38921 (P > 0.10) -0.37908 (P > 0.10) -0.9463 (P > 0.10)
OWATP4gwEU 5 -0.38168 (P > 0.10) -0.38168 (P > 0.10) -0.40360 (P > 0.10) 0.4897 (P > 0.50)
ATPase8
All 25 0.06944 (P > 0.10) -0.42777 (P > 0.10) -0.32087 (P > 0.10) -1.5442 (P > 0.20)
NWATPall 18 -1.66626 (0.10 > P > 0.05) -1.79890 (P > 0.10) -2.03413 (P > 0.10) -6.4462 (P < 0.001)**
NWATP2coyI+ATP3coyII 16 -1.63027 (0.10 > P > 0.05) -1.97065 (0.10 > P > 0.05) -2.15788 (0.10 > P > 0.05) -5.5160 (P < 0.01)**
NWATP2coyI 10 -1.74110 (P < 0.05)** -2.01007 (0.10 > P > 0.05) -2.17902 (0.10 > P > 0.05) -2.2598 (P < 0.02)**
NWATP3coyII 6 -0.05722 (P > 0.10) 0.07132 (P > 0.10) 0.04654 (P > 0.10) -2.4288 (P < 0.02)**
OWATP4all 7 -0.65405 (P > 0.10) -0.51900(P > 0.10) -0.59207 (P > 0.10) 0.1098 (P > 0.40)
OWATP4gwNorth 4 n/a n/a n/a n/a
OWATP4gwEU 5 -0.17474 (P > 0.10) -0.17474 (P > 0.10) -0.17531 (P > 0.10) 0.0607 (P > 0.30)
Sample size is the number of sequences analyzed based on haplotypes determined from the complete ATPase sequence (1067 bp). Dog sequence Catp04 wasexcluded from analysis because it clustered independently and may have been influenced by breeding selection. OWATP4North includes haplotypes Catp03 andCatp18 from the NWT, Canada, Catp08 from Sweden, and Catp09 from Russia; n/a indicates test not applicable because there were no polymorphic sites.Significantly negative values are indicative of selection, population subdivision or expansion. ** indicates statistical significance.
Table 5 Comparison of nonsynonomous (NSS) andsynonomous (SS) substitutions in ATPase6 and ATPAse8genes among clades
Clade Sample Size NSS SS dN/dS
ATPase6
All 25 11 52 0.045
NWATPall 18 5 23 0.073
NWATP1ew 2 1 4 0.082
NWATP2coyI+ATP3coyII 16 5 17 0.088
NWATP2coyI 10 2 9 0.073
NWATP3coyII 6 3 8 0.112
OWATP4all 7 4 9 0.163
OWATP4North 4 3 4 0.282
ATPase8
All 25 10 13 0.171
NWATPall 18 4 6 0.295
NWATP1ew 2 0 0 0.000
NWATP2coyI+ATP3coyII 16 3 6 0.214
NWATP2coyI 10 1 4 0.070
NWATP3coyII 6 2 2 0.285
OWATP4all 7 3 0 n/a
OWATP4North 4 0 0 0.000
Sample size is the number of sequences analyzed based on haplotypesdetermined from the complete ATPase sequence (1067 bp). Dog sequenceCatp04 was excluded from the analysis because it clustered independently fromother Old World (OW) sequences. OWNorth includes haplotypes Catp03 andCatp18 from the NWT, Canada, Catp08 from Sweden, and Catp09 from Russia.The ratio of nonsynonomous to synonomous substitutions is calculated as dN/dS,where dN is the number of nonsynonomous substitutions per nonsynonomoussite, and dS is the number of synonomous substitutions per synonomous site. Allcalculations were done in DNAsp v. 5.10. Clades are those identified in Figure 2b.
Rutledge et al. BMC Evolutionary Biology 2010, 10:215http://www.biomedcentral.com/1471-2148/10/215
Page 7 of 12
evolution [13], but statistical tests of nonsynonomousand synonomous substitutions did not support adaptiveselection in northern regions (Table 6). Although a wolfpoisoning campaign in the NWT during the 1950s [45]may have decreased genetic diversity of NWT greywolves somewhat, it is unlikely to have impacted haplo-type diversity to the extent that targeted exterminationefforts did in the US [37]. Further complicating interpre-tation is the recent suggestion that analysis of dN/dSratios and the McDonald-Kreitman test are ineffective atdetecting positive selection [46,47].The discrepancies in our analysis and in the human
literature does not necessarily mean that climatic adap-tation has not influenced the evolution of mtDNAlineages, but suggests rather that mtDNA evolution ismore complex than climatic variation alone can explain[8]. Although further investigation on a larger datasetwith an alternative approach [15] may help clarify therole of climate in shaping the distribution of CanismtDNA, and could provide valuable insight into theobserved patterns of mtDNA introgression in easternNorth American populations, it will remain difficult toseparate a signal for adaptive selection from the dra-matic and contrasting demographic histories of Canispopulations. The development of novel analytical toolswill be required to adequately disentangle natural selec-tion from demographic processes.
ConclusionsHere, we provide important new data for phylogeneticinference of wolves and coyotes in North America. Weknow of no other study that reports as extensively onthe ATPase region in wild Canis species. Similar
patterns of diversity and divergence between the controlregion and ATPase regions suggest that evolutionarypatterns can be inferred from non-coding regions ofmtDNA. Overall phylogenetic concordance between thecontrol and ATPase regions suggests that the controlregion can be an informative marker for inferring genetrees when dealing with recent divergence. Of particularimportance is the monophyletic clustering of easternwolf sequences under a new Bayesian analyticalapproach, thereby providing further evidence for a dis-tinct North American evolved wolf, independent of coy-otes and grey wolves, that inhabited the temperateforests of eastern North America prior to colonizationby European settlers. In addition, eastern wolf sequencesare further diverged from coyotes than the red wolfsequence. This does not necessarily imply that the redwolf is not a distinct species but rather supports theassignment of coyote-like sequences as eastern wolfspecific.Understanding the role that selection has had on
mtDNA evolution and distribution is a more difficulttask. Although the high rate of synonomous substitu-tions provides evidence that purifying selection mayhave influenced the evolution of Canis mtDNA, espe-cially in NW lineages, the role of adaptive selection inresponse to climate is more ambiguous. Adaptive selec-tion may play a role in the geographic distribution ofOW mtDNA sequences in North America, but alterna-tive analytical approaches will no doubt be required toadequately test this hypothesis.Based on the human literature, however, it seems
probable that climate is influential in adaptive selectionof mtDNA. Further research on adaptive selection ofCanis mtDNA is particularly important because it pro-vides a mechanism by which eastern wolf and coyotelike mtDNA have introgressed extensively into grey-eastern wolf hybrids in northern Ontario and the GreatLakes region [24,26,27,32,48] and why eastern wolfmtDNA is prevalent in eastern coyote populations[23,27,33,34]. It is important to note that mtDNA intro-gression can occur with little or no obvious nuclearintrogression [49-51], and in some cases completelyreplace mtDNA in the absence of apparent nuclearintrogression [50,52]. It is possible, therefore, that intro-gression of NW mtDNA lineages into grey-eastern wolfhybrids in eastern North America, and introgression ofeastern wolf mtDNA into eastern coyotes, reflect chanceor rare events on which selection then acted creatingspecies discordance between mtDNA and the nucleargenome [1]. Overall, this research provides a new andimportant framework with which to study patterns ofmtDNA introgression and geographic distribution inspecies where taxonomy has been blurred by incompletelineage sorting and/or hybridization.
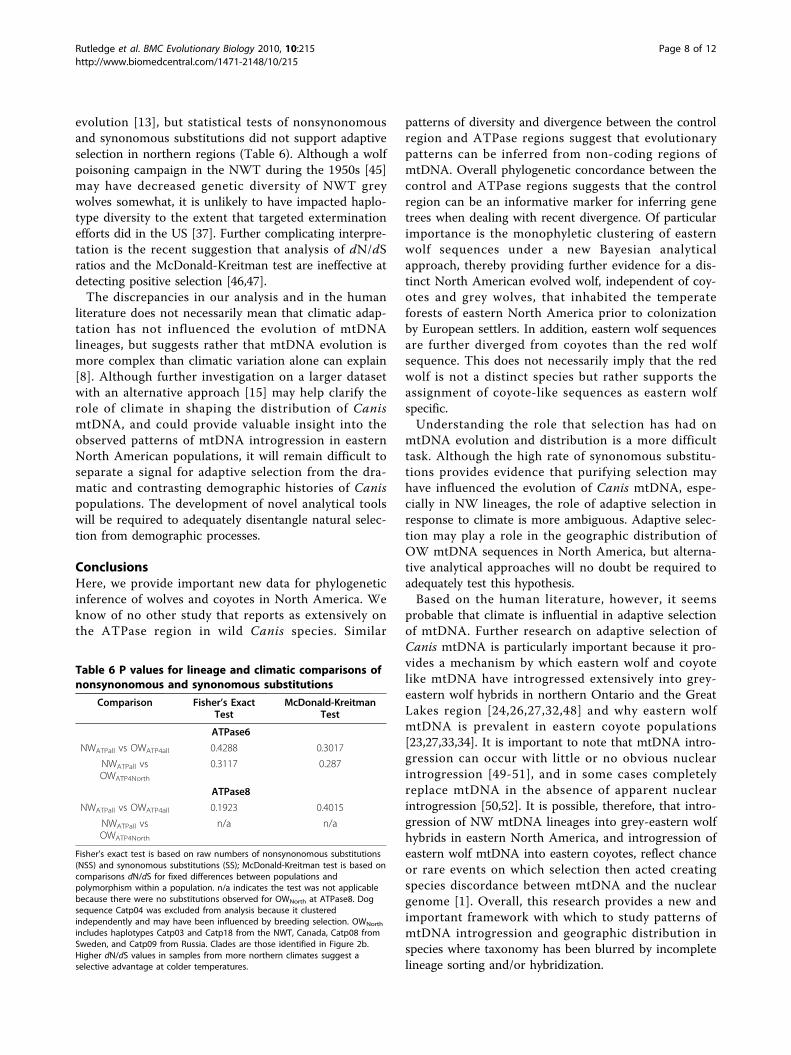
Table 6 P values for lineage and climatic comparisons ofnonsynonomous and synonomous substitutions
Comparison Fisher’s ExactTest
McDonald-KreitmanTest
ATPase6
NWATPall vs OWATP4all 0.4288 0.3017
NWATPall vsOWATP4North
0.3117 0.287
ATPase8
NWATPall vs OWATP4all 0.1923 0.4015
NWATPall vsOWATP4North
n/a n/a
Fisher’s exact test is based on raw numbers of nonsynonomous substitutions(NSS) and synonomous substitutions (SS); McDonald-Kreitman test is based oncomparisons dN/dS for fixed differences between populations andpolymorphism within a population. n/a indicates the test was not applicablebecause there were no substitutions observed for OWNorth at ATPase8. Dogsequence Catp04 was excluded from analysis because it clusteredindependently and may have been influenced by breeding selection. OWNorth
includes haplotypes Catp03 and Catp18 from the NWT, Canada, Catp08 fromSweden, and Catp09 from Russia. Clades are those identified in Figure 2b.Higher dN/dS values in samples from more northern climates suggest aselective advantage at colder temperatures.
Rutledge et al. BMC Evolutionary Biology 2010, 10:215http://www.biomedcentral.com/1471-2148/10/215
Page 8 of 12
MethodsSequencingPreviously extracted DNA from 83 individuals from var-ious North American Canis species (eastern wolves,grey wolves, red wolves, and coyotes) were selected torepresent a broad spectrum of geographic regions andmtDNA haplotypes. Extraction methods are providedelsewhere [19,53]. Nine additional sequences analyzed in[42] were obtained from GenBank (Accession Numbers:DQ480499, DQ480503 - DQ480508, DQ480510, andDQ480511). Locations for samples used in the presentanalysis are listed in Additional File 1. All polymerasechain reaction (PCR) amplifications were conducted in a20 μL reaction under the following conditions: approxi-mately 1ng DNA, 1.5 mM MgCl2, 0.2 mM dNTPs,0.2 μM forward primer, 0.2 μM reverse primer, 0.1 μgbovine serum albumin (BSA), 1 × PCR buffer, and1 Unit of Taq DNA polymerase (Invitrogen, Burlington,Ontario). PCR cycles were run with an initial denatura-tion at 94°C for 5 minutes, followed by 30 cycles of94°C for 30 seconds, 56°C, 58°C or 60°C (depending onthe region being amplified) annealing for 30 seconds,and 72°C extension for 30 seconds with a final extensionat 72°C for 4 minutes. A ~425 bp fragment of themtDNA control region was amplified with primersThrL: 5′-GAA TTC CCC GGT CTT GTA AAC C-3′and DLH-can: 5′-CCT GAG GTA AGA ACC AGA TG-3′ [22] under a 60°C annealing temperature. Three pri-mer pairs described in [42] were used to amplify aregion that contained the ATPase6 and ATPase8 regionof the mtDNA (For7651: 5′-CTT TAT ACC CAT TGTTCT TG-3′ and Rev8248: 5′-GGC GTA AAT GAGTGA GGT AAT-3′ (597 bp; 56°C annealing); For8049:5′-CCA TTT TAT TCC CAA CAC CC-3′ and Rev8501:5′-GGT AGC CCC TCC ATT CAA A-3′ (452 bp; 58°Cannealing); For8255: 5′-CAA CTC TCT ATA AAC CTCGG-3′ and Rev8891: 5′-CGT ATC GTA GTC CTT TTTGTA-3′ (636 bp; 58°C annealing). We designed addi-tional primer pairs for two of the regions because varia-tion in the primer sites in coyotes led to inefficientamplification. For7651B: 5′-CTT TAT GCC CAT TGTTCT TG-3′ and Rev8248B: 5′-GGT GTA AAT GAGTGG GGT AAT-3′; For8049B: 5′-CCA TTT TAT TCCCAG CAC CC-3′ and Rev8501B: 5′-GGT AGC CCCTCC AAT CAA G-3′. PCR products were cleaned withExoSAP-IT (USB Corporation, Ohio) and analyzed oneither a MegaBace 1000 (GE Healthcare Bio-Sciences,Baie d’Urfé, Quebec) or an AB 3730 (Applied Biosys-tems Canada, Streetsville, ON). Contigs from forwardand reverse sequences were assembled in Sequencher4.9 (GeneCodes Corporation, Michigan) and edits weremade based on visual inspection of electropherograms.Of the 83 samples, 74 full control region sequences of
347 bp (72 had both forward and reverse, 2 from onedirection only) and 80 ATPase region sequences of 1067bp were generated (base pairs 7729 - 8795 in the CanismtDNA complete genome sequence DQ480510; Region1: 70 samples in both forward and reverse directions, 10in one direction only; Region 2: 77 in both forward andreverse directions, 3 in one direction only; Region 3: 79in both forward and reverse directions, 1 in one direc-tion only). These, plus the 9 sequences from GEN-BANK, were used in subsequent analyses. Sequencealignment was done with ClustalW implemented inGeneious 4.5 for Mac OSX (Biomatters Ltd., NZ, http://www.geneious.com) followed by visual inspection.
Diversity and phylogenetic analysisMeasures of DNA sequence variation within and amonggroups, including number of haplotypes (h), variablesites, nucleotide diversity per site (Pi), and average num-ber of nucleotide differences between groups were cal-culated for the control region, the full ATPase sequence,ATPase6, and ATPase8 in the software program DnaSPv5.10 [54]. Calculations for ATPase6 and ATPase8 werelimited to a subset of groups analyzed with the full 1067bp sequence because the number of variable sites waslower in the specific gene regions, especially in ATPase8,due to the shorter fragment size. Phylogenetic analysiswas conducted under a Bayesian framework implemen-ted in the program BEAST v. 1.4.8 [55]. We combined3 independent runs, each with 10,000,000 MCMC itera-tions while sampling from the chain every 1000 steps.We used a relaxed uncorrelated lognormal molecularclock [56] with a substitution rate of 3.8 × 10⁻⁸/year forthe control region [37,48] and 1.5 × 10⁻⁹ for the ATPaseregion based on the median rate for substitution at thecytochrome b region in carnivores [57]. Based on Baye-sian Information Criteria (BIC) generated in ModelGen-erator [58] we used an HKY [59] with invariant sitesmodel with a transition/transversion rate ratio kappa of45.04 and a 0.79 fraction of invariable sites. As we wereinterested in putative species phylogenies, we used aYule tree prior as recommended in the BEAST manual.For the ATPase region, we used an HKY model with agamma distribution and 4 rate categories, alpha of 0.21and a transition/transversion rate ratio kappa of 42.96.To ensure high performance and accuracy, the BEASToutput was scrutinized in the software TRACER v. 1.4.1[60]. Raw traces for all parameters suggested theMCMC had converged on a stationary distribution, andall effective sample size (ESS) values were over 300(most were over 1000). A burnin of 10% was used whenannotating output files. Maximum clade credibility treeswere visualized in FigTree v.1.2.3 http://tree.bio.ed.ac.uk/software/figtree/.
Rutledge et al. BMC Evolutionary Biology 2010, 10:215http://www.biomedcentral.com/1471-2148/10/215
Page 9 of 12

Divergence and TMRCADivergence between clades was estimated by comparingthe number of fixed differences, the average number ofnucleotide differences, and the average number ofnucleotide substitutions per site with a Jukes and Cantorcorrection (Dxy_JC) [61] calculated in DnaSP v5.10 [54].We also compared divergence of the putative red wolfsequence with the eastern wolf clade and othersequences in the broader coyote clade.Time to most recent common ancestor (TMRCA) was
estimated in BEAST software with parameters describedabove. Four sequences were selected at random torepresent the main clades: DQ480503 (Ccr15; Catp09)represented the OW Eurasian lineage, CAN001806(Ccr03; Catp03) represented the OW North Americanlineage, CAN004377 (Ccr12; Catp16) represented theeastern wolf lineage, and CAN000142 (Ccr26; Catp22)represented the coyote lineage. Tree calibration wasdone by setting the divergence distribution betweenOW and NW lineages based on fossil evidence at 1.5million years ago and a standard deviation of 0.5 millionyears such that the 95% range would be 1 - 2 mya[19,62].
SelectionFor all the haplotypes identified in the ATPase phyloge-netic tree (n = 25, dog excluded) we examined theATPase6 (681 bp) and ATPase8 (204 bp) regions to testfor selection. To test the hypothesis of neutral evolution,we used DnaSP v 5.10 [54] to calculate Tajima’s D [63],Fu and Li’s D*, Fu and Li’s F* [64], and Fu’s Fs [65]overall and within clades. Significance values for eachtest are based on the confidence limits of D, the criticalvalues of D* and F* [64], or with 1000 replicates in thecoalescent simulations approach of DnaSP v. 5.10 forFu’s Fs. We also tested for neutrality in a group of OWsequences from northern climates (Russia, Sweden, andNorthwest Territories, Canada).To determine whether purifying or adaptive selection
influenced the evolution of Canis mtDNA, we comparedthe number of nonsynonomous substitutions (NSS) tosynonomous substitutions (SS), and the ratio of nonsy-nonomous substitutions per nonsynonomous site tosynonomous substitutions per synonomous site (dN/dS)in ATPase6 and ATPase8 overall, within clades, and inthe group of OW sequences from northern climates. Totest whether climate may have influenced Canis mtDNAdistribution, we compared dN/dS at ATPase6 andATPase8 for all NW sequences compared to a) all OWsequences and b) compared to OW sequences fromnorthern climates. If climate were a factor in theadaptive selection of mtDNA, one would expect higherdN/dS ratios in northern climates compared to moretemperate regions [13]. Significance of differences was
determined with a two-tailed Fisher’s exact test on theraw data (NSS and SS) with the online calculator avail-able at http://faculty.vassar.edu/lowry/VassarStats.html(accessed October 22, 2009) and a McDonald-Kreitmantest [66] conducted in DnaSP v. 5.10.
Additional material
Additional file 1: Sample information and haplotype summary. CanismtDNA control region and ATPase haplotype summary with comparisonsof control region haplotypes found in this study to previously publishedliterature.
AbbreviationsATPase: adenosine triphosphatase; Catp: Canis adenosine triphosphatase; Ccr:Canis control region; COX: cytochrome oxidase; coy: coyote (Canis latrans);CR: control region; EU: Eurasia; EW: eastern wolf (Canis lycaon); fam: dog(Canis lupus familiaris); HPD: highest posterior density; mtDNA: mitochondrialDNA; mya: millions of years ago; NA: North America; NW: New World; NWT:Northwest Territories; OW: Old World; ruf: red wolf (Canis rufus); RW: red wolf(Canis rufus); SEM: standard error of the mean; TMRCA: time to most recentcommon ancestor.
AcknowledgementsThanks to Kevin Middel for creating the map figure and to Chris Wilson forproviding comments on the manuscript. Also thank you to all the laboratorytechnicians at the Natural Resources DNA Profiling and Forensic Centre andto previous graduate students who extracted DNA from various samples.Funding from the Ontario Ministry of Natural Resources (OMNR) (BRP) wasresponsible for sample collection and genetic analyses. A ResearchFellowship Award from the OMNR combined with a Natural Sciences andEngineering Research Council (NSERC) doctoral scholarship (LYR) providedfunding for genetic analyses and preparation of the manuscript.
Author details1Environmental and Life Sciences Graduate Program, DNA Building, TrentUniversity, 2140 East Bank Drive, Peterborough, ON, K9J 7B8, Canada.2Ontario Ministry of Natural Resources, Wildlife Research DevelopmentSection, Trent University, DNA Building, 2140 East Bank Drive, Peterborough,ON, K9J 7B8, Canada. 3Biology Department, Natural Resources DNA Profiling& Forensic Centre, DNA Building, Trent University, 2140 East Bank Drive,Peterborough, ON, K9J 7B8, Canada.
Authors’ contributionsLYR conducted all the laboratory work and molecular genetic analyses, anddrafted the manuscript. BRP provided samples, was involved in the researchstudy concept, and helped revise the manuscript. BNW guided thelaboratory work and molecular genetic analyses, was involved in theresearch study design, and revised the manuscript. All authors contributedintellectual input as well as read and approved the final manuscript.
Received: 24 February 2010 Accepted: 16 July 2010Published: 16 July 2010
References1. Ballard JWO, Whitlock MC: The incomplete natural history of
mitochondria. Mol Ecol 2004, 13:729-744.2. Stoneking M: Hypervariable sites in the mtDNA control region are
mutational hotspots. Am J Hum Genet 2000, 67:1029-1032.3. Malyarchuk BA, Rogozin IB, Berikov VB, Derenko MV: Analysis of
phylogenetically reconstructed mutational spectra in humanmitochondrial DNA control region. Hum Genet 2002, 111:46-53.
4. Ingman M, Kaessmann H, Pääbo S, Gyllensten U: Mitochondrial genomevariation and the origin of modern humans. Nature 2000, 408:708-713.
5. Avise JC: Molecular Markers, Natural History, and Evolution. Sunderland,Massachusetts, Sinauer Associates, Inc. Publishers 2004.
Rutledge et al. BMC Evolutionary Biology 2010, 10:215http://www.biomedcentral.com/1471-2148/10/215
Page 10 of 12
6. Torroni A, Achilli A, Macaulay V, Richards M, Bandelt H-J: Harvesting thefruit of the human mtDNA tree. Trends Genet 2006, 22:339-345.
7. Gerber AS, Loggins R, Kumar S, Dowling TE: Does nonneutral evolutionshape observed patterns of DNA variation in animal mitochondrialgenomes? Annu Rev Genet 2001, 35:539-566.
8. Elson JL, Turnbull DM, Howell N: Comparative genomics and theevolution of human mitochondrial DNA: assessing the effects ofselection. Am J Hum Genet 2004, 74:229-238.
9. Moilanen JS, Majamaa K: Phylogenetic network and physicochemicalproperties of nonsynonomous mutations in the protein-codinggenes of human mitochondrial DNA. Mol Biol Evol 2003,20:1195-1210.
10. Meiklejohn CD, Montooth KL, Rand DM: Positive and negative selectionon the mitochondrial genome. Trends Ecol Evol 2007, 23:259-263.
11. Stewart JB, Freyer C, Elson JL, Larsson N-G: Purifying selection of mtDNAand its implications for understanding evolution and mitochondrialdisease. Nature Rev Genet 2008, 9:657-662.
12. Doi A, Suzuki H, Matsuura ET: Genetic analysis of temperature-dependenttransmission of mitochondrial DNA in Drosophila. Heredity 1999,82:555-560.
13. Mishmar D, Ruiz-Pesini E, Golik P, Macaulay V, Clark AG, Hosseini S,Brandon M, Easley K, Chen E, Brown MD, Sukernik RI, Olckers A, Wallace DC:Natural selection shaped regional mtDNA variation in humans. Proc NatlAcad Sci USA 2003, 100:171-176.
14. Ruiz-Pesini E, Mishmar D, Brandon M, Procaccio V, Wallace DC: Effects ofpurifying and adaptive selection on regional variation in human mtDNA.Science 2004, 303:223-226.
15. Balloux F, Lawson Handley L-J, Jombart T, Liu H, Manica A: Climate shapedthe worldwide distribution of human mitochondrial DNA sequencevariation. Proc R Soc B 276:3447-3455.
16. Kivisild T, Shen P, Wall DP, Do B, Sung R, Davis K, Passarino G, Underhill PA,Scharfe C, Torroni A, Scozzari R, Modiano D, Coppa A, de Knijff P,Feldman M, Cavalli-Sforza LL, Oefner PJ: The role of selection in theevolution of human mitochondrial genomes. Genetics 2006, 172:373-387.
17. Sun C, Kong Q-P, Zhang Y-P: The role of climate in human mitochondrialDNA evolution: a reappraisal. Genomics 2006, 89:338-342.
18. Vilà C, Amorim IR, Leonard JA, Posada D, Castroviejo J, Petrucci-Fonseca F,Crandall KA, Ellegren H, Wayne RK: Mitochondrial DNA phylogeographyand population history of the gray wolf Canis lupus. Mol Ecol 1999,8:2089-2103.
19. Wilson PJ, Grewal S, Lawford ID, Heal JNM, Granacki AG, Pennock D,Theberge JB, Theberge MT, Voigt DR, Waddell W, Chambers RE, Paquet PC,Goulet G, Cluff D, White BN: DNA profiles of the eastern Canadian wolfand the red wolf provide evidence for a common evolutionary historyindependent of the gray wolf. Can J Zool 2000, 78:2156-2166.
20. Wilson PJ, Grewal S, McFadden T, Chambers RC, White BN: MitochondrialDNA extracted from eastern North American wolves killed in the 1800sis not of gray wolf origin. Can J Zool 2003, 81:936-940.
21. Adams JR, Kelly BT, Waits LP: Using faecal DNA sampling and GIS tomonitor hybridization between red wolves (Canis rufus) and coyotes(Canis latrans). Mol Ecol 2003, 12:2175-2186.
22. Hailer F, Leonard JA: Hybridization among three native North AmericanCanis species in a region of natural sympatry. PLoS ONE 2008, 3:e3333.
23. Kays R, Curtis A, Kirchman JJ: Rapid adaptive evolution of northeasterncoyotes via hybridization with wolves. Biol Lett 2009, 6:89-93, doi:10.1098/rsbl.2009.0575.
24. Koblmüller S, Nord M, Wayne RK, Leonard JA: Origin and status of theGreat Lakes wolf. Mol Ecol 2009, 11:2313-2326.
25. Rutledge LY, Bos KI, Pearce RJ, White BN: Genetic and morphometricanalysis of sixteenth century Canis skull fragments: implications forhistoric eastern and gray wolf distribution in North America. ConservGenet 2009, 11:1273-1281.
26. Wheeldon T, White BN: Genetic analysis of historic western Great Lakesregion wolf samples reveals early Canis lupus/lycaon hybridization. BiolLett 2009, 5:101-104.
27. Wilson PJ, Grewal SK, Mallory FF, White BN: Genetic characterization ofhybrid wolves across Ontario. J Hered 2009, 100(Supplement 1):S80-S89.
28. Kyle CJ, Johnson AR, Patterson BR, Wilson PJ, Shami K, Grewal SK, White BN:Genetic nature of eastern wolves: past, present and future. Conserv Genet2006, 7:273-287.
29. Murray DL, Waits LP: Taxonomic status and conservation strategy of theendangered red wolf: a response to Kyle et al. (2006). Conserv Genet2007, 8:1483-1485.
30. Pakendorf B, Stoneking M: Mitochondrial DNA and human evolution.Annu Rev Genomics Hum Genet 2005, 6:165-183.
31. Galtier N, Enard D, Radondy Y, Bazin E, Belkhir K: Mutation hot spots inmammalian mitochondrial DNA. Genome Res 2006, 16:215-222.
32. Rutledge LY, Garroway CJ, Loveless KM, Patterson BR: Geneticdifferentiation of eastern wolves in Algonquin Park despite bridginggene flow between coyotes and grey wolves. Heredity 2010.
33. Way J, Rutledge LY, Wheeldon T, White BN: Genetic characterization ofnortheastern coyotes in eastern Massachusetts. Northeast Nat 2010,17:189-204.
34. Wheeldon TJ, Patterson BR, White BN: Colonization history and ancestry ofnortheastern coyotes. Biol Lett 2010, 6:246-247.
35. Degnan JH, Rosenberg HA: Gene tree discordance, phylogeneticinference and the multispecies coalescent. Trends Ecol Evol 2009,24:332-340.
36. Springer MS, DeBry RW, Douady C, Amrine HM, Madsen O, de Jong WW,Stanhope MJ: Mitochondrial versus nuclear gene sequences in deep-level mammalian phylogeny reconstruction. Mol Biol Evol 2001,18:132-143.
37. Leonard JA, Vilà C, Wayne RK: Legacy lost: genetic variability andpopulation size of extirpated US gray wolves (Canis lupus). Mol Ecol 2005,14:9-17.
38. Ray N, Currat M, Excoffier L: Intra-deme molecular diversity in spatiallyexpanding populations. Mol Biol Evol 2003, 20:76-86.
39. Fu Y-X: Statistical tests of neutrality of mutations against populationgrowth, hitchhiking and background selection. Genetics 1997,147:915-925.
40. Ramos-Onsins SE, Rozas J: Statistical properties of new neutrality testsagainst population growth. Mol Biol Evol 2002, 19:2092-2100.
41. Hedrick PW: Genetics of Populations. Sudbury, Massachusetts, Jones andBartlett Publishers 2000.
42. Björnerfeldt S, Webster MT, Vilà C: Relaxation of selective constraint ondog mitochondrial DNA following domestication. Genome Res 2006,16:990-994.
43. Howell N, Elson JL, Howell C, Turnbull DM: Relative rates of evolution inthe coding and control regions of African mtDNAs. Mol Biol Evol 2007,24:2213-2221.
44. Moilanen JS, Finnilä S, Majamaa K: Lineage-specific selection in humanmtDNA: lack of polymorphisms in a segment of MTND5 gene inhaplogroup J. Mol Biol Evol 2003, 20:2132-2142.
45. Heard G, Angell J: Historical and present status of wolves in theNorthwest Territories. Wolves in Canada and Alaska Canadian WildlifeService Report Series, No. 45, Canadian Wildlife Service, Ottawa, Ontario,CanadaCarbyn LN 1983, 44-47.
46. Kryazhimskiy S, Plotkin JB: The population genetics of dN/dS. PLoS Genet2008, 4:e10000304, (doi: 10.1371/journal.pgen.10000304).
47. Zhai W, Nielsen R, Slatkin M: An investigation of the statistical power ofneutrality tests based on comparative and population genetic data. MolBiol Evol 2009, 26:273-283.
48. Leonard JA, Wayne RK: Native Great Lakes wolves were not restored. BiolLett 2008, 4:95-98.
49. Powell JR: Interspecific cytoplasmic gene flow in the absence of nucleargene flow: evidence from Drosophila. Proc Natl Acad Sci USA 1983,80:492-495.
50. Bernatchez L, Glemet H, Wilson CC, Danzmann RG: Introgression andfixation of Arctic char (Salvelinus alpinus) mitochondrial genome in anallopatric population of brook trout (Salvelinus fontinalis). Can J FishAquat Sci 1995, 52:179-185.
51. Sota T: Radiation and reticulation: extensive introgressive hybridizationin the carabid beetles Ohomopterus inferred from mitochondrial genegenealogy. Popul Ecol 2002, 44:145-156.
52. Nevado B, Koblmüller S, Sturmbauer C, Snoeks J, Usano-Alemany J,Verheyen E: Complete mitochondrial DNA replacement in a LakeTanganyika cichlid fish. Mol Ecol 2009, 18:4240-4255.
53. Rutledge LY, Patterson BR, Mills KJ, Loveless KM, Murray DL, White BN:Protection from harvesting restores the natural social structure ofeastern wolf packs. Biol Conserv 2010, 143:332-339.
Rutledge et al. BMC Evolutionary Biology 2010, 10:215http://www.biomedcentral.com/1471-2148/10/215
Page 11 of 12
54. Librado P, Rozas J: DnaSP v5: a software for comprehensive analysis ofDNA polymorphism data. Bioinformatics 2009, 25:1451-1452.
55. Drummond AJ, Rambaut A: BEAST: Bayesian evolutionary analysis bysampling trees. BMC Evol Biol 2007, 7:214.
56. Drummond AJ, Ho SYW, Phillips MJ, Rambaut A: Relaxed phylogeneticsand dating with confidence. PLoS Biol 4:e88.
57. Nabholz B, Glémin S, Galtier N: Strong variations of mitochondrialmutation rate across mammals - the longevity hypothesis. Mol Biol Evol2007, 25:120-130.
58. Keane TM, Creevey CJ, Pentony MM, Naughton TJ, McInerney JO:Assessment of methods for amino acid matrix selection and their useon empirical data shows that ad hoc assumptions for choice of matrixare not justified. BMC Evol Biol 2006, 6:29.
59. Hasegawa M, Kishino H, Yano TA: Dating of the human-ape splitting by amolecular clock of mitochondrial DNA. J Mol Evol 1985, 22:160-174.
60. Rambaut A, Drummond AJ: Tracer v1.4. 2007 [http://beast.bio.ed.ac.uk/Tracer].
61. Nei M: Molecular Evolutionary Genetics. New York, Columbia UniversityPress 1987.
62. Kurtén B, Anderson E: Pleistocene mammals of North America. New York,Columbia University Press 1980.
63. Tajima F: Statistical method for testing the neutral mutation hypothesisby DNA polymorphism. Genetics 1989, 123:585-595.
64. Fu YX, Li WH: Statistical tests of neutrality of mutations. Genetics 1993,133:693-709.
65. Fu YX: Statistical tests of neutrality of mutations against populationgrowth, hitchhiking and background selection. Genetics 147:915-925.
66. McDonald JH, Kreitman M: Adaptive protein evolution at the Adh locus inDrosophila. Nature 1991, 351:652-654.
doi:10.1186/1471-2148-10-215Cite this article as: Rutledge et al.: Analysis of Canis mitochondrial DNAdemonstrates high concordance between the control region andATPase genes. BMC Evolutionary Biology 2010 10:215.
Submit your next manuscript to BioMed Centraland take full advantage of:
• Convenient online submission
• Thorough peer review
• No space constraints or color figure charges
• Immediate publication on acceptance
• Inclusion in PubMed, CAS, Scopus and Google Scholar
• Research which is freely available for redistribution
Submit your manuscript at www.biomedcentral.com/submit
Rutledge et al. BMC Evolutionary Biology 2010, 10:215http://www.biomedcentral.com/1471-2148/10/215
Page 12 of 12