research article fuzzy diagnostic system for oleo...
TRANSCRIPT

Hindawi Publishing CorporationThe Scientific World JournalVolume 2013, Article ID 248487, 11 pageshttp://dx.doi.org/10.1155/2013/248487
Research ArticleFuzzy Diagnostic System for Oleo-Pneumatic Drive Mechanismof High-Voltage Circuit Breakers
Viorel Nicolau
“Dunarea de Jos” University of Galati, 47 Domneasca Street, 800008 Galati, Romania
Correspondence should be addressed to Viorel Nicolau; [email protected]
Received 10 August 2013; Accepted 12 September 2013
Academic Editors: H. Choi and M. Riera-Guasp
Copyright © 2013 Viorel Nicolau.This is an open access article distributed under theCreativeCommonsAttribution License, whichpermits unrestricted use, distribution, and reproduction in any medium, provided the original work is properly cited.
Many oil-based high-voltage circuit breakers are still in use in national power networks of developing countries, like those in EasternEurope. Changing these breakers with newmore reliable ones is not an easy task, due to their implementing costs.The acting device,called oleo-pneumatic mechanism (MOP), presents the highest fault rate from all components of circuit breaker. Therefore, onlinepredictive diagnosis and early detection of the MOP fault tendencies are very important for their good functioning state. In thispaper, fuzzy logic approach is used for the diagnosis of MOP-type drive mechanisms. Expert rules are generated to estimate theMOP functioning state, and a fuzzy system is proposed for predictive diagnosis.The fuzzy inputs give information about the numberof starts and time of functioning per hour, in terms of short-term components, and their mean values. Several fuzzy systems weregenerated, using different sets of membership functions and rule bases, and their output performances are studied. Simulationresults are presented based on an input data set, which contains hourly records of operating points for a time horizon of five years.The fuzzy systems work well, making an early detection of the MOP fault tendencies.
1. Introduction
In power networks, the quality and security problems arecorrelated with each other, being extensively debated inthe literature. The increased concern for power quality hasresulted in significant advances of monitoring and diagnostictechniques that can be used to characterize disturbances andpower quality variations [1]. Different analysis methods canpoint out individual events, statistical summaries, or trends.
The circuit breakers (CB) play an important role fornetwork stability and security, as for power quality. Knowingthe actual and future states of circuit breakers is one of theprimary requisites to achieve the goals of optimal planningand operation of the large-scale power networks. As mostcomponents of power networks, CB should be enabled todetect their potential failures and make life expectancyprediction without human interference [2]. Diagnostic andmonitoring techniques can be used to optimize maintenancepractices, replacement, and utilization of circuit breakers. Butthese procedures must be selected with realistic expectations,as discussed [3].
Changing the old circuit breakers with new ones is not aneasy task, even in developed countries.The cost of the breakerand station equipment becomes prohibitive at high voltages[4]. In addition, their huge number in the power networksmakes the renewing process impossible in a short period oftime.Hence, for aged circuit breakers, a solution could be newmonitoring and diagnostic intelligent systems.
Monitoring of the main functions of circuit breakersassures less expensive exploitation during its life by lessregular maintenance [5]. Also, it improves the overall per-formances, like reliability and availability of the large-scalepower networks [6]. At the same time, the monitoring anddiagnostic procedures represent main solutions to preventfailures, safely decrease the scheduledmaintenance costs, andminimize downtime [7]. A development of diagnostic andmonitoring system for circuit breakers is presented in [8].
The state estimation is a key function for building acircuit breaker real-timemodel. In [9], an overview of electricpower system state estimation is presented, starting fromconventional state estimation, where logical and analog data

2 The Scientific World Journal
are studied separately. Also, probabilistic assessmentmethodscan be used to express the reliability of power systems,and in particular of high-voltage circuit breakers. In [10],probabilistic criteria and indexes are presented and some newareas of development are pointed-out.
In national power networks of developing countries,there are still many IO-type oil-based high voltage circuitbreakers, which are operated by oleo-pneumatic mechanisms(MOP). The circuit breakers are aged, many of them havingoverpassed their life time, as discussed in [11]. Due totheir low reliability, it is important to implement new less-expensive monitoring and diagnostic equipments for themajor parts of IO-type circuit breakers. They should useadvanced prediction techniques to detect their failure trendsand make life-expectancy estimation.
The behavior analysis of IO-type circuit breakers pointedout that, from all breaker components, the oleo-pneumaticdrivemechanism presents the highest fault rate [11]. Its failuregoes to the impossibility of switching the CB, which mayaffect the power network stability and security, and alsothe power quality. Therefore, knowing the actual and futurestates of MOP-type mechanisms is important to achievethe goals of optimal planning and operation of the powernetworks. Modern methods for off-line diagnosis of MOP-type mechanisms are presented in [11].
There aremany papers in the literature, using the artificialintelligence methods to decrease the exploitation costs andto improve the overall performances of high voltage circuitbreakers from power networks. The basic principles forprediction and condition diagnosis from the field of artificialintelligence are stated in [12].
Fuzzy logic has proved its efficiency in monitoring anddiagnosis of different components of power networks.A fuzzydiagnostic system for estimating the fault section of powersystem is presented in [13], and an adaptive version usingmatrix representations with fuzzy relations is introducedin [14]. Online fault diagnosis system on a transmissionnetwork can be implemented based on fuzzy Petri nets [15]or with a fuzzy expert system, as shown in [16]. An adaptivefuzzy system was used in [17] for learning power-qualitysignature waveforms. Also, neurofuzzy techniques were usedtogether in different power system applications, such as in[18] for predictive maintenance with self-diagnosis capabilityat the substation equipment level. A neurofuzzy system forstate estimation and fault detection in power systems wasproposed in [19].
In this paper, fuzzy logic approach is used for earlydiagnosis of MOP-type drive mechanisms. A fuzzy system isproposed for online predictive diagnosis and early detectionof the fault tendencies of MOP mechanisms.
The paper is organized as follows. Section 2 presents diag-nostic aspects of MOP-type drive mechanisms. Expert rulesfor predictive diagnosis are generated in Section 3. Fuzzydiagnostic system is studied in Section 4 and simulationresults are presented in Section 5. Conclusions are pointedout in Section 6.
2. Diagnostic Aspects of MOP-TypeMechanism
The IO-type high-voltage circuit breakers are operated byoleo-pneumatic drive mechanisms. The acting energy isstored into an accumulator with nitrogen under pressure.From there, when needed, the energy is transmitted tomobilecontacts of circuit-breaker through a hydraulic system. Thenitrogen pressure must be high enough to trigger the switch-ing process.
The main drawback of this acting mechanism is theaccumulator, which loses in time the internal pressure,meaning that it loses the stored energy.When this is detected,a pump actuated by a motor restores the pressure. Thepressure variation is detected through a piston displacement,using two on-off microswitches. Their positions correspondto maximum and minimum acceptable values of internalnitrogen pressure. Within this range, the internal pressure isconsidered as normal.
Pressure loss is a natural process and it cannot beavoided. In normal operation, the motor starts several timesevery hour. The number of starts per hour (𝑁𝑆) can be amalfunction indicator of pressure recovery circuit. If thisnumber is too big, this means the accumulator loses theinternal pressure too quickly and the recovery circuit isworking too often.On the contrary, if themotor does not startduring one hour, this can indicate a malfunction of pressurevariation sensing.
In addition, the total functioning time per hour (𝑇𝐹) can
also indicate a malfunction. In normal operation, the motoris functioning for a few seconds for every start. If the motoris functioning for long time periods every hour, this meansthat the pressure is restored too slowly due to a failure in thepump-motor circuit.
The number of starts and total functioning time per hourof the pump-motor group differ from one mechanism toanother, depending on internal and external disturbances.The internal disturbances (𝑤
𝑖) refer to wear and tear of
various components, such as valves and electrovalves. Theexternal ones (𝑤
𝑒) refer to weather conditions, especially
temperature which affects the high-pressure oil circuits.As a result, different MOP mechanisms can have normalbehaviors, although their pump-motor groups have differentvalues for the number of starts and total functioning time perhour.
Regarding normal operation of pump-motor group, everyMOPmechanism must fulfill two performance conditions asfollows.
(i) The number of starts per hour (𝑁𝑆) changes in time,
depending on 𝑤𝑖and 𝑤
𝑒. It must be within a pre-
defined value range, specified in technical datasheet.This means that the motor must start at least 𝑁𝑆mintimes in an hour, but not too often, no more than𝑁𝑆max as follows:
𝑁𝑆 (𝑡, 𝑤𝑖, 𝑤𝑒) ∈ [𝑁𝑆min, 𝑁𝑆max] . (1)
(ii) The total functioning time of the motor into an hour(𝑇𝐹) must not exceed a maximum value, denoted

The Scientific World Journal 3
x1
x2
NSmin NSmax
TFmin
TFmax
M1
M3
M2
P1
P2
P3
MN2
MT2
ΔN2
ΔT2TF2
NS2
Figure 1: Variations of normal operating point 𝑃 in R2 within thepermitted area.
𝑇𝐹max, also found in technical specifications. The
minimum value, 𝑇𝐹min, is not specified, but it is
nonzero value, being correlatedwith𝑁𝑆min as follows:
𝑇𝐹(𝑡, 𝑤𝑖, 𝑤𝑒) ∈ [𝑇
𝐹min, 𝑇𝐹max] . (2)
The normal operation point of MOP-type drive mech-anism, denoted 𝑃, can be characterized in R2 by a pair ofcoordinates changing in time, (𝑥
1(𝑡), 𝑥2(𝑡)) ∈ R2 as follows:
𝑥1 (𝑡) = 𝑁𝑆 (𝑡, 𝑤𝑖, 𝑤𝑒) , 𝑥2 (𝑡) = 𝑇𝐹 (𝑡, 𝑤𝑖, 𝑤𝑒) , (3)
with restrictions defined by performance conditions in (1)and (2), respectively.
In normal operation, due to internal and external distur-bances, the point 𝑃 is shifting in R2 within the permittedarea, as shown in Figure 1. The restriction boundaries areillustrated with a shaded area.
Considering their frequency characteristics, perturba-tions can be divided into 3 categories: low-, medium-, orhigh-frequency, denoted 𝑤
𝑙, 𝑤𝑚, and 𝑤
ℎ, respectively. They
can be considered as additive perturbations for the modelof MOP-type mechanism. Accordingly, there are 3 differentinfluences on the MOP operating point, depending on thetime horizon which is considered long-, medium-, or short-term time period as follows:
𝑥1 (𝑡) = 𝑥1𝑆 (𝑡, 𝑤ℎ) + 𝑥1𝑀 (𝑡, 𝑤𝑚) + 𝑥1𝐿 (𝑡, 𝑤𝑙) ,
𝑥2 (𝑡) = 𝑥2𝑆 (𝑡, 𝑤ℎ) + 𝑥2𝑀 (𝑡, 𝑤𝑚) + 𝑥2𝐿 (𝑡, 𝑤𝑙) ,(4)
where 𝑥𝑖𝑆, 𝑥𝑖𝑀, or 𝑥𝑖𝐿 are the short-, medium-, or long-term
components of 𝑖 coordinate, 𝑖 = 1, 2.The time interval length depends on the process type. For
oleo-pneumatic drive mechanisms, short-term refers to daysand weeks, medium extends to months or one year, and long-term takes into account several years to the life cycle.
Short-term perturbations are of random nature andproduce variations of𝑃point around themean value, denoted𝑀, computed over a predefined time horizon.Themean valueincludes medium- and long-term components, and it is also
NSminNSmax
TFmin
TFmax
MC
PC
MW
PW
P
M
x2
x1
Figure 2: Cyclicmovement ofmean value of normal operation pointon medium-term.
varying in time. As the time horizon is higher, the variationsof mean value will be smaller.
In Figure 1, the boundaries of short-term random vari-ations are represented as circles with dashed lines aroundmean values. The point coordinates can be rewritten asfollows:
𝑥1 (𝑡) = 𝑀𝑁 (𝑡) + Δ𝑁 (𝑡) ,
𝑥2 (𝑡) = 𝑀𝑇 (𝑡) + Δ𝑇 (𝑡) ,
(5)
where Δ𝑁(𝑡) and Δ𝑇(𝑡) are the short-term components,considered as random variables with normal distribution andzeromean.Themean values,𝑀
𝑁(𝑡) and𝑀
𝑇(𝑡), are functions
of time 𝑡, including medium- and long-term componentsfrom (4), 𝑥
1𝑀, 𝑥2𝑀
, and 𝑥1𝐿, 𝑥2𝐿, respectively.
3. Expert Rules for Predictive Diagnosis ofMOP Functioning
In this section, expert rules are generated to characterizethe functioning state of MOP-type drive mechanism. TheMOP behavior analysis is based on variations in the time ofmedium- and long-term components of mean values from(5).
On medium-term, during one year period, the meanvalue of normal operating point has a cyclic movement, asthe temperature is changing from one season to another.
In cold periods, due to low temperatures, the oil hashigher viscosity and mechanical friction increases. Thepump-motor group must work for longer time periods torestore the pressure. As a result, the number of starts per hourdecreases and total functioning time per hour increases. Thenormal operating point and its mean value, denoted in thiscase 𝑃𝐶 and𝑀𝐶, are moving to the upper-left corner of thepermitted area, as shown in Figure 2.Theboundaries of short-term random variations aremarked as dashed circles, and theuncertainty tunnel of cyclic movement is represented withdotted lines.
Rule No. 1. In cold periods, shifting the operating point andits mean value to upper-left corner of permitted area can be
4 The Scientific World Journal
0 2 4 6 8 100
20
40
60
80
100
120
140
160
180
200
Mean value of number of starts per hour, MNs
Mea
n va
lue o
f fun
ctio
ning
tim
e per
hou
r, M
Tf (s
)
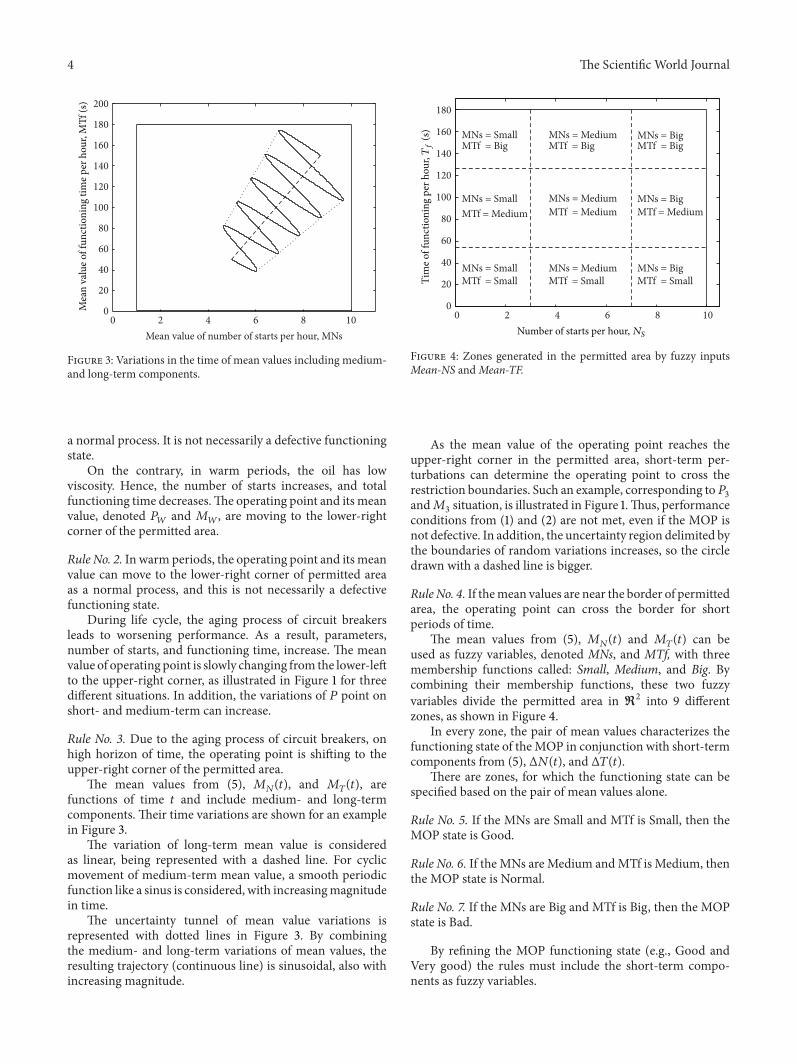
Figure 3: Variations in the time of mean values including medium-and long-term components.
a normal process. It is not necessarily a defective functioningstate.
On the contrary, in warm periods, the oil has lowviscosity. Hence, the number of starts increases, and totalfunctioning time decreases.The operating point and its meanvalue, denoted 𝑃
𝑊and 𝑀
𝑊, are moving to the lower-right
corner of the permitted area.
Rule No. 2. In warm periods, the operating point and its meanvalue can move to the lower-right corner of permitted areaas a normal process, and this is not necessarily a defectivefunctioning state.
During life cycle, the aging process of circuit breakersleads to worsening performance. As a result, parameters,number of starts, and functioning time, increase. The meanvalue of operating point is slowly changing from the lower-leftto the upper-right corner, as illustrated in Figure 1 for threedifferent situations. In addition, the variations of 𝑃 point onshort- and medium-term can increase.
Rule No. 3. Due to the aging process of circuit breakers, onhigh horizon of time, the operating point is shifting to theupper-right corner of the permitted area.
The mean values from (5), 𝑀𝑁(𝑡), and 𝑀
𝑇(𝑡), are
functions of time 𝑡 and include medium- and long-termcomponents. Their time variations are shown for an examplein Figure 3.
The variation of long-term mean value is consideredas linear, being represented with a dashed line. For cyclicmovement of medium-term mean value, a smooth periodicfunction like a sinus is considered, with increasingmagnitudein time.
The uncertainty tunnel of mean value variations isrepresented with dotted lines in Figure 3. By combiningthe medium- and long-term variations of mean values, theresulting trajectory (continuous line) is sinusoidal, also withincreasing magnitude.
0 2 4 6 8 100
20
40
60
80
100
120
140
160
180
MNs = Small
MNs = Small
MNs = Small
MTf = Big
MTf = Medium
MTf = Small MTf = Small MTf = Small
MNs = MediumMTf = Big
MNs = MediumMTf = Medium
MNs = Medium
MNs = BigMTf = Big
MNs = BigMTf = Medium
MNs = Big
Tim
e of f
unct
ioni
ng p
er h
our,Tf
(s)
Number of starts per hour, NS
Figure 4: Zones generated in the permitted area by fuzzy inputsMean-NS andMean-TF.
As the mean value of the operating point reaches theupper-right corner in the permitted area, short-term per-turbations can determine the operating point to cross therestriction boundaries. Such an example, corresponding to𝑃3and𝑀
3situation, is illustrated in Figure 1.Thus, performance
conditions from (1) and (2) are not met, even if the MOP isnot defective. In addition, the uncertainty region delimited bythe boundaries of random variations increases, so the circledrawn with a dashed line is bigger.
Rule No. 4. If themean values are near the border of permittedarea, the operating point can cross the border for shortperiods of time.
The mean values from (5), 𝑀𝑁(𝑡) and 𝑀
𝑇(𝑡) can be
used as fuzzy variables, denoted MNs, and MTf, with threemembership functions called: Small, Medium, and Big. Bycombining their membership functions, these two fuzzyvariables divide the permitted area in R2 into 9 differentzones, as shown in Figure 4.
In every zone, the pair of mean values characterizes thefunctioning state of theMOP in conjunction with short-termcomponents from (5), Δ𝑁(𝑡), and Δ𝑇(𝑡).
There are zones, for which the functioning state can bespecified based on the pair of mean values alone.
Rule No. 5. If the MNs are Small and MTf is Small, then theMOP state is Good.
Rule No. 6. If the MNs are Medium andMTf is Medium, thenthe MOP state is Normal.
Rule No. 7. If the MNs are Big and MTf is Big, then the MOPstate is Bad.
By refining the MOP functioning state (e.g., Good andVery good) the rules must include the short-term compo-nents as fuzzy variables.

The Scientific World Journal 5
4. Fuzzy Diagnostic System
Fuzzy logic can be used to estimate the functioning stateof MOP-type mechanisms, on a scale from 0 to 10, takinginto account the behavior aspects near the boundaries ofpermitted area. In this way, online predictive diagnosis andearly detection of the fault tendencies can be accomplished.
The fuzzy information is useful in the programmingof major overhauls and for decreasing the mean valuesof the operating point. Also, the fuzzy system avoids theunnecessary functioning interrupts, like in crisp diagnosticsystem, when the MOP is not yet defective, even if theperformance conditions are notmet for short periods of time.
In this section, a fuzzy diagnostic system (FDS) isproposed to characterize the functioning state of MOP-typemechanism, based on the model expressed in (5). It is aMamdani-type fuzzy system, denoted MOP-FDS, with 4inputs and 1 output. The FDS structure is shown in Figure 5.
Different fuzzy systems were studied in simulations,denoted MOP-FDSi, with 𝑖 = 1, 2, 3, . . ., with differentcharacteristics of knowledge base andmembership functions.
The inputs give information about the number of startsand time of functioning per hour, in terms of short-termcom-ponents, NS and TF, and their mean values from (5), Mean-NS and Mean-TF, respectively. An example is illustrated inFigure 6.
The ranges of membership functions are chosen based onrestrictions expressed in (1) and (2), with limited values fromtechnical specifications.
Each input of MOP-FDS has three membership func-tions, denoted: Small (S), Medium (M), and Big (B). The firsttwo fuzzy inputs characterize the number of starts per hour.The NS fuzzy variable has membership functions denoted:Small-NS, Medium-NS, and Big-NS. The membership func-tions for Mean-NS fuzzy variable are: Small-MNS, Medium-MNS, andBig-MNS. Similarly, the other two inputs for time offunctioning per hour,TF andMean-TF, have themembershipfunctions denoted: Small-TF, Medium-TF, and Big-TF, andSmall-MTF, Medium-MTF, and Big-MTF, respectively.
The fuzzy output (MOP-State) estimates the functioningstate of MOP-type mechanism, on a scale from 0 to 10. It has5 membership functions, represented in Figure 7.
The output membership functions are denoted: Very Bad(VB), Bad (B), Normal (N), Good (G), and Very Good (VG).
The complete rule base has 81 simple fuzzy rules, but itcan be generated with much less but more complex rules. Anexample of knowledge base, which was produced using 23fuzzy rules, is represented in Table 1. It is completed usingexpert rules from (5), some of them being generated in theprevious section. The two fuzzy inputs characterizing themean values, Mean-NS and Mean-TF, divide the permittedarea in R2, resulting in 9 different zones, similar to thosepresented in Figure 4.
Themembership functions of the input variables are listedwith their simplified names in bold-type in the table head (seeTable 1). For output variable, themembership functions in thetable cells are represented with their abbreviations, specifiedabove. For the sake of clarity, the 9 zones in the permitted areaare also highlighted.
Table 1: Rule base example of FDS.
Mean-NS NS
Mean-TFSmall (S) Medium (M) Big (B)
TFS M B S M B S M B
SS VG VG G G N B N B VBM VG VG G G N B N B VBB G G N G N B N B VB
MS G G G G G N N B VBM N N N G G N N B VBB B B B N N B N B VB
BS N N N N N N B B VBM B B B B B B B B VBB VB VB VB VB VB VB VB VB VB
System MOP-FDS1: 4 inputs, 1 output, 23 rules
Mean-TF (3)
MOP-state (5)
MOP−FDS1
(mamdani)
23 rules
NS (3)
Mean-NS (3)
TF (3)
Figure 5: Structure of fuzzy diagnostic system.
In general, the output of fuzzy system ismoving on outputsurface generated by inference process based on the inputcombinations.The system behaviour can be observed on thissurface. If the input number, denoted 𝑛, is high, then theoutput surface has also high dimension. In this case, thesystem behaviour can be studied on projections of outputsurface in 2-dimensional input subspace with all other inputsconsidered as constants. Using combinations of 𝑛 objectstaken 𝑘 at a time, denoted 𝐶𝑘
𝑛, there are 𝐶2
𝑛projection classes
of output surface. In each class, the constant fuzzy inputs canhave different values.
For MOP-FDS with 4 fuzzy inputs, there are 6 projectionclasses of the output surface. Due to their meanings, the twofuzzy inputs characterizing the mean values, Mean-NS, andMean-TF, are chosen as constant inputs.Hence, only this classis considered in the paper, in which the projections of outputsurface depend on NS and TF fuzzy variables. In the class,9 different projections can be generated, corresponding tozones shown in Figure 4.

6 The Scientific World Journal
0 2 4 6 8 100
0.2
0.4
0.6
0.8
1
NS
Deg
ree o
f mem
bers
hip
Medium-NS Big-NSSmall-NS
(a)
0 2 4 6 8 100
0.2
0.4
0.6
0.8
1
Mean-NS
Deg
ree o
f mem
bers
hip
Small-MNS Medium-MNS Big-MNS
(b)
0 20 40 60 80 100 120 140 160 1800
0.2
0.4
0.6
0.8
1
TF
Deg
ree o
f mem
bers
hip
Medium-TFSmall-TF Big-TF
(c)
0 20 40 60 80 100 120 140 160 1800
0.2
0.4
0.6
0.8
1
Mean-TF
Deg
ree o
f mem
bers
hip
Small-MTF Medium-MTF Big-MTF
(d)
Figure 6: Membership functions of FDS inputs.
0 2 4 6 8 100
0.2
0.4
0.6
0.8
1
MOP-state
Deg
ree o
f mem
bers
hip
Bad GoodNormalVery bad Very good
Figure 7: Membership functions of FDS output.

The Scientific World Journal 7
0 2 4 6 8 100
20
40
60
80
100
120
140
160
180
200
Tim
e of f
unct
ioni
ng p
er h
our,Tf
(s)
Number of starts per hour, NS
Figure 8: Input data set for 5 year-time horizon.
5. Simulation Results
To illustrate the advantages of fuzzy logic in predictivediagnosis and early detection of the fault tendencies, a largeinput data set is generated. It contains hourly records ofoperating points, (𝑥
1= 𝑁
𝑆, 𝑥2= 𝑇𝐹) ∈ R2, for a
time horizon of 5 years. During this time, the medium-and long-term mean values have variations similar to thoseshown in Figure 3. As a result, a mean value trajectoryappears as combination of seasonal movements with long-term shifting. The short-term components are considered asrandom variables with normal distribution and zero mean.
The data set contains 43800 points in R2, which areillustrated with grey color in Figure 8.The resulting variationof mean values is represented with a dark continuous line.Two points are placed intentionally outside the permittedarea, being represented with both “o” and “∗” marks.
The two points represent values exceeding the range foreither variable,𝑁𝑆 and𝑇𝐹.Themaximumvalues are exceededat two particular moments of time, at the 10000th sample and15000th sample, respectively.
To verify the distribution around the mean values, thedaily averages are computed in the data set and shown withgrey color in Figure 9. It can be observed that the daily-meanpoints follow the variation of the mean values.
The coordinates of operating points, (𝑥1= 𝑁𝑆, 𝑥2=
𝑇𝐹) ∈ R2, are functions of time with hourly records, being
represented in Figure 10.The two points placed outside the permitted area are
representedwith “o”marks. It can be observed that the secondcoordinate, time of functioning per hour, is noisier because itcontains real values, expressed with 2 digits after the decimalpoint. The first coordinate, number of starts per hour, is aninteger.
Several fuzzy diagnostic systems were used in simula-tions, with different characteristics of knowledge base andmembership functions. Comparative results from 6 fuzzysystems, denotedMOP-FDSi, 𝑖 = 1, . . . , 6, are presented in the
0 2 4 6 8 100
20
40
60
80
100
120
140
160
180
200
Dai
ly m
ean
ofTf
(s)
Daily mean of NS
Figure 9: Daily averages in the input data set.
02468
1012
0 0.5 1 1.5 2 2.5 3 3.5 4 4.5
0 0.5 1 1.5 2 2.5 3 3.5 4 4.5
0
50
100
150
200
t (hours)
t (hours)
×104
×104
Tf
(s)
NS
Figure 10: Coordinates of operating points.
paper.These 6 fuzzy systems were generated using 3 differentrule bases and 2 sets of membership functions.
MOP-FDS1 has the membership functions and rule basepresented in Section 4. For predictive diagnosiswith the givendata set, the most useful projections of output surface arethose around the upper-right corner in the permitted area.
The projections of output surface of MOP-FDS1, corre-sponding to pairs of constant inputs (Mean-NS=Big, Mean-TF =Big) and (Mean-NS=Medium, Mean-TF =Medium),respectively, are shown in Figure 11.
The projection for the pair (Mean-NS= Small, Mean-TF = Small) has similar shape as the one for pair (Medium,Medium), but shifted to higher values ofMOP-State.
The MOP-FDS1 projections of output surface, corre-sponding to pairs of constant inputs (Mean-NS=Medium,Mean-TF =Big) and (Mean-NS=Big, Mean-TF =Medium),respectively, are illustrated in Figure 12. The rest of the 4projections have similar shapes, but they shifted to different

8 The Scientific World Journal
02
46
810
050
100150
0
2
4
6
8
10
NSTF
MO
P-sta
te
02
46
810
050
100150
0
2
4
6
8
10
NSTF
MO
P-sta
te
Mean-NS= 5 (medium) Mean-TF= 90 (medium)Mean-NS= 8 (big) Mean-TF= 144 (big)
Figure 11: MOP-FDS1 output surface for pairs (Big, Big) and (Medium,Medium).
02
46
810
050
100150
0
2
4
6
8
10
NSTF
MO
P-sta
te
02
46
810
0
50100
150
0
2
4
6
8
10
NSTF
MO
P-sta
te
Mean-NS = 5 (medium) Mean-TF= 144 (big) Mean-NS = 8 (big) Mean-TF= 90 (medium)
Figure 12: MOP-FDS1 output surface for pairs (Medium, Big) and (Big,Medium).
values of MOP-State, accordingly with rule base given inTable 1.
The odd numbered fuzzy systems, MOP-FDSi with 𝑖 =1, 3, and 5, have different rule bases, but the same member-ship functions, presented in Figures 6 and 7.
The even numbered systems, with 𝑖 = 2, 4, and 6,have all the same membership functions, which are differentfrom those presented in Figures 6 and 7, with more narrowintersection areas. Their rule bases are the same as theircorresponding paired odd numbered systems (e.g., MOP-FDS1 and MOP-FDS2 have the same rule base, but differentmembership functions).
If themembership functions aremodified tomore narrowintersection areas, the output surface changes to amore roughshape. For example, the MOP-FDS2 projections of outputsurface, corresponding to pairs of constant inputs (Mean-NS=Medium, Mean-TF =Big) and (Mean-NS=Big, Mean-TF =Medium), respectively, are represented in Figure 13. Theshapes illustrated in Figure 12 are smoother.
If the rule base is changed with more complex rules,the output surface changes accordingly. For example, the
Table 2: Output performance of MOP-FDS.
Fuzzy diagnosticsystem
FDS output performancemse 𝑇max (hours)
MOP-FDS1 1.2030 35573MOP-FDS2 1.9371 35573MOP-FDS3 0.4565 35458MOP-FDS4 0.5378 35558MOP-FDS5 0.5542 35573MOP-FDS6 0.7712 35573
projections of output surface, corresponding to the pair ofconstant inputs (Mean-NS=Medium, Mean-TF =Medium)for MOP-FDS3 and MOP-FDS5, respectively, are shown inFigure 14. It can be observed that they are different from thesame projection shown in Figure 11. The smoothest surface isobtained for MOP-FDS5.
The output performance of MOP-FDSi, 𝑖 = 1, . . . , 6 isrepresented in Table 2.

The Scientific World Journal 9
02
46
810
050
100150
0
2
4
6
8
10
NSTF
MO
P-sta
te
Mean-NS = 8 (big) Mean-TF= 90 (medium)
02
46
810
050
100150
0
2
4
6
8
10
NSTF
MO
P-sta
teMean-NS = 5 (medium) Mean-TF= 144 (big)
Figure 13: MOP-FDS2 output surface for pairs (Medium, Big) and (Big,Medium).
02
46
810
050
100150
0
2
4
6
8
10
NSTF
MO
P-sta
te
024
68
10
050
100150
0
2
4
6
8
10
NSTF
MO
P-sta
teMean-NS = 5 (medium) Mean-TF= 90 (medium) Mean-NS = 5 (medium) Mean-TF= 90 (medium)
Figure 14: Output surface of MOP-FDS3 and MOP-FDS5 for pair (Medium,Medium).
Two performance criteria were used. The first one isthe mean squared error (mse) of fuzzy output (MOP-State)compared with a theoretical linear decreasing tendency ofMOP functioning state.
The second performance criterion is the total functioningtime (𝑇max) while the fuzzy output remains above a theoreti-cal alarm value, which was chosen atMOP-State= 2.
It can be observed that all the even numbered fuzzysystems have worse performance than their paired systemswith the same rule base but with membership functionspresented in Figures 6 and 7. The best performance wasobtained for MOP-FDS3, with mse = 0.4565.
The total functioning time (𝑇max) has comparable valuesfor all fuzzy diagnostic systems (little above 4 years). Again,MOP-FDS3 has the fastest predictive diagnostic response ofMOP state.
The three outputs of odd numbered fuzzy systems areshown with grey color in Figure 15. As expected, the outputsdecrease in time, from a state aroundNormal to theVery-Bad
state. As it can be observed, the dispersion of the points islarger for MOP-FDS1.
When the two points cross the border of permitted area,the outputs have small variations, shown with “o” mark, butthey do not make major changes in MOP state. By contrary,using a classic crisp system, each of these points would beinterpreted as a fault, activating an error and stopping theMOP.
At 𝑇max time sample (little over 4 years), the fuzzy out-puts decrease under alarm line, represented with horizontalcontinuous line. At this moment, the MOP state is alreadyBad, even it is not defective yet. The MOP functioning is notreliable, and maintenance process should be scheduled.
6. Conclusions
Fuzzy rules are generated to characterize the functioning stateof MOP-type drive mechanisms. Several fuzzy systems areproposed for online predictive diagnosis. The fuzzy output

10 The Scientific World Journal
0 0.5 1 1.5 2 2.5 3 3.5 4 4.50
1
2
3
4
5
6
7
8
9
10
00
1
2
3
4
5
6
7
8
9
10
0
1
2
3
4
5
6
7
8
9
10
t (hour)
0 0.5 1 1.5 2 2.5 3 3.5 4 4.5t (hour)
0.5 1 1.5 2 2.5 3 3.5 4 4.5t (hour)
MO
P-sta
teM
OP-
state
MO
P-sta
te
mse = 0.45646
mse = 0.5542
×104
×104
×104
mse = 1.203 Tmax = 35573
Tmax = 35458
Tmax = 35573
Figure 15: Fuzzy outputs of odd MOP-FDSi.

The Scientific World Journal 11
is not perturbed by operating points crossing the border ofpermitted area for short time periods.The fuzzy systemsworkwell, making an early detection of the fault tendencies ofMOP mechanism.
References
[1] A. Ghosh and G. Ledwich, Power Quality Enhancement UsingCustom Power Devices, Kluwer Academic, New York, NY, USA,2002.
[2] T. C. Nguyen, S. Chan, R. Bailey, and T. Nguyen, “Auto-check circuit breaker interrupting capabilities,” IEEE ComputerApplications in Power, vol. 15, no. 1, pp. 24–28, 2002.
[3] C. Sweetser, W. J. Bergman, G. Montillet et al., “Strategies forselecting monitoring of circuit breakers,” IEEE Transactions onPower Delivery, vol. 17, no. 3, pp. 742–746, 2002.
[4] M.M. Eissa, “Automatingmotor-operated air-breaker switches,”IEEE Computer Applications in Power, vol. 15, no. 2, pp. 52–56,2002.
[5] I. Miciu and F. Hartescu, “Monitoring system for co-generativepower plants,” Studies in Informatics and Control, vol. 18, no. 4,pp. 379–388, 2009.
[6] J. P. Dupraz, A. Schiemann, and G. F. Montillet, “Designobjectives of new digital control andmonitoring of high voltagecircuit breakers,” in Proceedings of the IEEE/PES Transmissionand Distribution Conference and Exposition, vol. 2, pp. 1088–1093, November 2001.
[7] A. M’halla, E. Craye, S. C. Dutilleul, and M. Benrejeb, “Moni-toring of a milk manufacturing workshop using chronicle andfault tree approaches,” Studies in Informatics and Control, vol. 19,no. 4, pp. 377–390, 2010.
[8] J. A. Dewulf, T. Jung, J. P. Dupraz, and G. F. Montillet, “Adevelopment and application of circuit breakers diagnostic andmonitoring,” in Proceedings of the IEEE PES Transmission andDistribution Conference, vol. 2, pp. 774–779, September 2003.
[9] A.Monticelli, “Electric power system state estimation,” Proceed-ings of the IEEE, vol. 88, no. 2, pp. 262–282, 2000.
[10] R. Allan and R. Billinton, “Probabilistic assessment of powersystems,” Proceedings of the IEEE, vol. 88, no. 2, pp. 140–162,2000.
[11] I. Manea, E. Ionescu, and D. Irimia, “Modern methods to diag-nose the oleo-pneumatic operating mechanisms type MOP,” inProceedings of the 5th International Power Systems Conference,Timisoara, Romania, 2003.
[12] M. Stanek and K. Frohlich, “Model-aided diagnosis—a newmethod for online condition assessment of high voltage circuitbreakers,” IEEE Transactions on Power Delivery, vol. 15, no. 2,pp. 585–591, 2000.
[13] C. Hong-Chan, “Fault section diagnosis of power system usingfuzzy logic,” IEEE Transactions on Power Systems, vol. 18, no. 1,pp. 245–250, 2003.
[14] S. W. Min, J. M. Sohn, J. K. Park, and K. H. Kim, “Adaptivefault section estimation using matrix representation with fuzzyrelations,” IEEE Transactions on Power Systems, vol. 19, no. 2, pp.842–848, 2004.
[15] J. Sun, S. Y. Qin, and Y. H. Song, “Fault diagnosis of electricpower systems based on fuzzy petri nets,” IEEE Transactions onPower Systems, vol. 19, no. 4, pp. 2053–2059, 2004.
[16] J. C. Tan, P. A. Crossley, and P. G. McLaren, “Fuzzy expertsystem for on-line fault diagnosis on a transmission network,”
in Proceedings of the IEEE Power Engineering Society WinterMeeting, vol. 2, pp. 775–780, usa, February 2001.
[17] W. R. A. Ibrahim andM.M.Morcos, “Adaptive fuzzy techniquefor learning power-quality signature waveforms,” IEEE PowerEngineering Review, vol. 21, no. 1, pp. 56–58, 2001.
[18] R. Shoureshi, T. Norick, D. Linder, J. Work, and P. Kaptain,“Sensor fusion and complex data analysis for predictivemainte-nance,” in Proceedings of the 36th Annual Hawaii InternationalConference on System Sciences, 2003.
[19] R. Shoureshi, T. Norick, V. Permana, and J. Work, “Advancedsensor and diagnostic technologies for development of intelli-gent substations,” in Proceedings of the IEEE Power EngineeringSociety General Meeting, vol. 1, pp. 727–746, June 2004.

TribologyAdvances in
Hindawi Publishing Corporationhttp://www.hindawi.com Volume 2014
International Journal of
AerospaceEngineeringHindawi Publishing Corporationhttp://www.hindawi.com Volume 2014
FuelsJournal of
Hindawi Publishing Corporationhttp://www.hindawi.com Volume 2014
Journal ofPetroleum Engineering
Hindawi Publishing Corporationhttp://www.hindawi.com Volume 2014
Industrial EngineeringJournal of
Hindawi Publishing Corporationhttp://www.hindawi.com Volume 2014
Power ElectronicsHindawi Publishing Corporationhttp://www.hindawi.com Volume 2014
Advances in
CombustionJournal of
Hindawi Publishing Corporationhttp://www.hindawi.com Volume 2014
Journal of
Hindawi Publishing Corporationhttp://www.hindawi.com Volume 2014
Renewable Energy
Submit your manuscripts athttp://www.hindawi.com
Hindawi Publishing Corporationhttp://www.hindawi.com Volume 2014
StructuresJournal of
International Journal of
RotatingMachinery
Hindawi Publishing Corporationhttp://www.hindawi.com Volume 2014
EnergyJournal of
Hindawi Publishing Corporationhttp://www.hindawi.com Volume 2014
Hindawi Publishing Corporation http://www.hindawi.com
Journal ofEngineeringVolume 2014
Hindawi Publishing Corporation http://www.hindawi.com Volume 2014
International Journal ofPhotoenergy
Hindawi Publishing Corporationhttp://www.hindawi.com Volume 2014
Nuclear InstallationsScience and Technology of
Hindawi Publishing Corporationhttp://www.hindawi.com Volume 2014
Solar EnergyJournal of
Hindawi Publishing Corporationhttp://www.hindawi.com Volume 2014
Wind EnergyJournal of
Hindawi Publishing Corporationhttp://www.hindawi.com Volume 2014
Nuclear EnergyInternational Journal of
Hindawi Publishing Corporationhttp://www.hindawi.com Volume 2014
High Energy PhysicsAdvances in
The Scientific World JournalHindawi Publishing Corporation http://www.hindawi.com Volume 2014