research article effects of wolf mortality on … · research article effects of wolf mortality on...
TRANSCRIPT

RESEARCH ARTICLE
Effects of Wolf Mortality on LivestockDepredationsRobert B. Wielgus, Kaylie A. Peebles*
Large Carnivore Conservation Laboratory, School of Environment, Washington State University, Pullman,Washington, United States of America
Abstract
Predator control and sport hunting are often used to reduce predator populations
and livestock depredations, – but the efficacy of lethal control has rarely been
tested. We assessed the effects of wolf mortality on reducing livestock
depredations in Idaho, Montana and Wyoming from 1987–2012 using a 25 year
time series. The number of livestock depredated, livestock populations, wolf
population estimates, number of breeding pairs, and wolves killed were calculated
for the wolf-occupied area of each state for each year. The data were then analyzed
using a negative binomial generalized linear model to test for the expected negative
relationship between the number of livestock depredated in the current year and the
number of wolves controlled the previous year. We found that the number of
livestock depredated was positively associated with the number of livestock and the
number of breeding pairs. However, we also found that the number of livestock
depredated the following year was positively, not negatively, associated with the
number of wolves killed the previous year. The odds of livestock depredations
increased 4% for sheep and 5–6% for cattle with increased wolf control - up until
wolf mortality exceeded the mean intrinsic growth rate of wolves at 25%. Possible
reasons for the increased livestock depredations at #25% mortality may be
compensatory increased breeding pairs and numbers of wolves following increased
mortality. After mortality exceeded 25%, the total number of breeding pairs, wolves,
and livestock depredations declined. However, mortality rates exceeding 25% are
unsustainable over the long term. Lethal control of individual depredating wolves
may sometimes necessary to stop depredations in the near-term, but we
recommend that non-lethal alternatives also be considered.
OPEN ACCESS
Citation: Wielgus RB, Peebles KA (2014) Effectsof Wolf Mortality on Livestock Depredations. PLoSONE 9(12): e113505. doi:10.1371/journal.pone.0113505
Editor: Joseph K. Bump, Michigan TechnologicalUniversity, United States of America
Received: July 28, 2014
Accepted: October 24, 2014
Published: December 3, 2014
Copyright: � 2014 Wielgus, Peebles. This is anopen-access article distributed under the terms ofthe Creative Commons Attribution License, whichpermits unrestricted use, distribution, and repro-duction in any medium, provided the original authorand source are credited.
Data Availability: The authors confirm that all dataunderlying the findings are fully available withoutrestriction. All relevant data are within theSupporting Information files.
Funding: Funding for this research was providedsolely by a research grant from the WashingtonDepartment of Fish and Wildlife. The funders hadno role in study design, data collection andanalysis, decision to publish, or preparation of themanuscript.
Competing Interests: The authors have declaredthat no competing interests exist.
PLOS ONE | DOI:10.1371/journal.pone.0113505 December 3, 2014 1 / 16
Introduction
Predator control and sport hunting are often used to reduce predator populations,
livestock depredations, and increase social acceptance of large carnivores such as
brown bears (Ursus arctos) [1], wolves (Canis lupus) [2], cougars (Puma concolor)
[3], jaguars (Panthera onca) [4], lions (Panthera leo) [5], leopards (Pantera
pardus) [6], and others [7].
Gray wolves (our model animal) are currently being hunted in Idaho,
Wyoming and Montana, in part, to reduce livestock depredations [8]. However,
to our knowledge, the long-term effectiveness of lethal wolf control to reduce
livestock depredations has not yet been rigorously tested. For example, Bradley
and Pletscher [9] predicted that breeding pairs are responsible for most livestock
depredations because they are bound to the den site, not natural prey distribution
[10]. Brainerd et al. [11] predicted that increased wolf mortality could result in
fracture of pack structure and increased breeding pairs. If this is the case,
increased mortality of wolves could result in increased breeding pairs and
livestock depredations following lethal control. In other species, Collins et al. [12]
and Treves et al. [13] found increased damages by black bears (Ursus americanus)
following high remedial mortality and Peebles et al. [14] found that increased
mortality of cougars resulted in increased livestock depredations because of social
disruption. In this paper we test the widely accepted, but untested, hypothesis that
increased lethal control decreases wolf livestock depredations in a large scale (tri-
state) long-term (25 year) quasi-experimental [15]. The ‘‘remedial control’’
hypothesis predicts that livestock depredations will decrease following increased
lethal control.
Methods
We obtained the confirmed number of cattle (Bos primigenius) and sheep (Ovis
aries) depredated, wolf population estimates, number of breeding pairs, and the
number of wolves killed in the wolf-occupied area of each state for each year
between 1987–2012 from United States Fish and Wildlife Services Interagency
Annual Wolf Reports [16] (Table S1). The number of wolves killed were wolves
that were killed through control methods including wolves killed legally by
livestock owners or through government control methods, these numbers do not
include other sources, including natural mortality. Only the total numbers of
livestock killed, not the number of confirmed livestock depredation incidents,
were available from the USFW database.
Numbers of livestock were similarly obtained from United States Department
of Agriculture National Agricultural Statistics Service for counties where wolves
are present [17] (Table S1). Livestock numbers for individual properties were not
available so livestock tallies were made across the tri-state area using counts from
wolf occupied counties.
Following Peebles et al. [14], we used forward selection, negative binomial
general linearized models to assess the relationship between livestock depredations
Wolf Mortality and Livestock
PLOS ONE | DOI:10.1371/journal.pone.0113505 December 3, 2014 2 / 16
and numbers of livestock, wolves, breeding pairs, and wolves killed. We used this
method because depredations were over-dispersed and consisted of 0 to positive
integer count data with a variance exceeding the mean [18]. The best statistical
model was then selected using the lowest AIC (Akaike Information Criterion) and
highest log-likelihood [19]. The rate ratio, analogous to odds-ratio, was computed
from the coefficients to aid in interpreting the results [20]. For example, a rate
ratio of 1.0 for any independent variable means the effect on the dependent
variable is unchanged. A rate ratio of 1.5 means the odds are increased by 50%.
To establish directionality, we analyzed the effect of independent variables in
year 1 on number of livestock depredated in year 2. This one year time-lag
between control kills and depredations removes the directional effect of
depredations causing kills. After assessing the models, we plotted and interpreted
the most important independent variables against depredations to provide a visual
representation of model terms. Only the independent variables that had a rate
ratio larger than 1.01or smaller than 0.99, meaning the change in the mean
number of livestock depredated was increased or decreased by at least 1%, were
examined further. We conducted our regressions on the entire tri-state area and
the 3 separate states- but only report the larger tri-state area here because the
results were basically the same in all cases (Figures S1 and S2).
Results
The total number of livestock depredated between January 1987- December 2012
in the tri-state area was 5670; 1853 were cattle and 3723 were sheep. Sample size
for paired depredations in year 2 and wolf and cattle numbers and wolves killed in
year 1 was: 17 years for Idaho, 17 years for Wyoming, and 25 years for Montana
(N total 559).
All of the well performing models (AIC,466) for cattle depredated included
the # wolves killed, # of breeding pairs and the # of wolves killed by # breeding
pairs interaction (Table 1) - and the coefficients for these terms were very similar
across models. The best models were #10, #12 and #13. The 1st model was g(y)
5 exp [1.307+0.05078(wolves killed through control methods) +0.07979(# of
breeding pairs) +2.11661028(# of cattle) – 1.34361023(# breeding pairs*-
wolves killed) – 2.98061028(# of cattle*wolves killed)]. The 2nd model was g(y)
5 exp [1.142+0.05293(wolves killed through control methods) +0.08791(# of
breeding pairs) +2.67461027(# of cattle) – 0.001377(wolves killed*# of
breeding pairs) – 1.70161028(# of cattle*# of breeding pairs)]. The 3rd model
was g(y) 5 exp [1.182+0.05795(wolves killed through control methods)
+0.07783(# of breeding pairs) +2.11261027(# of cattle) – 0.001378(wolves
killed*# of breeding pairs) – 7.80461029(# of cattle*# of wolves killed)]
In both models all of the main effects and some two way interactions were
found to be statistically significant (Table 2). The number of wolves killed in year
one was positively related to the number of cattle depredated the following year
(rate ratios 51.05, 1.05 and 1.06, z55.67 and 5.66, 4.69, P,0.001) (Figure 1). For
Wolf Mortality and Livestock
PLOS ONE | DOI:10.1371/journal.pone.0113505 December 3, 2014 3 / 16
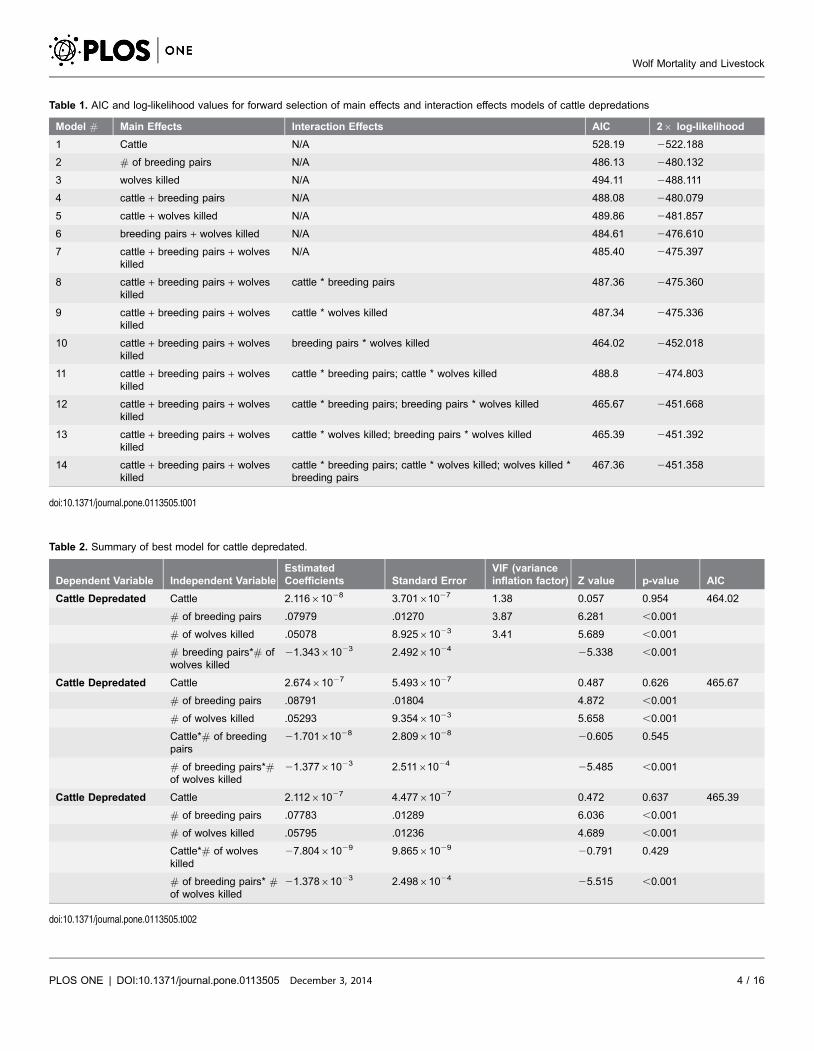
Table 2. Summary of best model for cattle depredated.
Dependent Variable Independent VariableEstimatedCoefficients Standard Error
VIF (varianceinflation factor) Z value p-value AIC
Cattle Depredated Cattle 2.11661028 3.70161027 1.38 0.057 0.954 464.02
# of breeding pairs .07979 .01270 3.87 6.281 ,0.001
# of wolves killed .05078 8.92561023 3.41 5.689 ,0.001
# breeding pairs*# ofwolves killed
21.34361023 2.49261024 25.338 ,0.001
Cattle Depredated Cattle 2.67461027 5.49361027 0.487 0.626 465.67
# of breeding pairs .08791 .01804 4.872 ,0.001
# of wolves killed .05293 9.35461023 5.658 ,0.001
Cattle*# of breedingpairs
21.70161028 2.80961028 20.605 0.545
# of breeding pairs*#of wolves killed
21.37761023 2.51161024 25.485 ,0.001
Cattle Depredated Cattle 2.11261027 4.47761027 0.472 0.637 465.39
# of breeding pairs .07783 .01289 6.036 ,0.001
# of wolves killed .05795 .01236 4.689 ,0.001
Cattle*# of wolveskilled
27.80461029 9.86561029 20.791 0.429
# of breeding pairs* #of wolves killed
21.37861023 2.49861024 25.515 ,0.001
doi:10.1371/journal.pone.0113505.t002
Table 1. AIC and log-likelihood values for forward selection of main effects and interaction effects models of cattle depredations
Model # Main Effects Interaction Effects AIC 26 log-likelihood
1 Cattle N/A 528.19 2522.188
2 # of breeding pairs N/A 486.13 2480.132
3 wolves killed N/A 494.11 2488.111
4 cattle + breeding pairs N/A 488.08 2480.079
5 cattle + wolves killed N/A 489.86 2481.857
6 breeding pairs + wolves killed N/A 484.61 2476.610
7 cattle + breeding pairs + wolveskilled
N/A 485.40 2475.397
8 cattle + breeding pairs + wolveskilled
cattle * breeding pairs 487.36 2475.360
9 cattle + breeding pairs + wolveskilled
cattle * wolves killed 487.34 2475.336
10 cattle + breeding pairs + wolveskilled
breeding pairs * wolves killed 464.02 2452.018
11 cattle + breeding pairs + wolveskilled
cattle * breeding pairs; cattle * wolves killed 488.8 2474.803
12 cattle + breeding pairs + wolveskilled
cattle * breeding pairs; breeding pairs * wolves killed 465.67 2451.668
13 cattle + breeding pairs + wolveskilled
cattle * wolves killed; breeding pairs * wolves killed 465.39 2451.392
14 cattle + breeding pairs + wolveskilled
cattle * breeding pairs; cattle * wolves killed; wolves killed *breeding pairs
467.36 2451.358
doi:10.1371/journal.pone.0113505.t001
Wolf Mortality and Livestock
PLOS ONE | DOI:10.1371/journal.pone.0113505 December 3, 2014 4 / 16
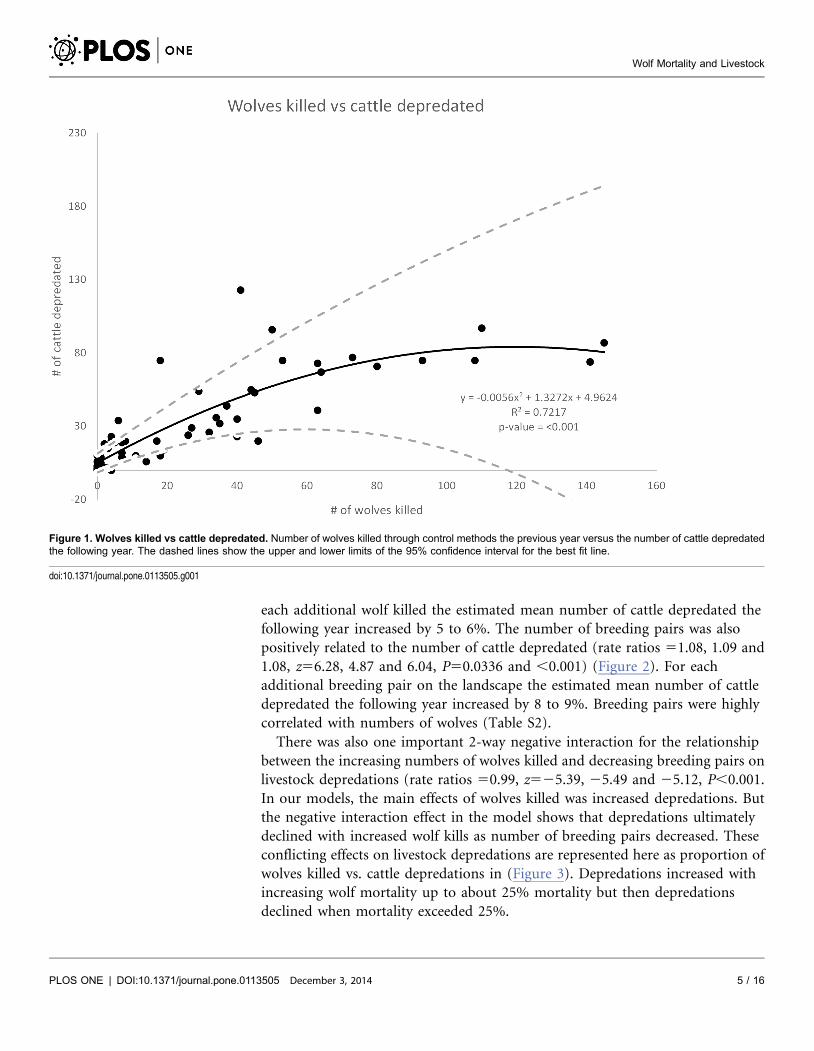
each additional wolf killed the estimated mean number of cattle depredated the
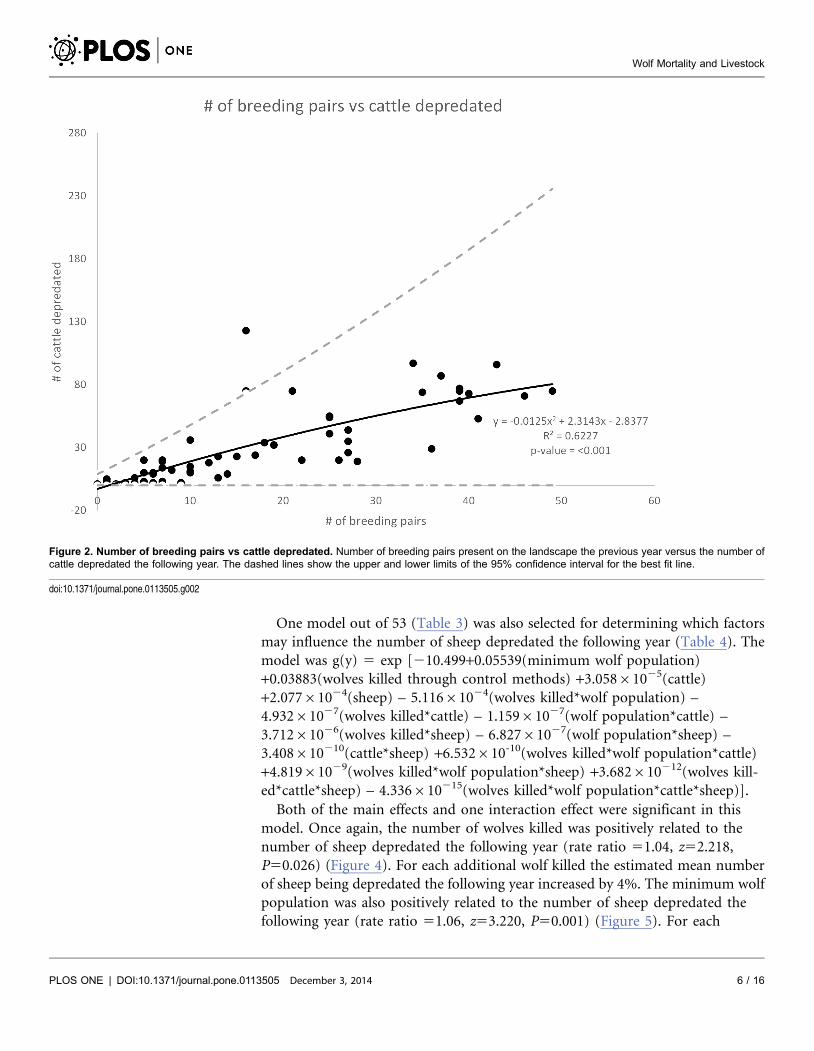
following year increased by 5 to 6%. The number of breeding pairs was also
positively related to the number of cattle depredated (rate ratios 51.08, 1.09 and
1.08, z56.28, 4.87 and 6.04, P50.0336 and ,0.001) (Figure 2). For each
additional breeding pair on the landscape the estimated mean number of cattle
depredated the following year increased by 8 to 9%. Breeding pairs were highly
correlated with numbers of wolves (Table S2).
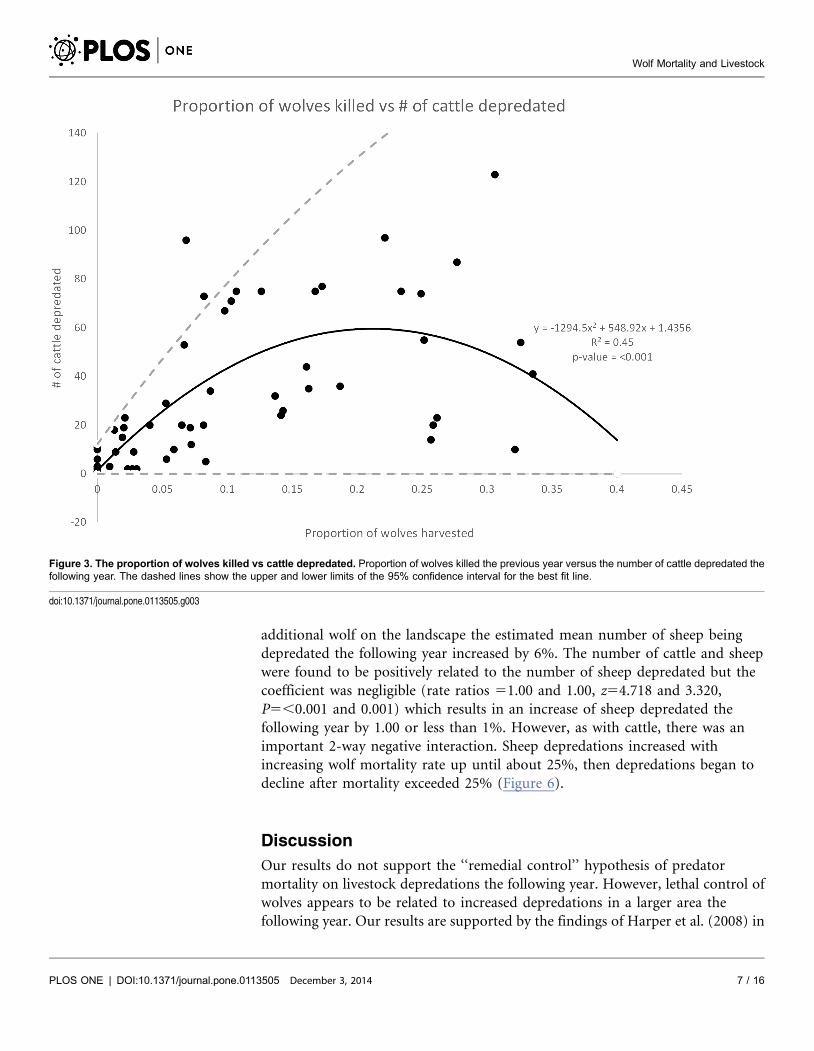
There was also one important 2-way negative interaction for the relationship
between the increasing numbers of wolves killed and decreasing breeding pairs on
livestock depredations (rate ratios 50.99, z525.39, 25.49 and 25.12, P,0.001.
In our models, the main effects of wolves killed was increased depredations. But
the negative interaction effect in the model shows that depredations ultimately
declined with increased wolf kills as number of breeding pairs decreased. These
conflicting effects on livestock depredations are represented here as proportion of
wolves killed vs. cattle depredations in (Figure 3). Depredations increased with
increasing wolf mortality up to about 25% mortality but then depredations
declined when mortality exceeded 25%.
Figure 1. Wolves killed vs cattle depredated. Number of wolves killed through control methods the previous year versus the number of cattle depredatedthe following year. The dashed lines show the upper and lower limits of the 95% confidence interval for the best fit line.
doi:10.1371/journal.pone.0113505.g001
Wolf Mortality and Livestock
PLOS ONE | DOI:10.1371/journal.pone.0113505 December 3, 2014 5 / 16
One model out of 53 (Table 3) was also selected for determining which factors
may influence the number of sheep depredated the following year (Table 4). The
model was g(y) 5 exp [210.499+0.05539(minimum wolf population)
+0.03883(wolves killed through control methods) +3.05861025(cattle)
+2.07761024(sheep) – 5.11661024(wolves killed*wolf population) –
4.93261027(wolves killed*cattle) – 1.15961027(wolf population*cattle) –
3.71261026(wolves killed*sheep) – 6.82761027(wolf population*sheep) –
3.408610210(cattle*sheep) +6.532610-10(wolves killed*wolf population*cattle)
+4.81961029(wolves killed*wolf population*sheep) +3.682610212(wolves kill-
ed*cattle*sheep) – 4.336610215(wolves killed*wolf population*cattle*sheep)].
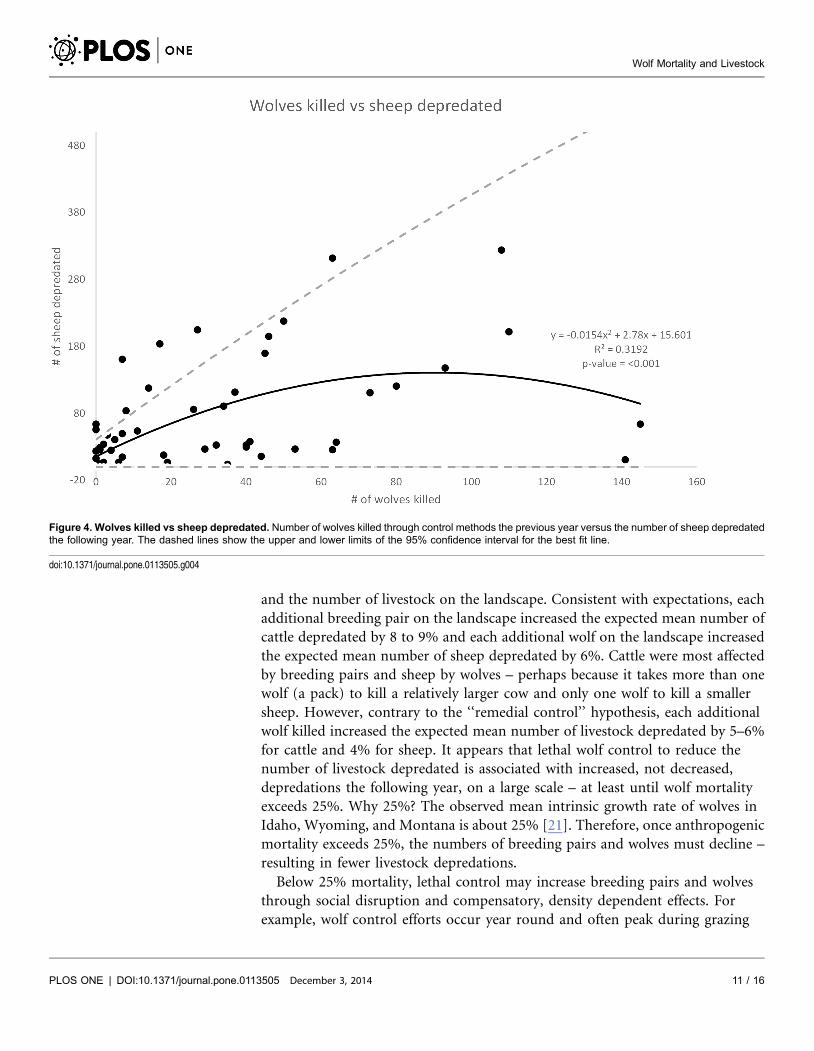
Both of the main effects and one interaction effect were significant in this
model. Once again, the number of wolves killed was positively related to the
number of sheep depredated the following year (rate ratio 51.04, z52.218,
P50.026) (Figure 4). For each additional wolf killed the estimated mean number
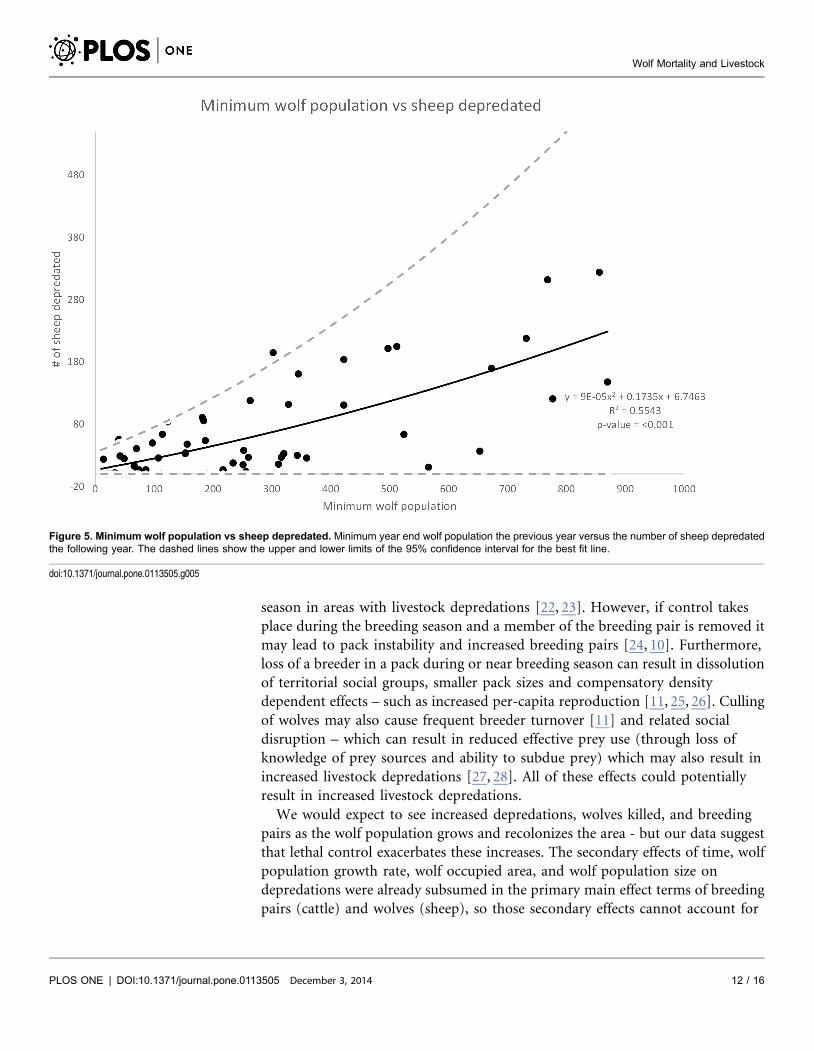
of sheep being depredated the following year increased by 4%. The minimum wolf
population was also positively related to the number of sheep depredated the
following year (rate ratio 51.06, z53.220, P50.001) (Figure 5). For each
Figure 2. Number of breeding pairs vs cattle depredated. Number of breeding pairs present on the landscape the previous year versus the number ofcattle depredated the following year. The dashed lines show the upper and lower limits of the 95% confidence interval for the best fit line.
doi:10.1371/journal.pone.0113505.g002
Wolf Mortality and Livestock
PLOS ONE | DOI:10.1371/journal.pone.0113505 December 3, 2014 6 / 16
additional wolf on the landscape the estimated mean number of sheep being
depredated the following year increased by 6%. The number of cattle and sheep
were found to be positively related to the number of sheep depredated but the
coefficient was negligible (rate ratios 51.00 and 1.00, z54.718 and 3.320,
P5,0.001 and 0.001) which results in an increase of sheep depredated the
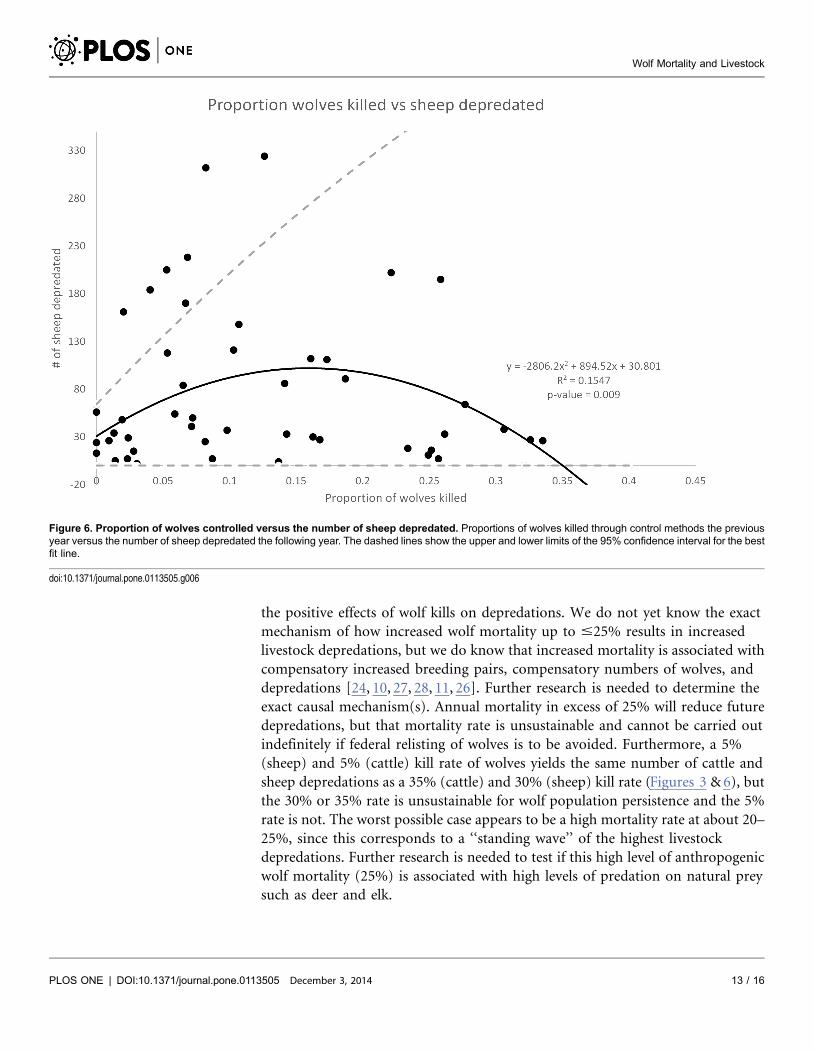
following year by 1.00 or less than 1%. However, as with cattle, there was an
important 2-way negative interaction. Sheep depredations increased with
increasing wolf mortality rate up until about 25%, then depredations began to
decline after mortality exceeded 25% (Figure 6).
Discussion
Our results do not support the ‘‘remedial control’’ hypothesis of predator
mortality on livestock depredations the following year. However, lethal control of
wolves appears to be related to increased depredations in a larger area the
following year. Our results are supported by the findings of Harper et al. (2008) in
Figure 3. The proportion of wolves killed vs cattle depredated. Proportion of wolves killed the previous year versus the number of cattle depredated thefollowing year. The dashed lines show the upper and lower limits of the 95% confidence interval for the best fit line.
doi:10.1371/journal.pone.0113505.g003
Wolf Mortality and Livestock
PLOS ONE | DOI:10.1371/journal.pone.0113505 December 3, 2014 7 / 16
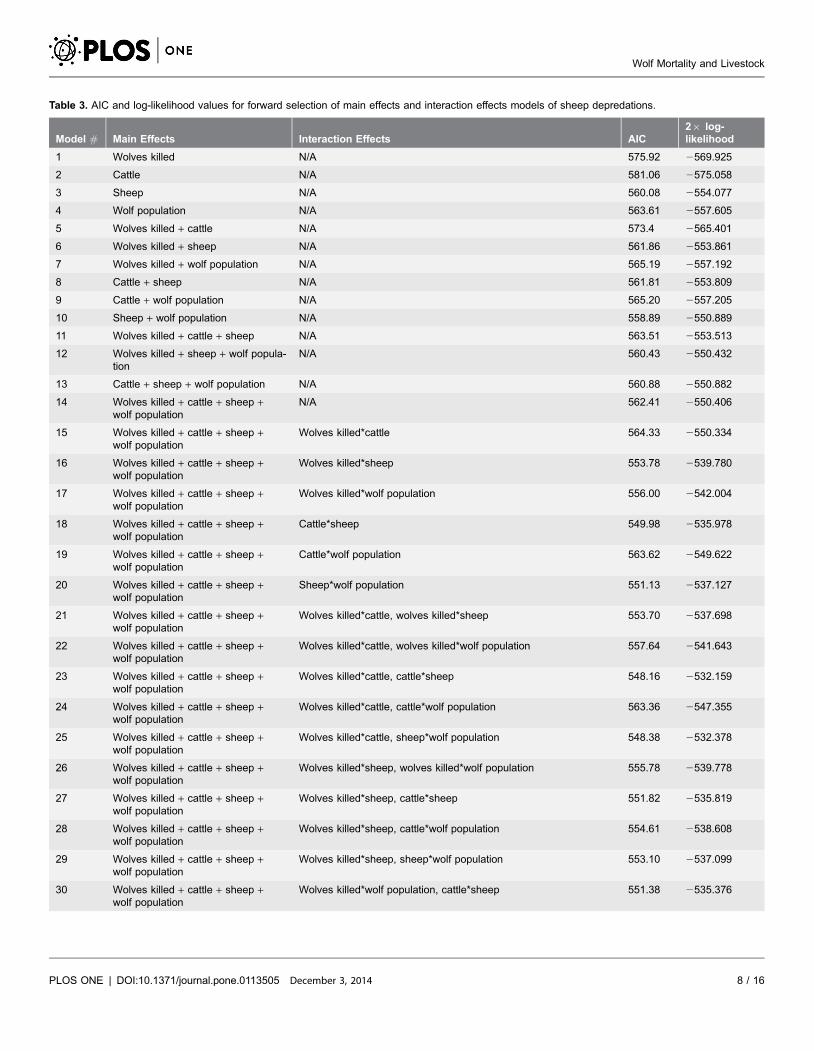
Table 3. AIC and log-likelihood values for forward selection of main effects and interaction effects models of sheep depredations.
Model # Main Effects Interaction Effects AIC26 log-likelihood
1 Wolves killed N/A 575.92 2569.925
2 Cattle N/A 581.06 2575.058
3 Sheep N/A 560.08 2554.077
4 Wolf population N/A 563.61 2557.605
5 Wolves killed + cattle N/A 573.4 2565.401
6 Wolves killed + sheep N/A 561.86 2553.861
7 Wolves killed + wolf population N/A 565.19 2557.192
8 Cattle + sheep N/A 561.81 2553.809
9 Cattle + wolf population N/A 565.20 2557.205
10 Sheep + wolf population N/A 558.89 2550.889
11 Wolves killed + cattle + sheep N/A 563.51 2553.513
12 Wolves killed + sheep + wolf popula-tion
N/A 560.43 2550.432
13 Cattle + sheep + wolf population N/A 560.88 2550.882
14 Wolves killed + cattle + sheep +wolf population
N/A 562.41 2550.406
15 Wolves killed + cattle + sheep +wolf population
Wolves killed*cattle 564.33 2550.334
16 Wolves killed + cattle + sheep +wolf population
Wolves killed*sheep 553.78 2539.780
17 Wolves killed + cattle + sheep +wolf population
Wolves killed*wolf population 556.00 2542.004
18 Wolves killed + cattle + sheep +wolf population
Cattle*sheep 549.98 2535.978
19 Wolves killed + cattle + sheep +wolf population
Cattle*wolf population 563.62 2549.622
20 Wolves killed + cattle + sheep +wolf population
Sheep*wolf population 551.13 2537.127
21 Wolves killed + cattle + sheep +wolf population
Wolves killed*cattle, wolves killed*sheep 553.70 2537.698
22 Wolves killed + cattle + sheep +wolf population
Wolves killed*cattle, wolves killed*wolf population 557.64 2541.643
23 Wolves killed + cattle + sheep +wolf population
Wolves killed*cattle, cattle*sheep 548.16 2532.159
24 Wolves killed + cattle + sheep +wolf population
Wolves killed*cattle, cattle*wolf population 563.36 2547.355
25 Wolves killed + cattle + sheep +wolf population
Wolves killed*cattle, sheep*wolf population 548.38 2532.378
26 Wolves killed + cattle + sheep +wolf population
Wolves killed*sheep, wolves killed*wolf population 555.78 2539.778
27 Wolves killed + cattle + sheep +wolf population
Wolves killed*sheep, cattle*sheep 551.82 2535.819
28 Wolves killed + cattle + sheep +wolf population
Wolves killed*sheep, cattle*wolf population 554.61 2538.608
29 Wolves killed + cattle + sheep +wolf population
Wolves killed*sheep, sheep*wolf population 553.10 2537.099
30 Wolves killed + cattle + sheep +wolf population
Wolves killed*wolf population, cattle*sheep 551.38 2535.376
Wolf Mortality and Livestock
PLOS ONE | DOI:10.1371/journal.pone.0113505 December 3, 2014 8 / 16
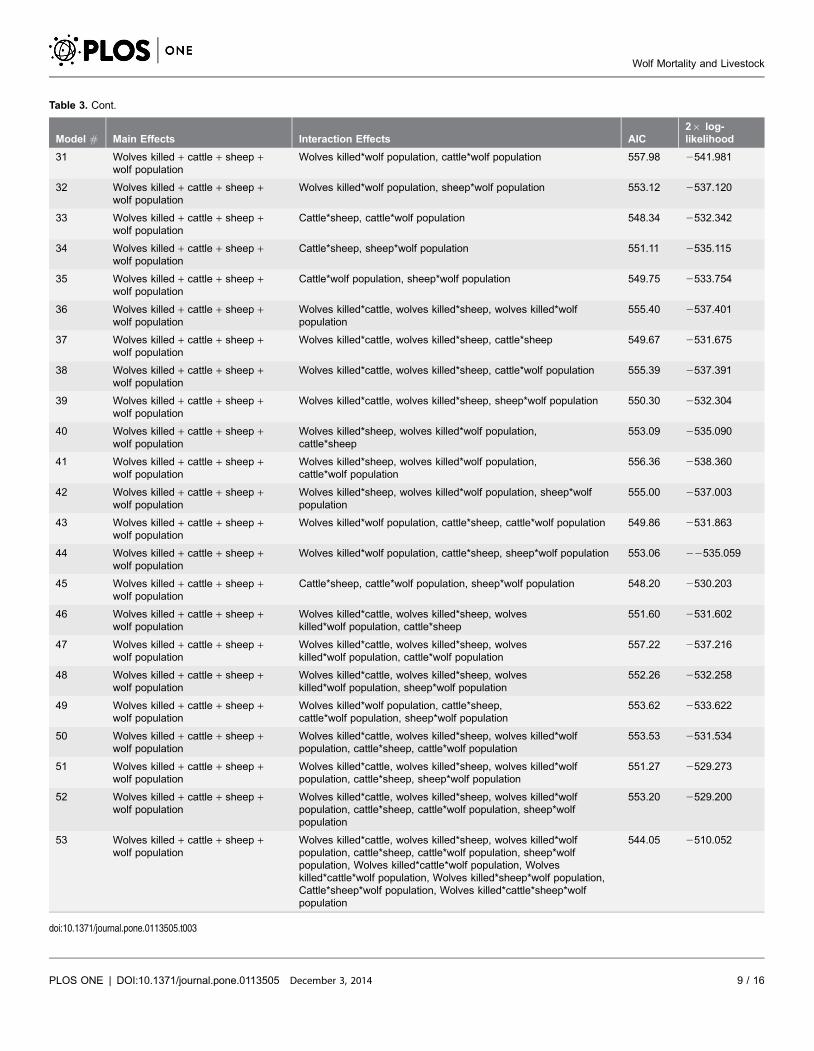
Table 3. Cont.
Model # Main Effects Interaction Effects AIC26 log-likelihood
31 Wolves killed + cattle + sheep +wolf population
Wolves killed*wolf population, cattle*wolf population 557.98 2541.981
32 Wolves killed + cattle + sheep +wolf population
Wolves killed*wolf population, sheep*wolf population 553.12 2537.120
33 Wolves killed + cattle + sheep +wolf population
Cattle*sheep, cattle*wolf population 548.34 2532.342
34 Wolves killed + cattle + sheep +wolf population
Cattle*sheep, sheep*wolf population 551.11 2535.115
35 Wolves killed + cattle + sheep +wolf population
Cattle*wolf population, sheep*wolf population 549.75 2533.754
36 Wolves killed + cattle + sheep +wolf population
Wolves killed*cattle, wolves killed*sheep, wolves killed*wolfpopulation
555.40 2537.401
37 Wolves killed + cattle + sheep +wolf population
Wolves killed*cattle, wolves killed*sheep, cattle*sheep 549.67 2531.675
38 Wolves killed + cattle + sheep +wolf population
Wolves killed*cattle, wolves killed*sheep, cattle*wolf population 555.39 2537.391
39 Wolves killed + cattle + sheep +wolf population
Wolves killed*cattle, wolves killed*sheep, sheep*wolf population 550.30 2532.304
40 Wolves killed + cattle + sheep +wolf population
Wolves killed*sheep, wolves killed*wolf population,cattle*sheep
553.09 2535.090
41 Wolves killed + cattle + sheep +wolf population
Wolves killed*sheep, wolves killed*wolf population,cattle*wolf population
556.36 2538.360
42 Wolves killed + cattle + sheep +wolf population
Wolves killed*sheep, wolves killed*wolf population, sheep*wolfpopulation
555.00 2537.003
43 Wolves killed + cattle + sheep +wolf population
Wolves killed*wolf population, cattle*sheep, cattle*wolf population 549.86 2531.863
44 Wolves killed + cattle + sheep +wolf population
Wolves killed*wolf population, cattle*sheep, sheep*wolf population 553.06 22535.059
45 Wolves killed + cattle + sheep +wolf population
Cattle*sheep, cattle*wolf population, sheep*wolf population 548.20 2530.203
46 Wolves killed + cattle + sheep +wolf population
Wolves killed*cattle, wolves killed*sheep, wolveskilled*wolf population, cattle*sheep
551.60 2531.602
47 Wolves killed + cattle + sheep +wolf population
Wolves killed*cattle, wolves killed*sheep, wolveskilled*wolf population, cattle*wolf population
557.22 2537.216
48 Wolves killed + cattle + sheep +wolf population
Wolves killed*cattle, wolves killed*sheep, wolveskilled*wolf population, sheep*wolf population
552.26 2532.258
49 Wolves killed + cattle + sheep +wolf population
Wolves killed*wolf population, cattle*sheep,cattle*wolf population, sheep*wolf population
553.62 2533.622
50 Wolves killed + cattle + sheep +wolf population
Wolves killed*cattle, wolves killed*sheep, wolves killed*wolfpopulation, cattle*sheep, cattle*wolf population
553.53 2531.534
51 Wolves killed + cattle + sheep +wolf population
Wolves killed*cattle, wolves killed*sheep, wolves killed*wolfpopulation, cattle*sheep, sheep*wolf population
551.27 2529.273
52 Wolves killed + cattle + sheep +wolf population
Wolves killed*cattle, wolves killed*sheep, wolves killed*wolfpopulation, cattle*sheep, cattle*wolf population, sheep*wolfpopulation
553.20 2529.200
53 Wolves killed + cattle + sheep +wolf population
Wolves killed*cattle, wolves killed*sheep, wolves killed*wolfpopulation, cattle*sheep, cattle*wolf population, sheep*wolfpopulation, Wolves killed*cattle*wolf population, Wolveskilled*cattle*wolf population, Wolves killed*sheep*wolf population,Cattle*sheep*wolf population, Wolves killed*cattle*sheep*wolfpopulation
544.05 2510.052
doi:10.1371/journal.pone.0113505.t003
Wolf Mortality and Livestock
PLOS ONE | DOI:10.1371/journal.pone.0113505 December 3, 2014 9 / 16
Minnesota where they found that across the state (large scale) none of their
correlations supported the hypothesis that killing a high number of wolves
reduced the following year’s depredations. Harper et al also found that trapping
and not catching wolves decreased depredations more than no trapping at all,
suggesting that a mere increase in human activity at depredation sites reduced
further depredations by those wolves in their study area. By contrast, Bjorge and
Gunson (1985) found reducing the population from 40 to 3 wolves in 2 years in
Alberta (a 10 fold reduction to near extirpation) resulted in a decline of livestock
depredations for two years - followed by subsequent recolonization and increased
depredations thereafter. Tompa (1983) also found that lethal control prevented
conflict for more than a year in some areas of British Columbia. It should be
noted that these 2 studies examined wolf control and livestock depredations at a
fine scale (grazing allotment or wolf pack territory or management zone). They
did not examine wolf control and livestock depredations at a larger scale (wolf
occupied areas) as was done by Harper et al. (2008) and us (this study). It appears
that wolf control is associated with reduced depredations at the local wolf pack
scale but increased depredations at the larger wolf population scale. This appears
consistent with Treves et al. (2005) prediction that the removal of carnivores
generally only achieves a temporary reduction in livestock depredations locally
when immigrants can rapidly fill the vacancies.
There were several different factors that influenced the number of livestock
depredated the following year by wolves. In order of importance, based on the
values of the rate ratios, these include: the number of wolves removed through
control methods, the number of breeding pairs, the minimum wolf population,
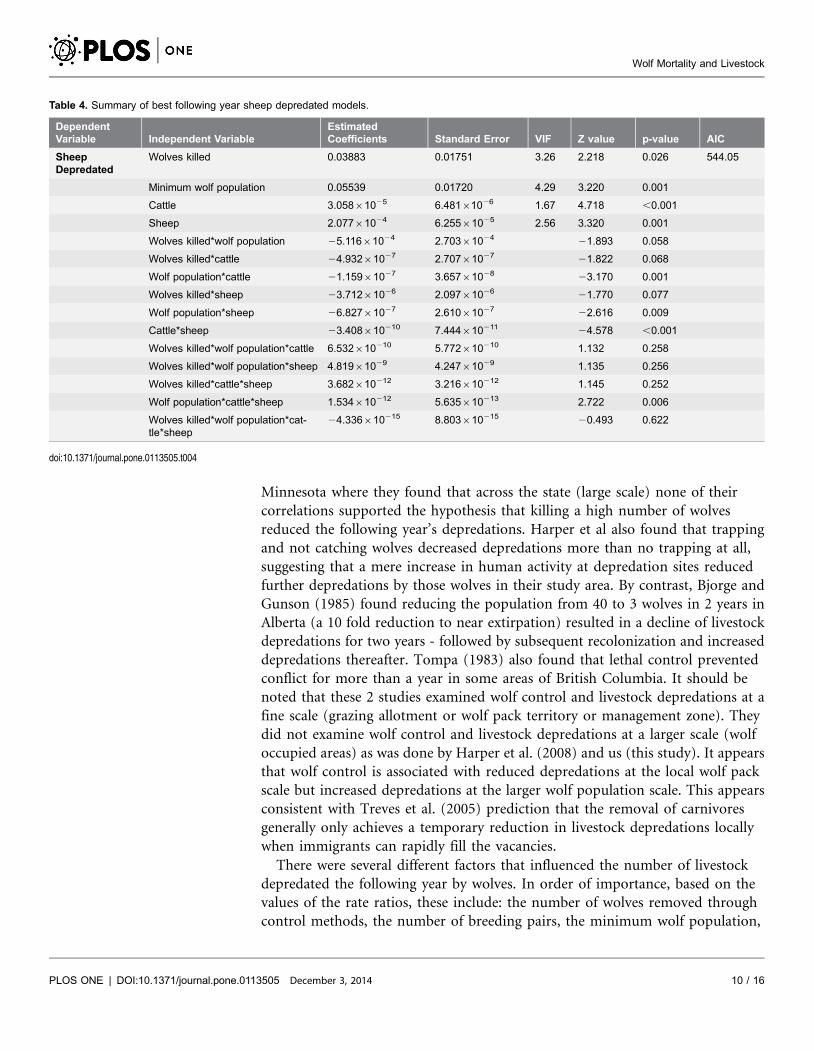
Table 4. Summary of best following year sheep depredated models.
DependentVariable Independent Variable
EstimatedCoefficients Standard Error VIF Z value p-value AIC
SheepDepredated
Wolves killed 0.03883 0.01751 3.26 2.218 0.026 544.05
Minimum wolf population 0.05539 0.01720 4.29 3.220 0.001
Cattle 3.05861025 6.48161026 1.67 4.718 ,0.001
Sheep 2.07761024 6.25561025 2.56 3.320 0.001
Wolves killed*wolf population 25.11661024 2.70361024 21.893 0.058
Wolves killed*cattle 24.93261027 2.70761027 21.822 0.068
Wolf population*cattle 21.15961027 3.65761028 23.170 0.001
Wolves killed*sheep 23.71261026 2.09761026 21.770 0.077
Wolf population*sheep 26.82761027 2.61061027 22.616 0.009
Cattle*sheep 23.408610210 7.444610211 24.578 ,0.001
Wolves killed*wolf population*cattle 6.532610210 5.772610210 1.132 0.258
Wolves killed*wolf population*sheep 4.81961029 4.24761029 1.135 0.256
Wolves killed*cattle*sheep 3.682610212 3.216610212 1.145 0.252
Wolf population*cattle*sheep 1.534610212 5.635610213 2.722 0.006
Wolves killed*wolf population*cat-tle*sheep
24.336610215 8.803610215 20.493 0.622
doi:10.1371/journal.pone.0113505.t004
Wolf Mortality and Livestock
PLOS ONE | DOI:10.1371/journal.pone.0113505 December 3, 2014 10 / 16
and the number of livestock on the landscape. Consistent with expectations, each
additional breeding pair on the landscape increased the expected mean number of
cattle depredated by 8 to 9% and each additional wolf on the landscape increased
the expected mean number of sheep depredated by 6%. Cattle were most affected
by breeding pairs and sheep by wolves – perhaps because it takes more than one
wolf (a pack) to kill a relatively larger cow and only one wolf to kill a smaller
sheep. However, contrary to the ‘‘remedial control’’ hypothesis, each additional
wolf killed increased the expected mean number of livestock depredated by 5–6%
for cattle and 4% for sheep. It appears that lethal wolf control to reduce the
number of livestock depredated is associated with increased, not decreased,
depredations the following year, on a large scale – at least until wolf mortality
exceeds 25%. Why 25%? The observed mean intrinsic growth rate of wolves in
Idaho, Wyoming, and Montana is about 25% [21]. Therefore, once anthropogenic
mortality exceeds 25%, the numbers of breeding pairs and wolves must decline –
resulting in fewer livestock depredations.
Below 25% mortality, lethal control may increase breeding pairs and wolves
through social disruption and compensatory, density dependent effects. For
example, wolf control efforts occur year round and often peak during grazing
Figure 4. Wolves killed vs sheep depredated. Number of wolves killed through control methods the previous year versus the number of sheep depredatedthe following year. The dashed lines show the upper and lower limits of the 95% confidence interval for the best fit line.
doi:10.1371/journal.pone.0113505.g004
Wolf Mortality and Livestock
PLOS ONE | DOI:10.1371/journal.pone.0113505 December 3, 2014 11 / 16
season in areas with livestock depredations [22, 23]. However, if control takes
place during the breeding season and a member of the breeding pair is removed it
may lead to pack instability and increased breeding pairs [24, 10]. Furthermore,
loss of a breeder in a pack during or near breeding season can result in dissolution
of territorial social groups, smaller pack sizes and compensatory density
dependent effects – such as increased per-capita reproduction [11, 25, 26]. Culling
of wolves may also cause frequent breeder turnover [11] and related social
disruption – which can result in reduced effective prey use (through loss of
knowledge of prey sources and ability to subdue prey) which may also result in
increased livestock depredations [27, 28]. All of these effects could potentially
result in increased livestock depredations.
We would expect to see increased depredations, wolves killed, and breeding
pairs as the wolf population grows and recolonizes the area - but our data suggest
that lethal control exacerbates these increases. The secondary effects of time, wolf
population growth rate, wolf occupied area, and wolf population size on
depredations were already subsumed in the primary main effect terms of breeding
pairs (cattle) and wolves (sheep), so those secondary effects cannot account for
Figure 5. Minimum wolf population vs sheep depredated. Minimum year end wolf population the previous year versus the number of sheep depredatedthe following year. The dashed lines show the upper and lower limits of the 95% confidence interval for the best fit line.
doi:10.1371/journal.pone.0113505.g005
Wolf Mortality and Livestock
PLOS ONE | DOI:10.1371/journal.pone.0113505 December 3, 2014 12 / 16
the positive effects of wolf kills on depredations. We do not yet know the exact
mechanism of how increased wolf mortality up to #25% results in increased
livestock depredations, but we do know that increased mortality is associated with
compensatory increased breeding pairs, compensatory numbers of wolves, and
depredations [24, 10, 27, 28, 11, 26]. Further research is needed to determine the
exact causal mechanism(s). Annual mortality in excess of 25% will reduce future
depredations, but that mortality rate is unsustainable and cannot be carried out
indefinitely if federal relisting of wolves is to be avoided. Furthermore, a 5%
(sheep) and 5% (cattle) kill rate of wolves yields the same number of cattle and
sheep depredations as a 35% (cattle) and 30% (sheep) kill rate (Figures 3 & 6), but
the 30% or 35% rate is unsustainable for wolf population persistence and the 5%
rate is not. The worst possible case appears to be a high mortality rate at about 20–
25%, since this corresponds to a ‘‘standing wave’’ of the highest livestock
depredations. Further research is needed to test if this high level of anthropogenic
wolf mortality (25%) is associated with high levels of predation on natural prey
such as deer and elk.
Figure 6. Proportion of wolves controlled versus the number of sheep depredated. Proportions of wolves killed through control methods the previousyear versus the number of sheep depredated the following year. The dashed lines show the upper and lower limits of the 95% confidence interval for the bestfit line.
doi:10.1371/journal.pone.0113505.g006
Wolf Mortality and Livestock
PLOS ONE | DOI:10.1371/journal.pone.0113505 December 3, 2014 13 / 16
Further research is also needed to account for the limitations of our data set.
The scale of our analysis was large (wolf occupied areas in each state in each year)
and the scale of some other studies were small (wolf packs). Simultaneous, multi-
scale analysis (individual wolf packs, wolf management zones, and wolf occupied
areas) may yield further insights.
Although lethal control is sometimes a necessary management tool in the near-
term, we suggest that managers also consider testing non-lethal methods of wolf
control [29] because these methods might not be associated with increased
depredations in the long-term.
Supporting Information
Figure S1. Proportion of wolves harvested vs cattle depredated. Proportion of
wolves harvested the previous year in each state (Montana, Idaho and Wyoming)
versus the number of cattle depredated the following year.
doi:10.1371/journal.pone.0113505.s001 (TIF)
Figure S2. Proportion of wolves harvested vs sheep depredated. Proportion of
wolves harvested the previous year in each state (Montana, Idaho and Wyoming)
versus the number of sheep depredated the following year.
doi:10.1371/journal.pone.0113505.s002 (TIF)
Table S1. Data by state, 1987–2012. Data for all variables used in the analysis
grouped by state from 1987–2012.
doi:10.1371/journal.pone.0113505.s003 (DOCX)
Table S2. Pearson correlation matrix. Pearson correlation matrix for
independent variables: cattle, sheep, minimum wolf population, wolves harvested
and number of breeding pairs.
doi:10.1371/journal.pone.0113505.s004 (DOCX)
Acknowledgments
This analysis and paper benefitted from the insights and comments of Hilary
Cooley (U.S. Fish and Wildlife Service), and John Pierce, Donny Martorello, Brian
Kertsen, Ben Maletzke, and Stephanie Simick (Washington Department of Fish
and Wildlife).
Author ContributionsConceived and designed the experiments: RBW KAP. Performed the experiments:
RBW KAP. Analyzed the data: RBW KAP. Contributed reagents/materials/analysis
tools: RBW KAP. Wrote the paper: RBW KAP.
Wolf Mortality and Livestock
PLOS ONE | DOI:10.1371/journal.pone.0113505 December 3, 2014 14 / 16
References
1. Zimmerman B, Wabbakken P, Dotterer M (2003) Brown bear – livestock conflicts in a bearconservation zone in Norway: are cattle a good alternative to sheep? Ursus 14 (1): 72–83.
2. Creel S, Rotella JJ (2010) Meta-Analysis of Relationships between Human Offtake Total Mortality andPopulation Dynamics of Gray Wolves (Canis lupus). PloS ONE doi:10.1371/journal.pone.0012918.
3. Lambert C, Wielgus RB, Robinson HS, Katnik DD, Cruickshank HS, et al. (2006) Cougar populationdynamics and viability in the Pacific Northwest. Journal of Wildlife Management 70: 246–254.
4. Rabinowitz A (2005) Jaguars and livestock: living with the world’s third largest cat. People and wildlife:conflict or coexistence. Cambridge University Press, The Zoological Society of London. Pages, 278–285.
5. Packer C, Kosmala M, Cooley HS, Brink H, Pintea L, et al. (2009) Sport hunting, predator control andconservation of large carnivores. PloS ONE 4(6): e5941.
6. Balme GA, Batchelor A, De Woronin Britz N, Seymour G, Grover M, et al. (2012) Reproductivesuccess of female leopards Panthera pardus: the importance of top-down processes. Mammal Reviewdoi: 10.1111/j. 1365-2907.2012.00219.x.
7. Treves A (2009) Hunting for large carnivore conservation. Journal of Applied Ecology 46: 1350–1356.
8. U.S. Fish and Wildlife Service, Idaho Department of Fish and Game, Montana Fish Wildlife &Parks, Nez Perce Tribe, National Park Service, et al. (2012) Northern Rocky Mountain Wolf RecoveryProgram 2011 Interagency Annual Report. M.D. Jimenez and S.A. Becker, eds. USFWS, EcologicalServices, 585 Shepard Way, Helena, Montana, 59601.
9. Bradley EH, Pletscher DH (2005) Assessing factors related to wolf depredation of cattle in fencedpastures in Montana and Idaho. Wildlife Society Bulletin 33: 1256–1265.
10. Mech LD (2010) Consideration for developing wolf harvesting regulations in the contiguous UnitedStates. Journal of Wildlife Management 74: 1421–1424.
11. Brainerd SM, Andren H, Bangs EE, Bradley EH, Fontaine JA, et al. (2008) The effects of breeder losson wolves. Journal of Wildlife Management 72: 89–98.
12. Collins GH, Wielgus RB, Koehler GM (2002) Effects of sex and age on American black bear coniferdamage and control. Ursus 13: 231–236.
13. Treves A, Kapp KJ, MacFarland D (2010) American black bear nuisance complaints and hunter take.Ursus 21(I): 30–42.
14. Peebles KA, Wielgus RB, Maletzke BT, Swanson ME (2013) Effects of remedial sport hunting oncougar complaints and livestock depredations. PloS ONE. DOI: 10.1371/journal.pone.0079713.
15. Biondi F (2014) Paleoecology grand challenge. Frontiers in Ecology and Evolution DOI: 10.3389/fevo.2014.00050.
16. U.S. Fish and Wildlife Service, Idaho Department of Fish and Game, Montana Fish Wildlife &Parks, Nez Perce Tribe, National Park Service, et al. (2013) Northern Rocky Mountain Wolf RecoveryProgram 2012 Interagency Annual Report. M.D. Jimenez, and, S.A. Becker, , eds. USFWS, EcologicalServices, 585 Shepard Way, Helena, Montana, 59601.
17. United States Department of Agriculture (2012) Washington Livestock Statistics. National AgriculturalStatistics Service, U.S. Department of Agriculture, Washington D.C., USA.
18. Agresti A (1996) An introduction to categorical data analysis. John Wiley and Sons, New York.
19. Burnham KP, Anderson DR (2010) Model Selection and multimodel inference: a practical information-theoretic approach. Springer, New York.
20. Mostellar F (1968) Association and estimation in contingency tables. Journal of American StatisticalAssociation 63: 1–28.
21. Wiles GJ, Allen HL, Hayes GE (2011) Wolf conservation and management plan for Washington.Washington Department of Fish and Wildlife, Olympia, Washington.
22. Musiani M, Mamo C, Boitani L, Callaghan C, Gates CC, et al. (2003) Wolf depredation trends and theuse of fladry barriers to protect livestock in western North America. Conservation Biology 17: 1538–1547.
Wolf Mortality and Livestock
PLOS ONE | DOI:10.1371/journal.pone.0113505 December 3, 2014 15 / 16
23. Fritts SH, Stephenson RO, Hayes RD, Boitani L (2003) Wolves and humans. Wolves: behavior,ecology, and conservation. The University of Chicago Press, Chicago. pp. 289–316.
24. Haber GC (1996) Biological, conservation, and ethical implications of exploiting and controlling wolves.Conservation Biology 10: 1068–1081.
25. VonHoldt BM, Stahler DR, Smith DW, Earl DA, Pollinger JP, et al. (2008) The genealogy and geneticvariability of reintroduced Yellowstone grey wolves. Molecular Ecology 17: 252–274.
26. Murray DL, Smith DW, Bangs EE, Mack C, Oakleaf JK, et al. (2010) Death from anthropogenic causesis partially compensatory in recovering wolf populations. Biological Conservation 143(11): 2514–2524.
27. Sand H, Wikenros C, Wabakken P, Liberg O (2006) Effects of hunting on group size snow depth andage on the success of wolves hunting moose. Animal Behavior 72: 781–789.
28. Stahler DR, Smith DW, Guernsey DS (2006) Foraging and feeding ecology of the gray wolf (Canislupus): lessons from Yellowstone national park, Wyoming, USA. Journal of Wildlife Nutrition 36: 1923s.
29. Wielgus RB (2014) Minimizing and mitigating wolf/livestock conflicts in Washington. Statement of Work.Washington State University. College of Agriculture, Human, and Natural Resource Sciences. 10 pp.
Wolf Mortality and Livestock
PLOS ONE | DOI:10.1371/journal.pone.0113505 December 3, 2014 16 / 16