research article drying of malaysian capsicum annuum l...
TRANSCRIPT
Hindawi Publishing CorporationInternational Journal of PhotoenergyVolume 2013, Article ID 167895, 9 pageshttp://dx.doi.org/10.1155/2013/167895
Research ArticleDrying of Malaysian Capsicum annuum L. (Red Chili) Dried byOpen and Solar Drying
Ahmad Fudholi, Mohd Yusof Othman, Mohd Hafidz Ruslan,and Kamaruzzaman Sopian
Solar Energy Research Institute, Universiti Kebangsaan Malaysia, 43600 Bangi, Selangor, Malaysia
Correspondence should be addressed to Ahmad Fudholi; [email protected]
Received 28 September 2012; Accepted 7 January 2013
Academic Editor: Sih-Li Chen
Copyright © 2013 Ahmad Fudholi et al.This is an open access article distributed under the Creative CommonsAttribution License,which permits unrestricted use, distribution, and reproduction in any medium, provided the original work is properly cited.
This study evaluated the performance of solar drying in theMalaysian red chili (Capsicum annuum L.). Red chilies were dried downfrom approximately 80% (wb) to 10% (wb) moisture content within 33 h. The drying process was conducted during the day, andit was compared with 65 h of open sun drying. Solar drying yielded a 49% saving in drying time compared with open sun drying.At the average solar radiation of 420W/m2 and air flow rate of 0.07 kg/s, the collector, drying system, and pickup demonstratedefficiency rates of approximately 28%, 13%, and 45%, respectively. Evaporative capacity ranged from 0.13 to 2.36 kg/h, with anaverage of 0.97 kg/h. The specific moisture extraction rate (SMER) of 0.19 kg/kWh was obtained. Moreover, the drying kineticsof C. annuum L. were investigated. A nonlinear regression procedure was used to fit three drying models. These models werecompared with experimental data on red chilies dried by open sun drying and those dried by solar drying. The fit quality of themodels was evaluated using their coefficient of determination (𝑅2), mean bias error, and root-mean-square error values. The Pagemodel resulted in the highest 𝑅2 and the lowest mean bias and root-mean-square errors.
1. Introduction
In subtropical and tropical countries, a name such as red chili(Capsicum annuum L.) is no stranger to the subject, and wasa compulsory course in the kitchen. It is a main ingredientin all cooking, as it has high nutritional value. For Malaysianred chili, it was found to be very nutritious, with high vitaminC (175mg/100 g), calcium (15mg/100 g), fiber (4.8%), protein(2.8%), iron (1.8mg/100 g), ash (0.9mg/100 g), and lipids(0.7mg/100 g), as shown in Table 1 [1]. The use of red chiliis not just for adding food palatability because there are anumber of studies that have shown that it is very beneficialfor human health. Furthermore, red chili is a good sourceof antioxidants, being rich in vitamins A and C, minerals,and other phytochemicals, which are an important source ofnutrients in the human diet. For contain nutritious of severalred chili (Capsicum annuum) varieties was reported [2, 3].
Traditionally, red chili is dried directly under the sun.Direct sun drying requires an area with a large, open spaceand long drying times. It is highly dependent on the avail-ability of sunshine and is susceptible to contamination with
foreign materials and insect and fungal infestations, whichthrive inmoist conditions, rendering red chili unusable.Mostagricultural and marine products require drying to preservethe quality of the final product; however, the traditionalmethod of direct sun drying results in low-quality products.As an alternative to open sun drying, solar drying is oneof the most attractive and promising applications of solarenergy systems. It uses renewable and environment-friendlytechnology and is economically viable in most developingcountries. Much recent research has reported on solar dryingof agricultural fruits and vegetables. Thin-layer drying mod-els have also beenwidely used to analyze the drying of variousagricultural [4–11] and marine [12–14] products.
Fudholi et al. [15] reviewed various types of solar dryingsystems for agricultural and marine products. They reportedthat the moisture content of fresh chili decreased from80% to 5% under solar drying in 48 h. Several studies havespecifically investigated solar drying systems for red chili.Janjai et al. [16] reported the use of a solar greenhouse dryerfor the commercial drying of 1000 kg of fruits or vegetables
2 International Journal of Photoenergy
Table 1: Concentration of elements (mg/100 g wet weight) [1].
Foodstuffs Vitamin C (mg/100 g) Ca (mg/100 g) Fe (mg/100 g) Ash (mg/100 g) Lipids (%) Protein (%) Fiber (%)Red chilli 175.0 15.0 1.8 0.9 0.7 2.8 4.8Seaweed (G. changii) 28.5 651.0 95.6 22.7 3.3 6.9 24.7Green bean sprouts 14.1 25.0 1.7 0.3 0.2 2.6 0.7Soya beans, white 7.5 200.0 6.0 4.8 18.9 33.8 5.5Peas (green, canned) 8.1 25.0 1.9 1.3 0.4 3.4 2.7Red spinach 48.3 120.0 4.0 1.8 0.3 2.8 1.5Carrots 9.5 140.0 0.8 0.8 0.1 1.0 1.1Broccoli 85.0 40.0 0.7 0.8 0.1 4.1 1.0Lettuce 27.6 50.0 1.5 0.7 0.1 1.2 0.5Tomato 25.8 12.0 0.8 0.6 0.2 1.4 0.5Red pumpkin 36.5 21 0.7 0.4 0.1 0.9 0.3Cabbage 53.0 40 0.6 0.8 0.2 1.6 0.9
in Champasak, Lao People’s Democratic Republic. Drying of300 kg of red chili in this dryer reduced its moisture contentfrom approximately 75% to 15% in 3 days, and the paybackperiod was estimated to be 2.5 years. They also reportedon six units of greenhouse dryers installed at agroindustrialsites in Thailand between 2008 and 2009. Kaewkiew et al.[17] investigated the performance of a large-scale greenhousedryer for drying red chili in Thailand. Drying of 500 kg ofred chili using this dryer reduced its moisture content fromapproximately 74% to 9% in 3 days, and the payback periodwas estimated to be 2 years. Furthermore, Lhendup [18]conducted a technical and economic performance analysisof solar drying red chili in Bhutan. Hossain and Bala [19]studied a mixed-mode forced convection solar tunnel dryerfor drying red chili in Bangladesh, whereas a simulationmodel was used to evaluate its technical and economicalperformance [20]. Banout et al. [21] compared the use of adouble-pass solar dryer with a cabinet dryer and open sundrying of red chili in central Vietnam. Drying approximately40 kg of red chili using the double-pass solar dryer reducedits moisture content from approximately 90% to 10% in 32 h(including nights), and the payback period was estimated tobe 3.26 years. To our best knowledge, limited informationon the performance indices of red chili is currently availableand studies on the drying kinetics of Malaysian red chiliunder a solar drying system have not been reported in theliterature. The present study was performed using a double-pass solar collector with a finned absorber. Experiments wereconducted to select the best mathematical model to illustratethe drying behaviors of Malaysian red chili dried by opensun drying and that subjected to solar drying.This study alsoinvestigated performance indices (drying efficiency, pick-upefficiency, and evaporative capacity).
2. Material and Methods
2.1. Material. Samples of the Malaysian red chili (C. annuumL.), also known as cili bangi, were obtained from the farm ofthe Universiti Kebangsaan Malaysia, Selangor, Malaysia. Ineach experiment, 0.4 kg of fresh red chili was used. About0.4 kg red chili was taken and kept in an oven dried, which
was maintained at 120 ± 1∘C until constant weigh has
reached. The initial and final masses of the red chili wererecorded with the help of electronic balance. The procedurewas repeated for every 1 h interval till the end of drying.Theiraverage moisture content was found to be 80.2% (wb).
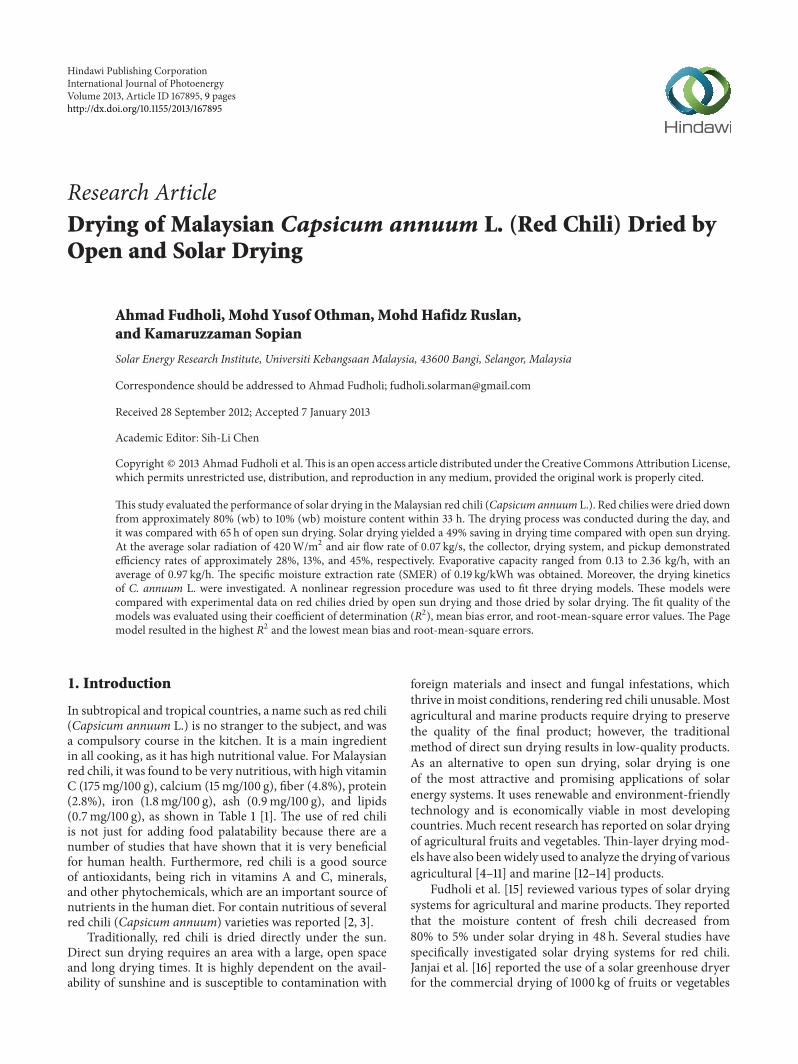
2.2. Solar Drying. A solar drying unit was installed atthe Green Energy Technology Innovation Park, UniversitiKebangsaan Malaysia, in 2010. The drying system was classi-fied to be of the forced convection indirect type. A schematicdiagram of the solar dryer is shown in Figure 1. The solardrying consists of an auxiliary heater, a blower, a dryingchamber, and a double-pass solar collector. The collectorwidth and length were 1.2m and 4.8m, respectively. Thesolar collector array consisted of four solar collectors. Theupper channel depth was 3.5 cm, whereas the lower depthmeasured 7 cm. The bottom and sides of the collector wereinsulated with 2.5 cm thick fiber glass to minimize heat loss.The collector consisted of a glass cover, an insulator, and ablack painted aluminumabsorber. It was 1.2mwide and 4.8mlong. In this type of collector, the air initially enters through achannel formed by the glass covering the absorber plate andthen through a second channel formed by the back plate andfinned absorber plate.The chambermeasured 2.4m in length,1m width, and 0.6m in height.
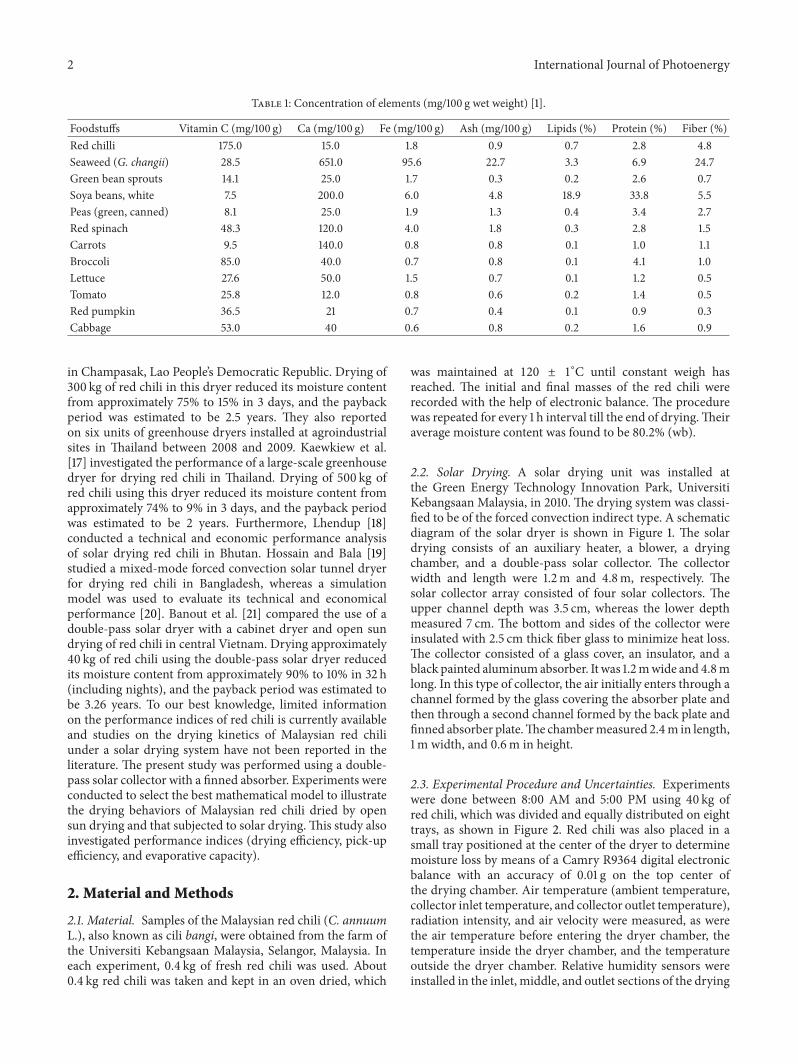
2.3. Experimental Procedure and Uncertainties. Experimentswere done between 8:00 AM and 5:00 PM using 40 kg ofred chili, which was divided and equally distributed on eighttrays, as shown in Figure 2. Red chili was also placed in asmall tray positioned at the center of the dryer to determinemoisture loss by means of a Camry R9364 digital electronicbalance with an accuracy of 0.01 g on the top center ofthe drying chamber. Air temperature (ambient temperature,collector inlet temperature, and collector outlet temperature),radiation intensity, and air velocity were measured, as werethe air temperature before entering the dryer chamber, thetemperature inside the dryer chamber, and the temperatureoutside the dryer chamber. Relative humidity sensors wereinstalled in the inlet, middle, and outlet sections of the drying
International Journal of Photoenergy 3
0.1m
0.6m
0.4m0.7m
1m
1.5m
1.5m
4.8m
0.6m
Air inletDouble-pass solar collectorwith finned absorber
Dryingchamber
Blower
Auxiliaryheater
0.3m
0.2m
15∘
Figure 1: The schematic of a solar drying.
Figure 2: Photograph of Malaysian red chili in drying chamber.
chamber. An air flow DTA 4000 anemometer to determinethe air flow velocity in the solar collector was used. T-typethermocouples with an accuracy of 0.018∘C and an LI-200pyranometer with 1% accuracy were used. During the dryingprocess, the temperature and relative humidity in the solardryerwere recorded at 1min intervals during the experimentswith the ADAM Data Acquisition System connected to acomputer. Data were averaged for 30min prior to analysis.Experimental uncertainties analysis was presented in Table 2.
During the measurements of the parameters, the uncer-tainties that occurred were shown in Table 2. Uncertaintiesestimation is calculated by El-Sebaii et al. [22]
𝑋𝑅= [(𝑥1)2
+ (𝑥2)2
+ ⋅ ⋅ ⋅ (𝑥𝑛)2
]1/2
, (1)
where𝑋𝑅: uncertainty in result and 𝑥
1, 𝑥2. . . 𝑥𝑛: uncertainty
in the independent variables.
2.4. Estimation of Performances Index. The thermal efficiencyof a solar collector is the ratio of useful heat gain to the solarradiation incident on the plane of the collector. It is definedas follows:
𝜂𝑐=𝑚𝐶 (𝑇
𝑜− 𝑇𝑖)
𝐴𝑐𝑆
× 100%, (2)
where𝑚: mass flow rate (kg/s),𝐶: specific heat of air (J/kg∘C),𝐴𝑐: collector area (m2), 𝑇
𝑖: inlet air temperature (∘C), 𝑇
𝑜:
outlet air temperature (∘C), and 𝑆: solar radiation intensity(W/m2).
System drying efficiency is defined as the ratio of energyrequired to evaporate moisture to the heat supplied to thedryer. For the solar collector, the heat supplied to the dryeris the solar radiation incident upon the solar collector. Thesystem drying efficiency is a measure of the overall effective-ness of a drying system. For forced convection dryers, typicalvalues are expected. Calculation of the system efficiency forforced convection solar dryers should take into account theenergy consumedby the fan/blower.The following expressioncan then be used [23]:
𝜂𝑝=
𝑊𝐿
𝐴𝑐𝑆 + 𝑃𝑓
, (3)
where 𝐿: latent heat of vaporization of water at exit airtemperature (J/kg), 𝑊: mass of water evaporated from theproduct (kg), and 𝑃
𝑓: power fan (W).
The mass of water removed (𝑊) from a wet product canbe calculated as follows [24]:
𝑊 =
𝑚𝑜(𝑀𝑖−𝑀𝑓)
100 −𝑀𝑓
, (4)
where 𝑚𝑜: initial total crop mass (kg), 𝑀
𝑖: initial moisture
content fraction on wet basis, and 𝑀𝑓: the final moisture
content fraction on wet basis.Pick-up efficiency determines the efficiency of moisture
removal by the drying air from the product [25], expressed as
𝜂𝑝=ℎ0− ℎ𝑖
ℎas − ℎ𝑖=
𝑊
𝑣𝜌𝑡 (ℎas − ℎ𝑖), (5)
where ℎ𝑜: absolute humidity of air leaving the drying chamber
(%), ℎ𝑖: absolute humidity of air entering the drying chamber
(%), ℎas: absolute humidity of the air entering the dryer atthe point of adiabatic saturation (%), 𝑣: volumetric airflow(m3/s), 𝜌: density of air (kg/m3), and 𝑡: drying time (s).
Evaporative capacity was used in this study as a per-formance index for solar dryers according to Jannot andCoulibaly [26]. It is the weight of water that can be extractedby the air flow from the products to be dried, defined asfollows:
𝐸 = 𝑚da (𝑋2𝑚 − 𝑋𝑎) , (6)
where 𝐸: evaporative capacity (kg/h), 𝑚da: mass flow rate ofdry air (kg/s), 𝑋
2𝑚: dryer outlet absolute humidity, and 𝑋
𝑎:
ambient absolute humidity.Desai et al. [27] evaluated time savings in drying chili
using solar drying compared with open sun drying. Theperformance of solar drying compared with open sun dryingwas calculated using the following equation:
Saving in drying time (%) =𝑡OS − 𝑡SD𝑡OS
× 100, (7)
where 𝑡OS: time taken for drying the product in open sun (h)and 𝑡SD: time taken for drying in solar drying (h).
4 International Journal of Photoenergy
The specific moisture extraction rate (SMER), which isthe energy required for removing one kg of water, SMERwas calculated using (8) as reported by Shanmugam andNatarajan [28]
SMER =𝑊
𝑃𝑡
, (8)
where SMER: specific moisture extraction rate (kg/kWh),𝑊:mass of water evaporated from the product (kg), and 𝑃
𝑡: total
energy input to the dryer (kWh).
2.5. Mathematical Modeling of Drying Curves. Moisture con-tentwas expressed as percentagewet basis and then convertedto grams of water per gram of dry matter. The experimentaldrying data for red chili were fitted to exponential thin-layer drying models using nonlinear regression analysis. Themoisture ratio (MR) can be calculated as
MR =𝑀 −𝑀
𝑒
𝑀𝑖−𝑀𝑒
, (9)
where𝑀: the moisture content at any time 𝑡,𝑀𝑒: equilibrium
moisture content, and 𝑀𝑖: initial moisture content with all
expresses in dry basis. The moisture content dry basis is
𝑀 =𝑤 (𝑡) − 𝑑
𝑑, (10)
where𝑤(𝑡): mass of wetmaterials at instant 𝑡 (kg) and 𝑑: massof dry materials (kg).
The drying rate (DR) is expressed as the amount ofevaporated moisture over time. It is defined as follows [29]:
DR =𝑀𝑡+𝑑𝑡
−𝑀𝑡
𝑑𝑡, (11)
where 𝑀𝑡: moisture content at time 𝑡 and 𝑀
𝑡+𝑑𝑡: moisture
content at time 𝑡 + 𝑑𝑡.This study used the coefficient of determination (𝑅2)
as one of the primary criteria for selecting the best modelfor comparison with the experimental data. In addition to𝑅2, mean bias error (MBE) and root-mean-square error
(RMSE) were used to analyze the relative goodness of fit. Themodel with the highest coefficient of determination and thelowest RMSE was selected as the best model describing thedrying behavior of red chili [30–34]. This parameter can becalculated as follows:
MBE = 1
𝑁
𝑁
∑
𝑖=1
(MRpre,𝑖 −MRexp,𝑖)2
,
RMSE = [ 1𝑁
𝑁
∑
𝑖=1
(MRpre,𝑖 −MRexp,𝑖)2
]
1/2
,
(12)
where MRexp,𝑖: experimental value of moisture ratio, MRpre,𝑖:simulated value of moisture ratio, and 𝑁: number of datapoints (observations).
0200400600800
1000
9:30
11:3
013
:30
15:3
09:
3011
:30
13:3
015
:30
9:30
11:3
013
:30
15:3
09:
3011
:30
13:3
010
:30
12:3
0
Time of the day
Sola
r rad
iatio
n (W
/m2)
020406080100
Tem
pera
ture
, hum
idity
(∘C,
%)
Solar radiation
Temperature chamberTemperature ambientHumidity chamberHumidity ambient
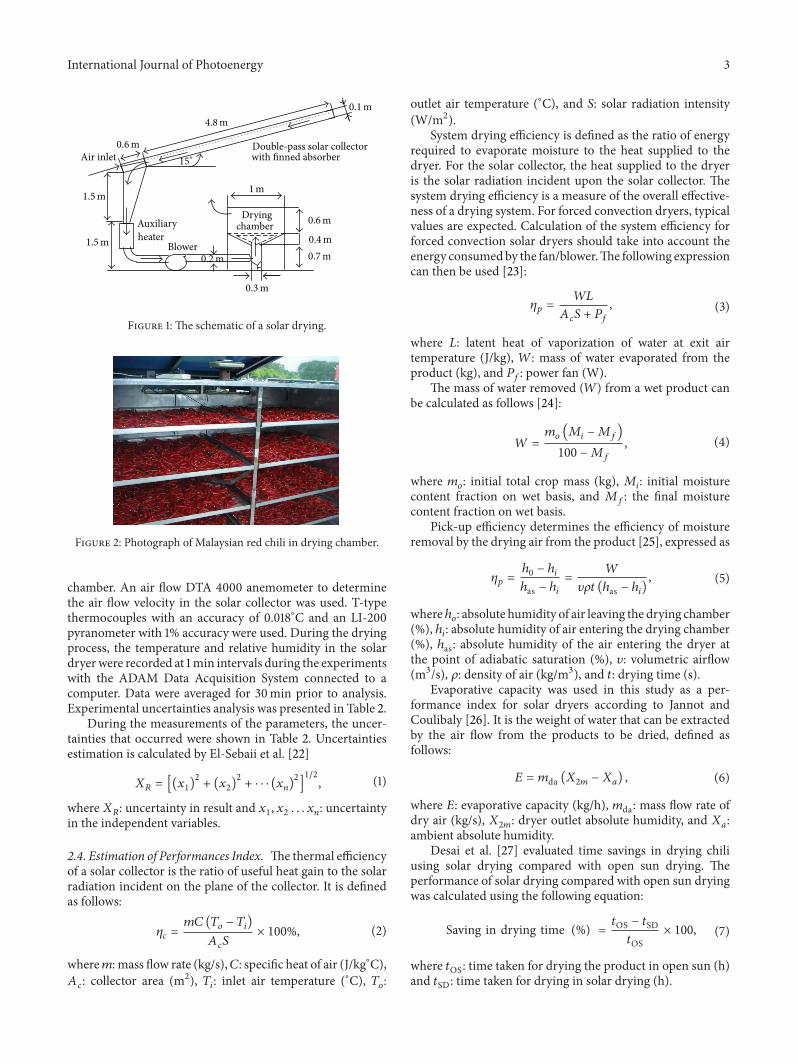
Figure 3: Temperatures (ambient and chamber), relative humidityof chamber, ambient humidity, and solar radiation on March 16,2012, to March 20, 2012.
3. Results and Discussion
3.1. Performances Index. The drying process was conductedonly from 9:00 AM to 5:00 PM. During the night, the solardryer was shut down. Drying continued until the next day,and the process was repeated until the required equilibriummoisture content was reached.
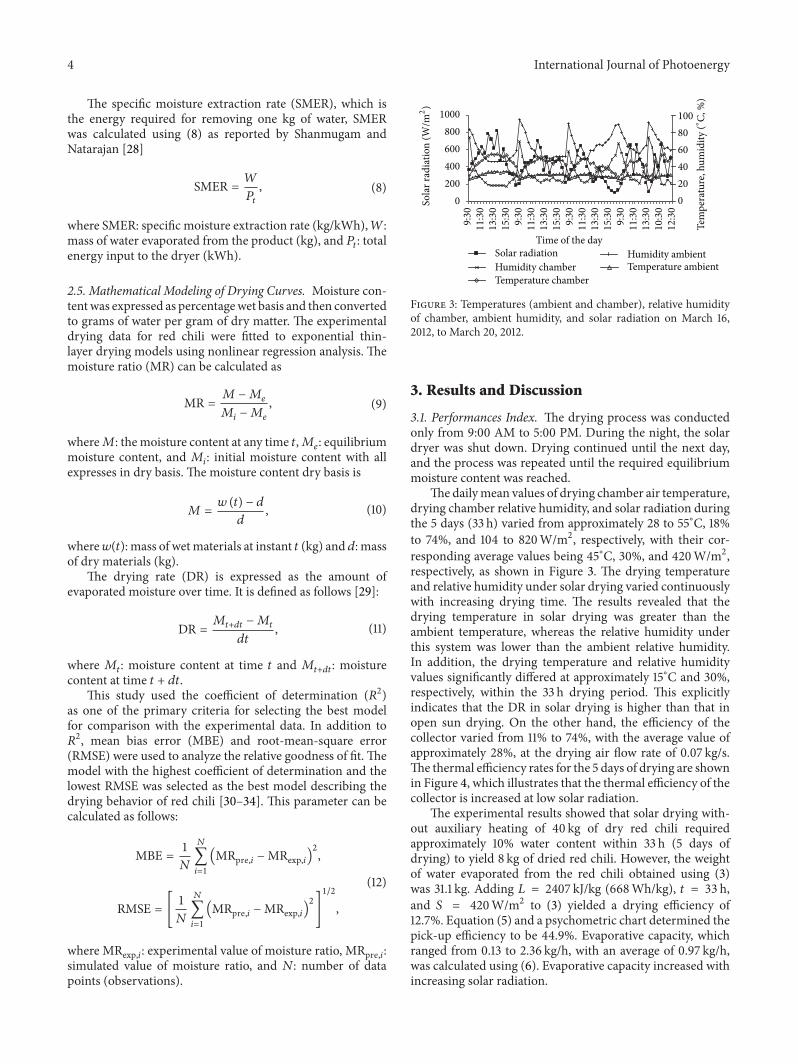
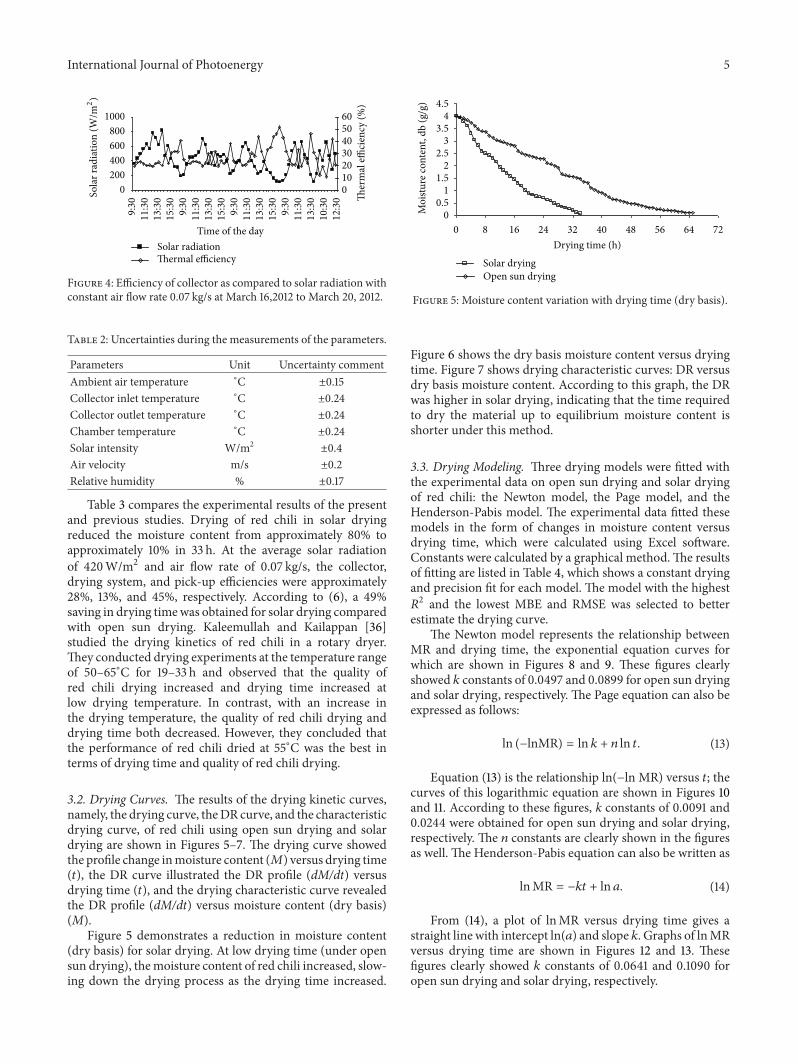
The dailymean values of drying chamber air temperature,drying chamber relative humidity, and solar radiation duringthe 5 days (33 h) varied from approximately 28 to 55∘C, 18%to 74%, and 104 to 820W/m2, respectively, with their cor-responding average values being 45∘C, 30%, and 420W/m2,respectively, as shown in Figure 3. The drying temperatureand relative humidity under solar drying varied continuouslywith increasing drying time. The results revealed that thedrying temperature in solar drying was greater than theambient temperature, whereas the relative humidity underthis system was lower than the ambient relative humidity.In addition, the drying temperature and relative humidityvalues significantly differed at approximately 15∘C and 30%,respectively, within the 33 h drying period. This explicitlyindicates that the DR in solar drying is higher than that inopen sun drying. On the other hand, the efficiency of thecollector varied from 11% to 74%, with the average value ofapproximately 28%, at the drying air flow rate of 0.07 kg/s.The thermal efficiency rates for the 5 days of drying are shownin Figure 4, which illustrates that the thermal efficiency of thecollector is increased at low solar radiation.
The experimental results showed that solar drying with-out auxiliary heating of 40 kg of dry red chili requiredapproximately 10% water content within 33 h (5 days ofdrying) to yield 8 kg of dried red chili. However, the weightof water evaporated from the red chili obtained using (3)was 31.1 kg. Adding 𝐿 = 2407 kJ/kg (668Wh/kg), 𝑡 = 33 h,and 𝑆 = 420W/m2 to (3) yielded a drying efficiency of12.7%. Equation (5) and a psychometric chart determined thepick-up efficiency to be 44.9%. Evaporative capacity, whichranged from 0.13 to 2.36 kg/h, with an average of 0.97 kg/h,was calculated using (6). Evaporative capacity increased withincreasing solar radiation.
International Journal of Photoenergy 5
0200400600800
10009:
3011
:30
13:3
015
:30
9:30
11:3
013
:30
15:3
09:
3011
:30
13:3
015
:30
9:30
11:3
013
:30
10:3
012
:30
Time of the day
Sola
r rad
iatio
n (W
/m2)
0102030405060
Ther
mal
effici
ency
(%)
Solar radiationThermal efficiency
Figure 4: Efficiency of collector as compared to solar radiation withconstant air flow rate 0.07 kg/s at March 16,2012 to March 20, 2012.
Table 2: Uncertainties during the measurements of the parameters.
Parameters Unit Uncertainty commentAmbient air temperature ∘C ±0.15Collector inlet temperature ∘C ±0.24Collector outlet temperature ∘C ±0.24Chamber temperature ∘C ±0.24Solar intensity W/m2
±0.4Air velocity m/s ±0.2Relative humidity % ±0.17
Table 3 compares the experimental results of the presentand previous studies. Drying of red chili in solar dryingreduced the moisture content from approximately 80% toapproximately 10% in 33 h. At the average solar radiationof 420W/m2 and air flow rate of 0.07 kg/s, the collector,drying system, and pick-up efficiencies were approximately28%, 13%, and 45%, respectively. According to (6), a 49%saving in drying timewas obtained for solar drying comparedwith open sun drying. Kaleemullah and Kailappan [36]studied the drying kinetics of red chili in a rotary dryer.They conducted drying experiments at the temperature rangeof 50–65∘C for 19–33 h and observed that the quality ofred chili drying increased and drying time increased atlow drying temperature. In contrast, with an increase inthe drying temperature, the quality of red chili drying anddrying time both decreased. However, they concluded thatthe performance of red chili dried at 55∘C was the best interms of drying time and quality of red chili drying.
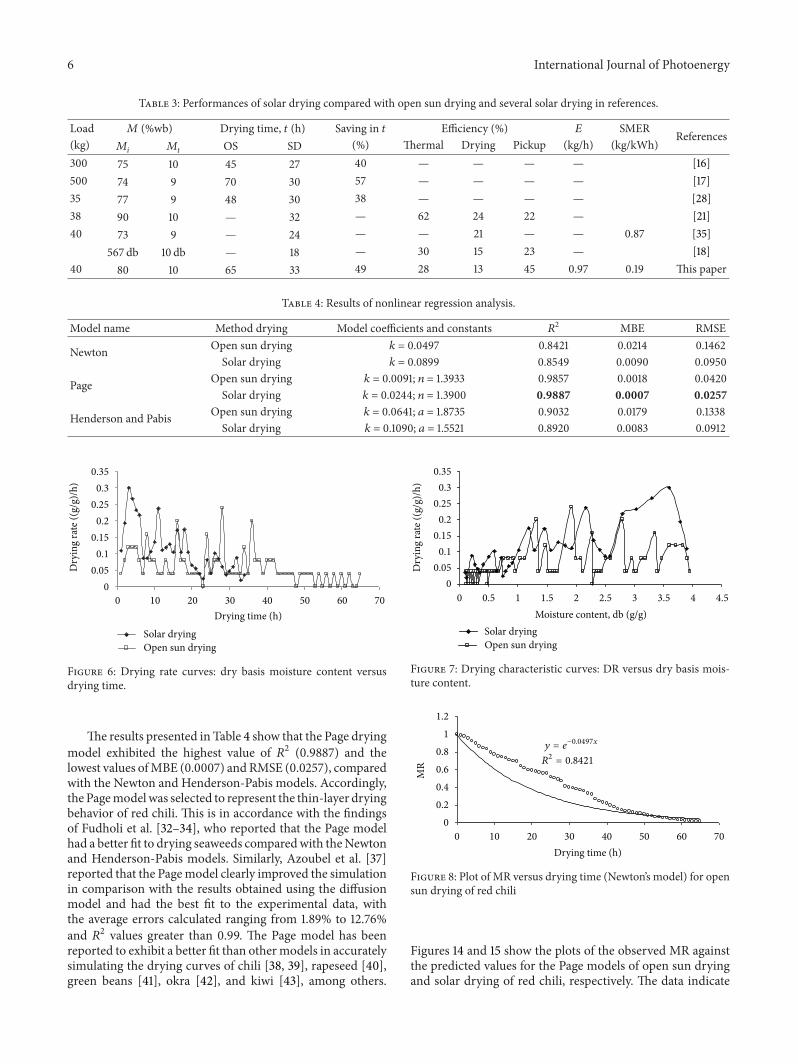
3.2. Drying Curves. The results of the drying kinetic curves,namely, the drying curve, theDR curve, and the characteristicdrying curve, of red chili using open sun drying and solardrying are shown in Figures 5–7. The drying curve showedthe profile change inmoisture content (𝑀) versus drying time(𝑡), the DR curve illustrated the DR profile (dM/dt) versusdrying time (𝑡), and the drying characteristic curve revealedthe DR profile (dM/dt) versus moisture content (dry basis)(M).
Figure 5 demonstrates a reduction in moisture content(dry basis) for solar drying. At low drying time (under opensun drying), themoisture content of red chili increased, slow-ing down the drying process as the drying time increased.
00.5
11.5
22.5
33.5
44.5
0 8 16 24 32 40 48 56 64 72Drying time (h)
Moi
sture
cont
ent,
db (g
/g)
Solar dryingOpen sun drying
Figure 5: Moisture content variation with drying time (dry basis).
Figure 6 shows the dry basis moisture content versus dryingtime. Figure 7 shows drying characteristic curves: DR versusdry basis moisture content. According to this graph, the DRwas higher in solar drying, indicating that the time requiredto dry the material up to equilibrium moisture content isshorter under this method.
3.3. Drying Modeling. Three drying models were fitted withthe experimental data on open sun drying and solar dryingof red chili: the Newton model, the Page model, and theHenderson-Pabis model. The experimental data fitted thesemodels in the form of changes in moisture content versusdrying time, which were calculated using Excel software.Constants were calculated by a graphical method.The resultsof fitting are listed in Table 4, which shows a constant dryingand precision fit for each model. The model with the highest𝑅2 and the lowest MBE and RMSE was selected to better
estimate the drying curve.The Newton model represents the relationship between
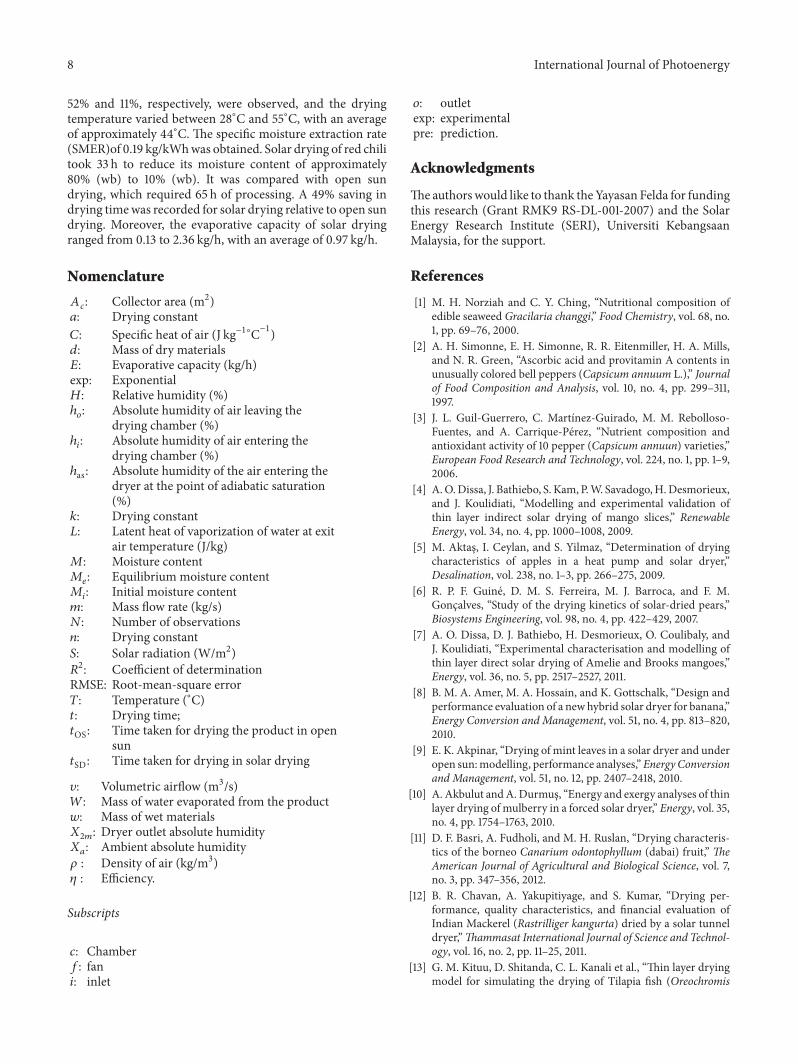
MR and drying time, the exponential equation curves forwhich are shown in Figures 8 and 9. These figures clearlyshowed 𝑘 constants of 0.0497 and 0.0899 for open sun dryingand solar drying, respectively. The Page equation can also beexpressed as follows:
ln (−lnMR) = ln 𝑘 + 𝑛 ln 𝑡. (13)
Equation (13) is the relationship ln(−ln MR) versus 𝑡; thecurves of this logarithmic equation are shown in Figures 10and 11. According to these figures, k constants of 0.0091 and0.0244 were obtained for open sun drying and solar drying,respectively. The 𝑛 constants are clearly shown in the figuresas well. The Henderson-Pabis equation can also be written as
lnMR = −𝑘𝑡 + ln 𝑎. (14)
From (14), a plot of lnMR versus drying time gives astraight line with intercept ln(𝑎) and slope 𝑘. Graphs of lnMRversus drying time are shown in Figures 12 and 13. Thesefigures clearly showed 𝑘 constants of 0.0641 and 0.1090 foropen sun drying and solar drying, respectively.
6 International Journal of Photoenergy
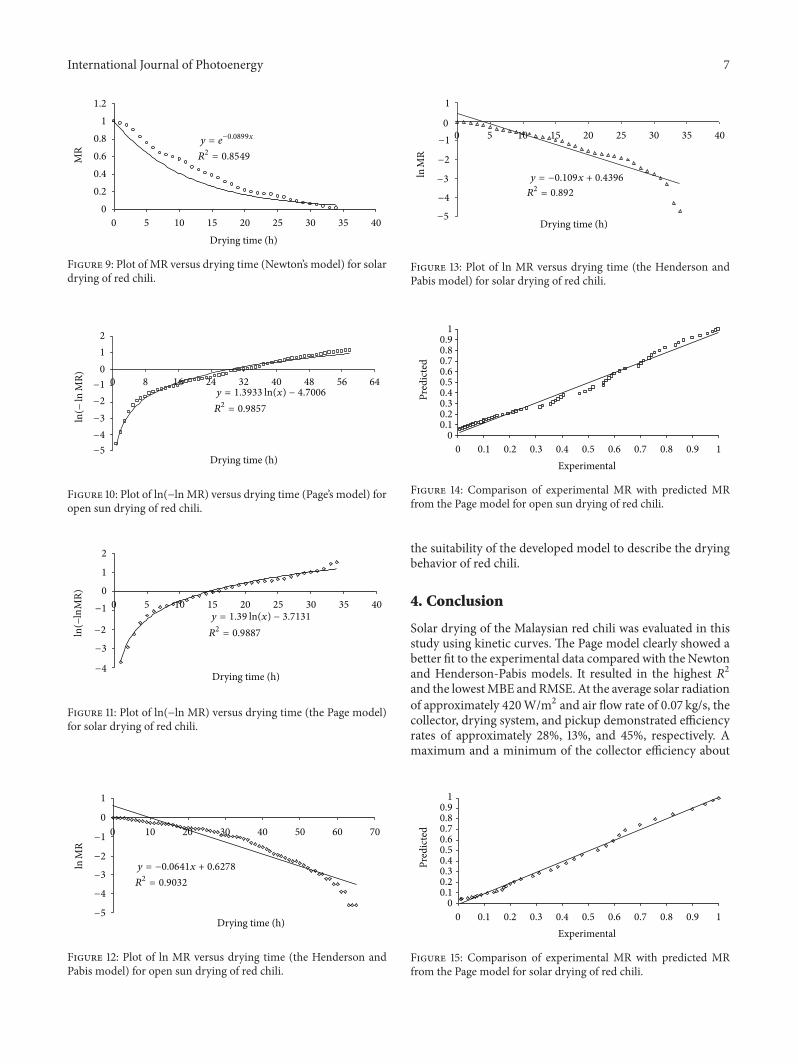
Table 3: Performances of solar drying compared with open sun drying and several solar drying in references.
Load 𝑀 (%wb) Drying time, 𝑡 (h) Saving in 𝑡 Efficiency (%) 𝐸 SMER References(kg) 𝑀
𝑖𝑀𝑡
OS SD (%) Thermal Drying Pickup (kg/h) (kg/kWh)300 75 10 45 27 40 — — — — [16]500 74 9 70 30 57 — — — — [17]35 77 9 48 30 38 — — — — [28]38 90 10 — 32 — 62 24 22 — [21]40 73 9 — 24 — — 21 — — 0.87 [35]
567 db 10 db — 18 — 30 15 23 — [18]40 80 10 65 33 49 28 13 45 0.97 0.19 This paper
Table 4: Results of nonlinear regression analysis.
Model name Method drying Model coefficients and constants 𝑅2 MBE RMSE
Newton Open sun drying 𝑘 = 0.0497 0.8421 0.0214 0.1462Solar drying 𝑘 = 0.0899 0.8549 0.0090 0.0950
Page Open sun drying 𝑘 = 0.0091; 𝑛 = 1.3933 0.9857 0.0018 0.0420Solar drying 𝑘 = 0.0244; 𝑛 = 1.3900 0.9887 0.0007 0.0257
Henderson and Pabis Open sun drying 𝑘 = 0.0641; 𝑎 = 1.8735 0.9032 0.0179 0.1338Solar drying 𝑘 = 0.1090; 𝑎 = 1.5521 0.8920 0.0083 0.0912
00.05
0.10.15
0.20.25
0.30.35
0 10 20 30 40 50 60 70Drying time (h)
Dry
ing
rate
((g/
g)/h
)
Solar dryingOpen sun drying
Figure 6: Drying rate curves: dry basis moisture content versusdrying time.
The results presented in Table 4 show that the Page dryingmodel exhibited the highest value of 𝑅2 (0.9887) and thelowest values ofMBE (0.0007) andRMSE (0.0257), comparedwith the Newton and Henderson-Pabis models. Accordingly,the Pagemodelwas selected to represent the thin-layer dryingbehavior of red chili. This is in accordance with the findingsof Fudholi et al. [32–34], who reported that the Page modelhad a better fit to drying seaweeds comparedwith theNewtonand Henderson-Pabis models. Similarly, Azoubel et al. [37]reported that the Pagemodel clearly improved the simulationin comparison with the results obtained using the diffusionmodel and had the best fit to the experimental data, withthe average errors calculated ranging from 1.89% to 12.76%and 𝑅2 values greater than 0.99. The Page model has beenreported to exhibit a better fit than othermodels in accuratelysimulating the drying curves of chili [38, 39], rapeseed [40],green beans [41], okra [42], and kiwi [43], among others.
00.05
0.10.15
0.20.25
0.30.35
0 0.5 1 1.5 2 2.5 3 3.5 4 4.5Moisture content, db (g/g)
Dry
ing
rate
((g/
g)/h
)
Solar dryingOpen sun drying
Figure 7: Drying characteristic curves: DR versus dry basis mois-ture content.
𝑦 = 𝑒−0.0497𝑥
𝑅2 = 0.8421
0.20.40.60.8
11.2
010 20 30 40 50 60 70
Drying time (h)
MR
0
Figure 8: Plot of MR versus drying time (Newton’s model) for opensun drying of red chili
Figures 14 and 15 show the plots of the observed MR againstthe predicted values for the Page models of open sun dryingand solar drying of red chili, respectively. The data indicate
International Journal of Photoenergy 7
𝑦 = 𝑒−0.0899𝑥
𝑅2 = 0.8549
0.20.40.60.8
11.2
05 10 15 20 25 30 35 40
Drying time (h)
MR
0
Figure 9: Plot of MR versus drying time (Newton’s model) for solardrying of red chili.
𝑅2 = 0.9857
−5
−4
−3
−2
−1
012
0 8 16 24 32 40 48 56 64
Drying time (h)
𝑦 = 1.3933 ln(𝑥) − 4.7006
ln(−ln
MR)
Figure 10: Plot of ln(−ln MR) versus drying time (Page’s model) foropen sun drying of red chili.
𝑦 = 1.39 ln(𝑥) − 3.7131
𝑅2 = 0.9887
−4
−3
−2
−1
0
1
2
0 5 10 15 20 25 30 35 40
Drying time (h)
ln(−
MR)
ln
Figure 11: Plot of ln(−ln MR) versus drying time (the Page model)for solar drying of red chili.
𝑦 = −0.0641𝑥 + 0.6278
𝑅2 = 0.9032
−5
−4
−3
−2
−1
0
1
0 10 20 30 40 50 60 70
Drying time (h)
lnM
R
Figure 12: Plot of ln MR versus drying time (the Henderson andPabis model) for open sun drying of red chili.
𝑦 = −0.109𝑥 + 0.4396
𝑅2 = 0.892−4
−3
−2
−1
0
1
0 5 10 15 20 25 30 35 40
Drying time (h)
lnM
R
−5
Figure 13: Plot of ln MR versus drying time (the Henderson andPabis model) for solar drying of red chili.
00.10.20.30.40.50.60.70.80.9
1
0 0.1 0.2 0.3 0.4 0.5 0.6 0.7 0.8 0.9 1Experimental
Pred
icte
d
Figure 14: Comparison of experimental MR with predicted MRfrom the Page model for open sun drying of red chili.
the suitability of the developed model to describe the dryingbehavior of red chili.
4. Conclusion
Solar drying of the Malaysian red chili was evaluated in thisstudy using kinetic curves. The Page model clearly showed abetter fit to the experimental data compared with the Newtonand Henderson-Pabis models. It resulted in the highest 𝑅2and the lowestMBE andRMSE. At the average solar radiationof approximately 420W/m2 and air flow rate of 0.07 kg/s, thecollector, drying system, and pickup demonstrated efficiencyrates of approximately 28%, 13%, and 45%, respectively. Amaximum and a minimum of the collector efficiency about
00.10.20.30.40.50.60.70.80.9
1
0 0.1 0.2 0.3 0.4 0.5 0.6 0.7 0.8 0.9 1Experimental
Pred
icte
d
Figure 15: Comparison of experimental MR with predicted MRfrom the Page model for solar drying of red chili.
8 International Journal of Photoenergy
52% and 11%, respectively, were observed, and the dryingtemperature varied between 28∘C and 55∘C, with an averageof approximately 44∘C. The specific moisture extraction rate(SMER)of 0.19 kg/kWhwas obtained. Solar drying of red chilitook 33 h to reduce its moisture content of approximately80% (wb) to 10% (wb). It was compared with open sundrying, which required 65 h of processing. A 49% saving indrying timewas recorded for solar drying relative to open sundrying. Moreover, the evaporative capacity of solar dryingranged from 0.13 to 2.36 kg/h, with an average of 0.97 kg/h.
Nomenclature
𝐴𝑐: Collector area (m2)
𝑎: Drying constant𝐶: Specific heat of air (J kg−1∘C−1)𝑑: Mass of dry materials𝐸: Evaporative capacity (kg/h)exp: Exponential𝐻: Relative humidity (%)ℎ𝑜: Absolute humidity of air leaving the
drying chamber (%)ℎ𝑖: Absolute humidity of air entering the
drying chamber (%)ℎas: Absolute humidity of the air entering the
dryer at the point of adiabatic saturation(%)
𝑘: Drying constant𝐿: Latent heat of vaporization of water at exit
air temperature (J/kg)𝑀: Moisture content𝑀𝑒: Equilibrium moisture content
𝑀𝑖: Initial moisture content
𝑚: Mass flow rate (kg/s)𝑁: Number of observations𝑛: Drying constant𝑆: Solar radiation (W/m2)𝑅2: Coefficient of determination
RMSE: Root-mean-square error𝑇: Temperature (∘C)𝑡: Drying time;𝑡OS: Time taken for drying the product in open
sun𝑡SD: Time taken for drying in solar drying
𝑣: Volumetric airflow (m3/s)𝑊: Mass of water evaporated from the product𝑤: Mass of wet materials𝑋2𝑚: Dryer outlet absolute humidity
𝑋𝑎: Ambient absolute humidity
𝜌 : Density of air (kg/m3)𝜂 : Efficiency.
Subscripts
𝑐: Chamber𝑓: fan𝑖: inlet
𝑜: outletexp: experimentalpre: prediction.
Acknowledgments
Theauthorswould like to thank theYayasan Felda for fundingthis research (Grant RMK9 RS-DL-001-2007) and the SolarEnergy Research Institute (SERI), Universiti KebangsaanMalaysia, for the support.
References
[1] M. H. Norziah and C. Y. Ching, “Nutritional composition ofedible seaweed Gracilaria changgi,” Food Chemistry, vol. 68, no.1, pp. 69–76, 2000.
[2] A. H. Simonne, E. H. Simonne, R. R. Eitenmiller, H. A. Mills,and N. R. Green, “Ascorbic acid and provitamin A contents inunusually colored bell peppers (Capsicum annuum L.),” Journalof Food Composition and Analysis, vol. 10, no. 4, pp. 299–311,1997.
[3] J. L. Guil-Guerrero, C. Martınez-Guirado, M. M. Rebolloso-Fuentes, and A. Carrique-Perez, “Nutrient composition andantioxidant activity of 10 pepper (Capsicum annuun) varieties,”European Food Research and Technology, vol. 224, no. 1, pp. 1–9,2006.
[4] A.O.Dissa, J. Bathiebo, S. Kam, P.W. Savadogo,H.Desmorieux,and J. Koulidiati, “Modelling and experimental validation ofthin layer indirect solar drying of mango slices,” RenewableEnergy, vol. 34, no. 4, pp. 1000–1008, 2009.
[5] M. Aktas, I. Ceylan, and S. Yilmaz, “Determination of dryingcharacteristics of apples in a heat pump and solar dryer,”Desalination, vol. 238, no. 1–3, pp. 266–275, 2009.
[6] R. P. F. Guine, D. M. S. Ferreira, M. J. Barroca, and F. M.Goncalves, “Study of the drying kinetics of solar-dried pears,”Biosystems Engineering, vol. 98, no. 4, pp. 422–429, 2007.
[7] A. O. Dissa, D. J. Bathiebo, H. Desmorieux, O. Coulibaly, andJ. Koulidiati, “Experimental characterisation and modelling ofthin layer direct solar drying of Amelie and Brooks mangoes,”Energy, vol. 36, no. 5, pp. 2517–2527, 2011.
[8] B. M. A. Amer, M. A. Hossain, and K. Gottschalk, “Design andperformance evaluation of a new hybrid solar dryer for banana,”Energy Conversion and Management, vol. 51, no. 4, pp. 813–820,2010.
[9] E. K. Akpinar, “Drying of mint leaves in a solar dryer and underopen sun:modelling, performance analyses,”Energy Conversionand Management, vol. 51, no. 12, pp. 2407–2418, 2010.
[10] A. Akbulut andA.Durmus, “Energy and exergy analyses of thinlayer drying of mulberry in a forced solar dryer,” Energy, vol. 35,no. 4, pp. 1754–1763, 2010.
[11] D. F. Basri, A. Fudholi, and M. H. Ruslan, “Drying characteris-tics of the borneo Canarium odontophyllum (dabai) fruit,” TheAmerican Journal of Agricultural and Biological Science, vol. 7,no. 3, pp. 347–356, 2012.
[12] B. R. Chavan, A. Yakupitiyage, and S. Kumar, “Drying per-formance, quality characteristics, and financial evaluation ofIndian Mackerel (Rastrilliger kangurta) dried by a solar tunneldryer,”Thammasat International Journal of Science and Technol-ogy, vol. 16, no. 2, pp. 11–25, 2011.
[13] G. M. Kituu, D. Shitanda, C. L. Kanali et al., “Thin layer dryingmodel for simulating the drying of Tilapia fish (Oreochromis
International Journal of Photoenergy 9
niloticus) in a solar tunnel dryer,” Journal of Food Engineering,vol. 98, no. 3, pp. 325–331, 2010.
[14] A. Fudholi, M. Y. Othman, M. H. Ruslan, M. Yahya, A.Zaharim, and K. Sopian, “Techno-economic analysis of solardrying system for seaweed in Malaysia,” in Procceedings ofthe 7th IASME/WSEAS International Conference on Energy,Environment, Ecosystems and Sustainable Development (EEESD’11), pp. 89–95, 2011.
[15] A. Fudholi, K. Sopian, M. H. Ruslan, M. A. Alghoul, and M. Y.Sulaiman, “Review of solar dryers for agricultural and marineproducts,” Renewable and Sustainable Energy Reviews, vol. 14,no. 1, pp. 1–30, 2010.
[16] S. Janjai, P. Intawee, J. Kaewkiew, C. Sritus, and V. Khamvongsa,“A large-scale solar greenhouse dryer using polycarbonatecover: modeling and testing in a tropical environment of LaoPeople’s Democratic Republic,” Renewable Energy, vol. 36, no.3, pp. 1053–1062, 2011.
[17] J. Kaewkiew, S. Nabneaan, and S. Janjai, “Experimental investi-gation of the performance of a large-scale greenhouse type solardryer for drying chilli in Thailand,” Procedia Engineering, vol.32, pp. 433–439, 2012.
[18] T. Lhendup, “Technical and financial feasibility of a solar dryerin Bhutan,” Energy for Sustainable Development, vol. 9, no. 4, pp.17–24, 2005.
[19] M. A. Hossain and B. K. Bala, “Drying of hot chilli using solartunnel drier,” Solar Energy, vol. 81, no. 1, pp. 85–92, 2007.
[20] M. A. Hossain, J. L. Woods, and B. K. Bala, “Optimisationof solar tunnel drier for drying of chilli without color loss,”Renewable Energy, vol. 30, no. 5, pp. 729–742, 2005.
[21] J. Banout, P. Ehl, J. Havlik, B. Lojka, Z. Polesny, and V. Verner,“Design and performance evaluation of a Double-pass solardrier for drying of red chilli (Capsicum annum L.),” SolarEnergy, vol. 85, no. 3, pp. 506–515, 2011.
[22] A. A. El-Sebaii, S. Aboul-Enein, M. R. I. Ramadan, S. M. Shal-aby, and B. M. Moharram, “Thermal performance investigationof double pass-finned plate solar air heater,”Applied Energy, vol.88, no. 5, pp. 1727–1739, 2011.
[23] J. Banout and P. Ehl, “Using a double-pass solar drier fordrying of bamboo shoots,” Journal of Agriculture and RuralDevelopment in the Tropics and Subtropics, vol. 111, no. 2, pp. 119–127, 2010.
[24] K. E. J. Al-Juamily, A. J. N. Khalifa, and T. A. Yassen, “Testing ofthe performance of a fruit and vegetable solar drying system inIraq,” Desalination, vol. 209, no. 1–3, pp. 163–170, 2007.
[25] M. H. Ruslan, A. Fudholi, M. Y. Othman et al., “The double-pass solar dryer for drying palm oil fronds,” in Proceedings ofthe 10th WSEAS international conference on System science andsimulation in engineering (ICOSSSE ’11), pp. 143–149, Penang,Malaysia, 2011.
[26] Y. Jannot and Y. Coulibaly, “the “evaporative capacity” as aperformance index for a solar-drier air-heater,” Solar Energy,vol. 63, no. 6, pp. 387–391, 1998.
[27] S.Desai, V. Palled, andM.Anantachar, “Performance evaluationof farm solar dryer for chilly drying,” Karnataka Journal ofAgricultural Sciences, vol. 22, no. 2, pp. 382–384, 2009.
[28] V. Shanmugam and E. Natarajan, “Experimental investigationof forced convection and desiccant integrated solar dryer,”Renewable Energy, vol. 31, no. 8, pp. 1239–1251, 2006.
[29] S. Meziane, “Drying kinetics of olive pomace in a fluidized beddryer,” Energy Conversion and Management, vol. 52, no. 3, pp.1644–1649, 2011.
[30] M. Ibrahim, K. Sopian, andW. R.W. Daud, “Study of the dryingkinetics of Lemon grass,” The American Journal of AppliedSciences, vol. 6, no. 6, pp. 1070–1075, 2009.
[31] M. Y. Othman, A. Fudholi, K. Sopian, M. H. Ruslan, and M.Yahya, “Analisis kinetik pengeringan rumpai laut Gracilariacangii menggunakan sistem pengering suria (drying kineticsanalysis of seaweed Gracilaria cangii using solar drying sys-tem),” Sains Malaysiana, vol. 41, no. 2, pp. 245–252, 2012.
[32] A. Fudholi,M. Y.Othman,M.H. Ruslan,M. Yahya, A. Zaharim,and K. Sopian, “The effects of drying air temperature andhumidity on drying kinetics of seaweed,” in Recent Research inGeography, Geology, Energy, Environment and Biomedicine, pp.129–133, Corfu, Greece, 2011.
[33] A. Fudholi, M. Y. Othman, M. H. Ruslan, M. Yahya, A.Zaharim, and K. Sopian, “Design and testing of solar dryer fordrying kinetics of seaweed in Malaysia,” in Recent Research inGeography, Geology, Energy, Environment and Biomedicine, pp.119–124, Corfu, Greece, 2011.
[34] A. Fudholi, M. H. Ruslan, L. C. Haw et al., “Mathematicalmodeling of brown seaweed drying curves,” in Proceedings oftheWSEAS International Conference on Applied Mathematics inElectrical and Computer Engineering, pp. 207–211, 2012.
[35] M. Mohanraj and P. Chandrasekar, “Performance of a forcedconvection solar drier integrated with gravel as heat storagematerial for chili drying,” Journal of Engineering Science andTechnology, vol. 4, no. 3, pp. 305–314, 2009.
[36] S. Kaleemullah and R. Kailappan, “Drying kinetics of redchillies in a rotary dryer,” Biosystems Engineering, vol. 92, no.1, pp. 15–23, 2005.
[37] P. M. Azoubel, M. D. A. M. Baima, M. D. R. Amorim, and S. S.B. Oliveira, “Effect of ultrasound on banana cv Pacovan dryingkinetics,” Journal of Food Engineering, vol. 97, no. 2, pp. 194–198,2010.
[38] T. Y. Tunde-Akintunde, “Mathematical modeling of sun andsolar drying of chilli pepper,” Renewable Energy, vol. 36, no. 8,pp. 2139–2145, 2011.
[39] I. Doymaz and M. Pala, “Hot-air drying characteristics of redpepper,” Journal of Food Engineering, vol. 55, no. 4, pp. 331–335,2002.
[40] L. A. Duc, J. W. Han, and D. H. Keum, “Thin layer dryingcharacteristics of rapeseed (Brassica napus L.),” Journal of StoredProducts Research, vol. 47, no. 1, pp. 32–38, 2011.
[41] I. Doymaz, “Drying behaviour of green beans,” Journal of FoodEngineering, vol. 69, no. 2, pp. 161–165, 2005.
[42] I. Doymaz, “Drying characteristics and kinetics of okra,” Journalof Food Engineering, vol. 69, no. 3, pp. 275–279, 2005.
[43] S. Simal, A. Femenia, M. C. Garau, and C. Rossello, “Useof exponential, Page’s and diffusional models to simulate thedrying kinetics of kiwi fruit,” Journal of Food Engineering, vol.66, no. 3, pp. 323–328, 2005.

Submit your manuscripts athttp://www.hindawi.com
Hindawi Publishing Corporationhttp://www.hindawi.com Volume 2014
Inorganic ChemistryInternational Journal of
Hindawi Publishing Corporation http://www.hindawi.com Volume 2014
International Journal ofPhotoenergy
Hindawi Publishing Corporationhttp://www.hindawi.com Volume 2014
Carbohydrate Chemistry
International Journal of
Hindawi Publishing Corporationhttp://www.hindawi.com Volume 2014
Journal of
Chemistry
Hindawi Publishing Corporationhttp://www.hindawi.com Volume 2014
Advances in
Physical Chemistry
Hindawi Publishing Corporationhttp://www.hindawi.com
Analytical Methods in Chemistry
Journal of
Volume 2014
Bioinorganic Chemistry and ApplicationsHindawi Publishing Corporationhttp://www.hindawi.com Volume 2014
SpectroscopyInternational Journal of
Hindawi Publishing Corporationhttp://www.hindawi.com Volume 2014
The Scientific World JournalHindawi Publishing Corporation http://www.hindawi.com Volume 2014
Medicinal ChemistryInternational Journal of
Hindawi Publishing Corporationhttp://www.hindawi.com Volume 2014
Chromatography Research International
Hindawi Publishing Corporationhttp://www.hindawi.com Volume 2014
Applied ChemistryJournal of
Hindawi Publishing Corporationhttp://www.hindawi.com Volume 2014
Hindawi Publishing Corporationhttp://www.hindawi.com Volume 2014
Theoretical ChemistryJournal of
Hindawi Publishing Corporationhttp://www.hindawi.com Volume 2014
Journal of
Spectroscopy
Analytical ChemistryInternational Journal of
Hindawi Publishing Corporationhttp://www.hindawi.com Volume 2014
Journal of
Hindawi Publishing Corporationhttp://www.hindawi.com Volume 2014
Quantum Chemistry
Hindawi Publishing Corporationhttp://www.hindawi.com Volume 2014
Organic Chemistry International
ElectrochemistryInternational Journal of
Hindawi Publishing Corporation http://www.hindawi.com Volume 2014
Hindawi Publishing Corporationhttp://www.hindawi.com Volume 2014
CatalystsJournal of