research article a comparison of synonymous …downloads.hindawi.com/journals/bmri/2013/406342.pdfa...
TRANSCRIPT
Hindawi Publishing CorporationBioMed Research InternationalVolume 2013, Article ID 406342, 10 pageshttp://dx.doi.org/10.1155/2013/406342
Research ArticleA Comparison of Synonymous Codon Usage Bias Patternsin DNA and RNA Virus Genomes: Quantifying the RelativeImportance of Mutational Pressure and Natural Selection
Youhua Chen
Department of Zoology, University of British Columbia, Vancouver, BC, Canada V6T 1Z4
Correspondence should be addressed to Youhua Chen; [email protected]
Received 15 April 2013; Revised 30 June 2013; Accepted 4 August 2013
Academic Editor: Sankar Subramanian
Copyright © 2013 Youhua Chen.This is an open access article distributed under the Creative Commons Attribution License, whichpermits unrestricted use, distribution, and reproduction in any medium, provided the original work is properly cited.
Codon usage bias patterns have been broadly explored for many viruses. However, the relative importance of mutation pressureand natural selection is still under debate. In the present study, I tried to resolve controversial issues on determining the principalfactors of codon usage patterns for DNA and RNA viruses, respectively, by examining over 38000 ORFs. By utilizing variationpartitioning technique, the results showed that 27% and 21% of total variation could be attributed to mutational pressure, while 5%and 6% of total variation could be explained by natural selection for DNA and RNA viruses, respectively, in codon usage patterns.Furthermore, the combined effect of mutational pressure and natural selection on influencing codon usage patterns of viruses issubstantial (explaining 10% and 8% of total variation of codon usage patterns). With respect to GC variation, GC content is alwaysnegatively and significantly correlated with aromaticity. Interestingly, the signs for the significant correlations between GC, genelengths, and hydrophobicity are completely opposite between DNA and RNA viruses, being positive for DNA viruses while beingnegative for RNA viruses. At last, GC12 versus G3s plot suggests that natural selection is more important than mutational pressureon influencing the GC content in the first and second codon positions.
1. Introduction
Codon usage is not a random event [1]. Codon usage bias hasbeen broadly observed, and different mechanisms have beenproposed to explain the bias patterns, for example, mutationpressure, translational efficiency, gene length [2], dinulcoe-tide bias [3], tRNA abundance [4], organ specificity [5], andso on. Codonusage bias patterns have been broadly studied inrecent years, especially for virus genomes [3, 6, 7]. However,most of these previous studies only consider a specific virusor a specific virus clade [8–10], a global comparison of viruscodon usage bias patterns is still largely lacking, even thoughsome literature had worked on many RNA and DNA virusesas whole [11–13]. A holistic observation and comparison ofcodon usage patterns over different clades of viruses wouldthrow new insights into virus genome explicitly. To copewith such a knowledge gap, in the present study, I analyzedcodon usage patterns for the available 2317 virus genomesfor the purpose of providing a more robust and integratedunderstanding of synonymous codon usage patterns.
Given the accumulation of genome sequences from dif-ferent viruses in GenBank database, another purpose of thepresent study is to quantify the relative contribution of muta-tion pressure and natural selection on influencing codonusage patterns of virus genomes. I could achieve such anobjective by introducing a new statistical method calledvariance partitioning to quantitatively examine the separatedrole of different mechanisms on synonymous codon usagepatterns of viruses.
2. Materials and Methods
2.1. Sequence Data. The complete genome sequences for2317 different virus species were originally obtained fromGenBank database (http://www.ncbi.nlm.nih.gov/genomes/VIRUSES/viruses.html). Because some viruses have beensequenced for multiple times using different strains, foravoiding sampling bias, only one from these multiple genom-ic sequences for the same virus is used. Furthermore, becauseRNA and DNA viruses are very different on their codon
2 BioMed Research International
usage biase patterns [12], RNA and DNA viruses are analyzedseparately. Genomes belonging to other types of viruses, suchas Retro-transcribing viruses, are not considered.
Consequently, 786 DNA viruses and 725 RNA viruses areretained for all subsequent analyses, representing around 65%of the total virus species in the NCBI Genome database. Byextracting all the valid open reading frames (ORFs) fromeachgenome sequence and removing problematic ones (includingshort-length (less than 350 bp) ORFs, overlapping ORFsfor different genes/transcripts, ORFs with nontranslatablecodons, andORFswithout synonymous codons), 35818ORFsfor DNA viruses and 2743 ORFs for RNA viruses are kept forcalculating codon usage indices and performing multivariateanalyses.
2.2. Measures of Relative Synonymous Codon Usage (RSCU).Relative synonymous codon usage values of each codon in agene are calculated to investigate the characteristics of synon-ymous codon usage. The RSCU index is calculated as follows[14]:
RSCU =𝑔𝑖𝑗× 𝑛𝑗
∑
𝑛𝑗
𝑖𝑔𝑖𝑗
, (1)
where 𝑔𝑖𝑗is the observed number of the 𝑖th codon for the
𝑗th amino acid which has 𝑛𝑖kinds of synonymous codons.
Codons with higher (or lower) selected frequencies havehigher (or lower) RSCU values. When the correspondingRSCU values of a codon are close to 1, it is used randomlyand evenly.
2.3. Effective Number of Codons. The effective number ofcodons (ENC) is a measure of bias from equal codon usagein a gene [15]. The calculation formula is
ENC = 2 + 9𝐹2
+
1
𝐹3
+
5
𝐹4
+
3
𝐹6
, (2)
where 𝐹𝑘(𝑘 = 2, 3, 4, 6) is the mean of 𝐹
𝑘values for the 𝑘-fold
degenerate amino acids, which is estimated using the formulaas follows:
𝐹𝑘=
𝑛𝑆 − 1
𝑛 − 1
, (3)
where 𝑛 is the total number of occurrences of the codons forthat amino acid and
𝑆 =
𝑘
∑
𝑖=1
(
𝑛𝑖
𝑛
)
2
, (4)
where 𝑛𝑖is the total number of occurrences of the 𝑖th codon
for that amino acid.𝑁𝑐ranges from 20 for the strongest bias (where only one
codon is used for each amino acid) to 61 for no bias (whereall synonymous codons are used equally).
For elucidating the relationship between GC3s and ENCvalues, the expected ENC values for different GC3s arecalculated as follows:
ENCexpected= 2 + 𝑠 +
29
𝑠
2+ (1 − 𝑠)
2, (5)
where 𝑠 denotes the value of GC3s [6]. The observed andexpected ENC values are compared to determine the influ-ence of nucleotide compositional constraint on structuringsynonymous codon usage bias.
2.4. Codon Adaptation Index. The codon adaptation index(CAI) estimates the extent of bias toward codons that areknown to be favored in highly expressed genes [16]. In thepresent study, for simplicity, the Escherichia coli optimalcodons are used as the reference.
2.5. Indices forMeasuring Chemical Properties of Amino Acids.Hydrophobicity (GRAVY) and aromaticity (AROMO) ofconceptually translated gene productmay be factors influenc-ing codon usage bias patterns [17]. As such, I quantify bothindices to reveal the evidence of natural selection on codonusage bias.
For hydrophobicity index [17], it is calculated as
GRAVY = 1𝑁
𝑁
∑
𝑖=1
𝑘𝑖, (6)
where 𝑁 is the number of amino acids and 𝑘𝑖is the
hydrophobic index of the 𝑖th amino acid.For aromaticity index [17], it is calculated as
AROMO = 1𝑁
𝑁
∑
𝑖=1
V𝑖, (7)
where V𝑖is either 1 (for an aromatic amino acid) or 0 (for
a nonaromatic amino acid) and 𝑁 is the number of aminoacids.
2.6. Correspondence Analysis and Canonical CorrespondenceAnalysis. In addition to utilizing conventional correspon-dence analysis (CA) [17], in the present study, I introducea new method, namely, canonical correspondence analysis(CCA) [18], which could help reveal the principal trends ofcodon usage bias patterns and identify the most correlatedvariables simultaneously. CCA method has been broadlyapplied in ecological studies [18, 19]. However, it might bethe first time to be applied to study synonymous codon usagepatterns for viruses in the present study.
Themathematical formulation for CCAmethod [18, 19] isa bit complicated in comparison to its linear analogue redun-dancy analysis (RDA) [19, 20] because it requires data trans-formation. As such, the calculation steps for RDA are presenthere for demonstrating the calculation core steps of CCA.
Assuming that one has the codon usage matrix 𝑌 andthe matrix of explanatory variables (codon usage indices) 𝑋(both have the same rows), then the RDA procedure is topredict the elements (codon usage values) in the matrix 𝑌 as
𝑌 = 𝑋[𝑋
𝑇𝑋]
−1
𝑋
𝑇𝑌, (8)
where the subscript𝑇 denotes the transpose of thematrix and−1 denotes the inverse of the matrix.
BioMed Research International 3
Thus the covariancematrix for the predicted codon usagematrix 𝑌 is (𝑛 denotes the row number)
𝑀 =
1
𝑛 − 1
𝑌
𝑇𝑌. (9)
The RDA or CCA method is to decompose the abovematrix 𝑀 into normalized eigenvalues 𝐸 and normalizedeigenvector matrix 𝑈. Elements from 𝐸 ranked from high tolow represent the explained proportion of total variation inthe codon usage patterns, while the corresponding eigenvec-tors 𝑈 can be used to obtain sample scores and biplots whengenerating the 2-dimensional plots.
2.7. Quantifying the Influence of Mutation Pressure and Se-lection Pressure Using Variation Partitioning. Variation parti-tioning is a relatively new method for helping elucidate theinfluence of each group of explanatory variables in multivari-ate statistics [21]. Variation partitioning has been broadlyapplied in ecological and evolutionary studies [19]. For quan-tifying the influence of mutation selection, I consider themetrics related to codon contents, like GC, GC3s, A3s, T3s,C3s, and G3s contents, as the factors reflecting mutationalpressure. In contrast, the indices CAI, all kinds of proteinproperties, including hydrophobicity and aromaticity, areregarded as the representative of natural selection [3, 17, 22].For simplicity, the mathematical formulation for variationpartitioning technique is as follows [21, 23, 24].
Supposing that there are two groups of explanatoryvariables in two matrices 𝑋
1and 𝑋
2, the total variation 𝑆 in
the codon usage table matrix 𝑌 with 𝑛 rows is written as
𝑆 =
1
(𝑛 − 1)
Trace ((𝑌 − 𝑌)𝑇
(𝑌 − 𝑌)) , (10)
where a hyphen above the variable(s) denotes the mean(s).Then the proportion of variation𝑅
1only explained by the
group of explanatory variables𝑋1is obtained as
𝑌1= 𝑋2[𝑋
𝑇
2𝑋2]
−1
𝑋2
𝑇𝑌,
𝑌
res1= 𝑌 − 𝑌
1,
𝑋
res1= 𝑋1− 𝑋2[𝑋
𝑇
2𝑋2]
−1
𝑋
𝑇
2𝑋1,
𝑌1= 𝑋
res1[𝑋
res1
𝑇𝑋
res1]
−1
𝑋
res1
𝑇𝑌1
res,
𝑅1=
Trace ((1/ (𝑛 − 1)) (𝑌1 − 𝑌1)𝑇
(𝑌1− 𝑌1))
𝑆
.
(11)
The percentage of total variation 𝑅2attributed to the
explanatory variable group 𝑋2is calculated following the
same procedure as above.Finally, the percentage of total variation explained by the
interaction of the two variable groups𝑋1and𝑋
2requires the
determination of the percentage of variation (𝑅12) explained
by all the variables𝑋, the matrix of which combines matrices𝑋1and𝑋
2together:
𝑌12= 𝑋[𝑋
𝑇𝑋]
−1
𝑋
𝑇𝑌,
𝑅12=
Trace ((1/ (𝑛 − 1)) (𝑌12 − 𝑌12)𝑇
(𝑌12− 𝑌12))
𝑆
.
(12)
Thus, the proportion of variation that cannot be explained byany current explanatory variables is determined by
𝑅0= 1 − 𝑅
12. (13)
Then, the percentage of total variation explained by theinteraction of the two variable groups is given by,
𝑅1∩2= 𝑅12− 𝑅1− 𝑅2. (14)
In a summary, 𝑅1, 𝑅2, 𝑅1∩2
and 𝑅0are the focused explained
variation for the present study.
2.8. Statistical Programs. Multivariate analyses, includingCA, CCA, and variation partitioning methods, were imple-mented in𝑅 [25] package “vegan” [26]. All other codon usageindices mentioned above were calculated using CodonWprogram [27].
3. Results
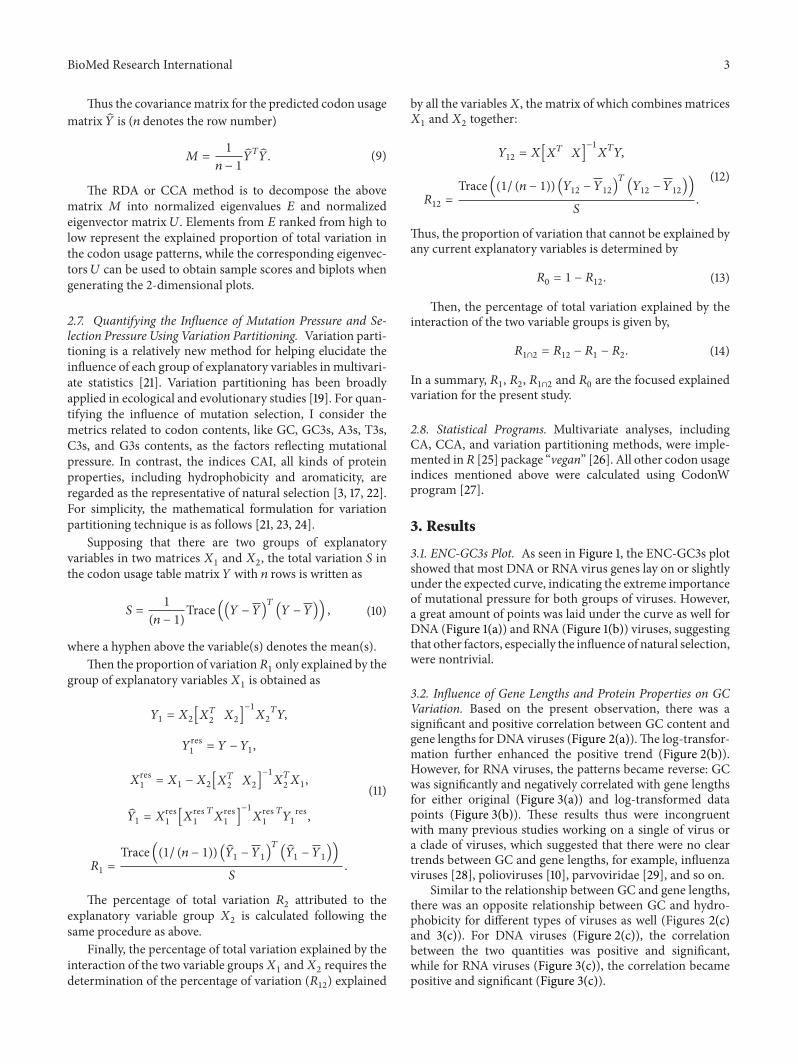
3.1. ENC-GC3s Plot. As seen in Figure 1, the ENC-GC3s plotshowed that most DNA or RNA virus genes lay on or slightlyunder the expected curve, indicating the extreme importanceof mutational pressure for both groups of viruses. However,a great amount of points was laid under the curve as well forDNA (Figure 1(a)) and RNA (Figure 1(b)) viruses, suggestingthat other factors, especially the influence of natural selection,were nontrivial.
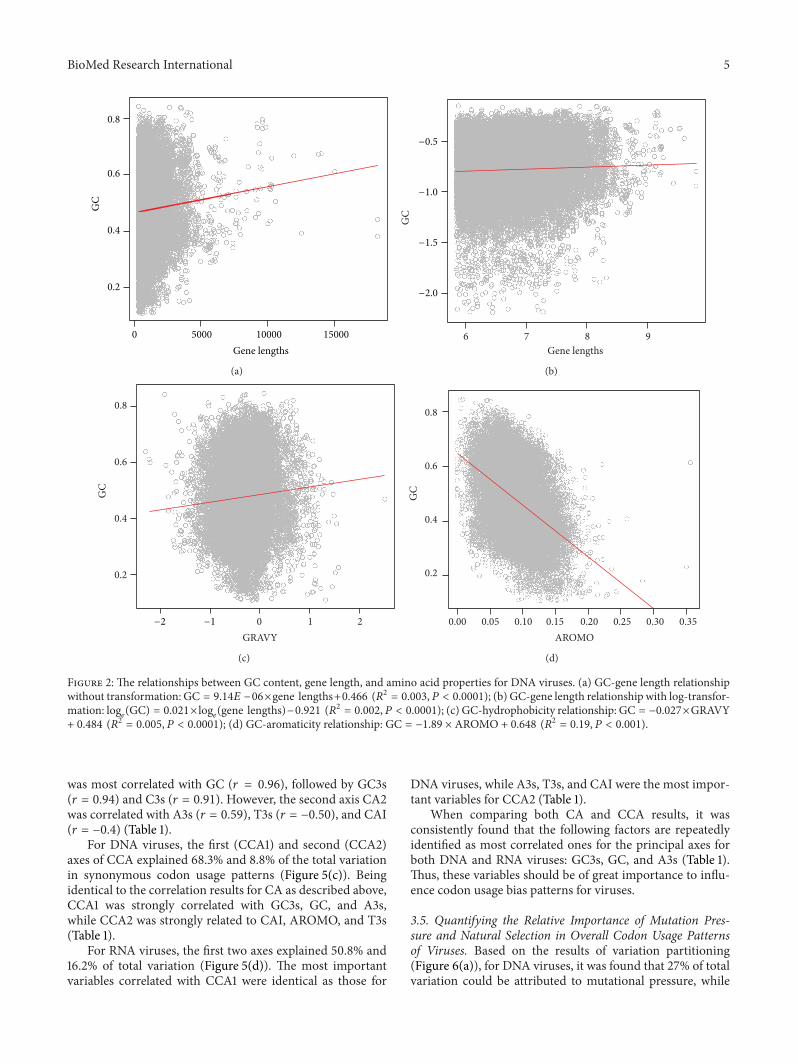
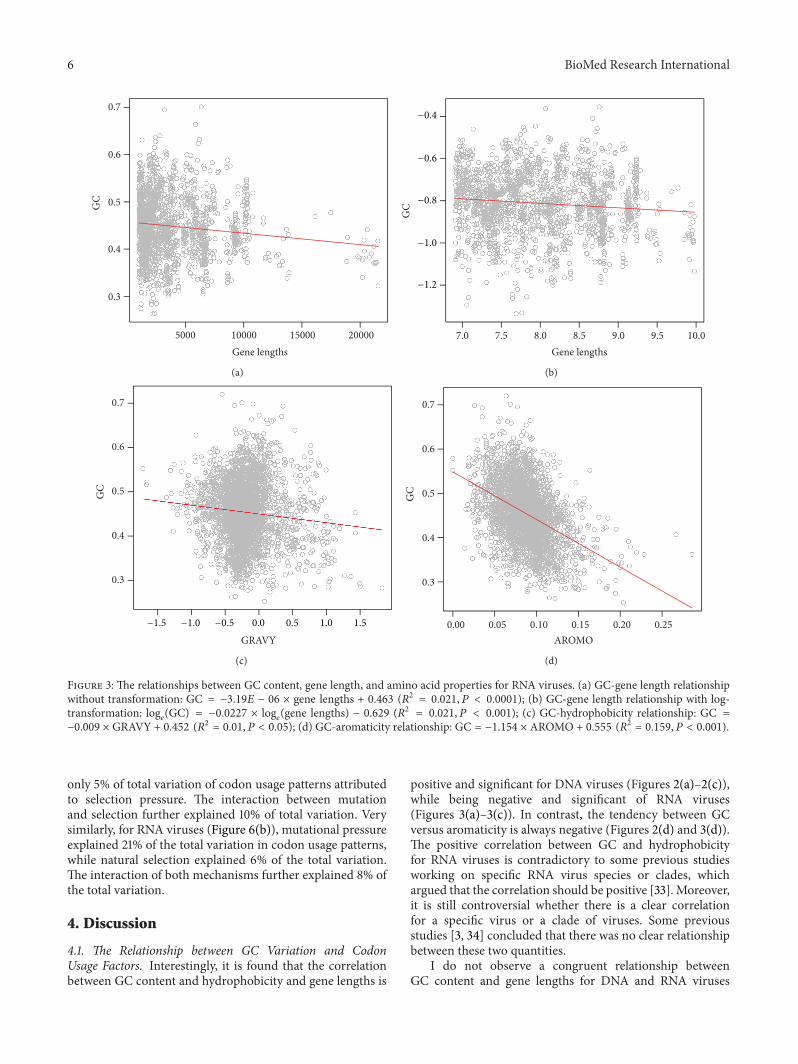
3.2. Influence of Gene Lengths and Protein Properties on GCVariation. Based on the present observation, there was asignificant and positive correlation between GC content andgene lengths for DNA viruses (Figure 2(a)).The log-transfor-mation further enhanced the positive trend (Figure 2(b)).However, for RNA viruses, the patterns became reverse: GCwas significantly and negatively correlated with gene lengthsfor either original (Figure 3(a)) and log-transformed datapoints (Figure 3(b)). These results thus were incongruentwith many previous studies working on a single of virus ora clade of viruses, which suggested that there were no cleartrends between GC and gene lengths, for example, influenzaviruses [28], polioviruses [10], parvoviridae [29], and so on.
Similar to the relationship between GC and gene lengths,there was an opposite relationship between GC and hydro-phobicity for different types of viruses as well (Figures 2(c)and 3(c)). For DNA viruses (Figure 2(c)), the correlationbetween the two quantities was positive and significant,while for RNA viruses (Figure 3(c)), the correlation becamepositive and significant (Figure 3(c)).
4 BioMed Research International
0.0 0.2 0.4 0.6 0.8 1.0
30
40
50
60
GC3s
ENC
(a)
0.2 0.4 0.6 0.8
25
30
35
40
45
50
55
60
GC3s
ENC
(b)
Figure 1: The relationship between ENC and GC3s for DNA (a) and RNA (b) virus genomes, respectively.
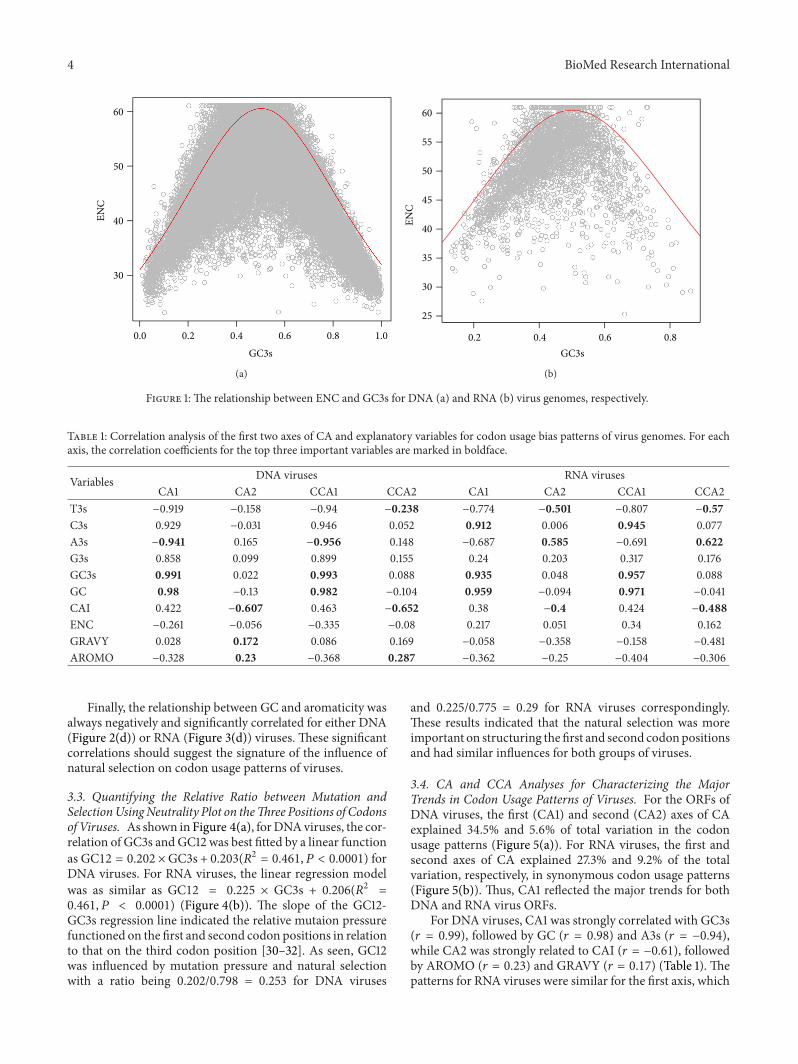
Table 1: Correlation analysis of the first two axes of CA and explanatory variables for codon usage bias patterns of virus genomes. For eachaxis, the correlation coefficients for the top three important variables are marked in boldface.
Variables DNA viruses RNA virusesCA1 CA2 CCA1 CCA2 CA1 CA2 CCA1 CCA2
T3s −0.919 −0.158 −0.94 −0.238 −0.774 −0.501 −0.807 −0.57C3s 0.929 −0.031 0.946 0.052 0.912 0.006 0.945 0.077A3s −0.941 0.165 −0.956 0.148 −0.687 0.585 −0.691 0.622G3s 0.858 0.099 0.899 0.155 0.24 0.203 0.317 0.176GC3s 0.991 0.022 0.993 0.088 0.935 0.048 0.957 0.088GC 0.98 −0.13 0.982 −0.104 0.959 −0.094 0.971 −0.041CAI 0.422 −0.607 0.463 −0.652 0.38 −0.4 0.424 −0.488ENC −0.261 −0.056 −0.335 −0.08 0.217 0.051 0.34 0.162GRAVY 0.028 0.172 0.086 0.169 −0.058 −0.358 −0.158 −0.481AROMO −0.328 0.23 −0.368 0.287 −0.362 −0.25 −0.404 −0.306
Finally, the relationship between GC and aromaticity wasalways negatively and significantly correlated for either DNA(Figure 2(d)) or RNA (Figure 3(d)) viruses. These significantcorrelations should suggest the signature of the influence ofnatural selection on codon usage patterns of viruses.
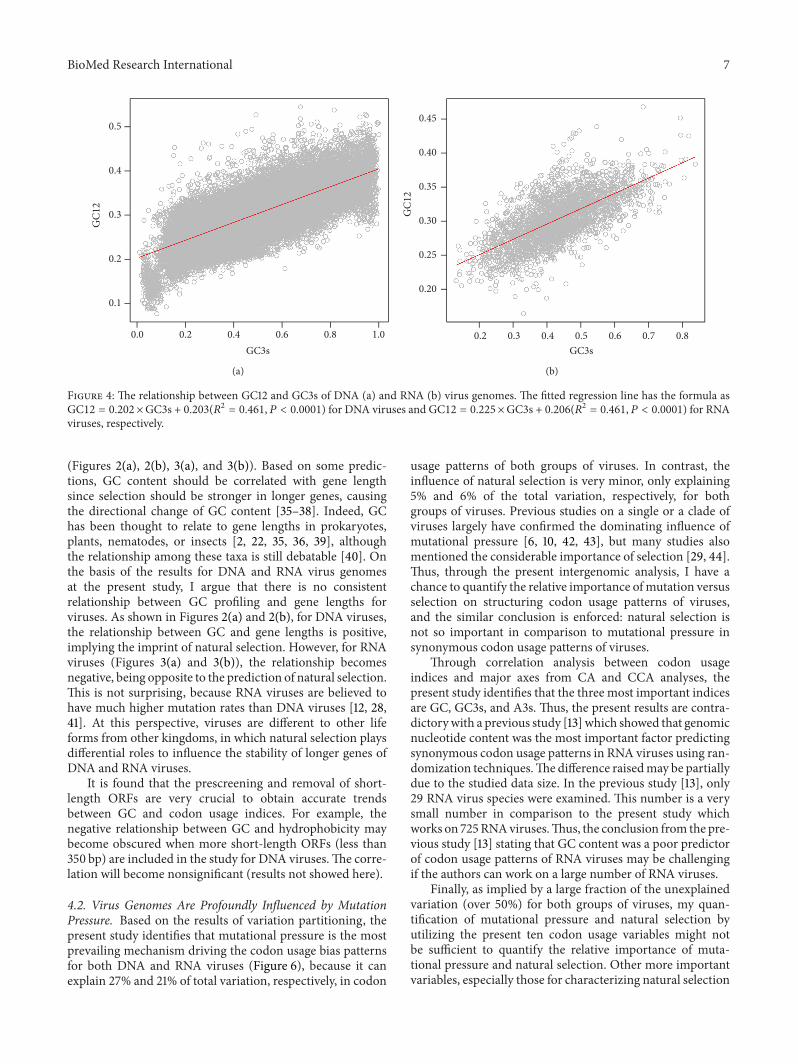
3.3. Quantifying the Relative Ratio between Mutation andSelectionUsingNeutrality Plot on theThree Positions of Codonsof Viruses. As shown in Figure 4(a), forDNAviruses, the cor-relation of GC3s and GC12 was best fitted by a linear functionas GC12 = 0.202 ×GC3s + 0.203(𝑅2 = 0.461, 𝑃 < 0.0001) forDNA viruses. For RNA viruses, the linear regression modelwas as similar as GC12 = 0.225 × GC3s + 0.206(𝑅2 =0.461, 𝑃 < 0.0001) (Figure 4(b)). The slope of the GC12-GC3s regression line indicated the relative mutaion pressurefunctioned on the first and second codon positions in relationto that on the third codon position [30–32]. As seen, GC12was influenced by mutation pressure and natural selectionwith a ratio being 0.202/0.798 = 0.253 for DNA viruses
and 0.225/0.775 = 0.29 for RNA viruses correspondingly.These results indicated that the natural selection was moreimportant on structuring the first and second codonpositionsand had similar influences for both groups of viruses.
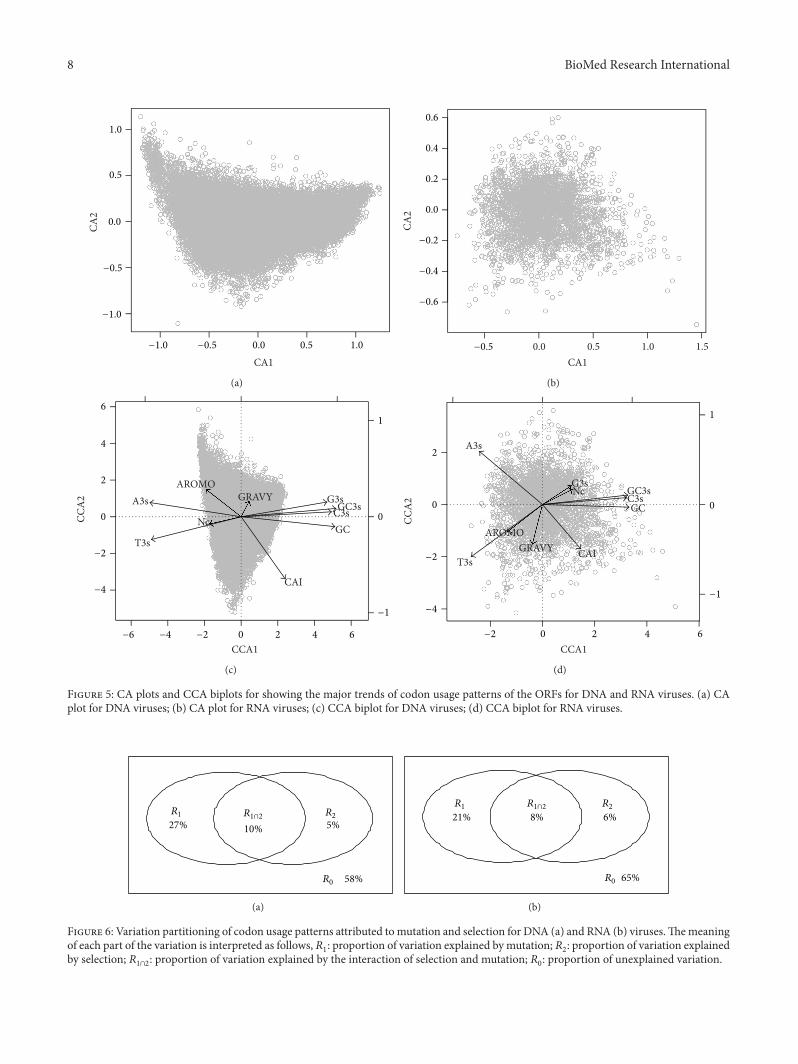
3.4. CA and CCA Analyses for Characterizing the MajorTrends in Codon Usage Patterns of Viruses. For the ORFs ofDNA viruses, the first (CA1) and second (CA2) axes of CAexplained 34.5% and 5.6% of total variation in the codonusage patterns (Figure 5(a)). For RNA viruses, the first andsecond axes of CA explained 27.3% and 9.2% of the totalvariation, respectively, in synonymous codon usage patterns(Figure 5(b)). Thus, CA1 reflected the major trends for bothDNA and RNA virus ORFs.
For DNA viruses, CA1 was strongly correlated with GC3s(𝑟 = 0.99), followed by GC (𝑟 = 0.98) and A3s (𝑟 = −0.94),while CA2 was strongly related to CAI (𝑟 = −0.61), followedby AROMO (𝑟 = 0.23) and GRAVY (𝑟 = 0.17) (Table 1). Thepatterns for RNA viruses were similar for the first axis, which
BioMed Research International 5
0 5000 10000 15000
0.2
0.4
0.6
0.8
Gene lengths
GC
(a)
6 7 8 9Gene lengths
GC
−2.0
−1.5
−1.0
−0.5
(b)
0 1 2
0.2
0.4
0.6
0.8
GRAVY
GC
−2 −1
(c)
0.00 0.05 0.10 0.15 0.20 0.25 0.30 0.35
0.2
0.4
0.6
0.8
AROMO
GC
(d)
Figure 2: The relationships between GC content, gene length, and amino acid properties for DNA viruses. (a) GC-gene length relationshipwithout transformation: GC = 9.14𝐸 −06×gene lengths+0.466 (𝑅2 = 0.003, 𝑃 < 0.0001); (b) GC-gene length relationship with log-transfor-mation: log
𝑒(GC) = 0.021× log
𝑒(gene lengths)−0.921 (𝑅2 = 0.002, 𝑃 < 0.0001); (c) GC-hydrophobicity relationship: GC = −0.027×GRAVY
+ 0.484 (𝑅2 = 0.005, 𝑃 < 0.0001); (d) GC-aromaticity relationship: GC = −1.89 × AROMO + 0.648 (𝑅2 = 0.19, 𝑃 < 0.001).
was most correlated with GC (𝑟 = 0.96), followed by GC3s(𝑟 = 0.94) and C3s (𝑟 = 0.91). However, the second axis CA2was correlated with A3s (𝑟 = 0.59), T3s (𝑟 = −0.50), and CAI(𝑟 = −0.4) (Table 1).
For DNA viruses, the first (CCA1) and second (CCA2)axes of CCA explained 68.3% and 8.8% of the total variationin synonymous codon usage patterns (Figure 5(c)). Beingidentical to the correlation results for CA as described above,CCA1 was strongly correlated with GC3s, GC, and A3s,while CCA2 was strongly related to CAI, AROMO, and T3s(Table 1).
For RNA viruses, the first two axes explained 50.8% and16.2% of total variation (Figure 5(d)). The most importantvariables correlated with CCA1 were identical as those for
DNA viruses, while A3s, T3s, and CAI were the most impor-tant variables for CCA2 (Table 1).
When comparing both CA and CCA results, it wasconsistently found that the following factors are repeatedlyidentified as most correlated ones for the principal axes forboth DNA and RNA viruses: GC3s, GC, and A3s (Table 1).Thus, these variables should be of great importance to influ-ence codon usage bias patterns for viruses.
3.5. Quantifying the Relative Importance of Mutation Pres-sure and Natural Selection in Overall Codon Usage Patternsof Viruses. Based on the results of variation partitioning(Figure 6(a)), for DNA viruses, it was found that 27% of totalvariation could be attributed to mutational pressure, while
6 BioMed Research International
5000 10000 15000 20000
0.3
0.4
0.5
0.6
0.7
Gene lengths
GC
(a)
7.0 7.5 8.0 8.5 9.0 9.5 10.0Gene lengths
GC
−1.2
−1.0
−0.8
−0.6
−0.4
(b)
0.3
0.4
0.5
0.6
0.7
GRAVY
GC
−1.5 −1.0 −0.5 0.0 0.5 1.0 1.5
(c)
0.00 0.05 0.10 0.15 0.20 0.25
0.3
0.4
0.5
0.6
0.7
AROMO
GC
(d)
Figure 3: The relationships between GC content, gene length, and amino acid properties for RNA viruses. (a) GC-gene length relationshipwithout transformation: GC = −3.19𝐸 − 06 × gene lengths + 0.463 (𝑅2 = 0.021, 𝑃 < 0.0001); (b) GC-gene length relationship with log-transformation: log
𝑒(GC) = −0.0227 × log
𝑒(gene lengths) − 0.629 (𝑅2 = 0.021, 𝑃 < 0.001); (c) GC-hydrophobicity relationship: GC =
−0.009 × GRAVY + 0.452 (𝑅2 = 0.01, 𝑃 < 0.05); (d) GC-aromaticity relationship: GC = −1.154 × AROMO + 0.555 (𝑅2 = 0.159, 𝑃 < 0.001).
only 5% of total variation of codon usage patterns attributedto selection pressure. The interaction between mutationand selection further explained 10% of total variation. Verysimilarly, for RNA viruses (Figure 6(b)), mutational pressureexplained 21% of the total variation in codon usage patterns,while natural selection explained 6% of the total variation.The interaction of both mechanisms further explained 8% ofthe total variation.
4. Discussion
4.1. The Relationship between GC Variation and CodonUsage Factors. Interestingly, it is found that the correlationbetween GC content and hydrophobicity and gene lengths is
positive and significant for DNA viruses (Figures 2(a)–2(c)),while being negative and significant of RNA viruses(Figures 3(a)–3(c)). In contrast, the tendency between GCversus aromaticity is always negative (Figures 2(d) and 3(d)).The positive correlation between GC and hydrophobicityfor RNA viruses is contradictory to some previous studiesworking on specific RNA virus species or clades, whichargued that the correlation should be positive [33]. Moreover,it is still controversial whether there is a clear correlationfor a specific virus or a clade of viruses. Some previousstudies [3, 34] concluded that there was no clear relationshipbetween these two quantities.
I do not observe a congruent relationship betweenGC content and gene lengths for DNA and RNA viruses
BioMed Research International 7
0.0 0.2 0.4 0.6 0.8 1.0
0.1
0.2
0.3
0.4
0.5
GC3s
GC1
2
(a)
0.2 0.3 0.4 0.5 0.6 0.7 0.8
0.20
0.25
0.30
0.35
0.40
0.45
GC3s
GC1
2
(b)
Figure 4: The relationship between GC12 and GC3s of DNA (a) and RNA (b) virus genomes. The fitted regression line has the formula asGC12 = 0.202 ×GC3s + 0.203(𝑅2 = 0.461, 𝑃 < 0.0001) for DNA viruses and GC12 = 0.225 ×GC3s + 0.206(𝑅2 = 0.461, 𝑃 < 0.0001) for RNAviruses, respectively.
(Figures 2(a), 2(b), 3(a), and 3(b)). Based on some predic-tions, GC content should be correlated with gene lengthsince selection should be stronger in longer genes, causingthe directional change of GC content [35–38]. Indeed, GChas been thought to relate to gene lengths in prokaryotes,plants, nematodes, or insects [2, 22, 35, 36, 39], althoughthe relationship among these taxa is still debatable [40]. Onthe basis of the results for DNA and RNA virus genomesat the present study, I argue that there is no consistentrelationship between GC profiling and gene lengths forviruses. As shown in Figures 2(a) and 2(b), for DNA viruses,the relationship between GC and gene lengths is positive,implying the imprint of natural selection. However, for RNAviruses (Figures 3(a) and 3(b)), the relationship becomesnegative, being opposite to the prediction of natural selection.This is not surprising, because RNA viruses are believed tohave much higher mutation rates than DNA viruses [12, 28,41]. At this perspective, viruses are different to other lifeforms from other kingdoms, in which natural selection playsdifferential roles to influence the stability of longer genes ofDNA and RNA viruses.
It is found that the prescreening and removal of short-length ORFs are very crucial to obtain accurate trendsbetween GC and codon usage indices. For example, thenegative relationship between GC and hydrophobicity maybecome obscured when more short-length ORFs (less than350 bp) are included in the study for DNA viruses.The corre-lation will become nonsignificant (results not showed here).
4.2. Virus Genomes Are Profoundly Influenced by MutationPressure. Based on the results of variation partitioning, thepresent study identifies that mutational pressure is the mostprevailing mechanism driving the codon usage bias patternsfor both DNA and RNA viruses (Figure 6), because it canexplain 27% and 21% of total variation, respectively, in codon
usage patterns of both groups of viruses. In contrast, theinfluence of natural selection is very minor, only explaining5% and 6% of the total variation, respectively, for bothgroups of viruses. Previous studies on a single or a clade ofviruses largely have confirmed the dominating influence ofmutational pressure [6, 10, 42, 43], but many studies alsomentioned the considerable importance of selection [29, 44].Thus, through the present intergenomic analysis, I have achance to quantify the relative importance ofmutation versusselection on structuring codon usage patterns of viruses,and the similar conclusion is enforced: natural selection isnot so important in comparison to mutational pressure insynonymous codon usage patterns of viruses.
Through correlation analysis between codon usageindices and major axes from CA and CCA analyses, thepresent study identifies that the three most important indicesare GC, GC3s, and A3s. Thus, the present results are contra-dictorywith a previous study [13] which showed that genomicnucleotide content was the most important factor predictingsynonymous codon usage patterns in RNA viruses using ran-domization techniques.The difference raisedmay be partiallydue to the studied data size. In the previous study [13], only29 RNA virus species were examined. This number is a verysmall number in comparison to the present study whichworks on 725RNAviruses.Thus, the conclusion from the pre-vious study [13] stating that GC content was a poor predictorof codon usage patterns of RNA viruses may be challengingif the authors can work on a large number of RNA viruses.
Finally, as implied by a large fraction of the unexplainedvariation (over 50%) for both groups of viruses, my quan-tification of mutational pressure and natural selection byutilizing the present ten codon usage variables might notbe sufficient to quantify the relative importance of muta-tional pressure and natural selection. Other more importantvariables, especially those for characterizing natural selection
8 BioMed Research International
CA1
CA2
−1.0 −0.5 0.0 0.5 1.0
−1.0
−0.5
0.0
0.5
1.0
(a)
0.0 0.5 1.0 1.5CA1
CA2
−0.6
−0.4
−0.2
0.0
0.2
0.4
0.6
−0.5
(b)
CCA1
CCA
2
T3s
C3sA3s G3s
GC3s
GC
CAI
Nc
GRAVYAROMO
6
4
2
0
−2
−4
−6 −4 −2 0 2 4 6
1
0
−1
(c)
CCA1
CCA
2
T3s
C3s
A3s
G3sGC3sGC
CAI
Nc
GRAVYAROMO
2
0
−2
−4
−2 0 2 4 6
1
0
−1
(d)
Figure 5: CA plots and CCA biplots for showing the major trends of codon usage patterns of the ORFs for DNA and RNA viruses. (a) CAplot for DNA viruses; (b) CA plot for RNA viruses; (c) CCA biplot for DNA viruses; (d) CCA biplot for RNA viruses.
27% 5%10%
58%
R1 R2
R0
R1∩2
(a)
21% 6%8%
65%
R1 R2
R0
R1∩2
(b)
Figure 6: Variation partitioning of codon usage patterns attributed tomutation and selection for DNA (a) and RNA (b) viruses.Themeaningof each part of the variation is interpreted as follows, 𝑅
1: proportion of variation explained by mutation; 𝑅
2: proportion of variation explained
by selection; 𝑅1∩2
: proportion of variation explained by the interaction of selection and mutation; 𝑅0: proportion of unexplained variation.
BioMed Research International 9
(e.g., the frequency of usage of optimal codons [45]), mightincrease the explanatory power of natural selection on codonusage patterns of virus genomes.
4.3. Limitations of the Present Study. I have to acknowledgethat the recombination events happened at either gene orgenome levels can influence the codon usage bias patterns tosome extent, as evidenced by some previous studies [46–48].Virus genomes have been broadly observed to process somedegrees of homologous recombination [49–52]. As such, itwould be a contribution when ones eliminate the influenceof homologous recombination in the virus genomes beforeanalyzing codon usage patterns to accurately disentangle therelative importance of mutation and selection.
Acknowledgments
The author thanks the Associate Editor Dr. Sankar Subrama-nian and two anonymous reviewers for their constructive andcritical comments on helping improve the quality of the text.This work is supported by China Scholarship Council (CSC).
References
[1] M. Archetti, “Codon usage bias and mutation constraintsreduce the level of error minimization of the genetic code,”Journal of Molecular Evolution, vol. 59, no. 2, pp. 258–266, 2004.
[2] L. Duret and D. Mouchiroud, “Expression pattern and, surpris-ingly, gene length shape codon usage in Caenorhabditis, Dro-sophila, and Arabidopsis,” Proceedings of the National Academyof Sciences of the United States of America, vol. 96, no. 8, pp.4482–4487, 1999.
[3] P. Tao, L. Dai, M. Luo, F. Tang, P. Tien, and Z. Pan, “Analysis ofsynonymous codon usage in classical swine fever virus,” VirusGenes, vol. 38, no. 1, pp. 104–112, 2009.
[4] E. N. Moriyama and J. R. Powell, “Codon usage bias and tRNAabundance in Drosophila,” Journal of Molecular Evolution, vol.45, no. 5, pp. 514–523, 1997.
[5] G. P. Holmquist and J. Filipski, “Organization of mutationsalong the genome: a prime determinant of genome evolution,”Trends in Ecology and Evolution, vol. 9, no. 2, pp. 65–69, 1994.
[6] X. Liu, C.Wu, andA.Y.-H.Chen, “Codonusage bias and recom-bination events for neuraminidase and hemagglutinin genes inChinese isolates of influenza A virus subtype H9N2,” Archivesof Virology, vol. 155, no. 5, pp. 685–693, 2010.
[7] Y. Zhang, Y. Liu, W. Liu et al., “Analysis of synonymous codonusage in Hepatitis A virus,” Virology Journal, vol. 8, article 174,2011.
[8] F. P. Lobo, B. E. F. Mota, S. D. J. Pena et al., “Virus-host coevolu-tion: common patterns of nucleotidemotif usage in Flaviviridaeand their hosts,” PLoS ONE, vol. 4, no. 7, Article ID e6282, 2009.
[9] A. Lukashev, J. Drexler, I. Belalov, M. Eschbach-Bludau, S.Baumgrate, and C. Drosten, “Genetic variation and recombi-nation in Aichi virus,” Journal of General Virology, vol. 93, pp.1226–1235, 2012.
[10] J. Zhang, M. Wang, W.-Q. Liu et al., “Analysis of codon usageand nucleotide composition bias in polioviruses,”Virology Jour-nal, vol. 8, article 146, 2011.
[11] L. A. Shackelton and E. C. Holmes, “The evolution of large DNAviruses: combining genomic information of viruses and theirhosts,”Trends inMicrobiology, vol. 12, no. 10, pp. 458–465, 2004.
[12] G. M. Jenkins and E. C. Holmes, “The extent of codon usagebias in human RNA viruses and its evolutionary origin,” VirusResearch, vol. 92, no. 1, pp. 1–7, 2003.
[13] I. Belalov and A. Lukashev, “Causes and implications of codonusage bias in RNAviruses,” PLoSONE, vol. 8, Article ID e56642,2013.
[14] P. M. Sharp and W.-H. Li, “Codon usage in regulatory genesin Escherichia coli does not reflect selection for ’rare’ codons,”Nucleic Acids Research, vol. 14, no. 19, pp. 7737–7749, 1986.
[15] F. Wright, “The ‘effective number of codons’used in a gene’,” Gene, vol. 87, pp. 23–29, 1990.
[16] P. M. Sharp and W.-H. Li, “The codon adaptation index-ameasure of directional synonymous codon usage bias, and itspotential applications,”Nucleic Acids Research, vol. 15, no. 3, pp.1281–1295, 1987.
[17] J. Peden, Analysis of codon usage [Ph.D. thesis], Department ofGenetics; Unviersity of Norttingham, 1999.
[18] C. J. F. Ter Braak, “Canonical correspondence analysis: a neweigenvector technique for multivariate direct gradient analysis,”Ecology, vol. 67, no. 5, pp. 1167–1179, 1986.
[19] P. Legendre and L. Legendre, Numerical Ecology, Elsevier Sci-ence BV, Amsterdam, The Netherlands, 1998.
[20] P. Legendre, J. Oksanen, and C. Ter Braak, “Testing the signif-icance of canonical axes in redundancy analysis,” Methods inEcology and Evolution, vol. 2, pp. 269–277, 2011.
[21] P. R. Peres-Neto, P. Legendre, S. Dray, and D. Borcard, “Varia-tion partitioning of species data matrices: estimation and com-parison of fractions,” Ecology, vol. 87, no. 10, pp. 2614–2625,2006.
[22] H. Liu, R. He, H. Zhang, Y. Huang, M. Tian, and J. Zhang,“Analysis of synonymous codon usage in Zea mays,” MolecularBiology Reports, vol. 37, no. 2, pp. 677–684, 2010.
[23] P. Legendre, D. Borcard, and P. R. Peres-Neto, “Analyzing betadiversity: partitioning the spatial variation of community com-position data,” Ecological Monographs, vol. 75, no. 4, pp. 435–450, 2005.
[24] D. Borcard, P. Legendre, and P. Drapeau, “Partialling out thespatial component of ecological variation,” Ecology, vol. 73, no.3, pp. 1045–1055, 1992.
[25] R. Development Core Team, “R: A Language andEnvironment for Statistical Computing, Vienna, Austria,”R Foundation for Statistical Computing, Vienna, Austria, 2011,http://www.R-project.org.
[26] J. Oksanen, G. Blanchet, R. Kindt et al., “Vegan: CommunityEcology Package. R package version 2. 0-4,” 2012.
[27] J. Peden, “CodonW,” 2005, http://codonw.sourceforge.net/.[28] T. Zhou, W. Gu, J. Ma, X. Sun, and Z. Lu, “Analysis of synony-
mous codon usage inH5N1 virus and other influenzaA viruses,”BioSystems, vol. 81, no. 1, pp. 77–86, 2005.
[29] S. Shi, Y. Jiang, Y. Liu, R. Xia, and L. Qin, “Selective pressuredominates the synonymous codon usage in parvoviridae,”VirusGenes, vol. 40, pp. 10–19, 2013.
[30] C. Fu, J. Xiong, andW. Miao, “Genome-wide identification andcharacterization of cytochrome P450 monooxygenase genes inthe ciliate Tetrahymena thermophila,” BMC Genomics, vol. 10,article 208, 2009.
[31] N. Sueoka, “Translation-coupled violation of Parity Rule 2 inhuman genes is not the cause of heterogeneity of the DNAG+Ccontent of third codon position,”Gene, vol. 238, no. 1, pp. 53–58,1999.
10 BioMed Research International
[32] N. Sueoka, “Intrastrand parity rules of DNA base compositionand usage biases of synonymous codons,” Journal of MolecularEvolution, vol. 40, no. 3, pp. 318–325, 1995.
[33] M. Wang, J. Zhang, J.-H. Zhou et al., “Analysis of codon usagein bovine viral diarrhea virus,” Archives of Virology, vol. 156, no.1, pp. 153–160, 2011.
[34] H. W. Cao, H. Zhang, Y. Liu, and D. S. Li, “Synonymous codonusage bias of spike genes of porcine epidemic diarrhea virus,”African Journal of Microbiology Research, vol. 5, no. 22, pp.3784–3789, 2011.
[35] N. Stoletzki, “The surprising negative correlation of gene lengthand optimal codon use—disentangling translational selectionfrom GC-biased gene conversion in yeast,” BMC EvolutionaryBiology, vol. 11, no. 1, article 93, 2011.
[36] N. Stoletzki and A. Eyre-Walker, “Synonymous codon usage inEscherichia coli: selection for translational accuracy,”MolecularBiology and Evolution, vol. 24, no. 2, pp. 374–381, 2007.
[37] M. D. Ermolaeva, “Synonymous codon usage in bacteria,” Cur-rent Issues in Molecular Biology, vol. 3, no. 4, pp. 91–97, 2001.
[38] A. Eyre-Walker, “Synonymous codon bias is related to genelength in Escherichia coli: selection for translational accuracy?”Molecular Biology and Evolution, vol. 13, no. 6, pp. 864–872,1996.
[39] G.Marais and L. Duret, “Synonymous codon usage, accuracy oftranslation, and gene length in Caenorhabditis elegans,” Journalof Molecular Evolution, vol. 52, no. 3, pp. 275–280, 2001.
[40] T. Zhou, X. Sun, and Z. Lu, “Synonymous codon usage inenvironmental chlamydia UWE25 reflects an evolutional diver-gence from pathogenic chlamydiae,” Gene, vol. 368, no. 1-2, pp.117–125, 2006.
[41] J. W. Drake and J. J. Holland, “Mutation rates among RNAviruses,” Proceedings of the National Academy of Sciences of theUnited States of America, vol. 96, no. 24, pp. 13910–13913, 1999.
[42] V. V. Khrustalev and E. V. Barkovsky, “Mutational pressure isa cause of inter- and intragenomic differences in GC-contentof simplex and varicello viruses,” Computational Biology andChemistry, vol. 33, no. 4, pp. 295–302, 2009.
[43] W.-Q. Liu, J. Zhang, Y.-Q. Zhang et al., “Compare the differencesof synonymous codon usage between the two species withincardiovirus,” Virology Journal, vol. 8, article 325, 2011.
[44] J. Zhou, Z. Gao, J. Sun et al., “A comparative analysis on thesynonymous codon usage pattern in viral functional genes andtheir translational initiation region of ASFV,” Virus Genes, vol.46, no. 2, pp. 271–279, 2013.
[45] T. Ikemura, “Correlation between the abundance of Escherichiacoli transfer RNAs and the occurrence of the respective codonsin its protein genes: a proposal for a synonymous codon choicethat is optimal for the E. coli translational system,” Journal ofMolecular Biology, vol. 151, no. 3, pp. 389–409, 1981.
[46] T. Zhou, Z. H. Lu, and X. Sun, “The correlation betweenrecombination rate and codon bias in yeast mainly resultsfrommutational bias associatedwith recombination rather thanhill-robertson interference,” in Proceedings of the 27th AnnualInternational Conference of the Engineering in Medicine andBiology Society (IEEE-EMBS ’05), pp. 4787–4790, September2005.
[47] G. Marais, D. Mouchiroud, and L. Duret, “Does recombinationimprove selection on codon usage? Lessons from nematode andfly complete genomes,” Proceedings of the National Academy ofSciences of the United States of America, vol. 98, no. 10, pp. 5688–5692, 2001.
[48] S. Behura and D. Severson, “Codon usage bias: causative fac-tors, quantification methods and genome-wide patterns: withemphasis on insect genomes,” Biological Reviews, vol. 88, pp.49–61, 2013.
[49] M. Worobey, “Extensive homologous recombination amongwidely divergent TT viruses,” Journal of Virology, vol. 74, no. 16,pp. 7666–7670, 2000.
[50] E. van derWalt, E. P. Rybicki, A. Varsani et al., “Rapid host adap-tation by extensive recombination,” Journal of General Virology,vol. 90, no. 3, pp. 734–746, 2009.
[51] G.-Z. Han and M. Worobey, “Homologous recombination innegative sense RNAviruses,”Viruses, vol. 3, no. 8, pp. 1358–1373,2011.
[52] C.-Q. He, Z.-X. Xie, G.-Z. Han et al., “Homologous recombi-nation as an evolutionary force in the avian influenza A virus,”Molecular Biology and Evolution, vol. 26, no. 1, pp. 177–187, 2009.

Submit your manuscripts athttp://www.hindawi.com
Hindawi Publishing Corporationhttp://www.hindawi.com Volume 2014
Anatomy Research International
PeptidesInternational Journal of
Hindawi Publishing Corporationhttp://www.hindawi.com Volume 2014
Hindawi Publishing Corporation http://www.hindawi.com
International Journal of
Volume 2014
Zoology
Hindawi Publishing Corporationhttp://www.hindawi.com Volume 2014
Molecular Biology International
GenomicsInternational Journal of
Hindawi Publishing Corporationhttp://www.hindawi.com Volume 2014
The Scientific World JournalHindawi Publishing Corporation http://www.hindawi.com Volume 2014
Hindawi Publishing Corporationhttp://www.hindawi.com Volume 2014
BioinformaticsAdvances in
Marine BiologyJournal of
Hindawi Publishing Corporationhttp://www.hindawi.com Volume 2014
Hindawi Publishing Corporationhttp://www.hindawi.com Volume 2014
Signal TransductionJournal of
Hindawi Publishing Corporationhttp://www.hindawi.com Volume 2014
BioMed Research International
Evolutionary BiologyInternational Journal of
Hindawi Publishing Corporationhttp://www.hindawi.com Volume 2014
Hindawi Publishing Corporationhttp://www.hindawi.com Volume 2014
Biochemistry Research International
ArchaeaHindawi Publishing Corporationhttp://www.hindawi.com Volume 2014
Hindawi Publishing Corporationhttp://www.hindawi.com Volume 2014
Genetics Research International
Hindawi Publishing Corporationhttp://www.hindawi.com Volume 2014
Advances in
Virolog y
Hindawi Publishing Corporationhttp://www.hindawi.com
Nucleic AcidsJournal of
Volume 2014
Stem CellsInternational
Hindawi Publishing Corporationhttp://www.hindawi.com Volume 2014
Hindawi Publishing Corporationhttp://www.hindawi.com Volume 2014
Enzyme Research
Hindawi Publishing Corporationhttp://www.hindawi.com Volume 2014
International Journal of
Microbiology