requirements for building information modeling based...
TRANSCRIPT
Requirements for building information modeling based lean production management systems for construction Article
Accepted Version
Sacks, R., Radosavljevic, M. and Barak, R. (2010) Requirements for building information modeling based lean production management systems for construction. Automation in Construction , 19 (5). pp. 641655. ISSN 09265805 doi: https://doi.org/10.1016/j.autcon.2010.02.010 Available at http://centaur.reading.ac.uk/8127/
It is advisable to refer to the publisher’s version if you intend to cite from the work. Published version at: http://www.sciencedirect.com/science?_ob=ArticleURL&_udi=B6V204YRPMVH1&_user=333848&_coverDate=08%2F31%2F2010&_rdoc=1&_fmt=high&_orig=search&_origin=search&_sort=d&_docanchor=&view=c&_searchStrId=1499669417&_rerunOrigin=scholar.google&_acct=C000017279&_
To link to this article DOI: http://dx.doi.org/10.1016/j.autcon.2010.02.010
Publisher: Elsevier Science
All outputs in CentAUR are protected by Intellectual Property Rights law, including copyright law. Copyright and IPR is retained by the creators or other copyright holders. Terms and conditions for use of this material are defined in the End User Agreement .
www.reading.ac.uk/centaur

CentAUR
Central Archive at the University of Reading
Reading’s research outputs online
Requirements for Building Information Modeling based Lean Production Management Systems for Construction Accepted 2/2010 for Automation in Construction © 2010 Sacks, Radosavljevic, Barak
1
Requirements for Building Information Modeling based Lean
Production Management Systems for Construction
Rafael Sacks1, Milan Radosavljevic2, Ronen Barak3
Abstract
Smooth flow of production in construction is hampered by disparity between individual trade teams’
goals and the goals of stable production flow for the project as a whole. This is exacerbated by the
difficulty of visualizing the flow of work in a construction project. While the addresses some of the
issues in Building information modeling provides a powerful platform for visualizing work flow in
control systems that also enable pull flow and deeper collaboration between teams on and off site.
The requirements for implementation of a BIM-enabled pull flow construction management
software system based on the Last Planner SystemTM, called 'KanBIM', have been specified, and a set
of functional mock-ups of the proposed system has been implemented and evaluated in a series of
three focus group workshops. The requirements cover the areas of maintenance of work flow
stability, enabling negotiation and commitment between teams, lean production planning with
sophisticated pull flow control, and effective communication and visualization of flow. The
evaluation results show that the system holds the potential to improve work flow and reduce waste
by providing both process and product visualization at the work face.
Keywords
Building Information Modeling; Lean construction; Process visualization; Production control; KanBIM
1 Corresponding author: Assoc. Prof., Faculty of Civil and Env. Eng., Technion - Israel Institute of Technology,
Haifa, Israel; [email protected] 2 Lecturer, School of Construction Management and Engineering, University of Reading, Reading, UK;
[email protected] 3 Adjunct Lecturer, Faculty of Civil and Env. Eng., Technion - Israel Institute of Technology, Haifa, Israel;
Requirements for Building Information Modeling based Lean Production Management Systems for Construction Accepted 2/2010 for Automation in Construction © 2010 Sacks, Radosavljevic, Barak
2
Introduction
Construction projects typically involve multiple discrete organizations working simultaneously on
congested sites. They suffer from waste that is manifested in waiting time for crews, rework,
unnecessary movement and handling of materials, unused inventories of workspaces and of
materials, etc. Achieving smooth work flow with minimal waste requires not only appropriate
construction planning, but also effective production management.
Lean thinking applied to construction has led to development of planning and control systems and
other practices that improve matters. Koskela’s ‘Transformation-Flow-Value’ (TFV) conceptualization
of production in construction [1] provides a theoretical basis for appreciating the flow and value
aspects of construction in addition to the well established transformation view. Applied research
using discrete event simulation has clearly shown the adverse impact of variation in production and
delivery rates [2,3] and the benefits of pull flow of trade teams according to information maturity
[4].
In practice, the Last Planner System™ (LPS) [5] and adaptations of it are increasingly applied to
reduce variation, improve coordination and work flow, and thus to reduce various forms of waste in
construction projects. While a detailed explanation of the LPS is beyond the scope of this paper, we
list the principles that underpin it as they are the foundation for much of what follows. Koskela [6]
outlined five principles for a production control system:
assignments should be sound regarding their prerequisites (i.e. constraints must be
released)
the realization of assignments is measured and monitored (in LPS the percent plan complete
measure serves this purpose)
causes for non-realization are investigated and those causes are removed
a buffer of unassigned tasks which are sound for each crew is maintained
Requirements for Building Information Modeling based Lean Production Management Systems for Construction Accepted 2/2010 for Automation in Construction © 2010 Sacks, Radosavljevic, Barak
3
in look ahead planning, the prerequisites of upcoming assignments are actively made ready
In his definitive work on the LPS [5], Ballard added the following:
Variability must be mitigated and remaining variability managed
The traditional schedule-push system is supplemented with pull techniques
Production control facilitates work flow and value generation
The project is conceived as a temporary production system
Decision making is distributed in production control systems
Production control resists the tendency toward local sub-optimization
The LPS was designed to be applied with minimal, if any, information technology support.
Nevertheless, effective production management in construction projects with large numbers of
essentially independent work teams and extensive distinct spaces (such as office towers, shopping
malls, etc.) remains difficult to achieve. A number of factors make coordination between the trade
contractor teams, material and equipment suppliers, construction management personnel, and
designers and inspectors difficult. Among them:
physical dispersion of the teams within the building or across the site, where they are
usually hidden from one another by the structure itself;
contracting relationships with remuneration terms that encourage local optimization and
work against overall project optimization [7];
complex variations in productivity rates [8], which makes it very difficult to predict short
term progress;
lack of effective real-time reporting of progress, despite multiple research efforts aimed at
automating this aspect of project control [9];
Requirements for Building Information Modeling based Lean Production Management Systems for Construction Accepted 2/2010 for Automation in Construction © 2010 Sacks, Radosavljevic, Barak
4
dependence on key individuals to obtain and communicate critical information regarding
constraint status to the look ahead and last planner functions;
reliance on paper documents to communicate product information, with the limitations of
design documentation errors, lack of clarity and potential obsolescence of information [10];
While the LPS reduces variation by improving the reliability of short-term planning, it does not
achieve pull flow in the pure sense in that it does not prioritize tasks in relation to signals from
downstream demand. In lean production in manufacturing settings, pull flow is implemented using
‘Kanban’ systems [11]. In manufacturing plants, process visualizations are used to provide flow
signals to workers and to empower them to adjust flow to suit the overall system pace [12]. On
construction sites, where work teams, not products, move, it is very difficult to visualize the flow of
the work in progress and to communicate its status to the teams and individuals involved. The
amount of buffered work-in-progress (WIP) accumulated between work teams cannot be seen by
the naked eye in the same way that piles of products that constitute WIP can be seen accumulating
between processing stations in a manufacturing plant [13].
Another problem is that the most common cycle time used with the LPS is one week (called 'weekly
work planning'). The weekly response time is too long to avoid waste in the case of tasks whose
constraints are only resolved within days prior to their execution. For example, the maturity of
building finishing works that have short task durations and multiple and varying dependencies on
information, preceding tasks and equipment, cannot be guaranteed in advance of a one-week
window. Where the LPS is used with a shorter planning window (e.g. [14]), it has been done on
projects where work is narrowly focused and all participants can easily see the process status, unlike
the case of finishing works in large buildings.
Finally, as implemented in practice, the weekly work plans do not make any a priori provision for
structured experimentation that could facilitate continuous improvements; rather, the percent-plan
complete measure is compiled, which enables retrospective learning from failure, but not planned
Requirements for Building Information Modeling based Lean Production Management Systems for Construction Accepted 2/2010 for Automation in Construction © 2010 Sacks, Radosavljevic, Barak
5
learning from success. Although the formulators of the LPS envisioned that it would support learning
from success, the pressures of day-to-day construction make recording of success for learning (both
within and beyond the current project) impractical. A computerized system with automated
recording and reporting might obviate this difficulty.
To address these issues, we propose that production management systems for construction should
be based on BIM platforms and introduce Kanban style pull process flow and Andon alerts. We call
this concept ‘KanBIM’. We hypothesize that a software system that supplements the LPS by
providing ubiquitous access to 3D visualizations of process status and future direction, delivered to
all on site and enabling real-time feedback of process status, including Kanban card type pull flow
control signals and Andon alerts, can empower people to manage the day to day flow of
construction operations with greater reliability and less variability than can be achieved without
such a system. The following sections of this paper outline the state of the art, describe the goals
and method of a research program underway to develop the KanBIM concept, and establish the
requirements for the modes of operation of future KanBIM type software systems.
State of the Art in Software Systems for Production Management in
Construction
With few notable exceptions, most of the academic and industrial research on computer-aided
design and visualization in construction deals with building design and with pre-construction
planning. There has been far less effort to develop Building Information Modeling (BIM) based tools
to support coherent production management on site.
The 4D CAD concept [15] has been implemented commercially in dedicated construction planning
software (such as CommonPoint [16] and Synchro [17]) and has also been incorporated in fully-
fledged BIM tools. Akinci et al. [18] demonstrated how work spaces and temporary facilities could be
generated and added to 3D building design models to enable evaluation of construction plans for
Requirements for Building Information Modeling based Lean Production Management Systems for Construction Accepted 2/2010 for Automation in Construction © 2010 Sacks, Radosavljevic, Barak
6
space conflicts. Some systems incorporate cost as a ‘fifth dimension’ of project information and aim
to enable ‘virtual construction’ [19]. These are appropriate for pre-construction planning and
monitoring schedules, but not for day to day production management, because they do not support
fine-grained collaborative task negotiation and planning between teams, their displays are not
intended for work crews on site, they do not support pull flow control, they do not support explicit
checking and removal of constraints, and they do not define activities with sufficient degrees of
detail.
Songer et al. (2000) proposed to integrate workflow modeling with 3D CAD to enable visualization of
project performance. Two examples of software that implement lean construction flow control, but
do not use building models to support visualization, are Choo et al.’s [20] ‘WorkPlan’ system, which
applied a database of work packages and constraints to support the Last Planner System process,
and SPS, a commercial package that helps reduce supply chain variations [21].
The Lean Enterprise Web-based Information System (LEWIS) proposed by Sriprasert and Dawood
[22] is a sophisticated integration of a building model, a decision support system that performs
optimization of construction plans using an evolutionary algorithm, and 4D visualization delivered on
a web-based and mobile information management system. It is rooted in the LPS approach in so far
as it aims to enable generation of reliable plans and constraint-free execution assignments. The
implementation included graphical depiction of constraints, such as material deliveries, by color-
coding objects in a building model view. ConstructSim [23] is a commercial software package which
offers model-based work planning (including detailing master plan level activities into detailed 'work
packs' for fine-grained production planning), constraint checking by associating building model
objects with external supply chain information systems, and visualization of project and work status
by color-coding of model objects. Both LEWIS and ConstrucSim fulfill a number of the requirements
defined in this paper, but both stop short of direct engagement of the 'last planners' (the trade
managers and crew leaders) themselves in operating the system. Their interfaces are designed to be
Requirements for Building Information Modeling based Lean Production Management Systems for Construction Accepted 2/2010 for Automation in Construction © 2010 Sacks, Radosavljevic, Barak
7
operated by engineering management. Neither system provides explicit support for online
negotiation of weekly work plans, nor does it support explicit pull flow control. Their process status
and forecast visualization are product-centric, in that they make the progression of production
visible by displaying the current and future states of the building or plant, but do not explicitly show
the locations of work teams or work in progress. TOKMO [24] is a more advanced commercial
system, but it too is primarily a desktop solution that does not deal with the dynamics of day to day
information delivery and reporting at the workface itself.
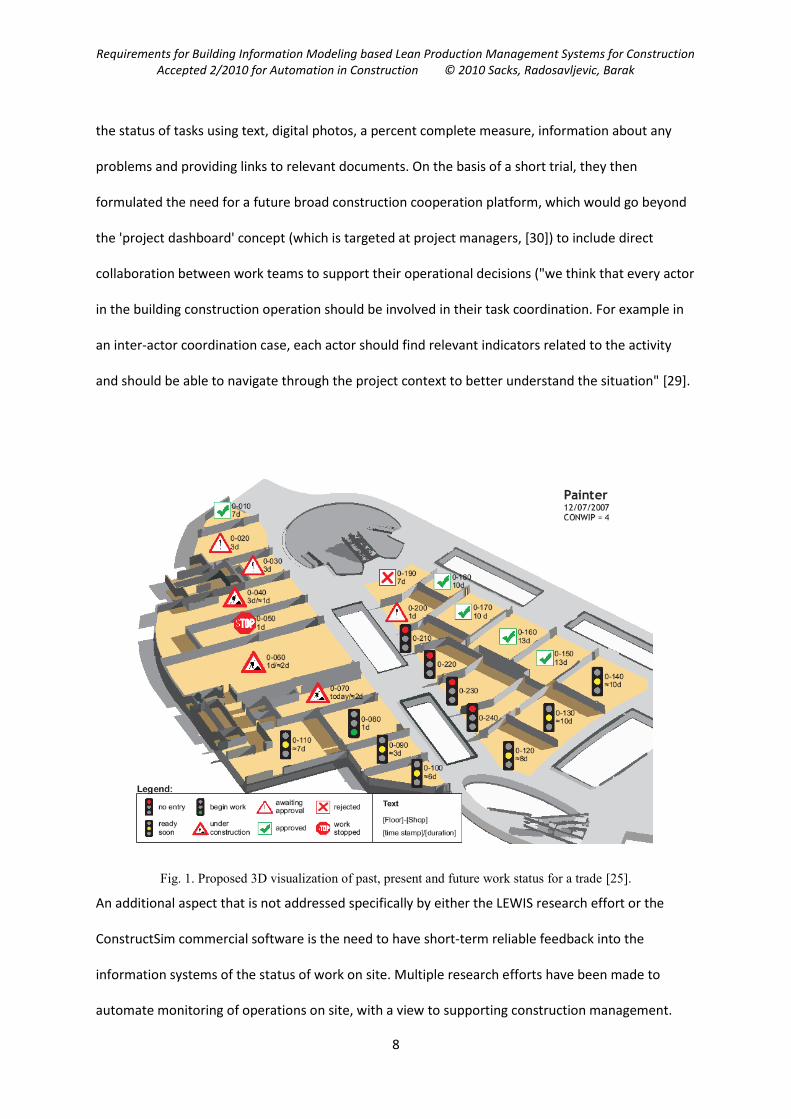
An earlier attempt to address these shortcomings, particularly the need to make the project status,
not only the product status, visible, used a reporting interface that incorporated symbols akin to
traffic signs [25] (see Fig. 1). It was developed to communicate project status to finishing works
subcontractors for a shopping mall project, and was based on an earlier experimental interface
devised for apartment finishing works. Hewage and Ruwanpura [26] deployed an 'information
booth' with a display screen and printer to communicate up-to-date information to workers at the
work face, and reported improved levels of productivity due to less time wasted by workers seeking
design information. This was restricted to product information and provided only one-way
communication.
These few exceptions, in contrast with the rich array of BIM and construction planning software
available, reveals neglect of production management on the part of researchers and developers of
information technology in construction. This neglect reflects the decline in attention paid to
production management on the part of general contractors and construction managers highlighted
by Koskela and Howell [27]. For various reasons, construction companies have adopted a hollowed-
out business model by reducing core staff to a minimum and implementing work through
subcontracting [28]. A result of this is the need for fine-grained coordination between work teams
that belong to disparate organizations. Kubicki et al. [29] identified the potential to support this
need using information technologies. They developed a prototype web interface to communicate
Requirements for Building Information Modeling based Lean Production Management Systems for Construction Accepted 2/2010 for Automation in Construction © 2010 Sacks, Radosavljevic, Barak
8
the status of tasks using text, digital photos, a percent complete measure, information about any
problems and providing links to relevant documents. On the basis of a short trial, they then
formulated the need for a future broad construction cooperation platform, which would go beyond
the 'project dashboard' concept (which is targeted at project managers, [30]) to include direct
collaboration between work teams to support their operational decisions ("we think that every actor
in the building construction operation should be involved in their task coordination. For example in
an inter-actor coordination case, each actor should find relevant indicators related to the activity
and should be able to navigate through the project context to better understand the situation" [29].
Fig. 1. Proposed 3D visualization of past, present and future work status for a trade [25].
An additional aspect that is not addressed specifically by either the LEWIS research effort or the
ConstructSim commercial software is the need to have short-term reliable feedback into the
information systems of the status of work on site. Multiple research efforts have been made to
automate monitoring of operations on site, with a view to supporting construction management.
Requirements for Building Information Modeling based Lean Production Management Systems for Construction Accepted 2/2010 for Automation in Construction © 2010 Sacks, Radosavljevic, Barak
9
These have included monitoring of workers [31], monitoring of construction equipment, such as
tower cranes [32], and scanning or image-recognition to identify work completed or as-built
conditions [33]. However, the driving model for many of these is the notion of contract management
rather than production management. They aim to measure actual performance and compare it to
measured performance, so that appropriate corrective action can be taken where necessary. A
better approach is to involve the people performing the work to provide status reports, but in ways
that do not encumber them with additional tasks. The linkage of field software and hardware with
BIM systems, such as that developed by Vela Systems and Tekla corporation [34], use RFID tracking
and reporting from site personnel to update project status in real-time, achieve this by reading and
interpreting data directly from hand-written forms filled in during the normal course of work.
Goals and Method
The goal of the KanBIM research as a whole is to propose, develop and test a BIM-enabled system to
support production planning and day to day production control on construction sites. A system has
been specified based on analysis of the literature on production control in construction, on the
results of earlier research efforts [25,35], and on study of production management practices in two
major construction management firms (in London and Helsinki).
Since no comparable systems exist, and no existing software could be adapted for the purposes of
evaluation of the proposed KanBIM system, the research method involved four steps:
a) Definition of the requirements;
b) Process analysis and system design;
c) Programming of functional mock-ups of its interfaces;
d) Evaluation of the system in focus group workshop evaluation sessions.
Requirements for Building Information Modeling based Lean Production Management Systems for Construction Accepted 2/2010 for Automation in Construction © 2010 Sacks, Radosavljevic, Barak
10
In the first step, a set guiding principles was defined based on previous research and the literature.
The principles were refined and elaborated through the experience gained in the following steps
(steps c) and d) where iterated in three formal cycles).
System design began with preparation of a detailed ‘future state’ process flow map of the work flow
envisaged for production planning and day to day production control on construction sites. The
information system required to support the process was then derived, and defined in a system
architecture plan. This step also required selection of the delivery methods (hardware) for each
interface.
In step c), functional mock-ups were prepared for the main user interfaces. The mock-ups sought to
provide sufficiently complete functionality to thoroughly demonstrate the system’s intended modes
of operation. These user-interfaces cover the stages of a) preparation by trades for weekly work
planning meetings, b) negotiation between trade crews prior to and during weekly work planning
meetings with the construction management team, and c) day to day interaction with trade crew
leaders on the job site. Programming of the functional mock-ups served not only the evaluation
step, but was in and of itself a formative activity in testing the assumptions made in defining the
work flow and the system architecture, applying to them a rigor that could not have been achieved
otherwise.
The user interfaces were evaluated in three focus group workshops which each involved
construction managers, trade team managers, and team leaders. Two workshops were held in the
UK and one in Finland. Qualitative rating-supported evaluation was preferred over a quantitative
and entirely rating-based evaluation. The system was demonstrated to the participants, and they
were then asked to complete a set of typical tasks using the large format touch-screen interfaces (as
described in the 'System Development' section below). The need for hands-on interaction with the
system for evaluation meant that surveys could not be used, so that assessment of the results was
qualitative rather than statistical.
Requirements for Building Information Modeling based Lean Production Management Systems for Construction Accepted 2/2010 for Automation in Construction © 2010 Sacks, Radosavljevic, Barak
11
Requirements for BIM-based Lean Production Management Systems
The requirements for development of a KanBIM system can be classified in seven main areas, which
are detailed under the sub-headings below. There is some overlap between these, and the specific
features of any given system are likely to satisfy multiple requirements.
Process Visualization
Despite the best efforts of project managers and planning teams, the uncertainty inherent in
construction operations results in changes to work plans. Records of the ‘percent plan complete’
(PPC) measure covering multiple projects show that even where the LPS has improved the reliability
of planning and operations, the PPC rarely goes above 80% [36], which means that some 20% of
tasks are still not executed according to plan. This occurs despite their having been filtered for
maturity in the weekly work planning process. As a result, when any task is not completed according
to plan, dependent tasks are rendered immature.
To avoid propagating plan failure and the associated waste within the current planning phase
(usually a week), trade managers and trade team leaders need both a) to be continuously informed
of the current status of operations, and b) to have the ability to proactively change daily task
assignments in close coordination with all parties that may be affected by the change. There is
therefore a need to display the status and location of work teams and the real-time maturity of
pending tasks. To support negotiation and reporting of plan changes on a daily level, a system must
also provide mechanisms for communication and feedback of decisions – these are discussed below.
Formoso et al. (2002) identified a number of additional benefits of process transparency that are
relevant for construction, including: improving the effectiveness of production planning and control;
increased involvement of workers in continuous improvement efforts, since it allows rapid
comprehension of and response to problems; simplification of control; reduced propensity for errors
by making them more visible; and improved motivation of workers.
Requirements for Building Information Modeling based Lean Production Management Systems for Construction Accepted 2/2010 for Automation in Construction © 2010 Sacks, Radosavljevic, Barak
12
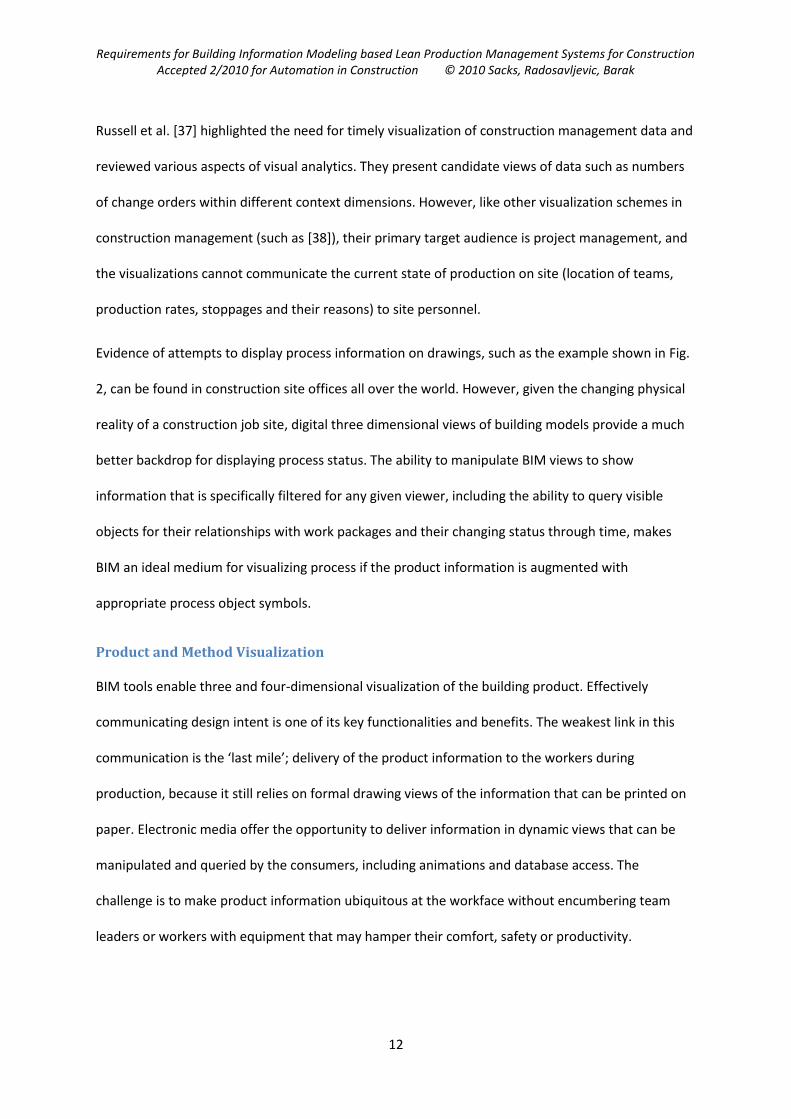
Russell et al. [37] highlighted the need for timely visualization of construction management data and
reviewed various aspects of visual analytics. They present candidate views of data such as numbers
of change orders within different context dimensions. However, like other visualization schemes in
construction management (such as [38]), their primary target audience is project management, and
the visualizations cannot communicate the current state of production on site (location of teams,
production rates, stoppages and their reasons) to site personnel.
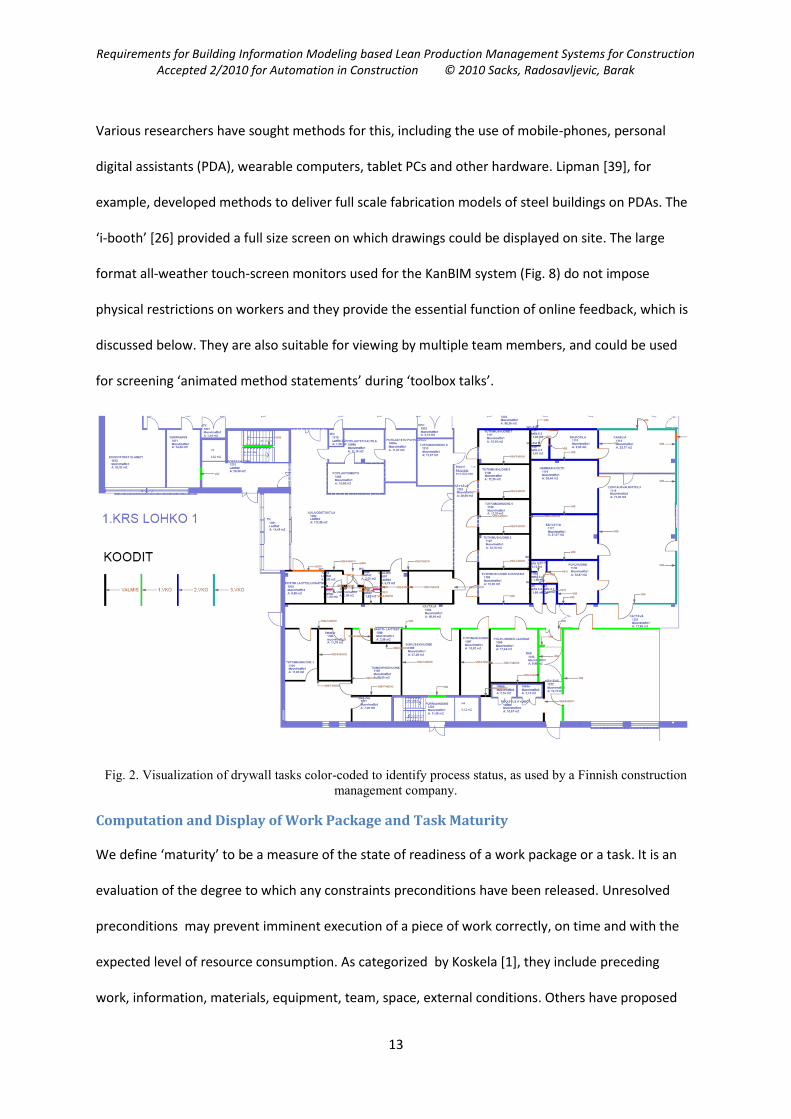
Evidence of attempts to display process information on drawings, such as the example shown in Fig.
2, can be found in construction site offices all over the world. However, given the changing physical
reality of a construction job site, digital three dimensional views of building models provide a much
better backdrop for displaying process status. The ability to manipulate BIM views to show
information that is specifically filtered for any given viewer, including the ability to query visible
objects for their relationships with work packages and their changing status through time, makes
BIM an ideal medium for visualizing process if the product information is augmented with
appropriate process object symbols.
Product and Method Visualization
BIM tools enable three and four-dimensional visualization of the building product. Effectively
communicating design intent is one of its key functionalities and benefits. The weakest link in this
communication is the ‘last mile’; delivery of the product information to the workers during
production, because it still relies on formal drawing views of the information that can be printed on
paper. Electronic media offer the opportunity to deliver information in dynamic views that can be
manipulated and queried by the consumers, including animations and database access. The
challenge is to make product information ubiquitous at the workface without encumbering team
leaders or workers with equipment that may hamper their comfort, safety or productivity.
Requirements for Building Information Modeling based Lean Production Management Systems for Construction Accepted 2/2010 for Automation in Construction © 2010 Sacks, Radosavljevic, Barak
13
Various researchers have sought methods for this, including the use of mobile-phones, personal
digital assistants (PDA), wearable computers, tablet PCs and other hardware. Lipman [39], for
example, developed methods to deliver full scale fabrication models of steel buildings on PDAs. The
‘i-booth’ [26] provided a full size screen on which drawings could be displayed on site. The large
format all-weather touch-screen monitors used for the KanBIM system (Fig. 8) do not impose
physical restrictions on workers and they provide the essential function of online feedback, which is
discussed below. They are also suitable for viewing by multiple team members, and could be used
for screening ‘animated method statements’ during ‘toolbox talks’.
Fig. 2. Visualization of drywall tasks color-coded to identify process status, as used by a Finnish construction
management company.
Computation and Display of Work Package and Task Maturity
We define ‘maturity’ to be a measure of the state of readiness of a work package or a task. It is an
evaluation of the degree to which any constraints preconditions have been released. Unresolved
preconditions may prevent imminent execution of a piece of work correctly, on time and with the
expected level of resource consumption. As categorized by Koskela [1], they include preceding
work, information, materials, equipment, team, space, external conditions. Others have proposed
Requirements for Building Information Modeling based Lean Production Management Systems for Construction Accepted 2/2010 for Automation in Construction © 2010 Sacks, Radosavljevic, Barak
14
that safety requirements be added to the list. If the state of each of these constraints can be
evaluated, a conjunctive ‘maturity index’ (MI) can be computed for any task at any given point in
time. The maturity index is intended to support both short-term decision-making by team leaders,
before they commit to performing tasks, and also to support weekly-planning activities. For
planning, we are concerned with the predicted future value of the maturity of a task, which means
that the calculation must consider a) the current status of the task's preconditions, b) the expected
status at the time being considered for the task's execution, and b) the reliability of the predictions
of the values, based on the recorded reliability of their sources in making those predictions. The
maturity index is displayed to planners and team leaders using color-coded symbols on task icons, as
shown in Fig. 4.
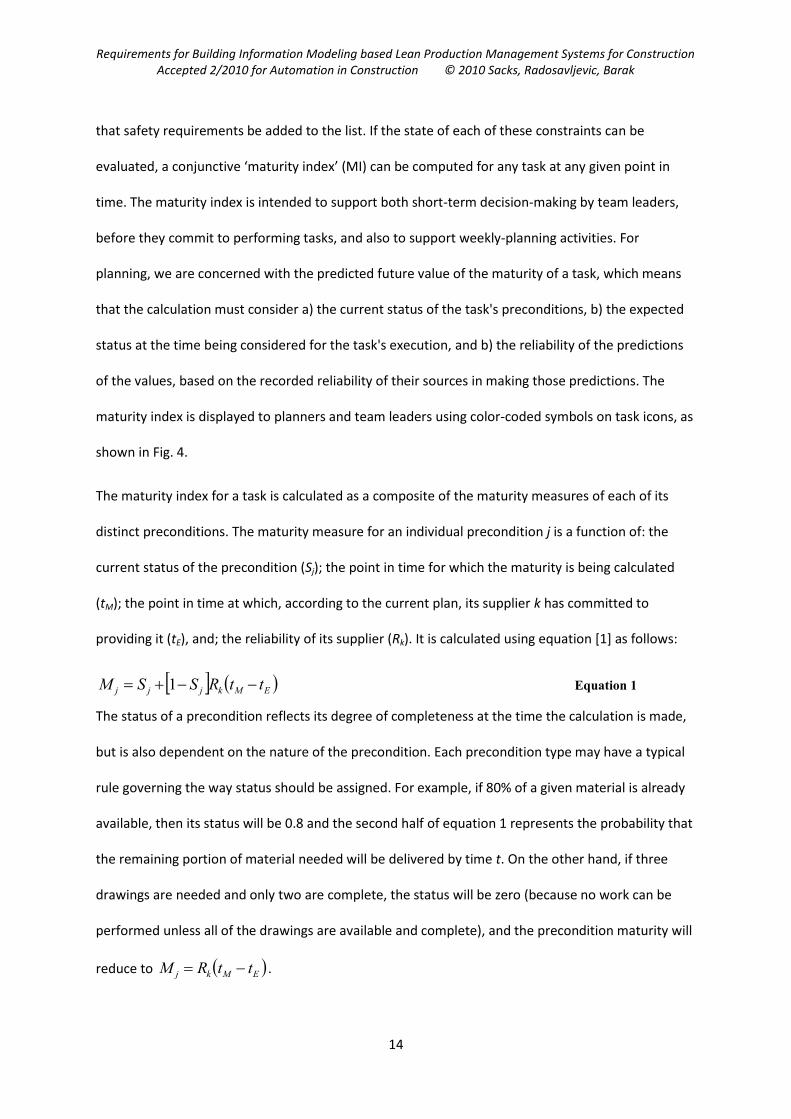
The maturity index for a task is calculated as a composite of the maturity measures of each of its
distinct preconditions. The maturity measure for an individual precondition j is a function of: the
current status of the precondition (Sj); the point in time for which the maturity is being calculated
(tM); the point in time at which, according to the current plan, its supplier k has committed to
providing it (tE), and; the reliability of its supplier (Rk). It is calculated using equation [1] as follows:
EMkjjj ttRSSM 1 Equation 1
The status of a precondition reflects its degree of completeness at the time the calculation is made,
but is also dependent on the nature of the precondition. Each precondition type may have a typical
rule governing the way status should be assigned. For example, if 80% of a given material is already
available, then its status will be 0.8 and the second half of equation 1 represents the probability that
the remaining portion of material needed will be delivered by time t. On the other hand, if three
drawings are needed and only two are complete, the status will be zero (because no work can be
performed unless all of the drawings are available and complete), and the precondition maturity will
reduce to EMkj ttRM .
Requirements for Building Information Modeling based Lean Production Management Systems for Construction Accepted 2/2010 for Automation in Construction © 2010 Sacks, Radosavljevic, Barak
15
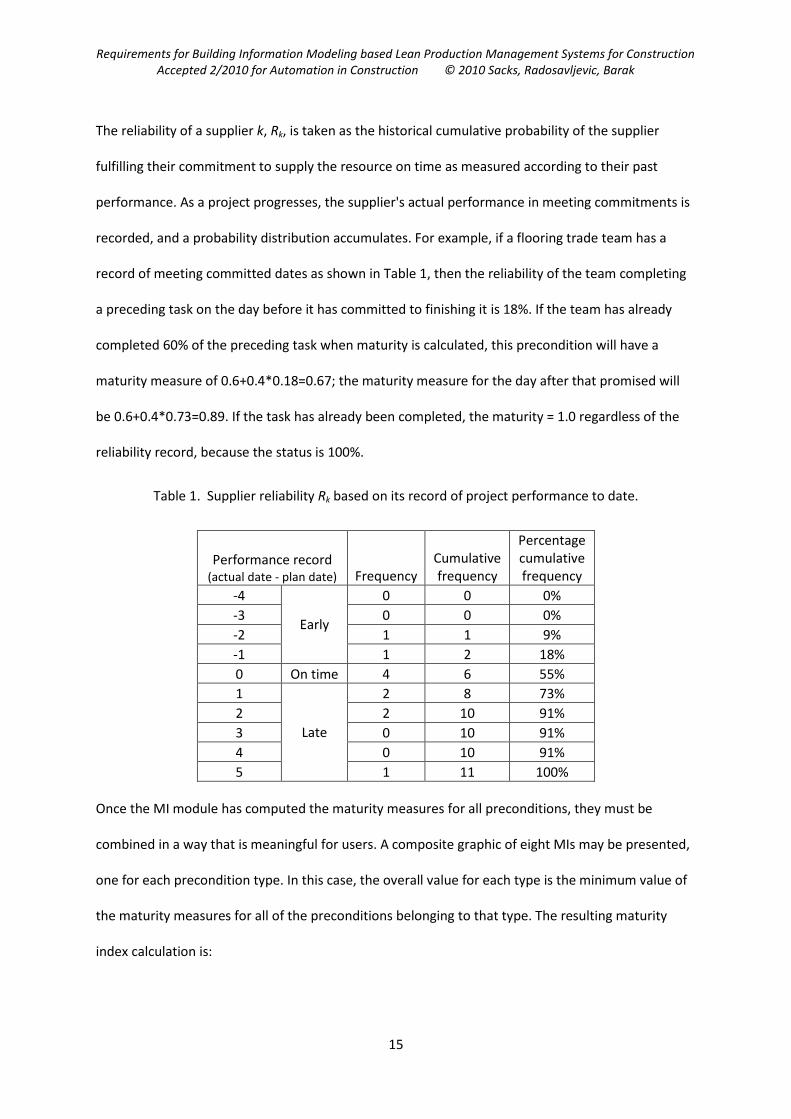
The reliability of a supplier k, Rk, is taken as the historical cumulative probability of the supplier
fulfilling their commitment to supply the resource on time as measured according to their past
performance. As a project progresses, the supplier's actual performance in meeting commitments is
recorded, and a probability distribution accumulates. For example, if a flooring trade team has a
record of meeting committed dates as shown in Table 1, then the reliability of the team completing
a preceding task on the day before it has committed to finishing it is 18%. If the team has already
completed 60% of the preceding task when maturity is calculated, this precondition will have a
maturity measure of 0.6+0.4*0.18=0.67; the maturity measure for the day after that promised will
be 0.6+0.4*0.73=0.89. If the task has already been completed, the maturity = 1.0 regardless of the
reliability record, because the status is 100%.
Table 1. Supplier reliability Rk based on its record of project performance to date.
Performance record (actual date - plan date) Frequency
Cumulative frequency
Percentage cumulative frequency
-4
Early
0 0 0%
-3 0 0 0%
-2 1 1 9%
-1 1 2 18%
0 On time 4 6 55%
1
Late
2 8 73%
2 2 10 91%
3 0 10 91%
4 0 10 91%
5 1 11 100%
Once the MI module has computed the maturity measures for all preconditions, they must be
combined in a way that is meaningful for users. A composite graphic of eight MIs may be presented,
one for each precondition type. In this case, the overall value for each type is the minimum value of
the maturity measures for all of the preconditions belonging to that type. The resulting maturity
index calculation is:
Requirements for Building Information Modeling based Lean Production Management Systems for Construction Accepted 2/2010 for Automation in Construction © 2010 Sacks, Radosavljevic, Barak
16
j
Mjj
j
Mjjj WWWWMMI Equation 2
The weightings here have two parts: Wj, which represents the relative importance of the
precondition, and WMj, which is used to give greater weight to lower values, thus placing the result
somewhere between the simple average and the minimum value. This can be done with different
formulae to calculate WMj , such as:
21 jMj MW or jMj MW 1 (to amplify lower values) or 1MjW (for a simple average).
Alternatively, a single normalised MI value may be presented for a task, computed as a weighted
average of the individual maturity measures or as an average of the eight results for the
precondition types.
A further consideration in calculating overall task MIs is that they are predictions of future states.
Given that trade team leaders and managers compare among them to select most mature tasks, MI
values for earlier tasks should reflect a greater degree of confidence than that placed in more distant
predictions. We note also that for any given point in time, the cumulative distribution value does not
reflect the pattern of the distribution itself. This can be problematic where a distribution has a long
tail of late values because it hides the degree of impact of the risk involved in delayed delivery. A
more sophisticated version of the calculation is under consideration in the framework of ongoing
research where measurements of actual performance are being collected to enable evaluation and
calibration of maturity index forecasts. These and other aspects, including calibration of MI
computations against empirical evidence, and trade crew leaders' perceptions of the MI value
presented to them, will be reported in detail in a separate paper.
Support for Planning, Negotiation, Commitment and Status Feedback
Part of the reason for the dearth of state of the art information systems to support production
management described above is insufficient recognition of the fact that the conceptualizations used
to represent and plan construction work at the planning level of resolution do not apply at the
Requirements for Building Information Modeling based Lean Production Management Systems for Construction Accepted 2/2010 for Automation in Construction © 2010 Sacks, Radosavljevic, Barak
17
production level. The underlying assumption behind the network planning approach and the critical
path method (CPM) is that work can be packaged into distinct activities and that technological
constraints (such as ‘finish-start’) can be strictly applied between them. However, these
relationships break down at the level where they can be negotiated between small work teams. For
example, a construction plan may call for all ducting work in a zone to be completed before sprinkler
installation begins. Yet with appropriate discussion between the two team leaders, the work can
often proceed in parallel, with duct work preceding sprinkler pipes in some spaces within the zone
and following it in others. Even where technical precedence does apply, the relationships change as
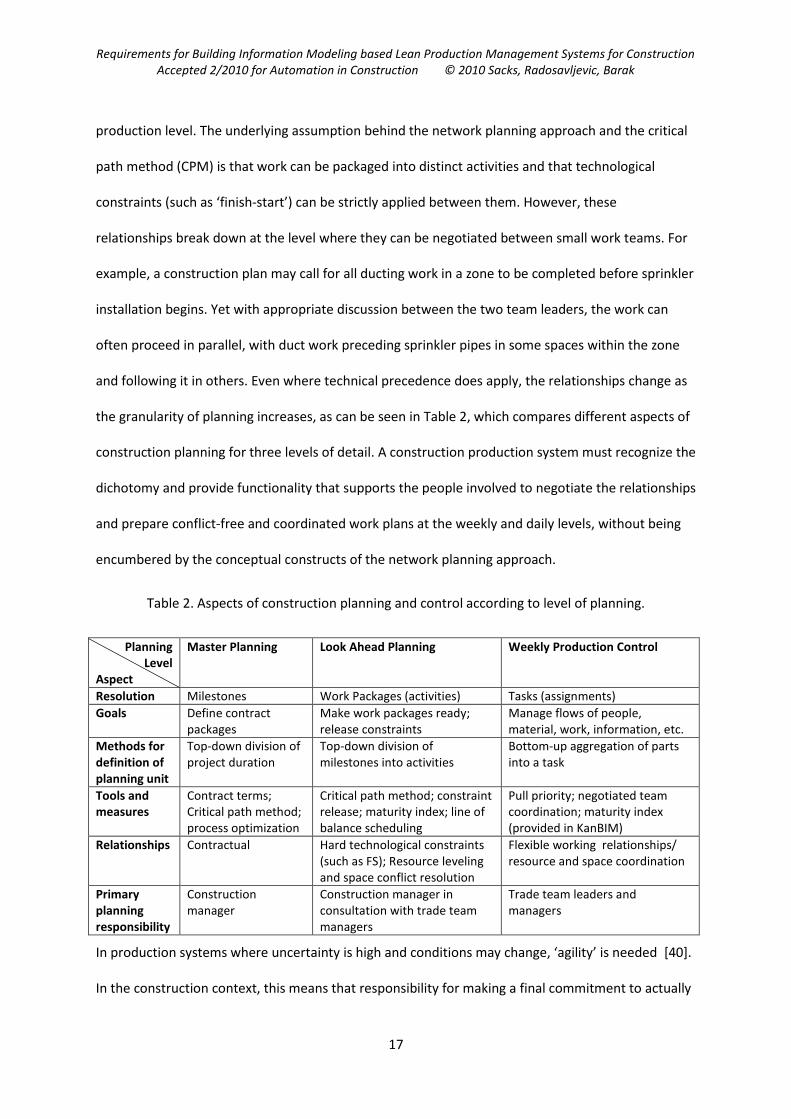
the granularity of planning increases, as can be seen in Table 2, which compares different aspects of
construction planning for three levels of detail. A construction production system must recognize the
dichotomy and provide functionality that supports the people involved to negotiate the relationships
and prepare conflict-free and coordinated work plans at the weekly and daily levels, without being
encumbered by the conceptual constructs of the network planning approach.
Table 2. Aspects of construction planning and control according to level of planning.
Planning Level
Aspect
Master Planning Look Ahead Planning Weekly Production Control
Resolution Milestones Work Packages (activities) Tasks (assignments)
Goals Define contract packages
Make work packages ready; release constraints
Manage flows of people, material, work, information, etc.
Methods for definition of planning unit
Top-down division of project duration
Top-down division of milestones into activities
Bottom-up aggregation of parts into a task
Tools and measures
Contract terms; Critical path method; process optimization
Critical path method; constraint release; maturity index; line of balance scheduling
Pull priority; negotiated team coordination; maturity index (provided in KanBIM)
Relationships Contractual Hard technological constraints (such as FS); Resource leveling and space conflict resolution
Flexible working relationships/ resource and space coordination
Primary planning responsibility
Construction manager
Construction manager in consultation with trade team managers
Trade team leaders and managers
In production systems where uncertainty is high and conditions may change, ‘agility’ is needed [40].
In the construction context, this means that responsibility for making a final commitment to actually
Requirements for Building Information Modeling based Lean Production Management Systems for Construction Accepted 2/2010 for Automation in Construction © 2010 Sacks, Radosavljevic, Barak
18
begin performing a task must reside with the team leader, who retains some flexibility. Where a
planned task has become ‘immature’, the team leader must be able to respond by selecting a
predefined contingency task or by negotiating a change of plan with all those who may be affected.
To support this degree of agility without maintaining excess capacity, a robust information system is
needed to enable good decisions to be made quickly. To do this, the system must:
- tightly integrate planning and production control. The granularity of the weekly work planning
and the level of detail of task properties must be appropriate for daily production control;
- enable online feedback from the workface to ensure that the process status information is up to
date;
- provide a channel of communication for negotiation of changes to planned tasks. Reducing the
planning window to daily level, extending the Last Planner System, requires enabling trade team
leaders to propose plan changes, identify and resolve any resulting conflicts through negotiation
with the affected parties, and inform all other project participants of the resulting changes.
The language/action perspective [41], which expresses the idea that activity in projects is
coordinated through making and keeping commitments rather than by directives from managers to
those responsible for executing work, has been identified as an important potential contributor to
achieving plan reliability in construction supply chains [42]. It defines a process of request,
commitment, action and reporting completion. A KanBIM system must implement this explicitly at
two levels:
a) Weekly work planning. Initial requests are communicated to trade teams in the form of work
packages scheduled in the look ahead plan. Trade teams then need to define the detailed tasks
for each work package, schedule them in a weekly work plan, negotiate with the other teams
and the construction management functions to remove conflicts of space and resource use, and
finally express explicit commitment to the coordinated plan.
Requirements for Building Information Modeling based Lean Production Management Systems for Construction Accepted 2/2010 for Automation in Construction © 2010 Sacks, Radosavljevic, Barak
19
b) Daily work execution. Team leaders must be able to select a mature task for execution, reaffirm
commitment to completing it at the time work begins, and then report completion of the work
once it has been done. In cases where a task cannot be completed, the system should require
explicit declaration that work is stopped and a detailing of the reasons for stopping. This
communication can be facilitated using touch screens (as shown in Error! Reference source not
found.a), or other devices such as cell phones.
The mechanism for reporting start and completion or stoppage of tasks is crucial because it provides
the feedback which allows the system to remain up to date with events as they occur on site.
Reporting stoppage is also essential because it supports ANDON style signals, pushed automatically
by the system via SMS and/or email, that can alert designers and/or managers to a production
problem as it arises.
Embedding the language/action perspective in a KanBIM system also applies the principle that work
planning and coordination is a human endeavor and that the purpose of the software is to support
negotiation and decision making by people. As such, a system should alert users to any planning
conflicts, but it should not take action at any step where value judgment, context awareness or
commitment to act is required. It should empower people and facilitate direct discussion between
them, leading – as far as possible – to creative collaborative control at daily level instead of central
control.
At the same time, we recognize that final authority for resolving planning conflicts must lie with the
project’s construction manager, who must be the final arbiter of task assignments and priorities in
the weekly work plan. This need arises because, by definition, the best weekly work plan, optimized
for the project as a whole, will be sub-optimal for some of the trade teams.
Requirements for Building Information Modeling based Lean Production Management Systems for Construction Accepted 2/2010 for Automation in Construction © 2010 Sacks, Radosavljevic, Barak
20
Implement Pull Flow Control
An online process status display can be used as a means to communicate pull signals to work teams
in situations where more than one task is possible at any given time. In most construction projects, it
is not possible to achieve a true pull flow regime, because construction does not have steady state
production systems with continuous flows of similar products. In construction, we build the
production facilities (site offices, cranes, support structures, etc.) at the same time as beginning to
build the ‘products’, and begin dismantling the production facilities before the first products are
delivered. The ‘factory’ operates in start-up mode, and usually does not reach full saturation (i.e. the
first product is not completed) before dismantling of the first-used facilities is begun.
It is possible, however, to apply a conscious strategy to reduce the quantity of work in progress, i.e.
to reduce the number of spaces being worked on simultaneously [43]. In construction, spaces
(rooms, apartments, etc.) can be considered the products; the building as a whole is an aggregate
product. The strategy, termed ‘WIP reduction’, requires trade teams to place highest priority on
tasks that complete their work in spaces (where work has already begun) soonest, and lowest
priority on tasks that begin work in new spaces. The approach is directly comparable to the
controlled WIP (CONWIP) strategies used in manufacturing situations where pull flow cannot be
applied directly [13]. It is generally not subcontractor trade teams’ strategy of choice, because it
does not leave them flexibility to switch workers to alternative spaces when work must be stopped
in a space for any reason (a common occurrence on less stable projects). Nevertheless, experiments
using discrete event simulation have shown that the positive effect on cycle times of spaces and on
total project durations are significant [43], because the strategy works to enhance overall project
optimization rather than local task optimization.
The strategy can be applied by each team individually, but it could also be extended to encompass
multiple trades if, at any given time, the probability of achieving a smooth workflow to complete
each space, over a series of tasks by multiple teams, could be computed and compared with the
Requirements for Building Information Modeling based Lean Production Management Systems for Construction Accepted 2/2010 for Automation in Construction © 2010 Sacks, Radosavljevic, Barak
21
probability of smooth completion of other spaces. The short-term tasks in the space with the highest
probability for smooth work to completion would be given highest priority for its next trade. We call
this probability the ‘pull flow index’ (PFI), and define it as “a measure of the likelihood that the
sequence of tasks following the current task, that is needed to complete a zone or product, can be
performed continuously to completion.” In practical terms, the PFI for a pending task in a space is a
function of the maturity index values of the string of tasks that is required to complete that space.
Those maturity indices are themselves functions of their precondition maturity measures, as defined
above, which are in turn functions of the expected date of each precondition and the reliability
record of its supplier. Since maturity index values are predictions of expected future conditions, their
reliability declines in inverse relation to the time between their prediction and the planned
execution of the tasks for which they are computed.
The PFI would be used by construction managers when setting task priorities, which must be done
with respect to both the need for controlling WIP and to other project imperatives. The priority
levels they set must then be communicated to teams on site. Communicating the pull flow priority to
teams is straightforward where teams have ubiquitous access to real-time information about project
status; it is expressed using star ratings on the task icons in Fig. 4. An additional visualization benefit
of the task icons is that they make it possible to see the quantity of work in progress, simplifying
management of a WIP reduction strategy. A project manager could elect to control and limit the
number of tasks that a team leader is ‘offered’ or may have under way at any one time, thus
implementing the CONWIP approach.
To buffer the effects of potential work stoppages under the WIP reduction strategy, a set of
contingency tasks should be included in every team’s weekly work plan. As far as possible, these
should be independent of other trades (no shared equipment, no shared space, etc.). Contingency
tasks are not scheduled to a particular day in the weekly task plan. They introduce short-term
flexibility and are marked appropriately on the task icons.
Requirements for Building Information Modeling based Lean Production Management Systems for Construction Accepted 2/2010 for Automation in Construction © 2010 Sacks, Radosavljevic, Barak
22
Maintain Work Flow and Plan Stability
Achieving stable workflow is the basic method for minimizing waste of labor time in construction.
Stability is not only important directly, it is also the basis for methodical process experimentation
(‘management by testing of hypotheses’), which is a key tenet of the Toyota Production System [11].
In the LPS, the ‘percent plan complete’ measure is used to help project organizations learn about the
reliability of their plans and thus improve plan stability, but, as explained above, it is a retrospective
measure.
The need for plan stability implies some guidelines for production management using a KanBIM
system. ‘On the fly’ changes to the content of tasks (expressed as aggregations of building product
objects in the construction model) are not to be allowed during the week; a failure due to
unavailability of a part or error in its fabrication or design information should be revealed, not
hidden by removal of the part from the task definition. Even when tasks planned for a day are
complete, the starting of tasks scheduled for future days should not be permitted, except after
coordination with other trades and suppliers within the KanBIM system, because what is not
planned and recorded in the system cannot be measured. The pitfalls of potential negative impacts
on other trades and the danger of ‘making-do’ and subsequent rework mean that plan changes must
be negotiated and recorded.
Formalize experimentation for continuous improvement
The principles that Deming developed for statistical analysis of production quality [44] are the basis
for the formalized approach to continuous improvement described in the previous section. The
KanBIM system can institutionalize this approach by allowing planning teams to select one or more
specific tasks for structured experimentation in each weekly work plan, as proposed in the PPM. The
task selected(s) would be marked with an appropriate icon and carry a data record defining the goal
of the experiment, the changes proposed to the work method, the method and units of
measurement of results, and a definition of success or failure. Computerization in this case has the
Requirements for Building Information Modeling based Lean Production Management Systems for Construction Accepted 2/2010 for Automation in Construction © 2010 Sacks, Radosavljevic, Barak
23
benefit that if an improved work method is adopted, the recipe can be embedded in the routines
that generate tasks for task planning.
Formalized experimentation could then lead to continuously improved work methods that can be
carried over to future tasks of the same type and to future projects, with wide ranging benefits for
various project stakeholders. For instance, with continuous improvement being part of the weekly
planning, task level innovations may become a key source of competitive advantage for trade
contractors.
KanBIM Planning and Control Process
The KanBIM concept seeks to leverage the detailed product information that is available in building
information models to support fine-grained operational coordination on construction sites. It is
based on the LPS [5] and the Process Planning Methodology (PPM) [35], but extends both in
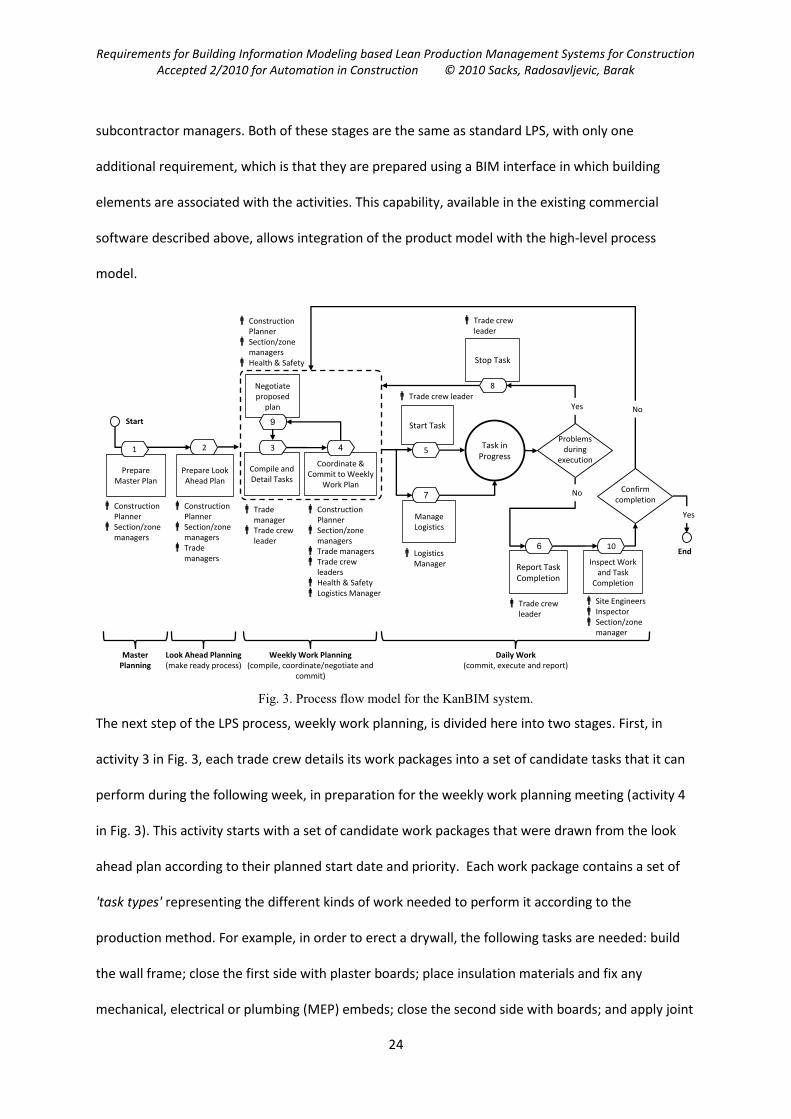
numerous ways. The process chart shown in Fig. 3 describes the actors in construction site
production management, the information they each generate, a set of ‘activity scenarios’ in which
information is generated, and the way the information is distributed and recorded in the different
information repositories maintained by the actors. The process starts with the creation of a Master
Plan. In this stage the users compile and maintain a set of high-level activities and subordinate work
packages, and schedule them, including trade assignments and buffering. High-level resource
leveling must also be done for major equipment and spaces. This is done using existing construction
planning tools.
The next stage (activity 2 in Fig. 3) is look ahead planning. It consists of breaking down the high-level
activities into smaller, manageable work packages, defining logistic and engineering constraints in
the form of connections between activities (i.e. finish-start, finish-finish etc.) and assigning
equipment and materials. The master plan and the look ahead plan both are done by managers of
the general contractor (or construction management company) and the principal work package
Requirements for Building Information Modeling based Lean Production Management Systems for Construction Accepted 2/2010 for Automation in Construction © 2010 Sacks, Radosavljevic, Barak
24
subcontractor managers. Both of these stages are the same as standard LPS, with only one
additional requirement, which is that they are prepared using a BIM interface in which building
elements are associated with the activities. This capability, available in the existing commercial
software described above, allows integration of the product model with the high-level process
model.
Stop Task
Prepare Look Ahead Plan
PrepareMaster Plan
21
8
Start
Master Planning
Look Ahead Planning(make ready process)
Weekly Work Planning(compile, coordinate/negotiate and
commit)
Daily Work(commit, execute and report)
Compile and Detail Tasks
3
Coordinate & Commit to Weekly
Work Plan
Start Task
5
Negotiate proposed
plan
Yes
Manage Logistics
Task in Progress
Report Task Completion
No
Construction Planner
Section/zone managers
Construction Planner
Section/zone managers
Trade managers
Trade manager
Trade crew leader
Construction Planner
Section/zone managers
Trade managersTrade crew
leadersHealth & Safety Logistics Manager
Construction Planner
Section/zone managers
Health & Safety
Trade crew leader
Trade crew leader
Logistics Manager
Trade crew leader
Site Engineers Inspector Section/zone
manager
End
Problemsduring
execution
No
Inspect Work and Task
Completion
10
Confirm completion
Yes
Fig. 3. Process flow model for the KanBIM system.
The next step of the LPS process, weekly work planning, is divided here into two stages. First, in
activity 3 in Fig. 3, each trade crew details its work packages into a set of candidate tasks that it can
perform during the following week, in preparation for the weekly work planning meeting (activity 4
in Fig. 3). This activity starts with a set of candidate work packages that were drawn from the look
ahead plan according to their planned start date and priority. Each work package contains a set of
'task types' representing the different kinds of work needed to perform it according to the
production method. For example, in order to erect a drywall, the following tasks are needed: build
the wall frame; close the first side with plaster boards; place insulation materials and fix any
mechanical, electrical or plumbing (MEP) embeds; close the second side with boards; and apply joint
Requirements for Building Information Modeling based Lean Production Management Systems for Construction Accepted 2/2010 for Automation in Construction © 2010 Sacks, Radosavljevic, Barak
25
strips, sand and paint. BIM objects can require one or more task types and the associations are
recorded with the object's properties.
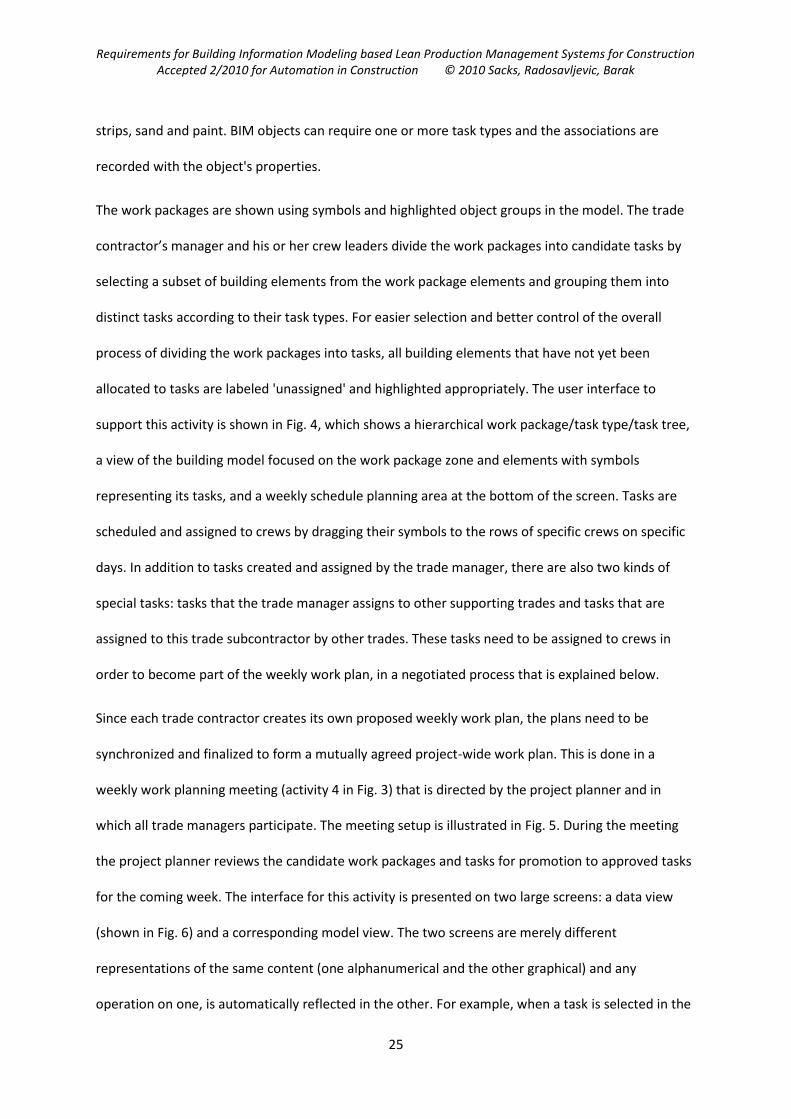
The work packages are shown using symbols and highlighted object groups in the model. The trade
contractor’s manager and his or her crew leaders divide the work packages into candidate tasks by
selecting a subset of building elements from the work package elements and grouping them into
distinct tasks according to their task types. For easier selection and better control of the overall
process of dividing the work packages into tasks, all building elements that have not yet been
allocated to tasks are labeled 'unassigned' and highlighted appropriately. The user interface to
support this activity is shown in Fig. 4, which shows a hierarchical work package/task type/task tree,
a view of the building model focused on the work package zone and elements with symbols
representing its tasks, and a weekly schedule planning area at the bottom of the screen. Tasks are
scheduled and assigned to crews by dragging their symbols to the rows of specific crews on specific
days. In addition to tasks created and assigned by the trade manager, there are also two kinds of
special tasks: tasks that the trade manager assigns to other supporting trades and tasks that are
assigned to this trade subcontractor by other trades. These tasks need to be assigned to crews in
order to become part of the weekly work plan, in a negotiated process that is explained below.
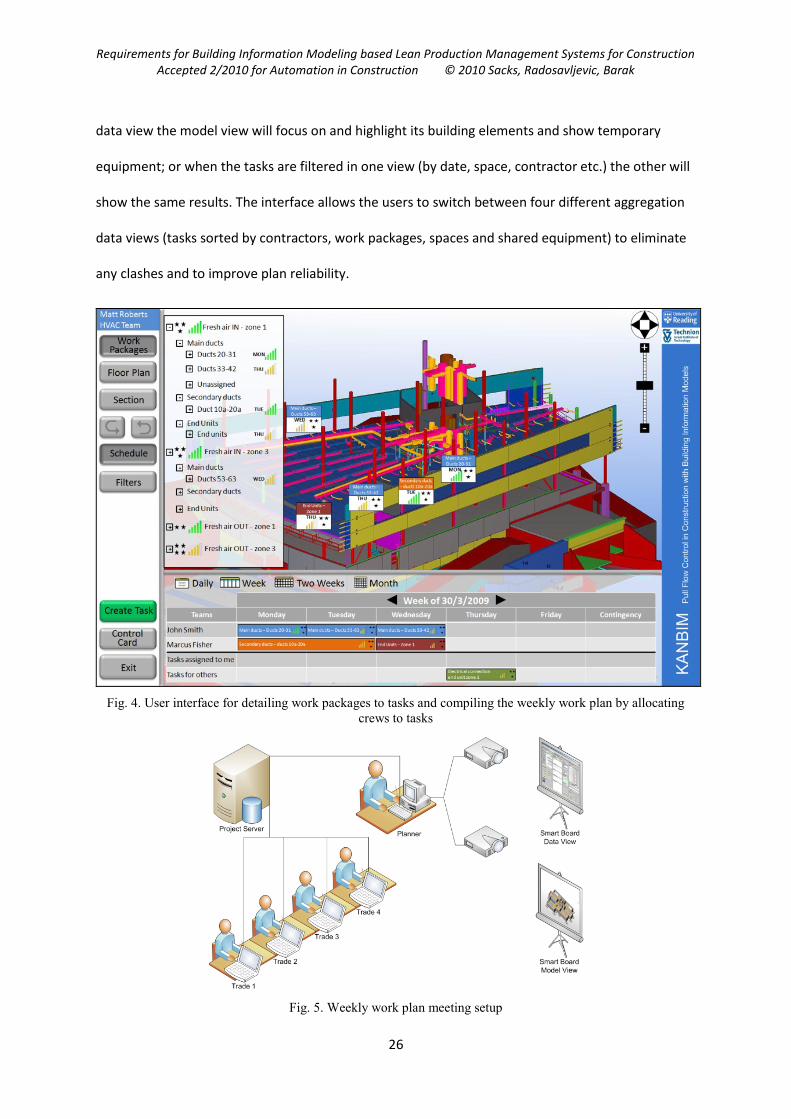
Since each trade contractor creates its own proposed weekly work plan, the plans need to be
synchronized and finalized to form a mutually agreed project-wide work plan. This is done in a
weekly work planning meeting (activity 4 in Fig. 3) that is directed by the project planner and in
which all trade managers participate. The meeting setup is illustrated in Fig. 5. During the meeting
the project planner reviews the candidate work packages and tasks for promotion to approved tasks
for the coming week. The interface for this activity is presented on two large screens: a data view
(shown in Fig. 6) and a corresponding model view. The two screens are merely different
representations of the same content (one alphanumerical and the other graphical) and any
operation on one, is automatically reflected in the other. For example, when a task is selected in the
Requirements for Building Information Modeling based Lean Production Management Systems for Construction Accepted 2/2010 for Automation in Construction © 2010 Sacks, Radosavljevic, Barak
26
data view the model view will focus on and highlight its building elements and show temporary
equipment; or when the tasks are filtered in one view (by date, space, contractor etc.) the other will
show the same results. The interface allows the users to switch between four different aggregation
data views (tasks sorted by contractors, work packages, spaces and shared equipment) to eliminate
any clashes and to improve plan reliability.
Fig. 4. User interface for detailing work packages to tasks and compiling the weekly work plan by allocating
crews to tasks
Fig. 5. Weekly work plan meeting setup
Requirements for Building Information Modeling based Lean Production Management Systems for Construction Accepted 2/2010 for Automation in Construction © 2010 Sacks, Radosavljevic, Barak
27
Any conflicts identified must be resolved through discussion and coordination between the relevant
trade managers. To resolve conflicts they can change their proposed plans using the same interface
used for initial planning (Fig. 4). Changes could include rescheduling tasks, assigning more crews or
workers, changing resources by changing construction methods, and others. The changes are made
while all the participants are online so that the project planner views will reflect the changed overall
weekly work plan.
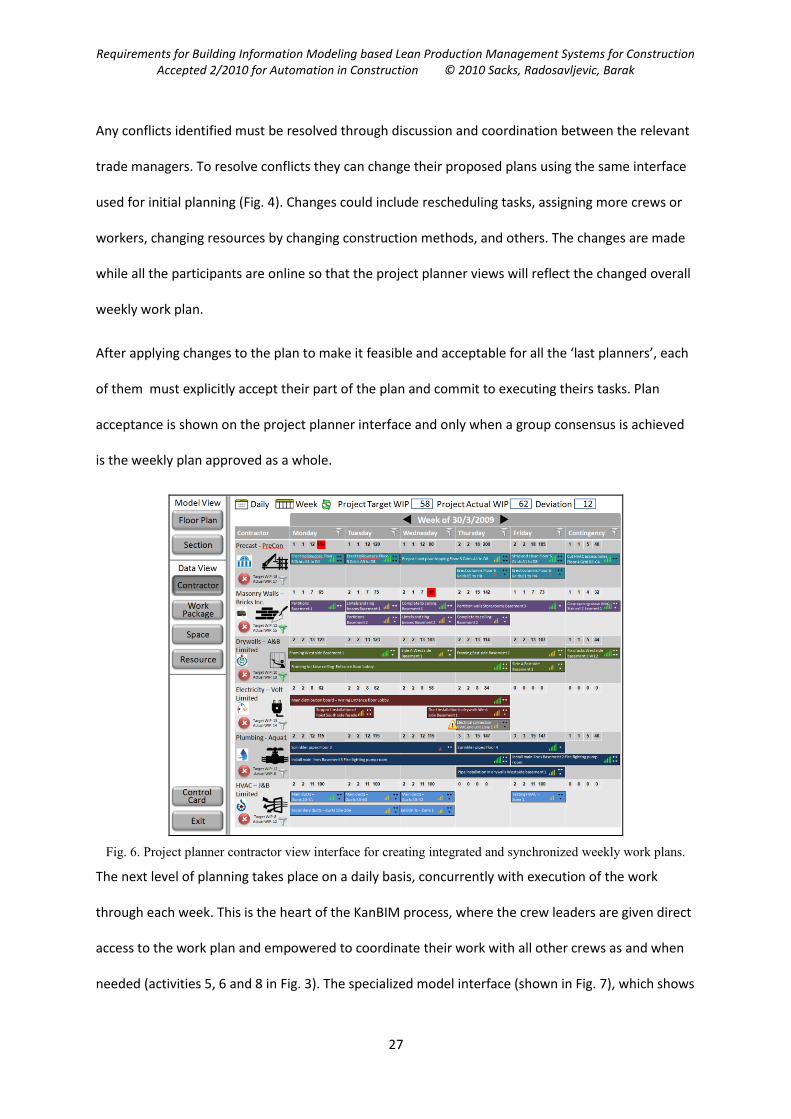
After applying changes to the plan to make it feasible and acceptable for all the ‘last planners’, each
of them must explicitly accept their part of the plan and commit to executing theirs tasks. Plan
acceptance is shown on the project planner interface and only when a group consensus is achieved
is the weekly plan approved as a whole.
Fig. 6. Project planner contractor view interface for creating integrated and synchronized weekly work plans.
The next level of planning takes place on a daily basis, concurrently with execution of the work
through each week. This is the heart of the KanBIM process, where the crew leaders are given direct
access to the work plan and empowered to coordinate their work with all other crews as and when
needed (activities 5, 6 and 8 in Fig. 3). The specialized model interface (shown in Fig. 7), which shows
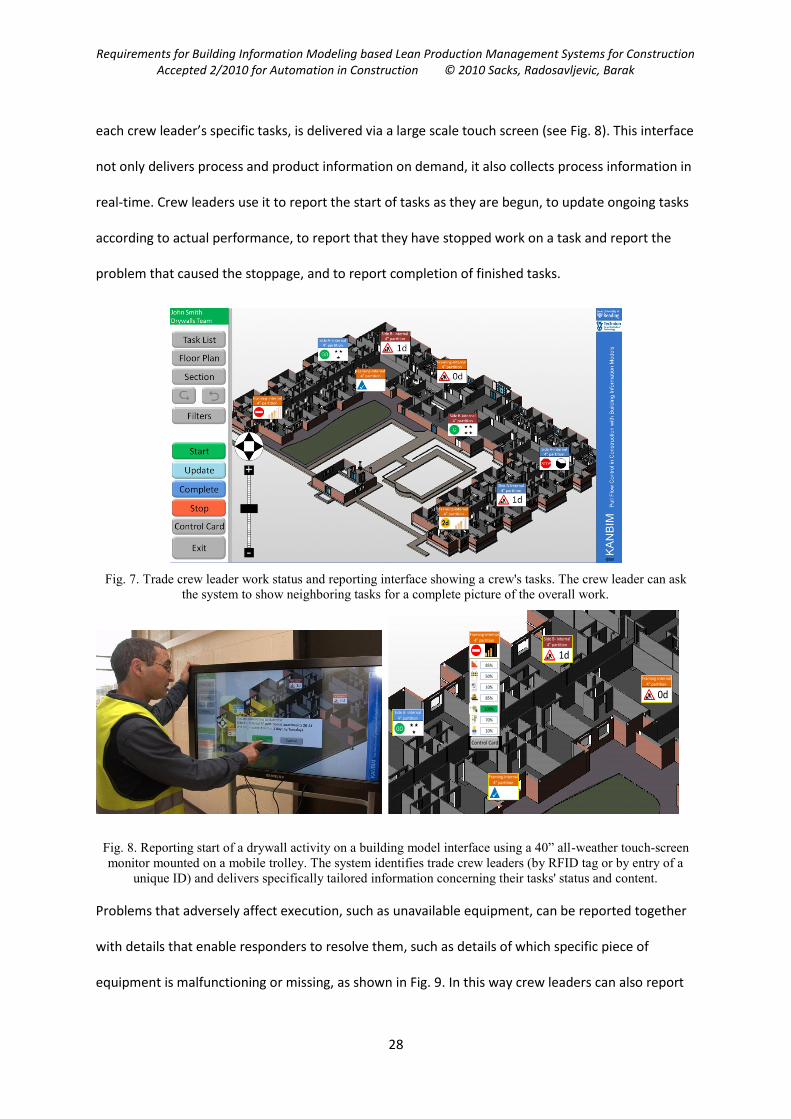
Requirements for Building Information Modeling based Lean Production Management Systems for Construction Accepted 2/2010 for Automation in Construction © 2010 Sacks, Radosavljevic, Barak
28
each crew leader’s specific tasks, is delivered via a large scale touch screen (see Fig. 8). This interface
not only delivers process and product information on demand, it also collects process information in
real-time. Crew leaders use it to report the start of tasks as they are begun, to update ongoing tasks
according to actual performance, to report that they have stopped work on a task and report the
problem that caused the stoppage, and to report completion of finished tasks.
Fig. 7. Trade crew leader work status and reporting interface showing a crew's tasks. The crew leader can ask
the system to show neighboring tasks for a complete picture of the overall work.
Side A- internal 4” partition
GO
Framing-internal 4” partition Side B- internal
4” partition
1d
Framing-internal 4” partition
Framing-internal 4” partition
0d
50%
10%
85%
85%
100%
70%
10%
Control Card
Fig. 8. Reporting start of a drywall activity on a building model interface using a 40” all-weather touch-screen
monitor mounted on a mobile trolley. The system identifies trade crew leaders (by RFID tag or by entry of a
unique ID) and delivers specifically tailored information concerning their tasks' status and content.
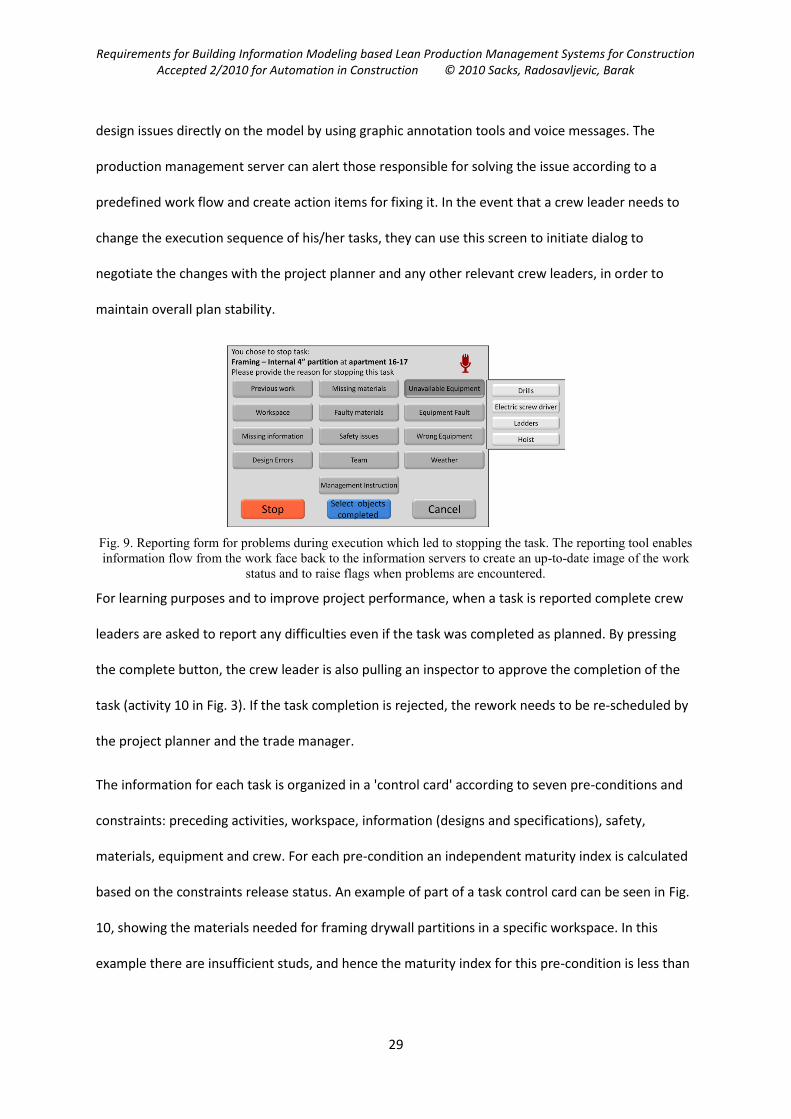
Problems that adversely affect execution, such as unavailable equipment, can be reported together
with details that enable responders to resolve them, such as details of which specific piece of
equipment is malfunctioning or missing, as shown in Fig. 9. In this way crew leaders can also report
Requirements for Building Information Modeling based Lean Production Management Systems for Construction Accepted 2/2010 for Automation in Construction © 2010 Sacks, Radosavljevic, Barak
29
design issues directly on the model by using graphic annotation tools and voice messages. The
production management server can alert those responsible for solving the issue according to a
predefined work flow and create action items for fixing it. In the event that a crew leader needs to
change the execution sequence of his/her tasks, they can use this screen to initiate dialog to
negotiate the changes with the project planner and any other relevant crew leaders, in order to
maintain overall plan stability.
Fig. 9. Reporting form for problems during execution which led to stopping the task. The reporting tool enables
information flow from the work face back to the information servers to create an up-to-date image of the work
status and to raise flags when problems are encountered.
For learning purposes and to improve project performance, when a task is reported complete crew
leaders are asked to report any difficulties even if the task was completed as planned. By pressing
the complete button, the crew leader is also pulling an inspector to approve the completion of the
task (activity 10 in Fig. 3). If the task completion is rejected, the rework needs to be re-scheduled by
the project planner and the trade manager.
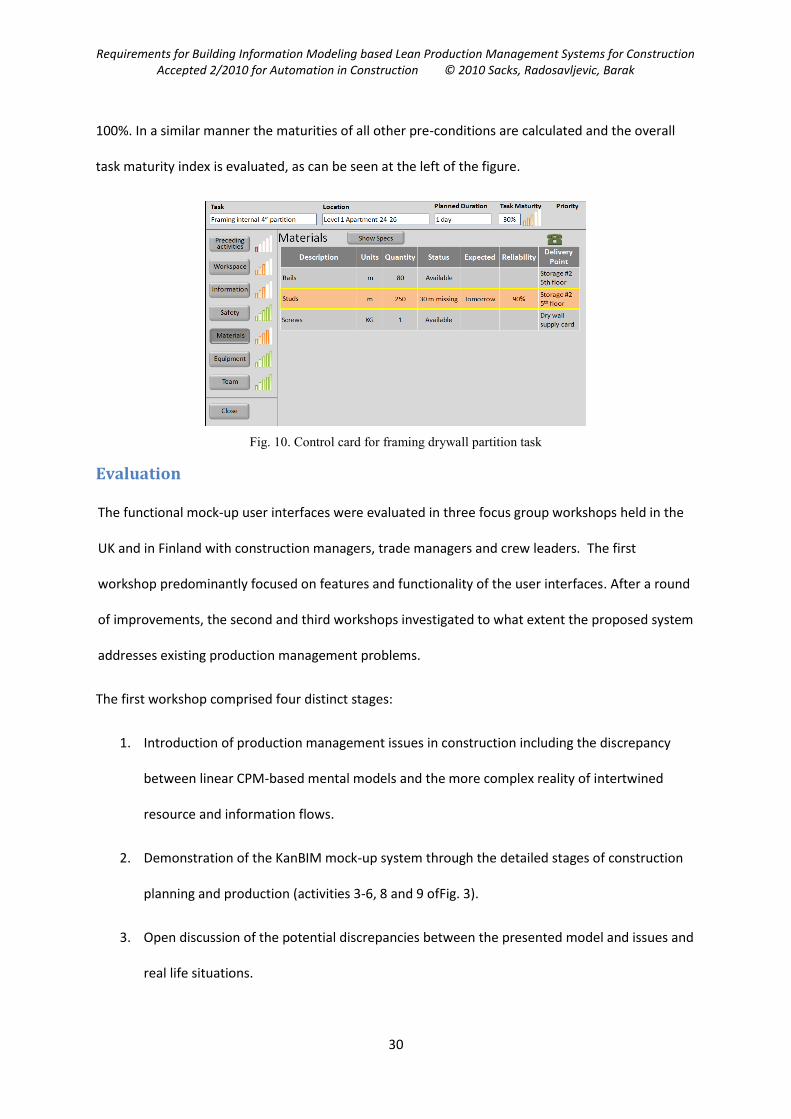
The information for each task is organized in a 'control card' according to seven pre-conditions and
constraints: preceding activities, workspace, information (designs and specifications), safety,
materials, equipment and crew. For each pre-condition an independent maturity index is calculated
based on the constraints release status. An example of part of a task control card can be seen in Fig.
10, showing the materials needed for framing drywall partitions in a specific workspace. In this
example there are insufficient studs, and hence the maturity index for this pre-condition is less than
Requirements for Building Information Modeling based Lean Production Management Systems for Construction Accepted 2/2010 for Automation in Construction © 2010 Sacks, Radosavljevic, Barak
30
100%. In a similar manner the maturities of all other pre-conditions are calculated and the overall
task maturity index is evaluated, as can be seen at the left of the figure.
Fig. 10. Control card for framing drywall partition task
Evaluation
The functional mock-up user interfaces were evaluated in three focus group workshops held in the
UK and in Finland with construction managers, trade managers and crew leaders. The first
workshop predominantly focused on features and functionality of the user interfaces. After a round
of improvements, the second and third workshops investigated to what extent the proposed system
addresses existing production management problems.
The first workshop comprised four distinct stages:
1. Introduction of production management issues in construction including the discrepancy
between linear CPM-based mental models and the more complex reality of intertwined
resource and information flows.
2. Demonstration of the KanBIM mock-up system through the detailed stages of construction
planning and production (activities 3-6, 8 and 9 ofFig. 3).
3. Open discussion of the potential discrepancies between the presented model and issues and
real life situations.
Requirements for Building Information Modeling based Lean Production Management Systems for Construction Accepted 2/2010 for Automation in Construction © 2010 Sacks, Radosavljevic, Barak
31
4. Evaluation of the system through a structured questionnaire (see Table 3) and group
discussion that included a general evaluation of the proposed system followed by specific
evaluation of the procedures and constraints.
The first workshop attracted 23 individuals from seven companies. 17 attendees (74%) were from
construction contracting companies, two (8%) from consulting companies and four (14%) were
mature employer-sponsored postgraduate students. A summary of feedback corresponding to the
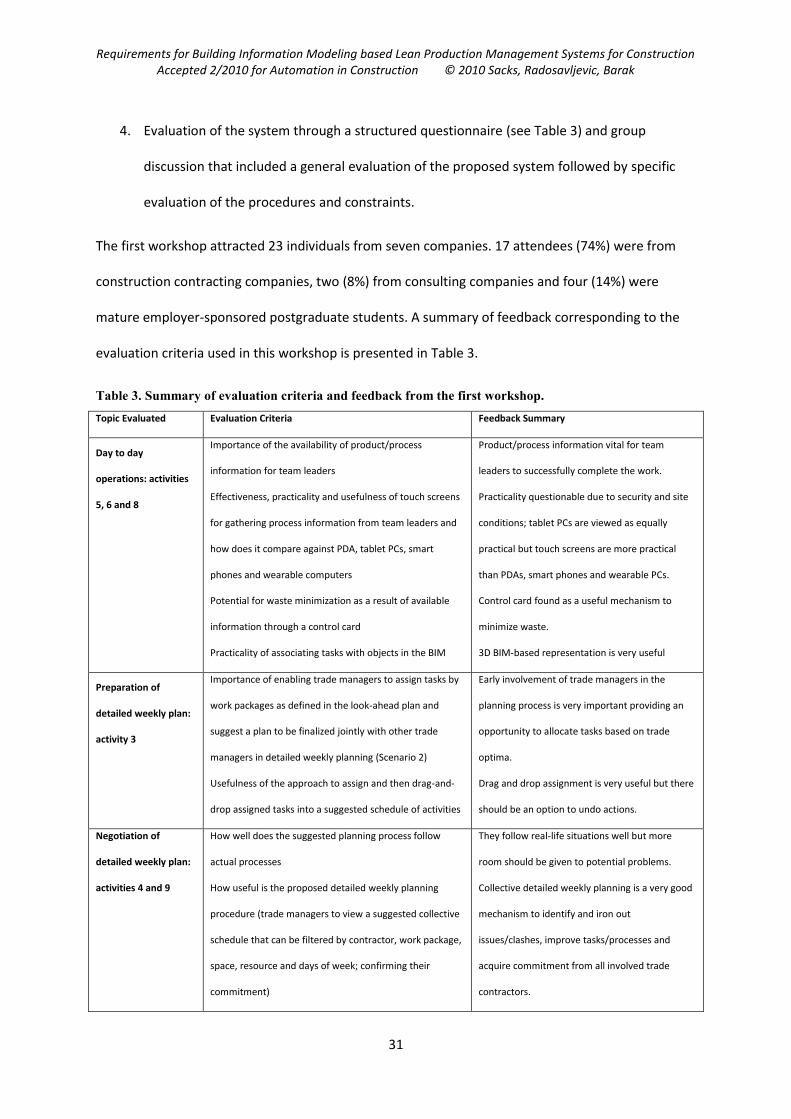
evaluation criteria used in this workshop is presented in Table 3.
Table 3. Summary of evaluation criteria and feedback from the first workshop.
Topic Evaluated Evaluation Criteria Feedback Summary
Day to day
operations: activities
5, 6 and 8
Importance of the availability of product/process
information for team leaders
Effectiveness, practicality and usefulness of touch screens
for gathering process information from team leaders and
how does it compare against PDA, tablet PCs, smart
phones and wearable computers
Potential for waste minimization as a result of available
information through a control card
Practicality of associating tasks with objects in the BIM
Product/process information vital for team
leaders to successfully complete the work.
Practicality questionable due to security and site
conditions; tablet PCs are viewed as equally
practical but touch screens are more practical
than PDAs, smart phones and wearable PCs.
Control card found as a useful mechanism to
minimize waste.
3D BIM-based representation is very useful
Preparation of
detailed weekly plan:
activity 3
Importance of enabling trade managers to assign tasks by
work packages as defined in the look-ahead plan and
suggest a plan to be finalized jointly with other trade
managers in detailed weekly planning (Scenario 2)
Usefulness of the approach to assign and then drag-and-
drop assigned tasks into a suggested schedule of activities
Early involvement of trade managers in the
planning process is very important providing an
opportunity to allocate tasks based on trade
optima.
Drag and drop assignment is very useful but there
should be an option to undo actions.
Negotiation of
detailed weekly plan:
activities 4 and 9
How well does the suggested planning process follow
actual processes
How useful is the proposed detailed weekly planning
procedure (trade managers to view a suggested collective
schedule that can be filtered by contractor, work package,
space, resource and days of week; confirming their
commitment)
They follow real-life situations well but more
room should be given to potential problems.
Collective detailed weekly planning is a very good
mechanism to identify and iron out
issues/clashes, improve tasks/processes and
acquire commitment from all involved trade
contractors.
Requirements for Building Information Modeling based Lean Production Management Systems for Construction Accepted 2/2010 for Automation in Construction © 2010 Sacks, Radosavljevic, Barak
32
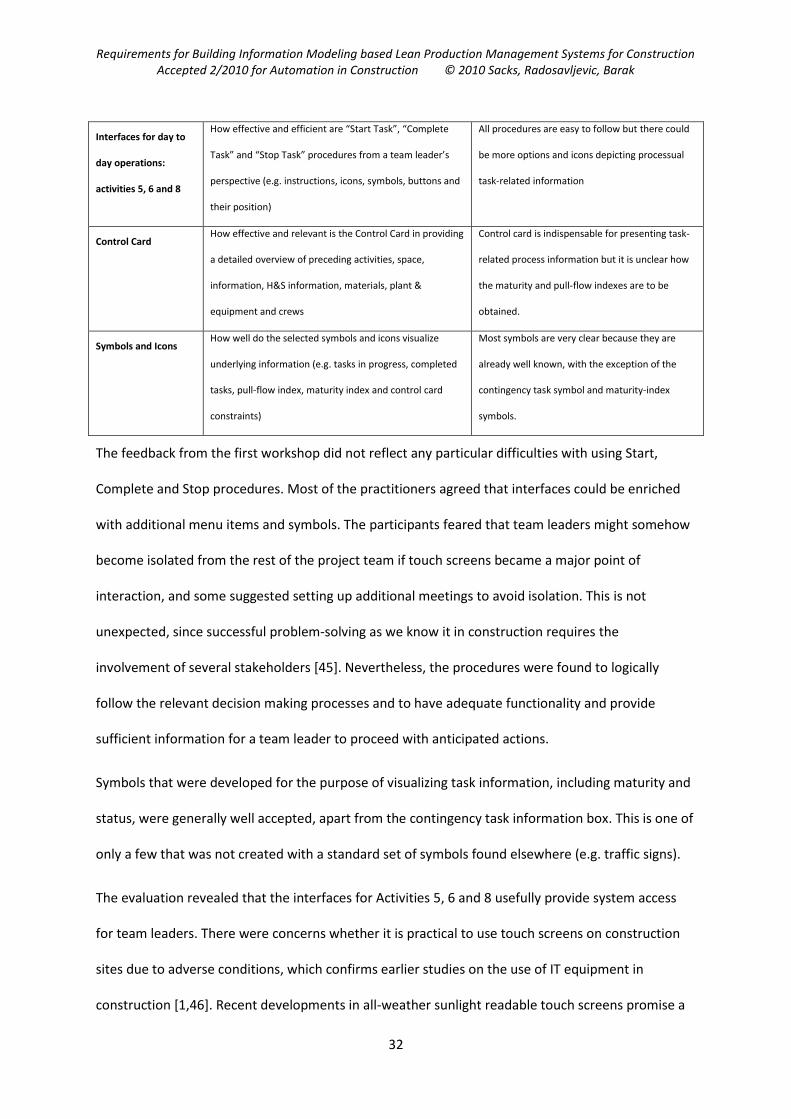
Interfaces for day to
day operations:
activities 5, 6 and 8
How effective and efficient are “Start Task”, “Complete
Task” and “Stop Task” procedures from a team leader’s
perspective (e.g. instructions, icons, symbols, buttons and
their position)
All procedures are easy to follow but there could
be more options and icons depicting processual
task-related information
Control Card How effective and relevant is the Control Card in providing
a detailed overview of preceding activities, space,
information, H&S information, materials, plant &
equipment and crews
Control card is indispensable for presenting task-
related process information but it is unclear how
the maturity and pull-flow indexes are to be
obtained.
Symbols and Icons How well do the selected symbols and icons visualize
underlying information (e.g. tasks in progress, completed
tasks, pull-flow index, maturity index and control card
constraints)
Most symbols are very clear because they are
already well known, with the exception of the
contingency task symbol and maturity-index
symbols.
The feedback from the first workshop did not reflect any particular difficulties with using Start,
Complete and Stop procedures. Most of the practitioners agreed that interfaces could be enriched
with additional menu items and symbols. The participants feared that team leaders might somehow
become isolated from the rest of the project team if touch screens became a major point of
interaction, and some suggested setting up additional meetings to avoid isolation. This is not
unexpected, since successful problem-solving as we know it in construction requires the
involvement of several stakeholders [45]. Nevertheless, the procedures were found to logically
follow the relevant decision making processes and to have adequate functionality and provide
sufficient information for a team leader to proceed with anticipated actions.
Symbols that were developed for the purpose of visualizing task information, including maturity and
status, were generally well accepted, apart from the contingency task information box. This is one of
only a few that was not created with a standard set of symbols found elsewhere (e.g. traffic signs).
The evaluation revealed that the interfaces for Activities 5, 6 and 8 usefully provide system access
for team leaders. There were concerns whether it is practical to use touch screens on construction
sites due to adverse conditions, which confirms earlier studies on the use of IT equipment in
construction [1,46]. Recent developments in all-weather sunlight readable touch screens promise a
Requirements for Building Information Modeling based Lean Production Management Systems for Construction Accepted 2/2010 for Automation in Construction © 2010 Sacks, Radosavljevic, Barak
33
much better use in construction, but security from theft and vandalism remains a challenge.
Practitioners also agreed that there are often so called 'make-do' situations where tasks should be
allowed to start even if they are not mature. The responses clearly indicate that team leaders should
be allowed to independently judge such situations, but that the system should in turn support the
decision making with appropriate and sufficiently detailed information. Although make-do behavior
has been found to be detrimental to the success of projects there is evidence in the literature that
construction processes should be sufficiently flexible to allow for early start of somewhat immature
tasks with some unavailable inputs [47]. Without exception, all participants agreed that involving
trade managers in the detailed planning process early on is crucial. This indicates the importance of
project team integration for successful detailed planning that has been also supported by earlier
studies [35].
The first round of evaluation led to several minor amendments of the proposed system requiring
further evaluation that was performed during the second and third workshops. An equivalent four-
stage approach with a single questionnaire divided into four sections was used in this second round
(see Table 2). Considering similarities in the user interface formats and time restrictions this second
evaluation only covered the interfaces for activities 5, 6 and 8, but the questionnaire contained an
additional section on current conditions. The additional section was then used to correlate the
issues identified by the participants with those the system is designed to eliminate.
The second workshop was held in the business school facility at the headquarters of a major
construction management organization. There were 10 attendees, six from the construction
management team of a 26 story office building under construction in London (planner, close-out
manager, construction Manager, assistant construction Manager, senior construction manager and
a director) and three from different subcontractors at the same project (two M&E trade
construction managers and a crew leader). The third workshop was held at the headquarters of a
major BIM vendor in Espoo, Finland, with five participants (a senior construction manager, two
Requirements for Building Information Modeling based Lean Production Management Systems for Construction Accepted 2/2010 for Automation in Construction © 2010 Sacks, Radosavljevic, Barak
34
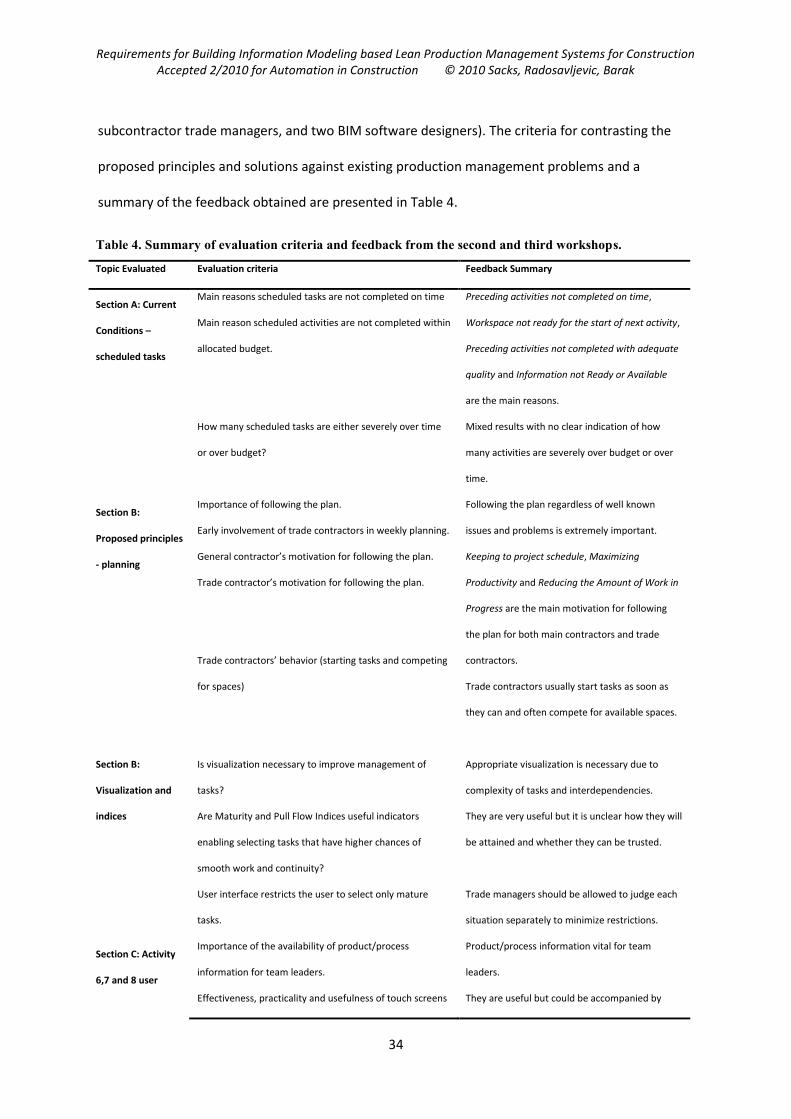
subcontractor trade managers, and two BIM software designers). The criteria for contrasting the
proposed principles and solutions against existing production management problems and a
summary of the feedback obtained are presented in Table 4.
Table 4. Summary of evaluation criteria and feedback from the second and third workshops.
Topic Evaluated Evaluation criteria Feedback Summary
Section A: Current
Conditions –
scheduled tasks
Main reasons scheduled tasks are not completed on time
Main reason scheduled activities are not completed within
allocated budget.
Preceding activities not completed on time,
Workspace not ready for the start of next activity,
Preceding activities not completed with adequate
quality and Information not Ready or Available
are the main reasons.
How many scheduled tasks are either severely over time
or over budget?
Mixed results with no clear indication of how
many activities are severely over budget or over
time.
Section B:
Proposed principles
- planning
Importance of following the plan.
Early involvement of trade contractors in weekly planning.
General contractor’s motivation for following the plan.
Trade contractor’s motivation for following the plan.
Trade contractors’ behavior (starting tasks and competing
for spaces)
Following the plan regardless of well known
issues and problems is extremely important.
Keeping to project schedule, Maximizing
Productivity and Reducing the Amount of Work in
Progress are the main motivation for following
the plan for both main contractors and trade
contractors.
Trade contractors usually start tasks as soon as
they can and often compete for available spaces.
Section B:
Visualization and
indices
Is visualization necessary to improve management of
tasks?
Are Maturity and Pull Flow Indices useful indicators
enabling selecting tasks that have higher chances of
smooth work and continuity?
User interface restricts the user to select only mature
tasks.
Appropriate visualization is necessary due to
complexity of tasks and interdependencies.
They are very useful but it is unclear how they will
be attained and whether they can be trusted.
Trade managers should be allowed to judge each
situation separately to minimize restrictions.
Section C: Activity
6,7 and 8 user
Importance of the availability of product/process
information for team leaders.
Effectiveness, practicality and usefulness of touch screens
Product/process information vital for team
leaders.
They are useful but could be accompanied by
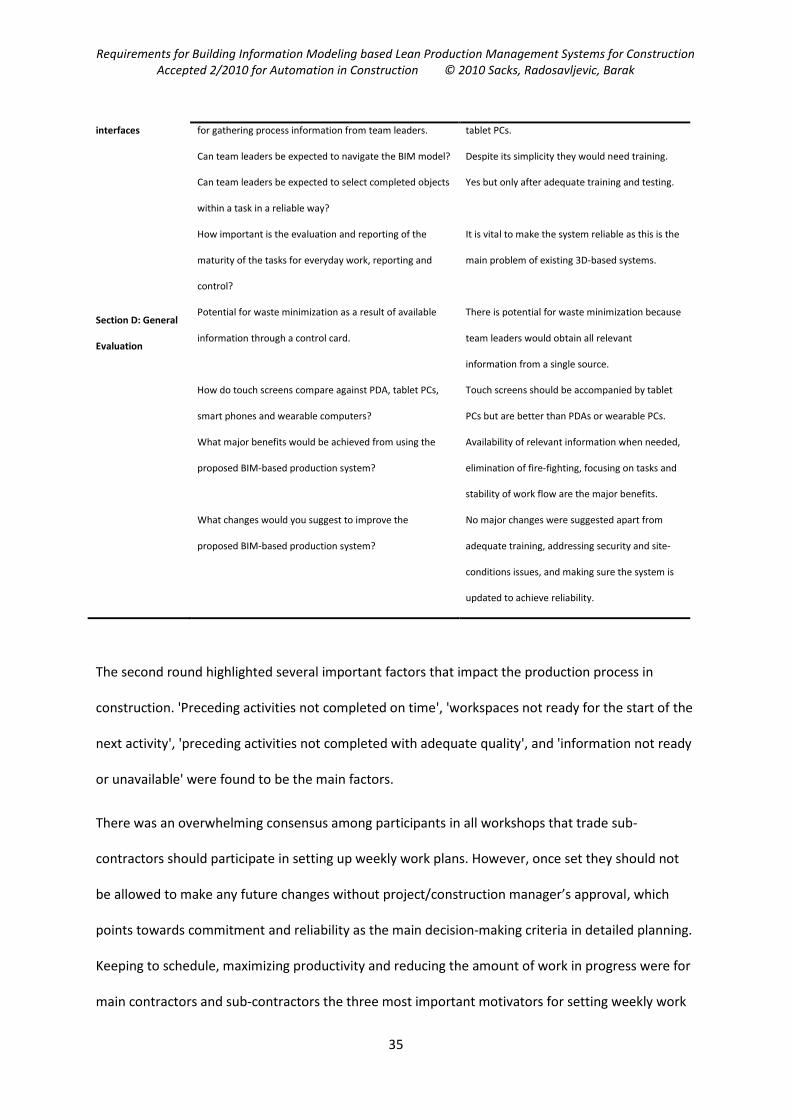
Requirements for Building Information Modeling based Lean Production Management Systems for Construction Accepted 2/2010 for Automation in Construction © 2010 Sacks, Radosavljevic, Barak
35
interfaces for gathering process information from team leaders.
Can team leaders be expected to navigate the BIM model?
Can team leaders be expected to select completed objects
within a task in a reliable way?
How important is the evaluation and reporting of the
maturity of the tasks for everyday work, reporting and
control?
tablet PCs.
Despite its simplicity they would need training.
Yes but only after adequate training and testing.
It is vital to make the system reliable as this is the
main problem of existing 3D-based systems.
Section D: General
Evaluation
Potential for waste minimization as a result of available
information through a control card.
How do touch screens compare against PDA, tablet PCs,
smart phones and wearable computers?
What major benefits would be achieved from using the
proposed BIM-based production system?
What changes would you suggest to improve the
proposed BIM-based production system?
There is potential for waste minimization because
team leaders would obtain all relevant
information from a single source.
Touch screens should be accompanied by tablet
PCs but are better than PDAs or wearable PCs.
Availability of relevant information when needed,
elimination of fire-fighting, focusing on tasks and
stability of work flow are the major benefits.
No major changes were suggested apart from
adequate training, addressing security and site-
conditions issues, and making sure the system is
updated to achieve reliability.
The second round highlighted several important factors that impact the production process in
construction. 'Preceding activities not completed on time', 'workspaces not ready for the start of the
next activity', 'preceding activities not completed with adequate quality', and 'information not ready
or unavailable' were found to be the main factors.
There was an overwhelming consensus among participants in all workshops that trade sub-
contractors should participate in setting up weekly work plans. However, once set they should not
be allowed to make any future changes without project/construction manager’s approval, which
points towards commitment and reliability as the main decision-making criteria in detailed planning.
Keeping to schedule, maximizing productivity and reducing the amount of work in progress were for
main contractors and sub-contractors the three most important motivators for setting weekly work
Requirements for Building Information Modeling based Lean Production Management Systems for Construction Accepted 2/2010 for Automation in Construction © 2010 Sacks, Radosavljevic, Barak
36
plans. Most agreed that sub-contractors normally start their activities as soon as they can and also
often compete for available workspace. Most therefore strongly agree that visualization on site
using 3D building information models could improve management of often competing activities.
Participants agreed that the system could provide full project integration and link relevant
information to a 3D model but also identified the following drawbacks and necessary conditions:
- Training (despite being simple to use many believe team leaders would require extensive
training to get used to the new reality and avoid potential errors or misuse)
- Managing change (the existing use of 3D planning software shows that it is extremely
difficult to promptly update models as a result of design and other changes)
- Site conditions (adversarial site conditions, weather and poor IT infrastructure are the major
factors that could prevent successful implementation of the system)
Conclusions
A set of guiding requirements for implementation and operation of a BIM based lean production
management system for construction has been compiled through development of the KanBIM
concept. The requirements were derived through research in which a system was specified,
prototype interfaces were implemented and tested using a touch-screen unit for site
communications, and in which the approach was evaluated with construction companies. The key
requirements concern issues of visualization of the construction process and its status; visualization
of the construction product and work methods; support for planning, negotiation, commitment and
status feedback; implementation of pull flow control; maintenance of work flow and plan stability;
and formalizing production experiments for continuous process improvement. The requirements
emphasize the role of a KanBIM system in supporting human decision making, negotiation among
trade teams to coordinate weekly work plans, reduction of the granularity of planning to a daily
Requirements for Building Information Modeling based Lean Production Management Systems for Construction Accepted 2/2010 for Automation in Construction © 2010 Sacks, Radosavljevic, Barak
37
level, real-time evaluation of task constraints to compute task maturity, and implementation of the
language/action perspective.
The primary contribution of the KanBIM concept is that it provides visualization not only of the
construction product, but of the production process. It extends the LPS by providing the information
infrastructure to reduce the granularity of planning coordination from weekly to daily. It enables
negotiation between parties affected by changes and informs – and thus empowers – all others on
and off site of any changes agreed to the plan in real-time. As such, it can contribute to relieving the
need for construction managers to ‘fight fires’ and enable them to focus on establishing the
production systems, setting policy and continuous improvement. If used with the priority pull flow
index, it will also extend the LPS’s ability to stabilize plans by enabling implementation of a CONWIP
production system.
The qualitative feedback resulting from the discussions and questionnaires used in the three
workshops indicates that practitioners were generally supportive of the system and its aim to
improve management in construction but they agreed that the system requires careful addressing of
potential problems. According to the received feedback site conditions, security and human
behavior are among the most serious problems that could affect the implementation of the system.
Project team integration by means of sub-contractors’ involvement in the detailed planning process
and the need to better visualize production/process information were all found to be highly
significant for the successful production management. However, adequate testing on site in order to
establish to what extent technical difficulties can impact upon the usefulness of the system and
behavioral investigation of its use have been identified as prerogative before the system could see
the full scale application in the industry.
This paper has outlined the concept and defined the requirements and presented a system design
for a BIM enabled lean production management system for construction. Evaluation to date has
identified the value of the system concept, but also shortcomings in the interface designs. Clearly,
Requirements for Building Information Modeling based Lean Production Management Systems for Construction Accepted 2/2010 for Automation in Construction © 2010 Sacks, Radosavljevic, Barak
38
further research is needed before a full scale KanBIM system can be built. Future work will include
testing of the algorithms for calculation of work package and task maturity, development of the pull
flow index and its computation, experimentation to explore the feasibility for guiding teams’
progress through projects using the touch-screen or other interfaces, and the information
technology challenges of maintaining an updated construction process model within a construction
BIM tool.
Acknowledgement
The research reported in this paper was supported by grants from the Innovative Construction
Research Centre at the University of Reading, UK, and from Tekla Oy, Espoo, Finland.
References
[1] L. Koskela, An exploration towards a production theory and its application to construction,
D. Tech, VTT Building Technology, Helsinki University of Technology, 2000.
[2] I.D. Tommelein, D.R. Riley, G.A. Howell, Parade Game: Impact of Work Flow Variability on
Trade Performance, Journal of Construction Engineering and Management 125 (5) (1999)
304-310.
[3] H.H. Bashford, K. Walsh, A. Sawhney, Production System Loading–Cycle Time Relationship in
Residential Construction, J. Constr. Engrg. and Mgmt. 131 (1) (2005) 15-22.
[4] R. Sacks, A. Esquenazi, M. Goldin, LEAPCON: Simulation of Lean Construction of High-Rise
Apartment Buildings, Journal of Construction Engineering and Management 133 (7) (2007)
529-539.
[5] G. Ballard, The Last Planner™ System of Production Control, PhD Dissertation, School of Civil
Engineering, The University of Birmingham, 2000.
[6] L. Koskela, Management of Production in Construction: A Theoretical View, 7th Annual
Conference of the International Group for Lean Construction, University of California,
Berkeley, CA, 1999, pp. 241-252.
[7] R. Sacks, M. Harel, An economic game theory model of subcontractor resource allocation
behavior, Construction Management & Economics 24 (8) (2006) 869-881.
[8] M. Radosavljevic, R.M.W. Horner, The evidence of complex variability in construction labour
productivity, Construction Management and Economics 20 (1) (2002) 3 - 12.
Requirements for Building Information Modeling based Lean Production Management Systems for Construction Accepted 2/2010 for Automation in Construction © 2010 Sacks, Radosavljevic, Barak
39
[9] R. Navon, R. Sacks, Assessing research issues in Automated Project Performance Control
(APPC), Automation in Construction 16 (4) (2007) 474-484.
[10] C.M. Eastman, P. Teicholz, R. Sacks, K. Liston, BIM Handbook: A Guide to Building
Information Modeling for Owners, Managers, Architects, Engineers, Contractors, and
Fabricators, John Wiley and Sons, Hoboken, NJ, 2008.
[11] J.E. Liker, The Toyota Way, McGraw-Hill, New York, 2003.
[12] G.G. Galsworth, Visual Systems: Harnessing the power of a visual workplace, 1st edition
(January 15, 1997) ed., AMACOM/American Management Association, New York City, 1997.
[13] W.J. Hopp, M.L. Spearman, Factory Physics, IRWIN, Chicago, 1996.
[14] R. Arbulu, A. Koerckel, F. Espana, Linking production-level workflow with materials supply,
in: R. Kenley (Ed.), 13th Conference of the International Group for Lean Construction,
University of New South Wales, Sydney, Australia, 2005, pp. 199-206.
[15] K. McKinney, M. Fischer, Generating, evaluating and visualizing construction schedules with
CAD tools, Automation in Construction 7 (6) (1998) 433-447.
[16] CommonPoint, Common Point Inc., Common Point Inc., Mountain View, CA,
http://www.commonpointinc.com/, last accessed December 2007.
[17] Synchro, Synchro, Synchro Ltd, Coventry UK, www.synchroltd.com/, last accessed December
2007.
[18] B. Akinci, M. Fischer, J. Kunz, Automated Generation of Work Spaces Required by
Construction Activities, Journal of Construction Engineering and Management 128 (4) (2002)
306-315.
[19] VICO, Virtual Construction 2007, Vico Software, Inc., Boulder, CO,
http://www.vicosoftware.com/, last accessed April 2007.
[20] H.J. Choo, I.D. Tommelein, G. Ballard, T.R. Zabelle, WorkPlan: Constraint-Based Database for
Work Package Scheduling, Journal of Construction Engineering and Management 125 (3)
(1999) 151-160.
[21] A. Koerckel, G. Ballard, Return on investment in construction innovation - a lean
construction case study, in: Russell (Ed.), 13th Annual Conference on Lean Construction,
UNSW, Sydney, Australia, 2005.
[22] E. Sriprasert, N. Dawood, Multi-Constraint Information Management and Visualisation for
Collaborative Planning and Control in Construction, ITcon - IT in Construction 8 (2003) 341 -
366.
Requirements for Building Information Modeling based Lean Production Management Systems for Construction Accepted 2/2010 for Automation in Construction © 2010 Sacks, Radosavljevic, Barak
40
[23] Bentley, ConstructSim, Bentley Inc., Exton, PA, http://www.bentley.com/en-
US/Products/ConstructSim/, last accessed November 25th 2009.
[24] I. Starkov, TOKMO, Tokmo Solutions, Inc., Reston, VA, http://tokmo.com/product.html, last
accessed 16th December 2009.
[25] R. Sacks, M. Treckmann, O. Rozenfeld, Visualization of Work Flow to Support Lean
Construction, Journal of Construction Engineering and Management 135 (12) (2009) 1307-
1315.
[26] K.N. Hewage, J.Y. Ruwanpura, A novel solution for construction on-site communication - the
information booth, Can. J. Civ. Eng. 36 (4) (2009) 659-671.
[27] L. Koskela, G. Howell, The Underlying Theory of Project Management Is Obsolete,
Engineering Management Review, IEEE 36 (2) (2008) 22-34.
[28] N. Costantino, R. Pietroforte, Subcontracting practices in USA homebuilding: an empirical
verification of Eccles’s findings 20 years later, European Journal of Purchasing & Supply
Management 8 (2002) 15–23.
[29] S. Kubicki, J.C. Bignon, G. Halin, P. Humbert, Assistance to building construction coordination
- towards a multi-view cooperative platform, ITcon - IT in Construction 11 (Special Issue
Process Modelling, Process Management and Collaboration) (2006) 565-586.
[30] A.D. Songer, P.S. Subramanian, J.E. Diekmann, Integrating workflow modeling and 3d cad for
visualizing project performance, CIB W78, Reykjavik, Iceland, 2000.
[31] R. Navon, E. Goldschmidt, Can Labor Inputs be Measured and Controlled Automatically?,
ASCE Journal of Construction Engineering and Management 129 (4) (2003) 437-445.
[32] R. Sacks, R. Navon, I. Brodetskaia, A. Shapira, Feasibility of Automated Monitoring of Lifting
Equipment in Support of Construction Project Control, ASCE Journal of Construction
Engineering and Management 131 (5) (2005) 604–614.
[33] F. Bosche, C.T. Haas, Towards Automated Retrieval of 3D Designed Data in 3D Sensed Data,
in: S. Lucio, A. Burcu (Eds.), ASCE International Workshop on Computing in Civil Engineering
Vol. 261, ASCE, Pittsburgh, PA, 2007, pp. 648-656.
[34] T. Sawyer, $1-Billion Jigsaw Puzzle Has Builder Modeling Supply Chains, Engineering News
Record, Vol. 23rd April 2008, 2008.
[35] M. Radosavljevic, R.M.W. Horner, Process planning methodology: dynamic short-term
planning for off-site construction in Slovenia, Construction Management and Economics 25
(2) (2007) 143-156.
Requirements for Building Information Modeling based Lean Production Management Systems for Construction Accepted 2/2010 for Automation in Construction © 2010 Sacks, Radosavljevic, Barak
41
[36] R.C. Bortolazza, D.B. Costa, C.T. Formoso, A quantitative analysis of the implementation of
the Last Planner System in Brazil, in: R. Kenley (Ed.), 13th Conference of the International
Group for Lean Construction, UNSW, Sydney, Australia, 2005, pp. 413-420.
[37] A.D. Russell, C.-Y. Chiu, T. Korde, Visual representation of construction management data,
Automation in Construction 18 (8) (2009) 1045-1062.
[38] K. Chau, M. Anson, Z. J., 4D dynamic construction management and visualization software,
Automation in Construction 14 (2005) 512-524.
[39] R.R. Lipman, Mobile 3D visualization for steel structures, Automation in Construction 13 (1)
(2004) 119-125.
[40] K. Preiss, Agility and Leanness, Proceedings of the International Conference on Agile
Manufacturing, Old Dominion University, Norfolk, VA, 2006.
[41] T. Winograd, A Language/Action Perspective on the Design of Cooperative Work, Human-
Computer Interaction 3 (1) (1987) 3 - 30.
[42] R. Vrijhoef, L. Koskela, G. Howell, Understanding construction supply chains: an alternative
interpretation, in: D. Chua, G. Ballard (Eds.), Proceedings of the 9th Annual Conference of
the International Group for Lean Construction (IGLC), National University of Singapore,
Singapore, 2001.
[43] R. Partouche, A Lean Model for Construction Management of Tall Office/Commercial
Buildings, MSc, Faculty of Civil and Env. Eng., Technion - Israel Institute of Technology, 2009.
[44] W.E. Deming, Out of the Crisis, Massachusetts Institute of Technology, Cambridge, MA,
1982.
[45] B.K. Baiden, A.D.F. Price, A.R.J. Dainty, The Extent of Team Integration within Construction
Projects, International Journal of Project Management 24 (1) (2006) 13-23.
[46] T. Olofsson, M. Emborg, Feasibility Study of Field Force Automation in the Swedish
Construction Sector, ITcon 9 (2004) 297-311.
[47] L. Koskela, Making Do - The Eighth Category of Waste, in: C.T. Formoso, S. Bertelsen (Eds.),
12th Annual Conference on Lean Construction, Lean Construction - DK, Elsinore, Denmark,
2004.
Requirements for Building Information Modeling based Lean Production Management Systems for Construction Accepted 2/2010 for Automation in Construction © 2010 Sacks, Radosavljevic, Barak
42
List of Tables Table 1. Supplier reliability Rk based on its record of project performance to date.
Table 2. Aspects of construction planning and control according to level of planning.
Table 3. Summary of evaluation criteria and feedback from the first workshop.
Table 4. Summary of evaluation criteria and feedback from the second and third workshops.
List of Figures Fig. 1. Proposed 3D visualization of past, present and future work status for a trade [25].
Fig. 2. Visualization of drywall tasks color-coded to identify process status, as used by a Finnish
construction management company.
Fig. 3. Process flow model for the KanBIM system.
Fig. 4. User interface for detailing work packages to tasks and compiling the weekly work plan by
allocating crews to tasks
Fig. 5. Weekly work plan meeting setup
Fig. 6. Project planner contractor view interface for creating integrated and synchronized weekly
work plans.
Fig. 7. Trade crew leader work status and reporting interface showing a crew's tasks. The crew leader
can ask the system to show neighboring tasks for a complete picture of the overall work.
Fig. 8. Reporting start of a drywall activity on a building model interface using a 40” all-weather
touch-screen monitor mounted on a mobile trolley. The system identifies trade crew leaders (by
RFID tag or by entry of a unique ID) and delivers specifically tailored information concerning their
tasks' status and content.;
Fig. 9. Reporting form for problems during execution which led to stopping the task. The reporting
tool enables information flow from the work face back to the information servers to create an up-to-
date image of the work status and to raise flags when problems are encountered.
Fig. 10. Control card for framing drywall partition task