report safety code 6 (sc6) measurement on triangle ... · safety code 6 (sc6) measurement on...
TRANSCRIPT

December 2008 Spectrum Management and Telecommunications
Report
Safety Code 6 (SC6) Measurement on Triangle Mountain in Colwood, British Columbia

i
Contents Executive Summary...................................................................................................................................1
Technical Report........................................................................................................................................3
1. Introduction....................................................................................................................................3
2. Background ....................................................................................................................................3 2.1 Equipment ........................................................................................................................... 3 2.2 Monitoring of the transmitted power of the FM stations.................................................... 4
3. Measurement locations..................................................................................................................5
4. Measurement procedures..............................................................................................................6 4.1 General scan and continuous logging of data along Bexhill Place..................................... 6 4.2 Measurement procedures at various locations .................................................................... 6
5. Measurement results......................................................................................................................8 5.1 General scan along Bexhill Place (public street) ................................................................ 8 5.2 Results of Measurements Taken at Multiple Locations (Public and Private)..................... 9 5.3 Additional Measurement Data (Site Revisited on August 13, 2008)................................ 11 5.4 Other Measurements ......................................................................................................... 11
6. Analysis of the Results .................................................................................................................11 6.1 Measurement Data ............................................................................................................ 11 6.2 Measurement Data Analysis and Uncertainty................................................................... 13 6.3 Other Measurement Results.............................................................................................. 15
7. Summary.......................................................................................................................................16
8. Conclusion ....................................................................................................................................16
9. Related documents .......................................................................................................................16
Annex A - Operating Parameters of the Three FM Stations and Results of Two Inspection Reports.......................................................................................17
Annex B - The Measurement Equipment ..............................................................................................18
Annex C - Off-air Monitoring of the Three FM Stations.....................................................................20
Annex D - Measurement Uncertainty ....................................................................................................22
Annex E - Comparison of the Measured Results from the SRM-3000 and 8718B Meters ...............23
Annex F - Analysis of Measured Results from the SRM-3000 and 8718B Meters with Extended Uncertainty ...................................................................................................24
Annex G - Analysis of Measured Results from 2001 and 2008............................................................25

Safety Code 6 (SC6) Measurement on Triangle Mountain in Colwood, British Columbia
1
Executive Summary Safety Code 6 Measurement – Colwood, British Columbia On July 30, 2008, Industry Canada staff conducted radio frequency field measurements in the vicinity of the broadcasting towers on Triangle Mountain in Colwood, British Columbia. The objective of the measurements was to verify compliance with respect to Safety Code 6 (SC6) in the area around the Triangle Mountain antenna site. In 2001, surveys performed by Industry Canada indicated that this antenna site was compliant with SC6 for the general public. Safety Code 6, published by Health Canada, specifies maximum radio frequency fields (RFF) exposure limits for the general public (GP) and for the radio frequency and microwave exposed workers (RF workers). The maximum exposure limit of SC6 is expressed in a linear scale in field strength (volts per metre or V/m, and amperes per metre or A/m) or in power density measurement units (watts per squared metre or W/m2). The industry normally uses the simpler “percentage of maximum exposure limit” for the general public or RF workers. Two surveyors, each using an independently calibrated instrument, conducted the measurements. The measurements from the two instruments were in agreement within the measurement uncertainty recommended by the manufacturer. One of the two instruments is capable of displaying the RFF contributions by services. It confirmed that the three FM signals contributed 99.978% of the overall emissions present at the test locations. While measurements were being taken on site, inspections were being carried out at the same time at the three FM stations. Off-air monitoring of the three FM stations was also undertaken twice each day from July 29 to August 5, 2008. The results of the inspections confirmed that the three stations were functioning at or near the maximum authorized transmit power, and monitoring confirmed no significant variations in signal levels during the period surveyed. Measurement survey results A continuous scan, with 130 measurements recorded along the street called Bexhill Place, resulted in an average measurement of 5.2% and a maximum measurement of 9.1% of the SC6 exposure limit for the general public. Measurements were taken at 28 locations, including public places, the front and back yards of residential properties, and inside some residences. Several measurement locations on private properties were suggested by residents. At each location, a 60-second average measurement was taken using two different sets of calibrated instruments. The data showed that: • measured RF exposures are less than 9% of the SC6 limit for the general public at 82% of the
locations; • all measured locations, except for one location, are less than 17% of the SC6 exposure limit for the
general public; and • the maximum RFF exposure measurement of 18.10% was found at one location, probably due to the
reflection effect at this particular location.
Safety Code 6 (SC6) Measurement on Triangle Mountain in Colwood, British Columbia
2
As a result of this survey, Industry Canada found that the measured RF field strengths are all less than the exposure limit of SC6 for the general public even when measurement uncertainties are included. Therefore, the antenna site at Triangle Mountain, Colwood, British Columbia, is in compliance with SC6.
Safety Code 6 (SC6) Measurement on Triangle Mountain in Colwood, British Columbia
3
Technical Report 1. Introduction On July 30, 2008, Industry Canada staff conducted radio frequency field (RFF) measurements in the vicinity of the broadcasting towers on Triangle Mountain in Colwood, British Columbia. The maximum RFF exposure limits for the general public (GP) and for the radio frequency and microwave exposed workers (RF workers), are specified in the document known as Safety Code 6 (SC6), which is published by Health Canada. The objective of these measurements was to verify the compliance with respect to SC6 in the area around Triangle Mountain antenna site. SC6 surveys performed in 2001 by Industry Canada (using similar equipment) indicated that the antenna site was, at that time, compliant with SC6 for the general public (GP). 2. Background Survey Date: Wednesday, July 30, 2008 Survey Team: Tam Huynh, Communications Engineer Ron Gloux, Spectrum Portfolio Manager Weather condition: Approximately 20°C Mostly sunny, with some cloud Humidity low, dry ground 2.1 Equipment For this survey, two sets of calibrated equipment were used to measure the radio frequency fields: the Narda Electromagnetic Survey Meter 8718B with the probe C8722D; and the Narda Selective Radiation Meter SRM-3000 with an isotropic antenna. For a more detailed description of these meters and their respective calibration dates, refer to Annex B. The 8718B measures and displays the RFF level as a percentage of the SC6 RF workers limit whereas the SRM-3000 displays the RFF as a percentage of the SC6 GP limit. As the exposure limit for the general public is 20% of RF workers in the frequencies of interest, in order to compare the measurements as provided by the two instruments, the 8718B measurements must be multiplied by 5 before being compared to the SRM-3000 measurements. Other equipment used included: a map; orange plastic cones to mark measurement location; and a digital camera to take photographs. At this antenna site, there are two metal structure towers supporting the three FM stations’ antenna arrays; the authorized operating parameters of these stations are listed in Annex A. As a preliminary step, the SRM-3000 was used to verify that the FM broadcast signals were the dominant RFF emission component in this environment. Taking a measurement at location 1 (see Figure 2) as an example, the SRM-3000 measured and computed the total RFF and the contribution of each individual service. The results are listed in Table 1.

Safety Code 6 (SC6) Measurement on Triangle Mountain in Colwood, British Columbia
4
Service Value % SC6 GP Frequency Range (MHz) TV Channel 2-6 0.0002460 % 54.000 to 88.000 FM Radio 4.631 % 88.000 to 108.000 Paging 0.0000163 % 152.000 to 159.000 TV Channel 7-13 0.0000784 % 174.000 to 216.000 TV Channel 14-69 0.0001302 % 470.000 to 806.000 SMR Tx 0.0000026 % 806.000 to 821.000 Private Land Mobile 0.0000005 % 821.000 to 824.000 Cellular AMPS 0.0000039 % 824.000 to 849.000 ESMR/ Land Mobile 0.0000849 % 849.000 to 869.000 Cellular AMPS 0.0000047 % 869.000 to 894.000 Aeronautical Mobile 0.0000002 % 894.000 to 896.000 Private Land Mobile 0.0000006 % 896.000 to 901.000 PCS Narrowband 0.0000001 % 901.000 to 902.000 Land Mobile & Ham 0.0000778 % 902.000 to 930.000 PCS Narrowband 0.0000001 % 930.000 to 931.000 Paging 0.0000015 % 931.000 to 932.000 PCS Narrowband 0.0000002 % 940.000 to 941.000 Public Land Mobile 0.0000023 % 941.000 to 960.000 PCS Broadband 0.0000206 % 1850.000 to 1990.000 Others 0.0004619 % Total 4.632 % 54.000 to 1990.000 Table 1: A display of the total RFF and contributions of individual services to the overall field exposure at Triangle Mountain in Colwood, B.C., July 30, 2008, as measured by the SRM-3000. These results indicated that the FM signals constituted 100 x 4.631/4.632 = 99.978 % of the overall RF emission. 2.2 Monitoring of the transmitted power of the FM stations While measurements were taken on site, another employee of Industry Canada carried out an inspection of the three FM stations. Annex A provides the results of the inspection report regarding the three FM stations on July 30, 2008. The three stations were found to be functioning near the maximum authorized transmission power. A third-party, off-air monitoring of the three FM stations was also conducted twice each day from July 29 to August 5, 2008, inclusive. Annex C shows the results of this monitoring of the three FM stations. No significant variation was noted in the measured signal levels from the three FM stations in this period. In addition, Industry Canada conducted similar off-air monitoring of the three FM stations from July 23 to August 15, 2008, inclusive (see Annex C). No significant variation was noted in the measured signal levels of the three FM stations in this period. Both sets of monitoring data and the inspection report were consistent with the conclusion that no significant variation occurred during this time in the operating transmission powers of the three FM broadcast stations.

Safety Code 6 (SC6) Measurement on Triangle Mountain in Colwood, British Columbia
5
3. Measurement locations Figure 1 shows the map of the Triangle Mountain antenna site. Measurement locations are shown in circled numbers. Only location numbers in public places are shown in the map.
Figure 1: Map with measurement location numbers in public places, for July and August 2008 on Triangle Mountain in Colwood, B.C. For this survey, the following measurements were taken:

Safety Code 6 (SC6) Measurement on Triangle Mountain in Colwood, British Columbia
6
First, a scan with continuous data logging was performed on the sidewalk of Bexhill Place from the front of residence #814 to residence #816. This scan provided an indication of how the RFF varied on this segment of Bexhill Place. The SRM-3000 was used to perform this scan and all data were saved in the meter’s memory. Second, a number of locations in public places on Bexhill Place, on residential properties and inside some residences were selected as measurement locations according to one or more of these criteria: • where measurements were made in a previous survey (thus providing a historic comparison of the RF
field at these locations); • where a maximum signal level was observed during a general scan; and • in front and back yards, or inside houses as requested by owners. The public measurement locations are indentified by numbers in Figure 1. To respect the privacy of individuals, residential measurement locations are not identified in this report. For each location, two measurements were taken: a first measurement with the Narda 8718B/C8722D and a second measurement with the SRM-3000. 4. Measurement procedures 4.1 General scan and continuous logging of data along Bexhill Place For this scan, the SRM-3000 was used in continuous logging mode. The surveyor started at the location near the fire hydrant (in front of residence #805) and walked slowly in a northwest direction on the sidewalk in front of residence #814 to residence #816. Data was recorded continuously every 1.5 seconds for each step of the surveyor, that is, a measurement was taken at approximately 30-centimetre intervals. See Figure 2 for the RF field strength measurements recorded along the selected section of Bexhill Place as expressed in unit μW/cm2 (microwatts per square centimetre) and the respective measured percentage of exposure with respect to the SC6 general public level. At FM broadcast frequencies, the SC6 exposure limit in power density for the general public is 200 μW/cm2 or 2 W/m2. 4.2 Measurement procedures at various locations At each measurement location, these procedures were followed: 1. identify the location; 2. mark the location with an orange cone; 3. take a photograph of the location; 4. measure with the Narda 8718B meter; and 5. measure with the SRM-3000 meter.

Safety Code 6 (SC6) Measurement on Triangle Mountain in Colwood, British Columbia
7
4.2.1 Signal Measurement Procedure for the NARDA 8718B meter with the NARDA C8722D probe
The NARDA 8718B meter was set to display in percentage of SC6 exposure limit for the RF workers. Zeroing of the probe was frequently required (a warning display appears on the meter). The frequencies of the three FM broadcast stations are 98.5 MHz, 103.1 MHz and 107.3 MHz; the correction factor for the probe C8722D corresponding to 100 MHz was used. The value of this correction factor read directly on the handle of the probe was 0.86. At each measurement location and using the orange cone as a reference point, the surveyor held the probe away from his/her body, with the probe pointing towards the transmitter and ensuring that his/her body was not directly in front of or behind the probe. The measurement at each location was done in “Time Average Mode” for 60 seconds. Starting at approximately 20 cm from the ground (top of the orange cone), the probe was moved up slowly, stopped at approximately 2 metres above ground and then slowly moved down to the top of the cone. This cycle was repeated as necessary over a period of 60 seconds. Such displacement of the probe is meant to represent the coverage of the entire body of a person over 60 seconds. In accordance with Narda’s recommendations, the probe was rotated about its axis during the up-and-down movement in order to optimize the accuracy of the measurement. 4.2.2 Signal Measurement Procedure for the SRM-3000 Meter with Isotropic Antenna The SRM-3000 was set to “Safety Evaluation Mode.” Column 1 of Table 1 lists all services that were programmed in the SRM-3000. The results were set to display the percentage of SC6 exposure limit for the general public. At each measurement location and using the orange cone as a reference point, the surveyor held the probe as used for the C8722D probe described in Section 4.2.1 above. The measurement at each location was done in “Spatial Averaging Mode.” Each run in display mode “percent of SC6” (data acquisition time plus processing time from raw data) required approximately 2 seconds. The percentage of SC6 and the number of runs are displayed and updated after each run. In order to have an average of 60 seconds, it took 30 runs, i.e., 30 x 2 s = 60 seconds. Operating the same way as with the 8718B meter, the position of the probe started at about 20 cm from the ground (top of the orange cone); then the probe was moved up slowly, stopped at about 2 metres then moved down to the top of the cone. This cycle was repeated as necessary to cover 30 runs. Such displacement of the probe theoretically represents the coverage of the entire body of a person over a period of 60 seconds. For the SRM-3000, there is no requirement to rotate the isotropic probe about its axis during the up-and-down movement. For each measurement, the results were saved in the meter’s memory with an index number. An example of saved data for one measurement is shown in Table 1.

Safety Code 6 (SC6) Measurement on Triangle Mountain in Colwood, British Columbia
8
Note: • Although time-averaging mode was used for the Narda 8718B and spatial-averaging mode for the
SRM-3000, the measurement procedure ensured that the two instruments measured the same quantity: the average RFF over an area about the size of a human over 60 seconds.
• When more than one measurement was taken at a same location, our “highest sample rule” was to
keep the highest measured value. This was the case of locations #2 and #7 when measuring with the Narda 8718B.
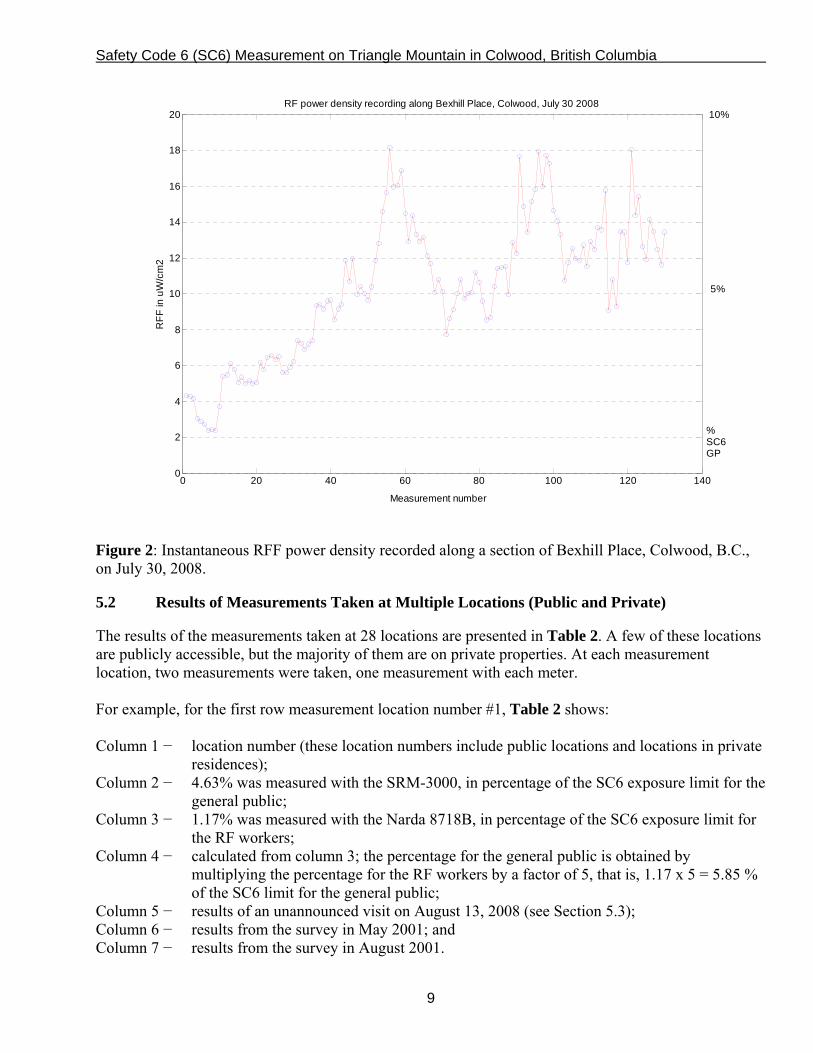
5. Measurement results 5.1 General scan along Bexhill Place (public street) For this measurement, the instantaneous RF field strengths were recorded in unit μW/cm2 (microwatts/square centimetre). To calculate the percentage with respect to the SC6 general public limit, the results are divided by 200 μW/cm2, which is the exposure limit in the FM broadcast frequency band of interest (SC6, Table 5). The results are plotted in Figure 2. The x-axis shows the count of data recorded; the left and right y-axis shows the power density in μW/cm2 and in percentage of SC6 for the general public respectively. The profile shows variations of the instantaneous RFF along Bexhill Place street. One observation is that the peaks were obtained when the measurement probe was in direct line of sight of the antennas (the clearance between two houses) and the valleys were obtained when the surveyor was in front of the houses. The average recorded was 5.2 % of the exposure limit of SC6 for the general public, and the maximum is measured as 9.1% of the exposure limit of SC6 for the general public.
Safety Code 6 (SC6) Measurement on Triangle Mountain in Colwood, British Columbia
9
0 20 40 60 80 100 120 1400
2
4
6
8
10
12
14
16
18
20
RFF
in u
W/c
m2
RF power density recording along Bexhill Place, Colwood, July 30 2008
Measurement number
%SC6GP
5%
10%
Figure 2: Instantaneous RFF power density recorded along a section of Bexhill Place, Colwood, B.C., on July 30, 2008. 5.2 Results of Measurements Taken at Multiple Locations (Public and Private) The results of the measurements taken at 28 locations are presented in Table 2. A few of these locations are publicly accessible, but the majority of them are on private properties. At each measurement location, two measurements were taken, one measurement with each meter. For example, for the first row measurement location number #1, Table 2 shows: Column 1 − location number (these location numbers include public locations and locations in private
residences); Column 2 − 4.63% was measured with the SRM-3000, in percentage of the SC6 exposure limit for the
general public; Column 3 − 1.17% was measured with the Narda 8718B, in percentage of the SC6 exposure limit for
the RF workers; Column 4 − calculated from column 3; the percentage for the general public is obtained by
multiplying the percentage for the RF workers by a factor of 5, that is, 1.17 x 5 = 5.85 % of the SC6 limit for the general public;
Column 5 − results of an unannounced visit on August 13, 2008 (see Section 5.3); Column 6 − results from the survey in May 2001; and Column 7 − results from the survey in August 2001.

Safety Code 6 (SC6) Measurement on Triangle Mountain in Colwood, British Columbia
10
Column 2
SRM-3000 Column 3 8718B
Column 4 8718B
Column 5 8718B
Column 6 8718
Column 7 8718
Location Number
% General Public Measured 2008-07-30
% RF Workers Measured 2008-07-30
% General Public Calculated 2008-07-30
% General Public Calculated 2008-08-13 REVISITED
% General Public Calculated 2001-05-10
% General Public Calculated 2001-08-27
# 1 4.63 1.17 5.85 7.215, 7.81 12.5 11.5
# 2 3.60 3.13 15.66 4.906, 5.375 12.5
# 3 5.63 1.37 6.84 8.935, 9.655 21.0 19.8
# 4 6.38 1.56 7.81 8.28, 6.50 17.5 15.2
# 5 N/A 3.36 16.78 8.75, 8.465 17.5 24.6
# 6 6.55 1.79 8.935 8.375, 8.53 15.0
# 7 5.36 2.44 12.22 9.78, 7.34 14.0
# 8 5.08 1.71 8.53 7.875, 7.25 17.5
# 9 2.30 0.90 4.50 4.531, 4.969 9.0
# 10 4.31 0.87 4.34 4.719, 4.688 9.5
# 11 N/A 1.41 7.06
# 12 5.26 1.07 5.34
# 13 14.22 2.97 14.84
# 14 18.10 3.36 16.78
# 15 0.79 0.28 1.39
# 16 4.22 1.13 5.66
# 17 2.97 0.66 3.28
# 18 5.58 1.58 7.91 11.5 10 # 19 0.93 0.26 1.31 # 20 2.73 0.70 3.50 7.06, 5.715 # 21 1.41 0.32 1.59 5.09, 1.781 # 22 0.92 0.36 1.78 # 23 1.18 0.38 1.88 1.719, 0.75 # 24 2.60 0.68 3.41 2.094, 2.719 # 25 1.70 0.36 1.81 3.125, 1.907
# … N/A Below Threshold
# 26 0.96 0.21 1.03 # 27 0.08 0.07 0.34 # 28 1.50 0.30 1.50 Table 2: Results of measurements on Triangle Mountain, Colwood, B.C., on July 30, 2008, and August 13, 2008; previous results are included for comparison.
Safety Code 6 (SC6) Measurement on Triangle Mountain in Colwood, British Columbia
11
5.3 Additional Measurement Data (Site Revisited on August 13, 2008) Contrary to the measurements taken on July 30, 2008, which were planned and announced to the public 10 days in advance, an unannounced visit was made to the Triangle Mountain site on August 13, 2008. The objective of this unannounced visit was to perform some additional measurements at a list of public locations to compare with previous measurements taken on July 30. Another objective of these measurements was to check the consistency of the RF environment. The Narda 8718B and probe C8722D were used for these measurements. The results of this visit are presented in column 5 of Table 2. 5.4 Other Measurements It was brought to Industry Canada’s attention that a few residents on Triangle Mountain have purchased a device called the Electrosmog meter − model TES-92 (ES) to take their own RFF measurements. To Industry Canada’s best knowledge, this device is not individually calibrated to a traceable standard, and the Department does not use it for compliance measurements. However, in order to compare its performance to a calibrated meter/probe set, Industry Canada’s Certification and Engineering Bureau tested the performance of a recently purchased ES against a calibrated Amplifier Research FP2000 / FM2000 electromagnetic field probe / meter (AR) in a controlled laboratory environment. These tests were conducted for the purpose of responding to concerns arising from measurements using the ES. See Section 6.3 for further information on the results of the laboratory testing of the units. 6. Analysis of the Results 6.1 Measurement Data In this survey, two different sets of instruments measured the RFF at each location. Each measured data was an average as described in the measurement procedure in section 4.2. The results, expressed in percentage of exposure limit for the general public, are presented in Table 2, column 2, for the SRM-300 and in column 4 for the 8718B. Columns 6 and 7 show results from the 2001 survey at some of the same locations. These observations can be made of these “raw” measurement data in Table 2: • measurements that resulted from two instruments (columns 2 and 4) agree within +/- 3dB, except for
locations #2 and #7 (see Annex E); • in general, readings from the SRM-3000 are lower than those from the 8718B; • at some locations, the measured RFF from the 2008 survey are one-half of the measured RFF from the
2001 survey; and • at location #14, both instruments recorded a maximum RFF. It was noted that locations #13 and #14 were on a balcony in direct line-of-sight with the antenna. Location #13 was a deck area with a table and chairs and location #14 was the walking corridor leading to location #13. This corridor is approximately 70-80 cm wide, and when measurement was made at location #14, the surveyor had a solid wall right at his back; this appeared to cause a reflection of the RFF. This location was suggested by the owner of the residence.

Safety Code 6 (SC6) Measurement on Triangle Mountain in Colwood, British Columbia
12
The measurement data from the unannounced visit on August 13, 2008 (column 5), were, in general, slightly lower than data obtained from the visit on July 30, 2008. Following our precautionary “highest sample rule,” in the subsequent analysis, we will consider the data set of July 30, 2008, because this data set has a higher maximum. Figure 3 plots the highest measured RFF level (from two instruments) on July 30, 2008, at each of the 28 locations.
0 5 10 15 20 25 300
2
4
6
8
10
12
14
16
18
20
% o
f SC
6 fo
r Gen
eral
Pub
lic
Measurement Location Number
Maximum RF exposure measured
Figure 3: Maximum measured data for the 28 locations on Triangle Mountain in Colwood, B.C., during the survey on July 30, 2008. The results of the measured data showed that: • 23 measurements are less than 9% of the SC 6 exposure limit for the general public, which represents
82% of the locations; • all measured locations, except for location #14, are less than 17% of the SC6 exposure limit for the
general public; and • the maximum RFF exposure measurement of 18.10% was found at location #14 due to the reflection
effect at this particular location.

Safety Code 6 (SC6) Measurement on Triangle Mountain in Colwood, British Columbia
13
6.2 Measurement Data Analysis and Uncertainty In assessing compliance, Industry Canada takes into account the measurement uncertainty, although it is not specified in SC6, and is not required by Health Canada.1 Every measurement is subject to uncertainties. There are two types of uncertainty, identified as “instrument-inherent uncertainty” and “sampling uncertainty”. The combined impact is called “extended uncertainty” (see Section 9, Related documents, and Annex D for more details). The first one, inherent to the equipment set-up, is described in the equipment’s specifications data sheet. This data, which is based on the worst case scenario, includes: • the calibration uncertainty for the basic unit, antenna and cable; • any impedance mismatches in the connections; and • the anisotropy/ellipticity (uniformity in response in the axes of the measuring antenna/probe) of the
measuring antenna. “Sampling uncertainty” represents the uncertainty in measurement samples that may be caused by the person taking the measurements. The extended measurement uncertainties for the SRM-3000 and Narda 8718B are +3.84 / -4.46 dB and +3.60/-3.60 dB respectively (see Annex F). The following table (Table 3) shows an example of the possible upper and lower range limits of the “raw” reading data (from Table 2, location #1) using the SRM-3000. The measured field strength is 4.63% of the SC6 limit for the general public. Although the actual field strength may be between 1.66% and 11.2%, the most probable field strength is 4.63%. Lower Limit
% SC6 GP Reading % SC6 GP
Upper Limit % SC6 GP
SRM-3000 1.66 4.63 11.20 Narda 8718B 2.55 5.85 13.40 Table 3: Example of the possible upper and lower range limits of the “raw” reading data (from Table 2, location #1) using the SRM-3000. The following figures show the upper and lower limits for each measurement made in the survey of July 30, 2008.
___________________________________ 1 According to Health Canada, “While the utmost efforts should be made to make the most accurate measurements feasible
under given circumstances, Health Canada considers it adequate to accept the indicated value of the instrument as the measurement result, provided the instrument is properly calibrated and the measurement is conducted using standards acceptable to Industry Canada. We would, however, like to point out that giving an overestimate of field strength measurements is a prudent approach in risk assessments. This means that your field measurement staff may take into account measurement uncertainties when feasible.”
Safety Code 6 (SC6) Measurement on Triangle Mountain in Colwood, British Columbia
14
0 5 10 15 20 25 300
5
10
15
20
25
30
35
40
45
% o
f SC
6 fo
r Gen
eral
Pub
lic
Measurement Location Number
SRM-3000: Measurement results with extended uncertainty
SRM Aver + 3.84dBSRM AverageSRM Aver - 4.46dB
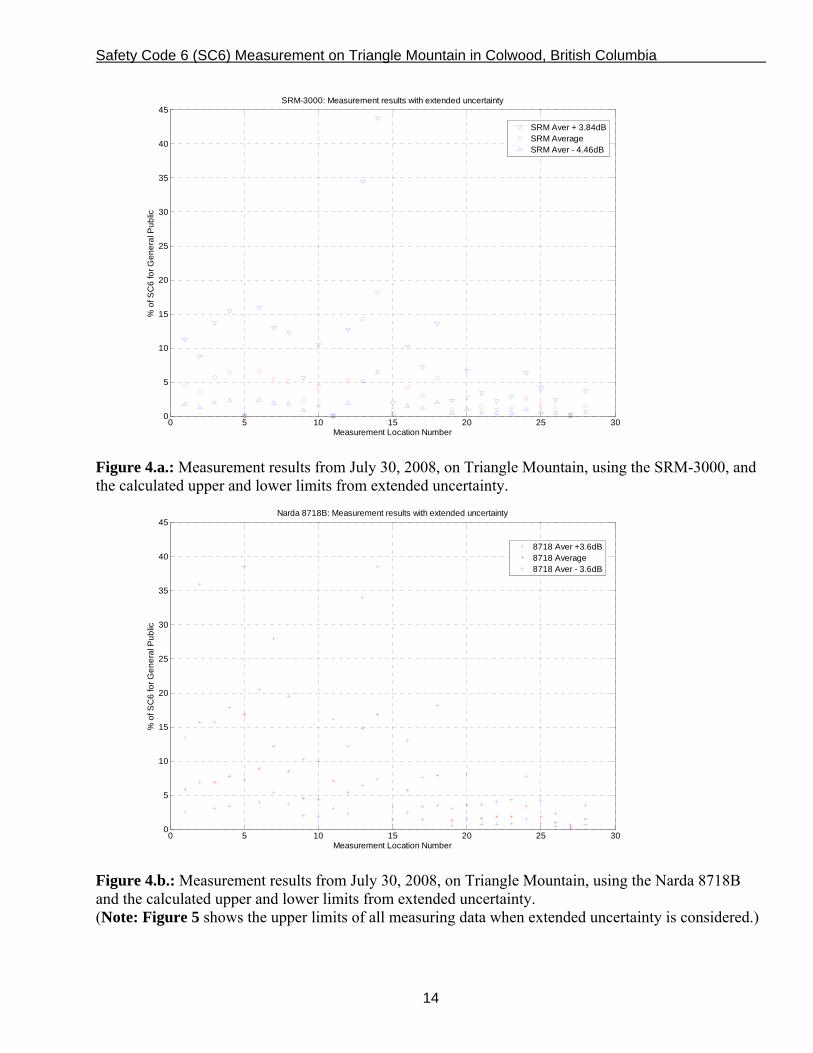
Figure 4.a.: Measurement results from July 30, 2008, on Triangle Mountain, using the SRM-3000, and the calculated upper and lower limits from extended uncertainty.
0 5 10 15 20 25 300
5
10
15
20
25
30
35
40
45
% o
f SC
6 fo
r Gen
eral
Pub
lic
Measurement Location Number
Narda 8718B: Measurement results with extended uncertainty
8718 Aver +3.6dB8718 Average8718 Aver - 3.6dB
Figure 4.b.: Measurement results from July 30, 2008, on Triangle Mountain, using the Narda 8718B and the calculated upper and lower limits from extended uncertainty. (Note: Figure 5 shows the upper limits of all measuring data when extended uncertainty is considered.)

Safety Code 6 (SC6) Measurement on Triangle Mountain in Colwood, British Columbia
15
0 5 10 15 20 25 300
5
10
15
20
25
30
35
40
45
% o
f SC
6 fo
r Gen
eral
Pub
lic
Measurement Location Number
Maximum RF exposure with extended uncertainty
Figure 5: Calculated upper limit of the RF exposure (with extended uncertainty) at all measurement locations in the July 30, 2008 survey on Triangle Mountain, Colwood, B.C. See Annex E for a comparison of the measured values obtained from the SRM-3000 and 8718B meters in the context of sampling uncertainty. Annex F shows an analysis of the results from the survey on July 30, 2008, including the extended measurement uncertainty. Annex G compares the results obtained in 2008 with the results obtained in 2001. 6.3 Other Measurement Results In the comparison measurements of the uncalibrated ES and the calibrated AR sensor, it was found that in 108 of the 250 measurements (or 43.2% of the cases) taken in the laboratory, the upper and lower limits of the ES measured values (as calculated with the published measurement uncertainty) are outside of the upper and lower limits of the measured values of the calibrated sensor (AR). More importantly, it was found that when the electric field is parallel to the axis of the measuring probe, the ES consistently reads much higher than the AR. The highest discrepancy found was that the ES read 216.5 V/m whereas the AR read 60 V/m. In other words, for that particular measurement, the ES reading was 360.83% of the AR reading, or 11.15 dB higher. Based these results, Industry Canada would not rely upon the tested ES unit for RFF measurements for SC6 compliance.
Safety Code 6 (SC6) Measurement on Triangle Mountain in Colwood, British Columbia
16
7. Summary The results of the measured data presented in Section 5 show that: • all 130 measurements recorded in the continuous scan along Bexhill Place street are less than 10% of
the SC6 exposure limit for the general public; • measurements are less than 9% of the SC6 exposure limit for the general public at 82% of the
locations; • all measured locations, except for location #14, are less than 17% of the SC6 exposure limit for the
general public; and • the maximum RFF exposure measurement of 18.10% was found at location #14 due to the reflection
effect at this particular location. The RF field strengths measured in this survey, taking into account measurement uncertainties, are all less than the exposure limit of SC6 for the general public. 8. Conclusion The antenna site at Triangle Mountain, Colwood, British Columbia, is in compliance with Safety Code 6. 9. Related documents 1. Narda Application Note “Accounting for measurement uncertainty in the SRM-3000” http://www.narda.de/pdf/fachartikel/AN_HF_1004_E_Messunsicherheit_2007_07_04.pdf 2. Heath Canada Safety Code 6 http://www.hc-sc.gc.ca/ewh-semt/pubs/radiation/99ehd-dhm237/index-eng.php

Safety Code 6 (SC6) Measurement on Triangle Mountain in Colwood, British Columbia
17
Annex A - Operating Parameters of the Three FM Stations and Results of Two Inspection Reports
The authorized operating parameters of the three FM stations on Triangle Mountain, Colwood, British Columbia, are as follows: Call sign Authorized Parameters
CIOC-FM (guyed)
CHTT-FM (guyed)
CHBE-FM
Channel/Frequency 253/98.5 MHz 276/103.1 MHz 297/107.3 MHz Effective Radiated Power Peak (W)
100,000
20,000
20,000
Tower height (AGL) m 70 70 58 Centre of antenna m 52.5 52.5 53.3 Results from Industry Canada’s inspection report on the three FM stations on Triangle Mountain on July 30, 2008. CIOC-FM
98.5 MHz CHTT-FM 103.1 MHz
CHBE-FM 107.3 MHz
Inspected Transmitted Power (W) System Efficiency Antenna Gain Effective Radiated Power (W)
17,000 0.838 6.37 90,747
2,850 0.891 6.471 16,430
8,300 0.944 2.57 20,136
Comments Ok As authorized
Ok As authorized
Ok As authorized
Results from the inspection report on the three FM stations on Triangle Mountain on August 9, 2001.
CIOC-FM 98.5 MHz
CHTT-FM 103.1 MHz
CFEX-FM 107.3 MHz Now CHBE-FM
Effective Radiated Power (W)
85,400
16,700
20,000

Safety Code 6 (SC6) Measurement on Triangle Mountain in Colwood, British Columbia
18
Annex B - The Measurement Equipment The 8718B meter, shown in Figure B-1, possesses these main features: • probe C8722D is shaped according to Canadian Safety Code 6 (SC6) Standard; • meter capable of time averaged measurement; • full range scale 300% for RF workers; • triaxial E field type probe; and • meter displays instantaneous and “maximum hold” values. This meter with the probe C8722D was set to measure and display the percentage of SC6 exposure limit for RF workers; the results displayed accounted for the total of all RFF contributions of all sources detected by the probe.
Figure B-1: Narda Electromagnetic Survey Meter 8718B with probe C8722D The second set of equipment, shown in Figure B-2, is the SRM-3000 with an isotropic antenna (or three-axis antenna) for electric field, which: • integrates two modes of operation: Safety Evaluation and Spectrum Analyzer; • provides the results in percentage of the SC6 exposure limit for the general public, for the RF workers
or in many others units (V/m, W/m2…); • gives the total RFF exposure of all sources detected by the probe; and • computes automatically the contribution of individual services to overall field exposure. This meter was set up to measure and display the percentage of exposure limit with respect to SC6 for the general public.
Safety Code 6 (SC6) Measurement on Triangle Mountain in Colwood, British Columbia
19
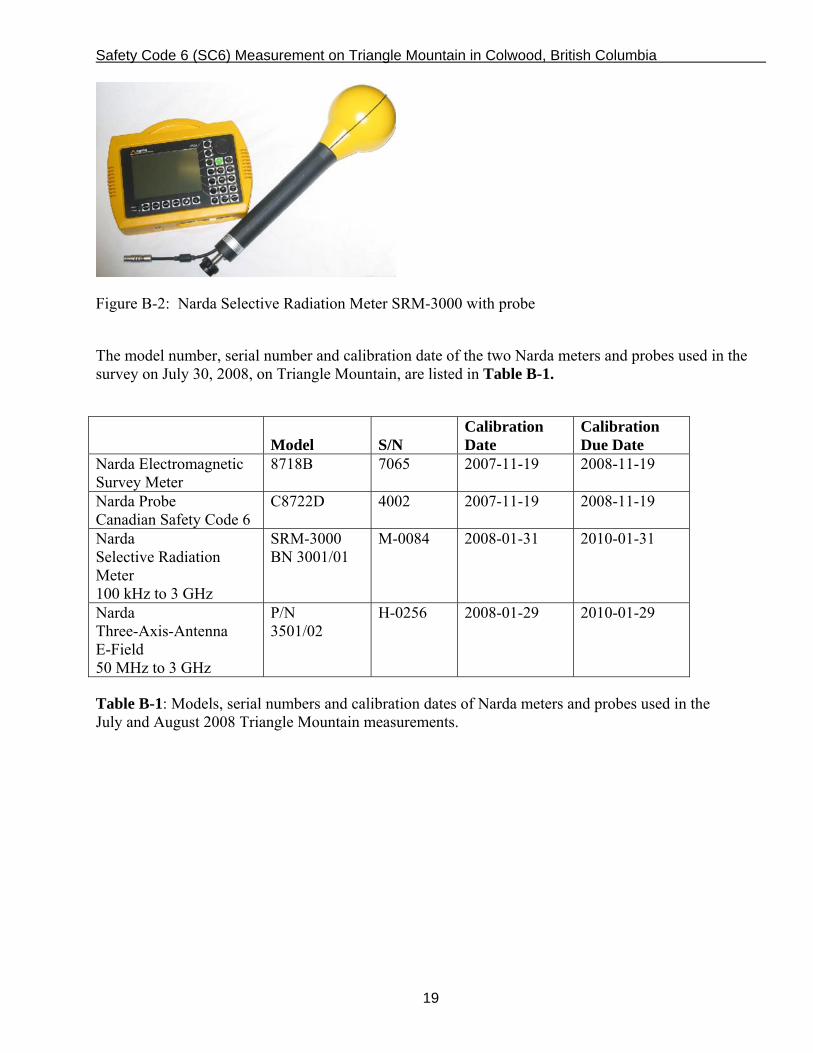
Figure B-2: Narda Selective Radiation Meter SRM-3000 with probe The model number, serial number and calibration date of the two Narda meters and probes used in the survey on July 30, 2008, on Triangle Mountain, are listed in Table B-1.
Model S/N
Calibration Date
Calibration Due Date
Narda Electromagnetic Survey Meter
8718B 7065 2007-11-19 2008-11-19
Narda Probe Canadian Safety Code 6
C8722D 4002 2007-11-19 2008-11-19
Narda Selective Radiation Meter 100 kHz to 3 GHz
SRM-3000 BN 3001/01
M-0084 2008-01-31 2010-01-31
Narda Three-Axis-Antenna E-Field 50 MHz to 3 GHz
P/N 3501/02
H-0256 2008-01-29 2010-01-29
Table B-1: Models, serial numbers and calibration dates of Narda meters and probes used in the July and August 2008 Triangle Mountain measurements.
Safety Code 6 (SC6) Measurement on Triangle Mountain in Colwood, British Columbia
20
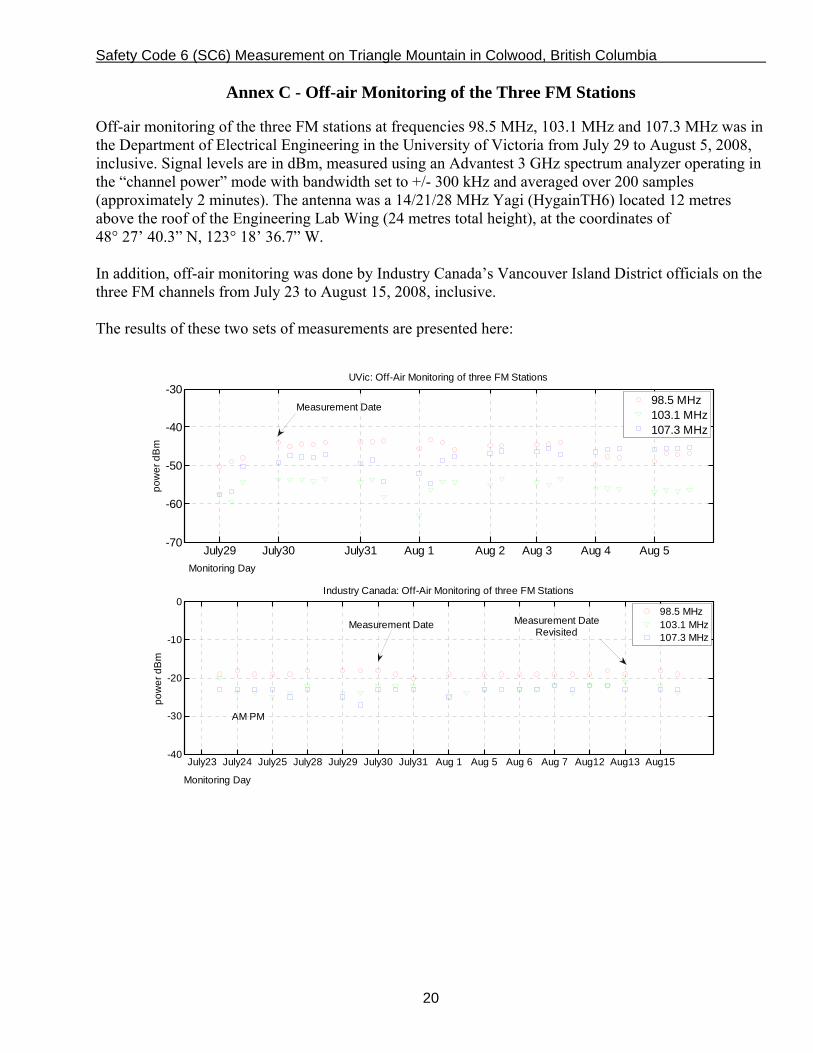
Annex C - Off-air Monitoring of the Three FM Stations Off-air monitoring of the three FM stations at frequencies 98.5 MHz, 103.1 MHz and 107.3 MHz was in the Department of Electrical Engineering in the University of Victoria from July 29 to August 5, 2008, inclusive. Signal levels are in dBm, measured using an Advantest 3 GHz spectrum analyzer operating in the “channel power” mode with bandwidth set to +/- 300 kHz and averaged over 200 samples (approximately 2 minutes). The antenna was a 14/21/28 MHz Yagi (HygainTH6) located 12 metres above the roof of the Engineering Lab Wing (24 metres total height), at the coordinates of 48° 27’ 40.3” N, 123° 18’ 36.7” W. In addition, off-air monitoring was done by Industry Canada’s Vancouver Island District officials on the three FM channels from July 23 to August 15, 2008, inclusive. The results of these two sets of measurements are presented here:
July29 July30 July31 Aug 1 Aug 2 Aug 3 Aug 4 Aug 5-70
-60
-50
-40
-30
Monitoring Day
pow
er d
Bm
UVic: Off-Air Monitoring of three FM Stations
July23 July24 July25 July28 July29 July30 July31 Aug 1 Aug 5 Aug 6 Aug 7 Aug12 Aug13 Aug15-40
-30
-20
-10
0
Monitoring Day
pow
er d
Bm
Industry Canada: Off-Air Monitoring of three FM Stations
98.5 MHz103.1 MHz107.3 MHz
98.5 MHz103.1 MHz107.3 MHz
Measurement Date
AM PM
Measurement Date Measurement DateRevisited
Safety Code 6 (SC6) Measurement on Triangle Mountain in Colwood, British Columbia
21
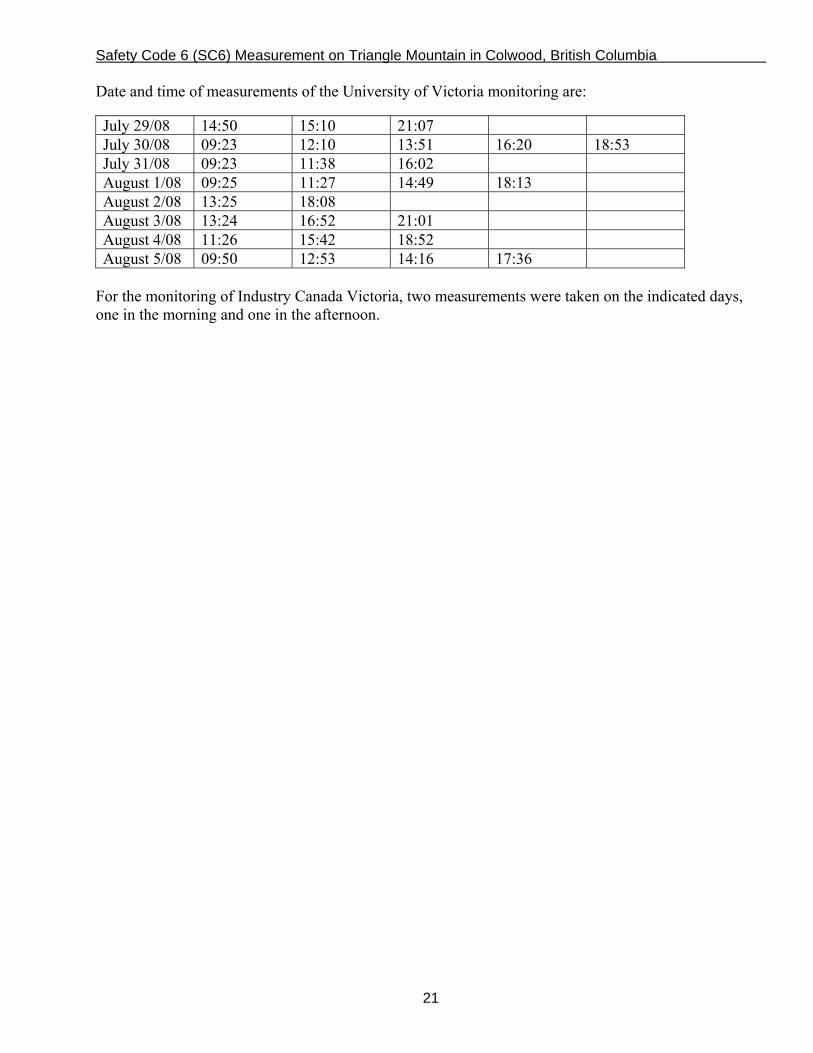
Date and time of measurements of the University of Victoria monitoring are: July 29/08 14:50 15:10 21:07 July 30/08 09:23 12:10 13:51 16:20 18:53 July 31/08 09:23 11:38 16:02 August 1/08 09:25 11:27 14:49 18:13 August 2/08 13:25 18:08 August 3/08 13:24 16:52 21:01 August 4/08 11:26 15:42 18:52 August 5/08 09:50 12:53 14:16 17:36
For the monitoring of Industry Canada Victoria, two measurements were taken on the indicated days, one in the morning and one in the afternoon.
Safety Code 6 (SC6) Measurement on Triangle Mountain in Colwood, British Columbia
22
Annex D - Measurement Uncertainty The following is an excerpt from the Narda Application Note “Application Accounting for Measurement Uncertainty in the SRM-3000.” Every measurement is subject to uncertainties. Any measurement report can only be considered to be complete when it includes the measurement uncertainties as well as the measurement results. Every factor that may influence the measurement result must be taken into account. The uncertainty associated with each of these factors also needs to be estimated. Generally, there are two possible sources of uncertainty or error: the measuring equipment and the person operating it. • The measurement uncertainty inherent in the measuring equipment setup can be determined from the
calibration certificates and the specifications quoted by the manufacturer. Narda quotes the full values for the SRM-3000 in the data sheet for the instrument.
• An empirical value can be used to represent the uncertainty in measurement samples that may be
caused by the person doing the measuring. The specified values: • include the calibration uncertainty for the basic unit, antenna and cable; • take any mismatches in the connections between the antenna and cable and the cable and basic unit
into account; • also include the anisotropy/ellipticity of the measuring antenna; • are referred to the standard measurement uncertainty by kq = 2. • The calculation is based on the worst case scenario. • The difference in measurement uncertainty when a 5 m RF cable is used instead of 1.5 m is negligible. Example: Measurement of radiation exposure levels due to mobile telephones; source frequency 2.1 GHz (UMTS); single-axis measurement. Extended measurement uncertainty from data sheet: +1.8 / -2.2 dB Sampling uncertainty, estimated: +/-3 dB The extended uncertainty in the measurement result is given by summing the squares: +3.5 / -3.7 dB To be certain that the radiation exposure level is below the limit value, 3.5 dB must be added to the measurement result. On the other hand, to be certain that the radiation exposure level exceeds the limit value, 3.7 dB must be subtracted from the measurement result. The complete document can be found at http://www.narda.de/pdf/fachartikel/AN_HF_1004_E_Messunsicherheit_2007_07_04.pdf.
Safety Code 6 (SC6) Measurement on Triangle Mountain in Colwood, British Columbia
23
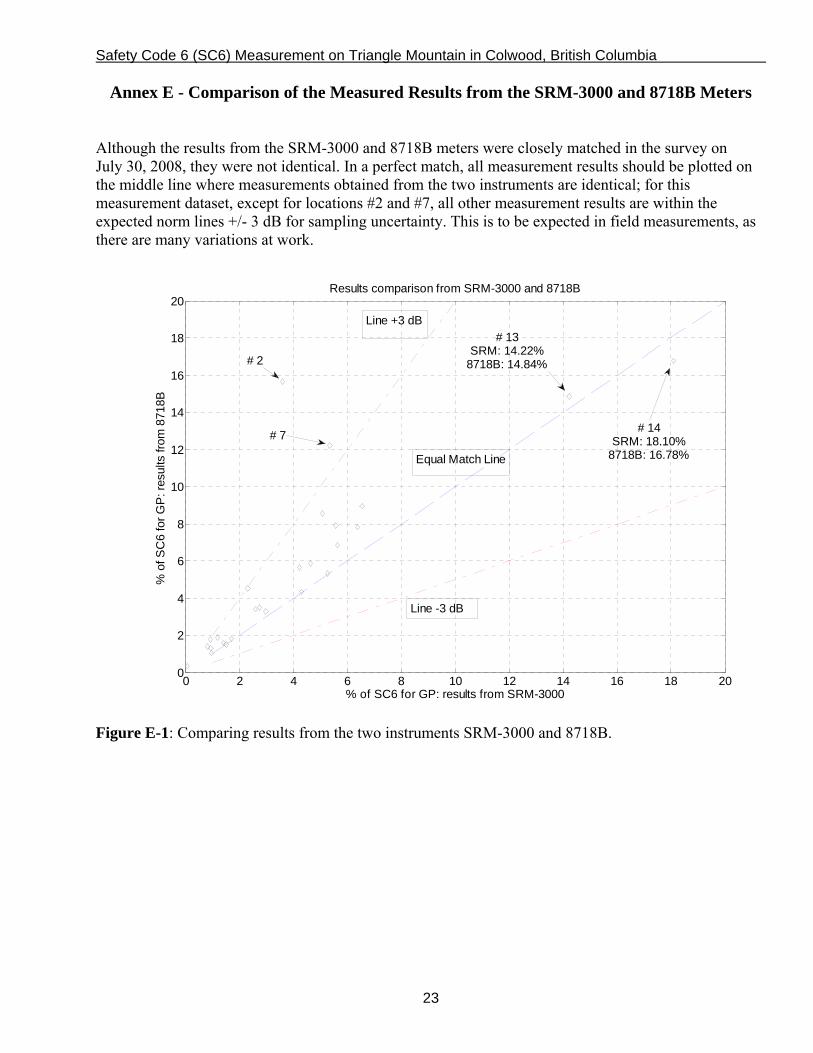
Annex E - Comparison of the Measured Results from the SRM-3000 and 8718B Meters Although the results from the SRM-3000 and 8718B meters were closely matched in the survey on July 30, 2008, they were not identical. In a perfect match, all measurement results should be plotted on the middle line where measurements obtained from the two instruments are identical; for this measurement dataset, except for locations #2 and #7, all other measurement results are within the expected norm lines +/- 3 dB for sampling uncertainty. This is to be expected in field measurements, as there are many variations at work.
0 2 4 6 8 10 12 14 16 18 200
2
4
6
8
10
12
14
16
18
20
% of SC6 for GP: results from SRM-3000
% o
f SC
6 fo
r GP
: res
ults
from
871
8B
Results comparison from SRM-3000 and 8718B
Line -3 dB
Line +3 dB
Equal Match Line
# 2
# 7
# 13SRM: 14.22%
8718B: 14.84%
# 14SRM: 18.10%
8718B: 16.78%
Figure E-1: Comparing results from the two instruments SRM-3000 and 8718B.

Safety Code 6 (SC6) Measurement on Triangle Mountain in Colwood, British Columbia
24
Annex F - Analysis of Measured Results from the SRM-3000 and 8718B Meters with Extended Uncertainty
Referring again to the Narda Application Note reproduced in Annex D, the extended uncertainty takes into account the two uncertainties combined (instrument-inherent uncertainty and sampling uncertainty). Instrument-inherent uncertainty: from the data sheet of the SRM-3000, the measurement uncertainty is +2.4 / -3.3 dB for the frequency range 75-900 MHz (our frequency of interest is around 100 MHz). For the Narda 8718B, the measurement uncertainty is +2 / -2 dB. Sampling uncertainty: According to the same Narda application note cited in the reference, the measurement sampling uncertainty, caused by the person doing the measuring, is estimated to be equal to +3 / -3 dB. The extended uncertainty for each instrument is calculated as follows: SRM-3000: +√ (2.42 + 32) = +3.84 -√ (3.32 + 32) = -4.46 Narda 8718B: ±√ (22 + 32) = ±3.60 The extended measurement uncertainties for the SRM-3000 and Narda 8718B are +3.84 / -4.46 dB and +3.60/-3.60 dB respectively. To see the impact of applying measurement uncertainty to raw measurement data, consider, for example, location measurement #1: the reading of the SRM-3000 is 4.63 % for the general public; the readings of the 8718B is 1.17% for the RF workers, or multiply by 5, i.e., 1.17 x 5 = 5.85% for the general public. For the SRM-3000, accounting for an extended measurement uncertainty of +3.84 / -4.46 dB means that the average reading 4.63% can be as high as +3.84 dB above this value (4.63) or can be as low as -4.46 dB below this value (4.63). Converting from logarithmic scale to linear scale, we have antilog(3.84/10) = 2.42 and antilog(4.46/10) = 2.79. Therefore, in the linear scale, the reading 4.63%, when considered with the extended uncertainly, can be as high as 4.63 x 2.42 = 11.20 and as low as 4.63/2.79 = 1.66. For the Narda 8718B, the uncertainty measurement is equal to +3.6 / -3.6 dB. Repeating the same calculation as above with + 3.6 / - 3.6 dB, we have antilog(3.6/10) = 2.29; that is, the average reading 5.85% can be as high as 5.85 x 2.29 = 13.40 and as low as 5.85/2.29 = 2.55.

Safety Code 6 (SC6) Measurement on Triangle Mountain in Colwood, British Columbia
25
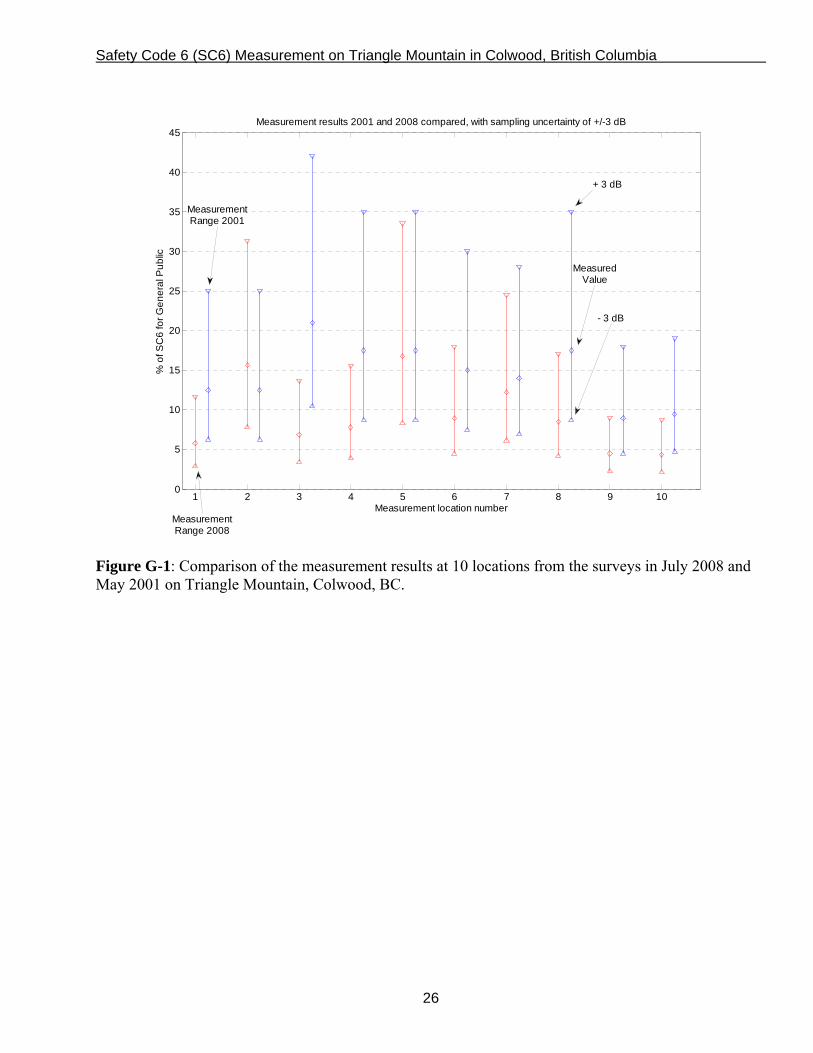
Annex G - Analysis of Measured Results from 2001 and 2008 At 10 public accessible locations where measurements were made in 2001, the survey team repeated measurements in July 2008, and then again in August 2008. The two measurements taken seven years apart could not be exactly the same due to factors including: slight variation in location in spite of the best effort by the surveyor, position of surveyor, how the probe is handled by the surveyor, the direction the probe is pointed to, weather conditions, changes in local environment such as new residential development, tree growth etc. As stated in section 6.2, this measurement “sampling uncertainty” is estimated to be equal to +3 / -3 dB. Consulting with the engineer from Narda, we were advised that a difference of 3 dB between 2 sets of measurements in 2001 and 2008 is expected and is not a concern. Considering the variations of the above factors, two measurements repeated at a different time/space cannot be the same. With sampling uncertainty of +/- 3 dB taken into account, Figure G-1 shows the expected ranges for each measurement of the two datasets, one in 2008 and one in 2001. For each measurement location, the two vertical bars indicate the measurement ranges corresponding to surveys 2008 and 2001. Each vertical bar is shown with the measured value, and the range of dots from an upper limit of +3 dB to a lower limit of -3 dB (from the measured value), to account for the sampling uncertainty +/- 3dB. For each measurement location, the two range values from surveys 2008 and 2001 always intersect with each other. This indicates the validity of these two measurements under the defined uncertainty.
Safety Code 6 (SC6) Measurement on Triangle Mountain in Colwood, British Columbia
26
1 2 3 4 5 6 7 8 9 100
5
10
15
20
25
30
35
40
45
% o
f SC
6 fo
r Gen
eral
Pub
lic
Measurement location number
Measurement results 2001 and 2008 compared, with sampling uncertainty of +/-3 dB
MeasurementRange 2008
MeasurementRange 2001
+ 3 dB
- 3 dB
MeasuredValue
Figure G-1: Comparison of the measurement results at 10 locations from the surveys in July 2008 and May 2001 on Triangle Mountain, Colwood, BC.