report on traffic safety in the denver region - drcog draft... · total crashes and crash rate in...
TRANSCRIPT
Draft for discussion
Denver Regional Council of Governments
Report on Traffic Crashes in the Denver Region
REVIEW DRAFT
October 2016

Draft for discussion
1290 Broadway Denver, CO 80203
www.drcog.org

Draft for discussion
Table of Contents
1. Introduction ....................................................................................................................... 1 A. Background and Purpose ............................................................................................ 1
B. Notes on Crash Data ................................................................................................... 1
2. Denver Region Crash Data ............................................................................................... 2 A. Traffic Fatality Trends .................................................................................................. 2
B. Serious Injury Trends................................................................................................... 5
C. Total Traffic Crash Trends ........................................................................................... 5
3. Demographics of Persons Involved in Crashes ............................................................. 7
4. Crash Characteristics ....................................................................................................... 9 A. Crash Types ................................................................................................................ 9
B. Crash Conditions ......................................................................................................... 9
C. Crash Causes .............................................................................................................10
5. Specific Crash Types .......................................................................................................11 A. Truck-related Crashes ................................................................................................11
B. Motorcycle-related Crashes ........................................................................................15
C. Pedestrian-related Crashes ........................................................................................18
D. Bicycle-related Crashes ..............................................................................................23
E. Construction Zone Crashes ........................................................................................28
F. Wildlife-related Collisions ............................................................................................30
6. High-Risk Behavior Crashes ...........................................................................................33 A. Impaired Driving .........................................................................................................33
B. Speeding ....................................................................................................................37
C. Red Light Running ......................................................................................................40
7. Identification of High Crash Locations ...........................................................................42 A. Freeway Segment Crashes ........................................................................................42
8. Other Safety Efforts .........................................................................................................44 A. Engineering Safer Roadways .....................................................................................44
B. Emergency Response and Crash Clearance ..............................................................44
9. Summary of Findings ......................................................................................................46
Draft for discussion
List of Tables
Table 1. Crash Types (2011-2013) ........................................................................................................... 9
Table 2. Prevailing Conditions at Time of Crash (2011-2013) .................................................................. 9
Table 3. Causes of Traffic Crashes by Driver Action (2011-2013) ......................................................... 10
Table 4. Traffic Crashes Involving Other Human Factors (2011-2013) .................................................. 10
Table 5. Truck Crash Characteristics (2011-2013) ................................................................................. 12
Table 6. Motorcycle Fatality Rate in the Denver Region (2010-2014) .................................................... 15
Table 7. Age of Pedestrians in Traffic Crashes (2011-2013) .................................................................. 19
Table 8. Pedestrian Crash Characteristics (2011-2013) ......................................................................... 20
Table 9. Age of Bicyclists in Traffic Crashes (2011-2013) ...................................................................... 24
Table 10. Bicycle Crash Characteristics (2011-2013) ............................................................................... 25
Table 11. Impaired Driving Crashes by Time of Day (2011-2013) ........................................................... 34
Table 12. Level of Service of Safety on DRCOG Freeway Segments ...................................................... 43
List of Figures
Figure 1. Annual Traffic Fatalities and Fatal Crash Rate in the Denver Region (1980-2015) ................... 2
Figure 2. Fatal Crash Events (2013) .......................................................................................................... 4
Figure 3. Serious Injuries and Injury Crash Rate in the Denver Region (2006-2013) ............................... 5
Figure 4. Total Crashes and Crash Rate in the Denver Region (1991-2013) ............................................ 6
Figure 5. Involvement in Fatal and Serious Injury Crashes by Age and Gender (2011-2013) .................. 7
Figure 6. Colorado Fatal Truck Crashes by Truck Type (2012-2014) ..................................................... 11
Figure 7. Crash Events Involving Trucks (2013) ...................................................................................... 14
Figure 8. Motorcycle Fatalities in the Denver Region (2000-2015) .......................................................... 15
Figure 9. Crash Events Involving Motorcycles (2013) .............................................................................. 17
Figure 10. Pedestrian Fatalities in the Denver Region (2000-2015) .......................................................... 18
Figure 11. Crash Events Involving Pedestrians (2013) .............................................................................. 21
Figure 12. Bicyclist Fatalities in the Denver Region (2000-2015) .............................................................. 23
Figure 13. Crash Events Involving Bicyclists (2013) .................................................................................. 27
Figure 14. Construction Zone Crashes in the Denver Region (1991-2013) ............................................... 28
Figure 15. Wildlife-Vehicle Collisions in the Denver Region (1991-2013) ................................................. 30
Figure 16. Crash Events Involving Wildlife (2013) ..................................................................................... 32
Figure 17. Impaired Driving Fatalities in the Denver Region (2004-2013) ................................................. 33
Figure 18. Impaired Drivers by Age Group Resulting in Fatality (2011-2013) ........................................... 34
Figure 19. Crash Events Involving Impaired Driving (2013) ....................................................................... 35
Figure 20. Age of Driver in Speeding-related Fatality (2011-2013) ........................................................... 37
Figure 21. Speeding-related Fatalities by Facility Type (2011-2013) ........................................................ 38
Figure 22. Crash Events Involving Speeding (2013) ................................................................................. 39
Figure 23. Crash Events Involving Red-Light Running (2013) ................................................................... 41
Figure 24. Safety Performance Function-Urban 6-Lane Freeways ........................................................... 42
Figure 25. Freeway Segment Level of Service of Safety (2010-2014) ...................................................... 43

Draft for discussion
1
1. INTRODUCTION
A. Background and Purpose
Traffic crashes represent a major safety concern. In 2015, over 38,000 people died on our
nation’s roadways. Every day in the Denver region, there are about 220 reported traffic
crashes. Tragically, the crashes result in about five seriously injured persons per day and four
traffic fatalities per week. These crashes incur large costs including property damage, medical
expenses, lost productivity, excess traffic congestion, and the pain and suffering associated
with an injury or fatal crash.
The purpose of this report is to raise awareness of traffic safety issues within the Denver region
using crash-related data. The data will assist DRCOG in developing long range goals and
targets. Extensive information is provided on many different types of crashes, causes, and
characteristics. Techniques to help reduce crashes are also presented in applicable sections.
This report is divided into the following seven sections:
Regional traffic crash trends
Crash demographics
Crash characteristics (e.g., crash causes and time of day)
Specific crash types (e.g., bicycle and pedestrian crashes)
High-risk behavior crashes
Locations of crashes
Other safety efforts
B. Notes on Crash Data
Crash data is not perfect, as field reports may not contain complete information. The majority
of the detailed crash data used in this report reflects the latest data available (through 2013)
from the Colorado Department of Transportation (CDOT)1. Fatal crash data is presented
through 2015 as it must be immediately reported to the National Highway Traffic Safety
Administration (NHTSA)2. NHTSA then presents data annually through the Fatality Analysis
Reporting System (FARS)3.
1 https://www.codot.gov/ 2 http://www.nhtsa.gov/. 3 http://www.nhtsa.gov/FARS

Draft for discussion
2
2. DENVER REGION CRASH DATA
A. Traffic Fatality Trends
The number of annual traffic fatalities in the Denver region reached a three-decade low in 2009.
Between 2001 and 2009, the number of traffic fatalities decreased by 44 percent (285 to 160).
Since 2009, however, annual fatalities have increased 49 percent (160 to 238 in 2015).
Another way of presenting crash information is by the “rate” per amount of miles that vehicles
are driven. The amount of driving is usually defined as “vehicle miles of travel” or VMT. For
example, on Denver regional roadways in 2015:
Motor vehicles were driven over 25 billion VMT (78 million per weekday).
Dividing the 185 fatalities into 25 billion results in a rate of 0.79 fatalities per
100 million VMT.
The chart below shows the number of traffic fatalities rate per 100 million VMT from 1980 to
2015. The fatality rate has decreased from 2.75 to 0.91 over the last 35 years, though there
has been a slight increase since 2009.
Figure 1. Annual Traffic Fatalities and Fatal Crash Rate in the Denver Region (1980-2015)
0.00
0.50
1.00
1.50
2.00
2.50
3.00
0
50
100
150
200
250
300
1980 1985 1990 1995 2000 2005 2010 2015
Fatalities Fatalities per 100 million VMT
Draft for discussion
3
Regardless of what the data says, one traffic fatality is one too many, even if a fatality occurs
“only” once every 125 million vehicle miles traveled. A new initiative, known as Towards Zero
Deaths, was established by the United States
Department of Transportation (USDOT)4) in
2014. The initiative has been embraced by the
Colorado Department of Transportation (CDOT)
and will be incorporated into DRCOG’s Metro
Vision Regional Transportation Plan5.
A third way of presenting traffic fatality data is in a public health perspective. For the Denver
region, in 2015 there were 6.8 fatalities per 100,000 persons in the Denver region. The
seriousness of the traffic safety issue can be portrayed comparably to other public health issues.
Several factors have contributed to the reduction of the traffic fatality rate over the past 35
years. Improvements in vehicle safety design (e.g., increased prevalence of front and side
airbags) and phasing out older vehicles from the motor vehicle fleet have played a critical role,
as has increased seat belt use. According to CDOT, overall seat belt use in Colorado rose from
50 percent in 1990 to 82 percent in 2014. Education and enforcement efforts have drastically
reduced the occurrence of impaired driving fatal crashes. In the Denver region, impaired-
driving fatalities dropped by 62 percent between 2004 and 2013 (from 111 to 42 fatalities).
Improvements in emergency response and medical care technology have also helped to
reduce traffic fatalities, as well as better designed roadways and safety features.
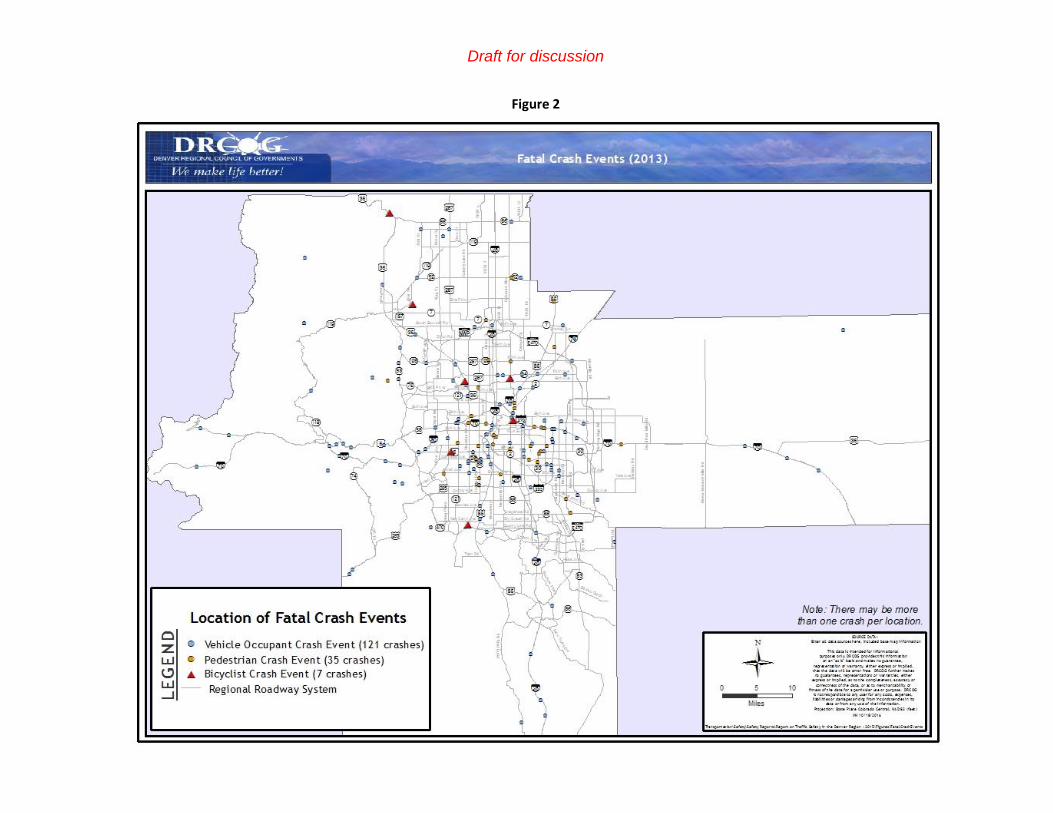
Figure 2 shows a map of fatal crash locations in 2013. Traffic fatalities occur throughout the
region and occur on all roadway facility types. In 2013, 26 percent of fatal crashes occurred on
freeway facilities and 74 percent along streets or at intersections. Upcoming sections of this
report will go into further detail on certain types of fatal crashes, such as those associated with
pedestrians, bicyclists, motorcyclists, trucks, and construction zones.
4 https://www.transportation.gov/ 5 https://drcog.org/programs/transportation-planning/regional-transportation-plan
Draft for discussion
4
Figure 2
Figure 2. Fatal Crash Events (2013)

Draft for discussion
5
B. Serious Injury Trends
The number of people seriously injured in traffic crashes has fluctuated, ranging between 1,600
and 1,940 injuries per year between 2006 and 2013. The rate of injuries was dropping through
2010, but has since been on the rise.
Figure 3. Serious Injuries and Injury Crash Rate in the Denver Region (2006-2013)
C. Total Traffic Crash Trends
The number of reported crashes in the region increased from about 50,000 in 1991 to about
70,000 crashes in 2005. The increase was likely due primarily to the rapid growth in VMT. The
number of reported crashes decreased to approximately 60,000 by 2012, but increased to
approximately 64,000 in 2013. Specific reasons for the fluctuation is not easy to define. As
shown in the chart below, the crash rate per 100 million VMT increased just slightly from 1991 to
2001, but has declined since. The overall crash data shown in this report does not include
unreported traffic crashes. The National Highway Traffic Safety Administration (NHTSA)
estimates that about half of all crashes are reported to the police.
5.00
5.50
6.00
6.50
7.00
0
500
1,000
1,500
2,000
2,500
2006 2007 2008 2009 2010 2011 2012 2013
Serious Injuries Serious Injury Crashes per 100 million VMT

Draft for discussion
6
Figure 4. Total Crashes and Crash Rate in the Denver Region (1991-2013)
The crash data shown in this report does not include unreported crashes.
0.0
50.0
100.0
150.0
200.0
250.0
300.0
350.0
400.0
450.0
0
10,000
20,000
30,000
40,000
50,000
60,000
70,000
80,000
90,000
1991 1996 2001 2006 2011
Total Crashes Crashes per 100 million VMT
Draft for discussion
7
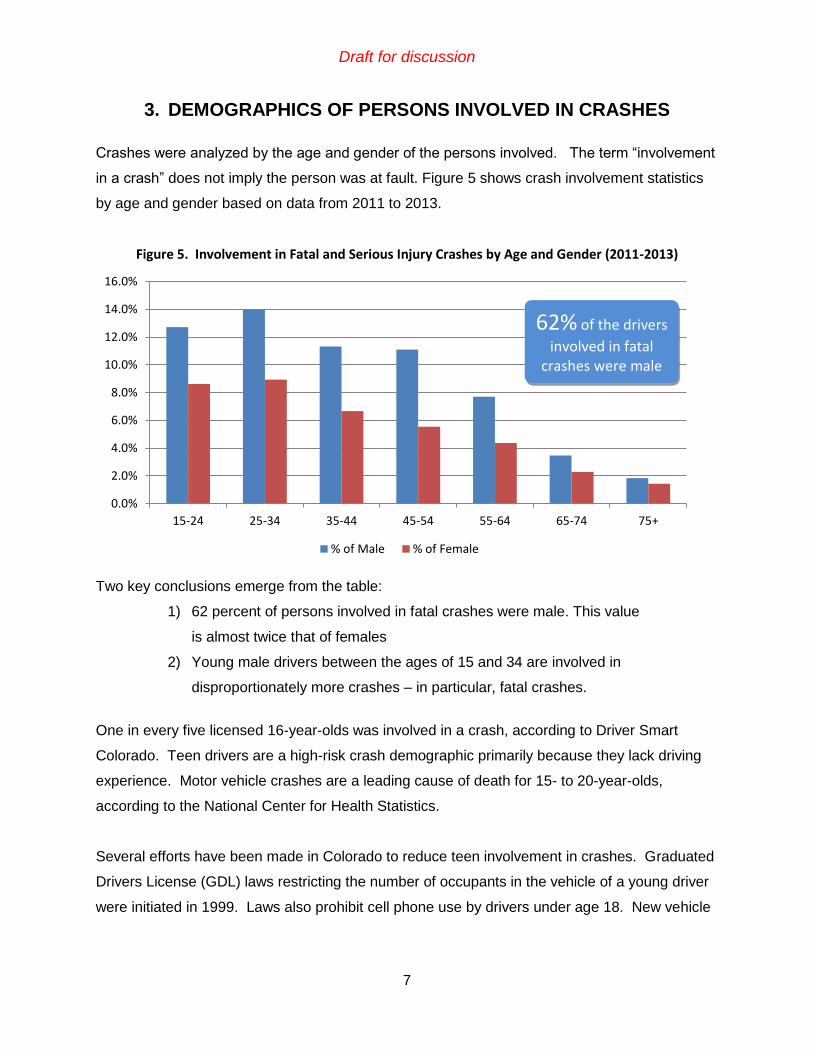
3. DEMOGRAPHICS OF PERSONS INVOLVED IN CRASHES
Crashes were analyzed by the age and gender of the persons involved. The term “involvement
in a crash” does not imply the person was at fault. Figure 5 shows crash involvement statistics
by age and gender based on data from 2011 to 2013.
Figure 5. Involvement in Fatal and Serious Injury Crashes by Age and Gender (2011-2013)
Two key conclusions emerge from the table:
1) 62 percent of persons involved in fatal crashes were male. This value
is almost twice that of females
2) Young male drivers between the ages of 15 and 34 are involved in
disproportionately more crashes – in particular, fatal crashes.
One in every five licensed 16-year-olds was involved in a crash, according to Driver Smart
Colorado. Teen drivers are a high-risk crash demographic primarily because they lack driving
experience. Motor vehicle crashes are a leading cause of death for 15- to 20-year-olds,
according to the National Center for Health Statistics.
Several efforts have been made in Colorado to reduce teen involvement in crashes. Graduated
Drivers License (GDL) laws restricting the number of occupants in the vehicle of a young driver
were initiated in 1999. Laws also prohibit cell phone use by drivers under age 18. New vehicle
0.0%
2.0%
4.0%
6.0%
8.0%
10.0%
12.0%
14.0%
16.0%
15-24 25-34 35-44 45-54 55-64 65-74 75+
% of Male % of Female
62% of the drivers
involved in fatal crashes were male

Draft for discussion
8
technologies have also been introduced to improve safety for young (and all) drivers, such as
stereo disabling if seat belts are not fastened.
Though statistics do not indicate a disproportionately high number of crashes among older
adults (aged 65+), there are unique concerns for this rapidly growing population group. Many
concerns can be addressed through roadway engineering actions such as clearer pavement
markings, larger text size on signs, and improved pedestrian crossings. Vehicle technologies
related to driver alerts, automated breaking, and run-off-road prevention will also help.

Draft for discussion
9
4. CRASH CHARACTERISTICS
A. Crash Types
Table 1 shows the distribution of crash types. The majority of
crashes (68 percent) occur between two or more moving motor
vehicles. About 17 percent of crashes occur with a fixed object.
Among crashes occurring between moving motor vehicles, about
half are rear-end collisions and 26 percent are broadside
collisions (i.e., a front to side impact).
Table 1. Crash Types (2011-2013)
Crash Type Collisions between Moving Vehicles
Moving motor vehicle 67.6% Front to rear 52.3%
Fixed object (e.g., light pole) 17.3% Front to side 25.9%
Parked vehicle, train, or bicycle 8.6% Sideswipe - same direction 14.2%
Rollover or non-collision 4.1% Front to front 5.3%
Pedestrian 1.3% Sideswipe - opposite direction 1.1%
Animal 1% Rear to side or Rear to rear 1.2%
Total 100% Total 100%
B. Crash Conditions
Table 2 shows the lighting and road surface conditions during crashes. The majority of crashes
occur during daylight. Fatalities during dark and twilight hours occur at a much higher proportion
than the share of travel (VMT) occurring at these times. It should be noted many snow crashes go
unreported.
Table 2. Prevailing Conditions at Time of Crash (2011-2013)
Lighting % of Crashes % of Fatalities % of VMT
Daylight 71% 41.9% 75%
Dark, Dawn, or Dusk 29% 58.1% 25%
Total 100% 100% 100%
Note: Daylight 7am-7pm annual average
Road Condition % of Crashes % of Fatalities
Dry 83.6% 91.07%
Wet 6.8% 5.16%
Snow, Ice, Slush 9.5% 3.77%
Foreign Materials,
Debris
0.1% 0.0%
Total 100% 100%
Half of all crashes between
moving vehicles are rear-end
collisions. Following too
closely and inattentiveness
are primary reasons.
Draft for discussion
10
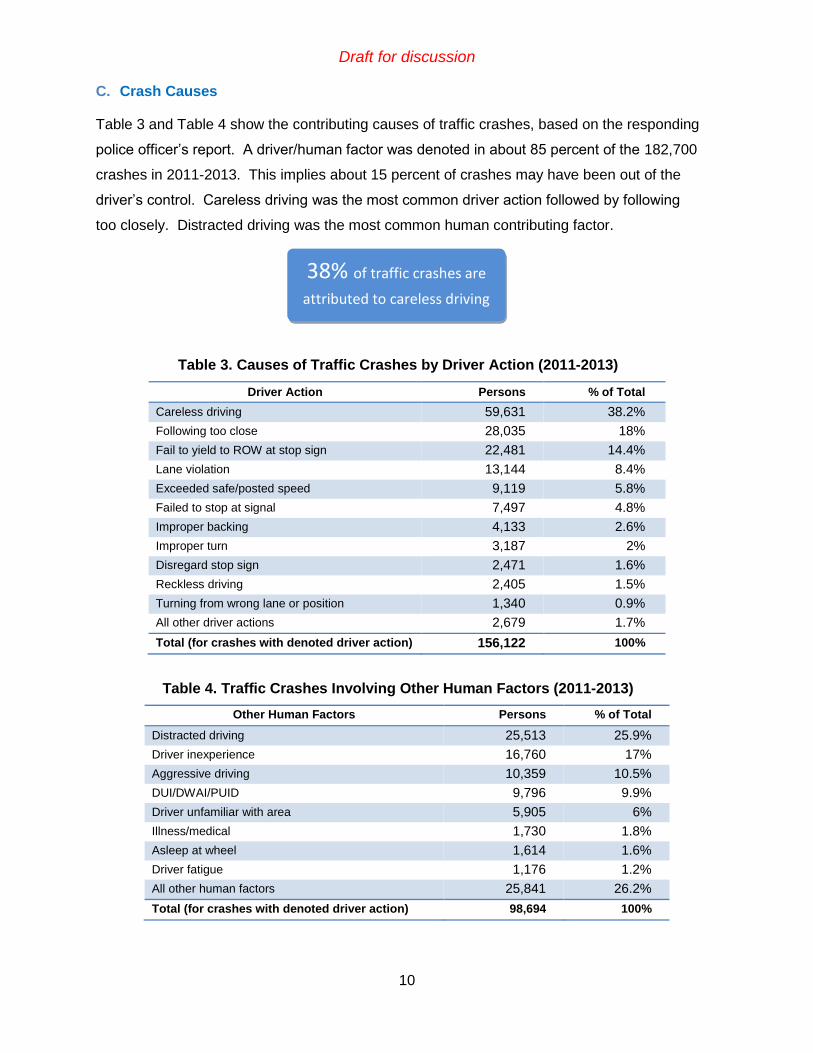
C. Crash Causes
Table 3 and Table 4 show the contributing causes of traffic crashes, based on the responding
police officer’s report. A driver/human factor was denoted in about 85 percent of the 182,700
crashes in 2011-2013. This implies about 15 percent of crashes may have been out of the
driver’s control. Careless driving was the most common driver action followed by following
too closely. Distracted driving was the most common human contributing factor.
Table 3. Causes of Traffic Crashes by Driver Action (2011-2013)
Driver Action Persons % of Total
Careless driving 59,631 38.2%
Following too close 28,035 18%
Fail to yield to ROW at stop sign 22,481 14.4%
Lane violation 13,144 8.4%
Exceeded safe/posted speed 9,119 5.8%
Failed to stop at signal 7,497 4.8%
Improper backing 4,133 2.6%
Improper turn 3,187 2%
Disregard stop sign 2,471 1.6%
Reckless driving 2,405 1.5%
Turning from wrong lane or position 1,340 0.9%
All other driver actions 2,679 1.7%
Total (for crashes with denoted driver action) 156,122 100%
Table 4. Traffic Crashes Involving Other Human Factors (2011-2013)
Other Human Factors Persons % of Total
Distracted driving 25,513 25.9%
Driver inexperience 16,760 17%
Aggressive driving 10,359 10.5%
DUI/DWAI/PUID 9,796 9.9%
Driver unfamiliar with area 5,905 6%
Illness/medical 1,730 1.8%
Asleep at wheel 1,614 1.6%
Driver fatigue 1,176 1.2%
All other human factors 25,841 26.2%
Total (for crashes with denoted driver action) 98,694 100%
38% of traffic crashes are
attributed to careless driving

Draft for discussion
11
5. SPECIFIC CRASH TYPES
A. Truck-related Crashes
Heavy trucks are an important consideration in traffic safety because of their
proportionally greater impacts per crash (injuries, fatalities, congestion). Trucks
also have unique maneuverability and visual considerations in relation to
roadway design and other road users. The crash database classifies a truck as
a vehicle with a gross weight greater than 10,000 pounds. As a point of reference, a Ford F350
pickup marks the bottom end of the weight threshold. In 2013, there were about 2,600 crashes
involving trucks in the Denver region, resulting in 51 serious injuries and 12 fatalities.
There were 162 fatal truck crashes in the state of Colorado between 2012 and 2014 (National
Highway Traffic Safety Administration). When analyzed by truck type, 114 of the fatal truck
crashes in Colorado (70.4 percent) involved a tractor trailer.
Figure 6. Colorado Fatal Truck Crashes by Truck Type (2012-2014)
Table 5 shows truck crash characteristics from 2011 to 2013. An equal number of truck crashes
occurred on arterials (36 percent), freeways (34 percent) and local roads (31 percent). About
half of truck-related crashes occurred at non-intersections, while intersection related crashes
accounted for about one third (38 percent). The most common truck movement at the time of
the crash was going straight (43 percent). Most truck-related crashes occurred during the day.
3.7%
25.9%
70.4%
Medium/Heavy Pickup or Step Van Single Unit Truck Truck Tractor

Draft for discussion
12
Table 5. Truck Crash Characteristics (2011-2013)
Facility Type Crashes Percent
Arterials 2,567 35.6%
Freeways 2,428 33.7%
Collector or local roads 2,210 30.7%
Total truck crashes 7,205 100%
Crash Location Crashes Percent
Non-intersection 3,627 50.3%
At intersection or intersection related 2,766 38.4%
At driveway access 415 5.8%
Highway interchange (ramp) 278 3.9%
In alley 81 1.1%
Parking lot 12 0.2%
Roundabout 26 0.4%
Unreported 0 0%
Total truck crashes 7,205 100%
Truck Movement Crashes Percent
Going Straight 3,223 43.1%
Making left-turn 803 10.7%
Making right-turn 734 9.8%
Stopped in Traffic 590 7.9%
Changing Lanes 585 7.8%
Backing 458 6.1%
Slowing 360 4.8%
Parked 232 3.1%
All other movements 497 6.6%
Total truck movements* 7,482 100%
Lighting Crashes Percent
Daylight 5,924 82.2%
Dark 1,023 14.2%
Dawn or dusk 237 3.3%
Unknown 21 0.3%
Total truck crashes 7,205 100%
*Note – The larger number of movements is due to the number of truck crashes that involved more than one truck.
Draft for discussion
13
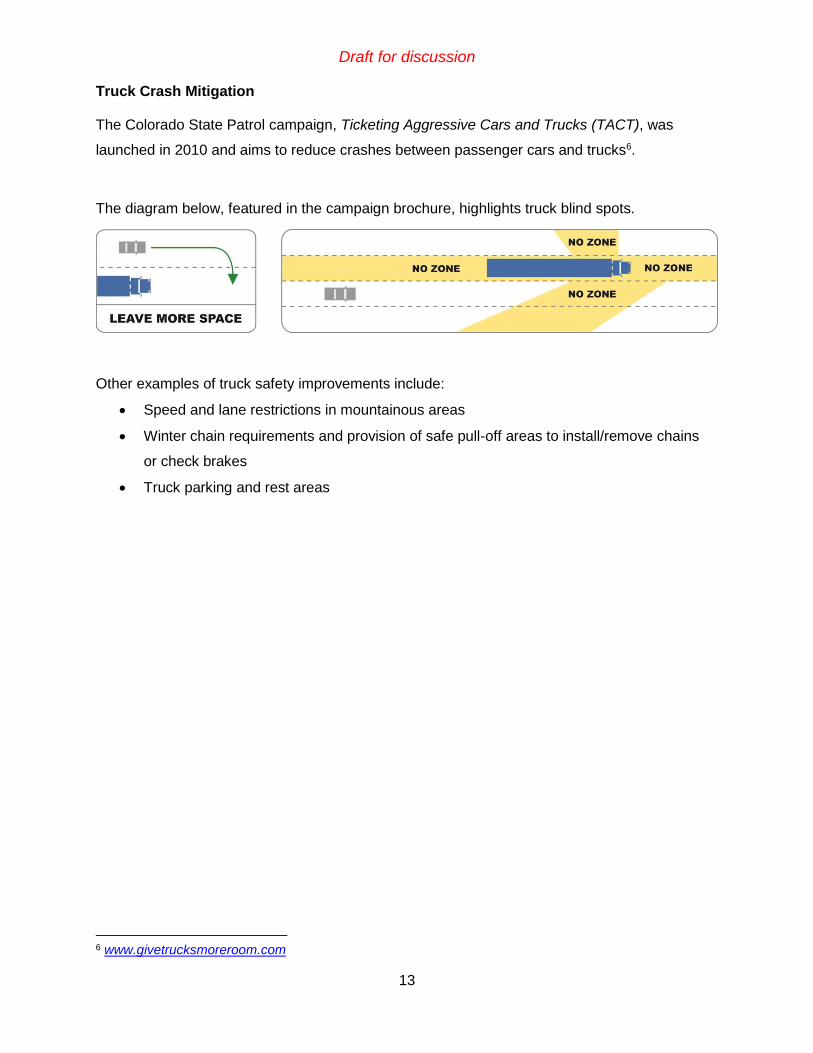
Truck Crash Mitigation
The Colorado State Patrol campaign, Ticketing Aggressive Cars and Trucks (TACT), was
launched in 2010 and aims to reduce crashes between passenger cars and trucks6.
The diagram below, featured in the campaign brochure, highlights truck blind spots.
Other examples of truck safety improvements include:
Speed and lane restrictions in mountainous areas
Winter chain requirements and provision of safe pull-off areas to install/remove chains
or check brakes
Truck parking and rest areas
6 www.givetrucksmoreroom.com
Draft for discussion
14
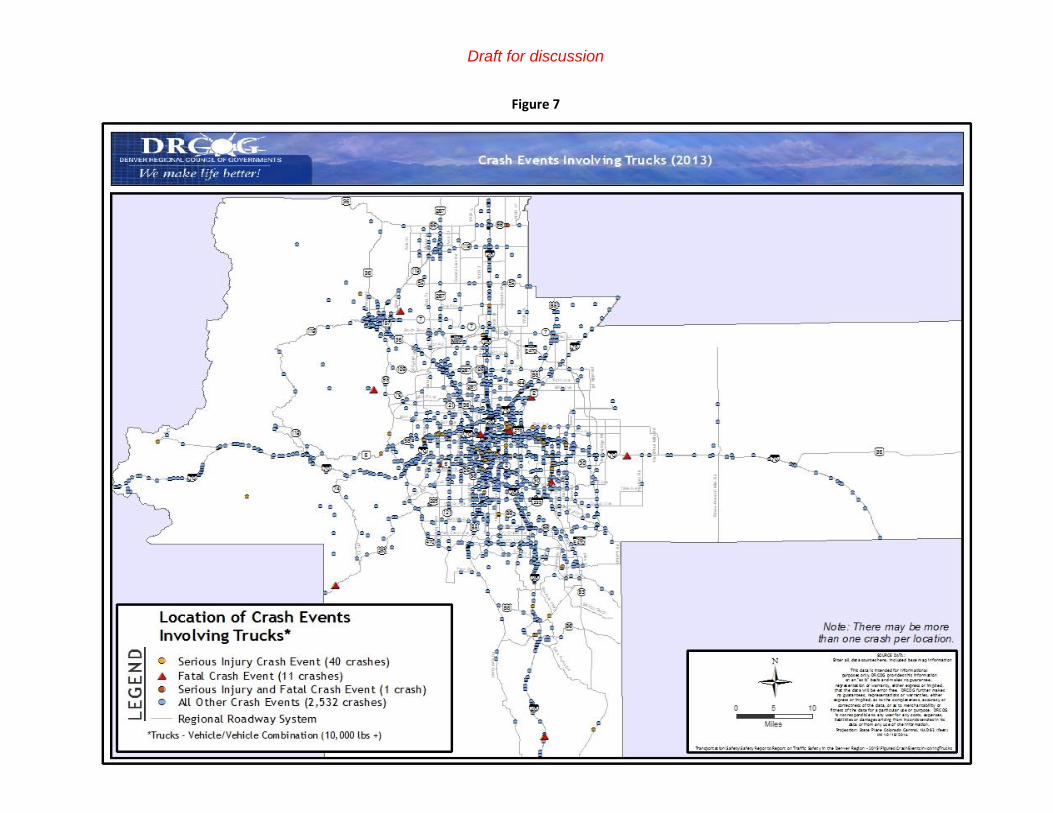
Figure 7
Figure 7. Crash Events Involving Trucks (2013)

Draft for discussion
15
B. Motorcycle-related Crashes
Motorcyclists are more vulnerable to serious injuries and fatalities than
persons driving cars. They have less protection than persons in cars and
are harder to see. Between 2011 and 2013, an average of 1,200
motorcycle crashes occurred per year in the Denver region. The chart
below shows motorcycle fatalities from 2000 to 2015, averaging 36 fatalities per year.
Motorcyclists make up an increasing proportion of all traffic fatalities (14 percent in 2000 to 23
percent in 2015).
Figure 8. Motorcycle Fatalities in the Denver Region (2000-2015)
The number of motorcycle registrations has increased substantially over the last five years. The
fatality rate per number of motorcycle registrations has remained about the same (see Table 6).
Table 6. Motorcycle Fatality Rate in the Denver Region (2010-2014)
Year
Motorcycle
Registrations
Motorcycle
Fatalities
Motorcycle
Fatalities
per 1,000
Registrations
2010 94,750 33 0.35
2011 99,284 27 0.27
2012 99,528 31 0.31
2013 103,543 32 0.31
2014 105,035 38 0.36
0
20
40
60
0%
10%
20%
30%
Mo
torc
ycle
Fat
alit
ies
Pe
rce
nta
ge o
f al
l Tra
ffic
Fat
alit
ies
Motorcycle Fatalities Motorcycle % of Fatalities

Draft for discussion
16
In Colorado, helmet use is not required for adults, but is required for operators and passengers under
the age of 18. CDOT also found motorcyclists were at fault in 7 out of 10 fatal crashes in 2010. For
additional information on CDOT motorcycle safety efforts, visit https://www.codot.gov/safety/live-to-ride.
Figure 9 shows a map of motorcycle crash locations from 2013.

Draft for discussion
17
Figure 9
Figure 9. Crash Events Involving Motorcycles (2013)
Draft for discussion
18
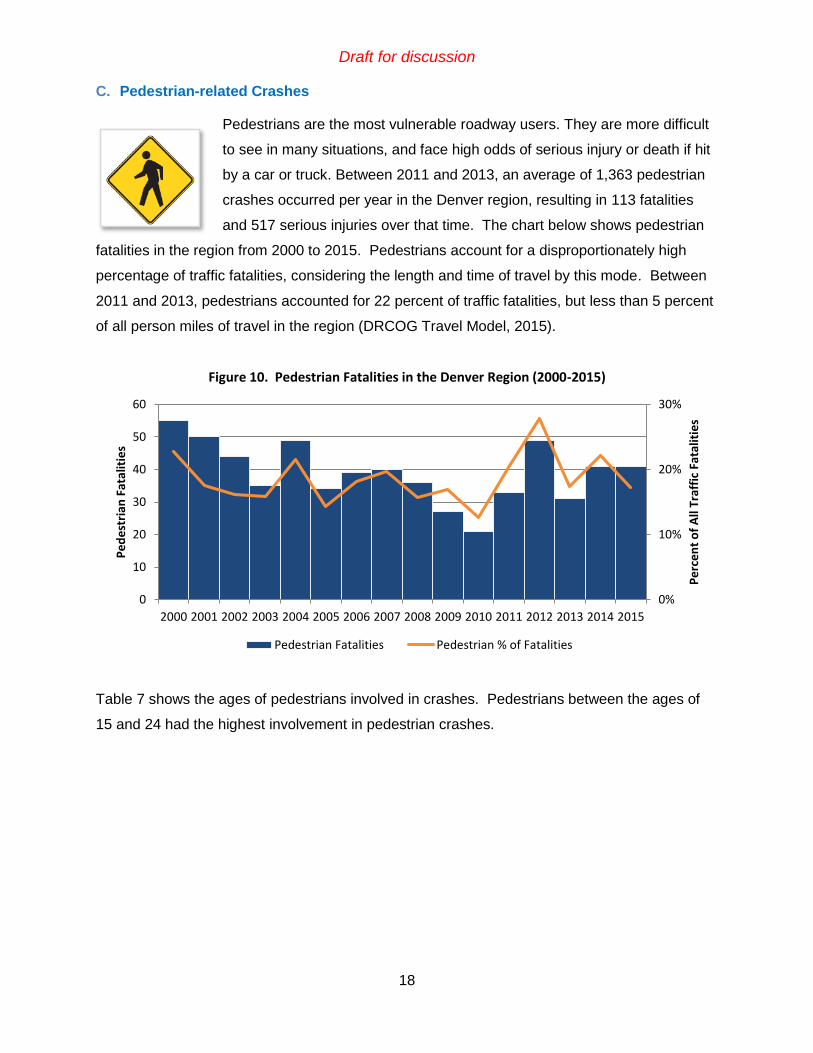
C. Pedestrian-related Crashes
Pedestrians are the most vulnerable roadway users. They are more difficult
to see in many situations, and face high odds of serious injury or death if hit
by a car or truck. Between 2011 and 2013, an average of 1,363 pedestrian
crashes occurred per year in the Denver region, resulting in 113 fatalities
and 517 serious injuries over that time. The chart below shows pedestrian
fatalities in the region from 2000 to 2015. Pedestrians account for a disproportionately high
percentage of traffic fatalities, considering the length and time of travel by this mode. Between
2011 and 2013, pedestrians accounted for 22 percent of traffic fatalities, but less than 5 percent
of all person miles of travel in the region (DRCOG Travel Model, 2015).
Figure 10. Pedestrian Fatalities in the Denver Region (2000-2015)
Table 7 shows the ages of pedestrians involved in crashes. Pedestrians between the ages of
15 and 24 had the highest involvement in pedestrian crashes.
0%
10%
20%
30%
0
10
20
30
40
50
60
2000 2001 2002 2003 2004 2005 2006 2007 2008 2009 2010 2011 2012 2013 2014 2015
Pe
rce
nt
of
All
Traf
fic
Fata
litie
s
Pe
de
stri
an F
atal
itie
s
Pedestrian Fatalities Pedestrian % of Fatalities

Draft for discussion
19
Table 7. Age of Pedestrians in Traffic Crashes (2011-2013)
Pedestrians Involved in
Crashes
Pedestrians Killed
Pedestrians Seriously Injured
Age Group Number Percent Number Percent Number Percent
0-14 391 9.8% 4 3.7% 75 12.6%
15-24 971 24.5% 16 14.8% 128 21.5%
25-34 758 19.1% 14 13% 108 18.2%
35-44 612 15.4% 22 20.4% 76 12.8%
45-54 596 15% 16 14.8% 98 16.5%
55-64 396 10% 19 17.6% 60 10.1%
65-74 165 4.2% 9 8.3% 32 5.4%
75+ 81 2% 8 7.4% 18 3%
Total Reported
3,970 100% 108 100% 595 100%
Age Unreported
641 - 4 - 70 -
Total Pedestrians
4,611 - 112 - 665 -
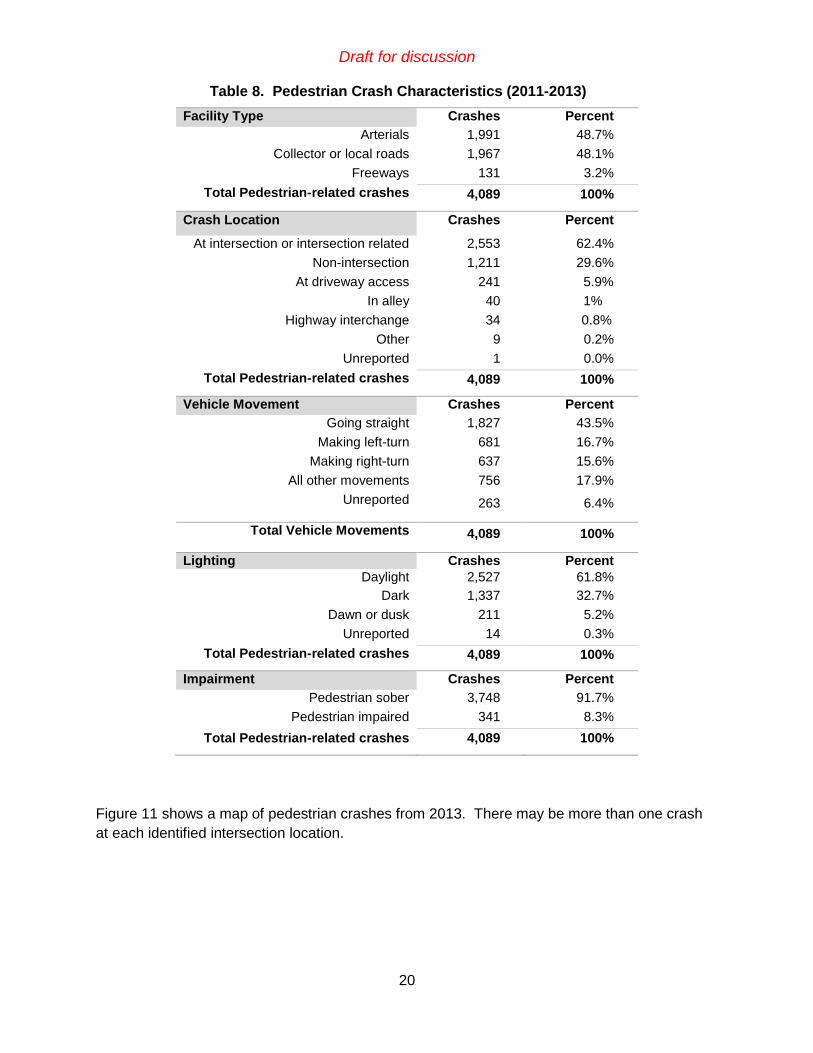
Table 8 shows pedestrian crash characteristics from 2011 to 2013. An equal number of
pedestrian crashes occurred on arterials (49 percent) and local roads (48 percent) and the
majority occurred at intersections (63 percent). In addition, the most common vehicle path in a
pedestrian crash is traveling straight; the second most common path is making a left turn.
One-third of crashes occurred at night. The pedestrian was impaired by alcohol or drugs in
eight percent of pedestrian crashes.
Draft for discussion
20
Table 8. Pedestrian Crash Characteristics (2011-2013)
Facility Type Crashes Percent
Arterials
Freeways
1,991
48.7%
Collector or local roads 1,967 48.1%
Freeways 131 3.2%
Total Pedestrian-related crashes 4,089 100%
Crash Location Crashes Percent
At intersection or intersection related 2,553 62.4%
Non-intersection 1,211 29.6%
At driveway access 241 5.9%
In alley 40 1%
Highway interchange 34 0.8%
Other 9 0.2%
Unreported 1 0.0%
Total Pedestrian-related crashes 4,089 100%
Vehicle Movement Crashes Percent
Going straight 1,827 43.5%
Making left-turn 681 16.7%
Making right-turn 637 15.6%
All other movements 756 17.9%
Unreported 263 6.4%
Total Vehicle Movements 4,089 100%
Lighting Crashes Percent
Daylight 2,527 61.8%
Dark 1,337 32.7%
Dawn or dusk 211 5.2%
Unreported 14 0.3%
Total Pedestrian-related crashes 4,089 100%
Impairment Crashes Percent
Pedestrian sober 3,748 91.7%
Pedestrian impaired 341 8.3%
Total Pedestrian-related crashes 4,089 100%
Figure 11 shows a map of pedestrian crashes from 2013. There may be more than one crash
at each identified intersection location.

Draft for discussion
21
Figure 11
Figure 11. Crash Events Involving Pedestrians (2013)
Draft for discussion
22
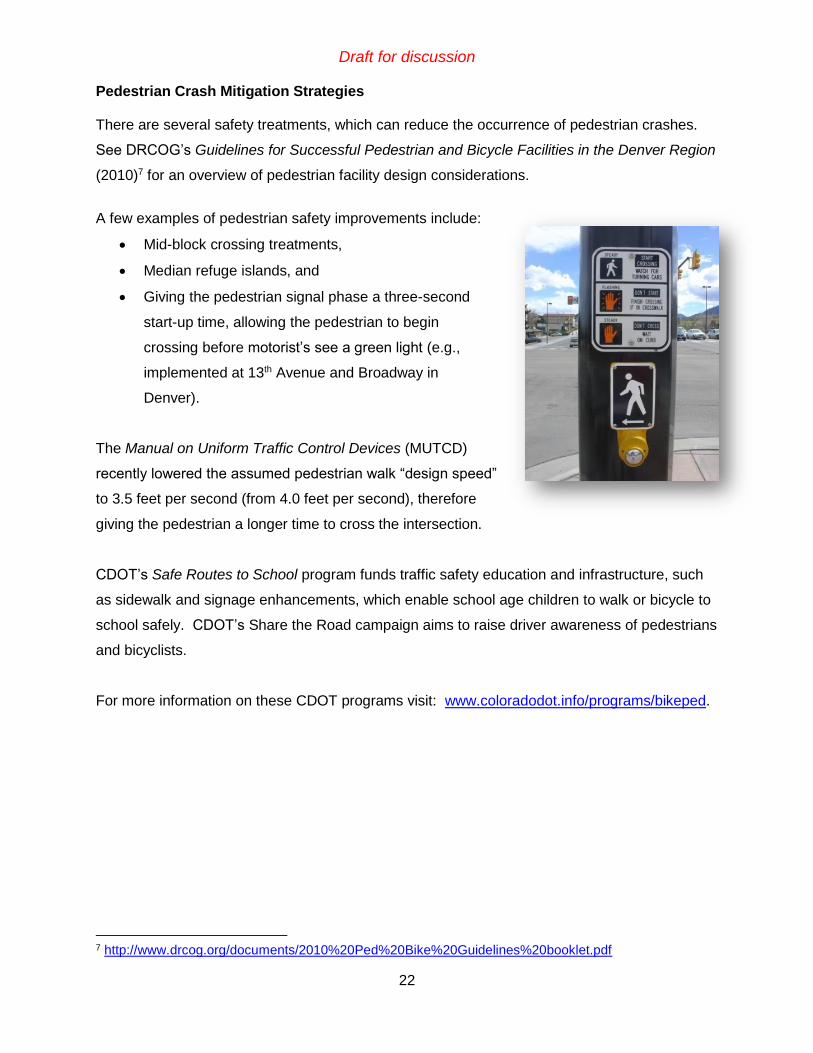
Pedestrian Crash Mitigation Strategies
There are several safety treatments, which can reduce the occurrence of pedestrian crashes.
See DRCOG’s Guidelines for Successful Pedestrian and Bicycle Facilities in the Denver Region
(2010)7 for an overview of pedestrian facility design considerations.
A few examples of pedestrian safety improvements include:
Mid-block crossing treatments,
Median refuge islands, and
Giving the pedestrian signal phase a three-second
start-up time, allowing the pedestrian to begin
crossing before motorist’s see a green light (e.g.,
implemented at 13th Avenue and Broadway in
Denver).
The Manual on Uniform Traffic Control Devices (MUTCD)
recently lowered the assumed pedestrian walk “design speed”
to 3.5 feet per second (from 4.0 feet per second), therefore
giving the pedestrian a longer time to cross the intersection.
CDOT’s Safe Routes to School program funds traffic safety education and infrastructure, such
as sidewalk and signage enhancements, which enable school age children to walk or bicycle to
school safely. CDOT’s Share the Road campaign aims to raise driver awareness of pedestrians
and bicyclists.
For more information on these CDOT programs visit: www.coloradodot.info/programs/bikeped.
7 http://www.drcog.org/documents/2010%20Ped%20Bike%20Guidelines%20booklet.pdf
Draft for discussion
23
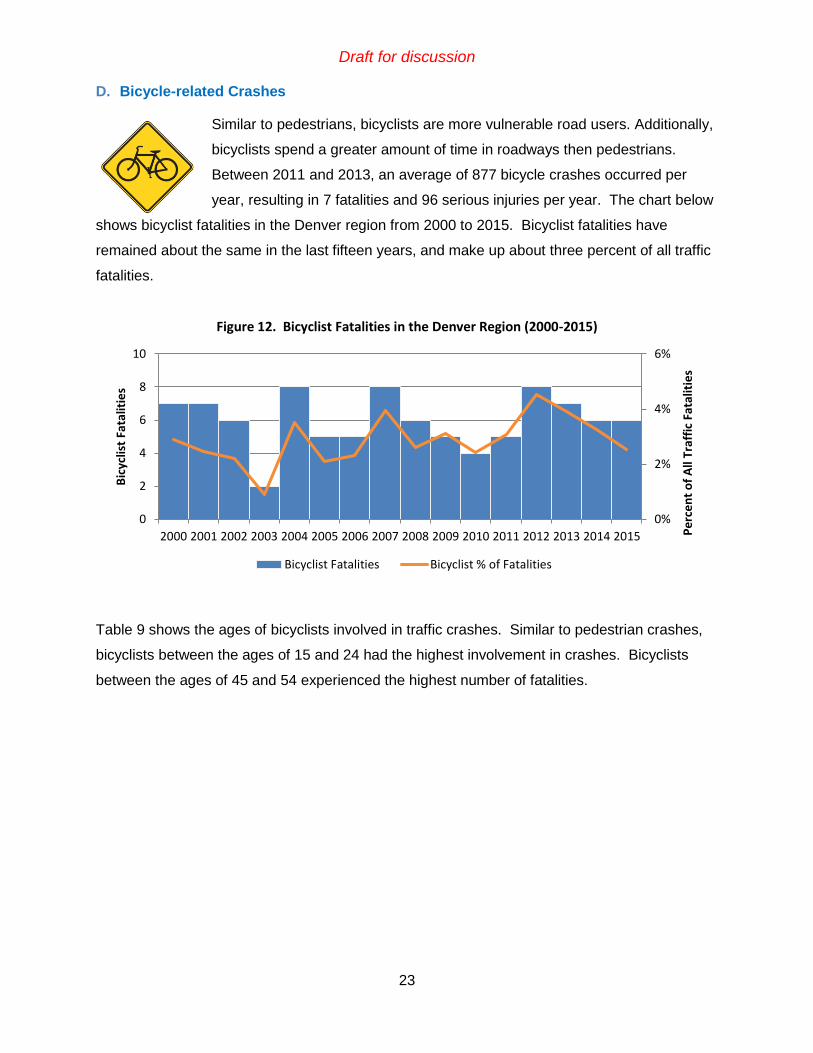
D. Bicycle-related Crashes
Similar to pedestrians, bicyclists are more vulnerable road users. Additionally,
bicyclists spend a greater amount of time in roadways then pedestrians.
Between 2011 and 2013, an average of 877 bicycle crashes occurred per
year, resulting in 7 fatalities and 96 serious injuries per year. The chart below
shows bicyclist fatalities in the Denver region from 2000 to 2015. Bicyclist fatalities have
remained about the same in the last fifteen years, and make up about three percent of all traffic
fatalities.
Figure 12. Bicyclist Fatalities in the Denver Region (2000-2015)
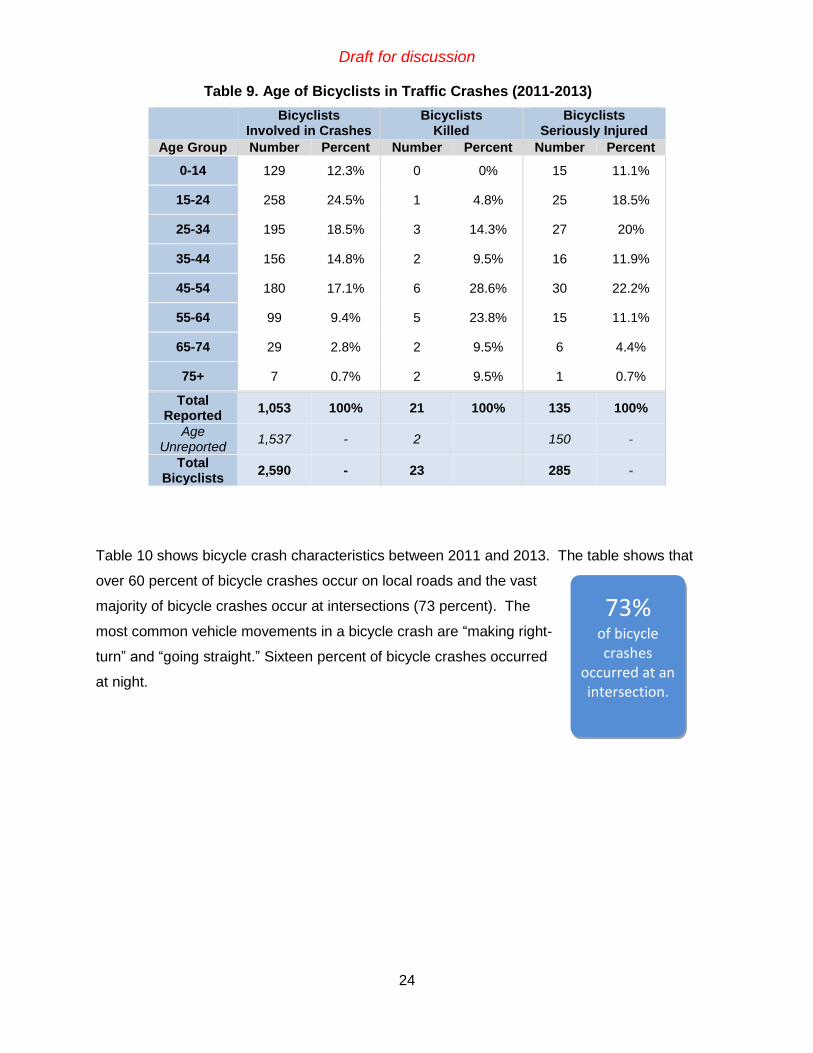
Table 9 shows the ages of bicyclists involved in traffic crashes. Similar to pedestrian crashes,
bicyclists between the ages of 15 and 24 had the highest involvement in crashes. Bicyclists
between the ages of 45 and 54 experienced the highest number of fatalities.
0%
2%
4%
6%
0
2
4
6
8
10
2000 2001 2002 2003 2004 2005 2006 2007 2008 2009 2010 2011 2012 2013 2014 2015 Pe
rce
nt
of
All
Traf
fic
Fata
litie
s
Bic
yclis
t Fa
talit
ies
Bicyclist Fatalities Bicyclist % of Fatalities
Draft for discussion
24
Table 9. Age of Bicyclists in Traffic Crashes (2011-2013)
Bicyclists Involved in Crashes
Bicyclists Killed
Bicyclists Seriously Injured
Age Group Number Percent Number Percent Number Percent
0-14 129 12.3% 0 0% 15 11.1%
15-24 258 24.5% 1 4.8% 25 18.5%
25-34 195 18.5% 3 14.3% 27 20%
35-44 156 14.8% 2 9.5% 16 11.9%
45-54 180 17.1% 6 28.6% 30 22.2%
55-64 99 9.4% 5 23.8% 15 11.1%
65-74 29 2.8% 2 9.5% 6 4.4%
75+ 7 0.7% 2 9.5% 1 0.7%
Total Reported
1,053 100% 21 100% 135 100%
Age Unreported
1,537 - 2 150 -
Total Bicyclists
2,590 - 23 285 -
Table 10 shows bicycle crash characteristics between 2011 and 2013. The table shows that
over 60 percent of bicycle crashes occur on local roads and the vast
majority of bicycle crashes occur at intersections (73 percent). The
most common vehicle movements in a bicycle crash are “making right-
turn” and “going straight.” Sixteen percent of bicycle crashes occurred
at night.
73% of bicycle crashes
occurred at an intersection.

Draft for discussion
25
Table 10. Bicycle Crash Characteristics (2011-2013)
Facility Type Crashes Percent
Collector or local roads
1,651 62.8%
Arterials
Freeways
959 36.5%
Freeway/Ramps 21 0.8%
Total Bicycle-related crashes 2,631 100%
Crash Location Crashes Percent
At intersection or intersection related 1,929 73.3%
Non-intersection 331 12.6%
At driveway access 317 12.0%
Alley related 43 1.6%
On/Off-ramp 9 0.3%
Parking Lot 2 0.1%
Total Bicycle-related crashes 2,631 100%
Vehicle Movement Crashes Percent
Making right-turn 956 36.1%
Going straight 911 34.4%
Making left-turn 512 19.3%
All other movements 267
10.1%
Total Vehicle Movements* 2,646 100%
Lighting Crashes Percent
Daylight 2,091 79.5%
Dark 415 15.8%
Dawn or dusk 115 4.4%
Unknown 10 0.4%
Total Bicycle-related Crashes 2,631 100%
*Note – Some crashes involved more than one vehicle resulting in a higher number of movements

Draft for discussion
26
Bicycle Crash Mitigation Strategies
As the interest in bicycling as a viable mode of travel increases among a wider segment of the
population, so does the demand for facilities that are both safe and comfortable. Providing high
comfort (or low-stress) facilities can help reduce the occurrence of crashes while potentially
inducing bicycle usage. Some examples of improvements which can improve comfort and safety
include:
conventional or protected bike lanes and intersections;
buffered bike lanes;
bicycle boulevards;
shared-use paths;
shared-use bridges/overpasses and underpasses;
paved shoulder bicycle routes; and
better maintenance of on-street and off-street bicycle facilities
The following resources include guidance for bicycle facility design:
Urban Bikeway Design Guide, 2014 – Second Edition, (National Association of City
Transportation Officials)
Guide for the Development of Bicycle Facilities, 2012 – Fourth Edition, (American
Association of State Highway and Transportation Officials)
CDOT Roadway Design Guide – Chapter 14 Bicycle and Pedestrian Facilities, Jan 2013,
Revision 1, (CDOT).

Draft for discussion
27
Figure 13
Figure 13. Crash Events Involving Bicyclists (2013)

Draft for discussion
28
E. Construction Zone Crashes
Construction zones expose vulnerable workers to motor vehicle traffic on a
day-to-day basis. Drivers may also have more difficulty maneuvering
through these zones. Between 2011 and 2013, an average of 709
construction zone crashes occurred per year, resulting in 26 serious injuries
and 3 fatalities per year. As shown in the chart below, the number of
construction zone crashes is highly variable, depending on the location and amount of
construction occurring each year.
Figure 14. Construction Zone Crashes in the Denver Region (1991-2013)
According to CDOT, 85% of work zone fatalities are motorists or occupants. Also, in a typical
five-day work week, an average of seven motorists and one highway worker are killed nationwide.
Rear-end collisions are by far the most common crash type in a construction zone, representing
70 percent of all collisions between moving
motor vehicles in 2013. Careless driving and
following too close were the most common
driver actions, while distracted driving was
the most common human factor.
0
200
400
600
800
1,000
1,200
1,400
1,600
1991 1996 2001 2006 2011
Co
nst
ruct
ion
Zo
ne
Cra
she
s

Draft for discussion
29
Construction Zone Crash Mitigation Strategies
CDOT’s Slow for the Cone Zone campaign8 aims to enhance safety for motorists and workers in
construction zones at construction projects each year from June to September. Higher fines for
violating traffic laws in a construction zone also help to reduce unsafe behavior. In 2006, nearly
all types of fines doubled in Colorado work zones. It is also important for construction and
maintenance teams to provide clear markings, warnings, and guidance for motorists.
8 www.coloradodot.info/programs/cone-zone
Draft for discussion
30
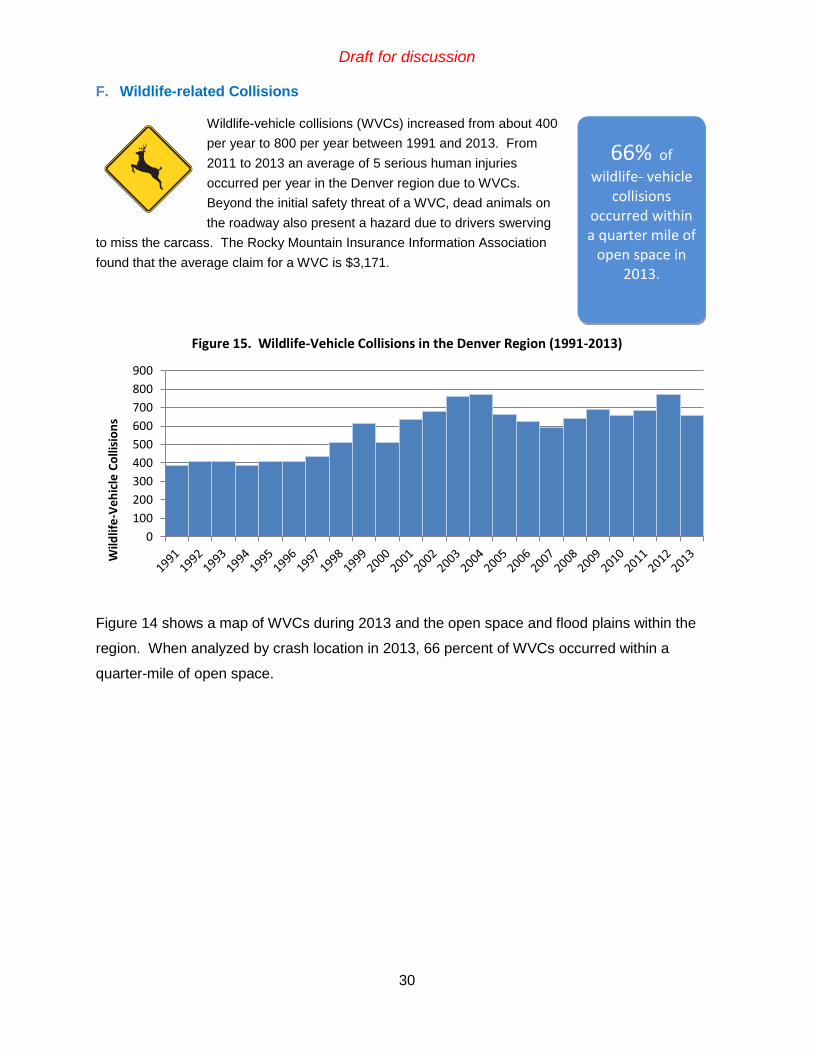
F. Wildlife-related Collisions
Wildlife-vehicle collisions (WVCs) increased from about 400
per year to 800 per year between 1991 and 2013. From
2011 to 2013 an average of 5 serious human injuries
occurred per year in the Denver region due to WVCs.
Beyond the initial safety threat of a WVC, dead animals on
the roadway also present a hazard due to drivers swerving
to miss the carcass. The Rocky Mountain Insurance Information Association
found that the average claim for a WVC is $3,171.
Figure 15. Wildlife-Vehicle Collisions in the Denver Region (1991-2013)
Figure 14 shows a map of WVCs during 2013 and the open space and flood plains within the
region. When analyzed by crash location in 2013, 66 percent of WVCs occurred within a
quarter-mile of open space.
0
100
200
300
400
500
600
700
800
900
Wild
life
-Ve
hic
le C
olli
sio
ns
66% of
wildlife- vehicle collisions
occurred within a quarter mile of
open space in 2013.

Draft for discussion
31
Animal-Vehicle Crash Mitigation Strategies
CDOT’s Wildlife on the Move campaign9 reminds drivers to drive with caution, especially in the fall,
when animal migration is most common. The majority of WVCs occur at nighttime; therefore CDOT
has designated certain at-risk corridors as
Wildlife Zones, reducing the nighttime
speed limit from September to April. The
US 36 corridor from Boulder to Lyons is a
designated Wildlife Zone. WVCs make up
over 65 percent of nighttime crashes on
this corridor.
CDOT also recently constructed a wildlife exclusion fence and crossing on US-6 in Golden.
The eight-foot tall fence extends 2.5 miles and funnels animals to a single wildlife crossing.
Flashing beacons and dynamic message
signs at the crossing alert motorists when
an animal is detected.
9 https://www.codot.gov/programs/environmental/wildlife/wildlifeonthemove
Source: CDOT

Draft for discussion
32
Figure 16
Figure 16. Crash Events Involving Wildlife (2013)

Draft for discussion
33
6. HIGH-RISK BEHAVIOR CRASHES
A. Impaired Driving
Between 2011 and 2013, an average of 3,265
impaired driving crashes occurred per year. These
crashes resulted in an average of 291 serious
injuries and 38 fatalities per year. The chart below
shows trends in impaired driving fatalities from 2004 to 2013. Impaired
driving fatalities in the Denver region have experienced a downward
trend over the last nine years, from 111 fatalities in 2004 to 42 fatalities
in 2013. In addition, the percentage of all fatal crashes related to
impaired driving has decreased steadily over the same time period
(from 48 percent to 23 percent).
Figure 17. Impaired Driving Fatalities in the Denver Region (2004-2013)
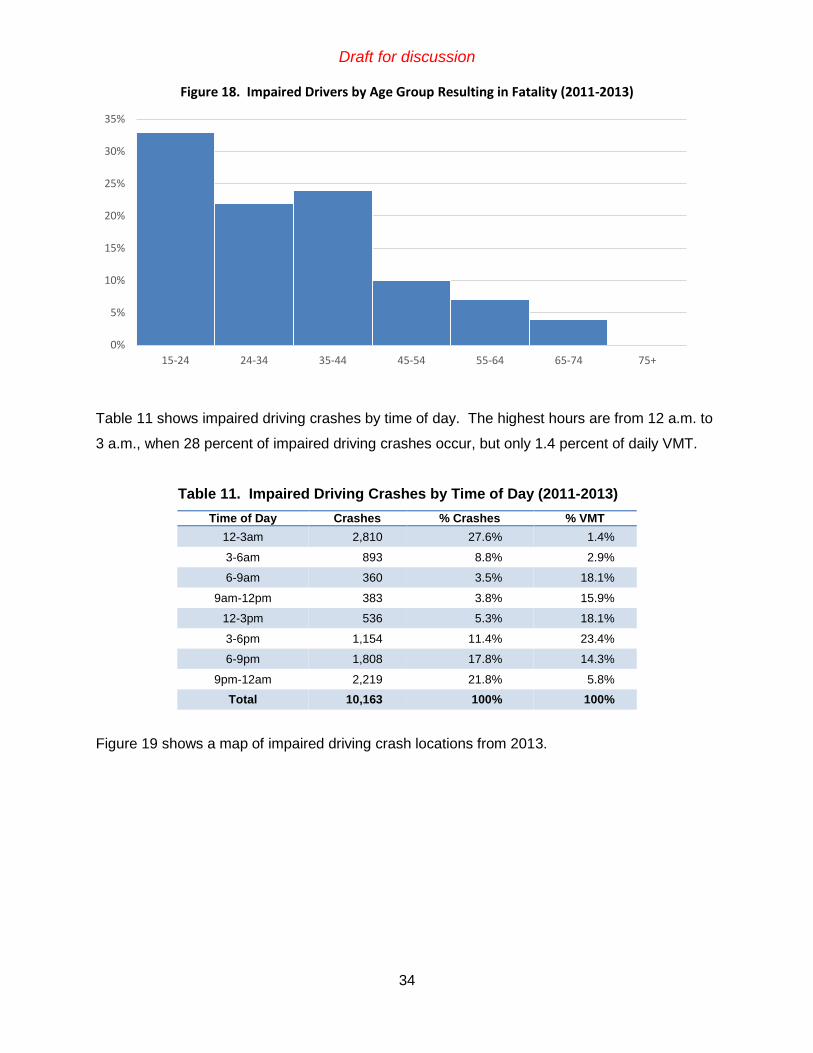
The chart below shows the demographics of impaired drivers that were involved in a fatal crash
between 2011 and 2013. Drivers under the age of 45 make up the vast majority of impaired
drivers in fatal crashes with 33% being between the ages of 15 and 24.
0%
10%
20%
30%
40%
50%
60%
0
20
40
60
80
100
120
2004 2005 2006 2007 2008 2009 2010 2011 2012 2013
Pe
rce
nt
of
all F
atal
Cra
she
s
Imp
aire
d D
rivi
ng
Fata
litie
s
Fatalities % of Fatal Crashes
Impaired driving fatalities have
dropped by
69% in the last
eight years.
27% of impaired
driving crashes occur between 12 and 3 a.m.
Draft for discussion
34
Figure 18. Impaired Drivers by Age Group Resulting in Fatality (2011-2013)
Table 11 shows impaired driving crashes by time of day. The highest hours are from 12 a.m. to
3 a.m., when 28 percent of impaired driving crashes occur, but only 1.4 percent of daily VMT.
Table 11. Impaired Driving Crashes by Time of Day (2011-2013)
Time of Day Crashes % Crashes % VMT
12-3am 2,810 27.6% 1.4%
3-6am 893 8.8% 2.9%
6-9am 360 3.5% 18.1%
9am-12pm 383 3.8% 15.9%
12-3pm 536 5.3% 18.1%
3-6pm 1,154 11.4% 23.4%
6-9pm 1,808 17.8% 14.3%
9pm-12am 2,219 21.8% 5.8%
Total 10,163 100% 100%
Figure 19 shows a map of impaired driving crash locations from 2013.
0%
5%
10%
15%
20%
25%
30%
35%
15-24 24-34 35-44 45-54 55-64 65-74 75+

Draft for discussion
35
Figure 19
Figure 19. Crash Events Involving Impaired Driving (2013)

Draft for discussion
36
Impaired Driving Education and Enforcement Efforts
CDOT runs several campaigns and programs to reduce
impaired driving. The Heat is On! campaign raises public
awareness of DUI through high visibility enforcement and
sobriety check points during 12 key periods of the year
(e.g., Labor Day, Fourth of July, Memorial Day, and New
Year’s Eve). From Memorial Day to Labor Day, the 100
Days of Heat campaign increases enforcement visibility by
placing two large banners at the Eisenhower and Johnson
tunnels on I-70 and a traveling dynamic message sign
counts the number of DUI arrests made year to date. Visit
www.HeatIsOnColorado.com for more information on CDOT
enforcement activities and DUI arrest statistics.
CDOT recently launched a new education campaign on marijuana impaired driving. Visit
https://www.codot.gov/safety/alcohol-and-impaired-driving/druggeddriving to learn more and to
find drugged driving statistics.

Draft for discussion
37
B. Speeding
Speeding generally involves exceeding the posted speed limit or driving too
fast for the road conditions. For this analysis, speeding was defined as a
driver traveling at 10 miles or more per hour above the speed limit.
Between 2011 and 2013, an average of 3,040 speeding-related crashes
occurred per year in the Denver region. These crashes resulted in an
average of 19 fatalities and 91 serious injuries per year. Speeding was involved in about 11
percent of all fatal crashes between 2011 and 2013. The charts below show the age of drivers
involved in speed-related fatal crashes and the types of roadways where speeding-related fatal
crashes occurred.
Figure 20. Age of Driver in Speeding-related Fatality (2011-2013)
Young drivers make up the vast majority of fatalities occurring due to excessive speed. The age
group of 15 to 34 makes up more than half of all fatalities. Speeding-related fatalities occur on all
types of roadways. As shown in the pie chart (Figure 21), 39 percent of speeding-related fatal
crashes occurred on arterials, 37 percent occurred on collector/local roads, and 25 percent
occurred on freeways.
0%
5%
10%
15%
20%
25%
30%
15-24 25-34 35-44 45-54 55-64 65-74 75+
% o
f Fa
talit
ies
in A
ge G
rou
p
Speeding was involved in
11% of fatal crashes between 2011
and 2013.

Draft for discussion
38
Figure 21. Speeding-related Fatalities by Facility Type (2011-2013)
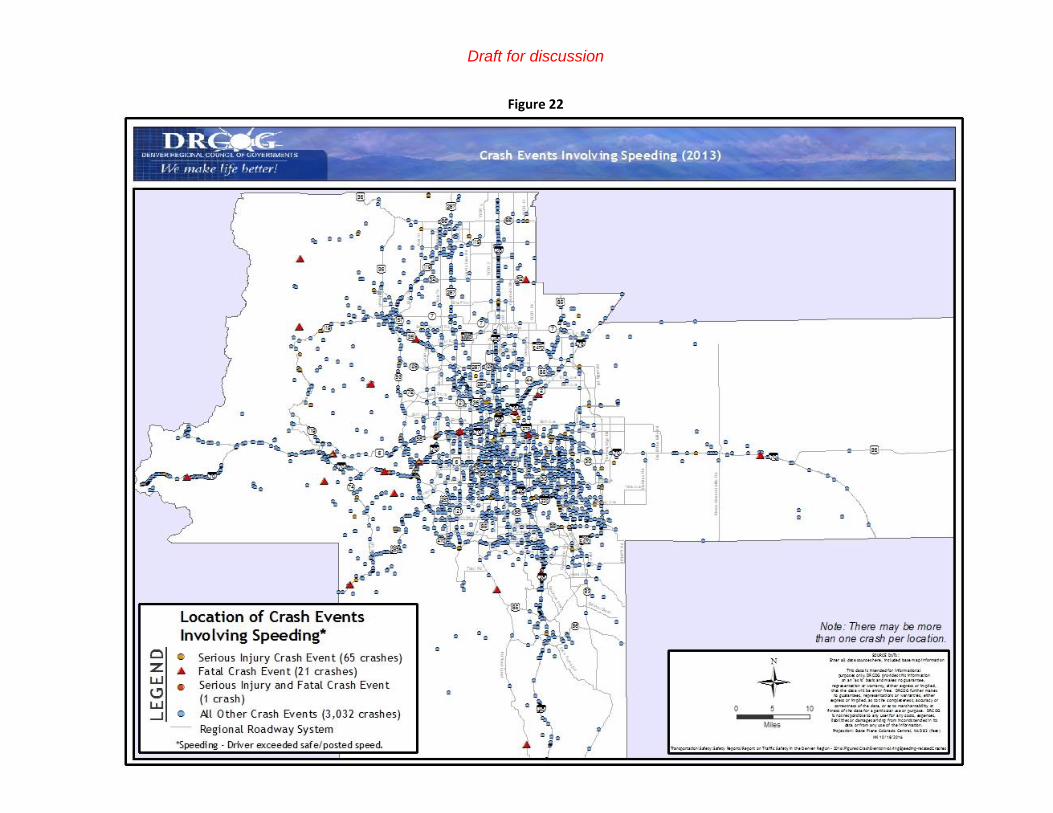
Figure 22 shows the locations of speeding-related crashes in 2013.
Speeding Education and Enforcement Efforts
CDOT’s Speed Enforcement and Control Program aims to reduce speed-related crashes
through “concentrated, repetitive, and high-visibility” speed enforcement. In 2009 and 2010, the
program provided funds to the Denver Police Department to focus on speeding violations on the
I-25 and I-70 corridors. For more information on CDOT Speed Enforcement program activities
see the Annual Report for the CDOT Office of Transportation Safety and Traffic Engineering10.
Many speeding-related crashes occur due to high speed differentials between vehicles on a
roadway. Achieving speed harmonization (i.e., all vehicles traveling at roughly the same speed)
greatly enhances roadway safety. In August 2011, CDOT began implementing 55 mph pacing
vehicles on the I-70 Mountain corridor to reduce crashes and congestion during peak travel times.
10 https://www.codot.gov/safety/safety-data-sources-information/transportation-safety-and-traffic-engineering-annual-report
25%
39%
37%
Freeway/Ramp Arterial Local
Draft for discussion
39
Figure 22
Figure 22. Crash Events Involving Speeding (2013)

Draft for discussion
40
C. Red Light Running
From 2011 to 2013, an average of 2,500 red light running (RLR) crashes
occurred per year in the Denver region. These crashes resulted in an
average of 7 fatalities and 130 serious injuries per year. In 2011,
according to the Insurance Institute for Highway Safety, about half of the
red-light running deaths in the United States were people other than the
red-light runner.
Figure 23 shows the locations of red light running crash locations in 2013.
Red Light Running Crash Mitigation
RLR crash mitigation is divided into two categories;
engineering treatments to reduce unintentional RLR and
enforcement activity, which reduces intentional RLR. In
regard to engineering countermeasures, some common
treatments include:
Improved signal visibility (e.g., placement of a
signal head over each through lane),
Installation of signal ahead warning signs,
Adjustment of the yellow and all-red intervals, and
Signal upgrades to allow for dilemma zone
preemption (i.e., extending the green when a
vehicle is detected in the dilemma zone).
Increased enforcement, via red light running cameras, is commonly used to reduce intentional
RLR. There are about 50 intersections in the Denver region with RLR cameras.

Draft for discussion
41
Figure 23
Figure 23. Crash Events Involving Red-Light Running (2013)
Draft for discussion
42
7. IDENTIFICATION OF HIGH CRASH LOCATIONS
A. Freeway Segment Crashes
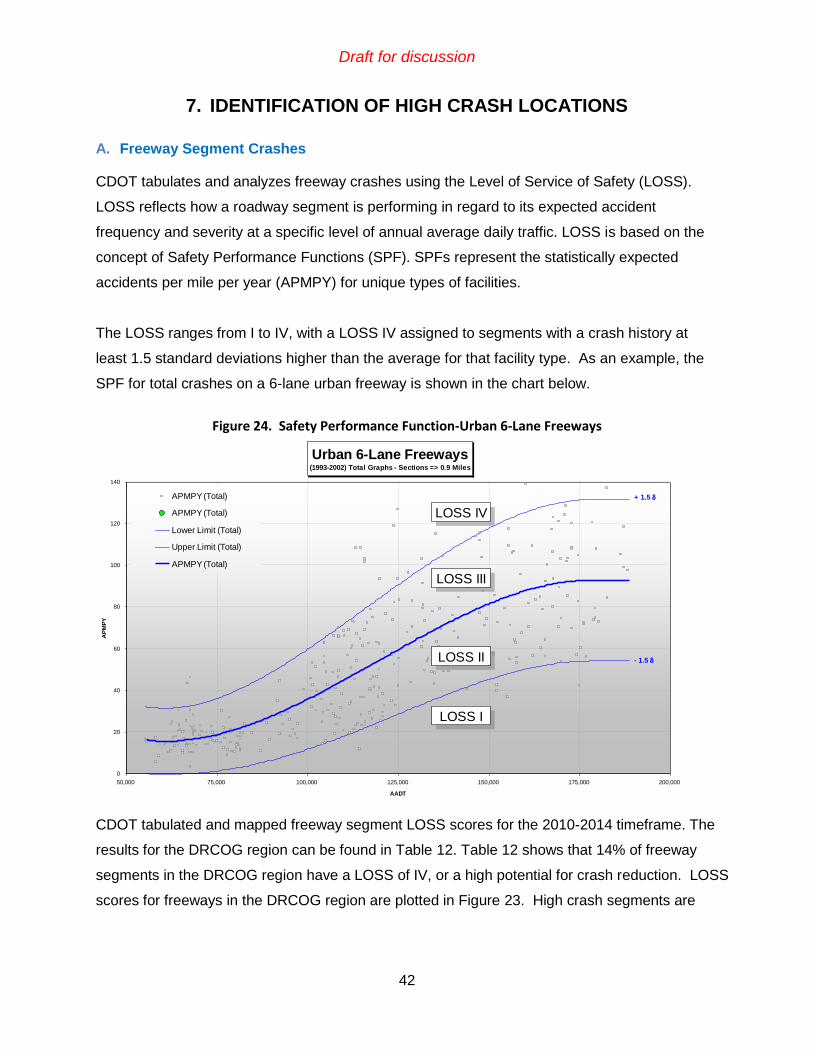
CDOT tabulates and analyzes freeway crashes using the Level of Service of Safety (LOSS).
LOSS reflects how a roadway segment is performing in regard to its expected accident
frequency and severity at a specific level of annual average daily traffic. LOSS is based on the
concept of Safety Performance Functions (SPF). SPFs represent the statistically expected
accidents per mile per year (APMPY) for unique types of facilities.
The LOSS ranges from I to IV, with a LOSS IV assigned to segments with a crash history at
least 1.5 standard deviations higher than the average for that facility type. As an example, the
SPF for total crashes on a 6-lane urban freeway is shown in the chart below.
Figure 24. Safety Performance Function-Urban 6-Lane Freeways
CDOT tabulated and mapped freeway segment LOSS scores for the 2010-2014 timeframe. The
results for the DRCOG region can be found in Table 12. Table 12 shows that 14% of freeway
segments in the DRCOG region have a LOSS of IV, or a high potential for crash reduction. LOSS
scores for freeways in the DRCOG region are plotted in Figure 23. High crash segments are
Urban 6-Lane Freeways(1993-2002) Total Graphs - Sections => 0.9 Miles
0
20
40
60
80
100
120
140
50,000 75,000 100,000 125,000 150,000 175,000 200,000
AADT
AP
MP
Y
APMPY (Total)
APMPY (Total)
Lower Limit (Total)
Upper Limit (Total)
APMPY (Total)
+ 1.5 d
- 1.5 d
LOSS IV
LOSS III
LOSS II
LOSS I

Draft for discussion
43
scattered throughout the DRCOG region, with the highest concentration of segments located in the
central part of the region along I-25, I-70 and US-6.
Table 12. Level of Service of Safety on DRCOG Freeway Segments
Level of Service of Safety Score
I (fewer crashes than expected)
II III IV
(more crashes than expected)
DRCOG Freeway Segments
443 (15%) 1,369 (45%) 801 (26%) 420 (14%)
Figure 25
Figure 25. Freeway Segment Level of Service of Safety (2010-2014)

Draft for discussion
44
8. OTHER SAFETY EFFORTS
A. Engineering Safer Roadways
A large part of roadway safety relies on proper signage, roadway design, maintenance, and
vehicle design. The American Association for State and Highway Transportation Officials
(AASHTO) publishes several manuals, which provide roadway and roadside design criteria
based on the functional classification and traffic volume on the facility. In addition to appropriate
design, regular maintenance, resurfacing, and restriping are needed to maintain roadway safety.
Proper communication with the roadway user, via signage and signals, is also critical to roadway
safety. The MUTCD governs the design and placement of traffic signs, signals, and pavement
markings nationwide. The purpose of the MUTCD is to ensure uniformity of traffic control devices,
as user understanding is greatly enhanced when messages are displayed in the same way at all
times.
Also, advancements in vehicle technology can help prevent crashes. Vehicle technology is
advancing quickly; several technologies in testing include traffic sign recognition (e.g.,
recognition of speed limit signs), automatic braking when a collision is sensed, and pedestrian
protection systems, which lessen injuries to a pedestrian when hit by a vehicle. Autonomous
vehicles and connected vehicle technology are also on the horizon.
B. Emergency Response and Crash Clearance
Crashes on freeways and major roads during peak hours have a major impact on traffic
congestion. For this reason, emergency response time and removal of an incident from the
traffic stream is very important. CDOT has several programs underway, which aid in faster
clearance of the roadway following a traffic crash. These programs include:
CDOT’s Mile High Courtesy Patrol provides assistance for passenger cars and other
small vehicles when stalled or involved in minor traffic crashes. The program has been
in place since 1992 and patrols key areas of I-25, I-70, I-225, and US-6 during rush
hours. The program provides services including flat tire repair, fueling, jump starts,
short-distance towing, accident scene protection, and minor mechanical assistance.
The Courtesy Patrol also serves the I-70 mountain corridor during weekends and
holidays from November to March.

Draft for discussion
45
CDOT’s Heavy Tow Quick Clearance program11 clears stalled commercial vehicles from
the travel lanes on I-70 between Floyd Hill and Vail Pass. The program operates on
weekends and holidays between November and April. The average clearance time for
the 2010/2011 winter season was 22 minutes. Before the program’s implementation, in
late 2008, the average clearance time was 50 minutes.
11 https://www.codot.gov/travel/winter-driving/CommercialVehicles.html

Draft for discussion
46
Source: NHTSA
9. SUMMARY OF FINDINGS
This report provides benchmark crash statistics for the Denver region and aims to increase
awareness among planners, engineers, and elected officials as they contemplate safety issues
in their communities. Some of the key findings of safety conditions in the Denver region are as
follows:
The overall crash rate decreased between 2001 and 2013.
The number of annual traffic fatalities in the region has increased since 2009.
Although the number of annual traffic fatalities decreased between 2001 and 2009, the number of annual fatalities has since increased 49 percent.
Young male drivers are involved in more crashes. Young male drivers between the ages of 15 and 34 are involved in disproportionately more crashes – in particular fatal crashes.
Pedestrians are particularly vulnerable transportation system users. Between 2011 and 2013 pedestrians accounted for 22 percent of traffic fatalities.
Motorcyclists make up an increasing proportion of all traffic fatalities.
Motorcyclists made up 14 percent of traffic fatalities in 2000, increasing to 23 percent in 2015.
Fortunately, many crashes can be prevented. As mentioned earlier, CDOT estimates 85 percent
of crashes are due to improper driver behavior, while only 15 percent of crashes occur due to
conditions out of the driver’s control. However, transportation safety is multidisciplinary in nature,
and involves the effort of many entities, including all roadway users, educators, law enforcement,
tow truck operations, emergency medical response professionals, and government agencies, to
name a few.