report on nutrient losses and gains factors used in ... · factors used in european food...
TRANSCRIPT

Report on Nutrient Losses and Gains Factors used in European Food Composition Databases
Workpackage 1.5 Standards Development
This work was completed on behalf of the EuroFIR Consortium and funded under the EU 6th Frame-work Food Quality and Safety Programme. Project contract No: FOOD-CT-2005-513944

2
EUROPEAN FOOD INFORMATION RESOURCE NETWORK (EuroFIR) Workpackage1.5 Standards Development Report on Nutrient Losses and Gains Factors used in European Food Composition Databases D 1.5.5 – NLG-Factors – Inventory Authors: Bell, S.*, Becker, W., Vásquez-Caicedo, A. L., Hartmann, B. M., Møller, A., Butriss, J. *Corresponding author: [email protected]
Federal Research Centre for Nutrition and Food (BfEL), Location Karlsruhe, Germany Prepared: April 2006

3
Summary Several efforts have been made at European level to include the energy and nutritional composition of cooked and prepared foods in food composition databases. This kind of data is needed to assess the nutritional status of the population, since a large amount of the food consumed is cooked or prepared. Some databases already comprise nutritional data acquired by the food manufacturing industry. The knowledge about nutrient losses and gains factors (NLG-factors) can also be used to calculate missing values of these data. Analysing composite foods is expensive and time consuming. Nutritional values of these dishes are therefore calculated on the basis of data of individual ingredients. For this rea-son, NLG-factors, including nutrient retention and yield factors (fat/water) must be pre-cisely known. The revision of these factors, which are applied in recipe calculations, is presented in this report. The report also gives a short overview of the efforts made in the field of NLG-factors at European level in the past. Furthermore, the aspects of applying analysed or calculated data for the calculation of nutrient content in prepared foods are discussed and recommendations about how to handle with these data are presented. The aim of this work is to be able to harmonize the data found in European food composi-tion databases (FCDB) from partners involved in EuroFIR (European Food Information Resource), Network of Excellence. Key words: Nutrient losses and gains factors, weight yield, nutrient retention, recipe calcu-lation, analysed data, calculated data.

4
Contents 1. The Subtask 6 – Nutrient losses and gains factors 1.1 Background 5 1.2 Objective 6 1.3 Method 6 2. Current status of NLG-factors in food composition databases 7 2.1 Information collected in Workpackage 2.2 (Composite, Processed and Novel Foods) 8 2.2 The applied systems 10 2.2.1 Current status 10 2.2.2 Bognár 11 2.2.3 McCance & Widdowson 12 2.2.4 NIH (INSA) 13 2.2.5 United States Department of Agriculture (USDA) 13 2.3 Availability of NLG-factors for different nutrients 14 3. Overview of applied nutrient retention factors (including Tabular Data Representation) 15 4. Yield factor (weight losses and gains) 21 5. Discussion and plans for the future 22 References 23 Appendix 1. Description of cooking methods (Bognár 2002) 25 Appendix 2. List of partners, who contributed to this inventory in Workpackage 1.5 27 Appendix 3. Percentage of nutrient retention (nutrient retention factors) 28 Appendix 4. Percentage of weight change (yield factors) 64
5
1. The Subtask 6 – Nutrient losses and gains factors 1.1 Background The revision of nutrient losses and gains factors (NLG-factors), including nutrient retention and yield factors (fat/water), applied in recipe calculations, should be carried out to harmo-nize the data found in European food composition databases (FCDB) from partners in-volved in EuroFIR (European Food Information Resource), Network of Excellence. Two main types of factors are needed: yield, weight yield or weight change factors and nutrient retention factors.1 ‘Nutrient losses and gains’ cover the whole process of food preparation, covering both the nutrient retention and the yield factors. The nutrient retention factor is the term used for the absolute amount of nutrient retained in the food after preparation in relation to the absolute amount of nutrient present in the food before preparation. The yield factor is the term used for what is retained in weight of food or dish after prepara-tion, processing or other treatment in relation to the absolute weight of the food before preparation. This may include changes in water or fat content. An inventory of the currently used factors is the first step to gain some insight about them. Values should be compared and calculations standardized. Several efforts have been made in the field of NLG-factors at European level. Within the scope of the FLAIR Eurofoods-Enfant Project, the work on nutrient losses and gains fac-tors was supported. Bergström at the Nutrition Division of the National Food Administra-tion, Sweden, has made a great effort in compiling, organizing and publishing the docu-ment “Nutrient Losses and Gains in the Preparation of Foods”. The aim of the project was to collect data related to nutrient losses and gains in the preparation of foods with a view to recommend factors for use with the calculation of the nutrient content of foods and reci-pes2. The great work from Bognár (2002)3 describes average retention of food constituents and weight yield by cooking of foods and dishes including NLG-factors tables and examples for conversion of recipe and for estimation of nutrient contents in dishes. Detailed description of nutrient content calculation by different cooking methods was pub-lished by Bognár (1988)4 and later by Bognár and Piekarski (2000)5. A further significant effort was made by Martins at the National Health Institute, Portugal.6 The aim of the project was the evaluation of the composition of Portuguese cooked dishes, due to limited analytical information available on it. The data obtained should be included in a food composition database. The focus of this report has mainly been retention factors. 1 L. Bergström (1994), Rapport 32/94: Nutrient Losses and Gains in the Preparation of Foods. 2 See 1. 3 A. Bognár (2002). Tables on weight yield of food and retention factors of food constituents for the calculation of nutrient composition of cooked foods (dishes). 4 A. Bognár (1988), Nutrient losses of foods during preparation at private household. AID – Consumer Service, special Edition, Bonn/Germany. 5 A. Bognár, J. Piekaski (2000). Guidelines for Recipe Information and Calculation of Nutrient Composition of Prepared Foods (dishes). 6 I. Martins (1998), Evaluation of the composition of Portuguese cooked foods.

6
1.2 Objective The aim of this subtask is to collate the most current information available about the cur-rently used yield and nutrient retention factors at European level, in order to be able to compare and harmonize them.
1.3 Method In order to obtain quality data and adequately compare these factors, some background information about the calculation of these factors is required. Therefore, EuroFIR partners were asked to provide the applied NLG-factors with the corresponding documentation of the data origin (literature data, analysed data, etc). All partners of Workpackage 1.5 and all food composition database compilers answered and contributed to the inventory. The calculation methods, for which the factors are applied are being investigated in Work-package 2.2 (Composite, Processed and Novel Foods). Since both issues are strongly connected to each other, results of the two work packages have been exchanged.

7
2. Current status of NLG-factors in food composition databases Table 1: Current status of NLG-factors in food composition databases
EuroFIR Partner Number
Institution Institution Use of Yield and nutri-ent retention Factors
Data available
Documentation available in English
1 01 IFR Institute of Food Research
yes yes yes
2 02 GUT Graz University of Technology
no -- --
3 03 RUG Ghent University, Belgium
no no --
4 06 NCI National Centre of Hygiene, Bulgaria
no, only for vit. C
no --
5 07 DFVF Danish Institute for Food and Veteri-nary Research
yes yes no
6 08 KTL National Public Health Institute, Finland
yes yes yes
7 10 AFSSA Agence Française de Sécurité Sani-taire des Aliments
yes yes yes
8 11 ICETEC Iðntæknistofnun / IceTec
yes yes yes
9 12 BfEL Federal Research Centre for Nutrition and Food, Ger-many
yes yes yes
10 15 NKUA National and Kapo-distrian University of Athens
no -- --
11 17 UCC University College Cork
yes yes yes
12 18 BGU Ben-Gurion Univer-sity of the Negev, Israel
yes yes yes. USDA documentation
13 20 CSPO Centro per lo Stu-dio e la Prevenzio-ne Oncologia, Italy
Only yield factors yes (IN-RAN factors)
--
14 21 WUR Wageningen Uni-versity
yes no --
15 22 UiO University of Oslo yes yes yes 16 23 NFNI National Food and
Nutrition Institute, Poland
yes yes yes
17 24 NHI (INSA) National Institute of Health (INSA), Portugal
yes yes yes
18 26 CESNID Centre for Superior Studies on Nutrition & Dietetics, Spain
yes yes yes
19 28 FRI-SK Food Research Institute, Slowak Republic
yes yes yes
20 29 NFA Swedish National Food Administrati-on
yes yes yes

8
Information has been collected from 20 countries of which 15 confirmed that they are using the factors. One country doesn’t provide information in English. 2.1 Information collected in workpackage 2.2 (Composite, Processed and Novel Foods) Table 2: Variation in the application of yield and nutrient retention factors in food composition databases Home-made
dishes Industrial composite foods
Yes No Yes No Do you have ingredient type information in the database?
14 3 7 9
Do you have quantities of ingredients in the database?
14 3 4 12
Do you produce nutrient values by recipe calculation?
14 3 11 5
Yield factors used: 1. for water 12 2. for water and fat 4
Retention factors used: 1. Water-soluble vitamins 2 2. Water- and fat-soluble vitamins 10
Report on 17 countries, which answered to the questionnaire. Nutrient retention factors were used for vitamins (for water-soluble in fourteen databases, for fat-soluble and water-soluble in ten food composition databases) and in six food composition databases for min-erals and trace elements (Table 3).

9
Table 3: Country specific description for nutrient retention factors in composite foods Institution Retention factors used in
calculations Describe your retention factors more specifically
Information collected for ingredients (of industrial composite foods)
1 AFSSA For water-soluble vitamins Dependent on nutrient type and treatment and food group
List of ingredients, Order of ingredients by weight
2 BfEL For water-soluble vitamins, fat soluble vitamins, miner-als, trace elements and macronutrients
General retention factor. Dependent on nutrient type, treatment and food group
Not relevant
3 CESNID For water-soluble vitamins, For fat soluble vitamins, Minerals and trace ele-ments
Other Not collected
4 CSPO Not relevant Not relevant Not relevant 5 DFVF For water-soluble vitamins,
For fat soluble vitamins, Minerals and trace ele-ments, Other
Dependent on nutrient type and preparation type and food
List of ingredients, Order of ingredients by weight
6 FRI For water-soluble vitamins, For fat soluble vitamins, Minerals and trace ele-ments, Other
Dependent on nutrient type and treatment and food group
List of ingredients
7 ICETEC For water-soluble vitamins, For fat soluble vitamins, Minerals and trace ele-ments
Dependent on nutrient type and treatment and food
Not collected
8 IFR For water-soluble vitamins, For fat soluble vitamins
Dependent on nutrient type and treatment and food
List of ingredients, Order of ingredients by weight
9 INRAN Not relevant Not relevant List of ingredients 10 INSA For water-soluble vitamins,
For fat soluble vitamins, Minerals and trace ele-ments, Other
Dependent on nutrient type and treatment and food group
Not collected
11 KTL For water-soluble vitamins, For fat soluble vitamins
Dependent on nutrient type and treatment and food
List of ingredients, Order of ingredients by weight
12 NFA For water-soluble vitamins General retention factor (heat treatment in general)
Not collected
13 NKUA No retention factors No retention factors used Not relevant 14 RUG/
NUBEL No retention factors No retention factors used Not collected
15 UCC For water-soluble vitamins, For fat soluble vitamins
Dependent on nutrient type and treatment and food group
Not collected
16 UiO For water-soluble vitamins, For fat soluble vitamins, Other (Na)
Other (Dependent on nutri-ent and food group)
List of ingredients for a few, Not collected for most
17 WUR/ NEVO
Other (Retention factors for each mineral/vitamin can be applied)
Other (Not applied due to uncertainty about which factors to use)
Not collected

10
2.2 The applied systems 2.2.1 Current status As presented in tables 1 and 2 retention factors are applied in 14 European food composi-tion databases. Among the countries, applying the retention factors in their food composition databases, not many differences in the systems were found. Furthermore, the used factors derive only from few well-known systems. For example Icetec also applies the factors used in the Danish food composition database. Therefore many countries are already using the same factors, which is an advantage towards data harmonisation. The table below presents the different systems and the countries, which apply them in their food composition databases and consequently in their recipe calculation procedures. Table 4: Systems applied in European food composition databases and their recipe calcu-lations. Institution Bognár McCance &
Widdow-son
USDA Denmark Bergström Other/Own system
IFR x GUT RUG/NUBEL NCI X, vitamin C DFVF x KTL x AFSSA x ICETEC x BfEL x NKUA UCC x BGU x CSPO X, for yield WUR x UiO x NFNI x NIH (INSA) x CESNID x FRI-SK x NFA x Total (n = 20)
4 3 1 2 3 4
BfEL, NIH (INSA) and FRI-SK apply the factors from Bognár. NIH (INSA) additionally uses the publications of Gall et al.7 and Batista et al.8 as reference for the retention factors. IFR and UCC apply the factors from McCance & Widdowson, 6th Edition, while CESNID applies the factors from the 5th edition. The factors used in the 6th edition were different to those used in earlier editions. The 6th edition applied retention factors to each ingredient in
7 Gall et al (1983) » Gall, KL; Otwell, WS; Koburger, JA; Appledorth, M (1983) - Effects of four Cooking Methods on the Proximate Composition of Fish Fillets. Journal Food Science, 48, p. 1068-1074. 8 Batista et al (1993) » Batista, I; Bandarra, NM; (1993) - Influence of four Cooking Methods on the Chemical Composi-tion of different fish species. Portuguese Magazine of Nutrition. Vol. 5 (3), p. 5-14.

11
a recipe (excluding minor ingredients such as herbs, spices, salt) but earlier editions ap-plied retention factors to the whole recipe based on the major ingredient. CIQUAL, the food composition database from AFSSA does use retention factors in some recipe calculations. However, for simplicity reasons and to avoid introducing more errors, nutrient data on equivalent cooked ingredients (e.g. cooked potatoes, cooked ground meat) is sought for and is combined to estimate the composition of a cooked recipe (e.g. hachis parmentier). When this is not possible, then retention factors from Bognár are used. BGU applies the factors from USDA and DFVF and ICETEC apply the Danish factors. NFA applies own factors, which were also published by Bergström9. KTL and UiO also apply the factors collected by Bergström. Additionally UiO uses a small number of the cal-culation factors for vitamin loss during cooking, which are derived from unpublished Nor-wegian tests. NFNI applies own calculated factors, which are derived from studies regarding the effect of culinary treatment techniques on the nutritional value of fish, chicken and turkey dishes.10 While some countries apply retention factors for different food groups (e.g. vegetables, cereals), nutrients and cooking methods (e.g. boiling, frying), other countries only use sin-gle factors. For example, NCI uses only correction factors for vitamin C in recipe calcula-tions according to scientific literature.
WUR uses retention factors only on a very limited basis for the calculation of a few bakery recipes. Only the loss of water during the heating process (no vitamins or minerals) is cal-culated. There is the technical possibility to use loss or gain factors for each separate nu-trient for all foods, but due to the uncertainty of which factor to use for a specific food, the work with these factors did not really start. Furthermore an inventory of the appropriate factors is being done. GUT, NKUA and RUG/NUBEL do not apply the retention factors.
2.2.2 Bognár The currently used retention factors from BfEL, FIR-SK and NIH/INSA derive from the work of Bognár from 2002.11 This study is one of several efforts to update and harmonise the food composition databases and to include the nutrient composition of cooked and prepared foods. Retention data of food constituents (nutrients) and own analytical results were checked by using common statistical methods to evaluate the relations between re-tention and the kind of food as a function of the cooking conditions. Retention factors of food constituents by cooking of dishes consisting of several ingredi-ents have been found to be about the same as by cooking of the single food typical of the dish. Retention factors by cooking of individual food items were, therefore, transferred to recipes (dishes) containing several ingredients. However, the cooking method can influ-ence nutrient retention considerably. Therefore, retention factors typical for the cooking method are used. For boiling, steaming and frying, nutrient retention with or without con-
9 L. Bergström (1994), Rapport 32/94: Nutrient Losses and Gains in the Preparation of Foods. 10 Beata Przygoda et al. (2003). The effect of culinary treatment techniques on the nutritional value of chicken and turkey dishes. National Food and Nutrition Institute, Warsaw, Poland. Hanna Kunachowicz et al. (2003). The effect of culinary treatment techniques on the nutritional value of fish dishes. National Food and Nutrition Institute, Warsaw, Poland. 11 Bognár, A. (2002). Tables on weight yield of food and retention factors of food constituents for the calculation of nutri-ent composition of cooked foods (dishes). Ed.: BFE, Karlsruhe.

12
sideration of the boiling medium and dripping juice may also be of importance. The data on the retention of food constituents during cooking of individual foods and dishes are incom-plete. It seemed advisable, therefore, to create average nutrient retention factors for typical food categories. This was reasonable only, however, if the nutrient retention factors by cooking of single foods or dishes belonging to a category were about the same size. Be-cause of the standardisation of the calculation method of nutrient composition of dishes, no variation of the retention factors of food constituents were given in the enclosed tables. Cooking of dishes, especially of breaded meat and fish, by using fat as the heating me-dium (e.g. frying in pan, deep frying) can lead to fat uptake in food. Quantities of fat uptake are, therefore, included in the tables. Factors for absorption of cooking salt during boiling and steaming of foodstuffs are also given. The report includes formulae used for calculation and tables of average retention factors of food constituents after cooking of about 39 typical food (dish) categories. The actual reten-tion factors for protein, fat, carbohydrates, sodium chloride, sodium, potassium, magne-sium, calcium, phosphorus and iron are statistically approved values. For some other food constituents, in particular niacin, biotin, folate, pantothenic acid, vitamin E, K and B12, fatty acids, amino acids, cholesterol, the retention data available are incomplete and should be regarded as crude estimates. For any other food constituents, for which at present no data are available, a retention factor of 1.0 is preliminarily recommended. Since cooking procedures of foods, as far as temperature and time are concerned, are more or less similar in all European countries, the retention factors in this study may be used as basic data to calculate the nutrient composition of dishes. This would also consid-erably improve the compatibility of the different nutrient databases for cooked foods and dishes. It is also of great importance that the data set for nutrient retention factors be fur-ther developed and extended to other countries.12 Further information about recipe calculation procedure in the German food composition database (BLS) is described in the proposal for the harmonisation of recipe calculation procedures, which was developed in Workpackage 2.2. 2.2.3 McCance & Widdowson Vitamin loss estimation in foods and recipe calculations are described in the 6th edition of The Composition of Foods:13 The losses of heat and water labile vitamins in cooked recipe dishes were estimated by assigning a set of factors for percentage vitamin losses to each ingredient in the recipe, according to its food group and the method of cooking. Vitamin losses were not assigned to minor ingredients such as herbs, spices and salt. The percentage vitamin losses used for each food group and cooking method are shown in section 3 of the referred publication. This is a change from the approach used in previous editions, in which vitamin losses were applied to the whole recipe dish according to the major ingredient. Vitamin losses will vary according to the length, temperature and method of cooking, and the nature of the ingredi-ents. For more accurate information the foods or composite dish should be analysed. 12 Bognár, A. (2002). Tables on weight yield of food and retention factors of food constituents for the calculation of nutri-ent composition of cooked foods (dishes). Ed.: BFE, Karlsruhe, (2002). Federal Research Centre for Nutrition, Institute of Chemistry and Biology. 13 McCance & Widdowson (2002). The Composition of Foods, Sixth summary edition. Cambridge: Royal Society of Chemistry. Food Standards Agency, UK.
13
An example of the method of calculating the vitamin content in a cooked product taking into account the percentage vitamin loss is given below. Vitamin content of cooked dish per 100g = Vitamin content of uncooked dish/100g – vitamin content of uncooked dish x % vitamin loss on cooking
100 For example, the thiamin content of brown bread, average, is 0.22mg per 100g and the percentage thiamin loss on toasting bread is 15%. Therefore the thiamin content of toasted brown bread calculated is
= 0.22 – (0.22 x15) = 0.19mg/100g 100
2.2.4 NIH (INSA) For the calculation of the nutrient content (TN) per 100 g food in cooked foods the follow-ing equation was used:
TN (in cooked food) = TN in raw food x retention factor x 100 Weight change* * Weight change (%) = Weight of edible portion cooked food x 100 14
Weight of raw food 2.2.5 United States Department of Agriculture (USDA) USDA Table of Nutrient Retention Factors, Release 5 (2003), implemented in Release 18 of the database: The resulting values quantify the nutrient content retained in a food after nutrient losses due to heating or other food preparations. The data set contains the factors for calculating retention of 25 components including vitamins, minerals and alcohol during food preparation.15 When nutrient data for prepared or cooked products were unavailable or incomplete in the database, nutrient values were calculated from comparable raw items or by recipe. When values are calculated in a recipe or from the raw item, appropriate nutrient retention (U.S. Department of Agriculture 2003) and yield factors (Matthews and Garrison, 1975) are ap-plied. To obtain the content of nutrient per 100 g of cooked food, the nutrient content per 100 g of raw food is multiplied by the nutrient retention factor and, when appropriate, adjust-ments are made for fat and moisture gains and losses. 14 Paul and Southgate (1978) 15 U.S. Department of Agriculture, Agricultural Research Service. 2005. USDA National Nutrient Database for Standard Reference, Release 18. Nutrient Data Laboratory Home Page, http://www.nal.usda.gov/fnic/foodcomp or http://www.nal.usda.gov/fnic/foodcomp/Data/

14
Nutrient retention factors are based on data from USDA research contracts, recent re-search reported in the literature, and USDA publications. Most retention factors were cal-culated by the True Retention Method (%TR) (Murphy et al. 1975). This method, as shown below, accounts for the loss of solids from foods that occurs during preparation and cooking.16
%TR = (Nc*Gc) / (Nr*Gr) * 100 Where: Nc = nutrient content per g of cooked food, Gc = g of cooked food, Nr = nutrient content per g of raw food, and Gr = g of food before cooking.
2.3 Availability of retention factors for different nutrients Table 5: Availability of retention factors for different nutrients Bognár Denmark McCance
& Widdowson USDA
(Service Release 18)Vitamin A x x x x Vitamin E x x x Vitamin C x x x x Thiamin x x x x Riboflavin x x x x Niacin x x x x Vitamin B6 x x x x Vitamin B12 x x x x Pantothenic acid x x Vitamin D x x x Beta-Carotene x x x Folate x x x x Sodium, Na x x x Potassium, K x x x Calcium, Ca x x x Magnesium, Mg x x x Phosphor, P x x x Iron, Fe x x x Protein x Total (n = 19) All 15 13 15
The availability of retention factors differs from system to system. For example in McCance & Widdowson, 6th Edition, retention factors are available only for vitamins. In other sys-tems like Bognár, USDA and the Danish one, retention factors are also available for min-eral substances, trace elements and macronutrients.
16 Composition of Foods. Raw, Processed, Prepared. USDA National Nutrient Database for Standard Reference, Re-lease 18. 2005.

15
3. Overview of applied nutrient retention factors Nutrient (or other food component) losses in cooking are normally reported as the per-centage remaining and hence are commonly referred to as nutrient retention factors. They may result from the degradation or leaching of components but normally are treated only as loss of the component itself, not as contributing to the overall weight loss of the dish.17 Nutrient retention factors were already collected and summarised in the past. Considering this, the table of nutrient retention ranges for vitamins prepared by Bergström18 was used as a model, then updated and completed. Information about retention factors for food composition databases in Denmark, Germany, Russia, Sweden, United Kingdom and United States was available in Bergströms work. Complementary information about France, Iceland, Poland, Portugal and Slovak Republic has been added. Apart from vitamins, factors for mineral substances, trace elements, fat, carbohydrates and protein were also available. The results are tabulated in tables 7 and 8. As showed in table 5 the availability of retention factors for nutrients differs between the applied systems from the countries. Factors for protein, fat, carbohydrates, dietary fibre, minerals (ash)19, sodium chloride20 and amino acids are also available in the tables from Bognár. Data for protein from NFNI is also available. The food groups and preparation or cooking methods in the tables 7 and 8 were selected with the aim of covering all food items and food groups, as well as representative and standard cooking methods. In some Food Composition Databases the use of retention factors is further differentiated according to the different cooking methods apart from boil-ing, frying and baking. Descriptions of further cooking methods are presented in appendix 1. The values are based on the food group of the ingredient in a recipe and not for individ-ual ingredients (e.g. vegetables instead of carrot or cucumber). Since the retention factors differ in the different systems, they are presented as retention ranges in the tables 7 and 8, e.g. vitamin A, vegetables, boiling: 85-95%. Reasons for the differences are among other things the different cooking methods, cook-ing time and cooking temperature applied for the determination of the retention factors. See Fig.1.
17 I. D. Unwin (2000), EUROFOODS Guidelines for Recipe Information Management. 18 L. Bergström (1994), Rapport 32/94: Nutrient Losses and Gains in the Preparation of Foods. 19 Without cooking salt 20 Related to the quantity of cooking salt added to the food or cooking water

16
Figure 1: Loss of vitamin C in relation to time and temperature during steaming of red cabbage 21:
Further aspects, which can influence nutrient changes in the foods, are e.g. food quality (part of plant or animal, physical state), effect of oxygen and light, cooking utensils, lid or foil covering food during cooking and final internal temperature, e.g. in cooked meat. A precondition for data harmonisation would be to standardise these cooking aspects in order to reach the same or at least similar retention factors, and to be able to compare them. This would be necessary in the case of new or further analysis of the food. On the other hand, the adoption of already available accurate yield and nutrient retention factors is also a possibility, considering that the analysis of retention data of food nutrients is time-consuming and costly. Furthermore, there is another difference by the determination of the nutrient retention fac-tors. The Bognár system, for example, considers additionally the yield factor in the for-mula. Figure 2 22:
Where: a(j, k, p) retention factor of nutrient j in dish k prepared by method p Z(j, k, p) content of nutrient j in 100 g edible part of dish k prepared by method p in
gram, milligram or microgram (analysed) X(j, k, p) content of nutrient j in 100 g edible part of ingredients for preparation of dish k
in gram, milligram or microgram (analysed) e(k, p) weight yield factor of dish k, edible part, prepared by method p (see formulae 2
in paragraph 1) 21 A. Bognár (1988), Nutrient losses of foods during preparation at private household. AID – Consumer Service, special Edition. 22 A. Bognár (2002), Tables on weight yield of food and retention factors of food constituents for the calculation of nutri-ent composition of cooked foods (dishes).

17
When for example meat is fried, a water loss and consequently a weight loss occur. Since by losing water, the concentration of a nutrient in the meat rises, it means that the content of a nutrient after frying is higher than before. For this reason the yield factor should be considered in the determination of nutrient retention factors by cooking of dishes. Experimental results have shown that discrepancies between chemical analyses and computerized programs for the calculation of nutrients content in prepared foods are gen-erally not significant. A study from 2003 of traditional Greek recipes showed that the re-sults of the computed macronutrients and energy of foods and recipes, compared to the chemically determined macronutrients and energy, had a satisfactory degree of agree-ment. 23 Further studies showed that a maximum of correspondence is achieved when calculations are based on the following data:
Data of nutrient content per 100 g edible portion of raw ingredients Quantity of ingredients for preparation of 100 g edible portion of cooked food (dish)
in the ready-to-serve condition Retention factors of food constituents during cooking.24
Table 6: Nutrient composition of selected dishes – comparison between analytical and cal-culated results25:
In conclusion both analysed and calculated data can be applied for the recipe calculation in food composition databases; however, analysed data should be favoured. Information about the nutrient content of foods is needed for the use of recipe calculation in food composition databases. When this information is not available for a specific food item, it is recommended to use the nutrient content values from a food item with similar nutritional composition. An estimated value is better than no value.
23 E. Vasilopoulou et al. (2003). Journal of Food Composition and Analysis. 24 A. Bognár (2002). Tables on weight yield of food and retention factors of food constituents for the calculation of nutri-ent composition of cooked foods (dishes). 25 Bognár, A., Piekaski, J. (2000). Guidelines for Recipe Information and Calculation of Nutrient Composition of Prepared Foods (dishes). Journal of Food Composition and Analysis.

18
For any other food constituents, for which at present no data are available, a retention factor of 1.0 is preliminarily recommended.26 Whatever approach is chosen, accurate documentation about analysis and calculation methods is essential. After building the new tables 7 and 8 with the data from the different countries, the current data was compared with the table prepared by Bergström. Some variations were estab-lished between the factors in tables 7 and 8 and in Bergström ones. However the factors do not vary strongly from each other. Few major variations were noted e.g. for vitamin A by boiling meat and poultry. In this case the nutrient retention factors presented by Bergström were higher and the range was smaller than the factors presented in tables 7 and 8. The nutrient retention factors presented in tables 7 and 8 in this document represent the currently applied factors in European food composition databases from EuroFIR partners. These factors should be classified as a discussion basis for a future harmonisation of the data in recipe calculation procedures at European level. A suggestion for further ap-proaches can be found in section 5 of this document. Detailed information about the used nutrient retention factors in European food composi-tion databases is given in appendix 3 of this document.
26 A. Bognár (2002). Tables on weight yield of food and retention factors of food constituents for the calculation of nutri-ent composition of cooked foods (dishes).

Table 8: Retention ranges by vitamins in %, on recipe level. The nutrient retention factors are based on data from the countries that make use of these factors (see section 2.2.1) Food Group Preparation or
cooking methods Vita-
min A Vita-min E
Vita-min C
Thiamin Ribo-flavin
Niacin Vitamin B6
Vita-min B12
Pan-tothenic acid
Vita-min D
Beta-Carote-ne
Boiling 80-95 80-100 50-100 50-85 50-90 60-100 50-90 75-100 60-95 90-100 80-95 Frying 90 100 50-100 70-90 75-100 85-100 60-90 100 80 100 90
Bread, grains, flour, pasta, rice Oven baking/ Baking 90-95 100 50-100 70-85 75-100 85-95 75-90 100 75 100 90-95
Boiling 80-95 80-100 45-90 60-90 60-95 70-95 60-95 60-100 60-90 90-100 80-100 Frying 85-90 100 50-85 70-90 75-95 70-100 60-95 70-100 90 100 85-90
Vegetables
Oven baking/ Baking 90-95 100 50-85 70-90 70-95 70-95 60-95 70-100 85-95 100 80-100 Boiling 80-90 80-100 30-65 50-80 60-90 60-95 60-90 60-100 70-90 90-100 80-90 Frying 90 100 30-85 70-90 60-100 60-85 60-95 100
Vegetables with leaf and steam Oven baking/ Baking 90 100 30-70 60-90 60-95 60-95 60-95 70-100 90 80-90
Boiling 80-100 80-100 25-85 70-80 70-95 60-95 60-95 70-100 70-90 90-100 80-100 Frying 90-100 100 50-80 70-80 70-95 70-95 60-95 80-100 90 100 90-100
Potatoes
Oven baking/ Baking 90-100 100 50-80 70-85 70-95 70-95 60-95 80-100 90 100 90-100 Boiling 75-90 80-100 25-75 65-80 65-90 65-90 60-90 90-100 75-90 90 75-10 Frying 90 100 50-100 70-100 65-100 65-100 60-100 100 100 90
Fruits and berries
Oven baking/ Baking 90 100 50-100 70-100 65-100 65-100 60-100 100 100 90 Boiling 80-100 80-100 50-85 70-100 75-100 85-100 80-90 55-95 90 90-100 80-100 Frying 90-100 80 50-65 70-100 75-100 85-100 75-90 55-95 100
Milk and milk products
Oven baking/ Baking 90-100 80-100 50-70 70-100 75-100 85-100 75-90 55-95 75 100 90-100 Boiling 55-90 75-100 50-85 30-80 70-95 5-900 35-80 50-90 40-90 75-90 55-90 Frying 55-85 55-100 50-85 50-80 45-90 70-100 45-80 65-95 75-90 55-90 55-100
Meat, Poultry
Oven baking/ Baking 75-100 55-100 50-85 45-80 45-95 55-90 45-80 60-95 70-90 55-100 55-100 Boiling 70-90 70-100 50-100 60-90 70-100 70-95 70-100 80-95 70-90 70-90 70-90 Frying 80-100 80-100 50-85 70-85 55-100 80-100 75-90 75-100 80-95 80-100 80-90
Fish, Shellfish
Oven baking/ Baking 80-100 80-100 50-85 70-95 55-100 80-100 80-90 85-90 80-85 80-100 80-90 Boiling 90-100 100 50-100 70-90 75-95 70-100 80-95 80-100 80 95 90-100 Frying 80-100 90-100 50-100 70-95 70-95 85-100 80-95 85-100 80-85 90-100 90-100
Eggs
Oven baking/ Baking 80-100 90-100 50-100 70-95 70-95 85-100 75-95 80-100 75-80 90-100 90-100 Boiling 85 75 50-100 70-100 75-100 85-100 80-100 100 Frying 50-90 20-95 50-100 70-100 75-100 85-100 80-100 100
Margarine, butter, oil
Oven baking/ Baking 85-90 75-95 50-100 70-100 75-100 85-100 80-100 100

20
Table 7: Retention ranges by protein, trace elements and mineral substances in %, on recipe level. The nutrient retention factors are based on data from the countries that make use of these factors (see section 2.2.1) Food Group Preparation or
cooking methods Folate Sodium, Na Potassium,
K Calcium, Ca
Magnsium, Mg
Phosphor, P
Iron, Fe Protein
Boiling 50-80 50-100 55-95 90-100 85-100 90-95 75-95 95 Frying 70 100 100 100 100 100 100 100
Bread, grains, flour, pasta, rice Oven baking/ Baking 50-70 100 100 100 100 100 100 100
Boiling 45-95 45-100 45-100 90-100 60-100 90-100 75-100 90-100 Frying 45-85 100 100 100 100 100 100 95-100
Vegetables
Oven baking/ Baking 50-85 100 100 100 100 100 100 95-100 Boiling 45-95 75-95 50-100 90-100 90-95 90-100 75-100 90-100 Frying 100 100 100 100 100 100
Vegetables with leaf and steam Oven baking/ Baking 50-70 60-100 100 100 100 100 100
Boiling 50-90 60-95 80-100 90-100 90-100 90-100 90-100 95 Frying 50-75 100 100 100 100 100 100 100
Potatoes
Oven baking/ Baking 50-75 100 100 100 100 100 100 100 Boiling 20-70 60-100 60-100 90-100 80-100 80-100 90-100 95 Frying 100 100 100 100 100 100 100 100
Fruits and berries
Oven baking/ Baking 100 100 100 100 100 100 100 100 Boiling 50-90 90-100 90-100 90-100 90-100 90-100 90-100 100 Frying 80 100 100 100 100 100 100 100
Milk and milk prod-ucts Oven baking/ Baking 50-85 100 100 100 100 100 100 95
Boiling 50-95 40-95 50-100 80-100 60-100 60-100 80-100 90-100 Frying 50-95 50-100 60-100 90-100 85-100 85-100 90-100 95-100
Meat
Oven baking/ Baking 50-95 50-100 55-100 80-100 65-100 65-100 95-100 95-100 Boiling 50-85 15-100 75-100 90-100 85-100 85-100 80-100 75-100 Frying 5-100 15-100 85-100 90-100 90-100 90-100 85-100 95-100
Fish
Oven baking/ Baking 50-90 15-100 85-100 100 90-100 90-100 85-100 95-100 Boiling 75-80 95-100 95-100 95-100 95-100 95-100 100 100 Frying 70-80 100 100 100 100 100 100 100
Eggs
Oven baking/ Baking 50-80 100 100 100 100 100 100 100 Boiling 95 95 95 95 95-100 Frying 100 100 100 100 100
Margarine, butter, oil
Oven baking/ Baking 100 100 100 100 100

4. Yield factors (weight losses and gains) The partner institutions IFR, BfEL, UCC, BGU, CSPO, WUR, UiO, NFNI, NIH/INSA, FRI-SK and NFA apply yield factors (weight loss and gain) for recipe calculation procedures in their food composition databases. In the majority of the cases the partners use yield fac-tors from the same source applied for the nutrient retention factors. Similar to the field of nutrient retention factors, a lot of work was already done by Bergström27 summarising data from different countries and their food composition data-bases in the field of yield factors. Since this is a more complicated issue, it will be dis-cussed at a later date. However, the yield factor by cooking is an important aspect for the determination of nutrient retention factors, as shown in section 3 of this document. As opposed to nutrient retention factors, the yield factors are determined for specific dishes (e.g. apple pie or butter cake) and not for composed food groups like vegetables, milk and milk products. A brief overview about the available data for yield factors used in the European food com-position databases is given in the appendix 4 of this document.
27 L. Bergström (1994), Rapport 32/94: Nutrient Losses and Gains in the Preparation of Foods.

22
5. Discussion and plans for the future Information about energy and nutrient composition of dishes and other prepared foods are necessary for the assessment of nutrition surveys, in order to evaluate the population nu-tritional intake. Furthermore, efforts are being made with the aim to make nutritional data accessible for everyone in the world. The most precise method for producing nutrient values of composite foods is to analyse them directly.28 However, the chemical analysis of cooked foods is costly and time con-suming. Experimental results have shown that discrepancies between chemical analyses and computerized programs for the calculation of nutrients content in prepared foods are gen-erally not significant. Nevertheless, some nutrient retention factors, such as vitamin B6 need to be reviewed to avoid generating mistakes in the food composition databases. Further studies showed that a maximum of correspondence is achieved when calculations are based on the following data:
Data of nutrient content per 100 g edible portion of raw ingredients Quantity of ingredients for preparation of 100 g edible portion of cooked food (dish)
in the ready-to-serve condition Retention factors of food constituents during cooking.29
In conclusion both analysed and calculated data can be applied for the recipe calculation in food composition databases, however, analysed data should be favoured. Whatever approach is chosen, accurate documentation about analysis and calculation methods is essential. Regarding the aims of EuroFIR the applied yield and nutrient retention factors from differ-ent partners are showed in this inventory, were no strong differences were observed. Only few different systems are used, therefore, appropriate conditions are given in direction data harmonisation. Plans for the future The yield and nutrient retention factors presented in this document should be classified as the basis for a future harmonisation of the data in recipe calculation procedures at Euro-pean level. Following this overview inventory, a proposal for EuroFIR partners and further users including recommended yield and nutrient retention factors according to cooking methods and food groups will be published soon. The subtask elaboration is being conducted in collaboration with Workpackage 2.2 (Com-posite, Processed and Novel Foods). Thus, the results of subtask 6 in Workpackage 1.5 (this document) and the results of Workpackage 2.2 in the field of recipe calculation pro-cedures will be merged into a further document giving an overview of both topics.
28 H. Greenfield, D.A.T. Southgate (2003), Food Composition Data. FAO, Rome. 29 A. Bognár (2002). Tables on weight yield of food and retention factors of food constituents for the calculation of nutri-ent composition of cooked foods (dishes).

23
References
1 Bergström, L. (1994). Rapport 32/94: Nutrient Losses and Gains in the Preparation of Foods. National Food Administration, Sweden, p. 18; p. 37-41.
2 Bognár, A. (1988). Nutrient losses of foods during preparation at private household.
AID – Consumer Service, special Edition, Bonn/Germany, p. 22, picture 8.
3 Bognár, A. (2002). Tables on weight yield of food and retention factors of food con-stituents for the calculation of nutrient composition of cooked foods (dishes). BFE, Karlsruhe, Germany, p. 7-11; p. 41-43; p. 95-97.
4 Bognár, A., Piekarski, J. (2000). Guidelines for Recipe Information and Calculation
of Nutrient Composition of Prepared Foods (dishes). Journal of Food Composition and Analysis, p. 405.
5 Clausen, J., Ovesen, L. (2001). Proximate Contents, Losses and Gains of Fat, Pro-
tein and Water comparing Raw, Hospital- and Household-Cooked Pork Cuts. Jour-nal of Food Composition and Analysis, 14, p. 491-503.
6 Comments about recipe calculation procedures provided by Porto, A. A. and
Oliveira, L., NHI (INSA) (2005).
7 Comments about the Swedish Food Composition Table provided by Becker, W., NFA (2005).
8 Composition of Foods (2005). Raw, Processed, Prepared. USDA National Nutrient
Database for Standard Reference, Release 18. U.S. Department of Agriculture, Beltsville Human Nutrition Research Center, p. 7.
9 Greenfield, H., Southgate, D.A.T. (2003). Food Composition Data. Food and Agri-
culture Organization of the United Nations, Rome.
10 Kunachowicz, H., Przygoda, B., Szulc, M., Wojtasik, A., Balas, J. (2003). The effect of culinary treatment techniques on the nutritional value of fish dishes. National Food and Nutrition Institute, Warsaw, Poland. Abstract form for the 9th European Nutrition Conference in Rome.
11 Matthews, R.H., and Garrison, Y.J. (1975). Food yields summarized by different
stages of preparation. U.S. Department of Agriculture, Agriculture Handbook 102.
12 Martins, I. (1998). Evaluation of the composition of Portuguese cooked foods (Re-sumé of the dissertation in Portuguese).
13 McCance & Widdowson’s (2002). The Composition of Foods, Sixth summary edi-
tion. Cambridge: Royal Society of Chemistry. Food Standards Agency, UK, p. 437.
14 NEVO – Dutch Nutrient Database, Netherlands Nutrition Centre, (2006) : http ://www.nevo-foodcomp.nl/index_en.htm/
24
15 Przygoda, B., Kunachowicz, H., Iwanow, K., Balas, J., (2003). The effect of culinary treatment techniques on the nutritional value of chicken and turkey dishes. National Food and Nutrition Institute, Warsaw, Poland. Research Project No. 3P06T 069 22.
16 Unwin, I. D. (2000). EUROFOODS Guidelines for Recipe Information Management.
Journal of Food Composition and Analysis, 13, p. 751.
17 U.S. Department of Agriculture, Agricultural Research Service (2005). USDA Na-tional Nutrient Database for Standard Reference, Release 18. Nutrient Data Labo-ratory Home Page, http://www.nal.usda.gov/fnic/foodcomp or http://www.nal.usda.gov/fnic/foodcomp/Data/
18 Vasilopoulou, E., Georga, K., Grilli, E., Linardou, A., Vithoulka, M., Trichopoulou, A.
(2003). Compatibility of computed and chemically determined macronutrients and energy content of traditional Greek recipes. Journal of Food Composition and Analysis. Athens, Greece, 16, p.717.

25
Appendix 1. Examples for cooking methods (Bognár 2002): 1. Cooking by moist heat Heat transfer from energy source to food surface with water or steam by convection. - boil, to Cooking of food in the presence of high quantity of water or containing liquid in a pot. Temperature of cooking liquid and of food: ~ 100°C; pressure: ~ 0.1 MPa. - pressure boil, to Cooking of food in the presence of high quantity of water or containing liquid in pressure cooker. Temperature of cooking liquid and of food: ~ 102 -120°C; Pressure: ~ 0.11-0.20 MPa. - microwave boil, to Cooking of food in the presence of high quantity of water or containing liquid in a pot by using microwave oven. Temperature of cooking liquid and of food: ~ 100°C; Pressure: ~ 0.1 MPa. -steam, to Cooking of food in vapour from boiling water in an atmospheric steamer pot. Temperature of steam and of food: ~ 100°C; Pressure: ~ 0.1 MPa. - pressure steam, to Cooking of food in vapour from boiling water in a pressure steamer. Temperature of steam and of food: ~ 102 -120°C; Pressure: ~ 0.11-0.20 MPa. - stew, to Cooking of food in presence of small quantity of water or containing liquid in a pot or pan. Temperature of cooking liquid and of food: ~ 100°C; Pressure: ~ 0.1 MPa. - pressure stew, to Cooking of food in presence of small quantity of water or containing liquid in a pressure cooker. Temperature of cooking liquid and of food: ~ 102 -120°C; Pressure: ~ 0.11-0.20 MPa. - microwave stew, to Cooking of food in the presence of small quantity of water or containing liquid in a pot by using microwave oven. Temperature of cooking liquid and of food: ~ 100°C; Pressure: ~ 0.1 MPa. 2. Cooking by dry heat Heat transfer from energy source to food surface with air, fat, radiation (e.g. infra red) and conduction (e.g. contact grill). Temperatures of cooking medium (fat) or area or metal sur-face resp. are between 140 °C and 350 °C. The surface of food is usually browned. - fry in pan, to (sauté) Cooking of food in a pan with a small quantity of added fat. The food surface will mostly brown. Temperature of fat or oil: 160 °C to 200 °C Temperature of food core: <100°C

26
Cooking time: 2-8 min for eggs 4-20 min for meat and fish 3-15 min for vegetables and other foods - fry in oven, to Cooking of meat in oven with and without added fat; by hot air. The food surface will most-ly brown. Temperature of air in oven: 160 °C to 250 °C Temperature of food core: <100°C Cooking time: 30-240 min for meat and meat products - bake in oven, to Baking in oven will usually applied to cook starch reach foods and dishes such as bread, cake, pizza, vegetables, fruits and potatoes. Temperature of air in oven: 160 °C to 250 °C Temperature of food core: <100°C Cooking time: 10-60 min for vegetables, fruits 20-70 min for bread, cake, pizza, potato - deep fry, to Cooking of food in fat or oil, deep enough to immerse the food entirely. The food surface will mostly brown. Temperature of fat or oil: 140 °C to 200 °C Temperature of food core: <100°C Cooking time: 4-20 min for meat and fish 3-15 min for vegetables, potatoes and other foodstuffs - grill, to ; broil, to ; barbecue, to Cooking of food by direct radiant heat over or under a heat source (e.g. infra red grill, charcoal).The food surface will mostly brown. Temperature of hot air: 200 °C to 350 °C Temperature of food core: <100°C Cooking time: 4-20 min for meat and fish 30-70 min for poultry (whole) 2-15 min for vegetables, potatoes and other foods - contact fry, to (griddle) Cooking of food on a heated heavy metal plate or between two heated heavy metal plates (e.g. contact grill). The food surface will mostly brown. Temperature of plates: 180 °C to 250 °C Temperature of food core: <100°C Cooking time: 4-20 min for meat and fish 2-15 min for vegetables and potatoes

27
Appendix 2: List of partners, who contributed to this inventory in Workpackage 1.5: Partner ID
Institution Institution Database Country
01 IFR Institute of Food Research The Composi-tion of Foods
UK
02 GUT Graz University of Technology Austria 03 RUG Ghent University Nutriments
Belgique (NUBEL)
Belgium
06 NCI National Centre of Hygiene Food Compo-sition Data-base
Bulgaria
07 DFVF Danish Institute for Food and Veterinary Re-search
Danish Food Composition Database
Denmark
08 KTL National Public Health Institute FINELI Finland 10 AFSSA Agence Française de Sécurité Sanitaire des
Aliments CIQUAL France
11 ICETEC Iðntæknistofnun / IceTec Icelandic Food Compo-sition Tables
Iceland
12 BfEL Federal Research Centre for Nutrition and Food
BLS Germany
15 NKUA National and Kapodistrian University of Athens Composition Tables of Foods and Greek dishes
Greece
17 UCC University College Cork Irish Food Nutrient Da-tabase
Ireland
18 BGU Ben-Gurion University of the Negev BGU Israel 20 CSPO Centro per lo Studio e la Prevenzione Oncolo-
gia INRAN Italy
21 WUR Wageningen University Nederlands Voedingsstof-fenbestand (NEVO)
The Nether-lands
22 UiO University of Oslo Food Compo-sition Tables
Norway
23 NFNI National Food and Nutrition Institute Food Compo-sition Tables
Poland
24 NHI-INSA National Institute of Health (INSA) Food Compo-sition Tables
Portugal
26 CESNID Centre for Superior Studies on Nutrition & Die-tetics
Spain
28 FRI-SK Food Research Institute Slovak Food Data Bank
Slovak Repub-lic
29 NFA Swedish National Food Administration Food Compo-sition Data-base
Sweden

28
Appendix 3: Percentage of nutrient retention (nutrient retention factors) The applied systems of European Food Composition Databases:
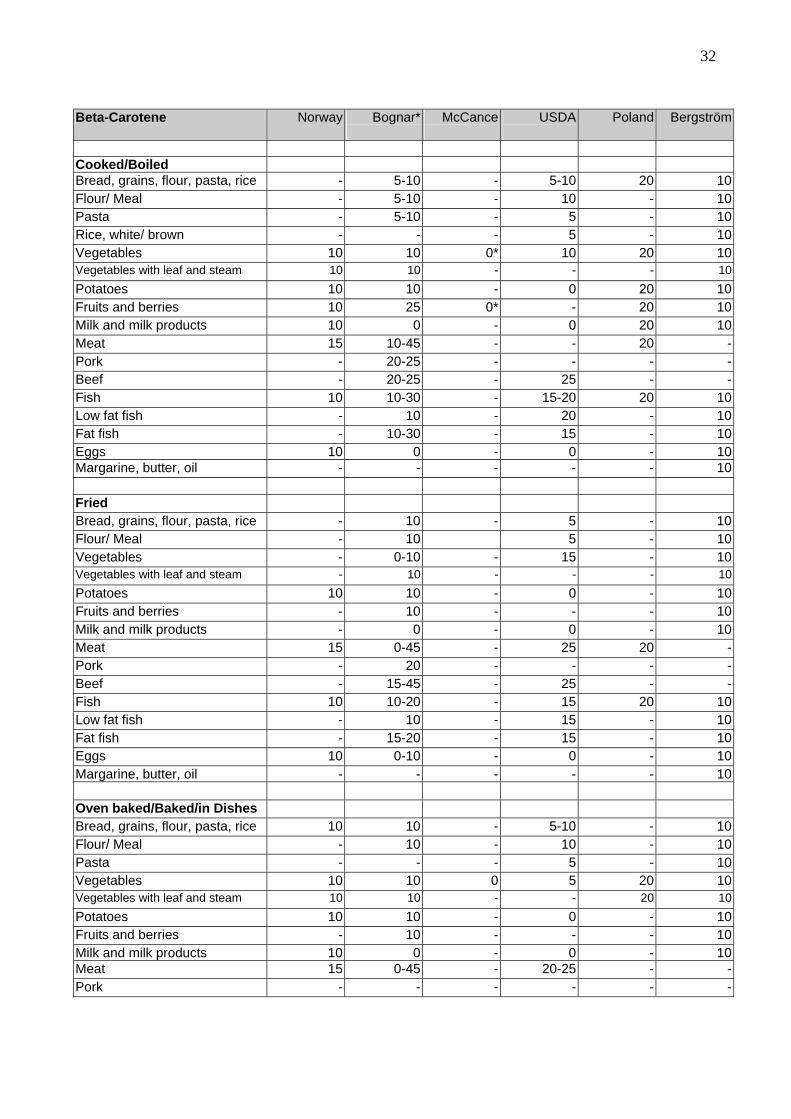
• Bognár: BfEL, NIH/INSA, FRI-SK, AFSSA • McCance & Widdowson: IFR, UCC, CESNID • USDA: BGU • Danish Data: DFVF, ICETEC • Bergström: KTL, UiO, NFA • Other/Own system: NCI, CSPO, NFNI
Protein Bognar McCance USDA
Poland
Cooked/Boiled Bread, grains, flour, pasta, rice 0 - - 10Vegetables 0-10 - - 10Vegetables with leaf and steam 0-10 - - 10Potatoes 0-5 - - 10Fruits and berries 5 - - 10Milk and milk products 0 - - 10Meat 0-10 - - 10Pork 2-10 - - -Veal and beef 2-10 - - -Poultry 0-10 - - -Fish 0-25 - - 10Low fat fish 0-25 - - -Fat fish 0-25 - - -Eggs 0 - - -Margarine, butter, oil - - - -
Fried Bread, grains, flour, pasta, rice 0 - - -Vegetables 0-5 - - -Vegetables with leaf and steam - - - -Potatoes 0 - - -Fruits and berries 0 - - -Milk and milk products 5* - - -Meat 0-5 - - 10Pork, breaded 2 - - -Veal and beef, breaded 2 - - -Poultry 0-3 - - -Fish 0-5 - - 0Low fat fish 0-5 - - -Low fat fish, breaded 0 - - -Fat fish 0-5 - - -Fat fish, breaded 0 - - -Eggs 0-5 - - -Margarine, butter, oil - - - -

29
Protein Bognar McCance USDA
Poland
Oven baked/Baked/in Dishes Bread, grains, flour, pasta, rice 0 - - -Vegetables 0 - - -Vegetables with leaf and steam 0 - - -Potatoes 0 - - -Fruits and berries 0 - - -Milk and milk products 5 - - -Meat 0-5 - - -Fish 0-5 - - -Eggs 0 - - -Margarine, butter, oil - - - -

30
Retinol
Denmark*
Norway Bognar McCance USDA Poland Bergström
Cooked/Boiled Bread, grains, flour, pasta, rice 10 - 5-10 - 5-10 20 10Flour/ Meal - - 5-10 - 10 - 10Pasta - - 5-10 - 5 - 10Rice, white/ brown - - 5-10 - 5 - 10Vegetables 10 - - - 10 20 10Vegetables with leaf and steam 10 - - - - 20 10Potatoes 10 - - - 0 20 10Fruits and berries 10 - 25 - - 20 10Milk and milk products 10 10 0 - 0 20 10Meat 10 15 15-45 0 - 20 15Pork - - 15-20 - - - 15Beef - - 15-20 - 25 - 15Poultry (10) - 20-45 - - - 15Fish 10 10 10-30 - 15-20 20 10Low fat fish - - 10 - 20 - 10Fat fish - - 30-10 - 15 - 10Eggs 5 10 0 - 0 - 10Margarine, butter, oil 15 - - - - 10
Fried Bread, grains, flour, pasta, rice 10 - 10 - 5 - 10Flour/ Meal - - 10** - 5 - 10Vegetables 10 - - - 15 - 10 Vegetables with leaf and steam 10 - - - - - 10Potatoes 10 - - - 0 - 10Fruits and berries 10 - 10 - - - 10Milk and milk products 10 - 0 - 0 - 15Meat 20 15 15-45 0 25 20 15Pork - - 20 - - - 15Beef - - 15-45 - 25 - 15Poultry - - 20-60 - - - 15Fish 20 10 15-20 0 15 20 10Low fat fish - - 10 - 15 - 10Fat fish - - 15-20 - 15 - 10Eggs 20 10 0-10 - 0 - 10Margarine, butter, oil 50 10 - - - - 10 Oven baked/Baked/in Dishes Bread, grains, flour, pasta, rice 10 - 10 - 5-10 - 10Flour/ meal - - 10*** - 10 - 10Pasta - - - - 5 - 10Vegetables (10) - - - 5 - 10 Vegetables with leaf and steam (10) - - - - - 10Potatoes (10) - - - 0 - 10Fruits and berries 10 - 10 - - - 10

31
Retinol
Denmark*
Norway Bognar McCance USDA Poland Bergström
Milk and milk products 10 10 0 - 0 - 10Meat 5 15 0-25 0 20-25 - 10Pork - - 20 - - - 15Beef - - - - 25 - 15Poultry (10) - - - - - 15Fish (20) 10 15-20 0 10-15 - 10Low fat fish - - 10 - 10 - 10Fat fish - - 15-20 - 15 - 10Eggs (20) 10 0-10 - 0 - 10Margarine, butter, oil (15) 10 - - - - 10* Vitamin A ** Bognar: ‘Flour/ Meal fried’ = pancake ***Bognar: ‘Flour/ Meal baked’ = pizza, cake, bread
32
Beta-Carotene Norway Bognar* McCance USDA
Poland Bergström
Cooked/Boiled Bread, grains, flour, pasta, rice - 5-10 - 5-10 20 10Flour/ Meal - 5-10 - 10 - 10Pasta - 5-10 - 5 - 10Rice, white/ brown - - - 5 - 10Vegetables 10 10 0* 10 20 10Vegetables with leaf and steam 10 10 - - - 10Potatoes 10 10 - 0 20 10Fruits and berries 10 25 0* - 20 10Milk and milk products 10 0 - 0 20 10Meat 15 10-45 - - 20 -Pork - 20-25 - - - -Beef - 20-25 - 25 - -Fish 10 10-30 - 15-20 20 10Low fat fish - 10 - 20 - 10Fat fish - 10-30 - 15 - 10Eggs 10 0 - 0 - 10Margarine, butter, oil - - - - - 10
Fried Bread, grains, flour, pasta, rice - 10 - 5 - 10Flour/ Meal - 10 5 - 10Vegetables - 0-10 - 15 - 10Vegetables with leaf and steam - 10 - - - 10Potatoes 10 10 - 0 - 10Fruits and berries - 10 - - - 10Milk and milk products - 0 - 0 - 10Meat 15 0-45 - 25 20 -Pork - 20 - - - -Beef - 15-45 - 25 - -Fish 10 10-20 - 15 20 10Low fat fish - 10 - 15 - 10Fat fish - 15-20 - 15 - 10Eggs 10 0-10 - 0 - 10Margarine, butter, oil - - - - - 10 Oven baked/Baked/in Dishes Bread, grains, flour, pasta, rice 10 10 - 5-10 - 10Flour/ Meal - 10 - 10 - 10Pasta - - - 5 - 10Vegetables 10 10 0 5 20 10Vegetables with leaf and steam 10 10 - - 20 10Potatoes 10 10 - 0 - 10Fruits and berries - 10 - - - 10Milk and milk products 10 0 - 0 - 10Meat 15 0-45 - 20-25 - -Pork - - - - - -

33
Beta-Carotene Norway Bognar* McCance USDA
Poland Bergström
Beef - - - 25 - -Fish 10 15-20 - 10-15 - 10Low fat fish - - - 10 - 10Fat fish - - - 15 - 10Eggs 10 0-10 - 0 - 10Margarine, butter, oil - - - - - 10* Estimated value, values for all carotenoids

34
Vitamin D Bognar McCance Poland Cooked/Boiled Bread, grains, flour, pasta, rice 0 - 10Vegetables 0 - 10 Vegetables with leaf and steam 0 - 10Potatoes 0 - 10Fruits and berries - - 10Milk and milk products 0 - 10Meat 10-25 - 10Fish 10-30 - 10Eggs 5 - 10Margarine, butter, oil - - 10
Fried Bread, grains, flour, pasta, rice 0 - -Vegetables 0 - - Vegetables with leaf and steam 0 - -Potatoes 0 - -Fruits and berries - - -Milk and milk products 0 - -Meat 10-45 - 10Fish 15-20 0 10Eggs 0-10 - -Margarine, butter, oil - - - Oven baked/Baked/in Dishes Bread, grains, flour, pasta, rice 0 - -Vegetables 0 - -Vegetables with leaf and steam 0 - -Potatoes 0 - -Fruits and berries - - -Milk and milk products 0 - -Meat 0-45 - -Fish 15-20 0 -Eggs 0-10 - -Margarine, butter, oil - - -

35
Tocopherol, Vitamin E Denmark Norway Bognar McCance
Poland
Cooked/Boiled Bread, grains, flour, pasta, rice 0 0 0 - 20Vegetables 0 0 0 0 20Vegetables with leaf and steam 0 0 0 0 20Potatoes 0 0 0 - 20Fruits and berries 0 0 0 - 20Milk and milk products 20 20 0 20 20Meat 20 20 0-25 20 20Fish 0 0 0-30 0 20Eggs 0 0 0 - -Margarine, butter, oil (25) - - - -
Fried Bread, grains, flour, pasta, rice 0 - 0 - -Vegetables 0 - 0 0 - Vegetables with leaf and steam 0 - - 0 -Potatoes 0 0 0 - -Fruits and berries 0 - 0 - -Milk and milk products 20 - 0 - -Meat 20 20 0-45 20 20Fish 0 0 0-20 0 20Eggs 0 0 0-10 - -Margarine, butter, oil 80 5 - - - Oven baked/Baked/in Dishes Bread, grains, flour, pasta, rice 0 0 0 - -Vegetables (0) 0 0 0 -Vegetables with leaf and steam (0) 0 0 - -Potatoes (0) 0 0 - -Fruits and berries (0) - 0 - -Milk and milk products (20) 20 0 - -Meat (20) 20 0-45 - -Fish 0 0 0-20 0 -Eggs 0 0 0-10 - -Margarine, butter, oil (25) 5 - - -

36
Thiamin, Vitamin B1 Denmark Norway Bognar McCance USDA Poland Sweden
* Bergström
Cooked/Boiled Bread, grains, flour, pasta, rice
- 20 0-50 - 20-35 25-50 30 25
Flour/ Meal - - 20-50 - 20 - - 25Pasta - - 20-50 - 35 - - 25Rice, white/ brown - - 0 - 20 - - 25Cereals 15 - 0 40 - - 30 25Vegetables 25-40 25 10-35 35 15 40 30 25Vegetables with leaf and steam
40 25 50 - - 40 30 25
Potatoes 25 25 20-25 - 20 30 30 25Fruits and berries 25 25 20-35 25 20 30 30 25Milk and milk products 0 25 10 10-20 10-25 20 30 25Meat 60 40 40-70 20 45-60 40 30 60Pork - - 40-70 - - - - 60Beef - - 40-60 - 20 - - 60Poultry 60 - 30-60 - - - 30 60Fish (20) 25 20 10 20 40 30 25Low fat fish - - 15-25 - 20 - - 25Fat fish - - 15-25 - 20 - - 25Eggs 10 25 30 - 15 - 30 25Margarine, butter, oil (0) - - - - - 30 25
Fried Bread, grains, flour, pasta, rice
- - 10 - 20 - 30 30
Flour/Meal - - 10-20 - 20 - - 30Cereals (20) - - - - - 30 30Vegetables (25-40) - 10 20 15 - 30 30Vegetables with leaf and steam
(40) - 10 - - - 30 30
Potatoes (25) 25 20 - 20 - 30 30Fruits and berries (25) - 0 - 20 - 30 30Milk and milk products (0) - 25 - 10-25 - 30 30Meat 20 40 30-50 20 30 25 30 40Pork - - 30-55 - - - - 40Beef - - 40-55 - 30 - - 40Poultry 20 - 30-45 - - - 30 40Fish 20 25 15-20 20 15 25 30 30Low fat fish - - 15-20 - 15 - - 30Fat fish - - 15-20 - 15 - - 30Eggs 15 25 5-30 5 15 - 30 30Margarine, butter, oil (0) - - - - - 30 30 Oven baked/Baked/in Dishes
Bread, grains, flour, pasta, rice
- 20 25 - 20 - 30 20
Flour/ Meal - - 25 - 20 - - 20

37
Thiamin, Vitamin B1 Denmark Norway Bognar McCance USDA Poland Sweden
* Bergström
Pasta - - - - 20 - - 20Cereals 20 - - 15-25 - - 30 20Vegetables (25-40) 25 10 20 10 - 30 20Vegetables with leaf and steam
(40) 25 10 - 10 - 30 20
Potatoes (25) 25 20 - 15-20 - 30 20Fruits and berries (25) 0 - 20 - 30 20Milk and milk products (0) 25 25 25 25 - 30 20Meat (20) 40 40-55 20 30-55 - 30 45Poultry (20) - - - - - 30 45Pork - - - - - - - 45Beef - - - - 55 - - 45Fish 30 25 15-25 30 5-10 - 30 20Low fat fish - - - - 10 - - 20Fat fish - - - - 5 - - 20Eggs (15) 25 5-30 15 20 - 30 20Margarine, butter, oil (0) - - - - - 30 20* Sweden: Values for boiling, roasting and warm preparation in general.

38
Riboflavin, Vitamin B2 Denmark Norway Bognar McCance USDA Poland Sweden
*Bergström
Cooked/Boiled Bread, grains, flour, pasta, rice
- 10 35-50 - 10-25 20-25 25 20
Flour/ Meal - - 0-30 - 10 - - 20Pasta - - 0-30 - 25 - - 20Rice, white/ brown - - 0-25 - 10 - - 20Cereals 10 - 0-25 40 - - 25 20Vegetables 30-40 20 30-40 20 5 30 25 20Vegetables with leaf and steam
40 20 40 - - 30 25 20
Potatoes 30 20 15-20 - 5 10 25 20Fruits and berries 35 20 20 25 10 10 25 20Milk and milk products 10 20 5 10 0 10 25 20Meat 30 10 5-30 20 5-25 20 25 25Pork - - 0-30 - - - - 25Beef - - 0-20 - 5 - - 25Poultry 30 - 0-5 - - - 25 25Fish 10 20 0-30 - 10 20 25 20Low fat fish - - 0-30 - 10 - - 20Fat fish - - 0-30 - 10 - - 20Eggs 5 20 20 - 5 - 25 20Margarine, butter, oil (0) - - - - - 25 20
Fried Bread, grains, flour, pasta, rice
- 0 - 10-15 - 25 15
Flour/ Meal - - 0 - 0 - - 15Cereals (5) - - - - - 25 15Vegetables (30-40) - 10-20 0 5 - 25 15Vegetables with leaf and steam
(40) - 15 - - - 25 15
Potatoes (30) 20 20 - 5 - 25 15Fruits and berries (35) 0 - 10 - 25 15Milk and milk products (10) 20 5 - 0 - 25 15Meat 20 10 40-55 20 10 10 25 10Pork - - 0-15 - - - - 10Beef - - 0-15 - 10 - - 10Poultry 20 - 0-10 - - - 25 10Fish 20 20-45 20 0-5 10 25 15Low fat fish - - 0-10 - 5 - - 15Fat fish - - 0-10 - 0 - - 15Eggs 10 20 5-30 20 5 - 25 15Margarine, butter, oil (0) 0 - - - - 25 15

39
Riboflavin, Vitamin B2 Denmark Norway Bognar McCance USDA Poland Sweden
*Bergström
Oven baked/Baked/in Dishes
Bread, grains, flour, pasta, rice
- 10 0 - 10 - 25 10
Flour/ Meal - - 0 - 10 - - 10Pasta - - - - 10 - - 10Cereals 5 - - 15 - - 25 10Vegetables (30-40) 20 10 20 5 - 25 10Vegetables with leaf and steam
(40) 20 15 - - - 25 10
Potatoes (30) 20 20 - 5 - 25 10Fruits and berries (35) 0 - 5 - 25 10Milk and milk products (10) 20 5 15 0 - 25 10Meat (20) 10 30-55 20 5-15 - 25 10Pork - - - - - - - 10Beef - - - - 0 - - 10Poultry (20) - - - - - 25 10Fish 20 20 20-45 20 0-5 - 25 10Low fat fish - - - - 5 - - 10Fat fish - - - - 0 - - 10Eggs (20) 20- 5-30 15 5 - 25 10Margarine, butter, oil (0) - - - - - 25 10* Values for boiling, roasting and warm preparation in general.

40
Niacin, Vitamin B3 Denmark Norway Bognar McCance USDA Poland Sweden
*Bergström
Cooked/Boiled Bread, grains, flour, pasta, rice - - 5-25 - 0-35 10-40 15 20Flour/ Meal - - 10-35 - 10 - - 20Pasta - - 10-35 - 35 - - 20Rice, white/ brown - - 5-25 - 0 - - 20Cereals 10 - 5-25 40 - - 15 20Vegetables 30-40 20 5-30 30 10 10 15 20Vegetables with leaf and steam 40 20 5-35 - - 40 15 20Potatoes 30 20 30 - 5 40 15 20Fruits and berries 35 20 10-20 25 25 15 20Milk and milk products 0 0 5 - 0 10 15 20Meat 50 20 10-50 - 10 10 15 45Pork - - 20-50 - - - - 45Beef - - 20-50 - 10 - - 45Poultry 50 - 20-40 - - - 15 45Fish 15 20 5-30 - 5-15 30 15 20Low fat fish - - 5-30 - 5 - - 20Fat fish - - 5-30 - 15 - - 20Eggs 0 0 20 - 5 30 15 20Margarine, butter, oil (0) - - - - - 15 20
Fried Bread, grains, flour, pasta, rice - - 0 - 0 - 15 15Flour/ Meal - - 0 - 0 - - 15Cereals (5) - - - - - 15 15Vegetables (30-40) - 5 0 10 - 15 15Vegetables with leaf and steam (40) - - - - - 15 15Potatoes (30) 20 5 - 5 - 15 15Fruits and berries (35) - 0 - - 15 15Milk and milk products (0) - 5 - 0 - 15 15Meat 20 20 10-30 20 10-20 0 15 20Pork - - 20-25 - - - - 20Beef - - 20 - 20 - - 20Poultry 20 - 20-40 - - - 15 20Fish 20 20 5-10 10-20 0 10 15 15Low fat fish - - 5-10 - 0 - - 15Fat fish - - 5-10 - 0 - - 15Eggs 0 0 5 5 5 - 15 15Margarine, butter, oil (0) - - - - - 15 15 Oven baked/Baked/in Dishes Bread, grains, flour, pasta, rice - 10 5 - 10 - 15 10Flour/ Meal - - 5 - 10 - - 10Pasta - - - - 10 - - 10Cereals 5 - - 5 - - 15 10Vegetables (30-40) 20 5 20 5 - 15 10Vegetables with leaf and steam (40) 20 5 - - - 15 10

41
Niacin, Vitamin B3 Denmark Norway Bognar McCance USDA Poland Sweden
*Bergström
Potatoes (30) 20 10 - 5 - 15 10Fruits and berries (35) - 0 - - - 15 10Milk and milk products (0) 0 5 5 0 - 15 10Meat (20) 20 10-30 20 45 - 15 20Pork - - - - - - - 20Beef - - - - 45 - - 20Poultry (20) - - - - - 15 20Fish 20 20 5-10 20 0-5 - 15 10Low fat fish - - - - 5 - - 10Fat fish - - - - 0 - - 10Eggs 0 - 5 5 10 - 15 10Margarine, butter, oil (0) - - - - - 15 10* Values for boiling, roasting and warm preparation in general.

42
Pantothenic acid, Vitamin B5 Bognar McCance Poland Bergström Cooked/Boiled Bread, grains, flour, pasta, rice 5-25 - 10 30Cereals 5-25 40 - 30Vegetables 10-40 - 10 30Vegetables with leaf and steam 10-30 - 10 30Potatoes 30 - 10 30Fruits and berries 10-20 25 10 30Milk and milk products 10 10 10 30Meat 10-60 - 10 30Fish 15-30 - 10 30Eggs 20 - - 30Margarine, butter, oil - - - 30
Fried Bread, grains, flour, pasta, rice 20 - - 20Vegetables 10 - - 20Vegetables with leaf and steam 10-30 - - 20Potatoes 10 - - 20Fruits and berries 0 - - 20Milk and milk products 10 - - 20Meat 10-25 20 10 20Fish 15-20 5-20 10 20Eggs 20 15 - 20Margarine, butter, oil - - - 20 Oven baked/Baked/in Dishes Bread, grains, flour, pasta, rice 25 - - 20Cereals 25 25 - 20Vegetables 5-15 20 - 20Vegetables with leaf and steam 10 - - 20Potatoes 10 - - 20Fruits and berries 0 - - 20Milk and milk products 25 25 - 20Meat 10-30 20 - 20Fish 15-20 20 - 20Eggs 20 25 - 20Margarine, butter, oil - - - 20

43
Pyridoxin, Vitamin B6 Denmark Norway Bognar McCance USDA Poland Sweden
*Bergström
Cooked/Boiled Bread, grains, flour, pasta, rice
- - 20-50 - 10-20 20-40 20 25
Flour/ Meal - - 20 - 10 - - 25Pasta - - 20 - 10 - - 25Rice, white/ brown - - 5-25 - 5 - - 25Cereals 40 - 5-25 40 - - 20 25Vegetables 40 40 30-35 40 10 40 20 25Vegetables with leaf and steam
40 40 35 - - 40 20 25
Potatoes 40 40 15-30 - 5 25 20 25Fruits and berries 40 40 10-30 20 10 20 20 25Milk and milk products 10 10 10 10 10 20 20 25Meat 50 20 15-50 50 50-65 30 20 55Pork - - 15-50 - - - - 55Beef - - 20-40 - 40 - - 55Poultry 50 - 20-40 - - - 20 55Fish 5 10 15-30 0 20 30 20 25Low fat fish - - 15-30 - 20 - - 25Fat fish - - 15-30 - 20 - - 25Eggs 10 20 20 - 5 - 20 25Margarine, butter, oil (0) - - - - - 20 25
Fried Bread, grains, flour, pasta, rice
- - 10 - 0 - 20 25
Flour/ Meal - - 20 - 0 - - 25Cereals (40) - - - - - 20 25Vegetables (40) - 10 25 10 - 20 25Vegetables with leaf and steam
(40) - 15 - - - 20 25
Potatoes (40) 40 20 - 5 - 20 25Fruits and berries (40) - 0 - 10 - 20 25Milk and milk products (10) - 25 - 25 - 20 25Meat 20 20 20-30 20 20-40 25 20 35Pork - - 20 - - - - 35Beef - - 20 - 40 - - 35Poultry 20 - 20-30 - - - 20 35Fish 20 10 15-20 20 10 25 20 25Low fat fish - - 15-20 - 10 - - 25Fat fish - - 15-20 - 10 - - 25Eggs 20 20 10 15 5 - 20 25Margarine, butter, oil (0) - - - - - 20 25

44
Pyridoxin, Vitamin B6 Denmark Norway Bognar McCance USDA Poland Sweden
*Bergström
Oven baked/Baked/in Dishes
Bread, grains, flour, pasta, rice
- 10 10 - 10 - 20 20
Flour/Meal - - 20-25 - 10 - - 20Pasta - - - - 10 - - 20Cereals 25 - - 25 - - 20 20Vegetables (40) 40 10 20 5 - 20 20Vegetables with leaf and steam
(40) 40 15 - - - 20 20
Potatoes (40) 40 20 - 5 - 20 20Fruits and berries (40) - 0 - - - 20 20Milk and milk products (10) 10 25 25 25 - 20 20Meat (20) 20 30-55 20 40-50 - 20 40Pork - - - - - - - 40Beef - - - - 65 - - 40Poultry (20) - - - - - 20 40Fish 10 10 15-20 10 10 - 20 20Low fat fish - - - - 10 - - 20Fat fish - - - - 10 - - 20Eggs (20) 20 10 25 5 - 20 20Margarine, butter, oil (0) - - - - - 20 20* Values for boiling, roasting and warm preparation in general.

45
Folate Norway Bognar McCance USDA**
Poland Bergström
Cooked/Boiled Bread, grains, flour, pasta, rice - 20-30 - 30 50 30Flour/ Meal - 30 - 30 - 30Pasta - 30 - 30 - 30Rice, white/ brown - 20-30 - 30 - 30Cereals - 20-30 50 - - 30Vegetables 50 30-50 40 30 5-55 30Vegetables with leaf and steam 50 30-50 - - 5-55 30Potatoes 50 50 - 10 50 30Fruits and berries 50 30-50 80 50 30Milk and milk products 50 20 20 15 10 30Meat 50 20-35 - 15 50 30Pork - 20-30 - - - 30Beef - 20-35 - 15 - 30Fish 50 15-30 - 20 50 30Low fat fish - 15-30 - 20 - 30Fat fish - 15-30 - 20 - 30Eggs 20 20 - 25 - 30Margarine, butter, oil - - - - - 30
Fried Bread, grains, flour, pasta, rice - 30 - 15 - 30Flour/ Meal - 30 - 15 - 30Vegetables - 30 55 30 - 30Vegetables with leaf and steam - - - - - 30Potatoes 50 25 - 25 - 30Fruits and berries - 0 - - - 30Milk and milk products - 50 - 20 - 30Meat 50 5-30 * 15 30 25Pork - 15-20 - - - 25Beef - 15-20 - 15 - 25Fish 50 15-20 0 10 30 30Low fat fish - 15-20 - 10 - 30Fat fish - 15-20 - 10 - 30Eggs 20 30 30 25 - 30Margarine, butter, oil - - - - - 30

46
*The amount of folate in meat is too low to make meaningful calculations of losses. ** Folate, total. *** McCance: values for cooked dishes.
Folate Norway Bognar McCance USDA**
Poland Bergström
Oven baked/Baked/***in Dishes Bread, grains, flour, pasta, rice 50 50 - 30 - 25Flour/ Meal - 50 - 30 - 25Pasta - - - 30 - 25Cereals - - 50 - - 25Vegetables 50 30 50 15 - 25Vegetables with leaf and steam 50 30 - - - 25Potatoes 50 25 - 25 - 25Fruits and berries - 0 - - - 25Milk and milk products 50 50 50 20 - 25Meat 50 5-30 50 30-45 - 15Beef - - - 35 - 15Fish 50 15-20 20 10 - 25Low fat fish - - - 10 - 25Fat fish - - - 10 - 25Eggs 20 30 50 25 - 25Margarine, butter, oil - - - - - 25

47
Cobalamin, Vitamin B12 Denmark Norway Bognar McCance USDA Poland Bergström
Cooked/Boiled Bread, grains, flour, pasta, rice - - 0-25 - 0 10 10Flour/ Meal - - 0 - 0 - 10Pasta - - 0 - 0 - 10Rice, white/ brown - - 5-25 - 0 - 10Cereals 5 - 5-25 - - - 10Vegetables (0) - 20-40 - 0 10 10Vegetables with leaf and steam (0) - 30-40 - - 10 10Potatoes (0) - 30 - 0 10 10Fruits and berries (0) - 10 - - 10 10Milk and milk products 5 5 5 5 20-45 10 10Meat 20 20 20-50 - 20 10 35Pork - - 20-40 - - - 35Beef - - 30-40 - 20 - 35Poultry 20 - 30-50 - - 10 35Fish 5 10 10-20 - 15 10 10Low fat fish - - 10-20 - 15 - 10Fat fish - - 10-20 - 15 - 10Eggs 0 0 20 - 15 - 10Margarine, butter, oil (0) - - - - - 10
Fried Bread, grains, flour, pasta, rice - - 0 - 0 - 15Flour/ Meal - - 0 - 0 - 15Cereals (40) - - - - - 15Vegetables (0) - 5-30 - 0 - 15Vegetables with leaf and steam (0) - - - - - 15Potatoes (0) - 20 - 0 - 15Fruits and berries (0) - 0 - - - 15Milk and milk products (5) - 10 - 45 - 15Meat 20 20 5-35 20 20 10 20Pork - - 20 - - - 20Beef - - 30 - 20 - 20Fish 0 10 10 0 10-25 10 15Low fat fish - - 10 - 10 - 15Fat fish - - 10 - 25 - 15Eggs 0 0 5 - 15 - 15Margarine, butter, oil (0) - - - - - 15 Oven baked/Baked/in Dishes Bread, grains, flour, pasta, rice - - 0 - 0 - 15Flour/ Meal - - 0 - 0 - 15Pasta - - - - 0 - 15Cereals (0) - - - - - 15Vegetables (0) - 30 - 0 - 15Vegetables with leaf and steam (0) - 30 - - - 15Potatoes (0) - 20 - 0 - 15

48
Cobalamin, Vitamin B12 Denmark Norway Bognar McCance USDA Poland Bergström
Fruits and berries (0) - 0 - - 15Milk and milk products (5) 5 10 - 45 - 15Meat (20) 20 5-35 20 20-40 - 20Pork - - - - - - 20Beef - - - - 40 - 20Poultry (20) - - - - - 20Fish 10 10 10 10 10-15 - 15Low fat fish - - - - 10 - 15Fat fish - - - - 15 - 15Eggs 0 0 5 - 20 - 15Margarine, butter, oil (0) - - - - - 15

49
Vitamin C Denmark Norway Bognar McCance USDA Poland Sweden
*Bergström
** Cooked/Boiled Bread, grains, flour, pasta, rice
- 35 30 - 20-30 - 50 35
Flour/ Meal - - 30 - 20 - - 35Pasta - - 30 - 30 - - 35Rice, white/ brown - - 30 - 20 - - 35Cereals 50 - 30 - - - 50 35Vegetables 40-70 35 10-55 45 20 50 50 35Vegetables with leaf and steam
70 35 55 - - 50 50 35
Potatoes 40 35 15-30 - 25 75 50 35Fruits and berries 50 25 30-60 25 30 75 50 35Milk and milk products 50 35 30 50 15-35 - 50 35Meat 20 25 15-30 - 20-25 - 50 25Pork - - 20 - - - - 25Beef - - 25 - 20 - - 25Poultry 20 - 20 - - - 50 25Fish (20) 35 15-20 - 25 - 50 35Low fat fish - - 15-20 - 25 - - 35Fat fish - - 15-20 - 25 - - 35Eggs 0 - 20 - 20 - 50 35Margarine, butter, oil (0) - - - - - 50 35
Fried Bread, grains, flour, pasta, rice
- - 25 - 15 - 50 40
Flour/ Meal - - 15 - 15 40Cereals (0) - - - - - 50 40Vegetables (40-70) - 25 30 15 - 50 40Vegetables with leaf and steam
(70) - 30 - - - 50 40
Potatoes (40) 35 20 - 20 - 50 40Fruits and berries (50) - 0 - 30 - 50 40Milk and milk products (50) - 30 - 35 - 50 40Meat 20 25 15-25 *** 20 - 50 25Pork - - 20 - - - - 25Beef - - 25 - 20 - - 25Poultry 20 - 20 - - - 50 25Fish (20) 35 15-20 - 20 - 50 40Low fat fish - - 15-20 - 20 - - 40Fat fish - - 15-20 - 20 - - 40Eggs 0 - 20 - 20 - 50 40Margarine, butter, oil (0) - - - - - 50 40

50
Vitamin C Denmark Norway Bognar McCance USDA Poland Sweden
*Bergström
**Oven baked/Baked/in Dishes
Bread, grains, flour, pasta, rice
- 35 30 - 20 - 50 30
Flour/ Meal - - 30 - 20 - - 30Pasta - - - - 20 - - 30Cereals 0 - - - - - 50 30Vegetables (40-70) 35 25 50 15 - 50 30Vegetables with leaf and steam
(70) 35 30 - - - 50 30
Potatoes (40) 35 20 - 20 - 50 30Fruits and berries (50) - 0 - 20 - 50 30Milk and milk products (50) 35 30 - 35 - 50 30Meat (20) 25 15-25 50 15-20 - 50 25Pork - - - - - - - 25Beef - - - - 20 - - 25Poultry (20) - - - - - 50 25Fish (20) 35 15-20 - 20 - 50 30Low fat fish - - - - 20 - - 30Fat fish - - - - 20 - - 30Eggs 0 - 20 - 20 - 50 30Margarine, butter, oil (0) - - - - - 50 30* Values for boiling, roasting and warm preparation in general. ** Bergström: the values for meat and poultry refer to ‘liver’. *** The amount of vitamin C in meat is too low to make meaningful calculations of losses.

51
Sodium, Na Denmark Bognar* USDA Poland Cooked/Boiled Bread, grains, flour, pasta, rice 5 20-40 0-50 10Flour/ Meal - 50 0 -Pasta - 50 50 -Rice, white/ brown - 0-40 0 -Vegetables 5 20-55 5 10Vegetables with leaf and steam 5 25 - 10Potatoes 5 20-40 5 10Fruits and berries 5 0-40 0 10Milk and milk products 5 0 0 10Meat 5 55-60 15-45 10Pork - 0-55 - -Beef - 0-55 15 -Fish 5 0-15 10 10Low fat fish - 0-15 10 -Fat fish - 0-15 10 -Eggs 5 0 0 -Margarine, butter, oil 5 - - -
Fried Bread, grains, flour, pasta, rice 0 0 0 -Flour/ Meal - 0 0 -Vegetables 0 0 0 -Vegetables with leaf and steam 0 0 - -Potatoes 0 0 0 -Fruits and berries 0 0 0 -Milk and milk products 0 0 0 -Meat 0 15-50 10-20 10Pork - 0-15 - -Beef - 0-15 15 -Fish 0 0-15 0 10Low fat fish - 0-15 0 -Fat fish - 0-15 0 -Eggs 0 0 0 -Margarine, butter, oil 0 - - -
Oven baked/Baked/in Dishes Bread, grains, flour, pasta, rice 0 0 0 -Flour/ Meal - 0 0 -Pasta - - 0 -Vegetables 0 0 0 -Vegetables with leaf and steam 0 40 - -Potatoes 0 0 0 -Fruits and berries 0 0 0 -Milk and milk products 0 0 0 -Meat 0 15-50 20-45 -Pork - - - -

52
Sodium, Na Denmark Bognar* USDA PolandBeef - - 45 -Fish 0 0-15 0 -Low fat fish - - 0 -Fat fish - - 0 -Eggs 0 0 0 -Margarine, butter, oil 0 - - -* Without cooking salt.

53
Potassium, K Denmark Bognar USDA Poland Cooked/Boiled Bread, grains, flour, pasta, rice 5 0-45 0-70 10Flour/ Meal - 35-40 0 -Pasta - 35-40 70 -Rice, white/ brown - 0-45 5 -Vegetables 5 0-55 10 10Vegetables with leaf and steam 5 0-50 - 10Potatoes 5 0-20 0 10Fruits and berries 5 0-40 - 10Milk and milk products 5 0 0 10Meat 5 0-50 15 10Pork - 0-50 - -Beef - 0-50 15 -Fish 5 0-25 15 10Low fat fish - 0-25 15 -Fat fish - 0-25 15 -Eggs 5 0 0 -Margarine, butter, oil 5 - - -
Fried Bread, grains, flour, pasta, rice 0 0 0 -Flour/ Meal - 0 0 -Vegetables 0 0 0 -Vegetables with leaf and steam 0 - - -Potatoes 0 0 0 -Fruits and berries 0 0 -Milk and milk products 0 0 0 -Meat 0 0-40 15 10Pork - 0-40 - -Beef - 0-40 15 -Fish 0 0-15 0 10Low fat fish - 0-15 0 -Fat fish - 0-15 0 -Eggs 0 0 0 -Margarine, butter, oil 0 - - - Oven baked/Baked/in Dishes Bread, grains, flour, pasta, rice 0 0 0 -Flour/ Meal - 0 0 -Pasta - - 0 -Vegetables 0 0 0 -Vegetables with leaf and steam 0 0 - -Potatoes 0 0 0 -Fruits and berries 0 0 -Milk and milk products 0 0 0 -Meat 0 15-40 0-45 -Pork - - - -Beef - - 45 -

54
Potassium, K Denmark Bognar USDA PolandFish 0 0-15 0 -Low fat fish - - 0 -Fat fish - - 0 -Eggs 0 0 0 -Margarine, butter, oil 0 - - -

55
Calcium, Ca Denmark Bognar USDA Poland Cooked/Boiled Bread, grains, flour, pasta, rice 5 5 0-5 10Flour/ Meal - 5 0 -Pasta - 5 5 -Rice, white/ brown - 0 0 -Vegetables 5 0-5 5 10Vegetables with leaf and steam 5 0-5 - 10Potatoes 5 5 0 10Fruits and berries 5 0-5 - 10Milk and milk products 5 0 0 10Meat 5 0-20 0 10Pork - 0-20 - -Beef - 0-20 0 -Fish 5 0 0 10Low fat fish - 0 0 -Fat fish - 0 0 -Eggs 5 0 0 -Margarine, butter, oil 5 - - -
Fried Bread, grains, flour, pasta, rice 0 0 0 -Flour/ Meal - 0 0 -Vegetables 0 0 0 -Vegetables with leaf and steam 0 - - -Potatoes 0 0 0 -Fruits and berries 0 0 -Milk and milk products 0 0 0 -Meat 0 0-10 0 10Pork - 0-10 - -Beef - 0-40 0 -Fish 0 0 0 10Low fat fish - 0 0 -Fat fish - 0 0 -Eggs 0 0 0 -Margarine, butter, oil 0 - - - Oven baked/Baked/in Dishes Bread, grains, flour, pasta, rice 0 0 0 -Pasta - - 0 -Vegetables 0 0 0 -Vegetables with leaf and steam 0 0 - -Potatoes 0 0 0 -Fruits and berries 0 0 -Milk and milk products 0 0 0 -Meat 0 0-10 20 -Pork - - - -Beef - - 20 -Fish 0 0 0 -

56
Calcium, Ca Denmark Bognar USDA PolandLow fat fish - - 0 -Fat fish - - 0 -Eggs 0 0 0 -Margarine, butter, oil 0 - - -

57
Magnesium, Mg Denmark Bognar USDA Poland Cooked/Boiled Bread, grains, flour, pasta, rice 5 0-15 0-5 10Flour/ Meal - 15 0 -Pasta - 15 0 -Rice, white/ brown - 0 0 -Vegetables 5 0-40 5 10Vegetables with leaf and steam 5 5 - 10Potatoes 5 5-10 0 10Fruits and berries 5 0-20 10Milk and milk products 5 0 0 10Meat 5 0-40 15 10Pork - 0-40 - -Beef - 0-40 15 -Fish 5 0-15 10 10Low fat fish - 0-15 10 -Fat fish - 0-15 10 -Eggs 5 0 0 -Margarine, butter, oil 5 - - -
Fried Bread, grains, flour, pasta, rice 0 0 0 -Flour/ Meal - 0 0 -Vegetables 0 0 0 -Vegetables with leaf and steam 0 - - -Potatoes 0 0 0 -Fruits and berries 0 0 - -Milk and milk products 0 0 0 -Meat 0 0-15 15 10Pork - 0-15 - -Beef - 0-15 15 -Fish 0 0-10 0 10Low fat fish - 0 0 -Fat fish - 0-10 0 -Eggs 0 0 0 -Margarine, butter, oil 0 - - - Oven baked/Baked/in Dishes Bread, grains, flour, pasta, rice 0 0 0 -Flour/ Meal - 0 0 -Pasta - - 0 -Vegetables 0 0 0 -Vegetables with leaf and steam 0 0 - -Potatoes 0 0 0 -Fruits and berries 0 0 -Milk and milk products 0 0 0 -Meat 0 0-15 0-35 -Pork - - - -Beef - - 35 -

58
Magnesium, Mg Denmark Bognar USDA PolandFish 0 0-10 0 -Low fat fish - - 0 -Fat fish - - 0 -Eggs 0 0 0 -Margarine, butter, oil 0 - - -
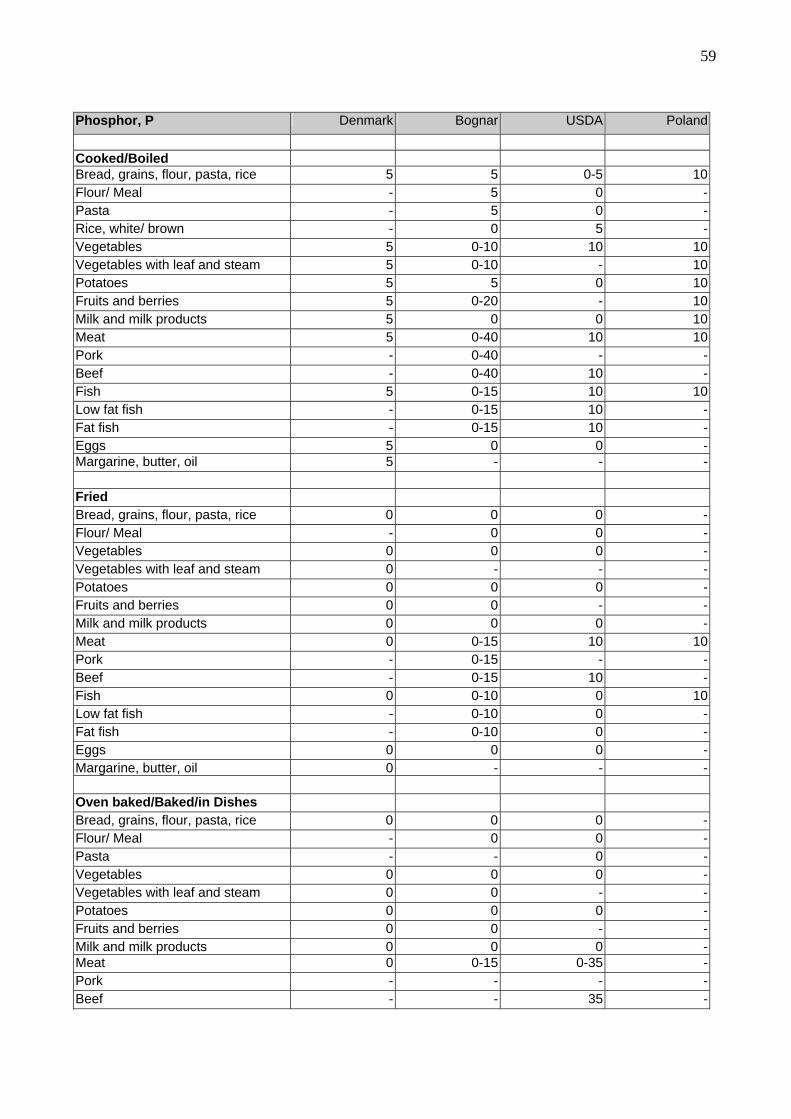
59
Phosphor, P Denmark Bognar USDA Poland Cooked/Boiled Bread, grains, flour, pasta, rice 5 5 0-5 10Flour/ Meal - 5 0 -Pasta - 5 0 -Rice, white/ brown - 0 5 -Vegetables 5 0-10 10 10Vegetables with leaf and steam 5 0-10 - 10Potatoes 5 5 0 10Fruits and berries 5 0-20 - 10Milk and milk products 5 0 0 10Meat 5 0-40 10 10Pork - 0-40 - -Beef - 0-40 10 -Fish 5 0-15 10 10Low fat fish - 0-15 10 -Fat fish - 0-15 10 -Eggs 5 0 0 -Margarine, butter, oil 5 - - -
Fried Bread, grains, flour, pasta, rice 0 0 0 -Flour/ Meal - 0 0 -Vegetables 0 0 0 -Vegetables with leaf and steam 0 - - -Potatoes 0 0 0 -Fruits and berries 0 0 - -Milk and milk products 0 0 0 -Meat 0 0-15 10 10Pork - 0-15 - -Beef - 0-15 10 -Fish 0 0-10 0 10Low fat fish - 0-10 0 -Fat fish - 0-10 0 -Eggs 0 0 0 -Margarine, butter, oil 0 - - - Oven baked/Baked/in Dishes Bread, grains, flour, pasta, rice 0 0 0 -Flour/ Meal - 0 0 -Pasta - - 0 -Vegetables 0 0 0 -Vegetables with leaf and steam 0 0 - -Potatoes 0 0 0 -Fruits and berries 0 0 - -Milk and milk products 0 0 0 -Meat 0 0-15 0-35 -Pork - - - -Beef - - 35 -

60
Phosphor, P Denmark Bognar USDA PolandFish 0 0-10 0 -Low fat fish - - 0 -Fat fish - - 0 -Eggs 0 0 0 -Margarine, butter, oil 0 - - -

61
Iron, Fe Bognar McCance USDA Poland Cooked/Boiled Bread, grains, flour, pasta, rice 25 - 0-25 10Flour/ Meal 25 - 0 -Pasta 25 - 25 -Rice, white/ brown 0 - 5 -Vegetables 0-25 - 5 10Vegetables with leaf and steam 0-25 - - 10Potatoes 5-10 - 0 10Fruits and berries 0-10 - - 10Milk and milk products 0 - 0 10Meat 0-20 - 5 10Pork 0 - - -Beef 0 - 5 -Fish 0-20 - 0 10Low fat fish 0-20 - 0 -Fat fish 0-20 - 0 -Eggs 0 0 0 -Margarine, butter, oil - - - -
Fried Bread, grains, flour, pasta, rice 0 - 0 -Flour/ Meal 0 - 0 -Vegetables 0 - 0 -Vegetables with leaf and steam - - - -Potatoes 0 - 0 -Fruits and berries 0 - - -Milk and milk products 0 - 0 -Meat 0-5 - 5 10Pork 0 - - -Beef 0-4 - 5 -Fish 0-15 - 0 10Low fat fish 0-15 - 0 -Fat fish 0-15 - 0 -Eggs 0 0 0 -Margarine, butter, oil - - - - Oven baked/Baked/in Dishes Bread, grains, flour, pasta, rice 0 - 0 -Pasta - - 0 -Vegetables 0 - 0 -Vegetables with leaf and steam 0 - - -Potatoes 0 - 0 -Fruits and berries 0 - -Milk and milk products 0 - 0 -Meat 0-5 - 0 -Pork - - - -Beef - - 0 -Fish 0-15 - 0 -

62
Iron, Fe Bognar McCance USDA PolandLow fat fish - - 0 -Fat fish - - 0 -Eggs 0 0 0 -Margarine, butter, oil - - - - Comments: Values in brackets () are estimated. POLAND:
- ‚Cooking’ = cooking with decoction poured off SWEDEN:
- Values for boiling, roasting, warm preparation in general - Values for Vitamin C, Thiamin, Riboflavin, Niacin, Vit. B6
BERGSTRÖM:
- Retention on recipe level
USDA:
- Further values for Zinc, Copper, Alcohol (ethyl), alpha carotene and other carote-noids are available. - beef: ground, baked without drippings - ‘Low fat fish’ = fish < 5% fat, ‘fat fish’ = > 5% fat
o ‘Baked’ without drippings o ‘Cooked’ means ‘simmered without dripping’ o ‘Fried’ means with coating
- Vegetable: ‘cooked’ = boiled with little water, drained - Flour/ Meal: ‘cooked’ = boiled, steamed
‘Fried’ = toasted - Pasta: ‘cooked’ = boiled, drained - Rice white/ brown: cooked, water used
BOGNÁR:
- Further retention factors (or rather loss values) for the following nutrients are available: o fat, carbohydrate, dietary fibre, minerals (ash) in general o Copper, Zinc, cooking salt and other minerals o Vitamin K, Biotin o Amino acids (Lysine, Methionine, Cystine) o Organic acids o Sterols o Purine o Other nutrients

63
- ‘Beef’ = veal and beef - ‘Flour/ Meal cooked/ boiled’ means pasta boiled (as solid part and total dish) - ‘Flour/ Meal baked’ includes bread, pizza, cake - ‘rice white/brown’ = ‘cereals’ = cereal grains and seeds, values for ‘whole’
grains/ seeds and ‘polished’ ones - ‘Milk and milk products’ means always total dishes - ‘poultry’ includes chicken, duck and goose, turkey - Wide ranges are due to differences between:
o fry in pan, fry in oven, deep fry o solid, edible part of food or total dish
- Further values for other food groups are available: o stem, flower, corn and seed vs. root, tuber, and bulb vegetable o beans, lentils, peas o potato products o mushrooms o other meat like ‘lamb, mutton and game’ or minced meat o breaded meat or fish or vegetable o sea food like crab, mussels or squid o bowels like liver, kidney, brain

64
Appendix 4: Percentage of weight change (yield factors) The applied systems of European food composition databases:
• Bognár: BfEL, FRI-SK • McCance & Widdowson: IFR, UCC, CESNID • USDA: BGU
Weight yield factors by cooking in %
Norway
Bognar1) McCance Poland Sweden Italy Denmark19)
Cooked/Boiled Bread, grains, flour, pasta, rice
- [+56, +210]15)
[+113,+197] 16)
- +100 [+92, 199] 8)
-
Vegetables - [-5,-10]13) - - -5 [-43,-1] -Vegetables with leaf and steam
- [+3,+15]/[-1,-4]2)
- - - - -
Potatoes - [-20,+4]14) - - - 0 -Fruits and berries - [+15,+300]
3)- - - - -
Milk and milk products - -59) - - - - -Meat -30 [-30,-40]11) -29 17) - - [-34,-10] [-36.6,
-27]20)
Fish [-20, -15] [-33,-49]12) +19 18) -1 - [-35,-16] -Eggs - -10 - - - - -Margarine, butter, oil - - - - - - -Fried Bread, grains, flour, pasta, rice
- [-7,-22]15) [-11,-29] 5) - - - -
Vegetables - - - - - [-40,-20] -Vegetables with leaf and steam
- - - - - - -
Potatoes - [-17,-46] 14) - - - -36 -Fruits and berries - - - [-20,-14] - - -Milk and milk products - -5 - - - - -Meat [-25,-30] [-26,-43]11) [-38,-5] 17) [-3,-17] - [-26,-12] -
Fish [-5,-20] [-46,-17]12) [-23,+2]7) -27 [-60,-22] -Eggs -10 [- 9,-13] 10) - - - -10 -Margarine, butter, oil - - - - - - -Oven baked/Baked/in Dishes
Bread, grains, flour, pasta, rice
- [-9,-28] 4) - - - - -
Vegetables - - - - - - -Vegetables with leaf and steam
- - - - - [-60,-4] -
Potatoes - -3214) - - - - -Fruits and berries - - - - - - -Milk and milk products - -5 - - - - -Meat - -33 -526) - - [-33,-11] -Fish - -12 -1927) - - [-37,-21] -Eggs - -1110) - - - - -Margarine, butter, oil - - - - - - -

65
Comments:
1) Mean value of available data, edible part of food 2) Weight gain: e.g. brussels sprouts, boiled. Weight loss: e.g. red cabbage, boiled. 3) Boiled apples: +300, pears stewed: +15 4) -28: biscuits, -9: lemon cake 5) Bread, Cakes, Muffins, fried or toasted. 6) weight gain: large ravioli fried, weight loss: pancake 7) weight gain: fish cakes, weight loss: fried (fatty) fish, fish fingers fried 8) only cooked pasta 9) Cheese soufflé, vanilla/chocolate blancmange 10) Fried egg/ scrambled egg; baked: Pancake 11) Pork and beef, fried: pork chop -47 12) Cooked: -49: cod (whole), -33: fish fillet (cod, red fish, pollack); fried: -42: Trout “Müllerin style”, -10:
fish fingers, breaded, deep fried 13) Root and tuber vegetables 14) Potato, with peel: -20, without peel: 0; potato dumpling [+3,+9], Fried: -46: French fries deep fried, -
17: potato pancake; Baked: -32: potato croquette , deep fried and baked
15) Boiled: +210: outs flakes, wholemeal; +56: small pasta, wheat flour with egg, fried: -22: wheat, wholemeal, roasted, -7: pancake, wheat flour
16) +113: Spaghetti, white, dried, boiled; +197: Savoury rice, cooked 17) Boiled: -29: Beef, silverside, salted; Fried: -38: veal, escalope, -5: chicken breast in crumbs; baked:
chicken pie (chilled/frozen) 18) Cooked: cod dried, salted, boiled; Baked: cod fillets 19) Reference: Clausen, J. and Ovesen, L.: “Proximate Contents, losses and Gains of Fat, Protein and
Water Comparing Raw, Hospital- and Household-Cooked Pork Cuts” Journal of Food Compositions and Analysis (2001) 14, 491-503
20) Pork, loin boneless with rind Description of the use of yield factors in the USDA National Nutrient Database: Basically, yields for products other than meats may be used when analytical data are not available. However, in most cases analytical data for raw and cooked foods and not yield factors is applied. Analytical data for most nutrients for the raw and cooked products in the field of cereals, grains and pasta are most available. If there is missing data for a nutrient in the cooked food, it is calculated from the raw (dry) grain using the moisture values (sol-ids) for raw and cooked rather than using yield factors. Baked Products: Food cooking yield factors reflect the changes due primarily to moisture and fat gains and/or losses. When recipe or formulations are used to impute nutrients for proc-essed/formulated foods a percent moisture loss is normally applied not a yield factor. A good example of this would be a cake mix prepared by recipe. The data in column A rep-resent the batter and indicates no moisture loss during baking. Data in column B reflects a 12% loss in weight due to moisture loss. The 12% moisture loss would be applied to the whole recipe and not an 88% yield factor. Nutrient Cake batter (A) Cake bake (B) Water 41.8g 33.9g Protein 3.89g 4.42g Ash 1.59g 1.81g
However, several food items in SR don't have moisture losses applied because analytical data for both the raw and cooked food items are available.

66
Meats: When analytical data is available for a food item (e.g. accurate data for cooked beef, pork, and alternate red meat products such as buffalo and ostrich), yield factors are not used. Yield factors are used for calculation, when only raw data is available and cooked data (and vice versa) is needed. Then yield factors from Handbook 102 are used.30 Examples of weight and water loss factors in dishes in the Dutch nutrient database NEVO: Product Name Weight loss in % Water loss in % Almond filled pastry 25 74,9 Apple pie Dutch 9 19 Cake plain 10 38 Cream puff pastry mille 15 28 Flan with fruit filling 5 8 Flan filled with rice pudding 20 33 Treacle waffle 8 22 Butter cake 3 17 Pizza with cheese and tomatoes 25 47 Apple puff pastry 25 53
30 Handbook 102: Matthews, R.H., and Garrison, Y.J. (1975). Food yields summarized by different stages of prepara-tion. U.S. Department of Agriculture, Agriculture.