report no. 35 - sat ejournal - archivesejournal.icrisat.org/volume5/aes/aes5.pdfp pathak principal...
TRANSCRIPT
119–2007
® ®About ICRISAT
Contact Information
ICRISAT-Patancheru(Headquarters)Patancheru 502 324Andhra Pradesh, IndiaTel +91 40 30713071Fax +91 40 [email protected]
ICRISAT Liaison OfficeCG Centers BlockNASC ComplexDev Prakash Shastri MargNew Delhi 110 012, IndiaTel +91 11 32472306 to 08 Fax +91 11 25841294
ICRISAT-Nairobi(Regional hub ESA)PO Box 39063, Nairobi, KenyaTel +254 20 7224550Fax +254 20 [email protected]
ICRISAT-Niamey(Regional hub WCA)BP 12404Niamey, Niger (Via Paris)Tel +227 722529, 722725Fax +227 [email protected]
ICRISAT-BamakoBP 320Bamako, MaliTel +223 2223375Fax +223 [email protected]
ICRISAT-BulawayoMatopos Research StationPO Box 776,Bulawayo, ZimbabweTel +263 83 8311 to 15Fax +263 83 8253/[email protected]
ICRISAT-LilongweChitedze Agricultural Research StationPO Box 1096Lilongwe, MalawiTel +265 1 707297/071/067/057Fax +265 1 [email protected]
ICRISAT-Maputoc/o IIAM, Av. das FPLM No 2698Caixa Postal 1906Maputo, MozambiqueTel +258 21 461657Fax +258 21 [email protected]
Visit us at www.icrisat.org
®
The International Crops Research Institute for the Semi-Arid Tropics (ICRISAT) is a nonprofit, non-political organization that does innovative agricultural research and capacity building for sustainable development with a wide array of partners across the globe. ICRISAT’s mission is to help empower 600 million poor people to overcome hunger, poverty and a degraded environment in the dry tropics through better agriculture. ICRISAT belongs to the Alliance of Centers of the Consultative Group on International Agricultural Research (CGIAR).
Physical and Chemical Properties of Red and Black Soils of Selected Benchmark
Spots for Carbon Sequestration Studies in Semi-Arid Tropics of India
Global Theme on AgroecosystemsReport no. 35
© International Crops Research Institute for the Semi-Arid Tropics (ICRISAT), 2006. All rights reserved.
ICRISAT holds the copyright to its publications, but these can be shared and duplicated for non-commercial purposes. Permission to make digital or hard copies of part(s) or all of any publication for non-commercial use is hereby granted as long as ICRISAT is properly cited. For any clarification, please contact the Director of Communication at [email protected]. ICRISAT’s name and logo are registered trademarks and may not be used without permission. You may not alter or remove any trademark, copyright or other notice.
Citation: Bhattacharyya T, Chandran P, Ray SK, (Mrs) Mandal C, Pal DK, Venugopalan MV, Durge SL, Srivastava P, Dubey PN, Kamble GK, Sharma RP, Wani SP, Rego TJ, Pathak P, Ramesh V, Manna MC and Sahrawat KL. 2007. Physical and chemical properties of selected benchmark spots for carbon sequestration studies in semi-arid tropics of India. Global Theme on Agroecosystems Report no. 35. Patancheru 502 324, Andhra Pradesh, India: International Crops Research Institute for the Semi-Arid Tropics (ICRISAT), and New Delhi, India: Indian Council of Agricultural Research (ICAR). 236 pp.
Abstract
Physical (nine characteristics) and chemical (14) properties of red and black soils are described: sand, silt, clay, fine clay, BD, COLE, HC (hydraulic conductivity) and WDC; pH (H2O and KCl), EC, OC, CaCO3, clay CO3, extractable Ca, Mg, Na, K, CEC, clay CEC, BS and ESP are described in three ecosystems, namely sub-humid (moist and dry) [SH (m) and SH (d)], semi-arid (moist and dry) [SA (m) and SA (d)] and arid in SAT, India.
Clay contents vary between 30% in arid system to 82% in sub-humid (dry) system and 79% in semi-arid (dry) system. The red soils contain 8–-55% clay. Fine clay (<0.2 μm) content ranges between 9–54% in red soils; for black soils nearly 50% of total clay (<2 μm) remains in finer (<0.2 μm) fractions. The overall relation between SOC and BD is negative; however, the correlation between SIC and BD within a depth of 0–30 cm soil depth is positive. Increase in relative proportion of coarse fragments increases the pore space, effecting decrease in BD values. The inherent relation between total clay and COLE in different bioclimatic systems indicates a positive correlation with a relatively high value (r = 0.83) in arid bioclimatic system. Except sub-humid (moist) and arid bioclimates, a positive correlation between COLE and slickensides is observed in most of the Vertisols in SAT India. A general decreasing trend of SOC with increase in HC is observed. Conversely, an increasing trend of HC has been found with decrease in SIC. In all the bioclimates, there is an increasing trend of SOC with decrease in ESP and an increasing trend of SIC with increase in ESP. This is due to preferential release of Ca2+ ions and their precipitation as CaCO3 in soil, thereby increasing the relative concentration of Na+ ions in the exchange complex effecting high value of ESP. In general, a positive correlation between amount of fine clay and SOC in surface soils has been found.
The SOC values in the surface (0–30 cm) follow the trend of forest system > permanent fallow (grassland), horticultural system > agricultural system > wasteland. Surface soils of agricultural and horticultural systems store higher SIC as compared to other systems. The surface soils of semi-arid (moist) show higher SOC under agricultural system due to inclusion of sun hemp for green manuring in crop rotation. The average SOC values follow the trend of SA (m) (0.825%) > SH (d) (0.804%) > SH (m) (0.642%) > SA (d) (0.633%) > arid (0.594%) for black soils under agricultural system. The values of SOC follow the trend of SH (m) (1.35) > SA (d) (0.84) > SA (m) (0.70) for the red soils used for cultivation.
The level of SIC values in surface soils under agricultural system followed the trend of arid (2.34%) > SH (d) (1.06%) > SA (m) (0.99%) > SA (d) (0.94%) > SH (m) (0.54%) for black soils. In red soils, CaCO3 in general is not found except in soils of semi-arid (dry) bioclimatic system.
The SOC in surface horizon under agricultural systems shows higher values for cereal-based system (0.79%), followed by soybean systems (0.70%) and cotton-based systems (0.68%). Interestingly, the SIC values have been found to be the highest in cotton-based systems (1.53%), followed by soybean-based systems (0.66%) and cereal-based systems (0.29%). This trend is opposite to that of the corresponding SOC values.
With the help of data generated, 14 systems (five in cotton, three in soybean, four in cereals, one in horticulture and one under forest) have been identified as ideal for organic carbon sequestration, keeping in view the existing level of management practices vis-à-vis soil health.
This publication is part of the research project “Identifying Systems for Carbon Sequestration and Increased Productivity in Semi-Arid Tropical Environments (RNPS-25)” funded by the National Agricultural Technology Project (NATP) through Indian Council of Agricultural Research, New Delhi, India.
Global Theme on AgroecosystemsReport no. 35
Physical and Chemical Properties of Red and Black Soils of Selected Benchmark Spots for Carbon Sequestration Studies in
Semi-Arid Tropics of India
Central Research Institute for Dryland Agriculture (CRIDA)Indian Institute of Soil Science (IISS)
National Bureau of Soil Survey & Land Use Planning (NBSS&LUP)2007
International Crops Research Institute for the Semi Arid TropicsICRISAT
®
T Bhattacharyya, P Chandran, SK Ray, (Mrs) C Mandal, DK Pal, MV Venugopalan, SL Durge, P Srivastava,
PN Dubey, GK Kamble, RP Sharma, SP Wani, TJ Rego, P Pathak, V Ramesh, MC Manna and KL Sahrawat
ii
About the Authors
T Bhattacharyya Principal Scientist, National Bureau of Soil Survey and Land Use Planning (NBSS&LUP), Nagpur 440 010, Maharashtra, India.
P Chandran National Bureau of Soil Survey and Land Use Planning (NBSS&LUP), Nagpur 440 010, Maharashtra, India.
SK Ray National Bureau of Soil Survey and Land Use Planning (NBSS&LUP), Nagpur 440 010, Maharashtra, India.
Mrs Mandal C Pal National Bureau of Soil Survey and Land Use Planning (NBSS&LUP), Nagpur 440 010, Maharashtra, India.
DK Pal National Bureau of Soil Survey and Land Use Planning (NBSS&LUP), Nagpur 440 010, Maharashtra, India.
MV Venugopalan National Bureau of Soil Survey and Land Use Planning (NBSS&LUP), Nagpur 440 010, Maharashtra, India.
SL Durge National Bureau of Soil Survey and Land Use Planning (NBSS&LUP), Nagpur 440 010, Maharashtra, India.
P Srivastava National Bureau of Soil Survey and Land Use Planning (NBSS&LUP), Nagpur 440 010, Maharashtra, India.
PN Dubey National Bureau of Soil Survey and Land Use Planning (NBSS&LUP), Nagpur 440 010, Maharashtra, India.
GK Kamble National Bureau of Soil Survey and Land Use Planning (NBSS&LUP), Nagpur 440 010, Maharashtra, India.
RP Sharma National Bureau of Soil Survey and Land Use Planning (NBSS&LUP), Nagpur 440 010, Maharashtra, India.
SP Wani Principal Scientist (Watersheds) and Regional Theme Coordinator (Asia), Global Theme on Agroecosystems, International Crops Research Institute for the Semi-Arid Tropics (ICRISAT), Patancheru 502 324, Andhra Pradesh, India.
TJ Rego Formerly Principal Scientist (Soil Science), Global Theme on Agroecosystems, International Crops Research Institute for the Semi-Arid Tropics (ICRISAT), Patancheru 502 324, Andhra Pradesh, India.
P Pathak Principal Scientist (Land and Water Management), Global Theme on Agroecosystems, International Crops Research Institute for the Semi-Arid Tropics (ICRISAT), Patancheru 502 324, Andhra Pradesh, India.
V Ramesh Scientist, Central Research Institute for Dryland Agriculture (CRIDA), Santoshnagar, Hyderabad 500 059, Andhra Pradesh, India.
MC Manna Senior Scientist, Indian Institute of Soil Science (IISS), Bhopal 462 038, Madhya Pradesh, India.
KL Sahrawat Visiting Scientist, Global Theme on Agroecosystems, International Crops Research Institute for the Semi-Arid Tropics (ICRISAT), Patancheru 502 324, Andhra Pradesh, India.
AcknowledgmentsThe authors like to thank the Chief Scientists of AICRPDA at different locations for soil samples and their staff for the immense help rendered. The authors acknowledge the valuable advice of Dr KPR Vittal and YS Ramakrishna of CRIDA, Drs DK Pal of NBSS&LUP and A Subba Rao, Director of IISS. Special thanks are due to Dr Ch Srinivasa Rao, Dr KV Padmaja and Ms Priti Anand for reviewing and editing the manuscript. The financial support provided by National Agricultural Technology project (RNPS–25), Indian Council of Agricultural Research (ICAR) is gratefully acknowledged.
iii
Contents
About the Authors iiAcknowledgments iiTeam Members iii
Chapter 1: Introduction 1
Chapter 2: Materials and Methods 3
2.1 Materials 32.2 Methods 7
Chapter 3: Results and Discussion 12
3.1 Particle-Size Distribution in Soils 123.2 Bulk Density 203.3 Coefficient of Linear Extensibility (COLE) 253.4 Hydraulic Conductivity (HC) 313.5 Exchangeable Sodium Percentage (ESP) 403.6 Clay Carbonate 423.7 pH 443.8 Soil Separates 463.9 Land Use Systems 533.10 Variation of SOC in Agricultural Systems under Different Bioclimates 553.11 SIC Content in Soils under Agricultural Systems in Different Bioclimates 593.12 SOC in Dominant Cropping Systems 613.13 SIC in Dominant Cropping Systems 633.14 Variation of SOC with Type of Management 65Dominant Crop as Soybean (Agricultural System) 76Dominant Crop as Cereals (Agricultural System) 78Forest Systems 80Horticultural System 80
Chapter 4: Summary and Conclusions 82
4.1 Summary 824.2 Conclusions 91
References 93
Appendices 97
iv
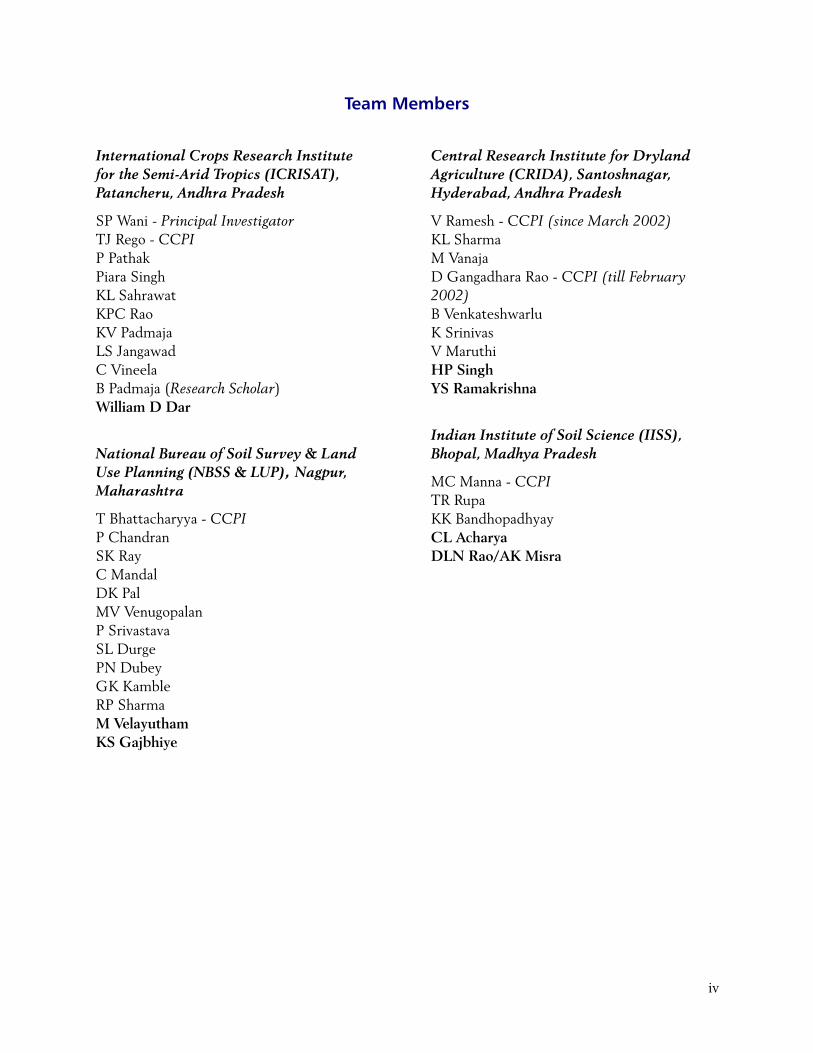
Team Members
International Crops Research Institute for the Semi-Arid Tropics (ICRISAT), Patancheru, Andhra Pradesh
SP Wani - Principal InvestigatorTJ Rego - CCPIP PathakPiara SinghKL Sahrawat KPC RaoKV PadmajaLS JangawadC VineelaB Padmaja (Research Scholar)William D Dar
National Bureau of Soil Survey & Land Use Planning (NBSS & LUP), Nagpur, Maharashtra
T Bhattacharyya - CCPIP ChandranSK RayC MandalDK PalMV VenugopalanP SrivastavaSL DurgePN DubeyGK KambleRP SharmaM VelayuthamKS Gajbhiye
Central Research Institute for Dryland Agriculture (CRIDA), Santoshnagar, Hyderabad, Andhra Pradesh
V Ramesh - CCPI (since March 2002)KL SharmaM VanajaD Gangadhara Rao - CCPI (till February 2002)B VenkateshwarluK SrinivasV MaruthiHP SinghYS Ramakrishna
Indian Institute of Soil Science (IISS), Bhopal, Madhya Pradesh
MC Manna - CCPITR RupaKK BandhopadhyayCL AcharyaDLN Rao/AK Misra
1
Chapter 1: Introduction
Physical properties of black and associated soils—particle-size distribution, namely sand, silt, clay, bulk density (BD), coefficient of linear extensibility (COLE), saturated hydraulic conductivity (HC) and water dispersible clay (WDC)—were determined. The chemical properties of black soils include pH, electrical conductivity (EC), organic carbon, calcium carbonate, clay carbonate, cation exchange capacity (CEC), extractable bases and exchangeable sodium percentage (ESP).
The basic property of Vertisols is that they have high water-holding capacity. This is controlled primarily by the relative proportion of different soil-size fractions. Vertisols are usually dominated by clay, which commonly ranges from 40 to 60%, but may be as high as 80% (Dudal 1965; DeVos and Virgo 1969; Bhattacharyya et al. 2003). In general, surface soils show low amount of clay that increases with depth. Clay content of black soils is uniformly high to a depth of 50 cm (Raychaudhuri et al. 1963; Dudal 1965, Yule and Ritchie 1980). Although typical Vertisols show high clay content in the subsurface, there are reports of Vertisols with sandy-textured subsurface (Cocheme and Franquin 1967; De Vos and Virgo 1969; Ray and Reddy 1997). In contrast, the red soils (Alfisols) show an increasing trend of clay down the depth, followed by a decrease in clay content.
The dominant clay mineral in Vertisols is smectite (Pal and Deshpande 1987b). It has been stated recently that Vertisols showing typical vertic properties can only be because of smectite content (Bhattacharyya et al. 1997) to the tune of at least 20% (Shirsath et al. 2000). The presence of dominating amounts of clay fractions offer more surface charge density (SCD), which is an important prerequisite of increasing SOC (Poonia and Niederbudde 1990; Bhattacharyya et al. 2000).
Another important physical property which largely determines the stock of both organic and inorganic form of carbon is bulk density (BD). The BD of Vertisols varies greatly because of their swelling and shrinking nature, which changes with moisture content. The soils have high BD when they are dry, and have low BD when they are in a swollen state. Bulk density has been reported to vary from 1.0 to 2.0 g/cm3, depending on the moisture content. Bulk density usually tends to increase with depth, due to compression caused by overburden weight. It has been observed that a volume change of nearly 60% occurs when a dry Vertisol is saturated with water (Rao et al. 1978). Various other physical properties of soils have been detailed by other authors (Ghosh and Raychaudhuri 1974).
Due to relatively lower values of clay and/or extractable bases and ESP, the hydraulic conductivity (HC) of Vertisols show initial higher values in the surface horizons, followed by drastic reduction in the subsurface horizons. It was reported that HC values decreased from 7.6 to 3.4 cm/hr for the first one hour, to 0.4 cm/hr over one to two hours, and further to 0.02 cm/hr after 144 hours when soils were saturated (Krantz et al. 1978). It has been reported that hydraulic conductivity gets impaired in Vertisols with increasing content of CaCO3 and exchangeable sodium percentage (Pal et al. 2000; Srivastava et al. 2002; Pal et al. 2003). It therefore appears that soils sequestering more inorganic carbon will have highly impaired hydraulic conductivity value. This value could be as low as 0.1 to 0.2 cm/hr. Recently, hydraulic conductivity has been reported as a single-index parameter to judge the quality of Vertisols with respect to yields of crops in the semi-arid tropics of India (Kadu et al. 2003).

2
In view of the importance of soil characteristics, nearly 52 pedons were selected from Indian SAT to study the physical and chemical properties of Vertisols and associated soils in order to identify the systems for carbon sequestration and increased productivity in semi-arid tropical environments.
3
Chapter 2: Materials and Methods
2.1 Materials
2.1.1 Background
Recent studies of red soils (Alfisols of eastern India, Saikh et al. 1998a,b) and associated red and black soils (Bhattacharyya and Pal 1998; Naitam and Bhattacharyya 2001) indicate that soil organic carbon (SOC) content of soils sharply declines when put to cultivation. Reduction of SOC level is significant even within 15 to 25 years of cultivation. These authors have hypothesized that irrespective of the initial organic carbon levels of these red soils, there is a tendency to reach the quasi-equilibrium value of 1 to 2% SOC. These values could be as high as 2–5% for black soils. Since such studies are limited to a specific geographical region, a generalized view about carbon-carrying capacity of the soils may not be advisable, because quality of soil substrate and its surface charge density (SCD) varies from one place to another.
It has been reported that increase in SOC increases the SCD of soils and the ratio of internal/external exchange sites (Poonia and Niederbudde 1990). It may be mentioned that the dominant soils in the semi-arid tropics (SAT) are black soils (Vertisols and their intergrades, with some inclusions of Entisols in the hills and pediments) and associated red soils. All these soils are dominated by smectites and smectite-kaolinite (Bhattacharyya et al. 1993; Pal and Deshpande 1987a, 1987b; Pal et al. 1989, 2000). Presence of smectite increases the SCD of soils, which offers greater scope of carbon sequestration in these soils. Black soils, therefore, may reach a higher quasi-equilibrium value (>2%) compared to red soils, dominated by kaolinites with low SCD.
Bhattacharyya and Pal (1998) reported 2–5% of SOC in black soils in the surface soils from Mandla and Dindori districts of Madhya Pradesh. More recently, it was also indicated the scope of higher SOC content in the shrink-swell soils of Australia. To find out the sufficient and deficient zones for SOC in different agro-ecoregions, Velayutham et al. (2000) adopted the lower limit of the quasi-equilibrium value of 1%. In view of higher SCD of the dominant soils of the SAT and considering a quasi-equilibrium value of 2% of SOC in the first 30 cm depth of soils, the SOC stock is worked out as 10.5 Pg for an area of 116.4 m ha. This value is more than three times the existing SOC stock of SAT (Bhattacharyya et al. 2000). It, therefore, appears that effective sequestration processes can increase the SOC stock by three times or more, suggesting that the SAT could be fruitfully prioritized for carbon management in the Indian subcontinent.
2.1.2 Area
Keeping the above points in view, the study area was chosen in the SAT as well as in the relatively dry sub-humid agro-eco subregions (AESRs 9.1, 9.2, 10.1, 10.2, 10.3, 10.4) (Velayutham et al. 1999). Area-wise, the vast plains of sub-humid, semi-arid and arid ecosystems cover 150.9 m ha area in this subcontinent. While selecting the soil-sites, the specific bioclimatic systems were identified in view of the rainfall (mean annual) as mentioned below:
Sub-humid (moist) SH (m) : >1100 mmSub-humid (dry) SH (d) : 1100-1000 mm
4
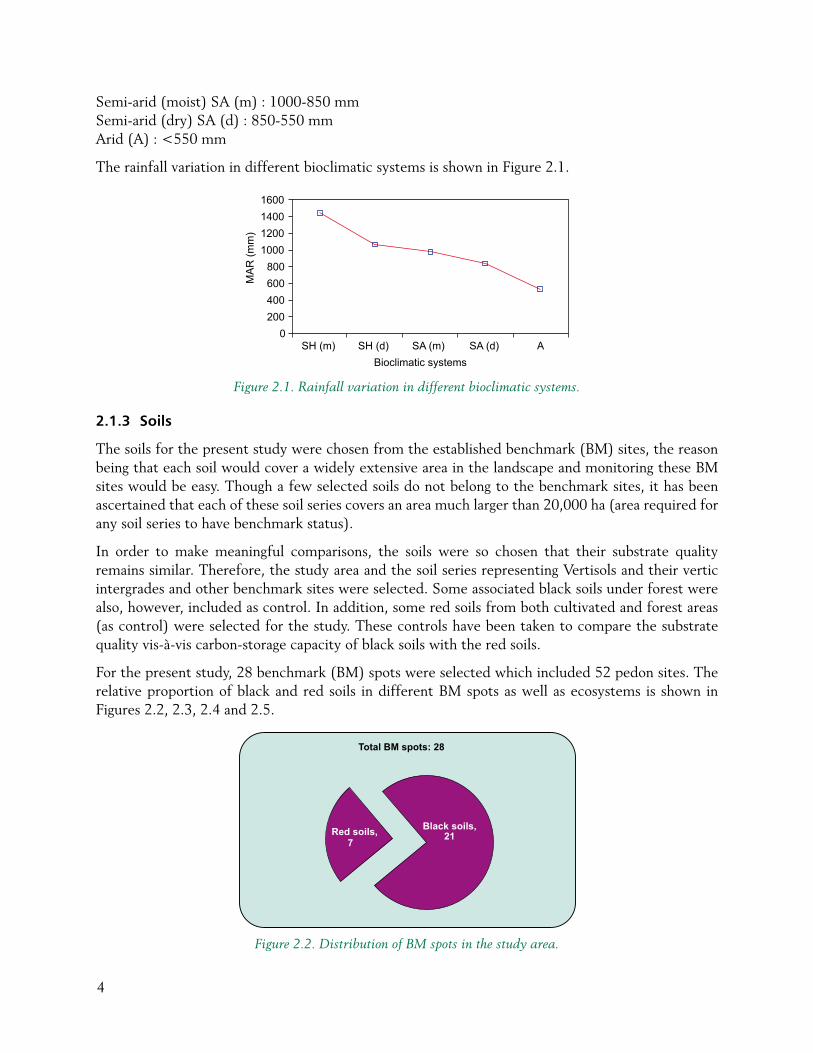
Semi-arid (moist) SA (m) : 1000-850 mmSemi-arid (dry) SA (d) : 850-550 mmArid (A) : <550 mm
The rainfall variation in different bioclimatic systems is shown in Figure 2.1.
Figure 2.1. Rainfall variation in different bioclimatic systems.
2.1.3 Soils
The soils for the present study were chosen from the established benchmark (BM) sites, the reason being that each soil would cover a widely extensive area in the landscape and monitoring these BM sites would be easy. Though a few selected soils do not belong to the benchmark sites, it has been ascertained that each of these soil series covers an area much larger than 20,000 ha (area required for any soil series to have benchmark status).
In order to make meaningful comparisons, the soils were so chosen that their substrate quality remains similar. Therefore, the study area and the soil series representing Vertisols and their vertic intergrades and other benchmark sites were selected. Some associated black soils under forest were also, however, included as control. In addition, some red soils from both cultivated and forest areas (as control) were selected for the study. These controls have been taken to compare the substrate quality vis-à-vis carbon-storage capacity of black soils with the red soils.
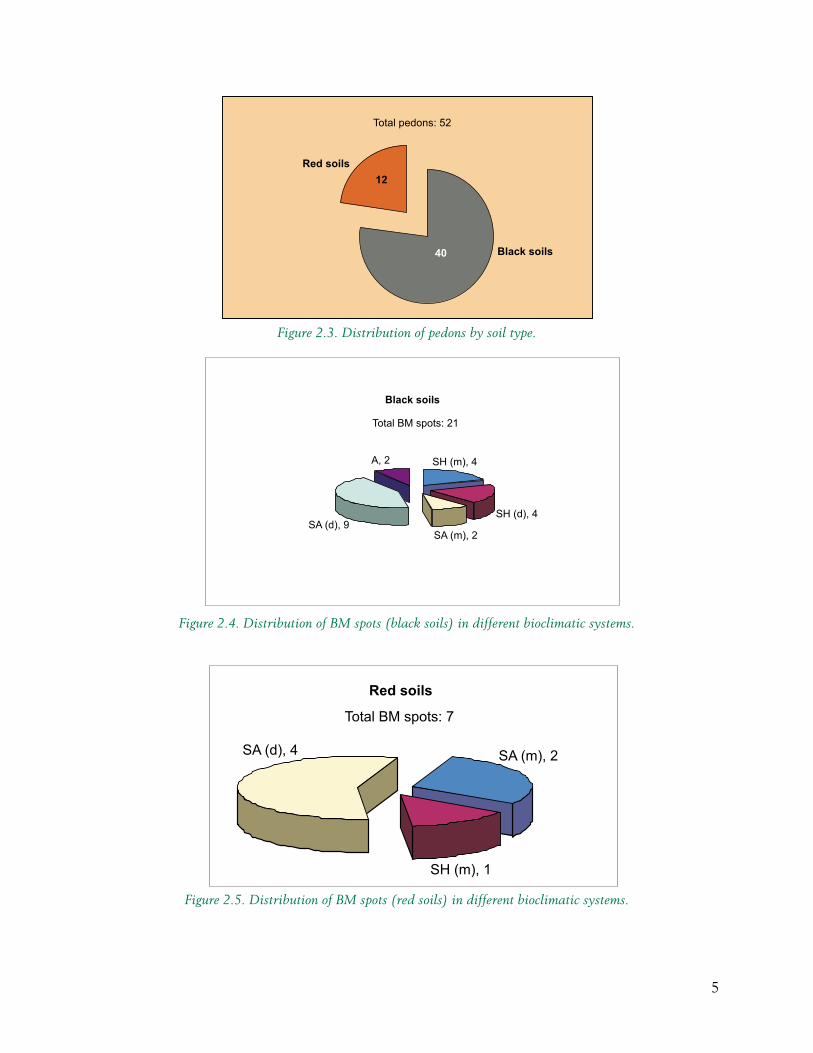
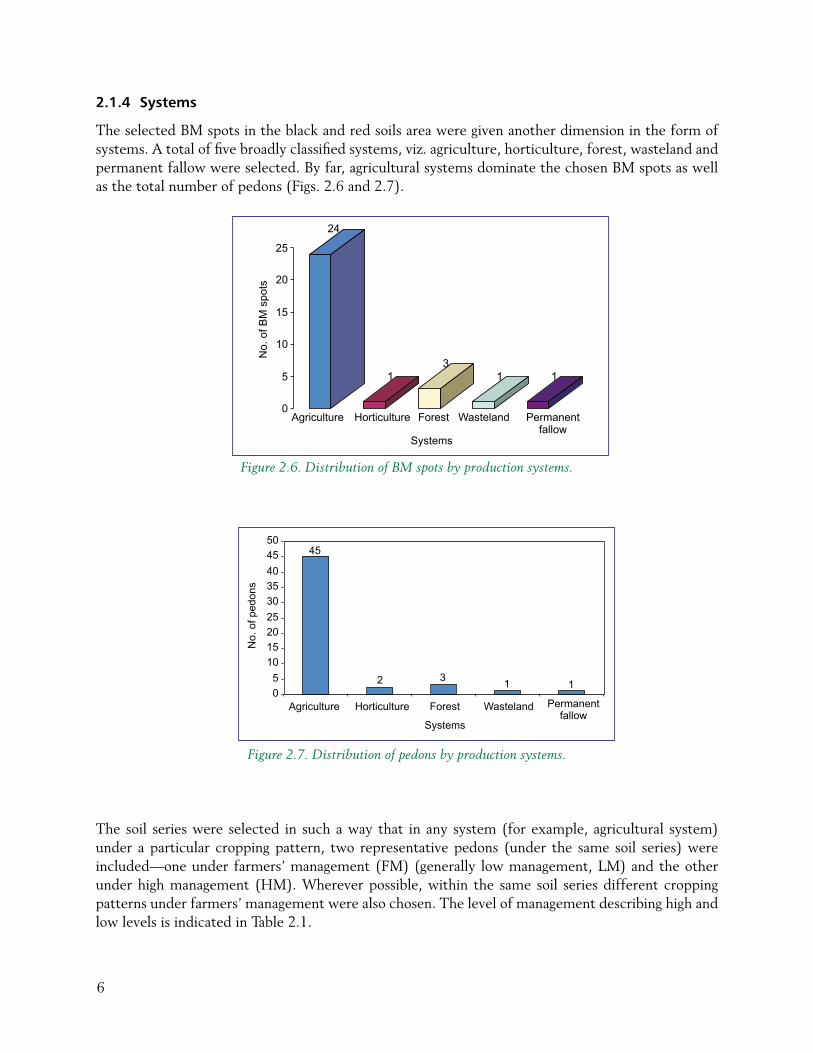
For the present study, 28 benchmark (BM) spots were selected which included 52 pedon sites. The relative proportion of black and red soils in different BM spots as well as ecosystems is shown in Figures 2.2, 2.3, 2.4 and 2.5.
Figure 2.2. Distribution of BM spots in the study area.
5
Figure 2.3. Distribution of pedons by soil type.
Figure 2.4. Distribution of BM spots (black soils) in different bioclimatic systems.
Figure 2.5. Distribution of BM spots (red soils) in different bioclimatic systems.
6
2.1.4 Systems
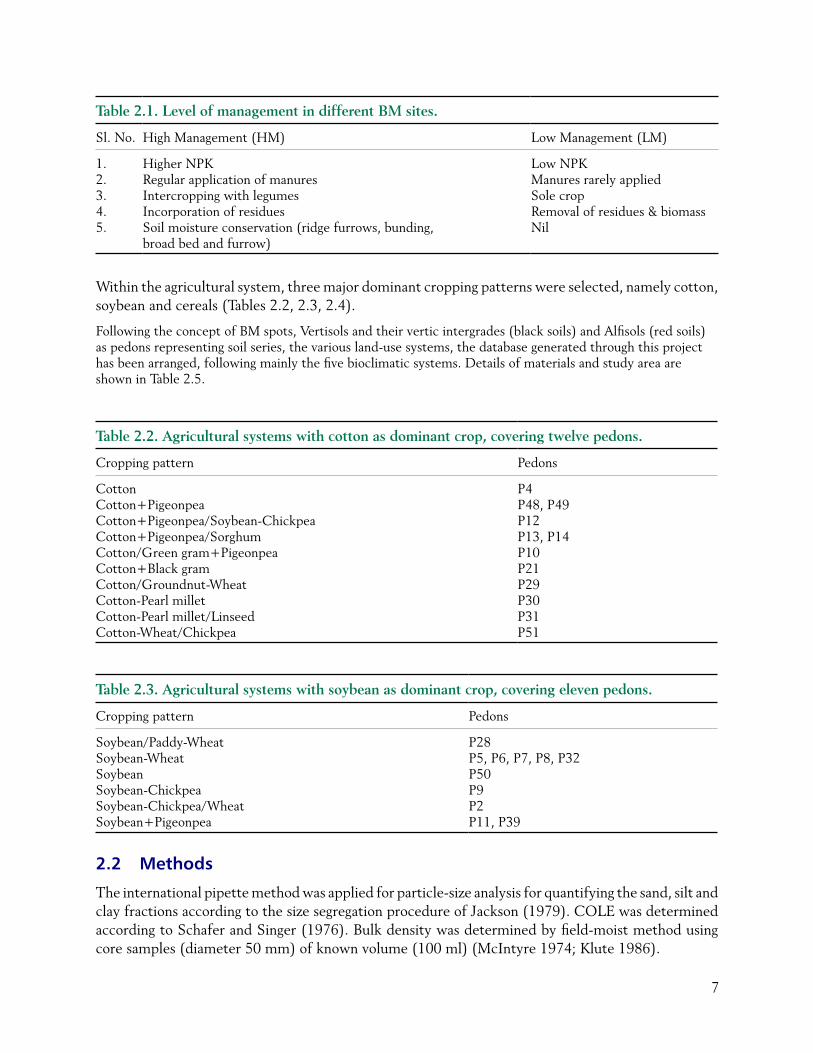
The selected BM spots in the black and red soils area were given another dimension in the form of systems. A total of five broadly classified systems, viz. agriculture, horticulture, forest, wasteland and permanent fallow were selected. By far, agricultural systems dominate the chosen BM spots as well as the total number of pedons (Figs. 2.6 and 2.7).
Figure 2.6. Distribution of BM spots by production systems.
Figure 2.7. Distribution of pedons by production systems.
The soil series were selected in such a way that in any system (for example, agricultural system) under a particular cropping pattern, two representative pedons (under the same soil series) were included—one under farmers’ management (FM) (generally low management, LM) and the other under high management (HM). Wherever possible, within the same soil series different cropping patterns under farmers’ management were also chosen. The level of management describing high and low levels is indicated in Table 2.1.
7
Table 2.1. Level of management in different BM sites.
Sl. No. High Management (HM) Low Management (LM)
1. Higher NPK Low NPK2. Regular application of manures Manures rarely applied3. Intercropping with legumes Sole crop4. Incorporation of residues Removal of residues & biomass5. Soil moisture conservation (ridge furrows, bunding,
broad bed and furrow)Nil
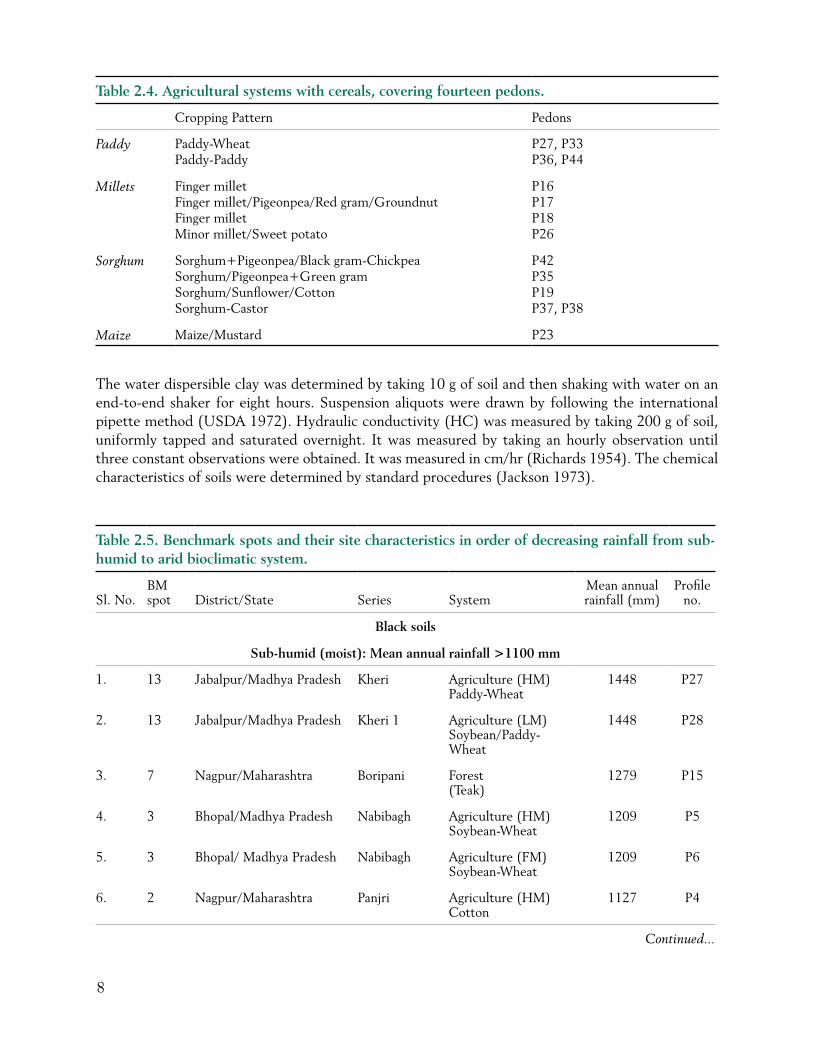
Within the agricultural system, three major dominant cropping patterns were selected, namely cotton, soybean and cereals (Tables 2.2, 2.3, 2.4).
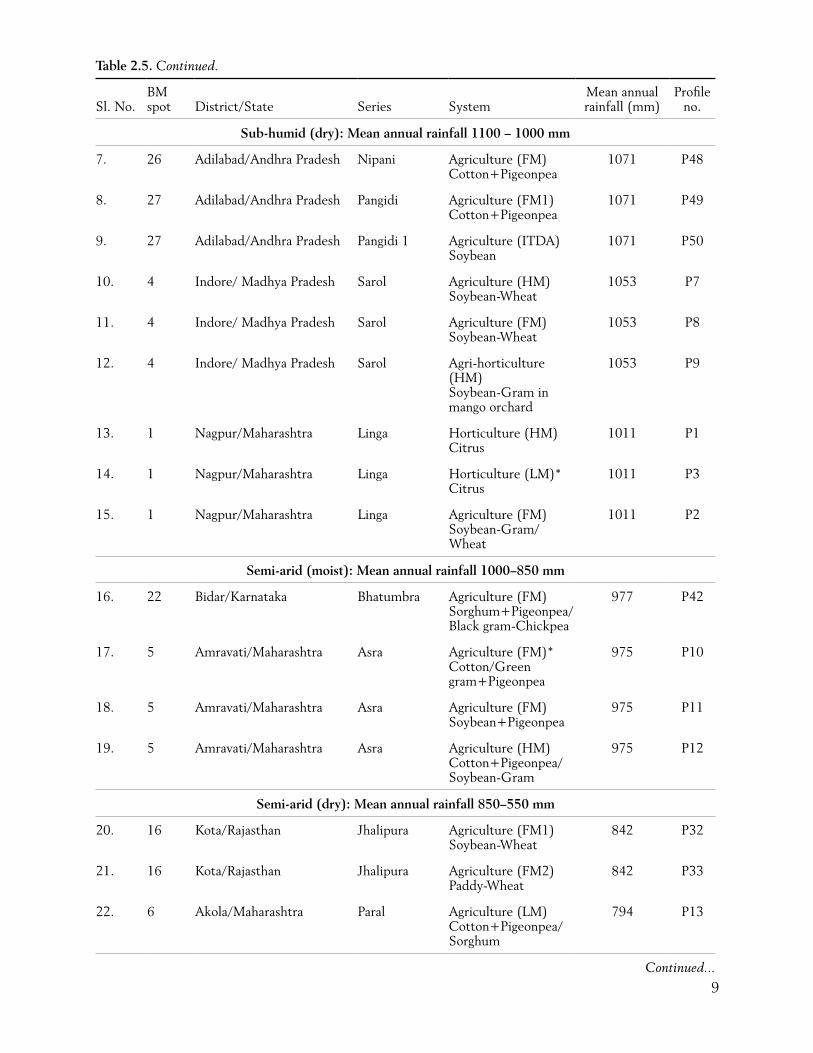
Following the concept of BM spots, Vertisols and their vertic intergrades (black soils) and Alfisols (red soils) as pedons representing soil series, the various land-use systems, the database generated through this project has been arranged, following mainly the five bioclimatic systems. Details of materials and study area are shown in Table 2.5.
Table 2.2. Agricultural systems with cotton as dominant crop, covering twelve pedons.
Cropping pattern Pedons
Cotton P4Cotton+Pigeonpea P48, P49Cotton+Pigeonpea/Soybean-Chickpea P12Cotton+Pigeonpea/Sorghum P13, P14Cotton/Green gram+Pigeonpea P10Cotton+Black gram P21Cotton/Groundnut-Wheat P29Cotton-Pearl millet P30Cotton-Pearl millet/Linseed P31Cotton-Wheat/Chickpea P51
Table 2.3. Agricultural systems with soybean as dominant crop, covering eleven pedons.
Cropping pattern Pedons
Soybean/Paddy-Wheat P28Soybean-Wheat P5, P6, P7, P8, P32Soybean P50Soybean-Chickpea P9Soybean-Chickpea/Wheat P2Soybean+Pigeonpea P11, P39
2.2 Methods
The international pipette method was applied for particle-size analysis for quantifying the sand, silt and clay fractions according to the size segregation procedure of Jackson (1979). COLE was determined according to Schafer and Singer (1976). Bulk density was determined by field-moist method using core samples (diameter 50 mm) of known volume (100 ml) (McIntyre 1974; Klute 1986).
8
The water dispersible clay was determined by taking 10 g of soil and then shaking with water on an end-to-end shaker for eight hours. Suspension aliquots were drawn by following the international pipette method (USDA 1972). Hydraulic conductivity (HC) was measured by taking 200 g of soil, uniformly tapped and saturated overnight. It was measured by taking an hourly observation until three constant observations were obtained. It was measured in cm/hr (Richards 1954). The chemical characteristics of soils were determined by standard procedures (Jackson 1973).
Table 2.4. Agricultural systems with cereals, covering fourteen pedons.
Cropping Pattern Pedons
Paddy Paddy-Wheat P27, P33Paddy-Paddy P36, P44
Millets Finger millet P16Finger millet/Pigeonpea/Red gram/Groundnut P17Finger millet P18Minor millet/Sweet potato P26
Sorghum Sorghum+Pigeonpea/Black gram-Chickpea P42Sorghum/Pigeonpea+Green gram P35Sorghum/Sunflower/Cotton P19Sorghum-Castor P37, P38
Maize Maize/Mustard P23
Table 2.5. Benchmark spots and their site characteristics in order of decreasing rainfall from sub-humid to arid bioclimatic system.
Sl. No.BM spot District/State Series System
Mean annualrainfall (mm)
Profile no.
Black soils
Sub-humid (moist): Mean annual rainfall >1100 mm
1. 13 Jabalpur/Madhya Pradesh Kheri Agriculture (HM)Paddy-Wheat
1448 P27
2. 13 Jabalpur/Madhya Pradesh Kheri 1 Agriculture (LM)Soybean/Paddy-Wheat
1448 P28
3. 7 Nagpur/Maharashtra Boripani Forest(Teak)
1279 P15
4. 3 Bhopal/Madhya Pradesh Nabibagh Agriculture (HM) Soybean-Wheat
1209 P5
5. 3 Bhopal/ Madhya Pradesh Nabibagh Agriculture (FM)Soybean-Wheat
1209 P6
6. 2 Nagpur/Maharashtra Panjri Agriculture (HM)Cotton
1127 P4
Continued...
9
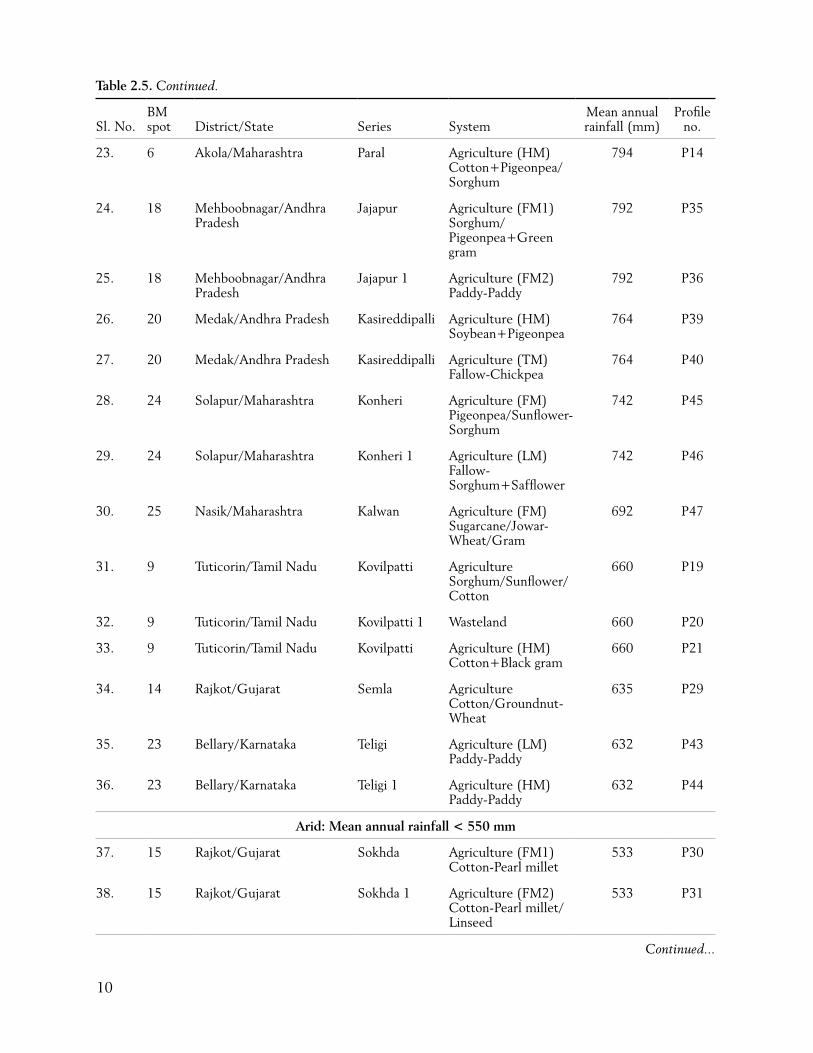
Table 2.5. Continued.
Sl. No.BM spot District/State Series System
Mean annual rainfall (mm)
Profile no.
Sub-humid (dry): Mean annual rainfall 1100 – 1000 mm
7. 26 Adilabad/Andhra Pradesh Nipani Agriculture (FM)Cotton+Pigeonpea
1071 P48
8. 27 Adilabad/Andhra Pradesh Pangidi Agriculture (FM1)Cotton+Pigeonpea
1071 P49
9. 27 Adilabad/Andhra Pradesh Pangidi 1 Agriculture (ITDA)Soybean
1071 P50
10. 4 Indore/ Madhya Pradesh Sarol Agriculture (HM) Soybean-Wheat
1053 P7
11. 4 Indore/ Madhya Pradesh Sarol Agriculture (FM)Soybean-Wheat
1053 P8
12. 4 Indore/ Madhya Pradesh Sarol Agri-horticulture (HM)Soybean-Gram in mango orchard
1053 P9
13. 1 Nagpur/Maharashtra Linga Horticulture (HM)Citrus
1011 P1
14. 1 Nagpur/Maharashtra Linga Horticulture (LM)*Citrus
1011 P3
15. 1 Nagpur/Maharashtra Linga Agriculture (FM)Soybean-Gram/Wheat
1011 P2
Semi-arid (moist): Mean annual rainfall 1000–850 mm
16. 22 Bidar/Karnataka Bhatumbra Agriculture (FM)Sorghum+Pigeonpea/ Black gram-Chickpea
977 P42
17. 5 Amravati/Maharashtra Asra Agriculture (FM)*Cotton/Green gram+Pigeonpea
975 P10
18. 5 Amravati/Maharashtra Asra Agriculture (FM)Soybean+Pigeonpea
975 P11
19. 5 Amravati/Maharashtra Asra Agriculture (HM)Cotton+Pigeonpea/Soybean-Gram
975 P12
Semi-arid (dry): Mean annual rainfall 850–550 mm
20. 16 Kota/Rajasthan Jhalipura Agriculture (FM1)Soybean-Wheat
842 P32
21. 16 Kota/Rajasthan Jhalipura Agriculture (FM2)Paddy-Wheat
842 P33
22. 6 Akola/Maharashtra Paral Agriculture (LM) Cotton+Pigeonpea/Sorghum
794 P13
Continued...
10
Table 2.5. Continued.
Sl. No.BM spot District/State Series System
Mean annual rainfall (mm)
Profile no.
23. 6 Akola/Maharashtra Paral Agriculture (HM)Cotton+Pigeonpea/Sorghum
794 P14
24. 18 Mehboobnagar/Andhra Pradesh
Jajapur Agriculture (FM1) Sorghum/Pigeonpea+Green gram
792 P35
25. 18 Mehboobnagar/Andhra Pradesh
Jajapur 1 Agriculture (FM2)Paddy-Paddy
792 P36
26. 20 Medak/Andhra Pradesh Kasireddipalli Agriculture (HM)Soybean+Pigeonpea
764 P39
27. 20 Medak/Andhra Pradesh Kasireddipalli Agriculture (TM)Fallow-Chickpea
764 P40
28. 24 Solapur/Maharashtra Konheri Agriculture (FM) Pigeonpea/Sunflower-Sorghum
742 P45
29. 24 Solapur/Maharashtra Konheri 1 Agriculture (LM)Fallow-Sorghum+Safflower
742 P46
30. 25 Nasik/Maharashtra Kalwan Agriculture (FM) Sugarcane/Jowar-Wheat/Gram
692 P47
31. 9 Tuticorin/Tamil Nadu Kovilpatti AgricultureSorghum/Sunflower/Cotton
660 P19
32. 9 Tuticorin/Tamil Nadu Kovilpatti 1 Wasteland 660 P20
33. 9 Tuticorin/Tamil Nadu Kovilpatti Agriculture (HM)Cotton+Black gram
660 P21
34. 14 Rajkot/Gujarat Semla Agriculture Cotton/Groundnut-Wheat
635 P29
35. 23 Bellary/Karnataka Teligi Agriculture (LM)Paddy-Paddy
632 P43
36. 23 Bellary/Karnataka Teligi 1 Agriculture (HM)Paddy-Paddy
632 P44
Arid: Mean annual rainfall < 550 mm
37. 15 Rajkot/Gujarat Sokhda Agriculture (FM1)Cotton-Pearl millet
533 P30
38. 15 Rajkot/Gujarat Sokhda 1 Agriculture (FM2)Cotton-Pearl millet/Linseed
533 P31
Continued...
11
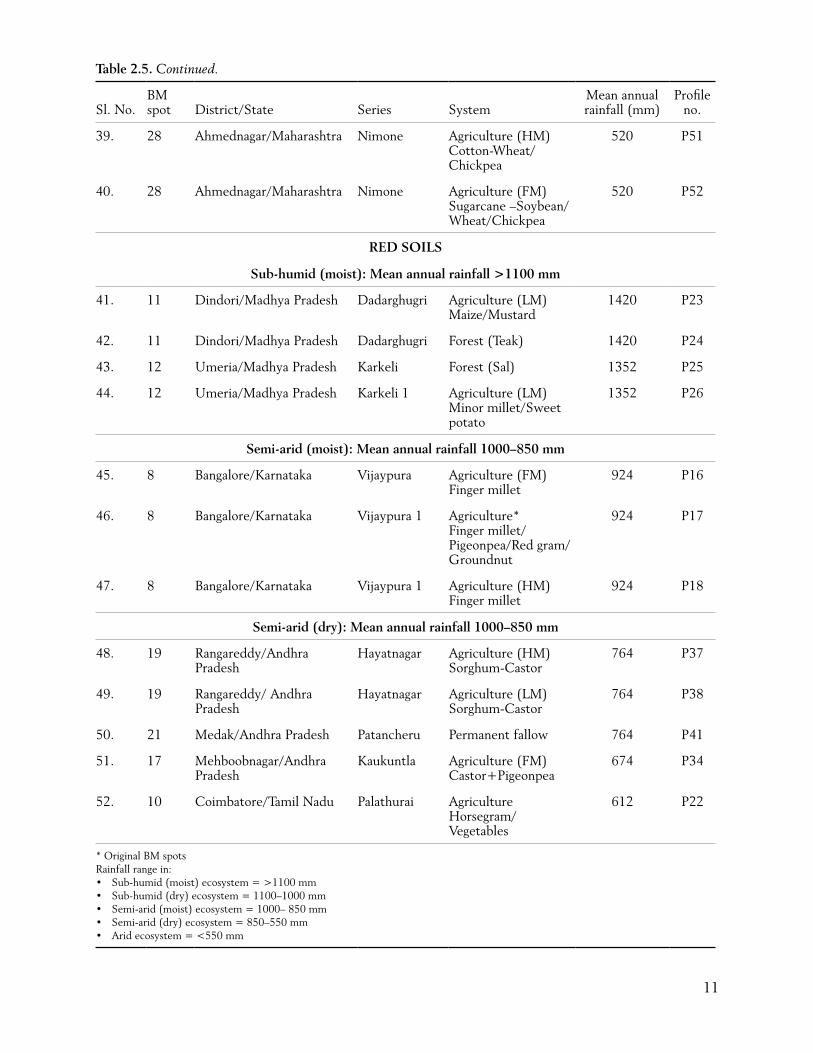
Table 2.5. Continued.
Sl. No.BM spot District/State Series System
Mean annual rainfall (mm)
Profile no.
39. 28 Ahmednagar/Maharashtra Nimone Agriculture (HM)Cotton-Wheat/Chickpea
520 P51
40. 28 Ahmednagar/Maharashtra Nimone Agriculture (FM)Sugarcane –Soybean/Wheat/Chickpea
520 P52
RED SOILS
Sub-humid (moist): Mean annual rainfall >1100 mm
41. 11 Dindori/Madhya Pradesh Dadarghugri Agriculture (LM)Maize/Mustard
1420 P23
42. 11 Dindori/Madhya Pradesh Dadarghugri Forest (Teak) 1420 P24
43. 12 Umeria/Madhya Pradesh Karkeli Forest (Sal) 1352 P25
44. 12 Umeria/Madhya Pradesh Karkeli 1 Agriculture (LM)Minor millet/Sweet potato
1352 P26
Semi-arid (moist): Mean annual rainfall 1000–850 mm
45. 8 Bangalore/Karnataka Vijaypura Agriculture (FM) Finger millet
924 P16
46. 8 Bangalore/Karnataka Vijaypura 1 Agriculture*Finger millet/Pigeonpea/Red gram/Groundnut
924 P17
47. 8 Bangalore/Karnataka Vijaypura 1 Agriculture (HM)Finger millet
924 P18
Semi-arid (dry): Mean annual rainfall 1000–850 mm
48. 19 Rangareddy/Andhra Pradesh
Hayatnagar Agriculture (HM)Sorghum-Castor
764 P37
49. 19 Rangareddy/ Andhra Pradesh
Hayatnagar Agriculture (LM)Sorghum-Castor
764 P38
50. 21 Medak/Andhra Pradesh Patancheru Permanent fallow 764 P41
51. 17 Mehboobnagar/Andhra Pradesh
Kaukuntla Agriculture (FM)Castor+Pigeonpea
674 P34
52. 10 Coimbatore/Tamil Nadu Palathurai AgricultureHorsegram/Vegetables
612 P22
* Original BM spotsRainfall range in:• Sub-humid(moist)ecosystem=>1100mm• Sub-humid(dry)ecosystem=1100–1000mm• Semi-arid(moist)ecosystem=1000–850mm• Semi-arid(dry)ecosystem=850–550mm• Aridecosystem=<550mm
12
Chapter 3: Results and Discussion
The physical and chemical properties of selected benchmark soils are discussed in the following chapters to find out which bioclimatic systems offer greater scope for organic as well as inorganic carbon sequestration.
3.1 Particle-Size Distribution in Soils
For the convenience of characterizing and classifying soil for agricultural and non-agricultural purposes, the soil materials are separated into coarse and fine particles. Several systems of classification of soils on the basis of particle-size classes are used to interpret soils for their uses—agricultural or non-agricultural. The particle-size distribution data in fine-earth fractions are used mainly to substitute the field-texture data obtained by ‘feeling method’. The data on particle sizes serve as a check on the homogeneity of soil profiles.
The soils selected for the present study belong to Vertisols and their intergrades. Logically, the sand, silt and clay content should be within the range to qualify them as Vertisols (Soil Survey Staff 1999). However, depending on geological formation and the bioclimatic region, the contents of sand, silt and clay vary as shown in Table 3.1.
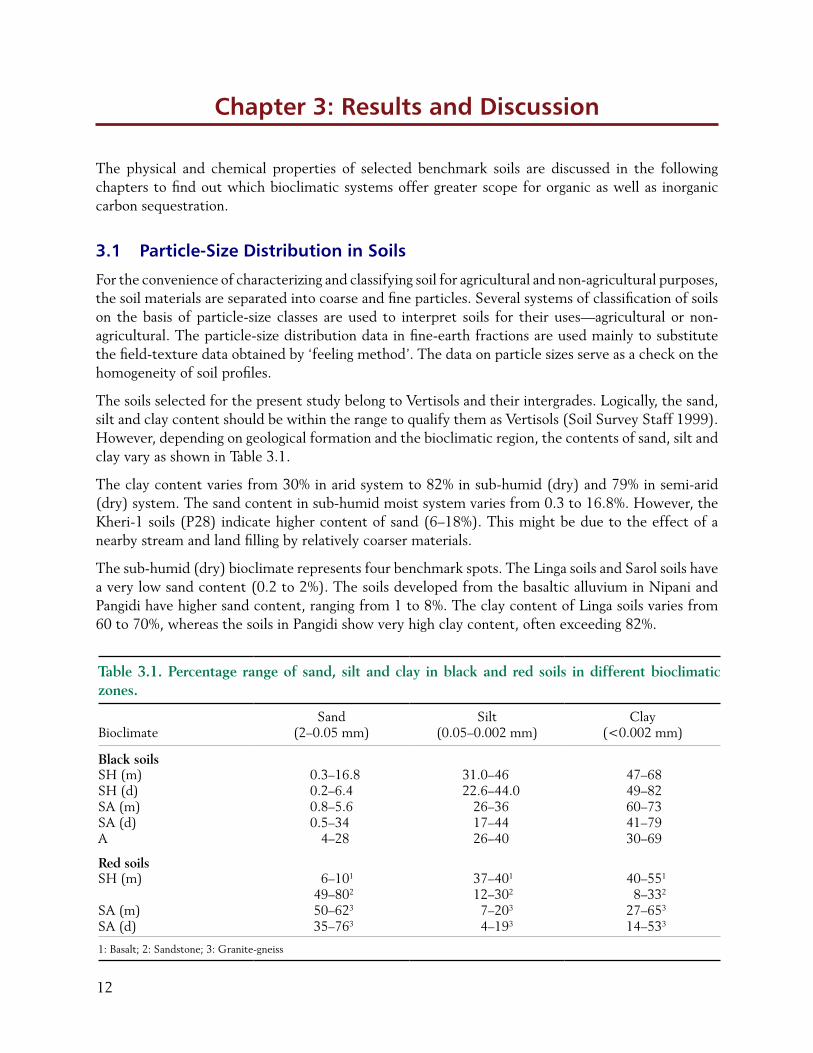
The clay content varies from 30% in arid system to 82% in sub-humid (dry) and 79% in semi-arid (dry) system. The sand content in sub-humid moist system varies from 0.3 to 16.8%. However, the Kheri-1 soils (P28) indicate higher content of sand (6–18%). This might be due to the effect of a nearby stream and land filling by relatively coarser materials.
The sub-humid (dry) bioclimate represents four benchmark spots. The Linga soils and Sarol soils have a very low sand content (0.2 to 2%). The soils developed from the basaltic alluvium in Nipani and Pangidi have higher sand content, ranging from 1 to 8%. The clay content of Linga soils varies from 60 to 70%, whereas the soils in Pangidi show very high clay content, often exceeding 82%.
Table 3.1. Percentage range of sand, silt and clay in black and red soils in different bioclimatic zones.
BioclimateSand
(2–0.05 mm)Silt
(0.05–0.002 mm)Clay
(<0.002 mm)
Black soilsSH (m) 0.3–16.8 31.0–46 47–68SH (d) 0.2–6.4 22.6–44.0 49–82SA (m) 0.8–5.6 26–36 60–73SA (d) 0.5–34 17–44 41–79A 4–28 26–40 30–69
Red soilsSH (m) 6–101
49–80237–401
12–30240–551
8–332
SA (m) 50–623 7–203 27–653
SA (d) 35–763 4–193 14–533
1: Basalt; 2: Sandstone; 3: Granite-gneiss
13
In semi-arid (moist) system, clay content is more than 60% in all the soils. The sand content ranges from 0.8 to 5.6%, with Bhatumbra soils having more sand than Asra soils.
In semi-arid (dry) zone, the sand content ranges from 0.5 to 34%. The lower content of sand is found in Paral and Konheri soils. The clay content also shows a wide range from 41 to 79%. The lower content of clay is common in Semla, Jhalipura, Jajapur, Kasireddipalli, Teligi and Konheri soils where the range is 41 to 55%.
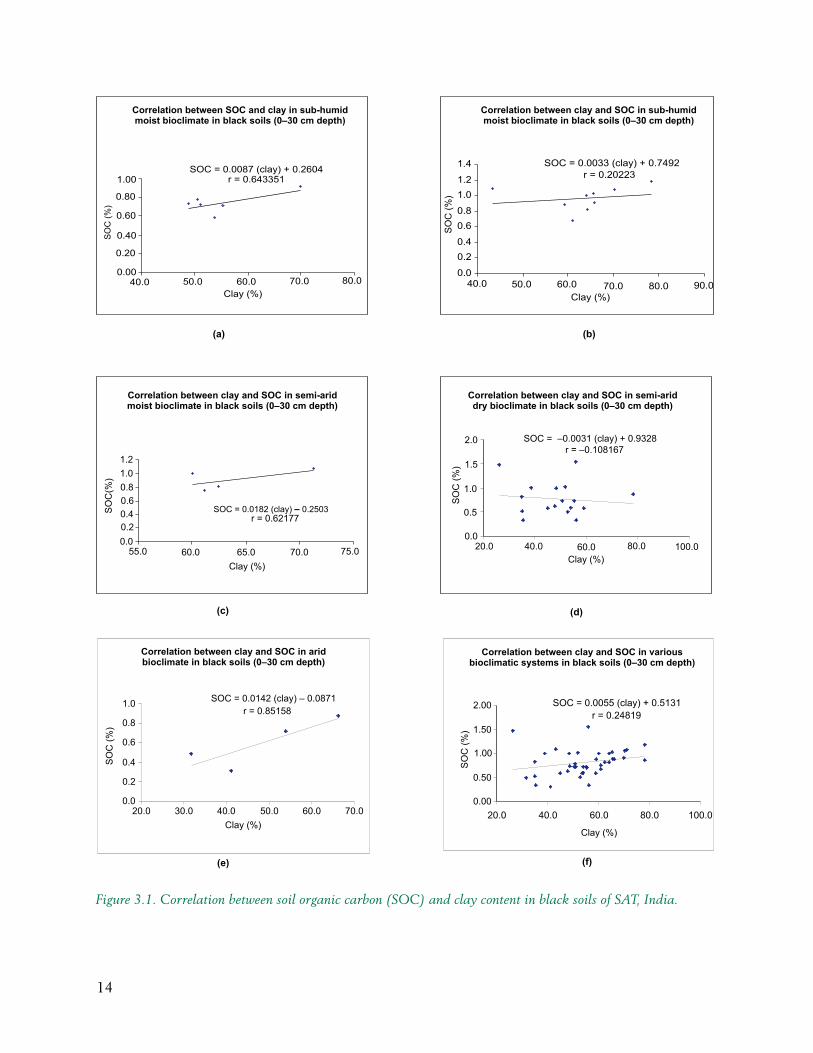
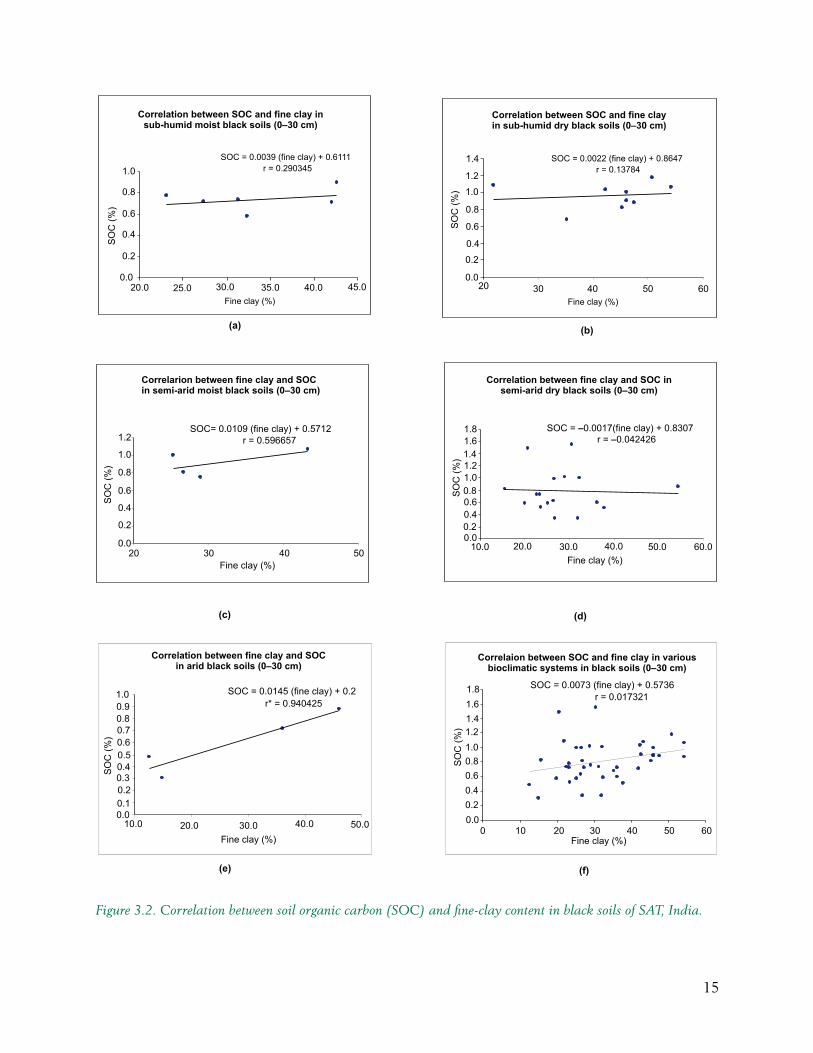
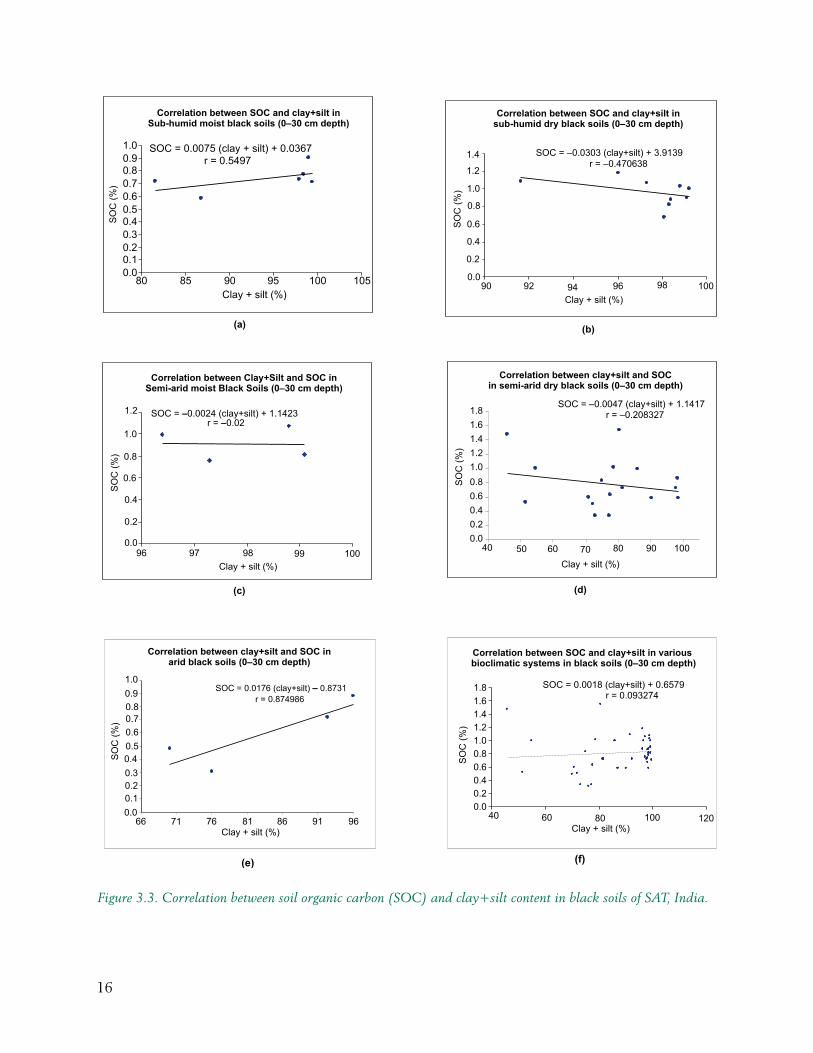
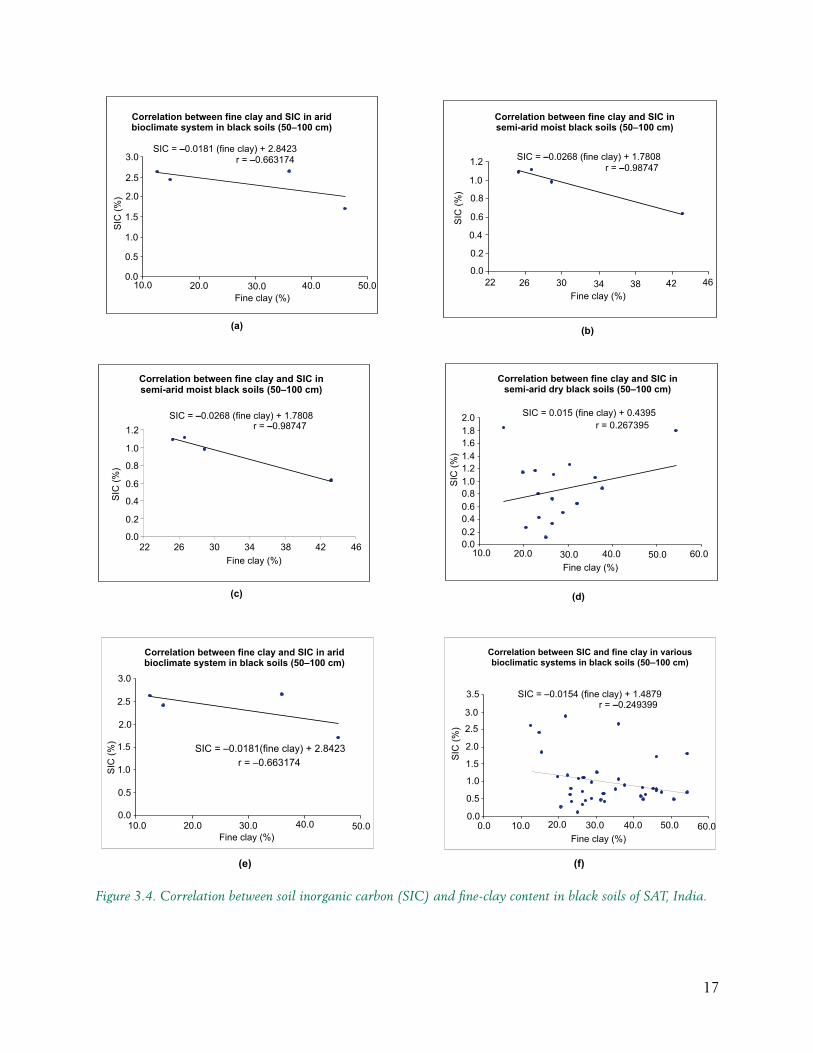
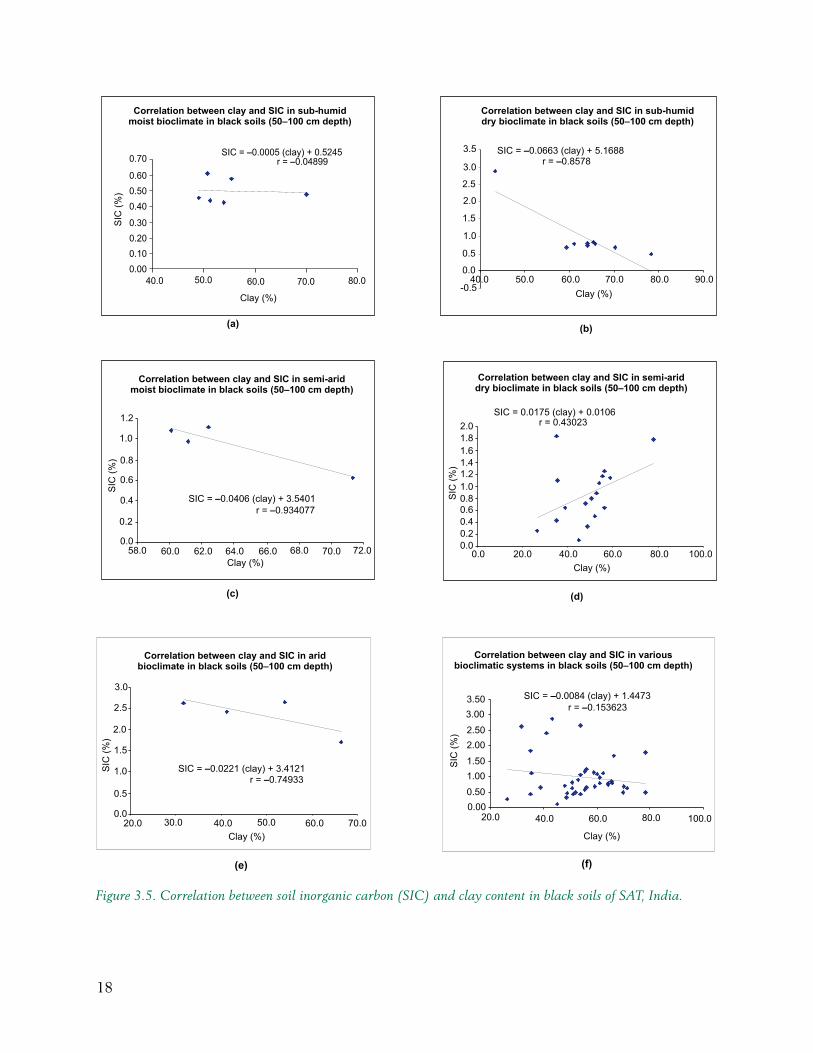
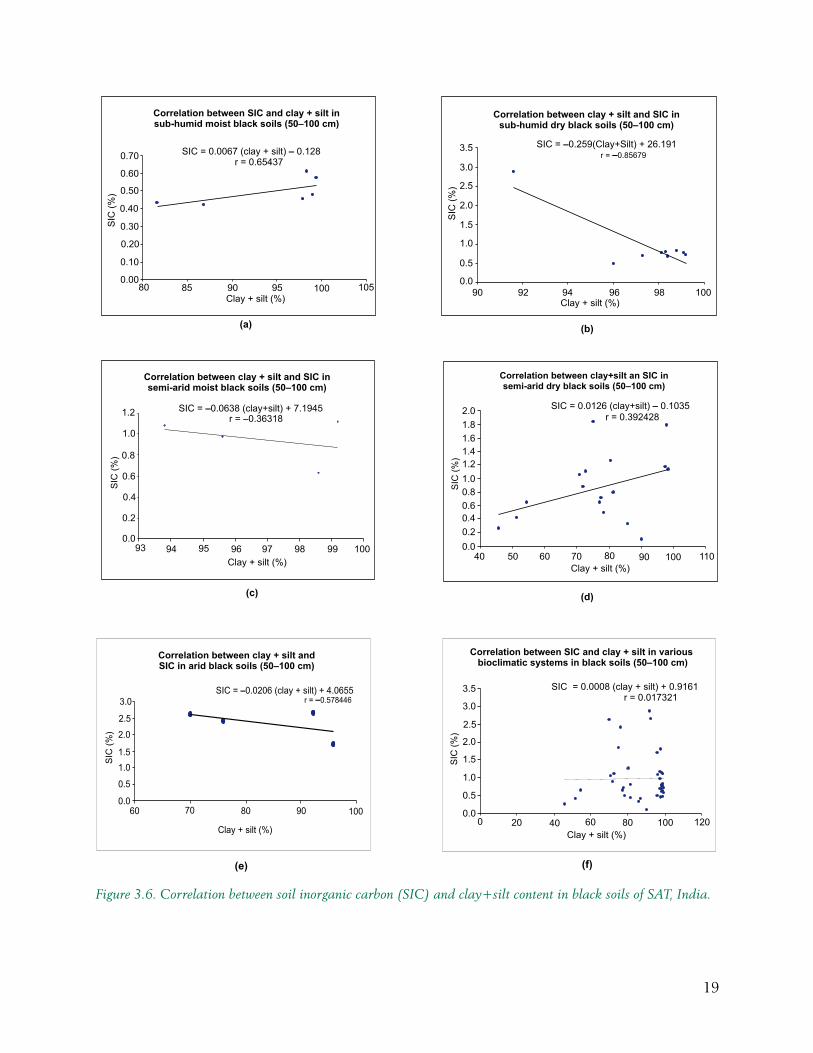
The seat of charge in soil mostly lies in clays and fine-silt fractions. Therefore, both the physical and chemical activities of soils are expected to be controlled by clay and silt. The major emphasis being the status of carbon in the soils, it seems prudent to establish relationships of organic carbon (SOC) and inorganic carbon in soils (SIC) with the reactive components, namely clay (<2 µ), fine clay (<0.2 µ) and clay+silt (<50 µ). With this in view, fine clay, clay, clay + silt percentage values were compared with SOC and SIC percentage values for black soils in different bioclimatic systems. A relationship with all the data sets was also found, irrespective of the bioclimatic systems.
The relationships of clay, fine clay, clay + silt with SOC in surface horizons are shown in Figures 3.1, 3.2 and 3.3. Similarly, a general relationship between clay, fine clay, clay + silt and SIC in 50–100 cm depth is shown in Figures 3.4, 3.5 and 3.6.
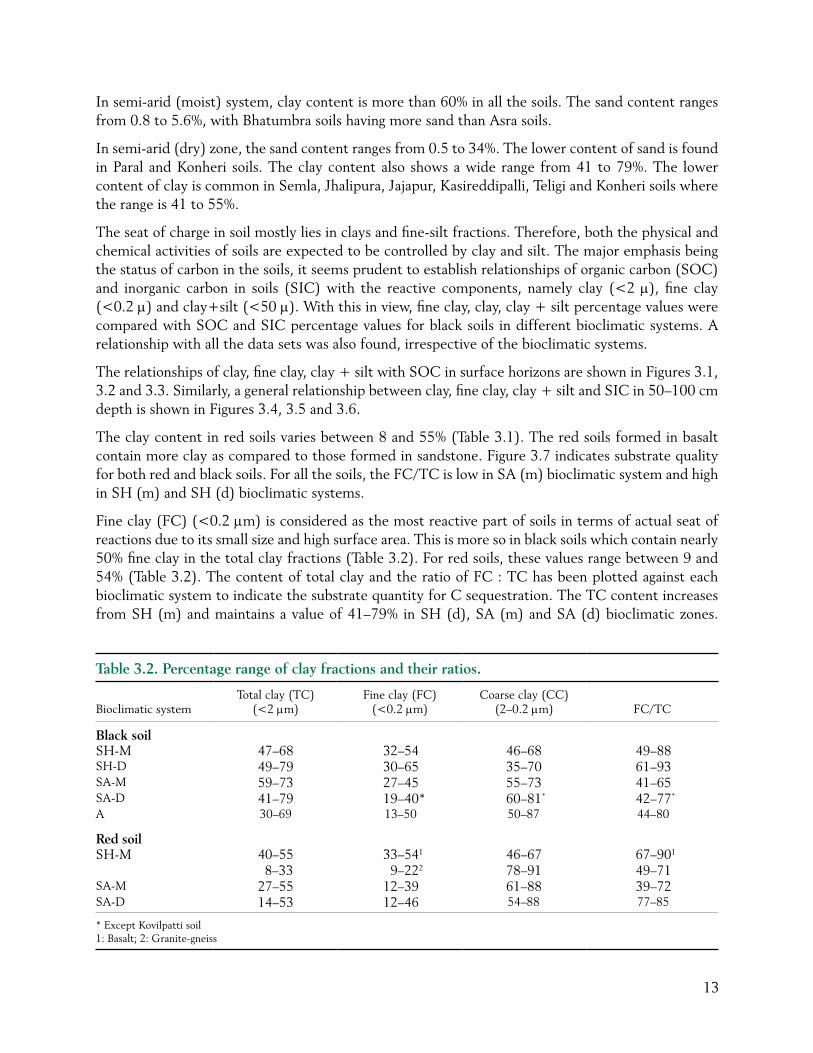
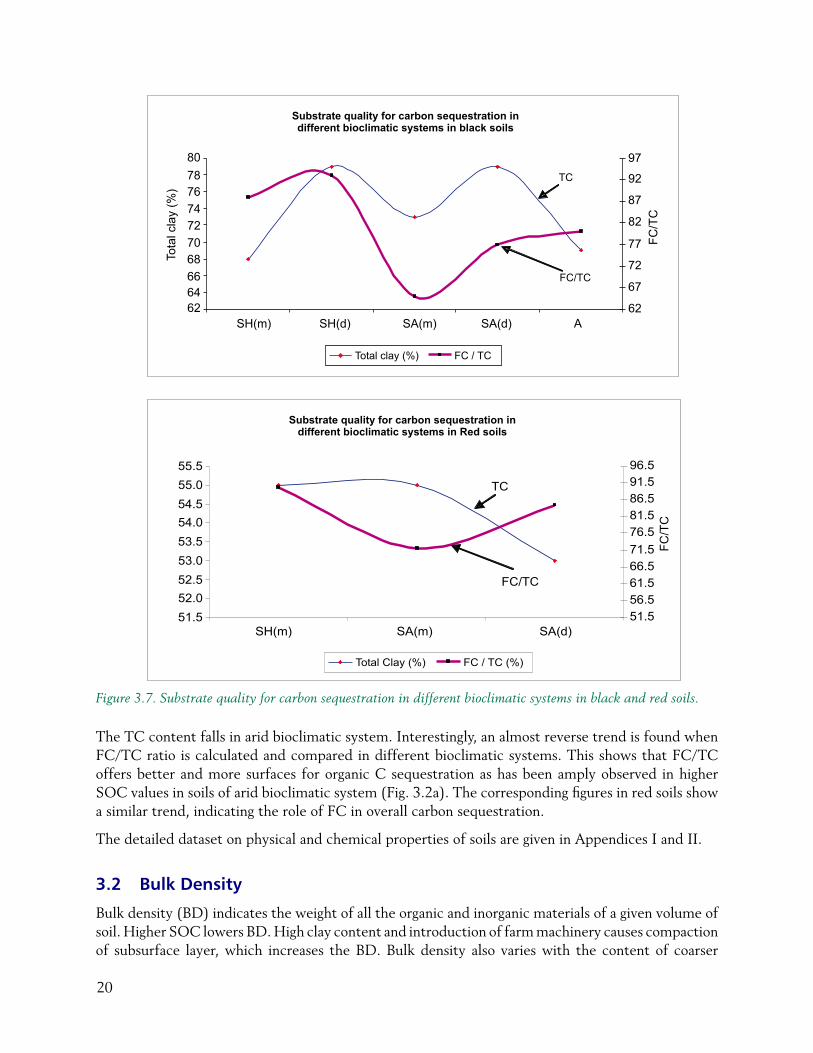
The clay content in red soils varies between 8 and 55% (Table 3.1). The red soils formed in basalt contain more clay as compared to those formed in sandstone. Figure 3.7 indicates substrate quality for both red and black soils. For all the soils, the FC/TC is low in SA (m) bioclimatic system and high in SH (m) and SH (d) bioclimatic systems.
Fine clay (FC) (<0.2 µm) is considered as the most reactive part of soils in terms of actual seat of reactions due to its small size and high surface area. This is more so in black soils which contain nearly 50% fine clay in the total clay fractions (Table 3.2). For red soils, these values range between 9 and 54% (Table 3.2). The content of total clay and the ratio of FC : TC has been plotted against each bioclimatic system to indicate the substrate quantity for C sequestration. The TC content increases from SH (m) and maintains a value of 41–79% in SH (d), SA (m) and SA (d) bioclimatic zones.
Table 3.2. Percentage range of clay fractions and their ratios.
Bioclimatic systemTotal clay (TC)
(<2 µm)Fine clay (FC)
(<0.2 µm)Coarse clay (CC)
(2–0.2 µm) FC/TC
Black soilSH-M 47–68 32–54 46–68 49–88 SH-D 49–79 30–65 35–70 61–93 SA-M 59–73 27–45 55–73 41–65 SA-D 41–79 19–40* 60–81* 42–77*
A 30–69 13–50 50–87 44–80
Red soilSH-M 40–55
8–33 33–541
9–22246–6778–91
67–901
49–71SA-M 27–55 12–39 61–88 39–72SA-D 14–53 12–46 54–88 77–85
* Except Kovilpatti soil1: Basalt; 2: Granite-gneiss
14
Figure 3.1. Correlation between soil organic carbon (SOC) and clay content in black soils of SAT, India.
15
Figure 3.2. Correlation between soil organic carbon (SOC) and fine-clay content in black soils of SAT, India.
16
Figure 3.3. Correlation between soil organic carbon (SOC) and clay+silt content in black soils of SAT, India.
17
Figure 3.4. Correlation between soil inorganic carbon (SIC) and fine-clay content in black soils of SAT, India.
18
Figure 3.5. Correlation between soil inorganic carbon (SIC) and clay content in black soils of SAT, India.
19
Figure 3.6. Correlation between soil inorganic carbon (SIC) and clay+silt content in black soils of SAT, India.
20
Figure 3.7. Substrate quality for carbon sequestration in different bioclimatic systems in black and red soils.
The TC content falls in arid bioclimatic system. Interestingly, an almost reverse trend is found when FC/TC ratio is calculated and compared in different bioclimatic systems. This shows that FC/TC offers better and more surfaces for organic C sequestration as has been amply observed in higher SOC values in soils of arid bioclimatic system (Fig. 3.2a). The corresponding figures in red soils show a similar trend, indicating the role of FC in overall carbon sequestration.
The detailed dataset on physical and chemical properties of soils are given in Appendices I and II.
3.2 Bulk Density
Bulk density (BD) indicates the weight of all the organic and inorganic materials of a given volume of soil. Higher SOC lowers BD. High clay content and introduction of farm machinery causes compaction of subsurface layer, which increases the BD. Bulk density also varies with the content of coarser
21
fragments in soils. There is a growing acceptance of the view that BD changes due to change in land-use pattern. A study was conducted with soil profiles from an undisturbed 30-to-40-year-old forest, a completely deforested area used for field crops for 20 years (wheat), and an agroforestry system. The soils were coarse silty, carbonaceous, calcixerollic xerochrept. Deforestation and subsequent cultivation resulted in almost a 20% increase in soil bulk density (Hajabassi et al. 1997).
The BD of Vertisols varies greatly because of their swelling and shrinking nature. Since shrink-swell phenomenon depends on soil moisture content, a change in moisture level changes BD values. In general, the Vertisols have higher BD when they are dry and lower BD in a swollen stage. Depending on moisture content, the BD values are reported to vary from 1 to 2 g/cc (Jewitt et al. 1979). Due to compression caused by overburden weight, the BD values usually increase with soil depth. It has been reported that Vertisols may have BD values as high as 2.1 gm/cc (Dudal 1965). It has been also shown that at the swelling limit, the gravimetric water content decreases and BD values increase with depth (Yule and Ritchie 1980). They also reported that the depressions of the two gilgai sites showed higher water content and lower BD at swelling limit than the mounds. A dry Vertisol suffers a volume change of nearly 60% when it is saturated with water. It is suggested that the BD of such soils should be corrected to a reference moisture level (25% w/w) to minimize error caused by the initial moisture content of the soils (Rao et al. 1978).
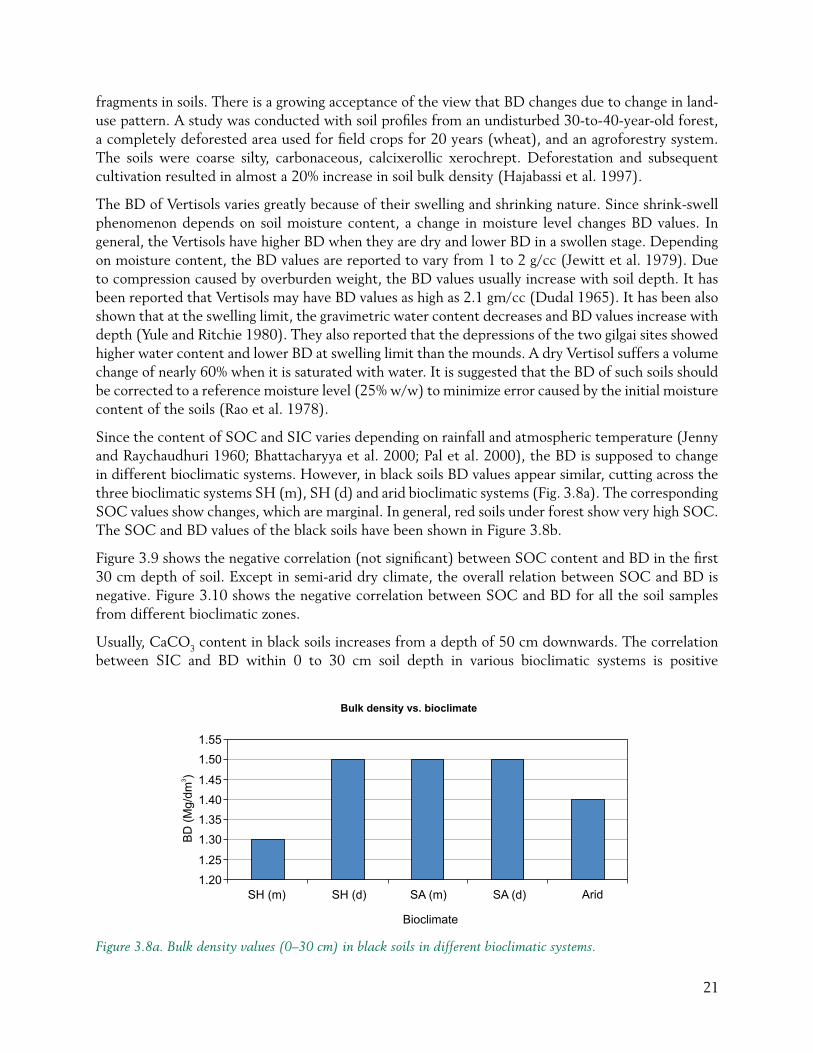
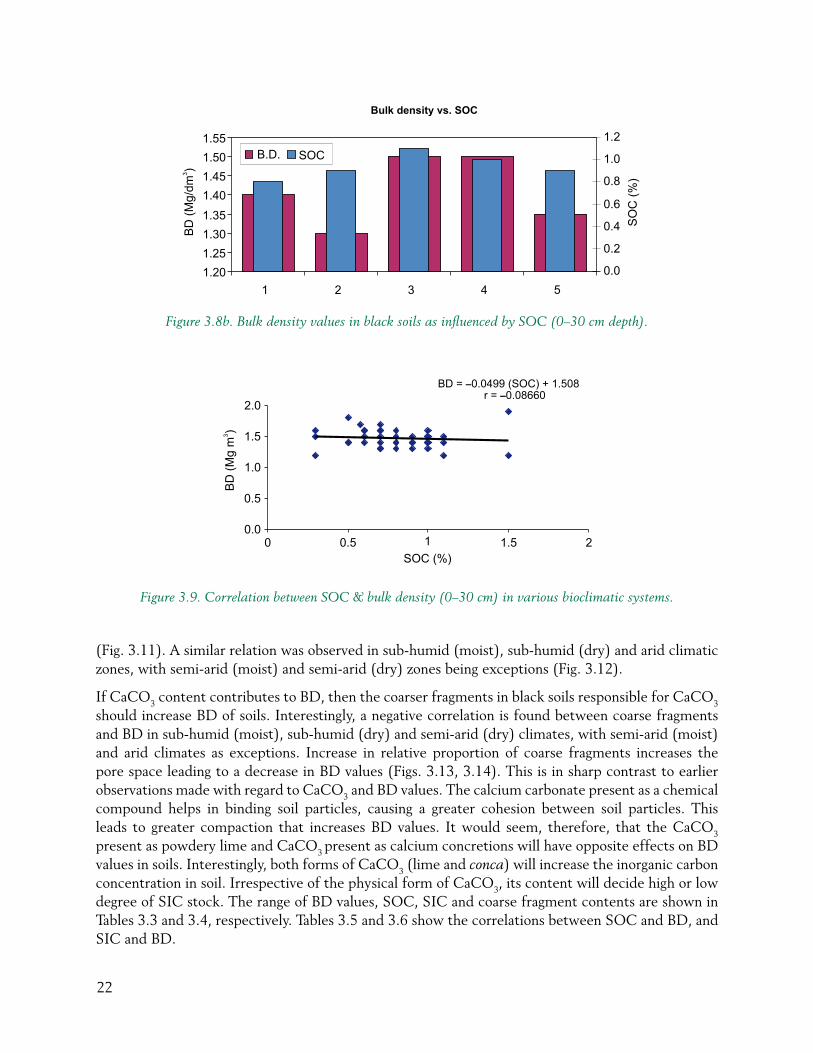
Since the content of SOC and SIC varies depending on rainfall and atmospheric temperature (Jenny and Raychaudhuri 1960; Bhattacharyya et al. 2000; Pal et al. 2000), the BD is supposed to change in different bioclimatic systems. However, in black soils BD values appear similar, cutting across the three bioclimatic systems SH (m), SH (d) and arid bioclimatic systems (Fig. 3.8a). The corresponding SOC values show changes, which are marginal. In general, red soils under forest show very high SOC. The SOC and BD values of the black soils have been shown in Figure 3.8b.
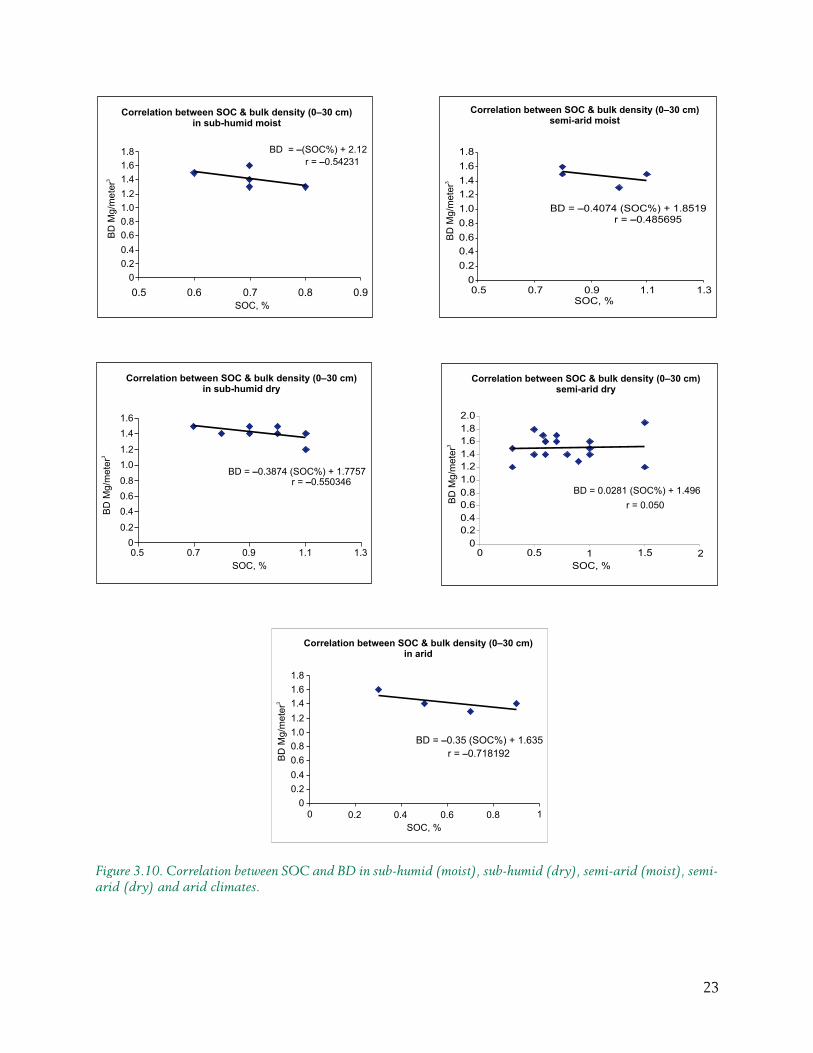
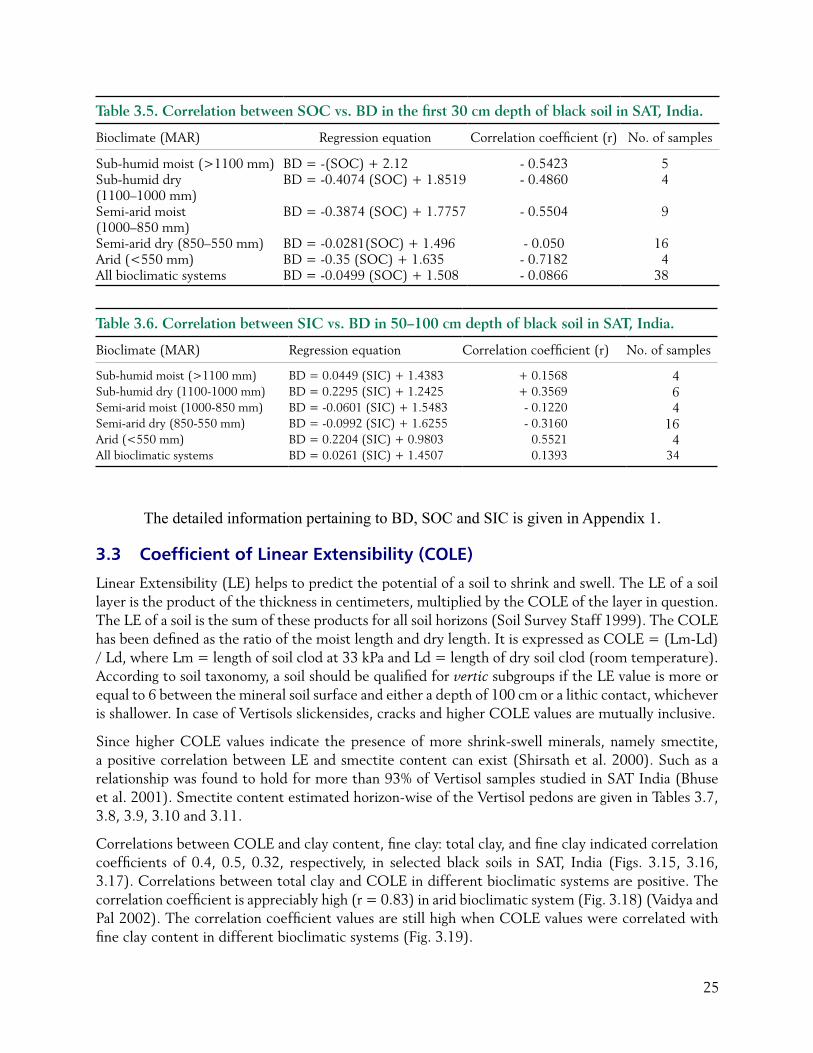
Figure 3.9 shows the negative correlation (not significant) between SOC content and BD in the first 30 cm depth of soil. Except in semi-arid dry climate, the overall relation between SOC and BD is negative. Figure 3.10 shows the negative correlation between SOC and BD for all the soil samples from different bioclimatic zones.
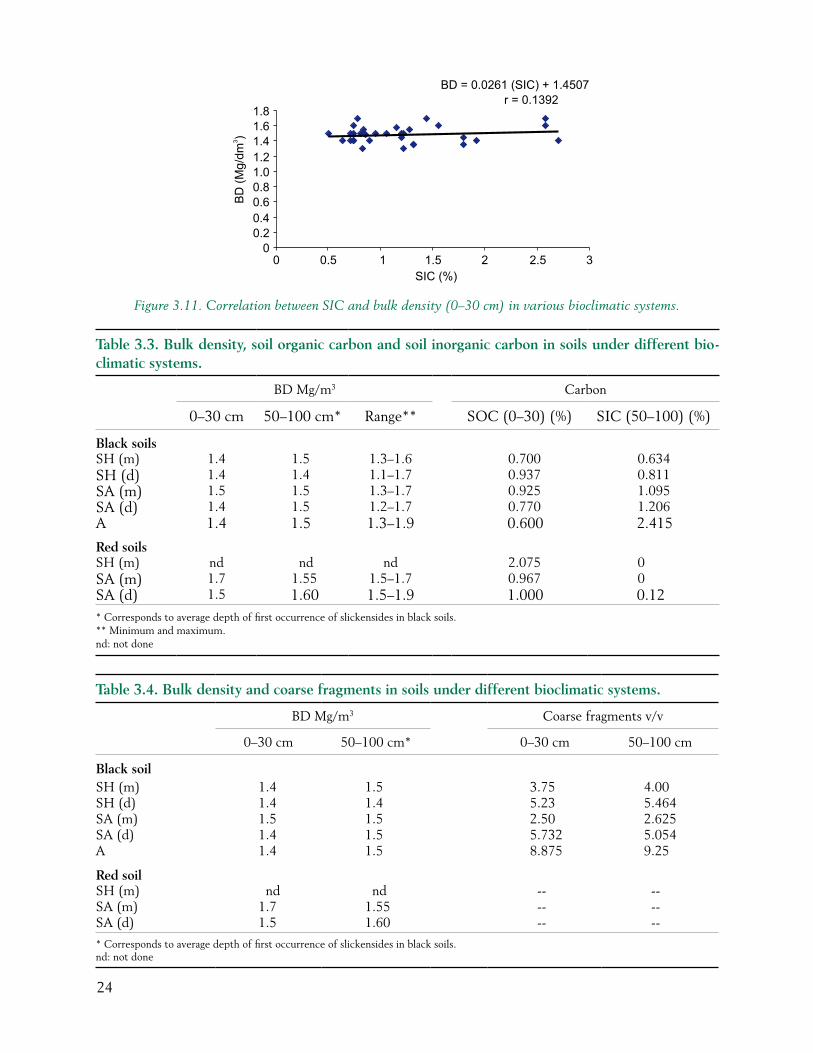
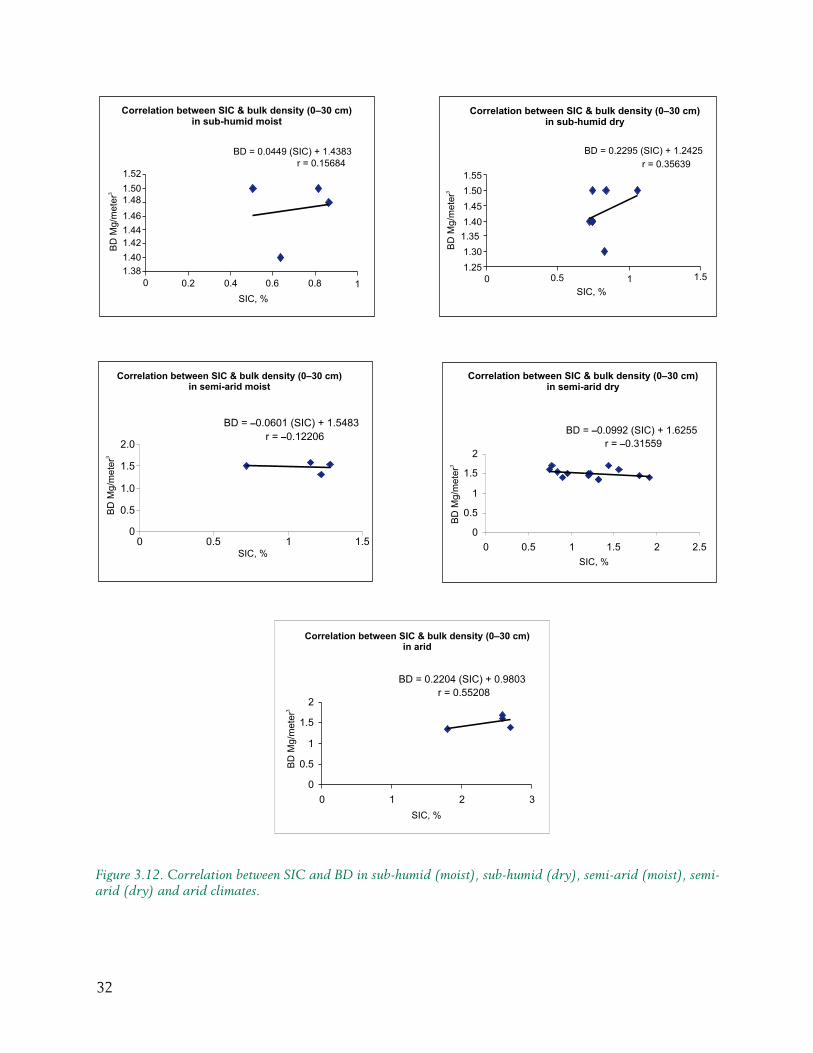
Usually, CaCO3 content in black soils increases from a depth of 50 cm downwards. The correlation between SIC and BD within 0 to 30 cm soil depth in various bioclimatic systems is positive
Figure 3.8a. Bulk density values (0–30 cm) in black soils in different bioclimatic systems.
22
Figure 3.8b. Bulk density values in black soils as influenced by SOC (0 –30 cm depth).
Figure 3.9. Correlation between SOC & bulk density (0–30 cm) in various bioclimatic systems.
(Fig. 3.11). A similar relation was observed in sub-humid (moist), sub-humid (dry) and arid climatic zones, with semi-arid (moist) and semi-arid (dry) zones being exceptions (Fig. 3.12).
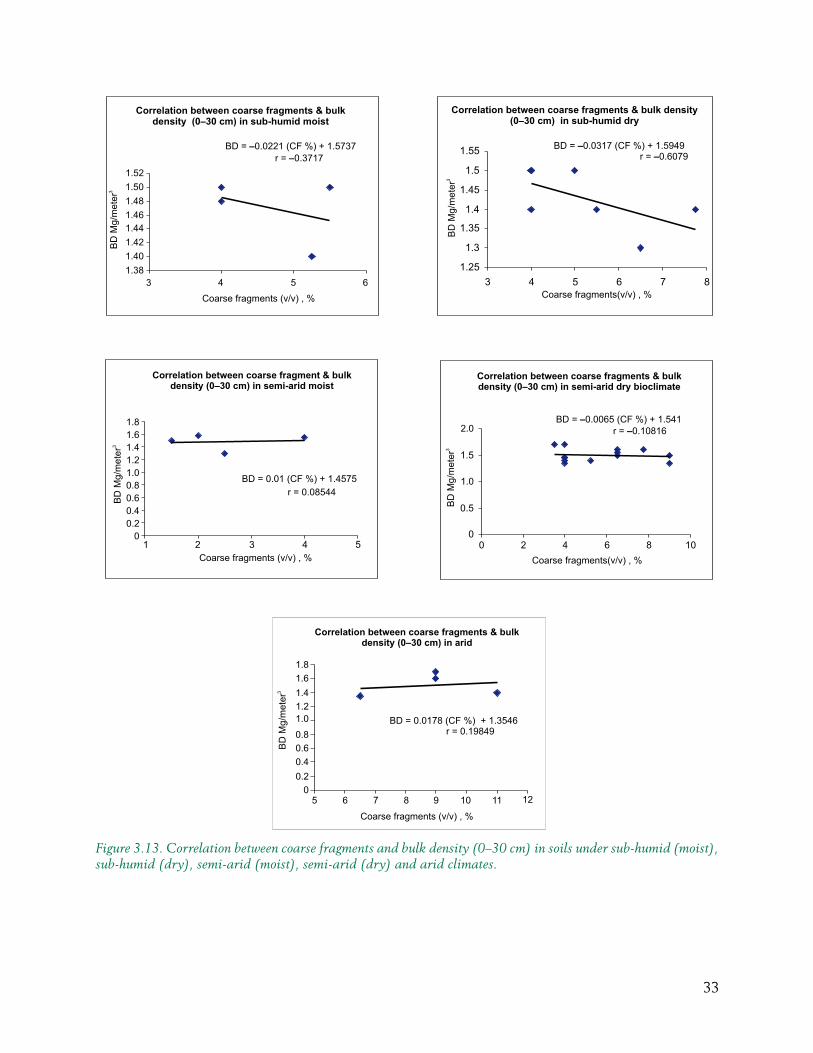
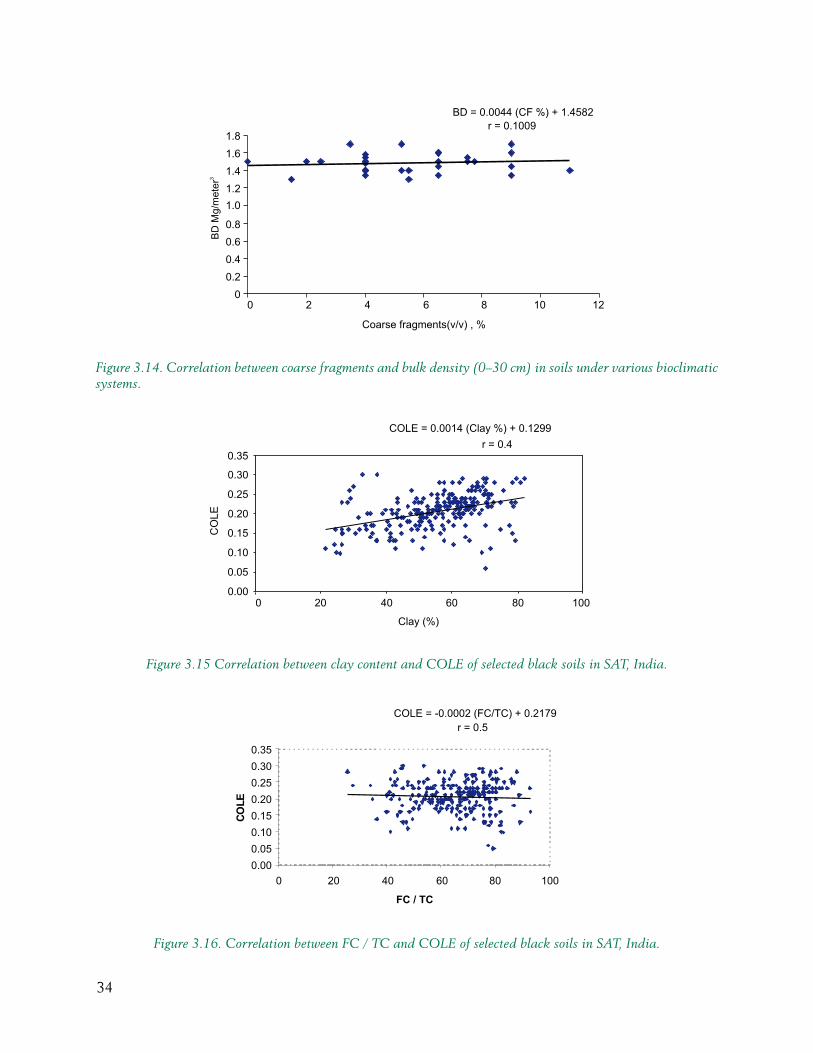
If CaCO3 content contributes to BD, then the coarser fragments in black soils responsible for CaCO3 should increase BD of soils. Interestingly, a negative correlation is found between coarse fragments and BD in sub-humid (moist), sub-humid (dry) and semi-arid (dry) climates, with semi-arid (moist) and arid climates as exceptions. Increase in relative proportion of coarse fragments increases the pore space leading to a decrease in BD values (Figs. 3.13, 3.14). This is in sharp contrast to earlier observations made with regard to CaCO3 and BD values. The calcium carbonate present as a chemical compound helps in binding soil particles, causing a greater cohesion between soil particles. This leads to greater compaction that increases BD values. It would seem, therefore, that the CaCO3 present as powdery lime and CaCO3 present as calcium concretions will have opposite effects on BD values in soils. Interestingly, both forms of CaCO3 (lime and conca) will increase the inorganic carbon concentration in soil. Irrespective of the physical form of CaCO3, its content will decide high or low degree of SIC stock. The range of BD values, SOC, SIC and coarse fragment contents are shown in Tables 3.3 and 3.4, respectively. Tables 3.5 and 3.6 show the correlations between SOC and BD, and SIC and BD.
23
Figure 3.10. Correlation between SOC and BD in sub-humid (moist), sub-humid (dry), semi-arid (moist), semi-arid (dry) and arid climates.
24
Table 3.3. Bulk density, soil organic carbon and soil inorganic carbon in soils under different bio-climatic systems.
BD Mg/m3 Carbon
0–30 cm 50–100 cm* Range** SOC (0–30) (%) SIC (50–100) (%)
Black soilsSH (m) 1.4 1.5 1.3–1.6 0.700 0.634SH (d) 1.4 1.4 1.1–1.7 0.937 0.811SA (m) 1.5 1.5 1.3–1.7 0.925 1.095SA (d) 1.4 1.5 1.2–1.7 0.770 1.206A 1.4 1.5 1.3–1.9 0.600 2.415
Red soilsSH (m) nd nd nd 2.075 0SA (m) 1.7 1.55 1.5–1.7 0.967 0SA (d) 1.5 1.60 1.5–1.9 1.000 0.12* Corresponds to average depth of first occurrence of slickensides in black soils. ** Minimum and maximum.nd: not done
Table 3.4. Bulk density and coarse fragments in soils under different bioclimatic systems.
BD Mg/m3 Coarse fragments v/v
0–30 cm 50–100 cm* 0–30 cm 50–100 cm
Black soilSH (m) 1.4 1.5 3.75 4.00SH (d) 1.4 1.4 5.23 5.464SA (m) 1.5 1.5 2.50 2.625SA (d) 1.4 1.5 5.732 5.054A 1.4 1.5 8.875 9.25
Red soil SH (m) nd nd -- --SA (m) 1.7 1.55 -- --SA (d) 1.5 1.60 -- --
* Corresponds to average depth of first occurrence of slickensides in black soils.nd: not done
Figure 3.11. Correlation between SIC and bulk density (0–30 cm) in various bioclimatic systems.
25
Table 3.6. Correlation between SIC vs. BD in 50–100 cm depth of black soil in SAT, India.
Bioclimate (MAR) Regression equation Correlation coefficient (r) No. of samples
Sub-humid moist (>1100 mm) BD=0.0449(SIC)+1.4383 + 0.1568 4Sub-humid dry (1100-1000 mm) BD=0.2295(SIC)+1.2425 + 0.3569 6Semi-arid moist (1000-850 mm) BD=-0.0601(SIC)+1.5483 - 0.1220 4Semi-arid dry (850-550 mm) BD=-0.0992(SIC)+1.6255 - 0.3160 16Arid (<550 mm) BD=0.2204(SIC)+0.9803 0.5521 4All bioclimatic systems BD=0.0261(SIC)+1.4507 0.1393 34
The detailed information pertaining to BD, SOC and SIC is given in Appendix 1.
3.3 Coefficient of Linear Extensibility (COLE)
Linear Extensibility (LE) helps to predict the potential of a soil to shrink and swell. The LE of a soil layer is the product of the thickness in centimeters, multiplied by the COLE of the layer in question. The LE of a soil is the sum of these products for all soil horizons (Soil Survey Staff 1999). The COLE hasbeendefinedastheratioofthemoistlengthanddrylength.ItisexpressedasCOLE=(Lm-Ld)/Ld,whereLm=lengthofsoilclodat33kPaandLd=lengthofdrysoilclod(roomtemperature).According to soil taxonomy, a soil should be qualified for vertic subgroups if the LE value is more or equal to 6 between the mineral soil surface and either a depth of 100 cm or a lithic contact, whichever is shallower. In case of Vertisols slickensides, cracks and higher COLE values are mutually inclusive.
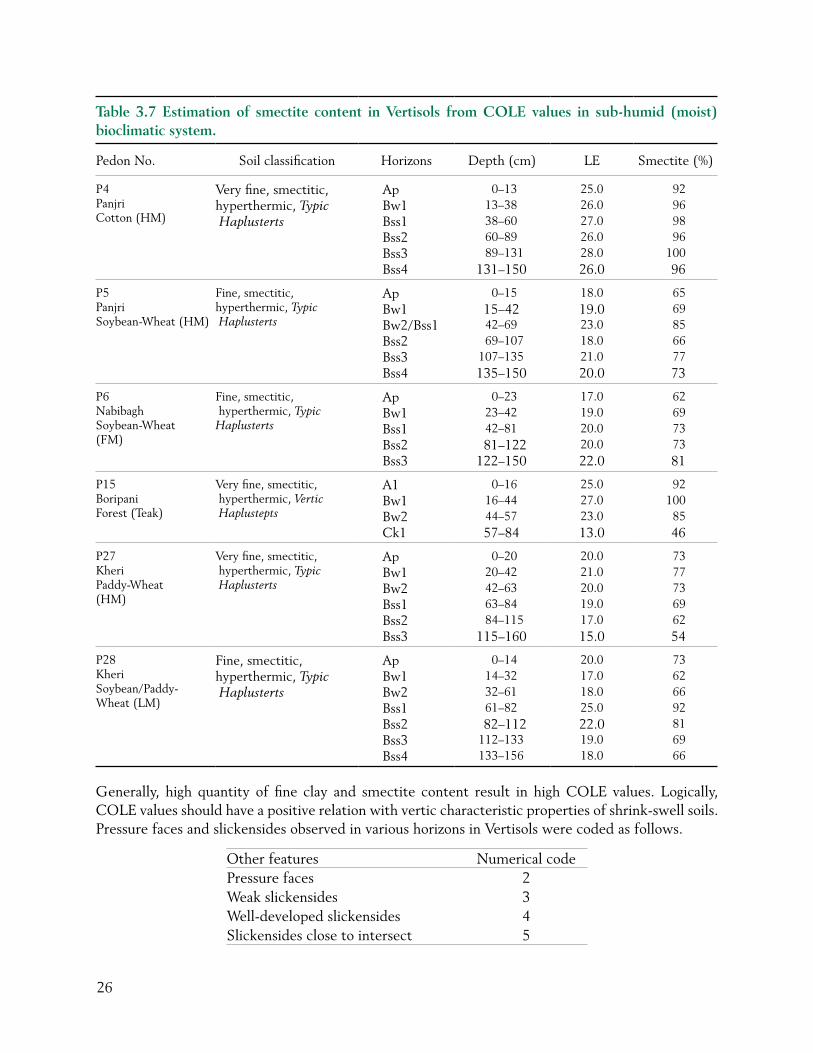
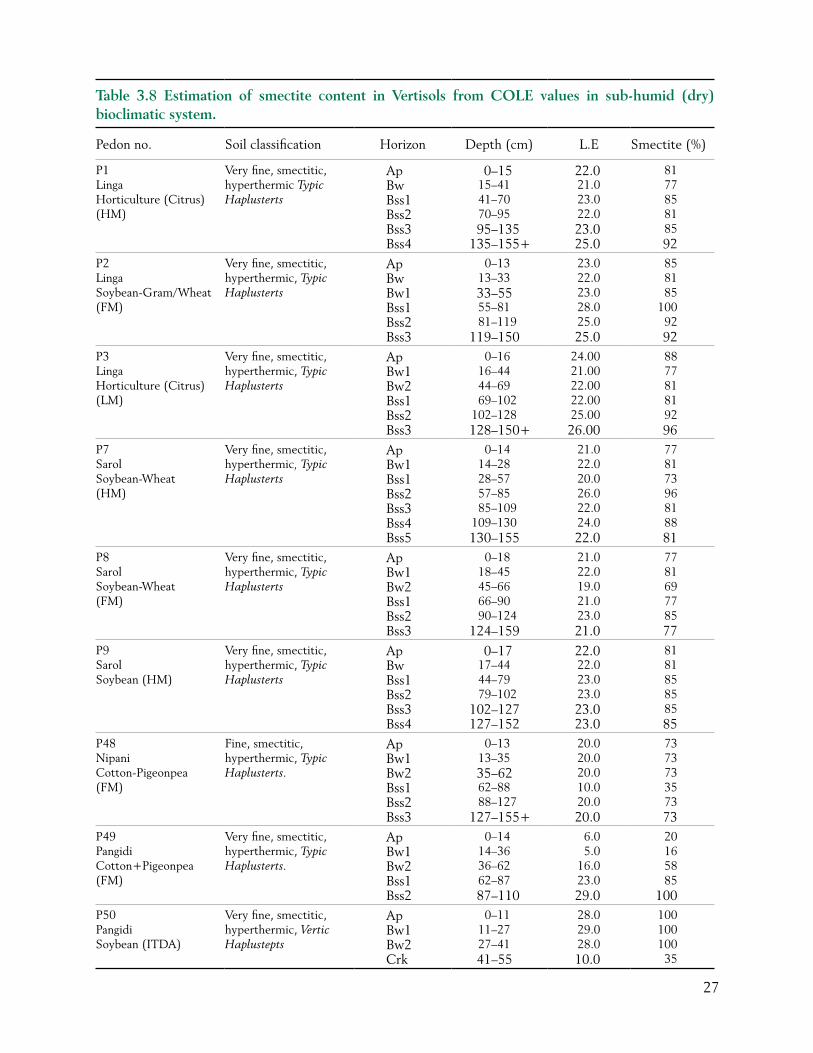
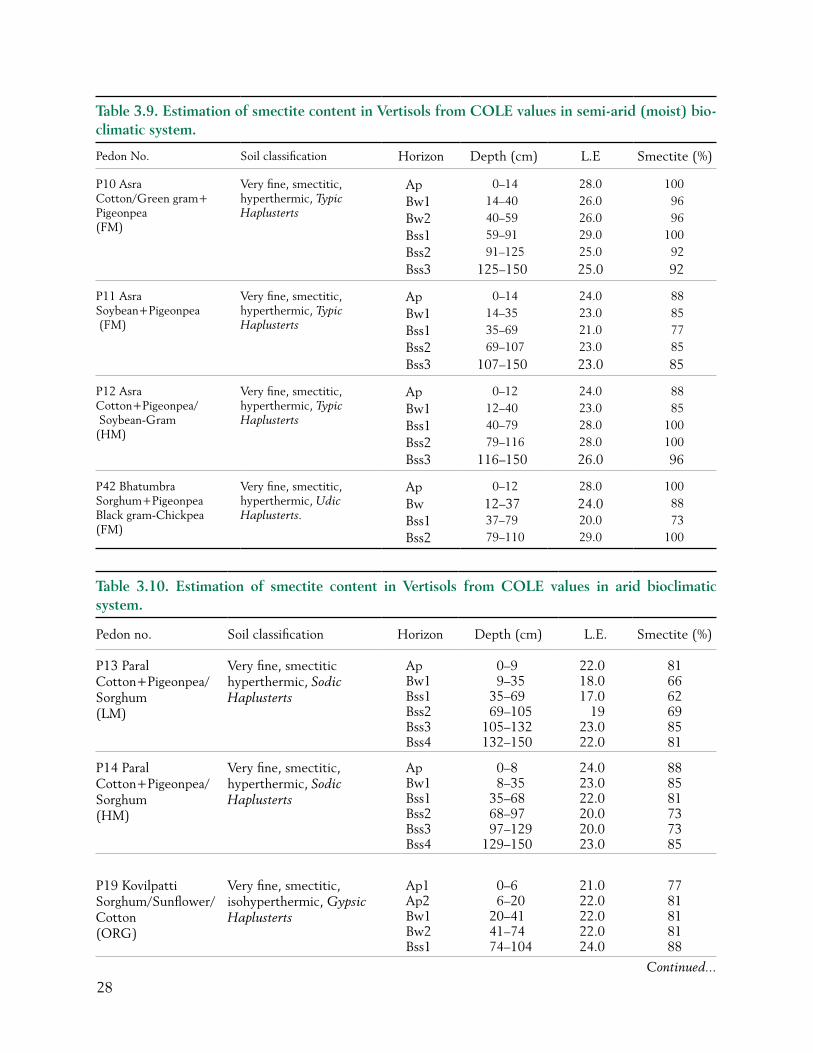
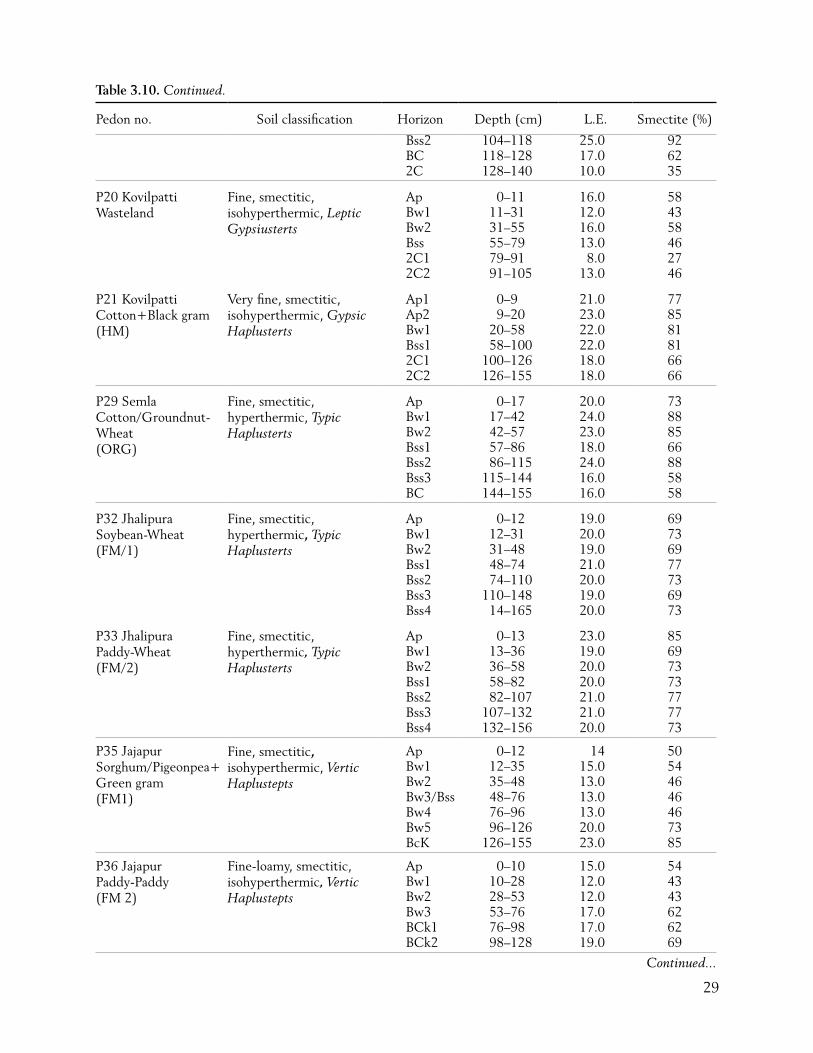
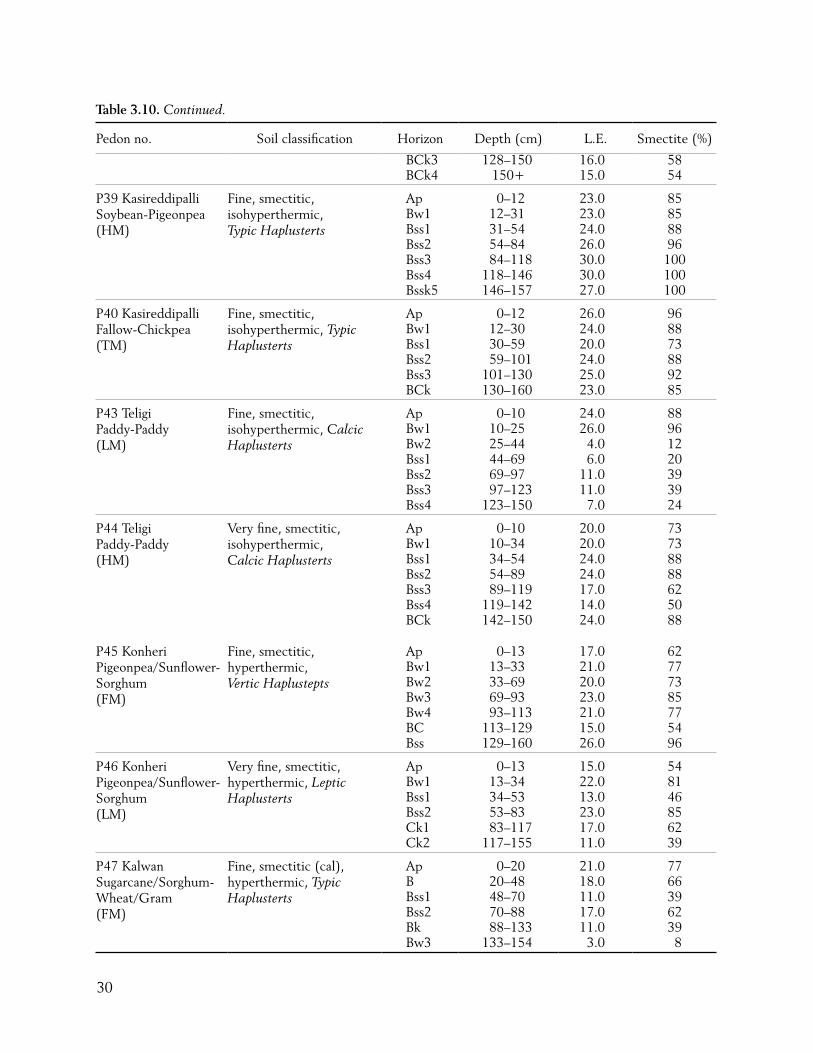
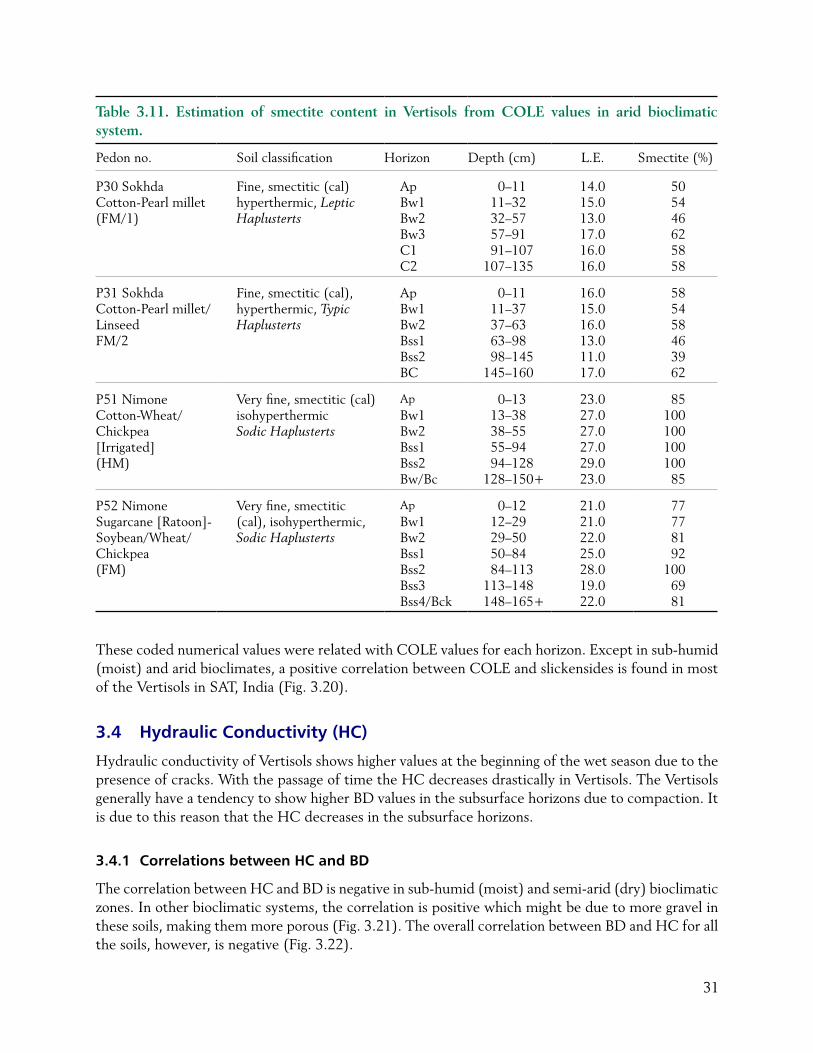
Since higher COLE values indicate the presence of more shrink-swell minerals, namely smectite, a positive correlation between LE and smectite content can exist (Shirsath et al. 2000). Such as a relationship was found to hold for more than 93% of Vertisol samples studied in SAT India (Bhuse et al. 2001). Smectite content estimated horizon-wise of the Vertisol pedons are given in Tables 3.7, 3.8, 3.9, 3.10 and 3.11.
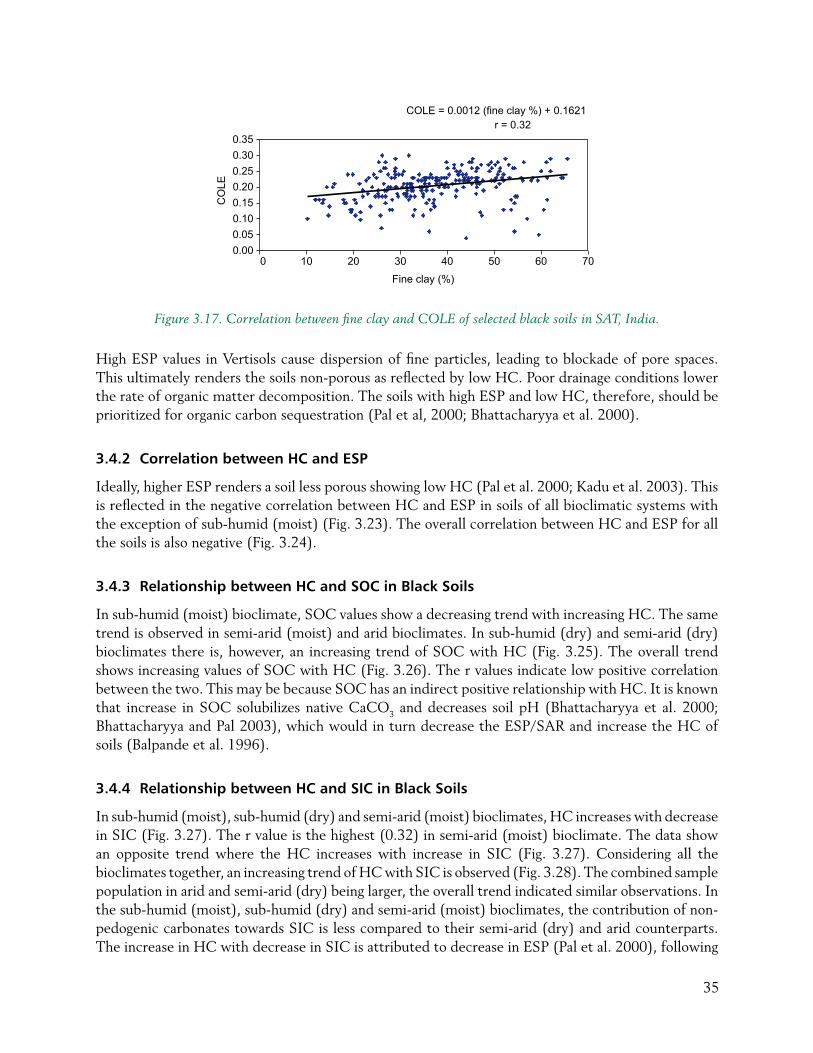
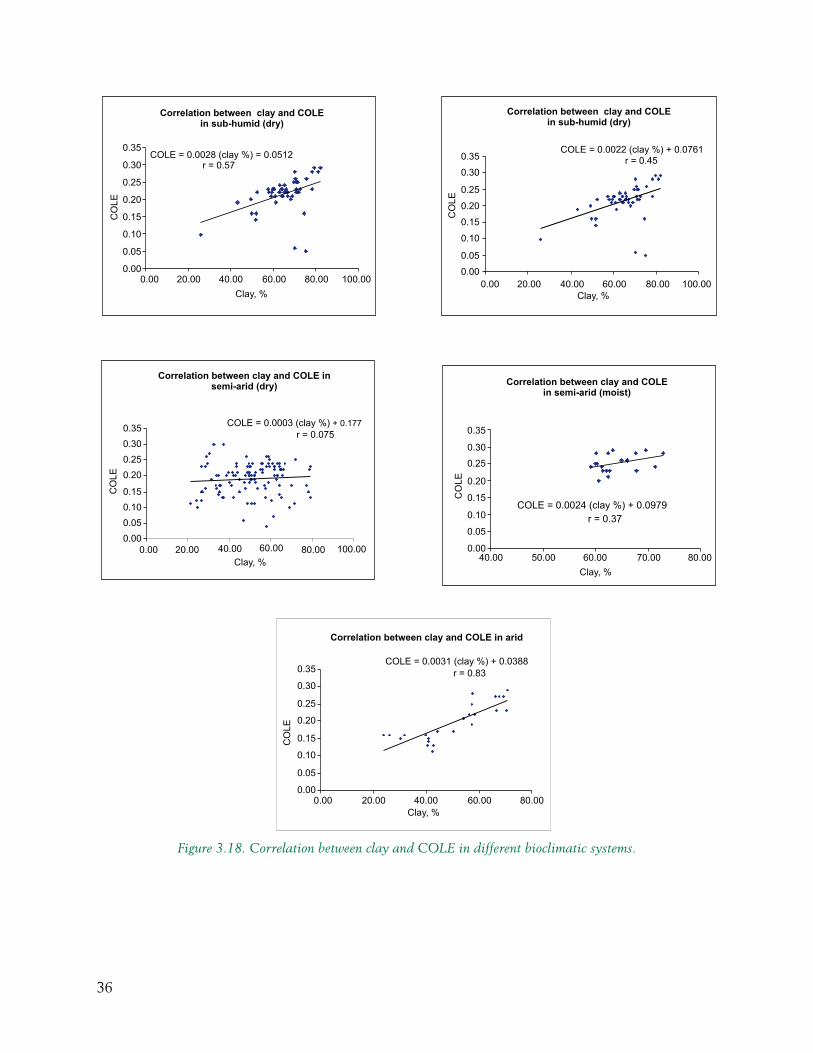
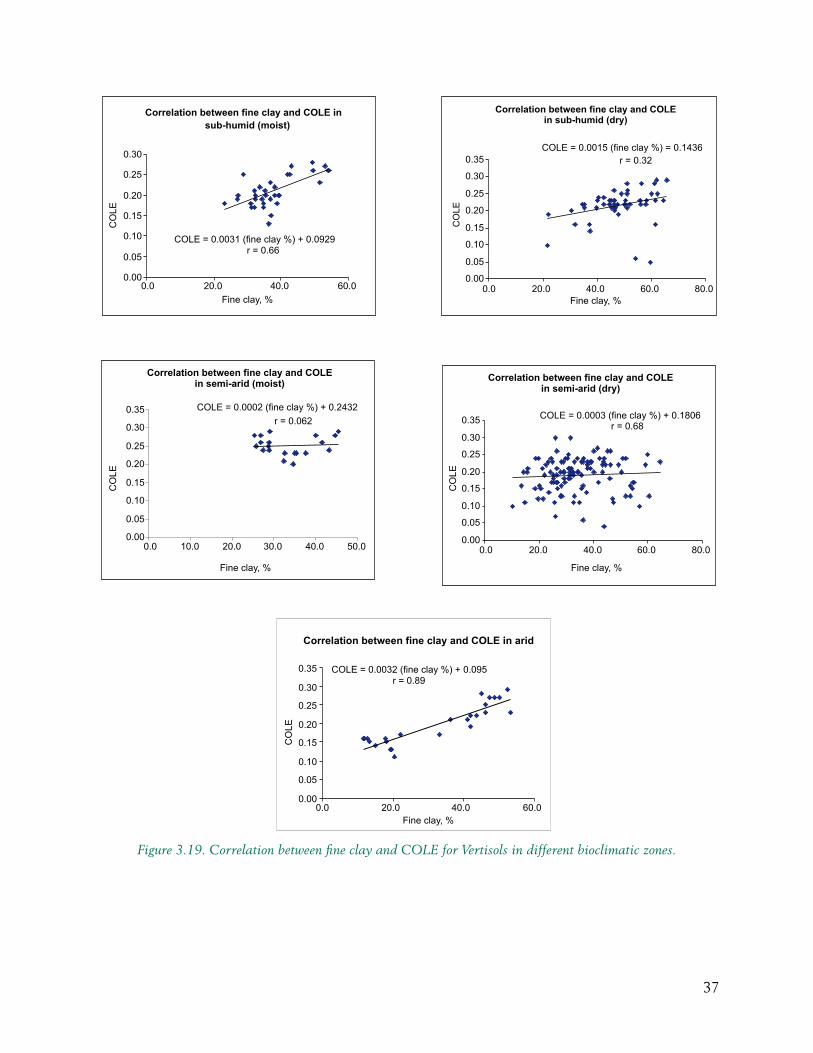
Correlations between COLE and clay content, fine clay: total clay, and fine clay indicated correlation coefficients of 0.4, 0.5, 0.32, respectively, in selected black soils in SAT, India (Figs. 3.15, 3.16, 3.17). Correlations between total clay and COLE in different bioclimatic systems are positive. The correlationcoefficientisappreciablyhigh(r=0.83)inaridbioclimaticsystem(Fig.3.18)(VaidyaandPal 2002). The correlation coefficient values are still high when COLE values were correlated with fine clay content in different bioclimatic systems (Fig. 3.19).
Table 3.5. Correlation between SOC vs. BD in the first 30 cm depth of black soil in SAT, India.
Bioclimate (MAR) Regression equation Correlation coefficient (r) No. of samples
Sub-humid moist (>1100 mm) BD=-(SOC)+2.12 - 0.5423 5Sub-humid dry (1100–1000 mm)
BD=-0.4074(SOC)+1.8519 - 0.4860 4
Semi-arid moist (1000–850 mm)
BD=-0.3874(SOC)+1.7757 - 0.5504 9
Semi-arid dry (850–550 mm) BD=-0.0281(SOC)+1.496 - 0.050 16Arid (<550 mm) BD=-0.35(SOC)+1.635 - 0.7182 4All bioclimatic systems BD=-0.0499(SOC)+1.508 - 0.0866 38
26
Table 3.7 Estimation of smectite content in Vertisols from COLE values in sub-humid (moist) bioclimatic system.
Pedon No. Soil classification Horizons Depth (cm) LE Smectite (%)
P4PanjriCotton (HM)
Very fine, smectitic,hyperthermic, Typic Haplusterts
Ap 0–13 25.0 92Bw1 13–38 26.0 96Bss1 38–60 27.0 98Bss2 60–89 26.0 96Bss3 89–131 28.0 100Bss4 131–150 26.0 96
P5PanjriSoybean-Wheat (HM)
Fine, smectitic, hyperthermic, Typic Haplusterts
Ap 0–15 18.0 65Bw1 15–42 19.0 69Bw2/Bss1 42–69 23.0 85Bss2 69–107 18.0 66Bss3 107–135 21.0 77Bss4 135–150 20.0 73
P6NabibaghSoybean-Wheat(FM)
Fine, smectitic, hyperthermic, Typic Haplusterts
Ap 0–23 17.0 62Bw1 23–42 19.0 69Bss1 42–81 20.0 73Bss2 81–122 20.0 73Bss3 122–150 22.0 81
P15BoripaniForest (Teak)
Very fine, smectitic, hyperthermic, Vertic Haplustepts
A1 0–16 25.0 92Bw1 16–44 27.0 100Bw2 44–57 23.0 85Ck1 57–84 13.0 46
P27KheriPaddy-Wheat(HM)
Very fine, smectitic, hyperthermic, Typic Haplusterts
Ap 0–20 20.0 73Bw1 20–42 21.0 77Bw2 42–63 20.0 73Bss1 63–84 19.0 69Bss2 84–115 17.0 62Bss3 115–160 15.0 54
P28KheriSoybean/Paddy-Wheat (LM)
Fine, smectitic, hyperthermic, Typic Haplusterts
Ap 0–14 20.0 73Bw1 14–32 17.0 62Bw2 32–61 18.0 66Bss1 61–82 25.0 92Bss2 82–112 22.0 81Bss3 112–133 19.0 69Bss4 133–156 18.0 66
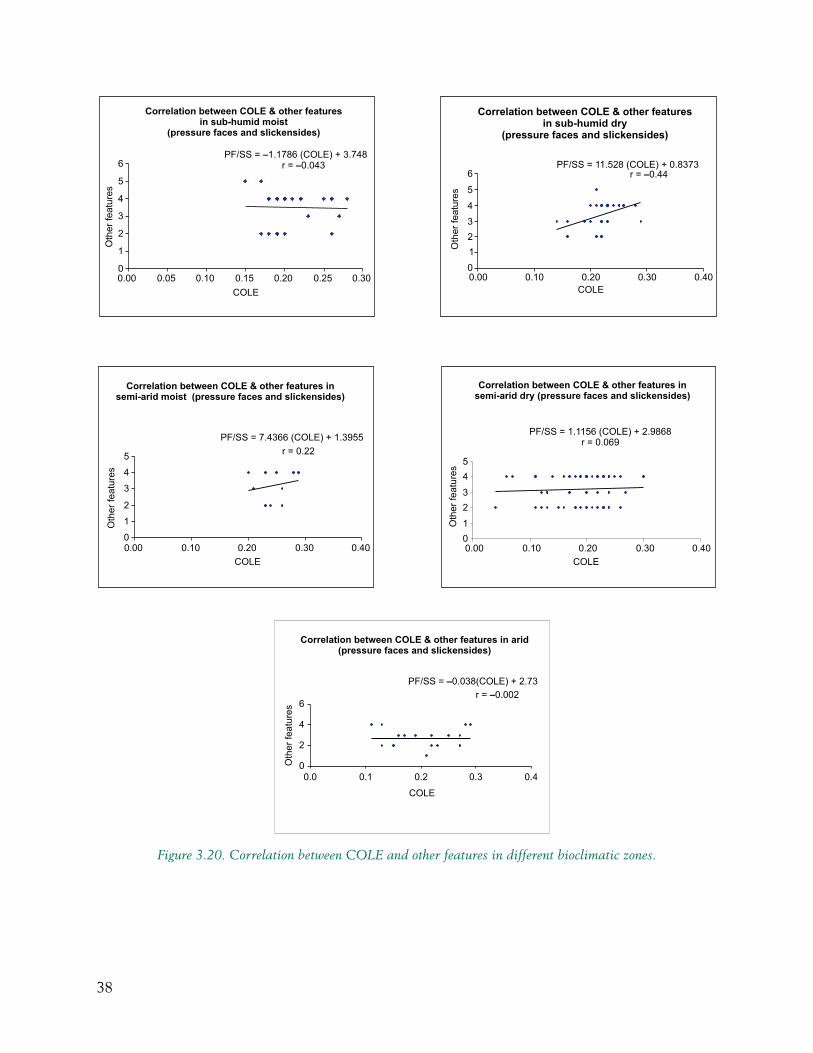
Generally, high quantity of fine clay and smectite content result in high COLE values. Logically, COLE values should have a positive relation with vertic characteristic properties of shrink-swell soils. Pressure faces and slickensides observed in various horizons in Vertisols were coded as follows.
Other features Numerical codePressure faces 2Weak slickensides 3Well-developed slickensides 4Slickensides close to intersect 5
27
Table 3.8 Estimation of smectite content in Vertisols from COLE values in sub-humid (dry) bioclimatic system.
Pedon no. Soil classification Horizon Depth (cm) L.E Smectite (%)
P1LingaHorticulture (Citrus)(HM)
Very fine, smectitic,hyperthermic TypicHaplusterts
Ap 0–15 22.0 81Bw 15–41 21.0 77Bss1 41–70 23.0 85Bss2 70–95 22.0 81Bss3 95–135 23.0 85Bss4 135–155+ 25.0 92
P2LingaSoybean-Gram/Wheat(FM)
Very fine, smectitic,hyperthermic, TypicHaplusterts
Ap 0–13 23.0 85Bw 13–33 22.0 81Bw1 33–55 23.0 85Bss1 55–81 28.0 100Bss2 81–119 25.0 92Bss3 119–150 25.0 92
P3LingaHorticulture (Citrus)(LM)
Very fine, smectitic,hyperthermic, Typic Haplusterts
Ap 0–16 24.00 88Bw1 16–44 21.00 77Bw2 44–69 22.00 81Bss1 69 –102 22.00 81Bss2 102–128 25.00 92Bss3 128–150+ 26.00 96
P7SarolSoybean-Wheat(HM)
Very fine, smectitic, hyperthermic, TypicHaplusterts
Ap 0–14 21.0 77Bw1 14–28 22.0 81Bss1 28–57 20.0 73Bss2 57–85 26.0 96Bss3 85–109 22.0 81Bss4 109–130 24.0 88Bss5 130–155 22.0 81
P8SarolSoybean-Wheat(FM)
Very fine, smectitic,hyperthermic, Typic Haplusterts
Ap 0–18 21.0 77Bw1 18–45 22.0 81Bw2 45–66 19.0 69Bss1 66–90 21.0 77Bss2 90–124 23.0 85Bss3 124–159 21.0 77
P9SarolSoybean (HM)
Very fine, smectitic,hyperthermic, TypicHaplusterts
Ap 0–17 22.0 81Bw 17–44 22.0 81Bss1 44–79 23.0 85Bss2 79–102 23.0 85Bss3 102–127 23.0 85Bss4 127–152 23.0 85
P48NipaniCotton-Pigeonpea(FM)
Fine, smectitic,hyperthermic, TypicHaplusterts.
Ap 0–13 20.0 73Bw1 13–35 20.0 73Bw2 35–62 20.0 73Bss1 62–88 10.0 35Bss2 88–127 20.0 73Bss3 127–155+ 20.0 73
P49PangidiCotton+Pigeonpea(FM)
Very fine, smectitic, hyperthermic, TypicHaplusterts.
Ap 0–14 6.0 20Bw1 14–36 5.0 16Bw2 36–62 16.0 58Bss1 62–87 23.0 85Bss2 87–110 29.0 100
P50PangidiSoybean (ITDA)
Very fine, smectitic, hyperthermic, VerticHaplustepts
Ap 0–11 28.0 100Bw1 11–27 29.0 100Bw2 27–41 28.0 100Crk 41–55 10.0 35
28
Table 3.9. Estimation of smectite content in Vertisols from COLE values in semi-arid (moist) bio-climatic system.
Pedon No. Soil classification Horizon Depth (cm) L.E Smectite (%)
P10 AsraCotton/Green gram+ Pigeonpea(FM)
Very fine, smectitic, hyperthermic, Typic Haplusterts
Ap 0–14 28.0 100
Bw1 14–40 26.0 96
Bw2 40–59 26.0 96
Bss1 59–91 29.0 100
Bss2 91–125 25.0 92
Bss3 125–150 25.0 92
P11 AsraSoybean+Pigeonpea (FM)
Very fine, smectitic, hyperthermic, Typic Haplusterts
Ap 0–14 24.0 88
Bw1 14–35 23.0 85
Bss1 35–69 21.0 77
Bss2 69–107 23.0 85
Bss3 107–150 23.0 85
P12 AsraCotton+Pigeonpea/ Soybean-Gram(HM)
Very fine, smectitic, hyperthermic, Typic Haplusterts
Ap 0–12 24.0 88
Bw1 12–40 23.0 85
Bss1 40–79 28.0 100
Bss2 79–116 28.0 100
Bss3 116–150 26.0 96
P42 BhatumbraSorghum+PigeonpeaBlack gram-Chickpea(FM)
Very fine, smectitic, hyperthermic, Udic Haplusterts.
Ap 0–12 28.0 100
Bw 12–37 24.0 88
Bss1 37–79 20.0 73
Bss2 79–110 29.0 100
Table 3.10. Estimation of smectite content in Vertisols from COLE values in arid bioclimatic system.
Pedon no. Soil classification Horizon Depth (cm) L.E. Smectite (%)
P13 ParalCotton+Pigeonpea/Sorghum(LM)
Very fine, smectitic hyperthermic, SodicHaplusterts
Ap 0–9 22.0 81Bw1 9–35 18.0 66Bss1 35–69 17.0 62Bss2 69–105 19 69Bss3 105–132 23.0 85Bss4 132–150 22.0 81
P14 ParalCotton+Pigeonpea/ Sorghum(HM)
Very fine, smectitic,hyperthermic, SodicHaplusterts
Ap 0–8 24.0 88Bw1 8–35 23.0 85Bss1 35–68 22.0 81Bss2 68–97 20.0 73Bss3 97–129 20.0 73Bss4 129–150 23.0 85
P19 KovilpattiSorghum/Sunflower/Cotton(ORG)
Very fine, smectitic,isohyperthermic, GypsicHaplusterts
Ap1 0–6 21.0 77Ap2 6–20 22.0 81Bw1 20–41 22.0 81Bw2 41–74 22.0 81Bss1 74 –104 24.0 88
Continued...
29
Table 3.10. Continued.
Pedon no. Soil classification Horizon Depth (cm) L.E. Smectite (%)
Bss2 104–118 25.0 92BC 118–128 17.0 622C 128–140 10.0 35
P20 KovilpattiWasteland
Fine, smectitic, isohyperthermic, LepticGypsiusterts
Ap 0–11 16.0 58Bw1 11–31 12.0 43Bw2 31–55 16.0 58Bss 55–79 13.0 462C1 79–91 8.0 272C2 91–105 13.0 46
P21 KovilpattiCotton+Black gram(HM)
Very fine, smectitic,isohyperthermic, GypsicHaplusterts
Ap1 0–9 21.0 77Ap2 9–20 23.0 85Bw1 20–58 22.0 81Bss1 58–100 22.0 812C1 100–126 18.0 662C2 126–155 18.0 66
P29 SemlaCotton/Groundnut-Wheat(ORG)
Fine, smectitic,hyperthermic, TypicHaplusterts
Ap 0–17 20.0 73Bw1 17–42 24.0 88Bw2 42–57 23.0 85Bss1 57–86 18.0 66Bss2 86–115 24.0 88Bss3 115–144 16.0 58BC 144–155 16.0 58
P32 JhalipuraSoybean-Wheat(FM/1)
Fine, smectitic, hyperthermic, Typic Haplusterts
Ap 0–12 19.0 69Bw1 12–31 20.0 73Bw2 31–48 19.0 69Bss1 48–74 21.0 77Bss2 74–110 20.0 73Bss3 110–148 19.0 69Bss4 14–165 20.0 73
P33 JhalipuraPaddy-Wheat(FM/2)
Fine, smectitic, hyperthermic, Typic Haplusterts
Ap 0–13 23.0 85Bw1 13–36 19.0 69Bw2 36–58 20.0 73Bss1 58–82 20.0 73Bss2 82–107 21.0 77Bss3 107–132 21.0 77Bss4 132–156 20.0 73
P35 JajapurSorghum/Pigeonpea+ Green gram(FM1)
Fine, smectitic, isohyperthermic, VerticHaplustepts
Ap 0–12 14 50Bw1 12–35 15.0 54Bw2 35–48 13.0 46Bw3/Bss 48–76 13.0 46Bw4 76–96 13.0 46Bw5 96–126 20.0 73BcK 126–155 23.0 85
P36 JajapurPaddy-Paddy(FM 2)
Fine-loamy, smectitic, isohyperthermic, Vertic Haplustepts
Ap 0–10 15.0 54Bw1 10–28 12.0 43Bw2 28–53 12.0 43Bw3 53–76 17.0 62BCk1 76–98 17.0 62BCk2 98–128 19.0 69
Continued...
30
Table 3.10. Continued.
Pedon no. Soil classification Horizon Depth (cm) L.E. Smectite (%)
BCk3 128–150 16.0 58BCk4 150+ 15.0 54
P39 KasireddipalliSoybean-Pigeonpea(HM)
Fine, smectitic, isohyperthermic,Typic Haplusterts
Ap 0–12 23.0 85Bw1 12–31 23.0 85Bss1 31–54 24.0 88Bss2 54–84 26.0 96Bss3 84–118 30.0 100Bss4 118–146 30.0 100Bssk5 146–157 27.0 100
P40 KasireddipalliFallow-Chickpea(TM)
Fine, smectitic, isohyperthermic, TypicHaplusterts
Ap 0–12 26.0 96Bw1 12–30 24.0 88Bss1 30–59 20.0 73Bss2 59–101 24.0 88Bss3 101–130 25.0 92BCk 130–160 23.0 85
P43 TeligiPaddy-Paddy(LM)
Fine, smectitic, isohyperthermic, Calcic Haplusterts
Ap 0–10 24.0 88Bw1 10–25 26.0 96Bw2 25–44 4.0 12Bss1 44–69 6.0 20Bss2 69–97 11.0 39Bss3 97–123 11.0 39Bss4 123–150 7.0 24
P44 TeligiPaddy-Paddy(HM)
Very fine, smectitic,isohyperthermic,Calcic Haplusterts
Ap 0–10 20.0 73Bw1 10–34 20.0 73Bss1 34–54 24.0 88Bss2 54–89 24.0 88Bss3 89–119 17.0 62Bss4 119–142 14.0 50BCk 142–150 24.0 88
P45 KonheriPigeonpea/Sunflower- Sorghum(FM)
Fine, smectitic, hyperthermic,Vertic Haplustepts
Ap 0–13 17.0 62Bw1 13–33 21.0 77Bw2 33–69 20.0 73Bw3 69–93 23.0 85Bw4 93–113 21.0 77BC 113–129 15.0 54Bss 129–160 26.0 96
P46 KonheriPigeonpea/Sunflower-Sorghum(LM)
Very fine, smectitic,hyperthermic, Leptic Haplusterts
Ap 0–13 15.0 54Bw1 13–34 22.0 81Bss1 34–53 13.0 46Bss2 53–83 23.0 85Ck1 83–117 17.0 62Ck2 117–155 11.0 39
P47 KalwanSugarcane/Sorghum-Wheat/Gram(FM)
Fine, smectitic (cal),hyperthermic, TypicHaplusterts
Ap 0–20 21.0 77B 20–48 18.0 66Bss1 48–70 11.0 39Bss2 70–88 17.0 62Bk 88–133 11.0 39Bw3 133–154 3.0 8
31
Table 3.11. Estimation of smectite content in Vertisols from COLE values in arid bioclimatic system.
Pedon no. Soil classification Horizon Depth (cm) L.E. Smectite (%)
P30 SokhdaCotton-Pearl millet(FM/1)
Fine, smectitic (cal)hyperthermic, Leptic Haplusterts
Ap 0–11 14.0 50Bw1 11–32 15.0 54Bw2 32–57 13.0 46Bw3 57–91 17.0 62C1 91–107 16.0 58C2 107–135 16.0 58
P31 SokhdaCotton-Pearl millet/LinseedFM/2
Fine, smectitic (cal),hyperthermic, Typic Haplusterts
Ap 0–11 16.0 58Bw1 11–37 15.0 54Bw2 37–63 16.0 58Bss1 63–98 13.0 46Bss2 98–145 11.0 39BC 145–160 17.0 62
P51 NimoneCotton-Wheat/Chickpea[Irrigated](HM)
Very fine, smectitic (cal)isohyperthermicSodic Haplusterts
Ap 0–13 23.0 85Bw1 13–38 27.0 100Bw2 38–55 27.0 100Bss1 55–94 27.0 100Bss2 94–128 29.0 100Bw/Bc 128–150+ 23.0 85
P52 NimoneSugarcane [Ratoon]-Soybean/Wheat/ Chickpea(FM)
Very fine, smectitic(cal), isohyperthermic,Sodic Haplusterts
Ap 0–12 21.0 77Bw1 12–29 21.0 77Bw2 29–50 22.0 81Bss1 50–84 25.0 92Bss2 84–113 28.0 100Bss3 113–148 19.0 69Bss4/Bck 148–165+ 22.0 81
These coded numerical values were related with COLE values for each horizon. Except in sub-humid (moist) and arid bioclimates, a positive correlation between COLE and slickensides is found in most of the Vertisols in SAT, India (Fig. 3.20).
3.4 Hydraulic Conductivity (HC)
Hydraulic conductivity of Vertisols shows higher values at the beginning of the wet season due to the presence of cracks. With the passage of time the HC decreases drastically in Vertisols. The Vertisols generally have a tendency to show higher BD values in the subsurface horizons due to compaction. It is due to this reason that the HC decreases in the subsurface horizons.
3.4.1 Correlations between HC and BD
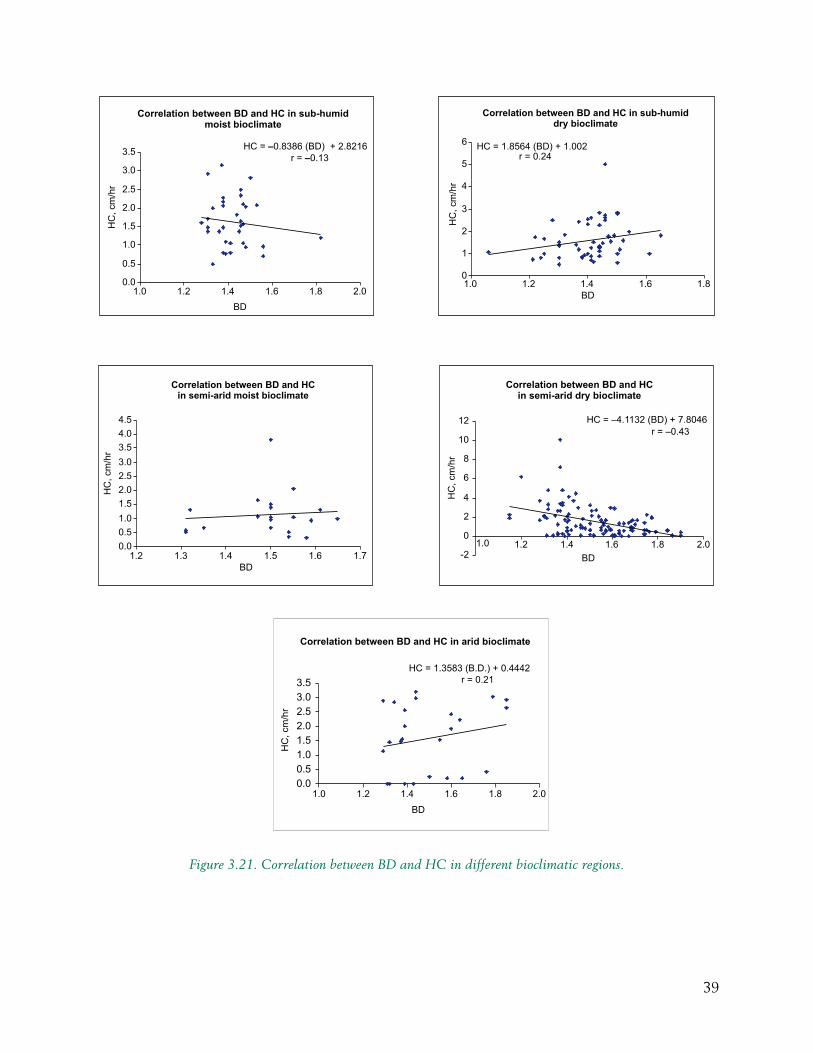
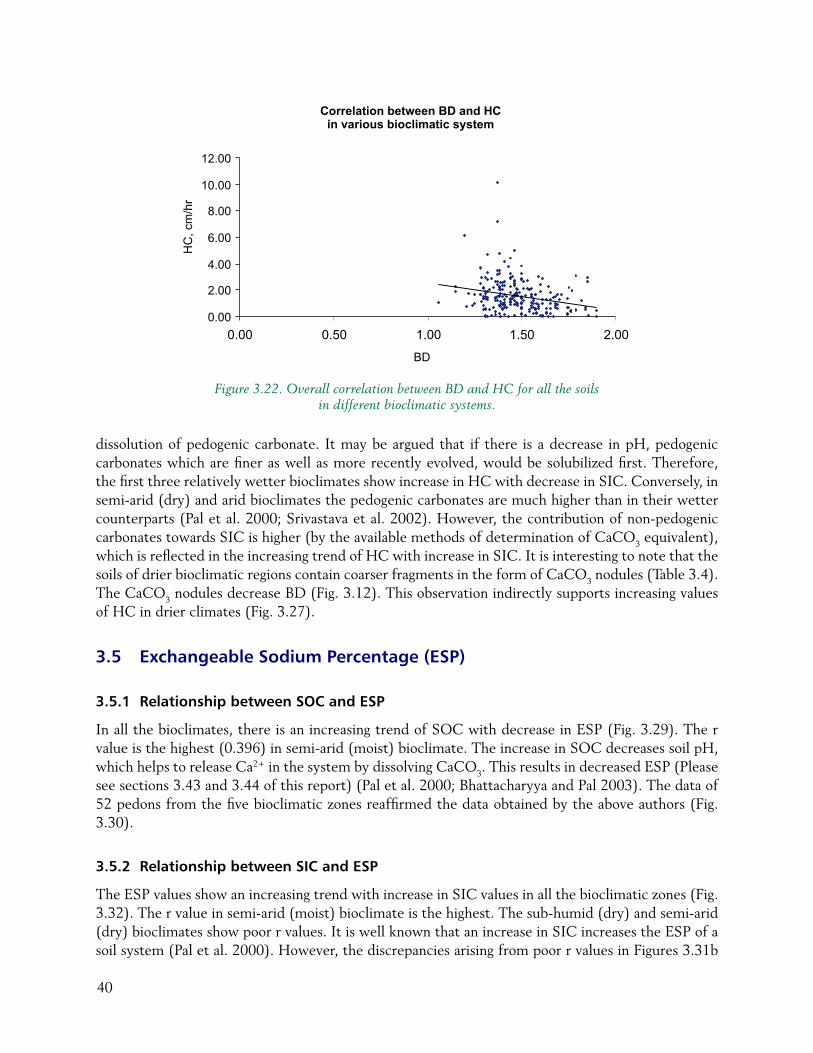
The correlation between HC and BD is negative in sub-humid (moist) and semi-arid (dry) bioclimatic zones. In other bioclimatic systems, the correlation is positive which might be due to more gravel in these soils, making them more porous (Fig. 3.21). The overall correlation between BD and HC for all the soils, however, is negative (Fig. 3.22).
32
Figure 3.12. Correlation between SIC and BD in sub-humid (moist), sub-humid (dry), semi-arid (moist), semi-arid (dry) and arid climates.
33
Figure 3.13. Correlation between coarse fragments and bulk density (0–30 cm) in soils under sub-humid (moist), sub-humid (dry), semi-arid (moist), semi-arid (dry) and arid climates.
34
Figure 3.14. Correlation between coarse fragments and bulk density (0–30 cm) in soils under various bioclimatic systems.
Figure 3.15 Correlation between clay content and COLE of selected black soils in SAT, India.
Figure 3.16. Correlation between FC / TC and COLE of selected black soils in SAT, India.
35
High ESP values in Vertisols cause dispersion of fine particles, leading to blockade of pore spaces. This ultimately renders the soils non-porous as reflected by low HC. Poor drainage conditions lower the rate of organic matter decomposition. The soils with high ESP and low HC, therefore, should be prioritized for organic carbon sequestration (Pal et al, 2000; Bhattacharyya et al. 2000).
3.4.2 Correlation between HC and ESP
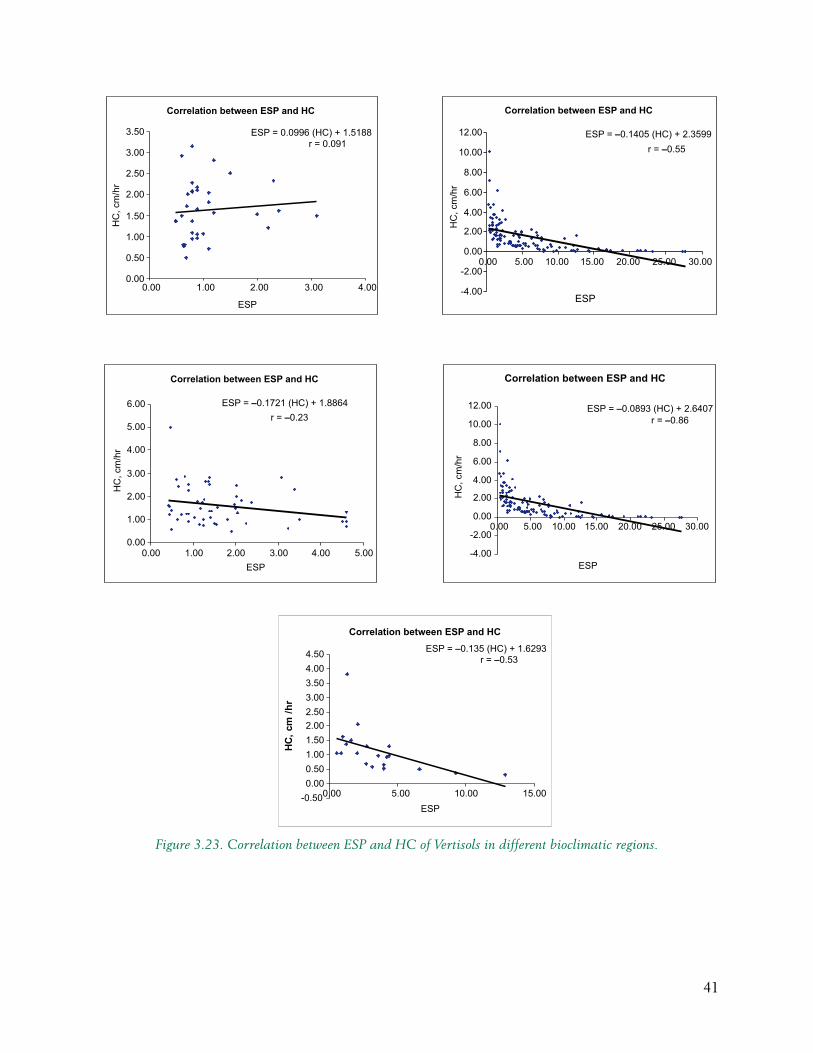
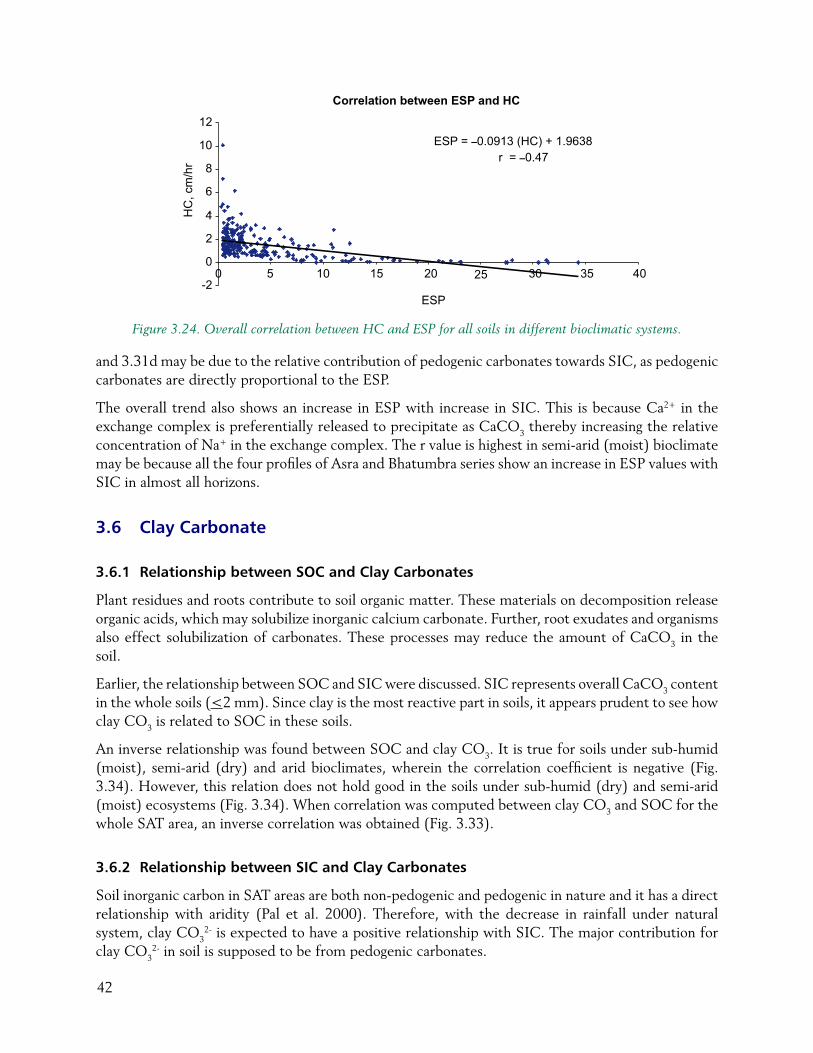
Ideally, higher ESP renders a soil less porous showing low HC (Pal et al. 2000; Kadu et al. 2003). This is reflected in the negative correlation between HC and ESP in soils of all bioclimatic systems with the exception of sub-humid (moist) (Fig. 3.23). The overall correlation between HC and ESP for all the soils is also negative (Fig. 3.24).
3.4.3 Relationship between HC and SOC in Black Soils
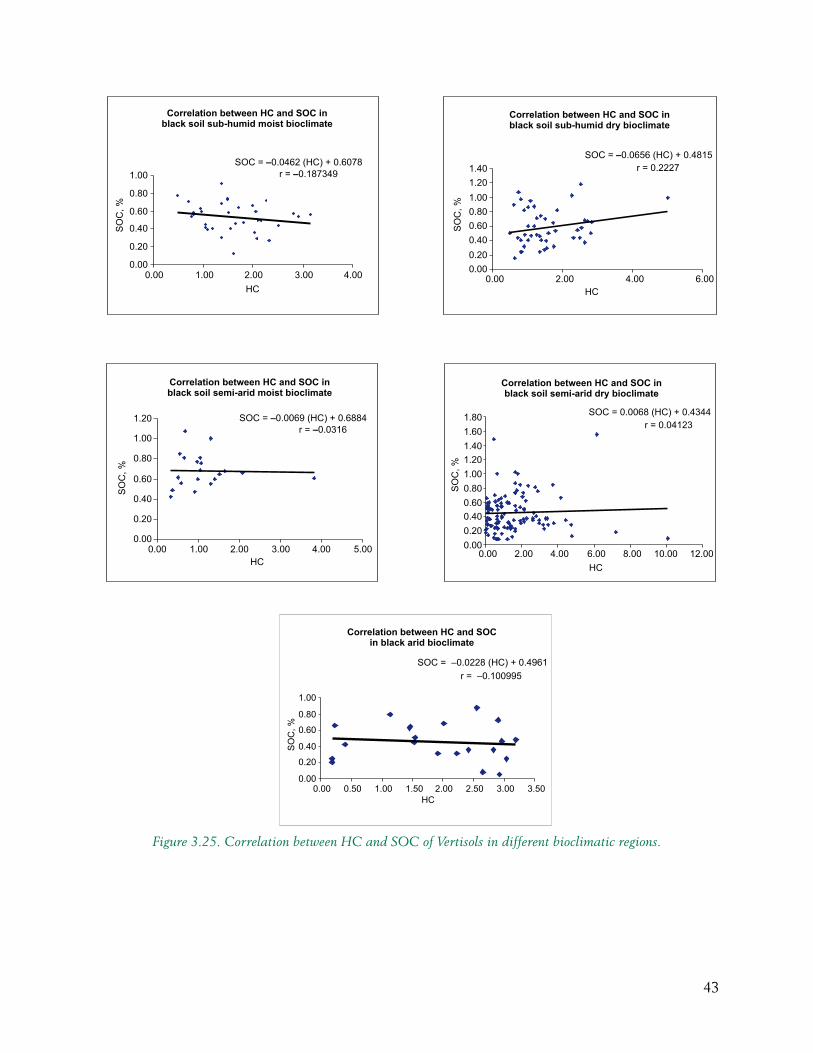
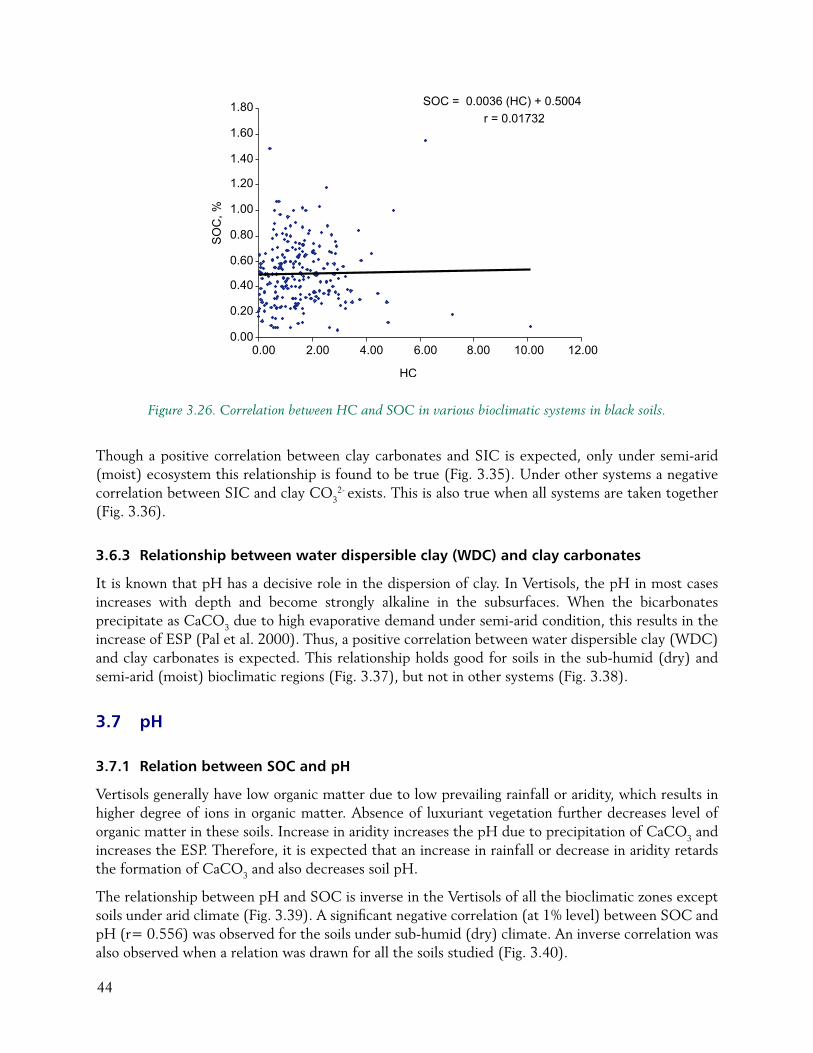
In sub-humid (moist) bioclimate, SOC values show a decreasing trend with increasing HC. The same trend is observed in semi-arid (moist) and arid bioclimates. In sub-humid (dry) and semi-arid (dry) bioclimates there is, however, an increasing trend of SOC with HC (Fig. 3.25). The overall trend shows increasing values of SOC with HC (Fig. 3.26). The r values indicate low positive correlation between the two. This may be because SOC has an indirect positive relationship with HC. It is known that increase in SOC solubilizes native CaCO3 and decreases soil pH (Bhattacharyya et al. 2000; Bhattacharyya and Pal 2003), which would in turn decrease the ESP/SAR and increase the HC of soils (Balpande et al. 1996).
3.4.4 Relationship between HC and SIC in Black Soils
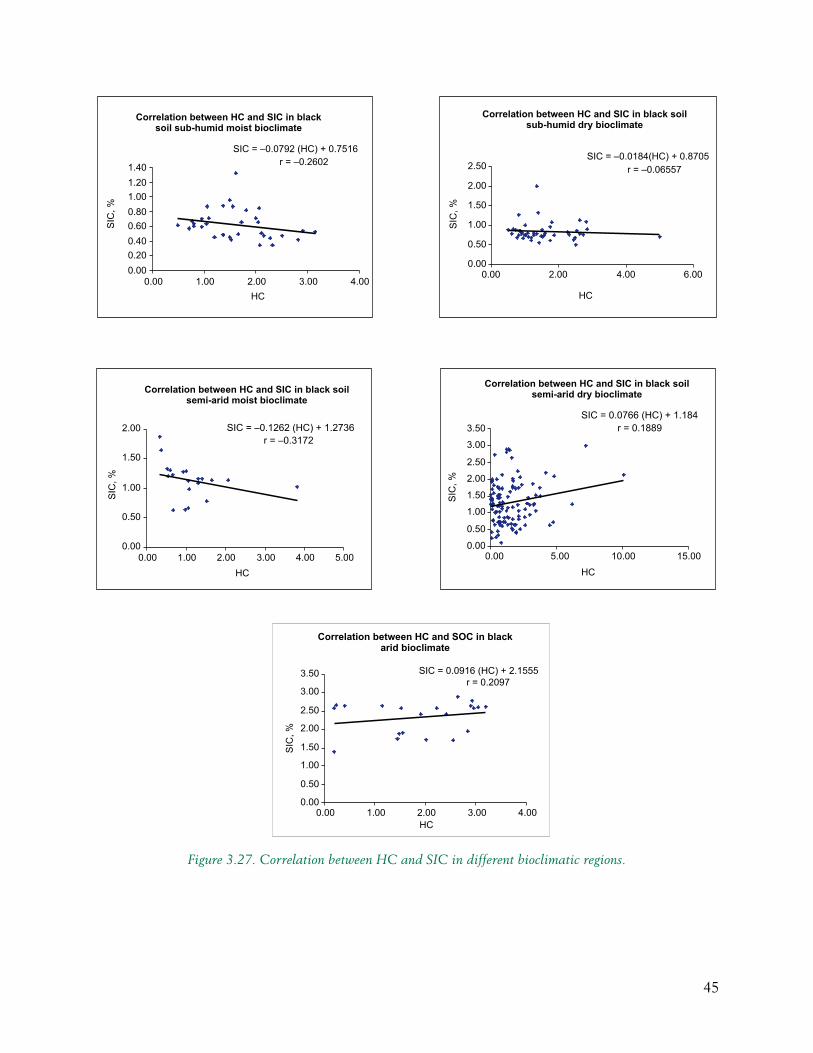
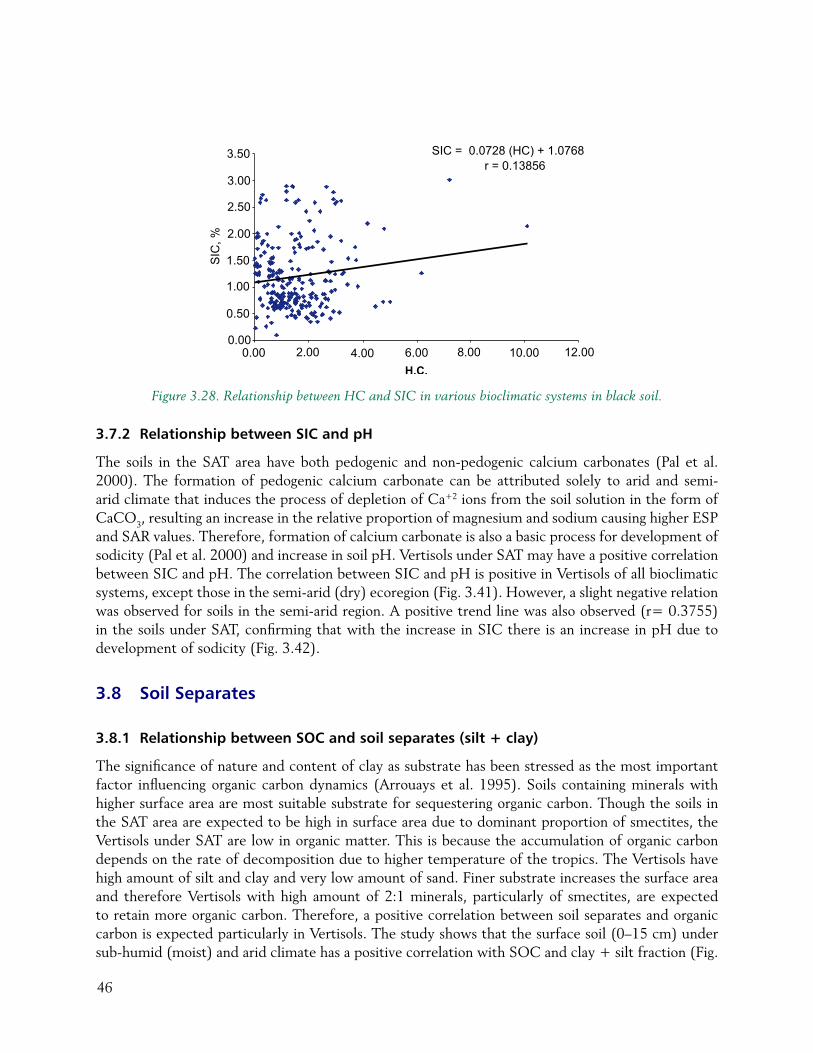
In sub-humid (moist), sub-humid (dry) and semi-arid (moist) bioclimates, HC increases with decrease in SIC (Fig. 3.27). The r value is the highest (0.32) in semi-arid (moist) bioclimate. The data show an opposite trend where the HC increases with increase in SIC (Fig. 3.27). Considering all the bioclimates together, an increasing trend of HC with SIC is observed (Fig. 3.28). The combined sample population in arid and semi-arid (dry) being larger, the overall trend indicated similar observations. In the sub-humid (moist), sub-humid (dry) and semi-arid (moist) bioclimates, the contribution of non-pedogenic carbonates towards SIC is less compared to their semi-arid (dry) and arid counterparts. The increase in HC with decrease in SIC is attributed to decrease in ESP (Pal et al. 2000), following
Figure 3.17. Correlation between fine clay and COLE of selected black soils in SAT, India.
36
Figure 3.18. Correlation between clay and COLE in different bioclimatic systems.
37
Figure 3.19. Correlation between fine clay and COLE for Vertisols in different bioclimatic zones.
38
Figure 3.20. Correlation between COLE and other features in different bioclimatic zones.
39
Figure 3.21. Correlation between BD and HC in different bioclimatic regions.
40
dissolution of pedogenic carbonate. It may be argued that if there is a decrease in pH, pedogenic carbonates which are finer as well as more recently evolved, would be solubilized first. Therefore, the first three relatively wetter bioclimates show increase in HC with decrease in SIC. Conversely, in semi-arid (dry) and arid bioclimates the pedogenic carbonates are much higher than in their wetter counterparts (Pal et al. 2000; Srivastava et al. 2002). However, the contribution of non-pedogenic carbonates towards SIC is higher (by the available methods of determination of CaCO3 equivalent), which is reflected in the increasing trend of HC with increase in SIC. It is interesting to note that the soils of drier bioclimatic regions contain coarser fragments in the form of CaCO3 nodules (Table 3.4). The CaCO3 nodules decrease BD (Fig. 3.12). This observation indirectly supports increasing values of HC in drier climates (Fig. 3.27).
3.5 Exchangeable Sodium Percentage (ESP)
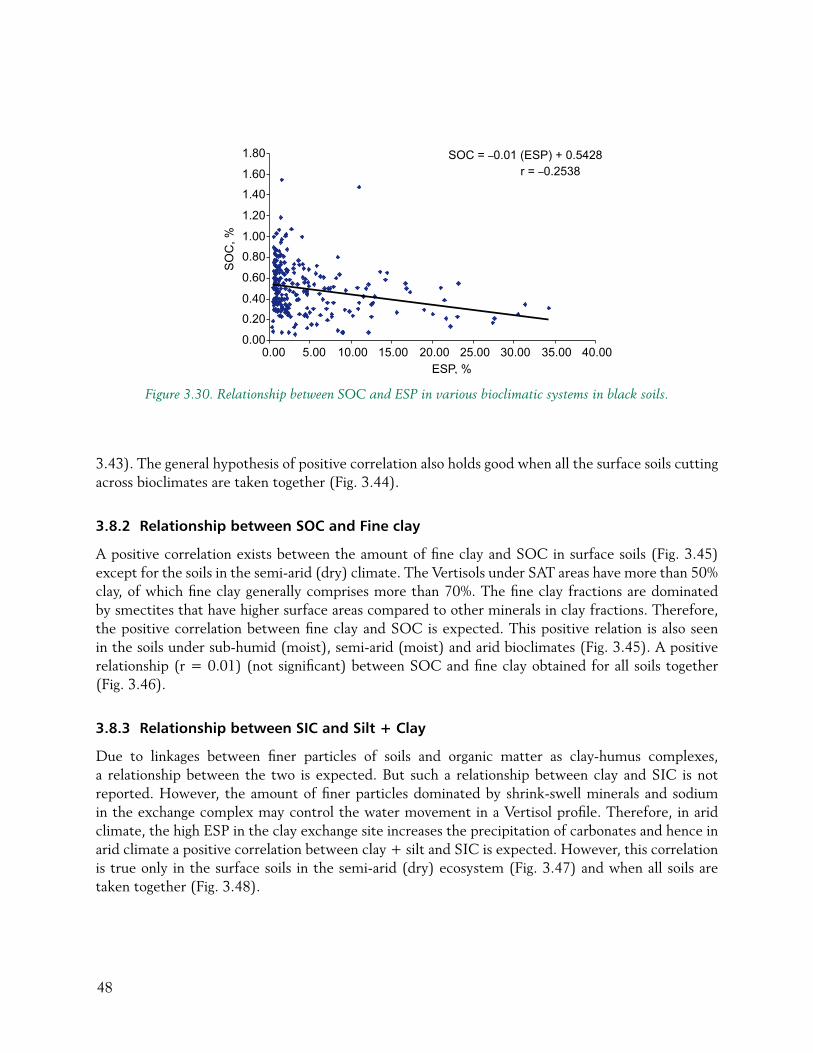
3.5.1 Relationship between SOC and ESP
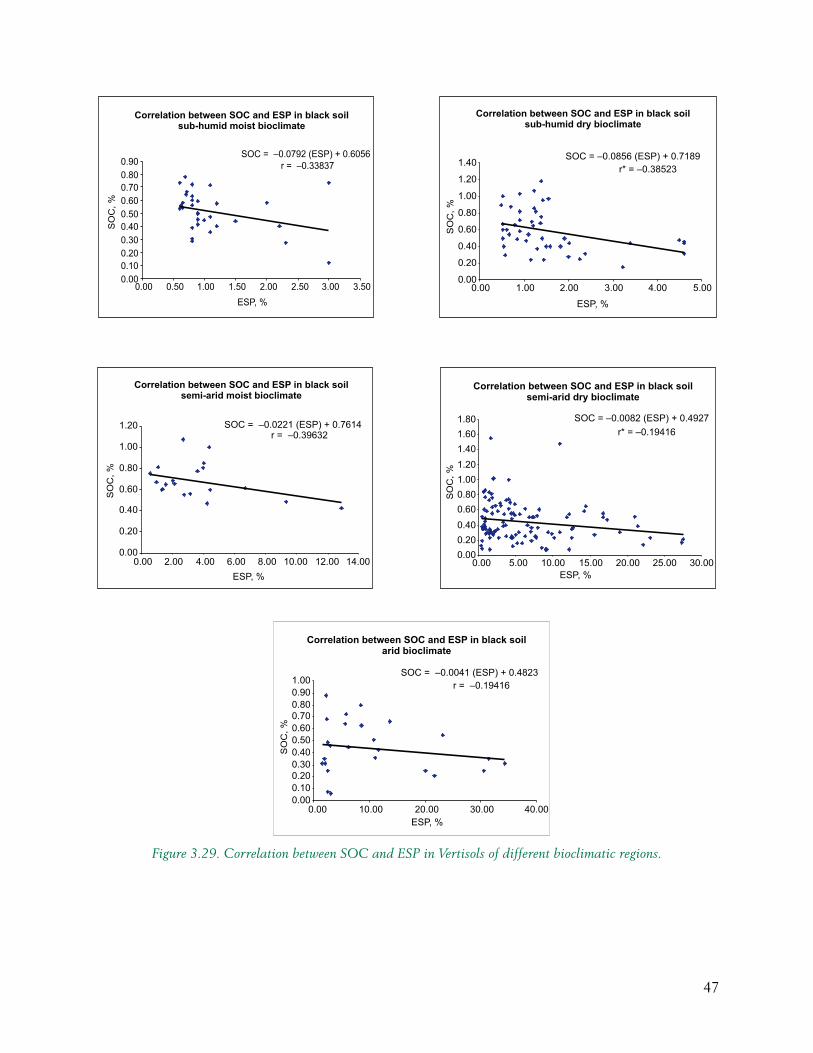
In all the bioclimates, there is an increasing trend of SOC with decrease in ESP (Fig. 3.29). The r value is the highest (0.396) in semi-arid (moist) bioclimate. The increase in SOC decreases soil pH, which helps to release Ca2+ in the system by dissolving CaCO3. This results in decreased ESP (Please see sections 3.43 and 3.44 of this report) (Pal et al. 2000; Bhattacharyya and Pal 2003). The data of 52 pedons from the five bioclimatic zones reaffirmed the data obtained by the above authors (Fig. 3.30).
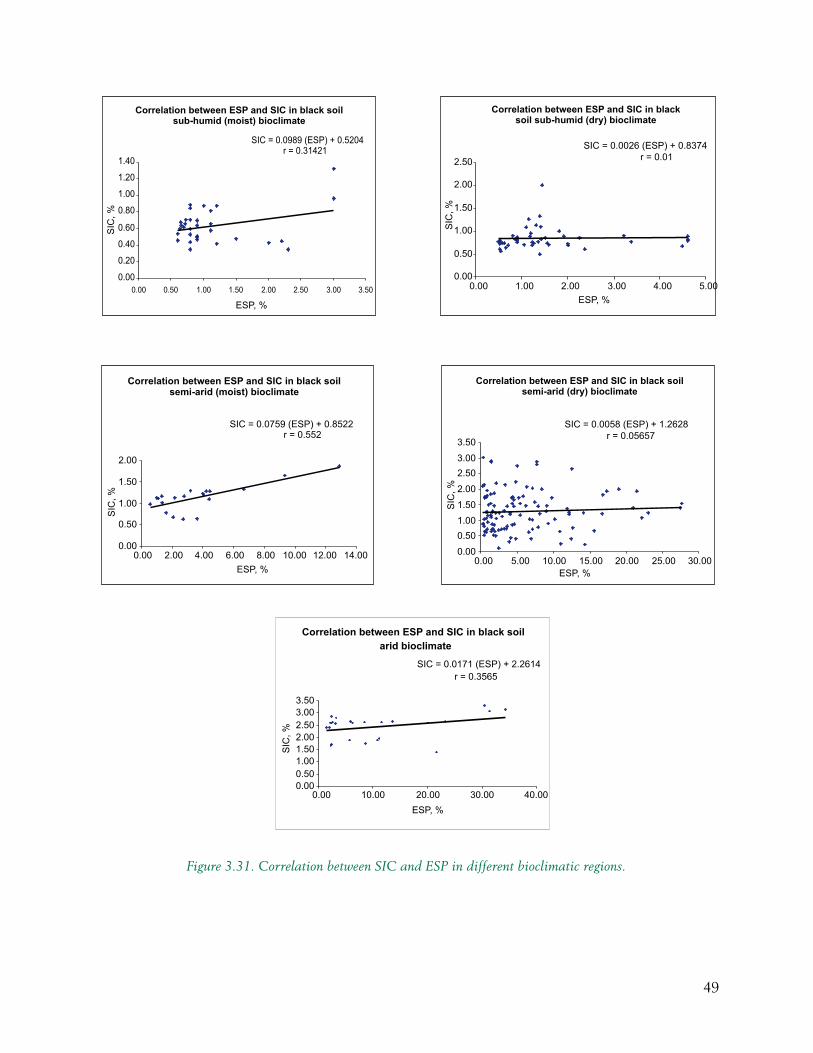
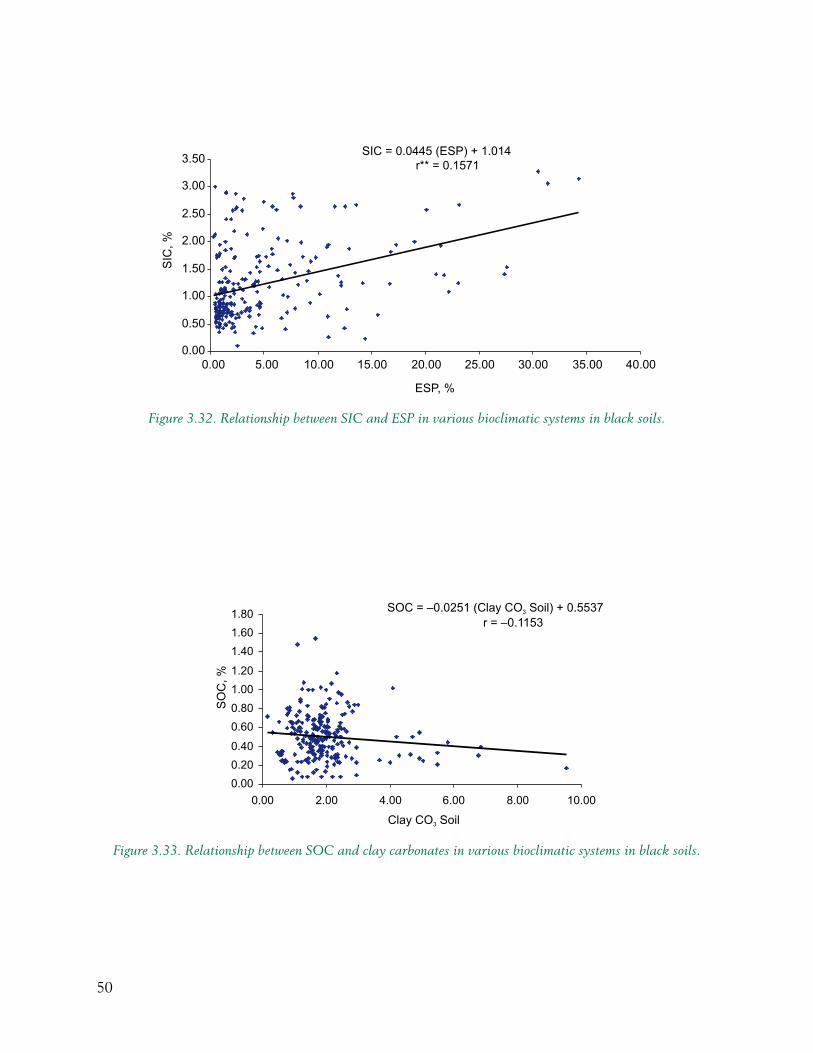
3.5.2 Relationship between SIC and ESP
The ESP values show an increasing trend with increase in SIC values in all the bioclimatic zones (Fig. 3.32). The r value in semi-arid (moist) bioclimate is the highest. The sub-humid (dry) and semi-arid (dry) bioclimates show poor r values. It is well known that an increase in SIC increases the ESP of a soil system (Pal et al. 2000). However, the discrepancies arising from poor r values in Figures 3.31b
Figure 3.22. Overall correlation between BD and HC for all the soils in different bioclimatic systems.
41
Figure 3.23. Correlation between ESP and HC of Vertisols in different bioclimatic regions.
42
Figure 3.24. Overall correlation between HC and ESP for all soils in different bioclimatic systems.
and 3.31d may be due to the relative contribution of pedogenic carbonates towards SIC, as pedogenic carbonates are directly proportional to the ESP.
The overall trend also shows an increase in ESP with increase in SIC. This is because Ca2+ in the exchange complex is preferentially released to precipitate as CaCO3 thereby increasing the relative concentration of Na+ in the exchange complex. The r value is highest in semi-arid (moist) bioclimate may be because all the four profiles of Asra and Bhatumbra series show an increase in ESP values with SIC in almost all horizons.
3.6 Clay Carbonate
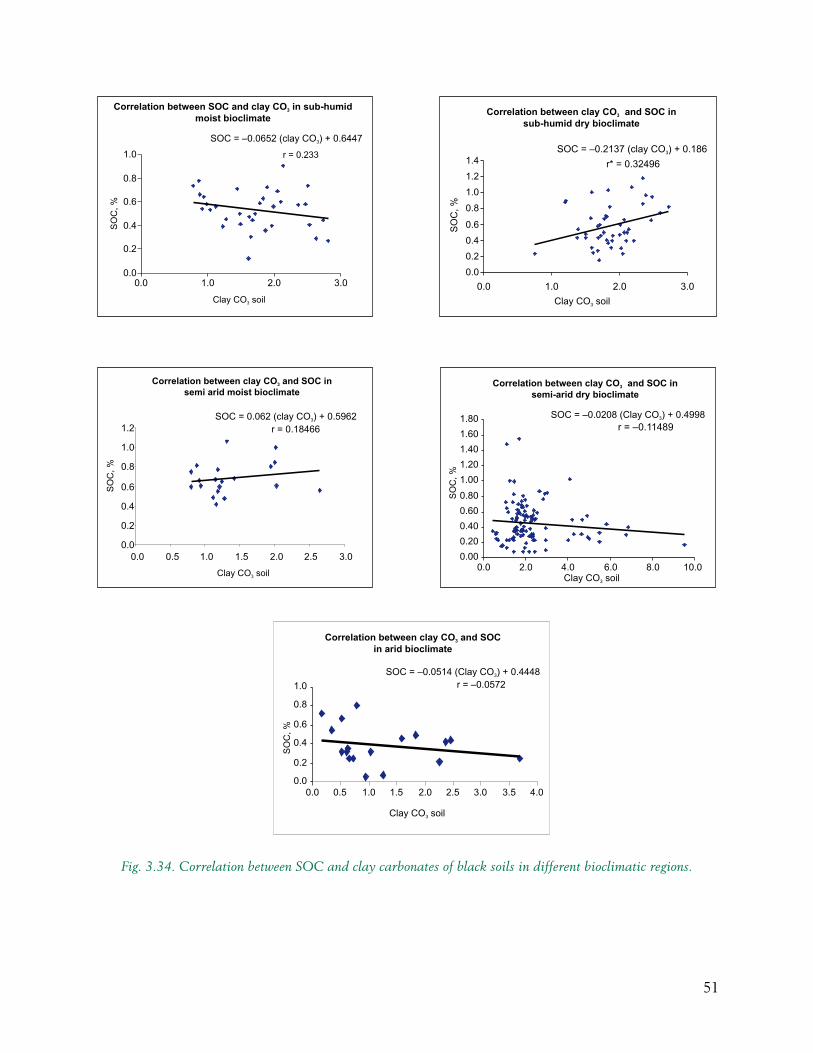
3.6.1 Relationship between SOC and Clay Carbonates
Plant residues and roots contribute to soil organic matter. These materials on decomposition release organic acids, which may solubilize inorganic calcium carbonate. Further, root exudates and organisms also effect solubilization of carbonates. These processes may reduce the amount of CaCO3 in the soil.
Earlier, the relationship between SOC and SIC were discussed. SIC represents overall CaCO3 content in the whole soils (<2 mm). Since clay is the most reactive part in soils, it appears prudent to see how clay CO3 is related to SOC in these soils.
An inverse relationship was found between SOC and clay CO3. It is true for soils under sub-humid (moist), semi-arid (dry) and arid bioclimates, wherein the correlation coefficient is negative (Fig. 3.34). However, this relation does not hold good in the soils under sub-humid (dry) and semi-arid (moist) ecosystems (Fig. 3.34). When correlation was computed between clay CO3 and SOC for the whole SAT area, an inverse correlation was obtained (Fig. 3.33).
3.6.2 Relationship between SIC and Clay Carbonates
Soil inorganic carbon in SAT areas are both non-pedogenic and pedogenic in nature and it has a direct relationship with aridity (Pal et al. 2000). Therefore, with the decrease in rainfall under natural system, clay CO3
2- is expected to have a positive relationship with SIC. The major contribution for clay CO3
2- in soil is supposed to be from pedogenic carbonates.
43
Figure 3.25. Correlation between HC and SOC of Vertisols in different bioclimatic regions.
44
Figure 3.26. Correlation between HC and SOC in various bioclimatic systems in black soils.
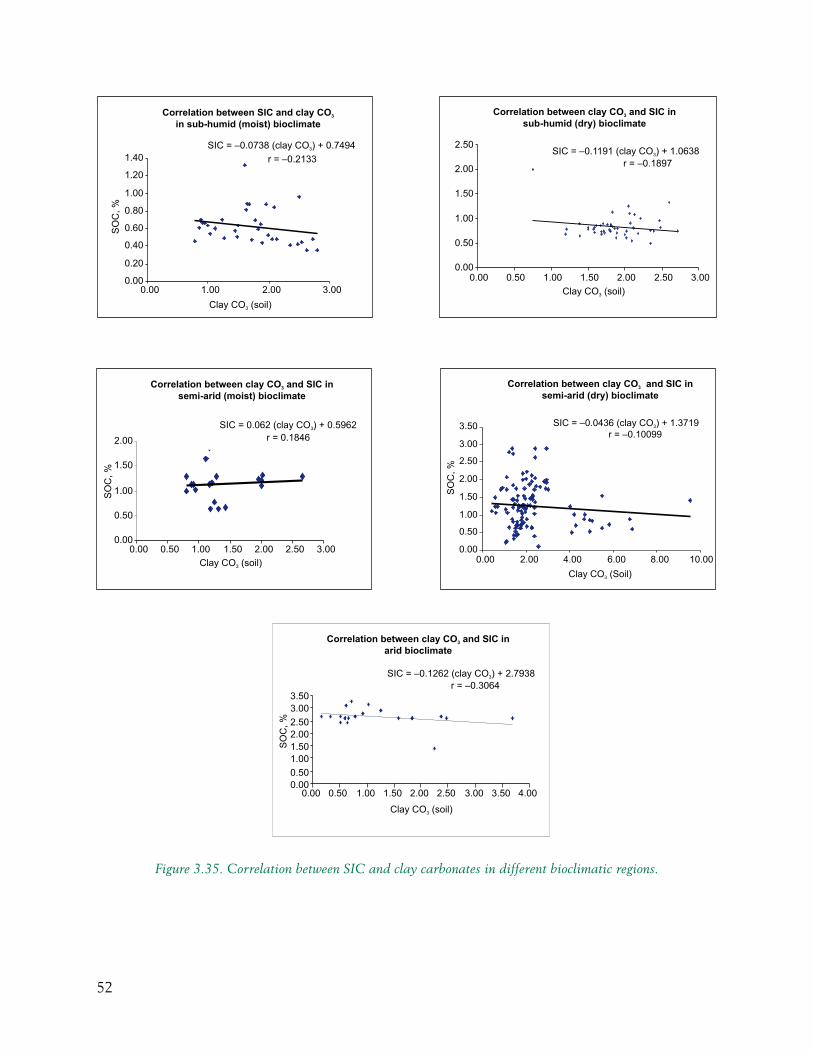
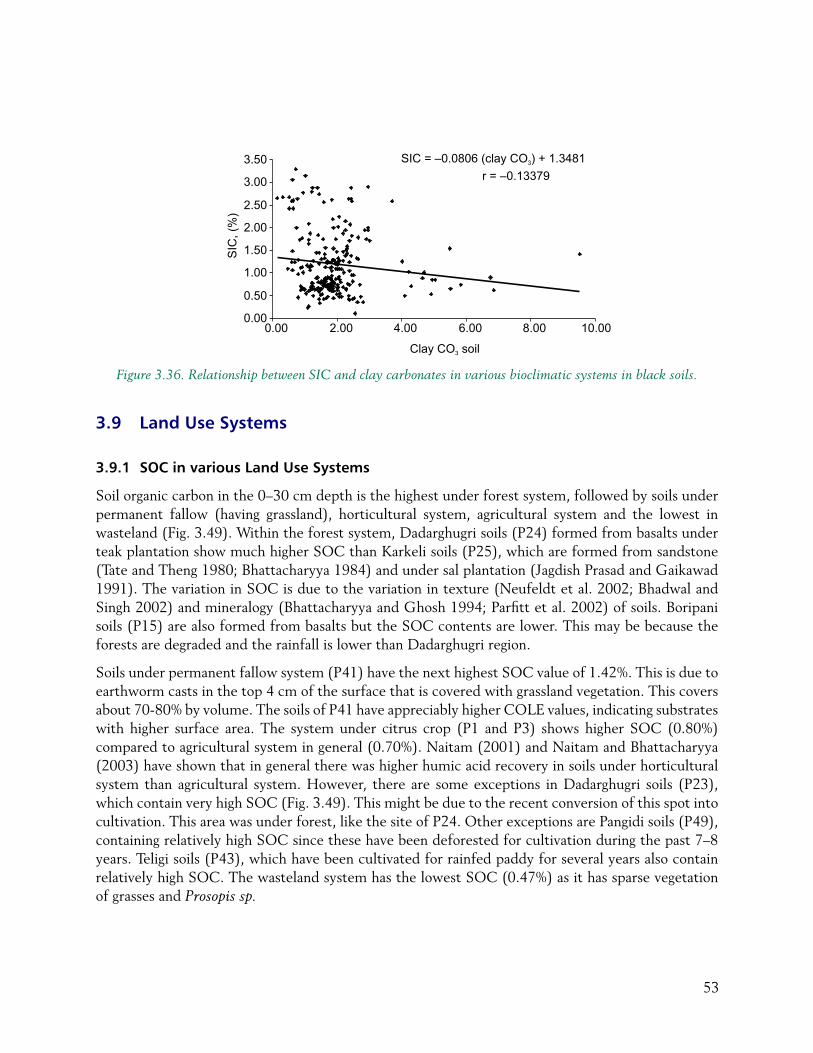
Though a positive correlation between clay carbonates and SIC is expected, only under semi-arid (moist) ecosystem this relationship is found to be true (Fig. 3.35). Under other systems a negative correlation between SIC and clay CO3
2- exists. This is also true when all systems are taken together (Fig. 3.36).
3.6.3 Relationship between water dispersible clay (WDC) and clay carbonates
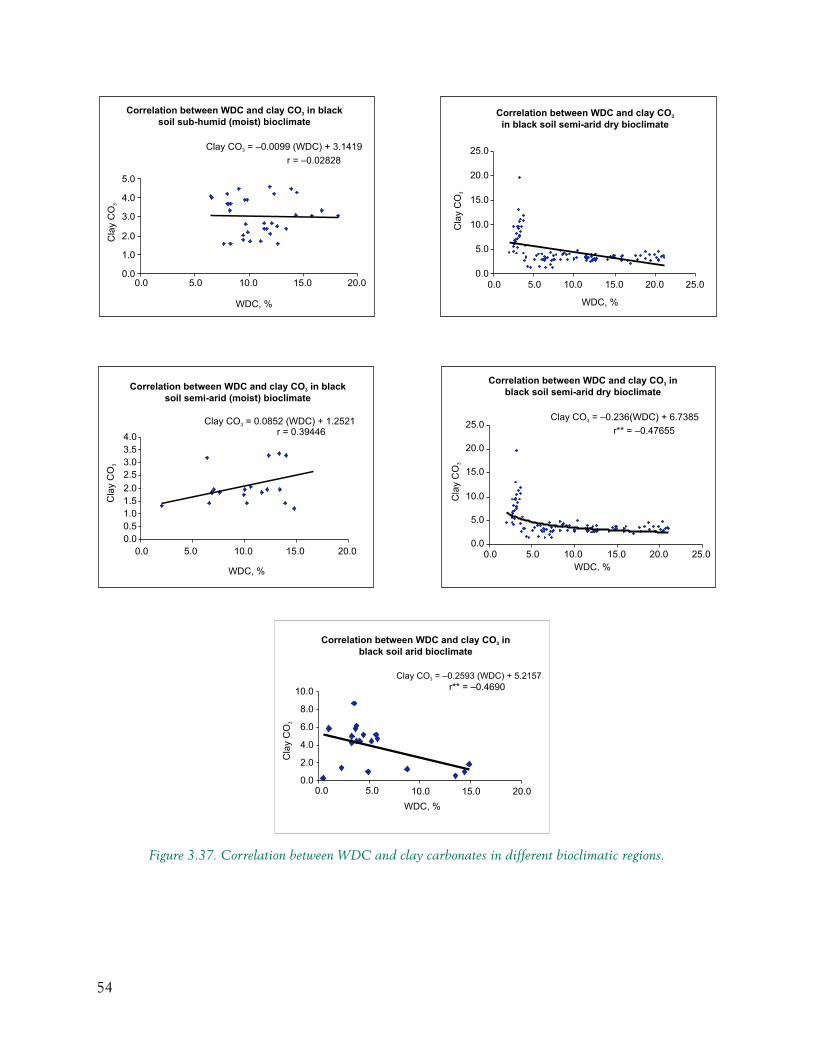
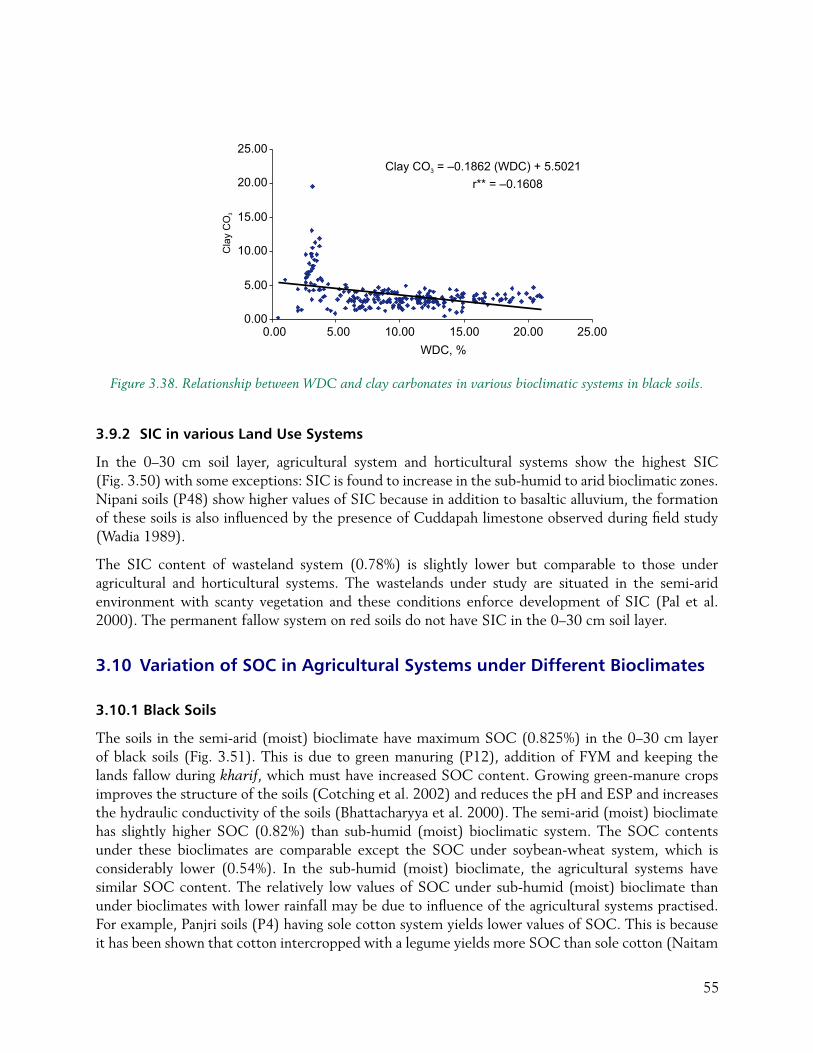
It is known that pH has a decisive role in the dispersion of clay. In Vertisols, the pH in most cases increases with depth and become strongly alkaline in the subsurfaces. When the bicarbonates precipitate as CaCO3 due to high evaporative demand under semi-arid condition, this results in the increase of ESP (Pal et al. 2000). Thus, a positive correlation between water dispersible clay (WDC) and clay carbonates is expected. This relationship holds good for soils in the sub-humid (dry) and semi-arid (moist) bioclimatic regions (Fig. 3.37), but not in other systems (Fig. 3.38).
3.7 pH
3.7.1 Relation between SOC and pH
Vertisols generally have low organic matter due to low prevailing rainfall or aridity, which results in higher degree of ions in organic matter. Absence of luxuriant vegetation further decreases level of organic matter in these soils. Increase in aridity increases the pH due to precipitation of CaCO3 and increases the ESP. Therefore, it is expected that an increase in rainfall or decrease in aridity retards the formation of CaCO3 and also decreases soil pH.
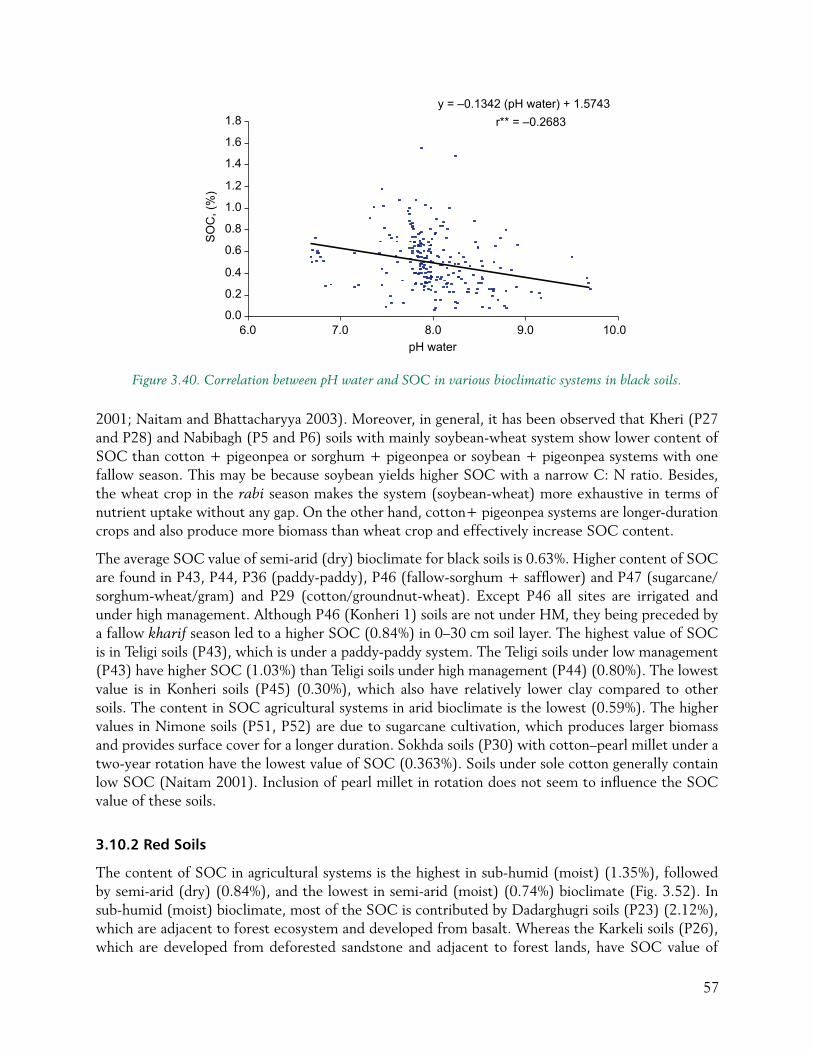
The relationship between pH and SOC is inverse in the Vertisols of all the bioclimatic zones except soils under arid climate (Fig. 3.39). A significant negative correlation (at 1% level) between SOC and pH(r=0.556)wasobservedforthesoilsundersub-humid(dry)climate.Aninversecorrelationwasalso observed when a relation was drawn for all the soils studied (Fig. 3.40).
45
Figure 3.27. Correlation between HC and SIC in different bioclimatic regions.
46
3.7.2 Relationship between SIC and pH
The soils in the SAT area have both pedogenic and non-pedogenic calcium carbonates (Pal et al. 2000). The formation of pedogenic calcium carbonate can be attributed solely to arid and semi-arid climate that induces the process of depletion of Ca+2 ions from the soil solution in the form of CaCO3, resulting an increase in the relative proportion of magnesium and sodium causing higher ESP and SAR values. Therefore, formation of calcium carbonate is also a basic process for development of sodicity (Pal et al. 2000) and increase in soil pH. Vertisols under SAT may have a positive correlation between SIC and pH. The correlation between SIC and pH is positive in Vertisols of all bioclimatic systems, except those in the semi-arid (dry) ecoregion (Fig. 3.41). However, a slight negative relation wasobservedforsoilsinthesemi-aridregion.Apositivetrendlinewasalsoobserved(r=0.3755)in the soils under SAT, confirming that with the increase in SIC there is an increase in pH due to development of sodicity (Fig. 3.42).
3.8 Soil Separates
3.8.1 Relationship between SOC and soil separates (silt + clay)
The significance of nature and content of clay as substrate has been stressed as the most important factor influencing organic carbon dynamics (Arrouays et al. 1995). Soils containing minerals with higher surface area are most suitable substrate for sequestering organic carbon. Though the soils in the SAT area are expected to be high in surface area due to dominant proportion of smectites, the Vertisols under SAT are low in organic matter. This is because the accumulation of organic carbon depends on the rate of decomposition due to higher temperature of the tropics. The Vertisols have high amount of silt and clay and very low amount of sand. Finer substrate increases the surface area and therefore Vertisols with high amount of 2:1 minerals, particularly of smectites, are expected to retain more organic carbon. Therefore, a positive correlation between soil separates and organic carbon is expected particularly in Vertisols. The study shows that the surface soil (0–15 cm) under sub-humid (moist) and arid climate has a positive correlation with SOC and clay + silt fraction (Fig.
Figure 3.28. Relationship between HC and SIC in various bioclimatic systems in black soil.
47
Figure 3.29. Correlation between SOC and ESP in Vertisols of different bioclimatic regions.
48
3.43). The general hypothesis of positive correlation also holds good when all the surface soils cutting across bioclimates are taken together (Fig. 3.44).
3.8.2 Relationship between SOC and Fine clay
A positive correlation exists between the amount of fine clay and SOC in surface soils (Fig. 3.45) except for the soils in the semi-arid (dry) climate. The Vertisols under SAT areas have more than 50% clay, of which fine clay generally comprises more than 70%. The fine clay fractions are dominated by smectites that have higher surface areas compared to other minerals in clay fractions. Therefore, the positive correlation between fine clay and SOC is expected. This positive relation is also seen in the soils under sub-humid (moist), semi-arid (moist) and arid bioclimates (Fig. 3.45). A positive relationship(r=0.01)(notsignificant)betweenSOCandfineclayobtainedforallsoilstogether(Fig. 3.46).
3.8.3 Relationship between SIC and Silt + Clay
Due to linkages between finer particles of soils and organic matter as clay-humus complexes, a relationship between the two is expected. But such a relationship between clay and SIC is not reported. However, the amount of finer particles dominated by shrink-swell minerals and sodium in the exchange complex may control the water movement in a Vertisol profile. Therefore, in arid climate, the high ESP in the clay exchange site increases the precipitation of carbonates and hence in arid climate a positive correlation between clay + silt and SIC is expected. However, this correlation is true only in the surface soils in the semi-arid (dry) ecosystem (Fig. 3.47) and when all soils are taken together (Fig. 3.48).
Figure 3.30. Relationship between SOC and ESP in various bioclimatic systems in black soils.
49
Figure 3.31. Correlation between SIC and ESP in different bioclimatic regions.
50
Figure 3.32. Relationship between SIC and ESP in various bioclimatic systems in black soils.
Figure 3.33. Relationship between SOC and clay carbonates in various bioclimatic systems in black soils.
51
Fig. 3.34. Correlation between SOC and clay carbonates of black soils in different bioclimatic regions.
52
Figure 3.35. Correlation between SIC and clay carbonates in different bioclimatic regions.
53
3.9 Land Use Systems
3.9.1 SOC in various Land Use Systems
Soil organic carbon in the 0–30 cm depth is the highest under forest system, followed by soils under permanent fallow (having grassland), horticultural system, agricultural system and the lowest in wasteland (Fig. 3.49). Within the forest system, Dadarghugri soils (P24) formed from basalts under teak plantation show much higher SOC than Karkeli soils (P25), which are formed from sandstone (Tate and Theng 1980; Bhattacharyya 1984) and under sal plantation (Jagdish Prasad and Gaikawad 1991). The variation in SOC is due to the variation in texture (Neufeldt et al. 2002; Bhadwal and Singh 2002) and mineralogy (Bhattacharyya and Ghosh 1994; Parfitt et al. 2002) of soils. Boripani soils (P15) are also formed from basalts but the SOC contents are lower. This may be because the forests are degraded and the rainfall is lower than Dadarghugri region.
Soils under permanent fallow system (P41) have the next highest SOC value of 1.42%. This is due to earthworm casts in the top 4 cm of the surface that is covered with grassland vegetation. This covers about 70-80% by volume. The soils of P41 have appreciably higher COLE values, indicating substrates with higher surface area. The system under citrus crop (P1 and P3) shows higher SOC (0.80%) compared to agricultural system in general (0.70%). Naitam (2001) and Naitam and Bhattacharyya (2003) have shown that in general there was higher humic acid recovery in soils under horticultural system than agricultural system. However, there are some exceptions in Dadarghugri soils (P23), which contain very high SOC (Fig. 3.49). This might be due to the recent conversion of this spot into cultivation. This area was under forest, like the site of P24. Other exceptions are Pangidi soils (P49), containing relatively high SOC since these have been deforested for cultivation during the past 7–8 years. Teligi soils (P43), which have been cultivated for rainfed paddy for several years also contain relatively high SOC. The wasteland system has the lowest SOC (0.47%) as it has sparse vegetation of grasses and Prosopis sp.
Figure 3.36. Relationship between SIC and clay carbonates in various bioclimatic systems in black soils.
54
Figure 3.37. Correlation between WDC and clay carbonates in different bioclimatic regions.
55
3.9.2 SIC in various Land Use Systems
In the 0–30 cm soil layer, agricultural system and horticultural systems show the highest SIC (Fig. 3.50) with some exceptions: SIC is found to increase in the sub-humid to arid bioclimatic zones. Nipani soils (P48) show higher values of SIC because in addition to basaltic alluvium, the formation of these soils is also influenced by the presence of Cuddapah limestone observed during field study (Wadia 1989).
The SIC content of wasteland system (0.78%) is slightly lower but comparable to those under agricultural and horticultural systems. The wastelands under study are situated in the semi-arid environment with scanty vegetation and these conditions enforce development of SIC (Pal et al. 2000). The permanent fallow system on red soils do not have SIC in the 0–30 cm soil layer.
3.10 Variation of SOC in Agricultural Systems under Different Bioclimates
3.10.1 Black Soils
The soils in the semi-arid (moist) bioclimate have maximum SOC (0.825%) in the 0–30 cm layer of black soils (Fig. 3.51). This is due to green manuring (P12), addition of FYM and keeping the lands fallow during kharif, which must have increased SOC content. Growing green-manure crops improves the structure of the soils (Cotching et al. 2002) and reduces the pH and ESP and increases the hydraulic conductivity of the soils (Bhattacharyya et al. 2000). The semi-arid (moist) bioclimate has slightly higher SOC (0.82%) than sub-humid (moist) bioclimatic system. The SOC contents under these bioclimates are comparable except the SOC under soybean-wheat system, which is considerably lower (0.54%). In the sub-humid (moist) bioclimate, the agricultural systems have similar SOC content. The relatively low values of SOC under sub-humid (moist) bioclimate than under bioclimates with lower rainfall may be due to influence of the agricultural systems practised. For example, Panjri soils (P4) having sole cotton system yields lower values of SOC. This is because it has been shown that cotton intercropped with a legume yields more SOC than sole cotton (Naitam
Figure 3.38. Relationship between WDC and clay carbonates in various bioclimatic systems in black soils.
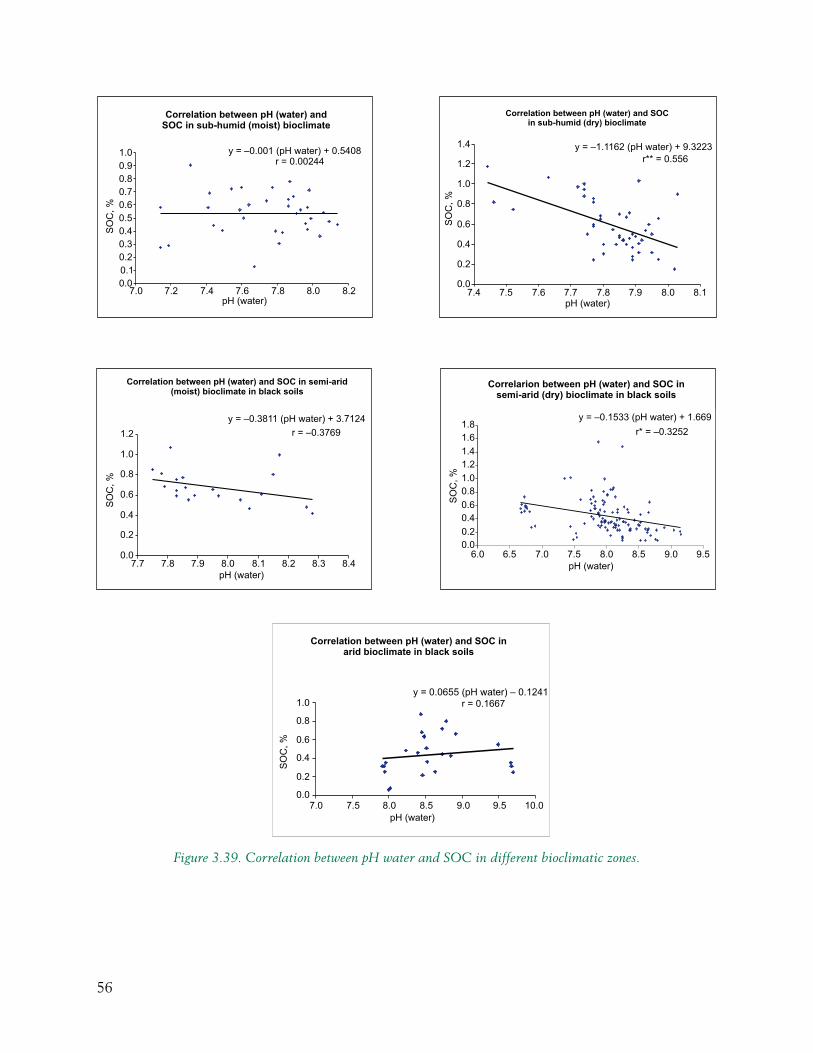
56
Figure 3.39. Correlation between pH water and SOC in different bioclimatic zones.
57
2001; Naitam and Bhattacharyya 2003). Moreover, in general, it has been observed that Kheri (P27 and P28) and Nabibagh (P5 and P6) soils with mainly soybean-wheat system show lower content of SOC than cotton + pigeonpea or sorghum + pigeonpea or soybean + pigeonpea systems with one fallow season. This may be because soybean yields higher SOC with a narrow C: N ratio. Besides, the wheat crop in the rabi season makes the system (soybean-wheat) more exhaustive in terms of nutrient uptake without any gap. On the other hand, cotton+ pigeonpea systems are longer-duration crops and also produce more biomass than wheat crop and effectively increase SOC content.
The average SOC value of semi-arid (dry) bioclimate for black soils is 0.63%. Higher content of SOC are found in P43, P44, P36 (paddy-paddy), P46 (fallow-sorghum + safflower) and P47 (sugarcane/sorghum-wheat/gram) and P29 (cotton/groundnut-wheat). Except P46 all sites are irrigated and under high management. Although P46 (Konheri 1) soils are not under HM, they being preceded by a fallow kharif season led to a higher SOC (0.84%) in 0–30 cm soil layer. The highest value of SOC is in Teligi soils (P43), which is under a paddy-paddy system. The Teligi soils under low management (P43) have higher SOC (1.03%) than Teligi soils under high management (P44) (0.80%). The lowest value is in Konheri soils (P45) (0.30%), which also have relatively lower clay compared to other soils. The content in SOC agricultural systems in arid bioclimate is the lowest (0.59%). The higher values in Nimone soils (P51, P52) are due to sugarcane cultivation, which produces larger biomass and provides surface cover for a longer duration. Sokhda soils (P30) with cotton–pearl millet under a two-year rotation have the lowest value of SOC (0.363%). Soils under sole cotton generally contain low SOC (Naitam 2001). Inclusion of pearl millet in rotation does not seem to influence the SOC value of these soils.
3.10.2 Red Soils
The content of SOC in agricultural systems is the highest in sub-humid (moist) (1.35%), followed by semi-arid (dry) (0.84%), and the lowest in semi-arid (moist) (0.74%) bioclimate (Fig. 3.52). In sub-humid (moist) bioclimate, most of the SOC is contributed by Dadarghugri soils (P23) (2.12%), which are adjacent to forest ecosystem and developed from basalt. Whereas the Karkeli soils (P26), which are developed from deforested sandstone and adjacent to forest lands, have SOC value of
Figure 3.40. Correlation between pH water and SOC in various bioclimatic systems in black soils.
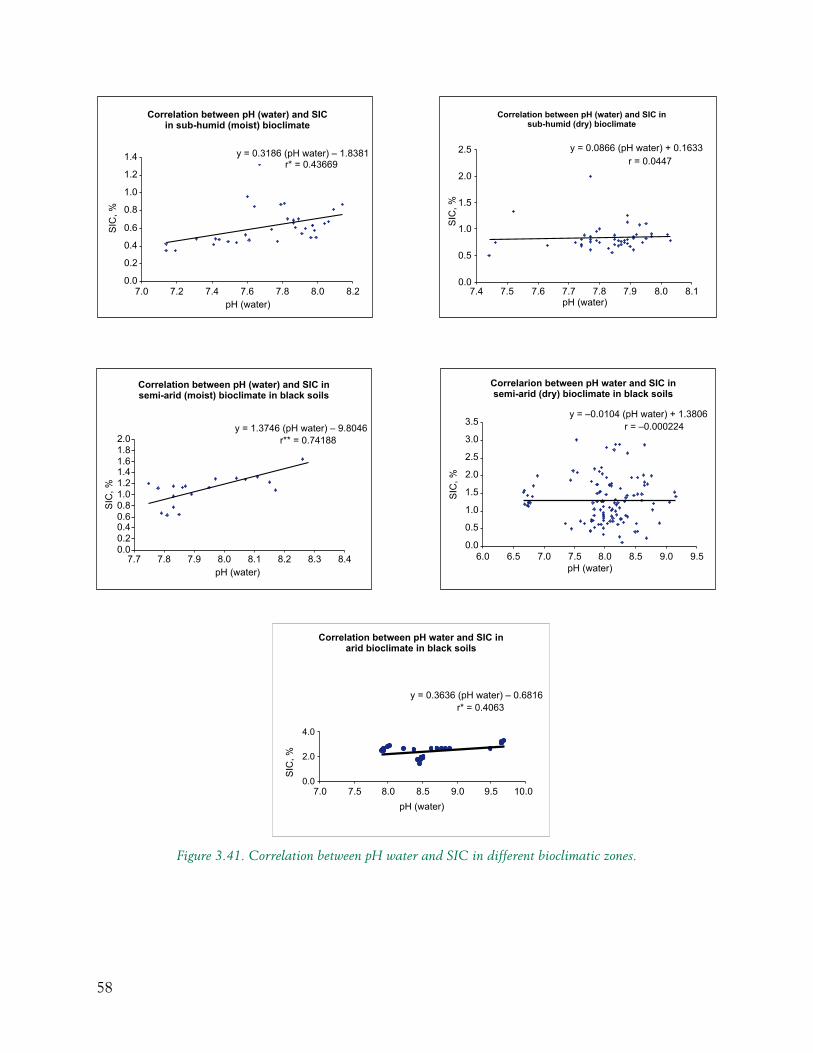
58
Figure 3.41. Correlation between pH water and SIC in different bioclimatic zones.
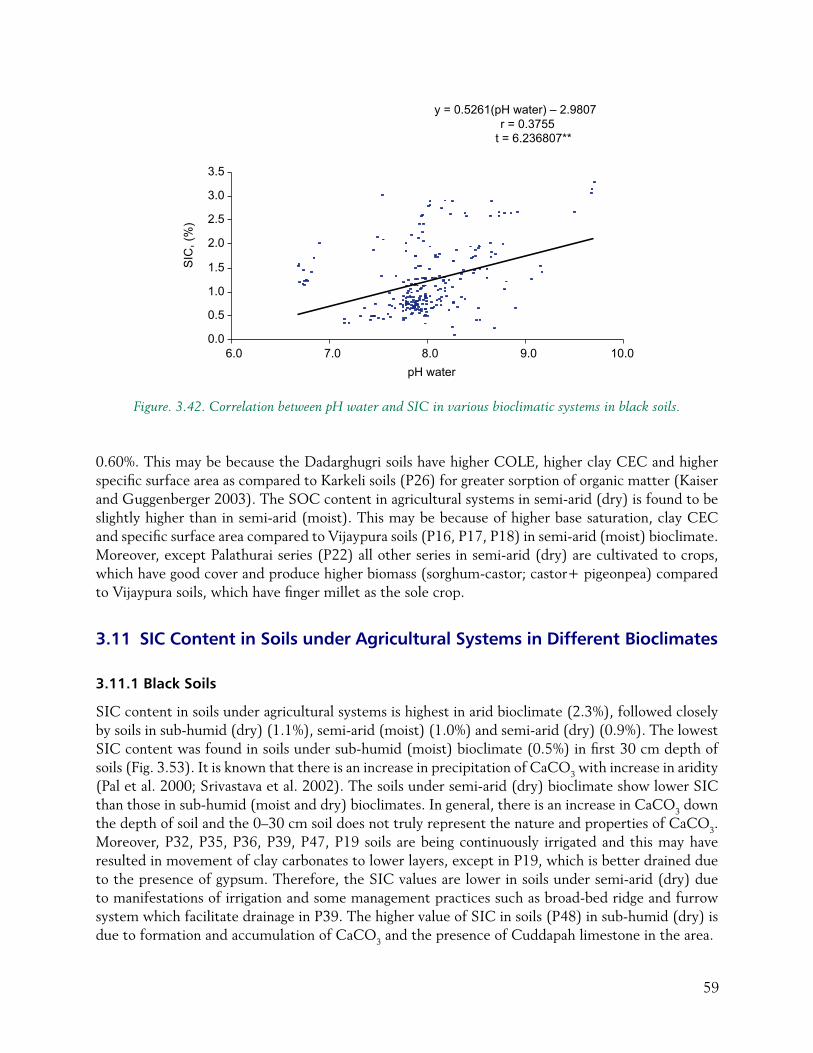
59
0.60%. This may be because the Dadarghugri soils have higher COLE, higher clay CEC and higher specific surface area as compared to Karkeli soils (P26) for greater sorption of organic matter (Kaiser and Guggenberger 2003). The SOC content in agricultural systems in semi-arid (dry) is found to be slightly higher than in semi-arid (moist). This may be because of higher base saturation, clay CEC and specific surface area compared to Vijaypura soils (P16, P17, P18) in semi-arid (moist) bioclimate. Moreover, except Palathurai series (P22) all other series in semi-arid (dry) are cultivated to crops, which have good cover and produce higher biomass (sorghum-castor; castor+ pigeonpea) compared to Vijaypura soils, which have finger millet as the sole crop.
3.11 SIC Content in Soils under Agricultural Systems in Different Bioclimates
3.11.1 Black Soils
SIC content in soils under agricultural systems is highest in arid bioclimate (2.3%), followed closely by soils in sub-humid (dry) (1.1%), semi-arid (moist) (1.0%) and semi-arid (dry) (0.9%). The lowest SIC content was found in soils under sub-humid (moist) bioclimate (0.5%) in first 30 cm depth of soils (Fig. 3.53). It is known that there is an increase in precipitation of CaCO3 with increase in aridity (Pal et al. 2000; Srivastava et al. 2002). The soils under semi-arid (dry) bioclimate show lower SIC than those in sub-humid (moist and dry) bioclimates. In general, there is an increase in CaCO3 down the depth of soil and the 0–30 cm soil does not truly represent the nature and properties of CaCO3. Moreover, P32, P35, P36, P39, P47, P19 soils are being continuously irrigated and this may have resulted in movement of clay carbonates to lower layers, except in P19, which is better drained due to the presence of gypsum. Therefore, the SIC values are lower in soils under semi-arid (dry) due to manifestations of irrigation and some management practices such as broad-bed ridge and furrow system which facilitate drainage in P39. The higher value of SIC in soils (P48) in sub-humid (dry) is due to formation and accumulation of CaCO3 and the presence of Cuddapah limestone in the area.
Figure. 3.42. Correlation between pH water and SIC in various bioclimatic systems in black soils.
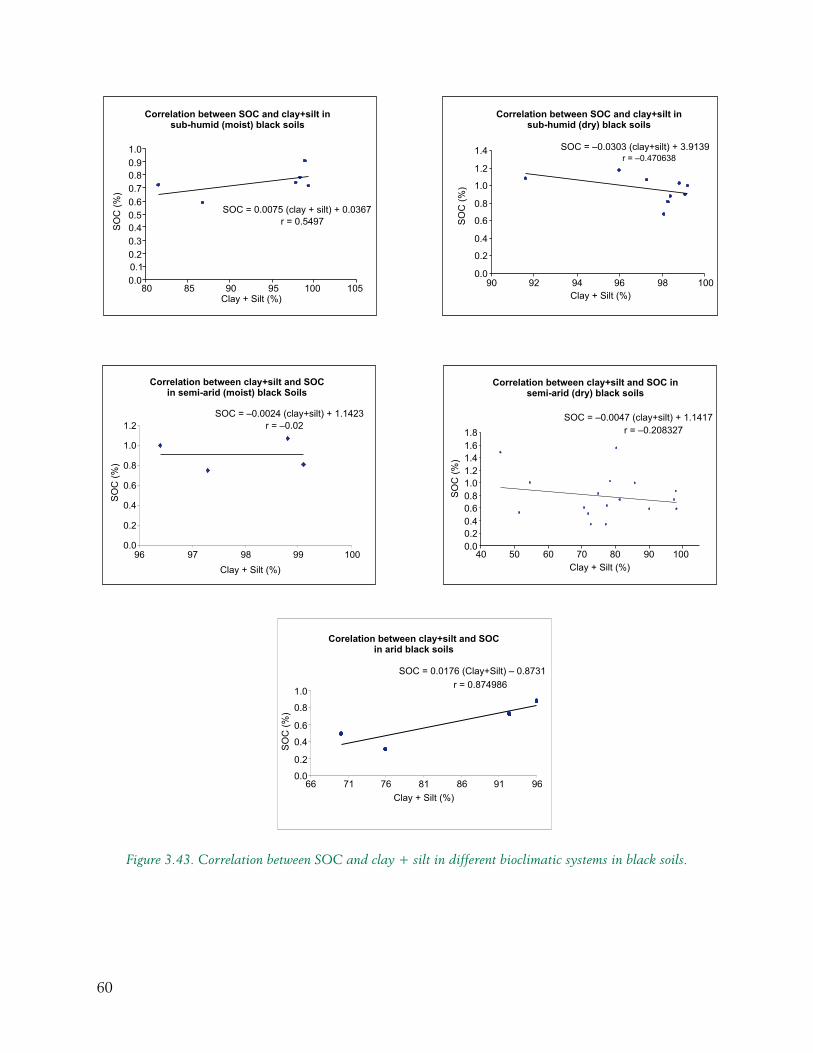
60
Figure 3.43. Correlation between SOC and clay + silt in different bioclimatic systems in black soils.
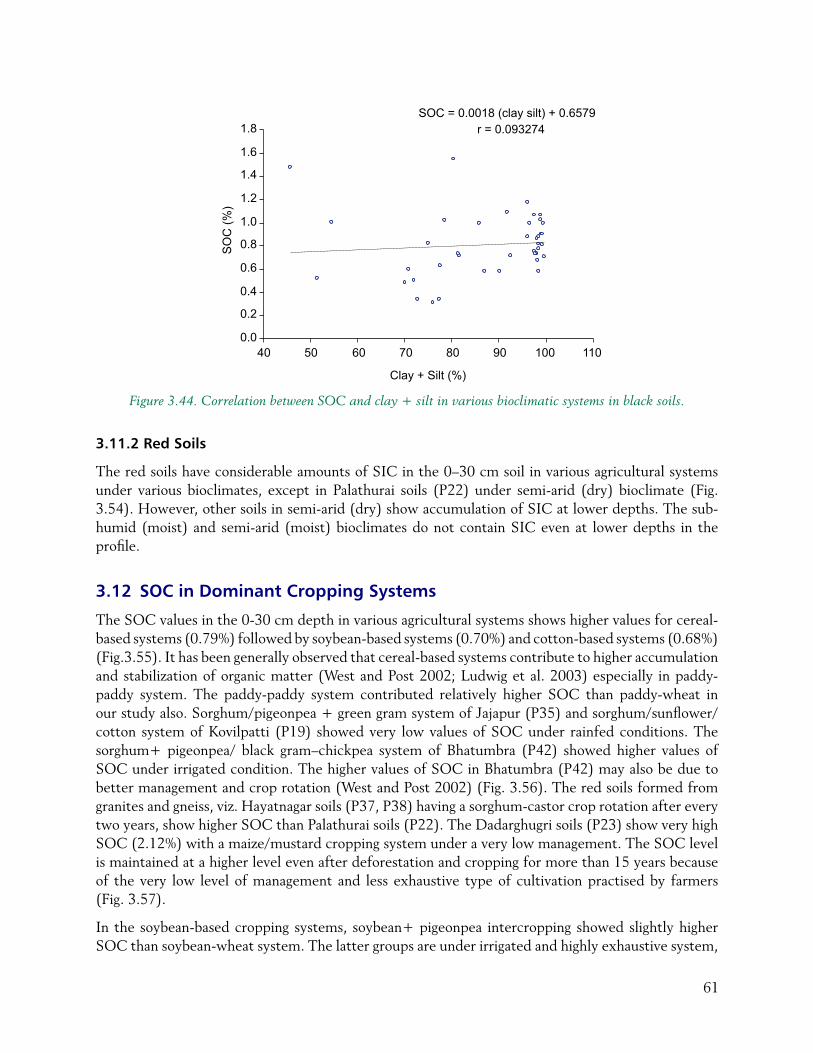
61
3.11.2 Red Soils
The red soils have considerable amounts of SIC in the 0–30 cm soil in various agricultural systems under various bioclimates, except in Palathurai soils (P22) under semi-arid (dry) bioclimate (Fig. 3.54). However, other soils in semi-arid (dry) show accumulation of SIC at lower depths. The sub-humid (moist) and semi-arid (moist) bioclimates do not contain SIC even at lower depths in the profile.
3.12 SOC in Dominant Cropping Systems
The SOC values in the 0-30 cm depth in various agricultural systems shows higher values for cereal-based systems (0.79%) followed by soybean-based systems (0.70%) and cotton-based systems (0.68%) (Fig.3.55). It has been generally observed that cereal-based systems contribute to higher accumulation and stabilization of organic matter (West and Post 2002; Ludwig et al. 2003) especially in paddy-paddy system. The paddy-paddy system contributed relatively higher SOC than paddy-wheat in our study also. Sorghum/pigeonpea + green gram system of Jajapur (P35) and sorghum/sunflower/cotton system of Kovilpatti (P19) showed very low values of SOC under rainfed conditions. The sorghum+ pigeonpea/ black gram–chickpea system of Bhatumbra (P42) showed higher values of SOC under irrigated condition. The higher values of SOC in Bhatumbra (P42) may also be due to better management and crop rotation (West and Post 2002) (Fig. 3.56). The red soils formed from granites and gneiss, viz. Hayatnagar soils (P37, P38) having a sorghum-castor crop rotation after every two years, show higher SOC than Palathurai soils (P22). The Dadarghugri soils (P23) show very high SOC (2.12%) with a maize/mustard cropping system under a very low management. The SOC level is maintained at a higher level even after deforestation and cropping for more than 15 years because of the very low level of management and less exhaustive type of cultivation practised by farmers (Fig. 3.57).
In the soybean-based cropping systems, soybean+ pigeonpea intercropping showed slightly higher SOC than soybean-wheat system. The latter groups are under irrigated and highly exhaustive system,
Figure 3.44. Correlation between SOC and clay + silt in various bioclimatic systems in black soils.
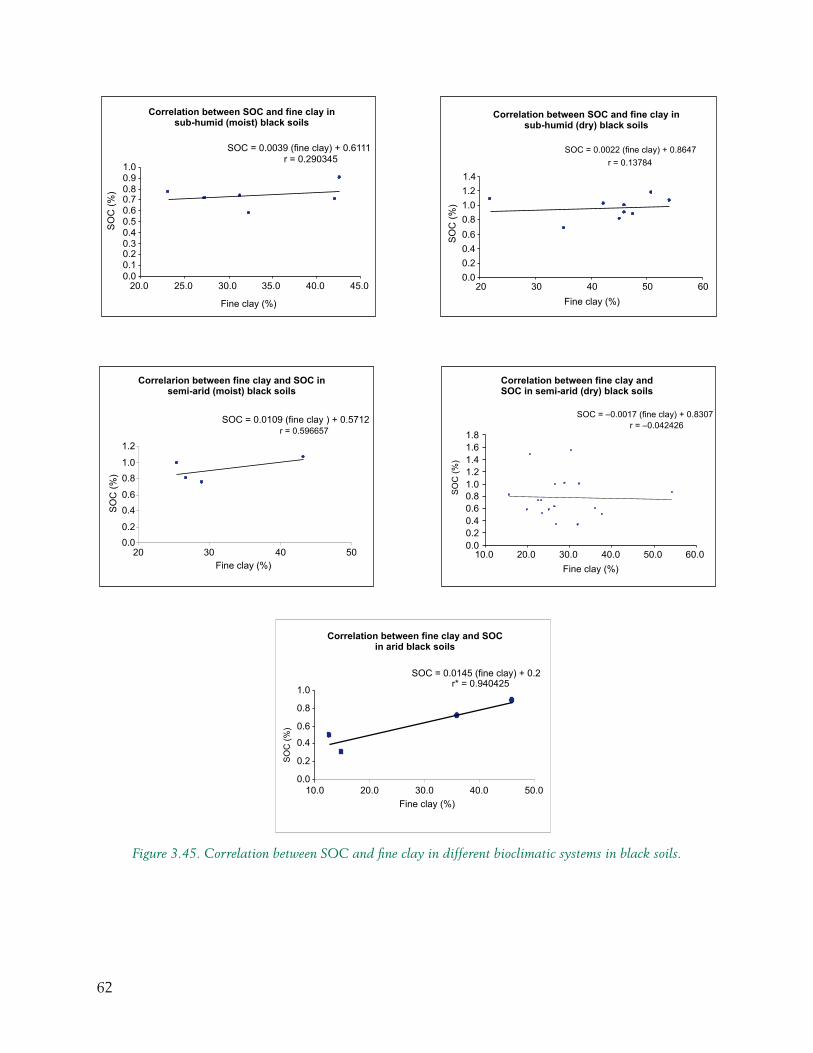
62
Figure 3.45. Correlation between SOC and fine clay in different bioclimatic systems in black soils.
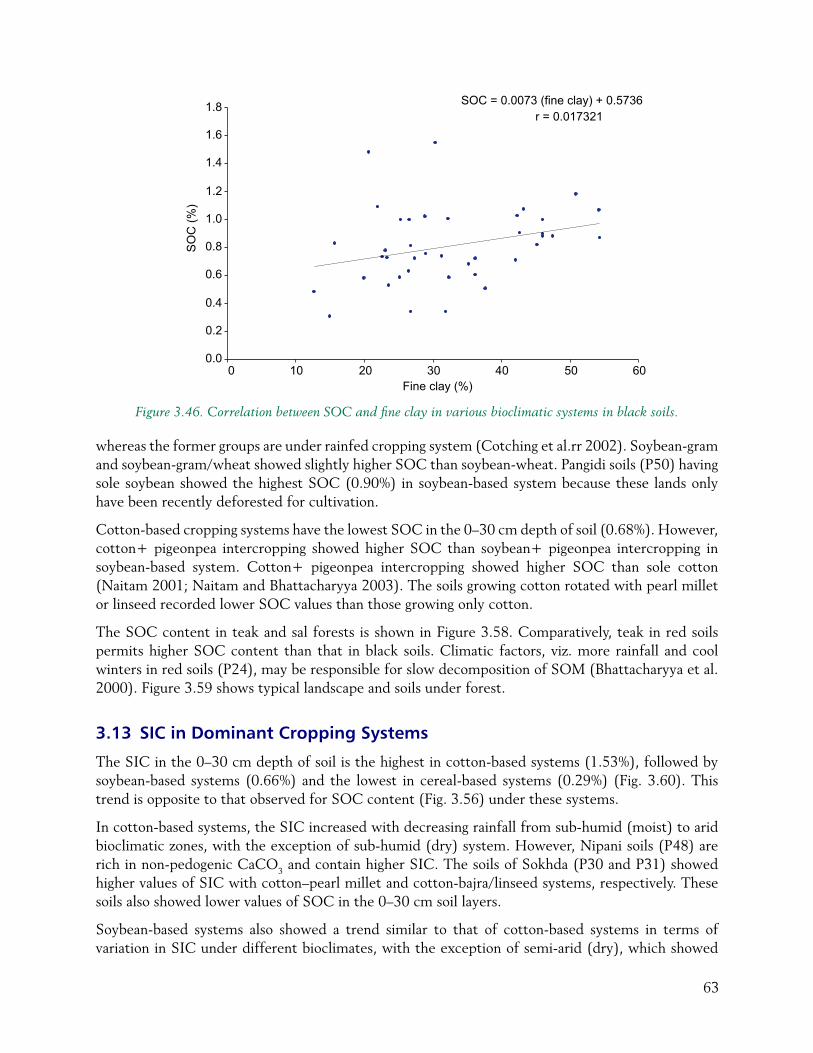
63
whereas the former groups are under rainfed cropping system (Cotching et al.rr 2002). Soybean-gram and soybean-gram/wheat showed slightly higher SOC than soybean-wheat. Pangidi soils (P50) having sole soybean showed the highest SOC (0.90%) in soybean-based system because these lands only have been recently deforested for cultivation.
Cotton-based cropping systems have the lowest SOC in the 0–30 cm depth of soil (0.68%). However, cotton+ pigeonpea intercropping showed higher SOC than soybean+ pigeonpea intercropping in soybean-based system. Cotton+ pigeonpea intercropping showed higher SOC than sole cotton (Naitam 2001; Naitam and Bhattacharyya 2003). The soils growing cotton rotated with pearl millet or linseed recorded lower SOC values than those growing only cotton.
The SOC content in teak and sal forests is shown in Figure 3.58. Comparatively, teak in red soils permits higher SOC content than that in black soils. Climatic factors, viz. more rainfall and cool winters in red soils (P24), may be responsible for slow decomposition of SOM (Bhattacharyya et al. 2000). Figure 3.59 shows typical landscape and soils under forest.
3.13 SIC in Dominant Cropping Systems
The SIC in the 0–30 cm depth of soil is the highest in cotton-based systems (1.53%), followed by soybean-based systems (0.66%) and the lowest in cereal-based systems (0.29%) (Fig. 3.60). This trend is opposite to that observed for SOC content (Fig. 3.56) under these systems.
In cotton-based systems, the SIC increased with decreasing rainfall from sub-humid (moist) to arid bioclimatic zones, with the exception of sub-humid (dry) system. However, Nipani soils (P48) are rich in non-pedogenic CaCO3 and contain higher SIC. The soils of Sokhda (P30 and P31) showed higher values of SIC with cotton–pearl millet and cotton-bajra/linseed systems, respectively. These soils also showed lower values of SOC in the 0–30 cm soil layers.
Soybean-based systems also showed a trend similar to that of cotton-based systems in terms of variation in SIC under different bioclimates, with the exception of semi-arid (dry), which showed
Figure 3.46. Correlation between SOC and fine clay in various bioclimatic systems in black soils.
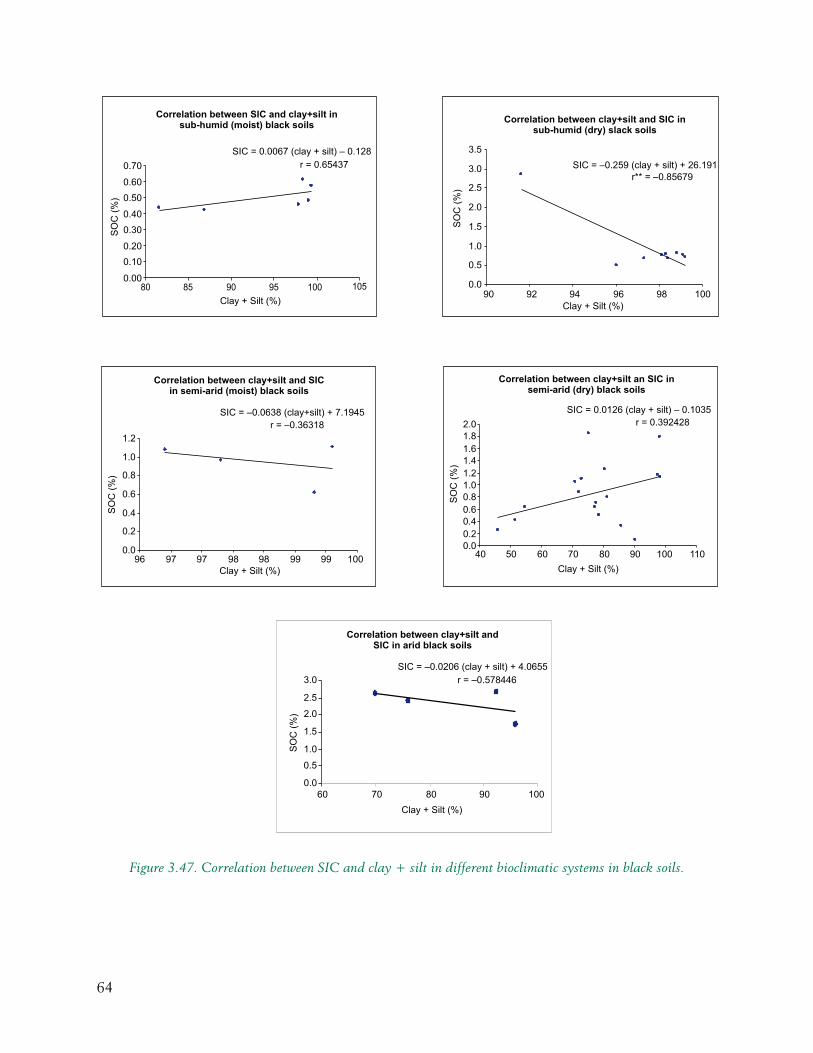
64
Figure 3.47. Correlation between SIC and clay + silt in different bioclimatic systems in black soils.
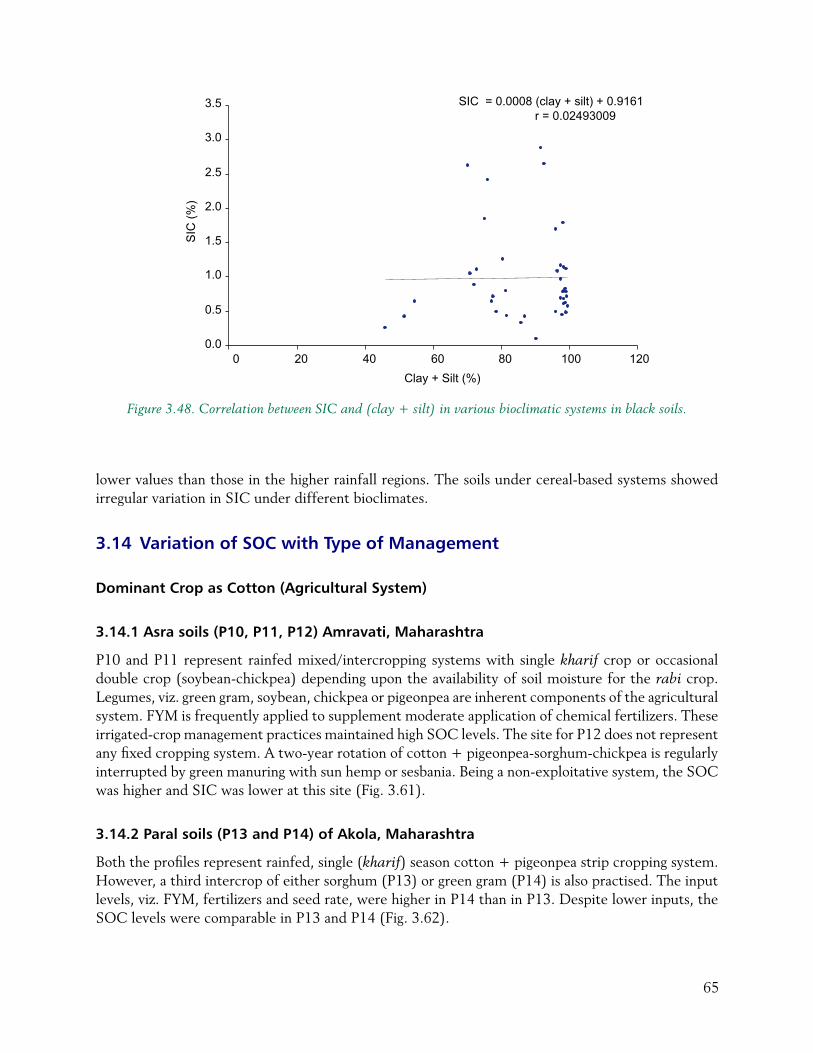
65
lower values than those in the higher rainfall regions. The soils under cereal-based systems showed irregular variation in SIC under different bioclimates.
3.14 Variation of SOC with Type of Management
Dominant Crop as Cotton (Agricultural System)
3.14.1 Asra soils (P10, P11, P12) Amravati, Maharashtra
P10 and P11 represent rainfed mixed/intercropping systems with single kharif crop or occasional double crop (soybean-chickpea) depending upon the availability of soil moisture for the rabi crop. Legumes, viz. green gram, soybean, chickpea or pigeonpea are inherent components of the agricultural system. FYM is frequently applied to supplement moderate application of chemical fertilizers. These irrigated-crop management practices maintained high SOC levels. The site for P12 does not represent any fixed cropping system. A two-year rotation of cotton + pigeonpea-sorghum-chickpea is regularly interrupted by green manuring with sun hemp or sesbania. Being a non-exploitative system, the SOC was higher and SIC was lower at this site (Fig. 3.61).
3.14.2 Paral soils (P13 and P14) of Akola, Maharashtra
Both the profiles represent rainfed, single (kharif) season cotton + pigeonpea strip cropping system. However, a third intercrop of either sorghum (P13) or green gram (P14) is also practised. The input levels, viz. FYM, fertilizers and seed rate, were higher in P14 than in P13. Despite lower inputs, the SOC levels were comparable in P13 and P14 (Fig. 3.62).
Figure 3.48. Correlation between SIC and (clay + silt) in various bioclimatic systems in black soils.
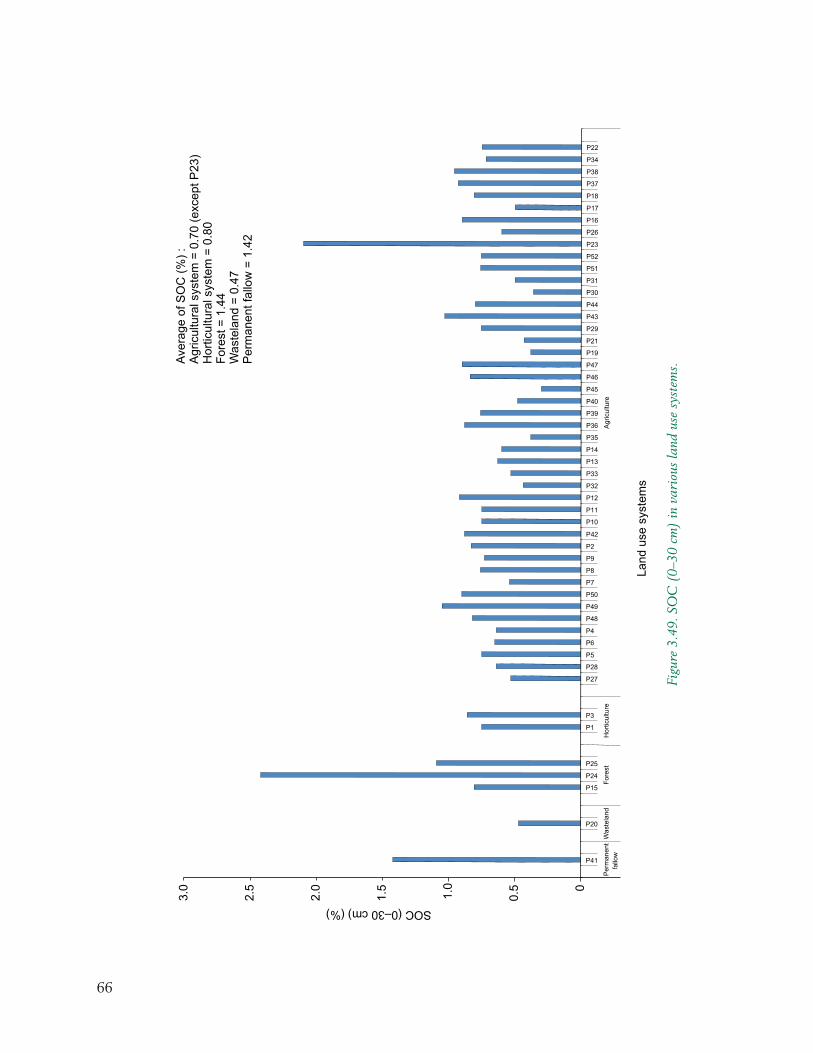
66
Figu
re 3
.49.
SO
C (
0–30
cm
) in
var
ious
land
use
sys
tem
s.
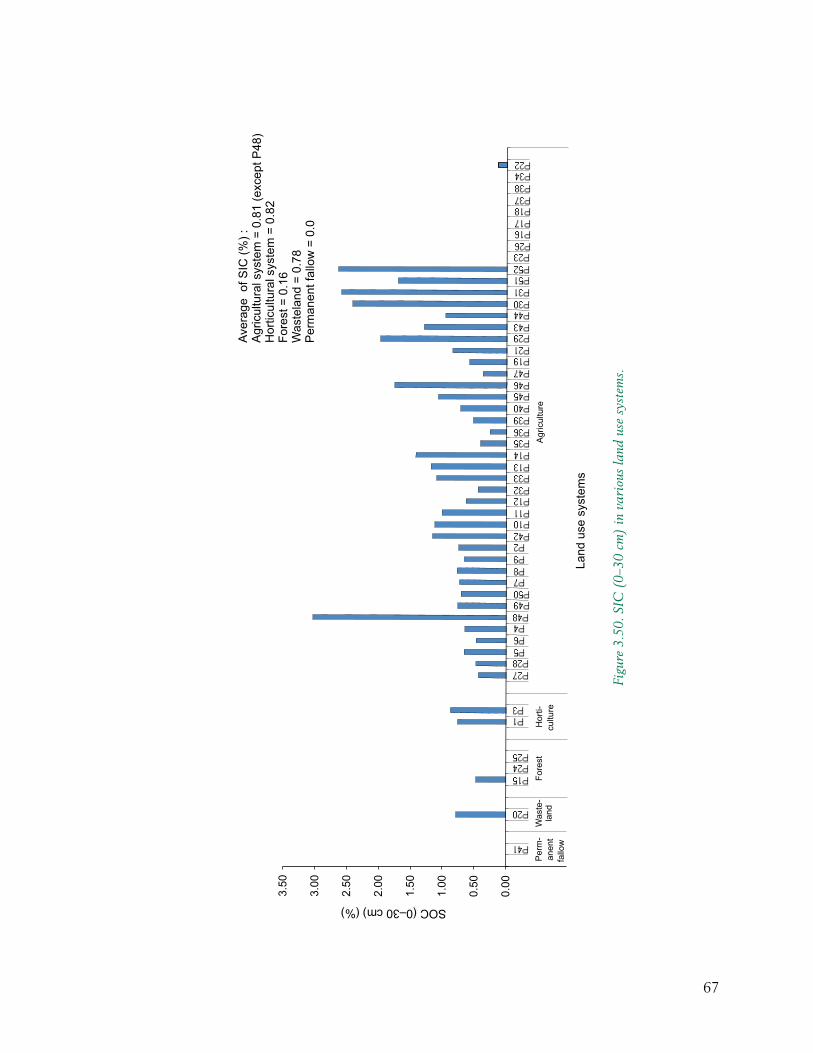
67
Figu
re 3
.50.
SIC
(0–
30 c
m)
in v
ario
us la
nd u
se s
yste
ms.
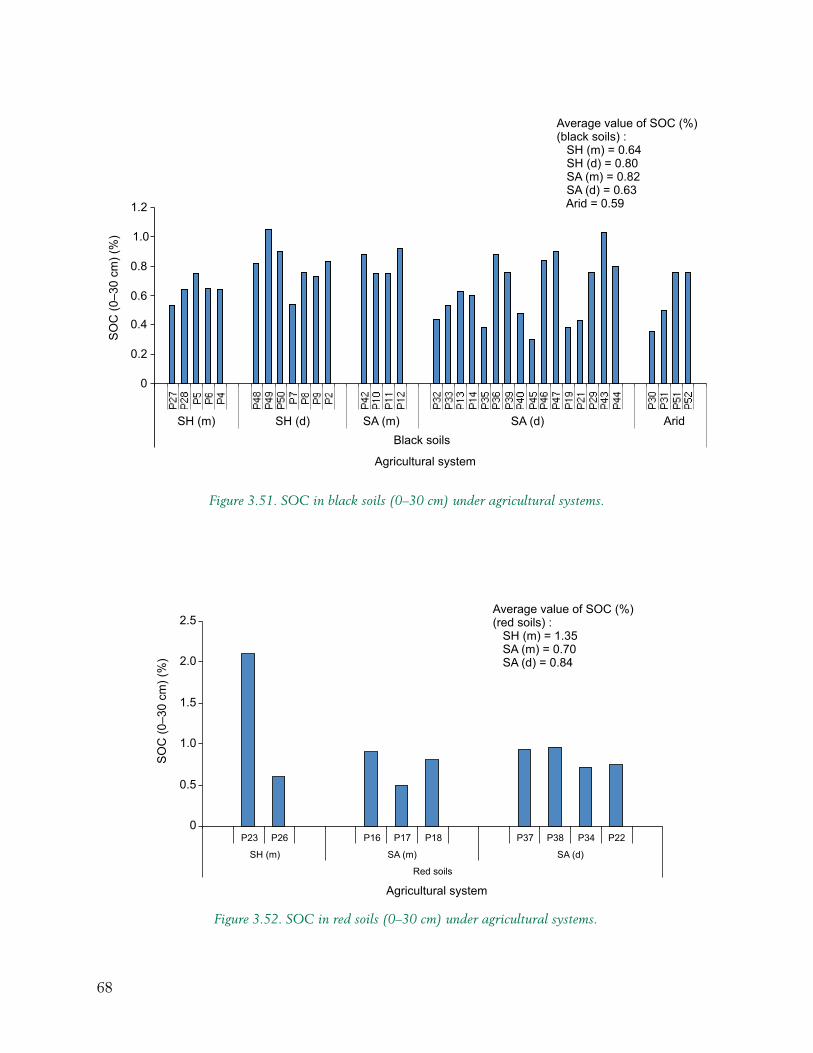
68
Figure 3.51. SOC in black soils (0–30 cm) under agricultural systems.
Figure 3.52. SOC in red soils (0–30 cm) under agricultural systems.

69
Figure 3.53. SIC in black and red soils (0–30 cm) in agricultural systems.
Figure 3.54. SIC in black and red soils (0–150 cm) in agricultural systems.
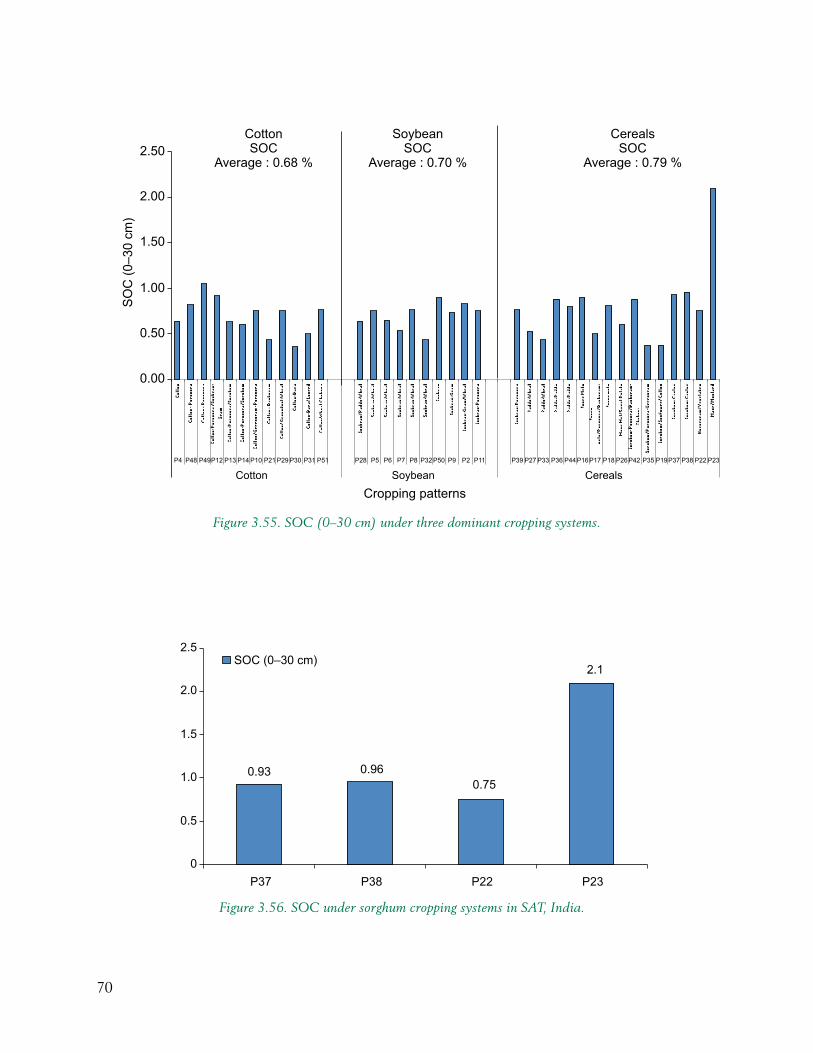
70
Figure 3.55. SOC (0–30 cm) under three dominant cropping systems.
Figure 3.56. SOC under sorghum cropping systems in SAT, India.
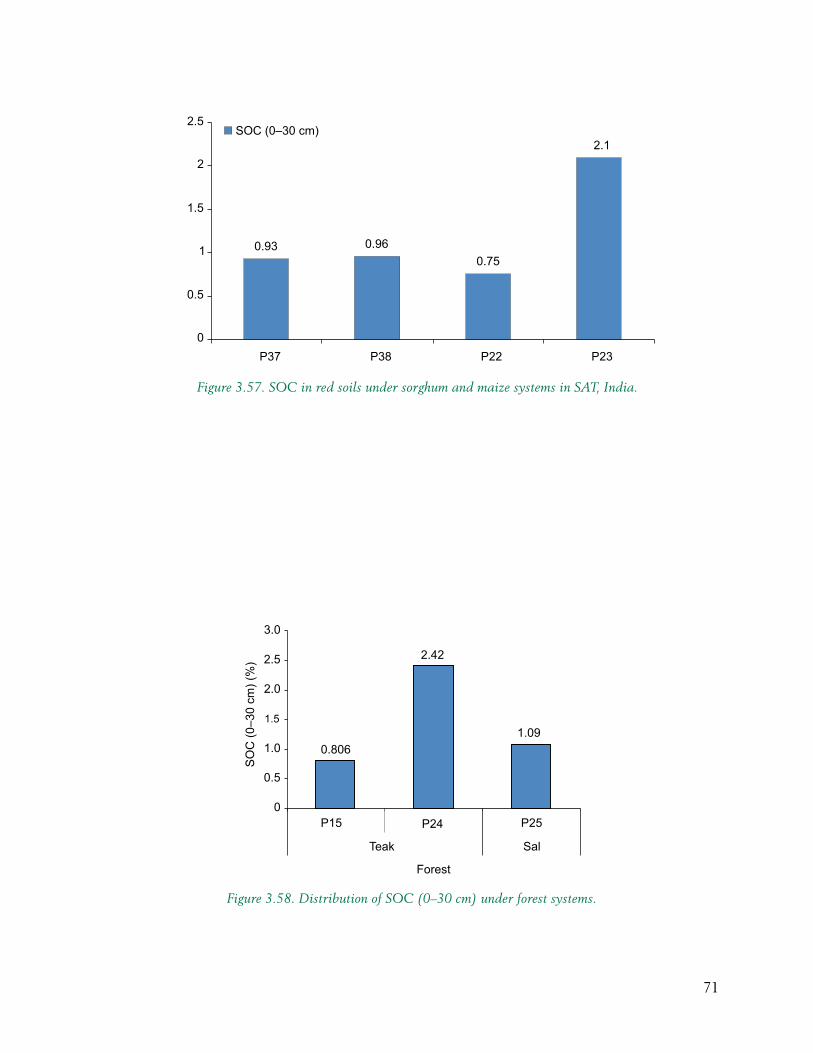
71
Figure 3.57. SOC in red soils under sorghum and maize systems in SAT, India.
Figure 3.58. Distribution of SOC (0–30 cm) under forest systems.
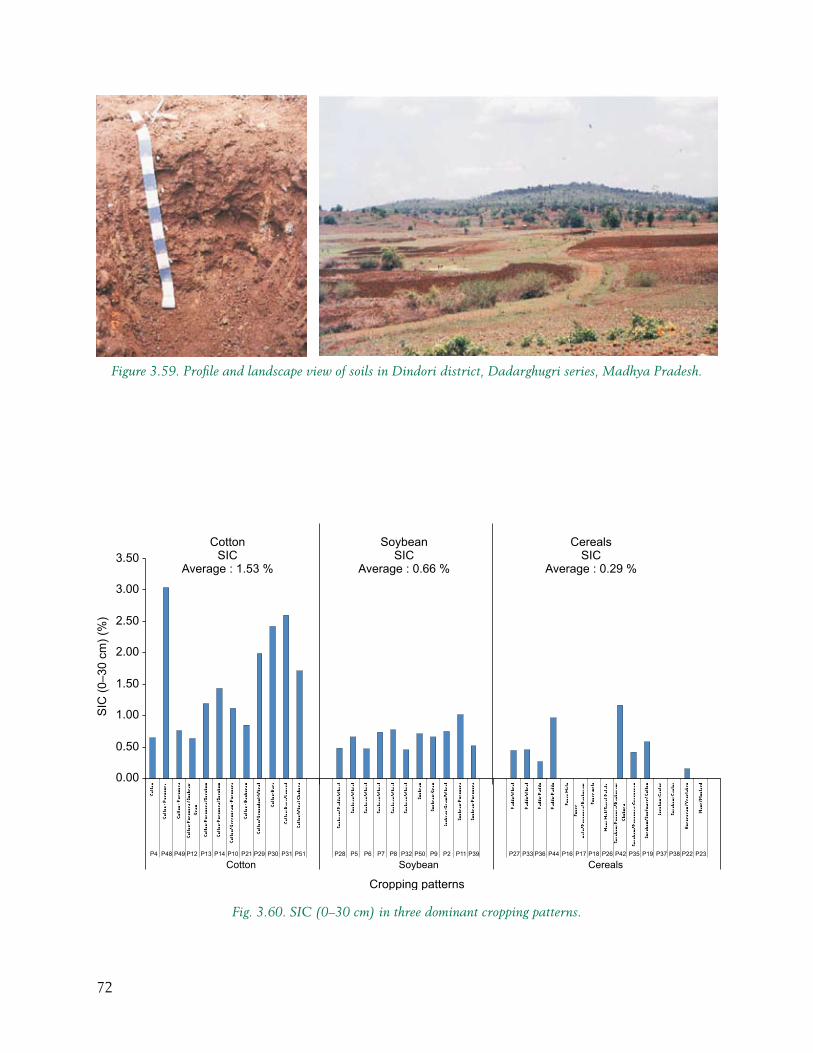
72
Figure 3.59. Profile and landscape view of soils in Dindori district, Dadarghugri series, Madhya Pradesh.
Fig. 3.60. SIC (0–30 cm) in three dominant cropping patterns.
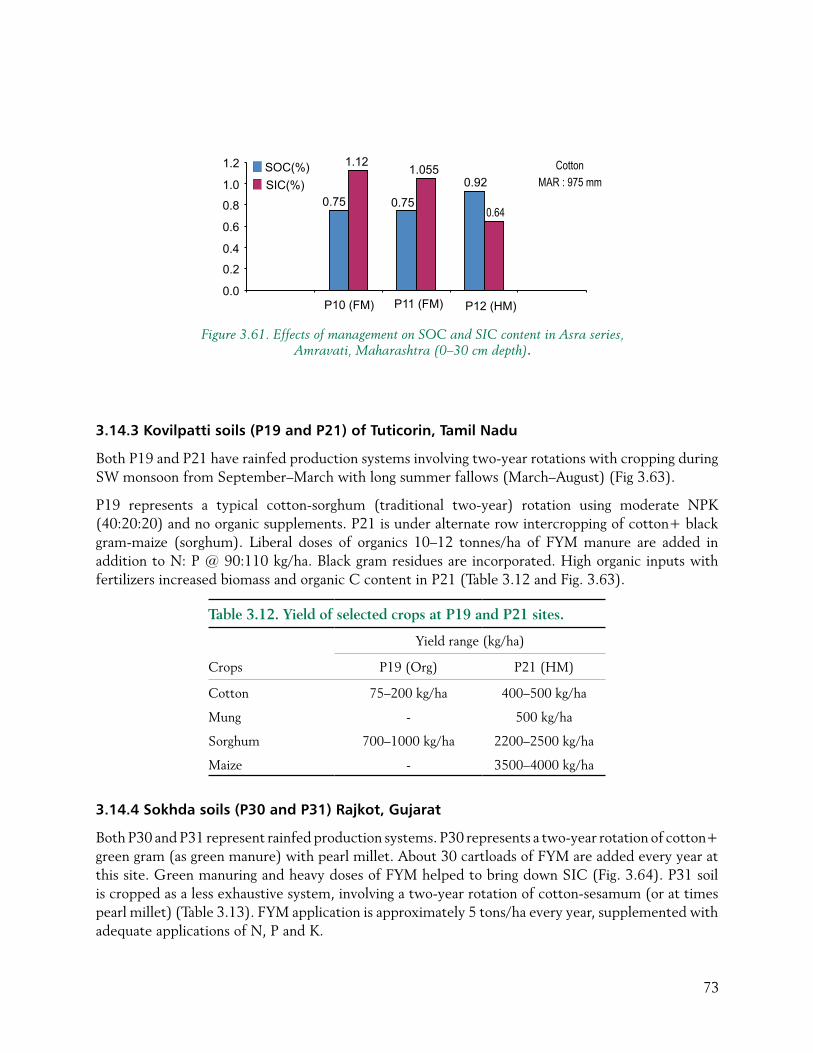
73
3.14.3 Kovilpatti soils (P19 and P21) of Tuticorin, Tamil Nadu
Both P19 and P21 have rainfed production systems involving two-year rotations with cropping during SW monsoon from September–March with long summer fallows (March–August) (Fig 3.63).
P19 represents a typical cotton-sorghum (traditional two-year) rotation using moderate NPK (40:20:20) and no organic supplements. P21 is under alternate row intercropping of cotton+ black gram-maize (sorghum). Liberal doses of organics 10–12 tonnes/ha of FYM manure are added in addition to N: P @ 90:110 kg/ha. Black gram residues are incorporated. High organic inputs with fertilizers increased biomass and organic C content in P21 (Table 3.12 and Fig. 3.63).
Table 3.12. Yield of selected crops at P19 and P21 sites.
Crops
Yield range (kg/ha)
P19 (Org) P21 (HM)
Cotton 75–200 kg/ha 400–500 kg/ha
Mung - 500 kg/ha
Sorghum 700–1000 kg/ha 2200–2500 kg/ha
Maize - 3500–4000 kg/ha
3.14.4 Sokhda soils (P30 and P31) Rajkot, Gujarat
Both P30 and P31 represent rainfed production systems. P30 represents a two-year rotation of cotton+ green gram (as green manure) with pearl millet. About 30 cartloads of FYM are added every year at this site. Green manuring and heavy doses of FYM helped to bring down SIC (Fig. 3.64). P31 soil is cropped as a less exhaustive system, involving a two-year rotation of cotton-sesamum (or at times pearl millet) (Table 3.13). FYM application is approximately 5 tons/ha every year, supplemented with adequate applications of N, P and K.
Figure 3.61. Effects of management on SOC and SIC content in Asra series, Amravati, Maharashtra (0–30 cm depth).
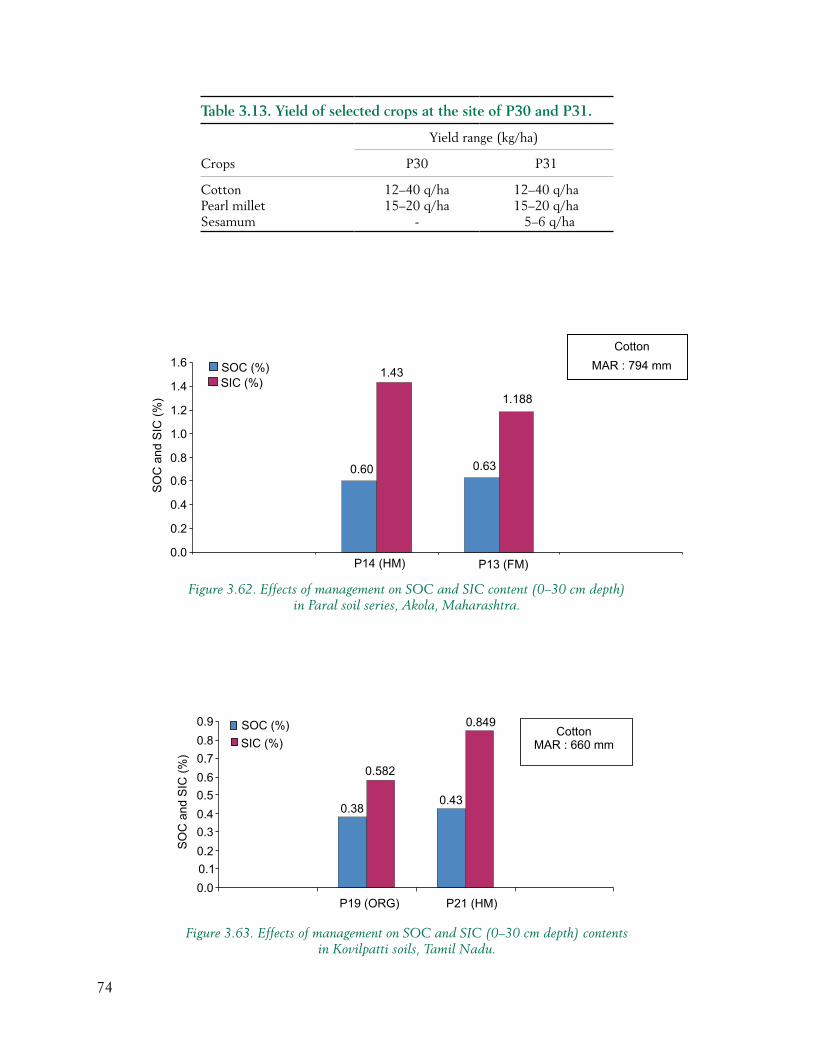
74
Table 3.13. Yield of selected crops at the site of P30 and P31.
Crops
Yield range (kg/ha)
P30 P31
Cotton 12–40 q/ha 12–40 q/haPearl millet 15–20 q/ha 15–20 q/haSesamum - 5–6 q/ha
Figure 3.62. Effects of management on SOC and SIC content (0–30 cm depth) in Paral soil series, Akola, Maharashtra.
Figure 3.63. Effects of management on SOC and SIC (0–30 cm depth) contents in Kovilpatti soils, Tamil Nadu.
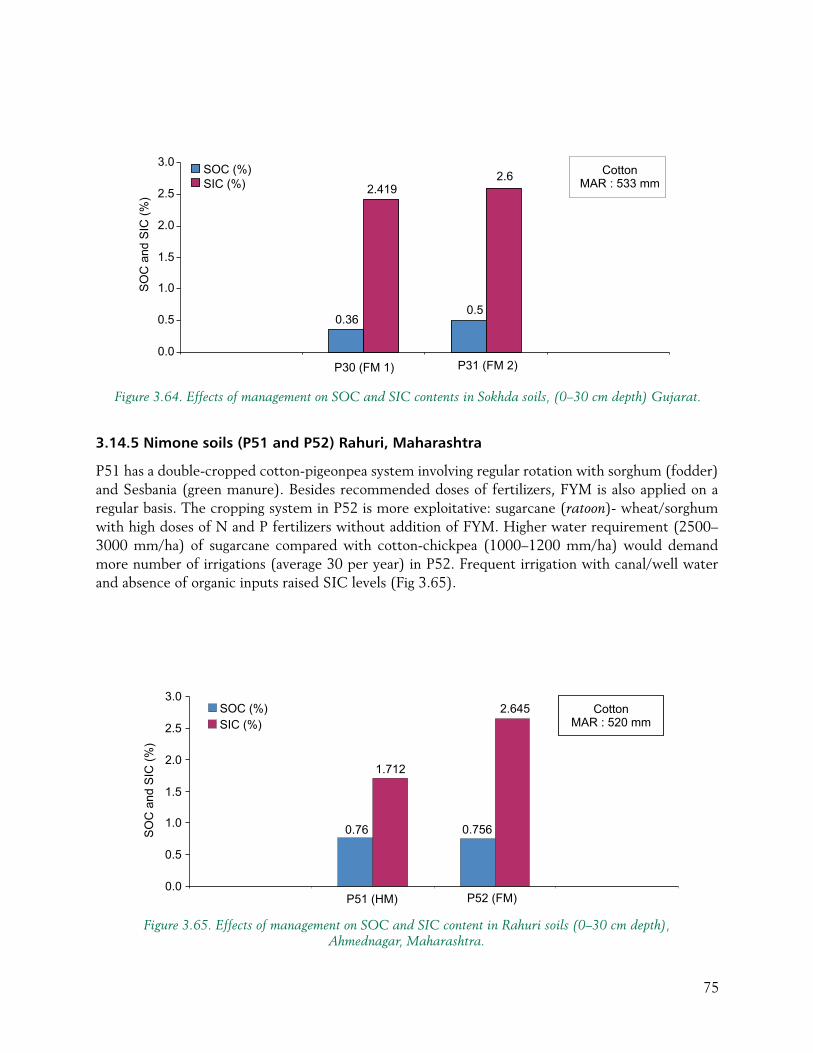
75
3.14.5 Nimone soils (P51 and P52) Rahuri, Maharashtra
P51 has a double-cropped cotton-pigeonpea system involving regular rotation with sorghum (fodder) and Sesbania (green manure). Besides recommended doses of fertilizers, FYM is also applied on a regular basis. The cropping system in P52 is more exploitative: sugarcane (ratoon)- wheat/sorghum with high doses of N and P fertilizers without addition of FYM. Higher water requirement (2500–3000 mm/ha) of sugarcane compared with cotton-chickpea (1000–1200 mm/ha) would demand more number of irrigations (average 30 per year) in P52. Frequent irrigation with canal/well water and absence of organic inputs raised SIC levels (Fig 3.65).
Figure 3.64. Effects of management on SOC and SIC contents in Sokhda soils, (0–30 cm depth) Gujarat.
Figure 3.65. Effects of management on SOC and SIC content in Rahuri soils (0–30 cm depth), Ahmednagar, Maharashtra.
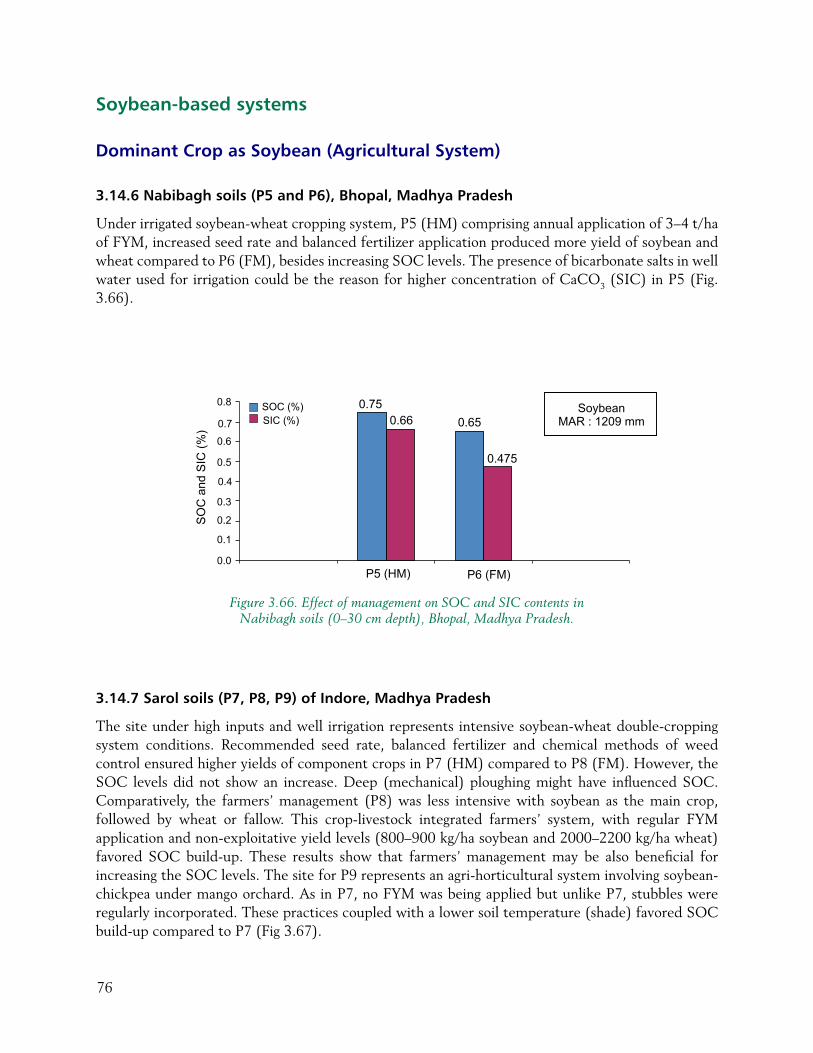
76
Soybean-based systems
Dominant Crop as Soybean (Agricultural System)
3.14.6 Nabibagh soils (P5 and P6), Bhopal, Madhya Pradesh
Under irrigated soybean-wheat cropping system, P5 (HM) comprising annual application of 3–4 t/ha of FYM, increased seed rate and balanced fertilizer application produced more yield of soybean and wheat compared to P6 (FM), besides increasing SOC levels. The presence of bicarbonate salts in well water used for irrigation could be the reason for higher concentration of CaCO3 (SIC) in P5 (Fig. 3.66).
Figure 3.66. Effect of management on SOC and SIC contents in Nabibagh soils (0–30 cm depth), Bhopal, Madhya Pradesh.
3.14.7 Sarol soils (P7, P8, P9) of Indore, Madhya Pradesh
The site under high inputs and well irrigation represents intensive soybean-wheat double-cropping system conditions. Recommended seed rate, balanced fertilizer and chemical methods of weed control ensured higher yields of component crops in P7 (HM) compared to P8 (FM). However, the SOC levels did not show an increase. Deep (mechanical) ploughing might have influenced SOC. Comparatively, the farmers’ management (P8) was less intensive with soybean as the main crop, followed by wheat or fallow. This crop-livestock integrated farmers’ system, with regular FYM application and non-exploitative yield levels (800–900 kg/ha soybean and 2000–2200 kg/ha wheat) favored SOC build-up. These results show that farmers’ management may be also beneficial for increasing the SOC levels. The site for P9 represents an agri-horticultural system involving soybean-chickpea under mango orchard. As in P7, no FYM was being applied but unlike P7, stubbles were regularly incorporated. These practices coupled with a lower soil temperature (shade) favored SOC build-up compared to P7 (Fig 3.67).
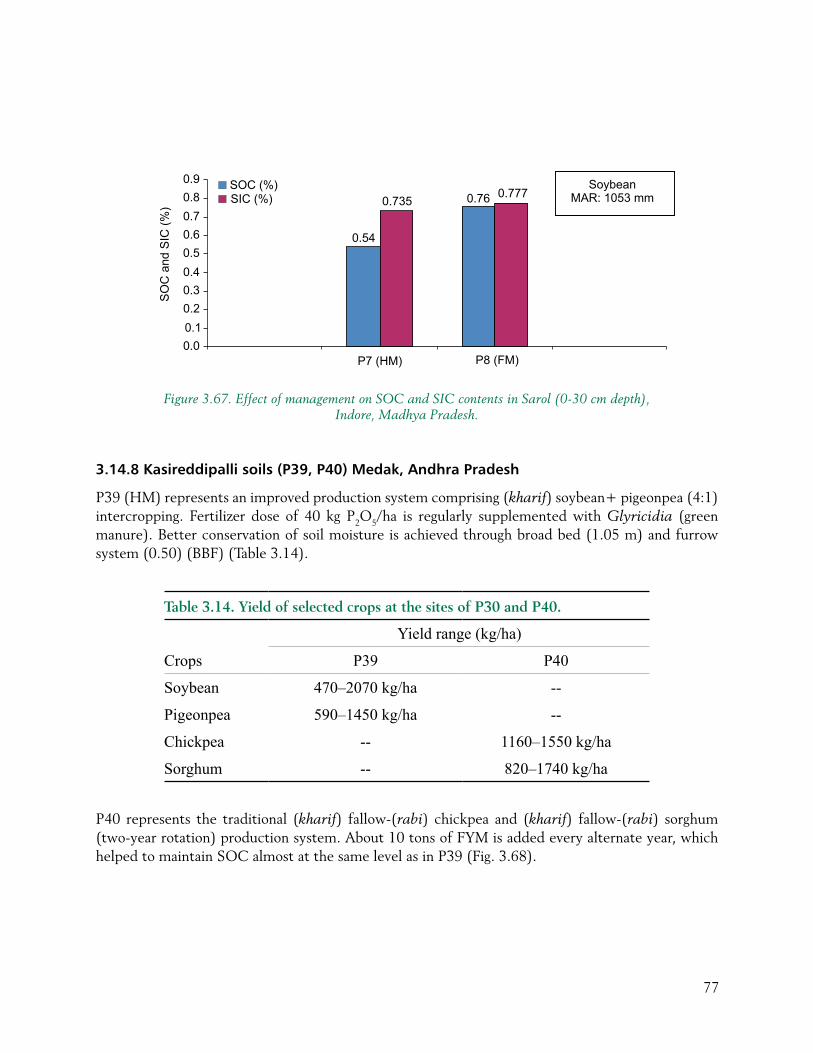
77
3.14.8 Kasireddipalli soils (P39, P40) Medak, Andhra Pradesh
P39 (HM) represents an improved production system comprising (kharif) soybean+ pigeonpea (4:1) intercropping. Fertilizer dose of 40 kg P2O5/ha is regularly supplemented with Glyricidia (green manure). Better conservation of soil moisture is achieved through broad bed (1.05 m) and furrow system (0.50) (BBF) (Table 3.14).
Table 3.14. Yield of selected crops at the sites of P30 and P40.
Crops
Yield range (kg/ha)
P39 P40
Soybean 470–2070 kg/ha --
Pigeonpea 590–1450 kg/ha --
Chickpea -- 1160–1550 kg/ha
Sorghum -- 820–1740 kg/ha
P40 represents the traditional (kharif) fallow-(rabi) chickpea and (kharif) fallow-(rabi) sorghum (two-year rotation) production system. About 10 tons of FYM is added every alternate year, which helped to maintain SOC almost at the same level as in P39 (Fig. 3.68).
Figure 3.67. Effect of management on SOC and SIC contents in Sarol (0-30 cm depth), Indore, Madhya Pradesh.
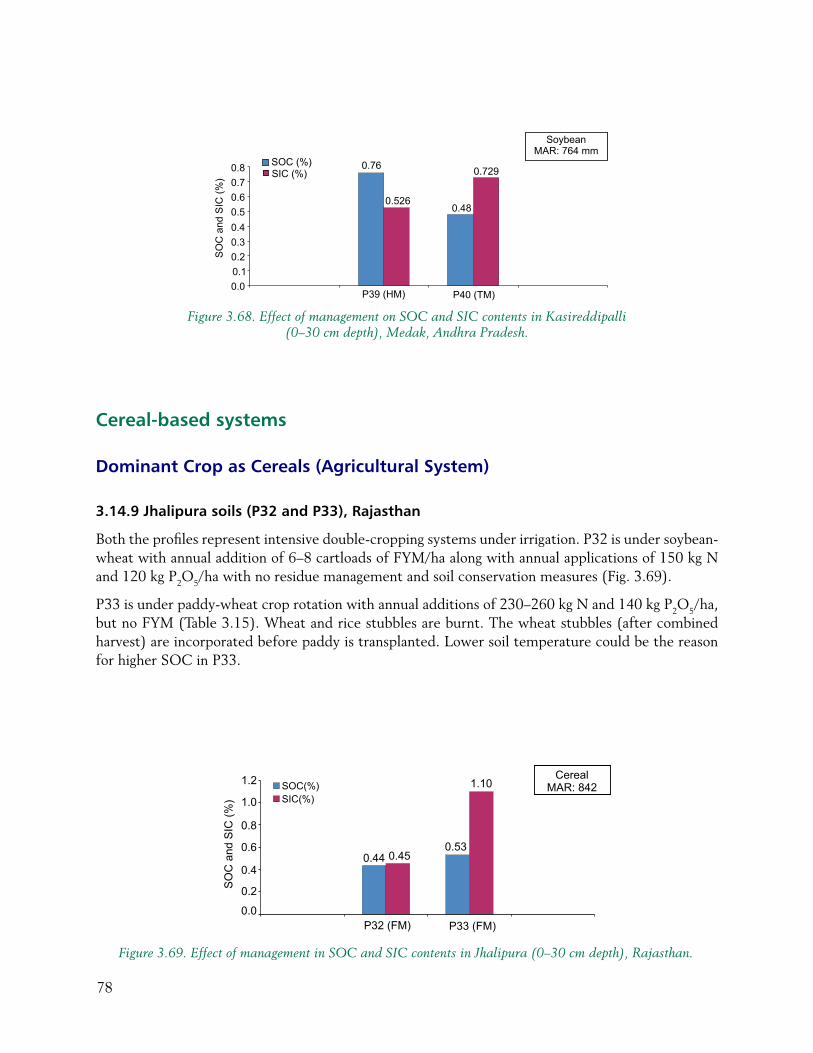
78
Figure 3.68. Effect of management on SOC and SIC contents in Kasireddipalli (0–30 cm depth), Medak, Andhra Pradesh.
Cereal-based systems
Dominant Crop as Cereals (Agricultural System)
3.14.9 Jhalipura soils (P32 and P33), Rajasthan
Both the profiles represent intensive double-cropping systems under irrigation. P32 is under soybean-wheat with annual addition of 6–8 cartloads of FYM/ha along with annual applications of 150 kg N and 120 kg P2O5/ha with no residue management and soil conservation measures (Fig. 3.69).
P33 is under paddy-wheat crop rotation with annual additions of 230–260 kg N and 140 kg P2O5/ha, but no FYM (Table 3.15). Wheat and rice stubbles are burnt. The wheat stubbles (after combined harvest) are incorporated before paddy is transplanted. Lower soil temperature could be the reason for higher SOC in P33.
Figure 3.69. Effect of management in SOC and SIC contents in Jhalipura (0–30 cm depth), Rajasthan.
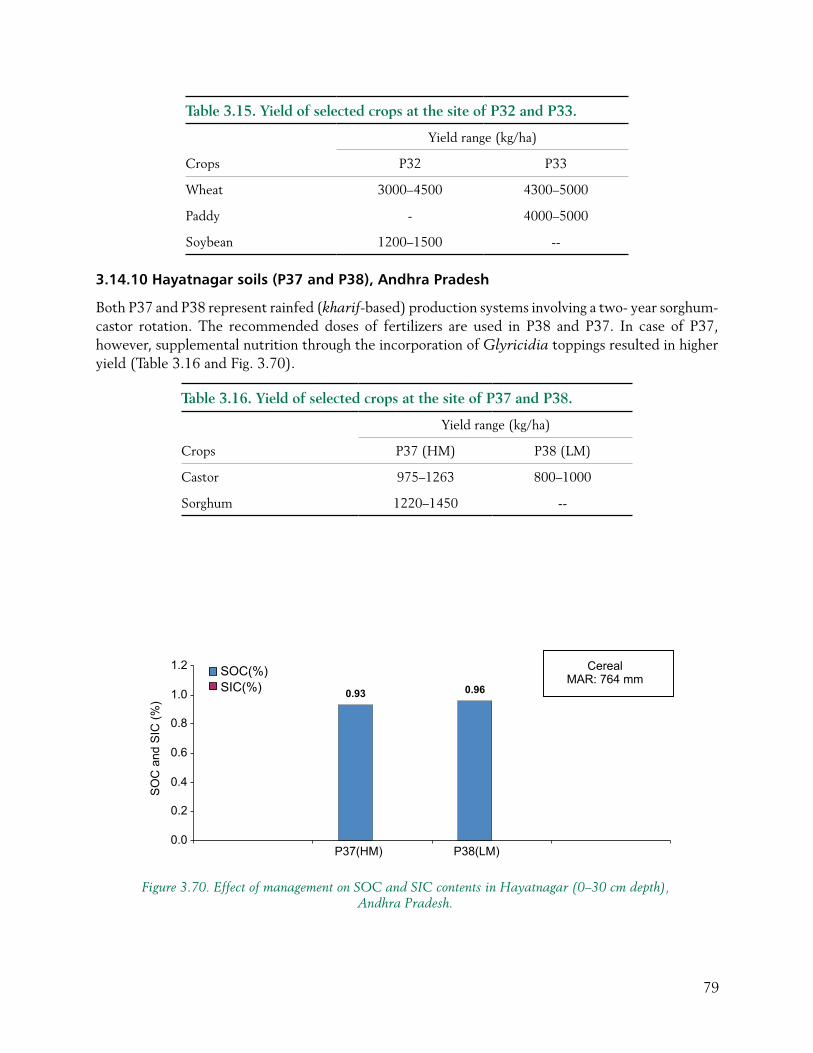
79
Table 3.15. Yield of selected crops at the site of P32 and P33.
Crops
Yield range (kg/ha)
P32 P33
Wheat 3000–4500 4300–5000
Paddy - 4000–5000
Soybean 1200–1500 --
3.14.10 Hayatnagar soils (P37 and P38), Andhra Pradesh
Both P37 and P38 represent rainfed (kharif-based) production systems involving a two- year sorghum-castor rotation. The recommended doses of fertilizers are used in P38 and P37. In case of P37, however, supplemental nutrition through the incorporation of Glyricidia toppings resulted in higher yield (Table 3.16 and Fig. 3.70).
Table 3.16. Yield of selected crops at the site of P37 and P38.
Crops
Yield range (kg/ha)
P37 (HM) P38 (LM)
Castor 975–1263 800–1000
Sorghum 1220–1450 --
Figure 3.70. Effect of management on SOC and SIC contents in Hayatnagar (0–30 cm depth), Andhra Pradesh.
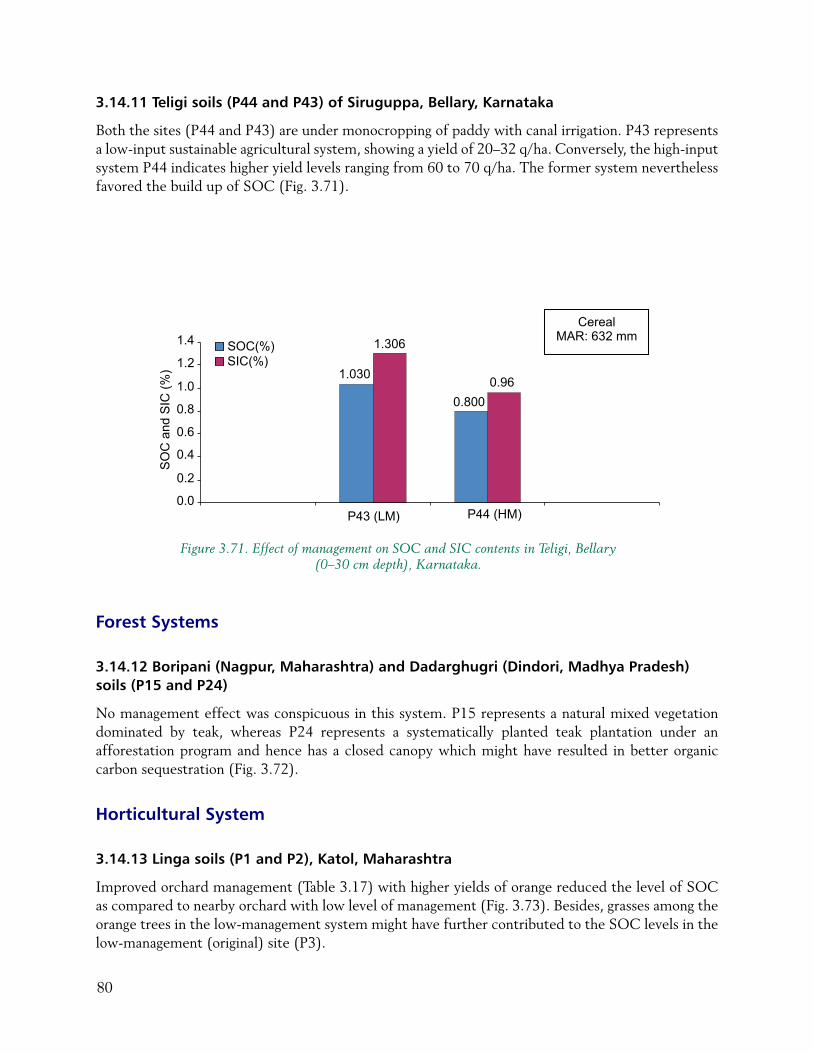
80
Figure 3.71. Effect of management on SOC and SIC contents in Teligi, Bellary (0–30 cm depth), Karnataka.
3.14.11 Teligi soils (P44 and P43) of Siruguppa, Bellary, Karnataka
Both the sites (P44 and P43) are under monocropping of paddy with canal irrigation. P43 represents a low-input sustainable agricultural system, showing a yield of 20–32 q/ha. Conversely, the high-input system P44 indicates higher yield levels ranging from 60 to 70 q/ha. The former system nevertheless favored the build up of SOC (Fig. 3.71).
Forest Systems
3.14.12 Boripani (Nagpur, Maharashtra) and Dadarghugri (Dindori, Madhya Pradesh) soils (P15 and P24)
No management effect was conspicuous in this system. P15 represents a natural mixed vegetation dominated by teak, whereas P24 represents a systematically planted teak plantation under an afforestation program and hence has a closed canopy which might have resulted in better organic carbon sequestration (Fig. 3.72).
Horticultural System
3.14.13 Linga soils (P1 and P2), Katol, Maharashtra
Improved orchard management (Table 3.17) with higher yields of orange reduced the level of SOC as compared to nearby orchard with low level of management (Fig. 3.73). Besides, grasses among the orange trees in the low-management system might have further contributed to the SOC levels in the low-management (original) site (P3).
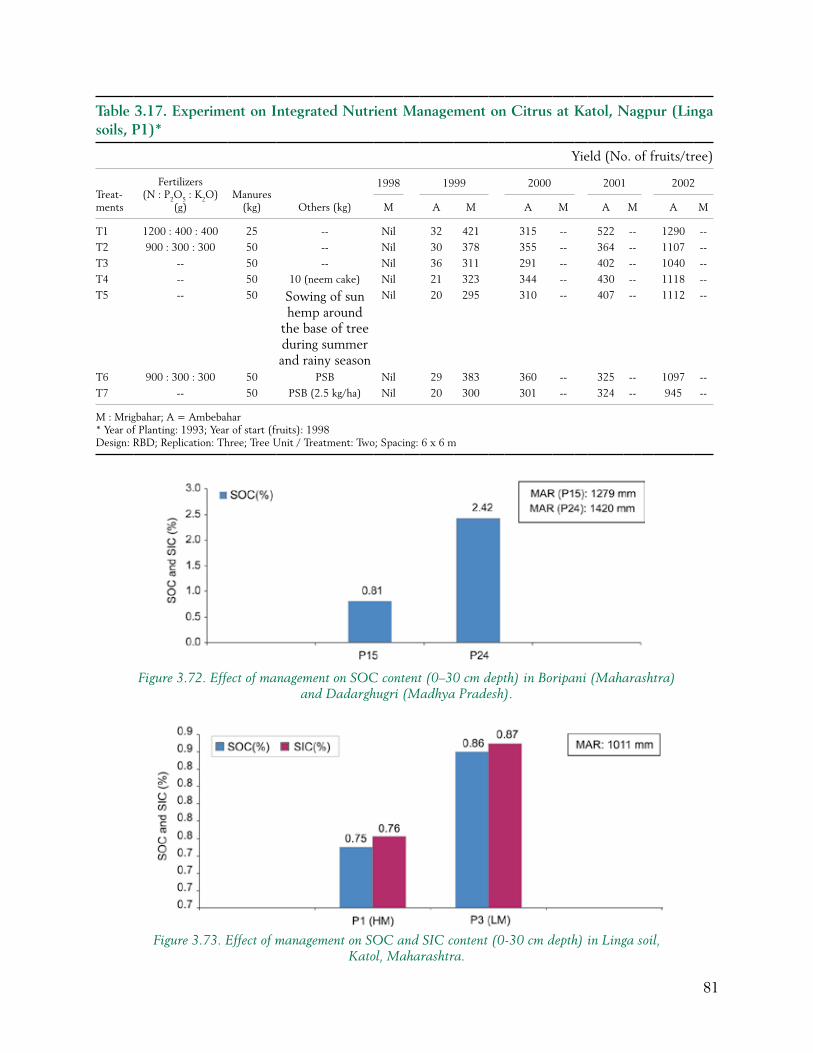
81
Figure 3.73. Effect of management on SOC and SIC content (0-30 cm depth) in Linga soil, Katol, Maharashtra.
Figure 3.72. Effect of management on SOC content (0–30 cm depth) in Boripani (Maharashtra) and Dadarghugri (Madhya Pradesh).
Table 3.17. Experiment on Integrated Nutrient Management on Citrus at Katol, Nagpur (Linga soils, P1)*
Yield (No. of fruits/tree)
Treat-ments
Fertilizers (N : P2O5 : K2O)
(g)Manures
(kg) Others (kg)
1998 1999 2000 2001 2002
M A M A M A M A M
T1 1200 : 400 : 400 25 -- Nil 32 421 315 -- 522 -- 1290 --
T2 900 : 300 : 300 50 -- Nil 30 378 355 -- 364 -- 1107 --
T3 -- 50 -- Nil 36 311 291 -- 402 -- 1040 --
T4 -- 50 10 (neem cake) Nil 21 323 344 -- 430 -- 1118 --
T5 -- 50 Sowing of sun hemp around
the base of tree during summer and rainy season
Nil 20 295 310 -- 407 -- 1112 --
T6 900 : 300 : 300 50 PSB Nil 29 383 360 -- 325 -- 1097 --
T7 -- 50 PSB (2.5 kg/ha) Nil 20 300 301 -- 324 -- 945 --
M:Mrigbahar;A=Ambebahar* Year of Planting: 1993; Year of start (fruits): 1998 Design: RBD; Replication: Three; Tree Unit / Treatment: Two; Spacing: 6 x 6 m
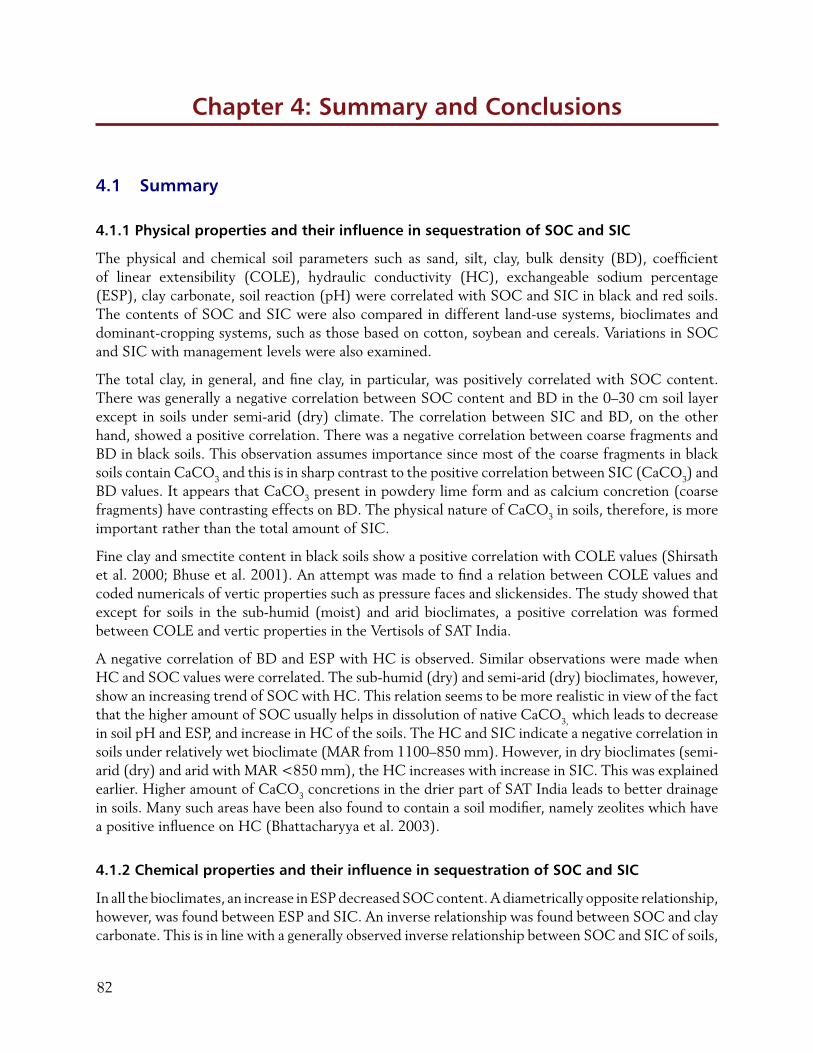
82
Chapter 4: Summary and Conclusions
4.1 Summary
4.1.1 Physical properties and their influence in sequestration of SOC and SIC
The physical and chemical soil parameters such as sand, silt, clay, bulk density (BD), coefficient of linear extensibility (COLE), hydraulic conductivity (HC), exchangeable sodium percentage (ESP), clay carbonate, soil reaction (pH) were correlated with SOC and SIC in black and red soils. The contents of SOC and SIC were also compared in different land-use systems, bioclimates and dominant-cropping systems, such as those based on cotton, soybean and cereals. Variations in SOC and SIC with management levels were also examined.
The total clay, in general, and fine clay, in particular, was positively correlated with SOC content. There was generally a negative correlation between SOC content and BD in the 0–30 cm soil layer except in soils under semi-arid (dry) climate. The correlation between SIC and BD, on the other hand, showed a positive correlation. There was a negative correlation between coarse fragments and BD in black soils. This observation assumes importance since most of the coarse fragments in black soils contain CaCO3 and this is in sharp contrast to the positive correlation between SIC (CaCO3) and BD values. It appears that CaCO3 present in powdery lime form and as calcium concretion (coarse fragments) have contrasting effects on BD. The physical nature of CaCO3 in soils, therefore, is more important rather than the total amount of SIC.
Fine clay and smectite content in black soils show a positive correlation with COLE values (Shirsath et al. 2000; Bhuse et al. 2001). An attempt was made to find a relation between COLE values and coded numericals of vertic properties such as pressure faces and slickensides. The study showed that except for soils in the sub-humid (moist) and arid bioclimates, a positive correlation was formed between COLE and vertic properties in the Vertisols of SAT India.
A negative correlation of BD and ESP with HC is observed. Similar observations were made when HC and SOC values were correlated. The sub-humid (dry) and semi-arid (dry) bioclimates, however, show an increasing trend of SOC with HC. This relation seems to be more realistic in view of the fact that the higher amount of SOC usually helps in dissolution of native CaCO3, which leads to decrease in soil pH and ESP, and increase in HC of the soils. The HC and SIC indicate a negative correlation in soils under relatively wet bioclimate (MAR from 1100–850 mm). However, in dry bioclimates (semi-arid (dry) and arid with MAR <850 mm), the HC increases with increase in SIC. This was explained earlier. Higher amount of CaCO3 concretions in the drier part of SAT India leads to better drainage in soils. Many such areas have been also found to contain a soil modifier, namely zeolites which have a positive influence on HC (Bhattacharyya et al. 2003).
4.1.2 Chemical properties and their influence in sequestration of SOC and SIC
In all the bioclimates, an increase in ESP decreased SOC content. A diametrically opposite relationship, however, was found between ESP and SIC. An inverse relationship was found between SOC and clay carbonate. This is in line with a generally observed inverse relationship between SOC and SIC of soils,
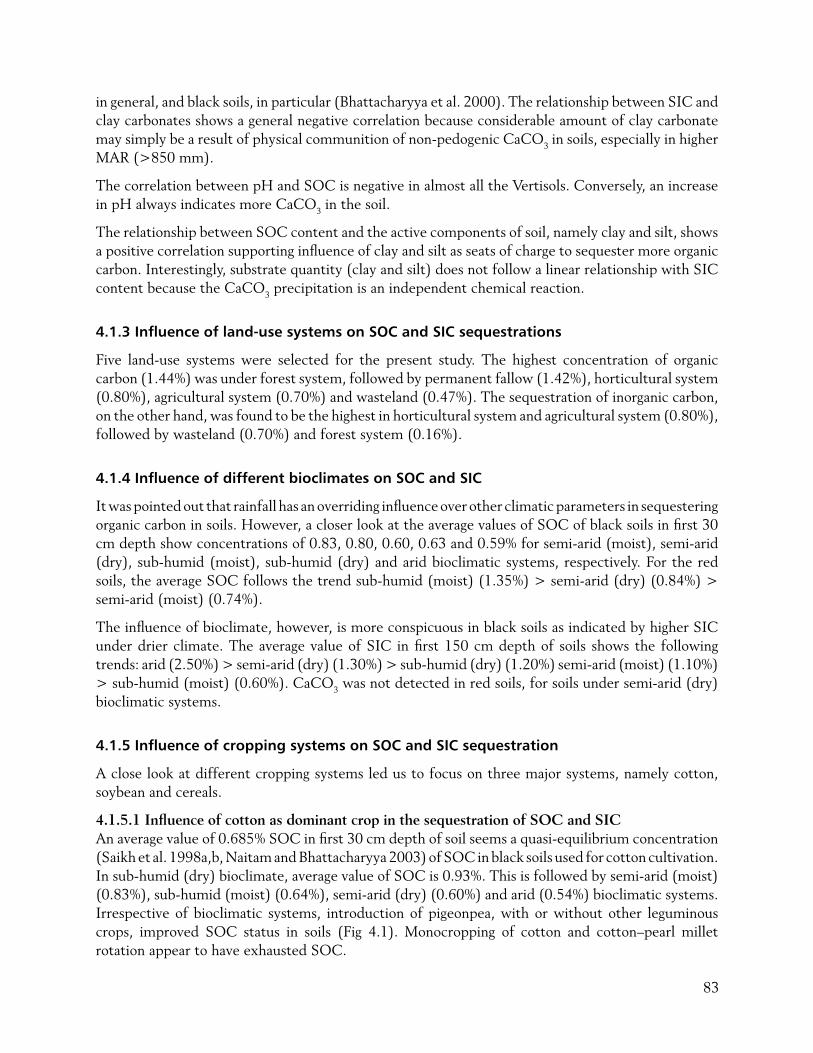
83
in general, and black soils, in particular (Bhattacharyya et al. 2000). The relationship between SIC and clay carbonates shows a general negative correlation because considerable amount of clay carbonate may simply be a result of physical communition of non-pedogenic CaCO3 in soils, especially in higher MAR (>850 mm).
The correlation between pH and SOC is negative in almost all the Vertisols. Conversely, an increase in pH always indicates more CaCO3 in the soil.
The relationship between SOC content and the active components of soil, namely clay and silt, shows a positive correlation supporting influence of clay and silt as seats of charge to sequester more organic carbon. Interestingly, substrate quantity (clay and silt) does not follow a linear relationship with SIC content because the CaCO3 precipitation is an independent chemical reaction.
4.1.3 Influence of land-use systems on SOC and SIC sequestrations
Five land-use systems were selected for the present study. The highest concentration of organic carbon (1.44%) was under forest system, followed by permanent fallow (1.42%), horticultural system (0.80%), agricultural system (0.70%) and wasteland (0.47%). The sequestration of inorganic carbon, on the other hand, was found to be the highest in horticultural system and agricultural system (0.80%), followed by wasteland (0.70%) and forest system (0.16%).
4.1.4 Influence of different bioclimates on SOC and SIC
It was pointed out that rainfall has an overriding influence over other climatic parameters in sequestering organic carbon in soils. However, a closer look at the average values of SOC of black soils in first 30 cm depth show concentrations of 0.83, 0.80, 0.60, 0.63 and 0.59% for semi-arid (moist), semi-arid (dry), sub-humid (moist), sub-humid (dry) and arid bioclimatic systems, respectively. For the red soils, the average SOC follows the trend sub-humid (moist) (1.35%) > semi-arid (dry) (0.84%) > semi-arid (moist) (0.74%).
The influence of bioclimate, however, is more conspicuous in black soils as indicated by higher SIC under drier climate. The average value of SIC in first 150 cm depth of soils shows the following trends: arid (2.50%) > semi-arid (dry) (1.30%) > sub-humid (dry) (1.20%) semi-arid (moist) (1.10%) > sub-humid (moist) (0.60%). CaCO3 was not detected in red soils, for soils under semi-arid (dry) bioclimatic systems.
4.1.5 Influence of cropping systems on SOC and SIC sequestration
A close look at different cropping systems led us to focus on three major systems, namely cotton, soybean and cereals.
4.1.5.1 Influence of cotton as dominant crop in the sequestration of SOC and SICAn average value of 0.685% SOC in first 30 cm depth of soil seems a quasi-equilibrium concentration (Saikh et al. 1998a,b, Naitam and Bhattacharyya 2003) of SOC in black soils used for cotton cultivation. In sub-humid (dry) bioclimate, average value of SOC is 0.93%. This is followed by semi-arid (moist) (0.83%), sub-humid (moist) (0.64%), semi-arid (dry) (0.60%) and arid (0.54%) bioclimatic systems. Irrespective of bioclimatic systems, introduction of pigeonpea, with or without other leguminous crops, improved SOC status in soils (Fig 4.1). Monocropping of cotton and cotton–pearl millet rotation appear to have exhausted SOC.
84
Figure 4.2 shows the distribution of SIC in first 30 cm depth of soil. The average value of SIC in cotton system is 1.53% with the trend in different bioclimatic systems as follows: arid (2.24%) > semi-arid (dry) (1.37%) > semi-arid (moist) (0.88%) > sub-humid (dry) (1.84%) > sub-humid (moist) (0.64%). A closer look at the SIC values in the wetter bioclimatic system shows that pigeonpea in the crop rotation has a positive influence in reducing the level of SIC.
4.1.5.2. Influence of soybean as dominant cropping system on SOC and SIC sequestration Soybean registers marginally high average quasi-equilibrium value of SOC in black soils. When SOC content values were compared in different bioclimatic systems, the following trend was observed: sub-humid (dry), semi-arid (moist) (0.75%) > sub-humid (moist) (0.68%) > semi-arid (dry) (0.60%).
Unlike under sole cotton system (Fig. 4.1), which stabilizes SOC concentration at 0.64%, monocropping with soybean stabilizes SOC at much higher value of 0.90% (at the site of P50). It is worthwhile to mention that the site of P50 has recently been deforested and is being cultivated for soybean (Fig. 4.3). The data show that soybean-wheat crop rotation stabilizes SOC concentration between 0.54 to 0.76% (Fig. 4.4).
Interestingly, SIC values in first 30 cm depth of soils average 0.66% (Fig. 4.6). The general trend in different bioclimates is as follows: semi-arid (moist) (1.02%) > sub-humid (dry) (0.73%) > sub-humid (moist) (0.54%) > semi-arid (dry) (0.49%).
4.1.5.3 Influence of cereals cropping systems on SOC and SIC sequestratingOn an average, cereals dominated by paddy, wheat and sorghum stabilize SOC at 0.789% in the first 30 cm depth of soil. Cereals represent three bioclimatic systems, namely, semi-arid (moist), sub-humid (moist) and semi-arid (dry). The SOC values in these three bioclimatic systems are 0.88, 0.53 and 0.52%, respectively.
On the basis of dominant crop among cereals, following observations are made:
a) Paddy-wheat cropping system: Normally this system is followed in sub-humid (moist) and semi-arid (dry) bioclimatic systems. The SOC values stabilize at 0.44–.53%.
b) Sorghum-pigeonpea system: This system under semi-arid (moist) bioclimate registers a value of 0.88% SOC. Similarly, sorghum-pigeonpea system in semi-arid (dry) bioclimate registers a much lower value of SOC (0.30%) at the site of P35 (Jajapur). This may be due to low management levels. The land-use data collected from the field (Bhatumbra series, Bidar, Karnataka) shows that these areas are under intensive agriculture and canal irrigated, which might have resulted in higher SOC.
c) Paddy-Paddy: Paddy-paddy system stabilizes SOC values at 0.80 to 0.88% (Fig 4.5) Among cereals, paddy-paddy system seems to be more beneficial for higher amount of SOC sequestration. In general, the level of SIC in cereals is less (0.29%) than in cotton (1.53%) and soybean (0.66%) systems (Fig 4.6). Unlike SOC, the distribution of SIC does not follow any definite trend either in terms of bioclimatic systems or in different cropping systems.
4.1.6 Influence of management on SOC and SIC sequestration
4.1.6.1 Influence of type of management on sequestration of SOC and SIC with cotton as domi-nant cropping systemIn contrast to the generally held view that black cotton soils are low in SOC, our study indicates that black cotton soils in semi-arid bioclimatic system stabilize in terms of SOC between 0.60 and 0.92%.
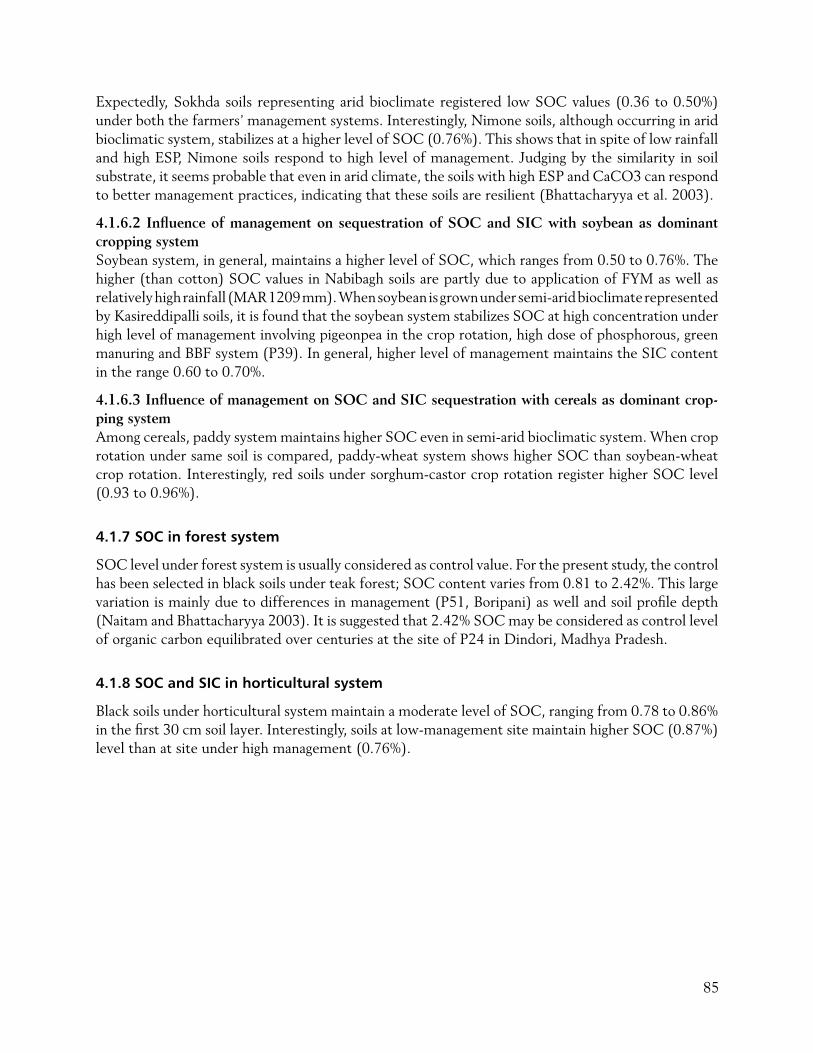
85
Expectedly, Sokhda soils representing arid bioclimate registered low SOC values (0.36 to 0.50%) under both the farmers’ management systems. Interestingly, Nimone soils, although occurring in arid bioclimatic system, stabilizes at a higher level of SOC (0.76%). This shows that in spite of low rainfall and high ESP, Nimone soils respond to high level of management. Judging by the similarity in soil substrate, it seems probable that even in arid climate, the soils with high ESP and CaCO3 can respond to better management practices, indicating that these soils are resilient (Bhattacharyya et al. 2003).
4.1.6.2 Influence of management on sequestration of SOC and SIC with soybean as dominant cropping systemSoybean system, in general, maintains a higher level of SOC, which ranges from 0.50 to 0.76%. The higher (than cotton) SOC values in Nabibagh soils are partly due to application of FYM as well as relatively high rainfall (MAR 1209 mm). When soybean is grown under semi-arid bioclimate represented by Kasireddipalli soils, it is found that the soybean system stabilizes SOC at high concentration under high level of management involving pigeonpea in the crop rotation, high dose of phosphorous, green manuring and BBF system (P39). In general, higher level of management maintains the SIC content in the range 0.60 to 0.70%.
4.1.6.3 Influence of management on SOC and SIC sequestration with cereals as dominant crop-ping systemAmong cereals, paddy system maintains higher SOC even in semi-arid bioclimatic system. When crop rotation under same soil is compared, paddy-wheat system shows higher SOC than soybean-wheat crop rotation. Interestingly, red soils under sorghum-castor crop rotation register higher SOC level (0.93 to 0.96%).
4.1.7 SOC in forest system
SOC level under forest system is usually considered as control value. For the present study, the control has been selected in black soils under teak forest; SOC content varies from 0.81 to 2.42%. This large variation is mainly due to differences in management (P51, Boripani) as well and soil profile depth (Naitam and Bhattacharyya 2003). It is suggested that 2.42% SOC may be considered as control level of organic carbon equilibrated over centuries at the site of P24 in Dindori, Madhya Pradesh.
4.1.8 SOC and SIC in horticultural system
Black soils under horticultural system maintain a moderate level of SOC, ranging from 0.78 to 0.86% in the first 30 cm soil layer. Interestingly, soils at low-management site maintain higher SOC (0.87%) level than at site under high management (0.76%).
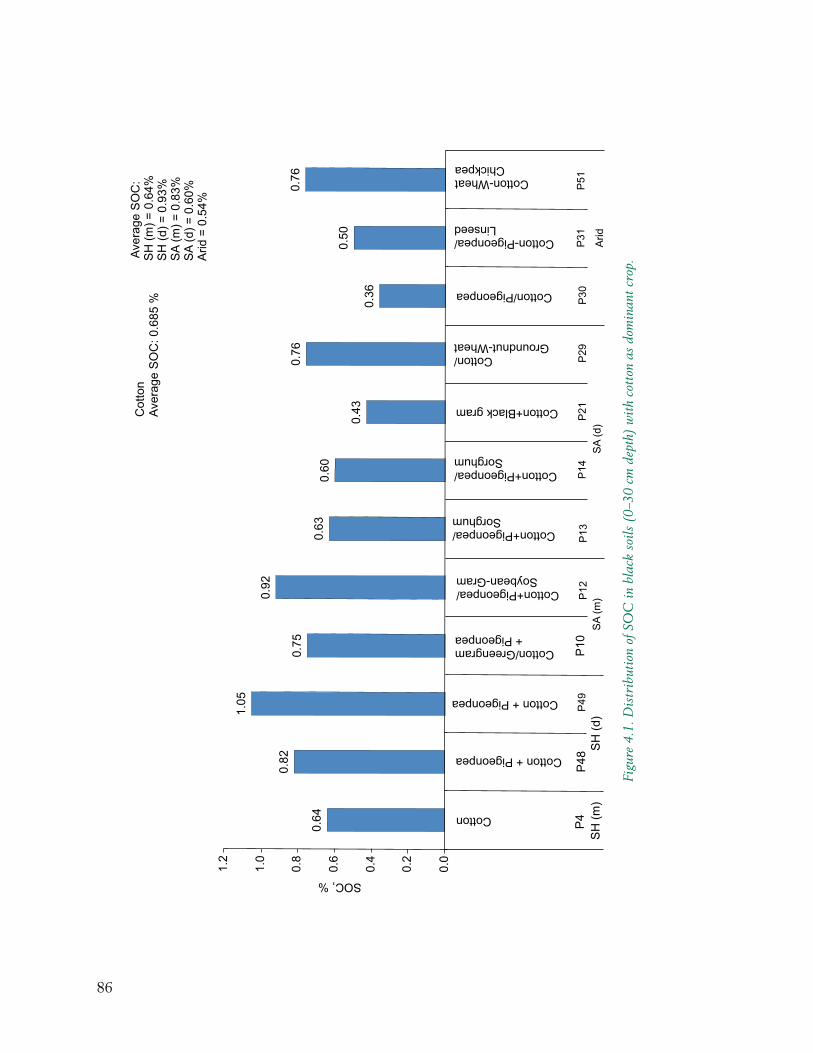
86
Figu
re 4
.1. D
istr
ibut
ion
of S
OC
in b
lack
soi
ls (
0–30
cm
dep
th)
wit
h co
tton
as
dom
inan
t cro
p.
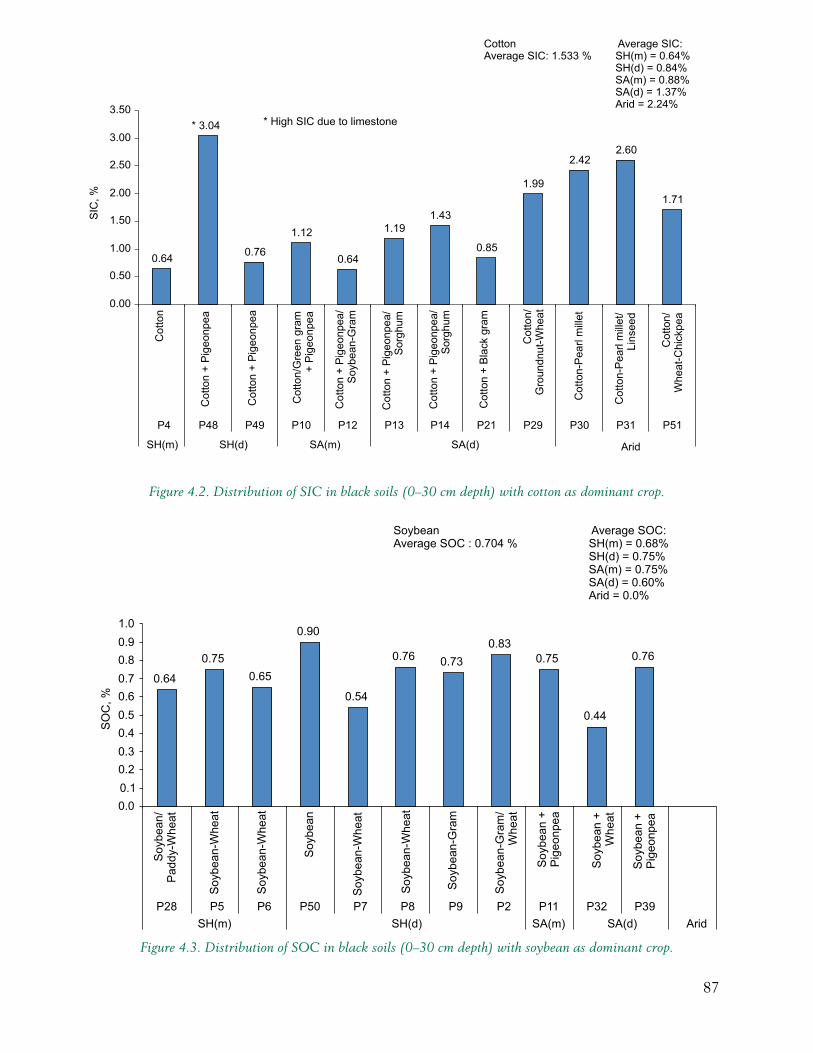
87
Figure 4.2. Distribution of SIC in black soils (0–30 cm depth) with cotton as dominant crop.
Figure 4.3. Distribution of SOC in black soils (0–30 cm depth) with soybean as dominant crop.
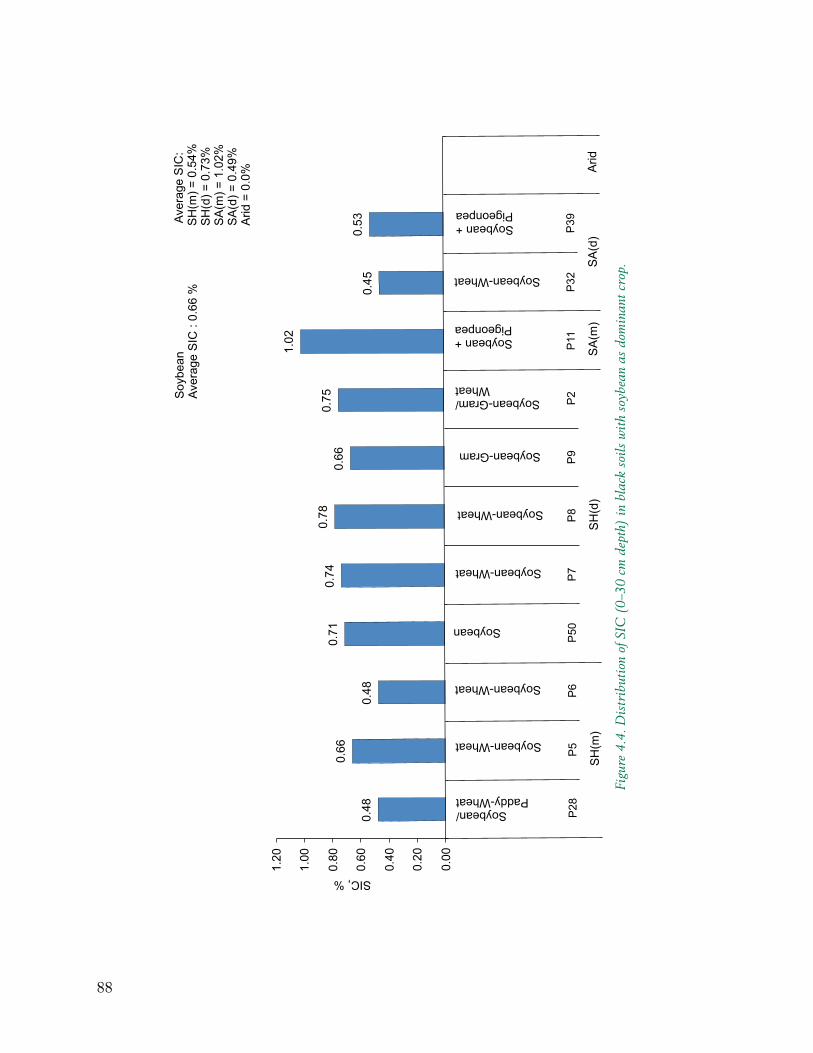
88
Figu
re 4
.4. D
istr
ibut
ion
of S
IC (
0–30
cm
dep
th)
in b
lack
soi
ls w
ith
soyb
ean
as d
omin
ant c
rop.
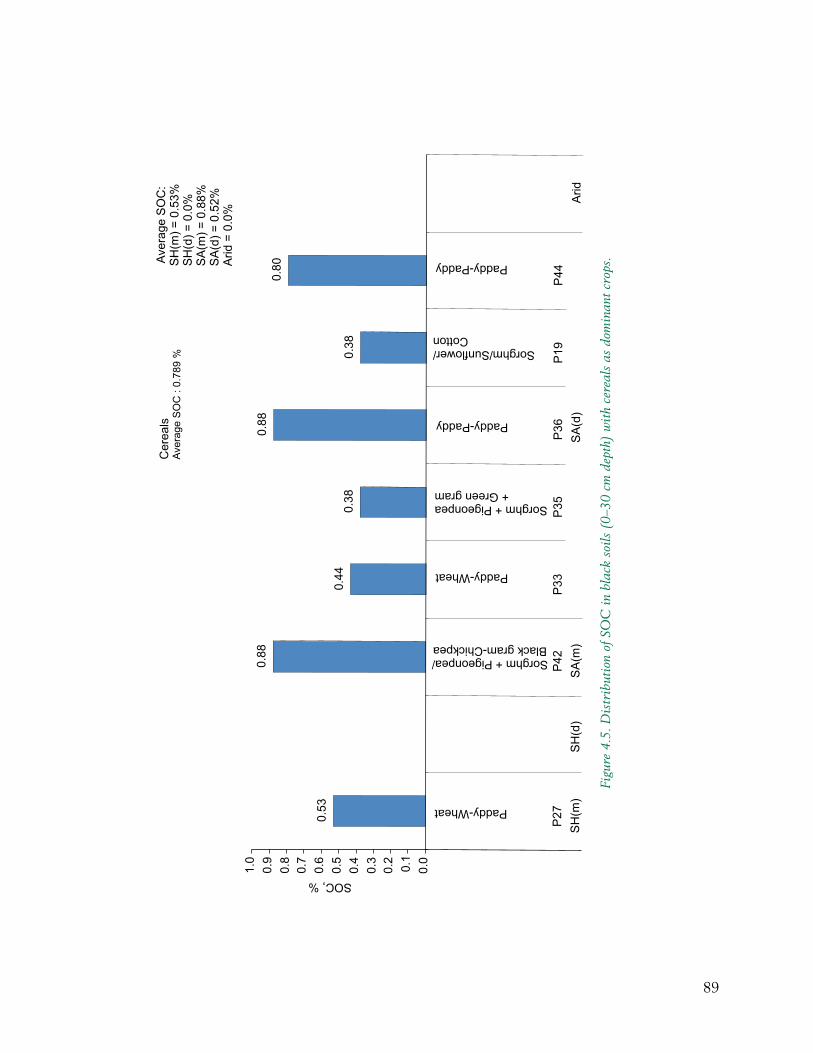
89
Figu
re 4
.5. D
istr
ibut
ion
of S
OC
in b
lack
soi
ls (
0–30
cm
dep
th)
wit
h ce
real
s as
dom
inan
t cro
ps.
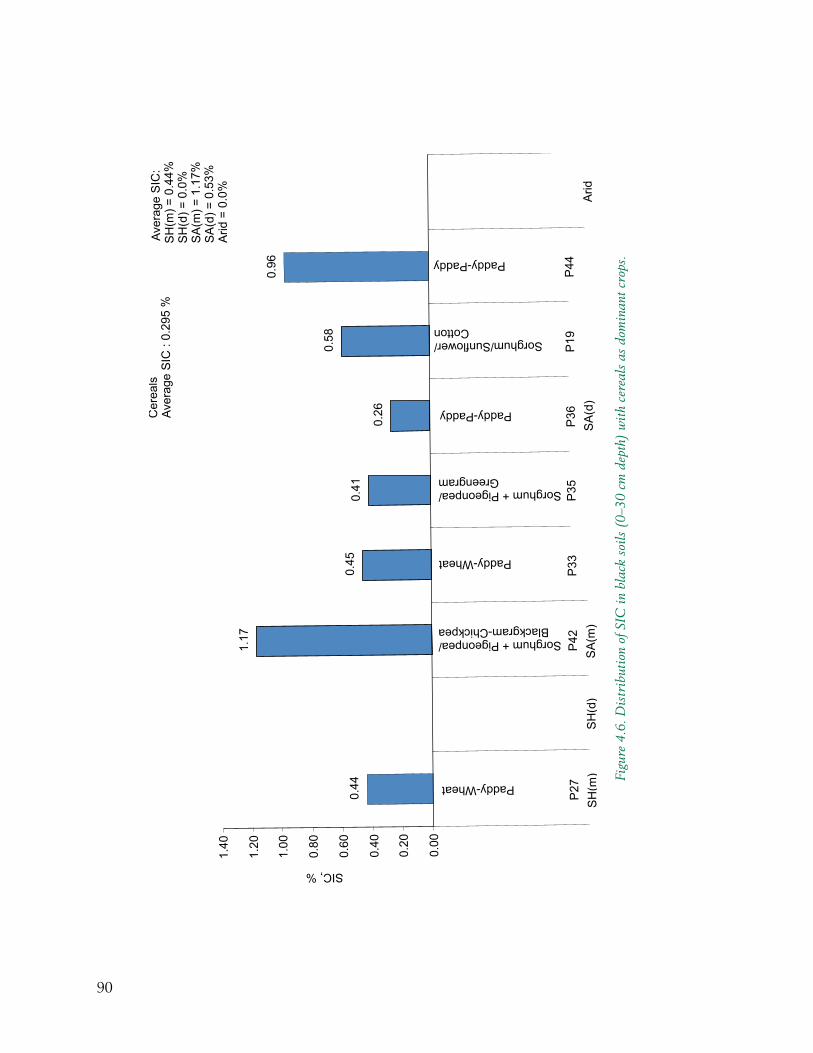
90
Figu
re 4
.6. D
istr
ibut
ion
of S
IC in
bla
ck s
oils
(0–
30 c
m d
epth
) w
ith
cere
als
as d
omin
ant c
rops
.
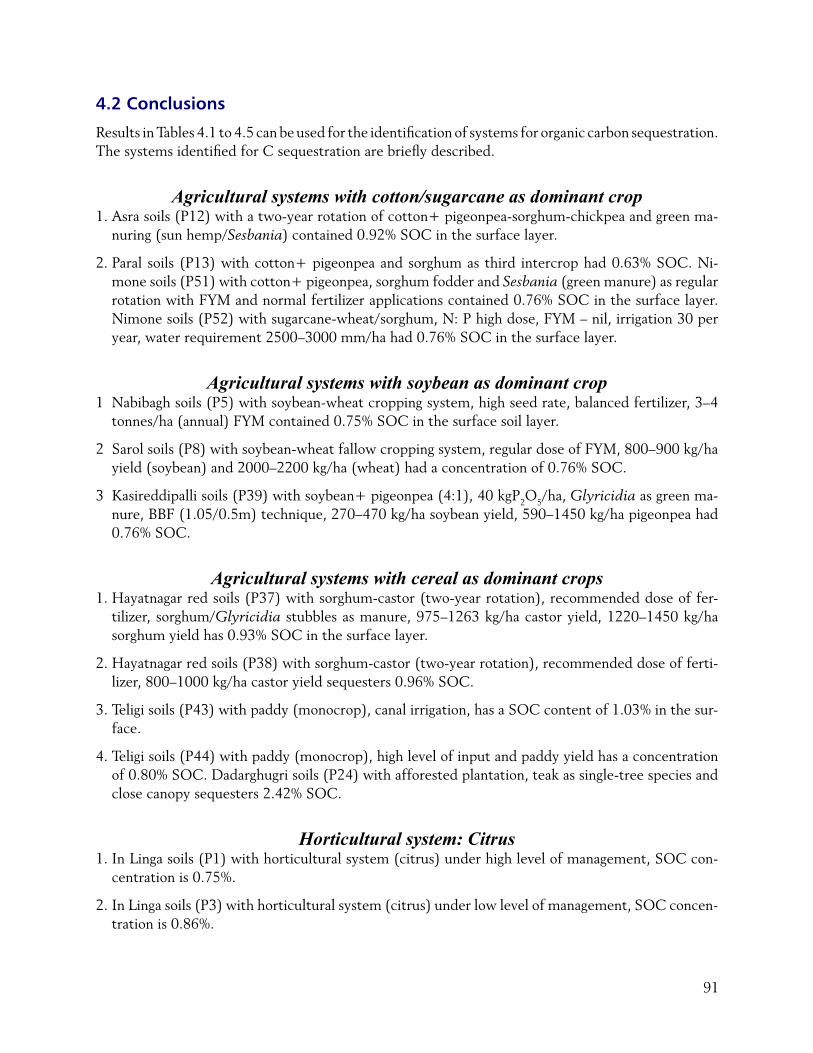
91
4.2 Conclusions
Results in Tables 4.1 to 4.5 can be used for the identification of systems for organic carbon sequestration. The systems identified for C sequestration are briefly described.
Agricultural systems with cotton/sugarcane as dominant crop1. Asra soils (P12) with a two-year rotation of cotton+ pigeonpea-sorghum-chickpea and green ma-
nuring (sun hemp/Sesbania) contained 0.92% SOC in the surface layer.
2. Paral soils (P13) with cotton+ pigeonpea and sorghum as third intercrop had 0.63% SOC. Ni-mone soils (P51) with cotton+ pigeonpea, sorghum fodder and Sesbania (green manure) as regular rotation with FYM and normal fertilizer applications contained 0.76% SOC in the surface layer. Nimone soils (P52) with sugarcane-wheat/sorghum, N: P high dose, FYM – nil, irrigation 30 per year, water requirement 2500–3000 mm/ha had 0.76% SOC in the surface layer.
Agricultural systems with soybean as dominant crop1 Nabibagh soils (P5) with soybean-wheat cropping system, high seed rate, balanced fertilizer, 3–4
tonnes/ha (annual) FYM contained 0.75% SOC in the surface soil layer.
2 Sarol soils (P8) with soybean-wheat fallow cropping system, regular dose of FYM, 800–900 kg/ha yield (soybean) and 2000–2200 kg/ha (wheat) had a concentration of 0.76% SOC.
3 Kasireddipalli soils (P39) with soybean+ pigeonpea (4:1), 40 kgP2O5/ha, Glyricidia as green ma-nure, BBF (1.05/0.5m) technique, 270–470 kg/ha soybean yield, 590–1450 kg/ha pigeonpea had 0.76% SOC.
Agricultural systems with cereal as dominant crops1. Hayatnagar red soils (P37) with sorghum-castor (two-year rotation), recommended dose of fer-
tilizer, sorghum/Glyricidia stubbles as manure, 975–1263 kg/ha castor yield, 1220–1450 kg/ha sorghum yield has 0.93% SOC in the surface layer.
2. Hayatnagar red soils (P38) with sorghum-castor (two-year rotation), recommended dose of ferti-lizer, 800–1000 kg/ha castor yield sequesters 0.96% SOC.
3. Teligi soils (P43) with paddy (monocrop), canal irrigation, has a SOC content of 1.03% in the sur-face.
4. Teligi soils (P44) with paddy (monocrop), high level of input and paddy yield has a concentration of 0.80% SOC. Dadarghugri soils (P24) with afforested plantation, teak as single-tree species and close canopy sequesters 2.42% SOC.
Horticultural system: Citrus1. In Linga soils (P1) with horticultural system (citrus) under high level of management, SOC con-
centration is 0.75%.
2. In Linga soils (P3) with horticultural system (citrus) under low level of management, SOC concen-tration is 0.86%.
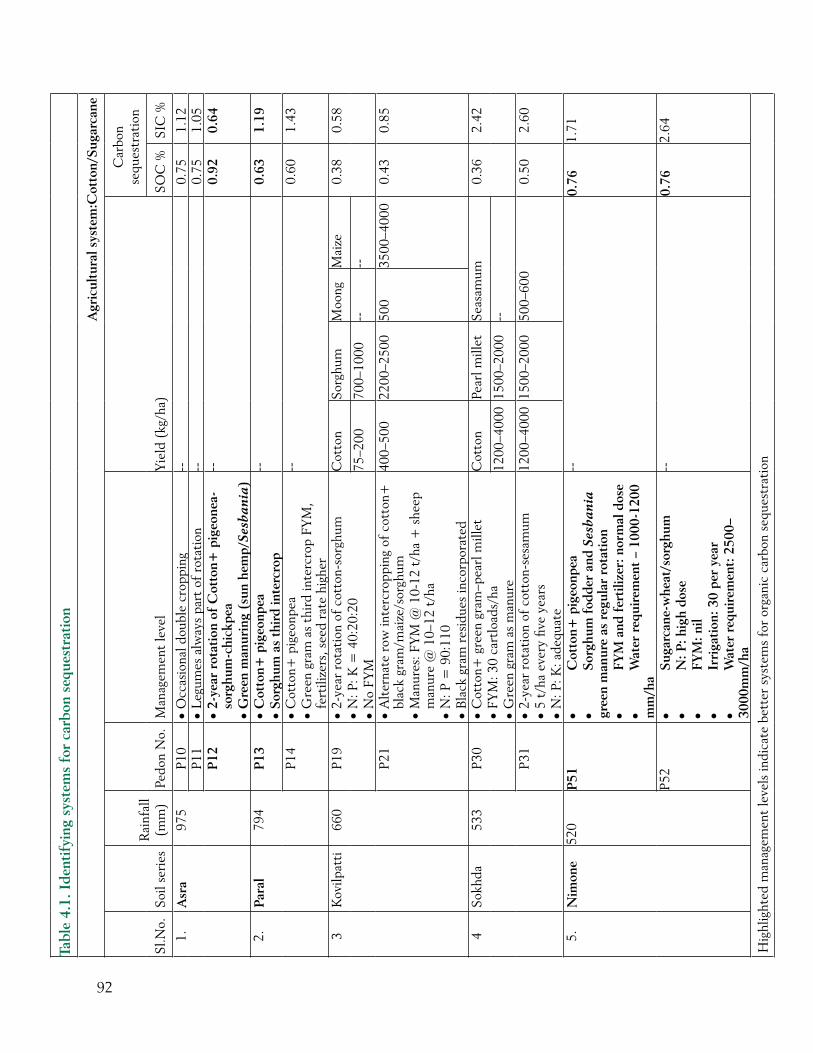
92
Tabl
e 4.
1. I
dent
ifyi
ng s
yste
ms
for
carb
on s
eque
stra
tion
Agr
icul
tura
l sys
tem
:Cot
ton/
Suga
rcan
e
Sl.N
o.So
il se
ries
Rai
nfal
l (m
m)
Pedo
n N
o.M
anag
emen
t le
vel
Yie
ld (
kg/h
a)
Car
bon
sequ
estr
atio
n
SOC
%SI
C %
1.A
sra
975
P10
• O
ccas
iona
l dou
ble
crop
ping
--
0.75
1.12
P11
• L
egum
es a
lway
s pa
rt o
f ro
tati
on--
0.75
1.05
P12
• 2-
year
rot
atio
n of
Cot
ton+
pig
eone
a-so
rghu
m-c
hick
pea
• G
reen
man
urin
g (s
un h
emp/
Sesb
ania
)
--0.
920.
64
2.Pa
ral
794
P13
• C
otto
n+ p
igeo
npea
• So
rghu
m a
s th
ird
inte
rcro
p--
0.63
1.19
P14
• C
otto
n+ p
igeo
npea
• G
reen
gra
m a
s th
ird
inte
rcro
p FY
M,
fert
ilize
rs, s
eed
rate
hig
her
--0.
601.
43
3K
ovilp
atti
660
P19
• 2-
year
rot
atio
n of
cot
ton-
sorg
hum
• N:P:K=40:20:20
• N
o FY
M
Cot
ton
Sorg
hum
Moo
ngM
aize
0.38
0.58
75–2
0070
0–10
00--
--
P21
• A
lter
nate
row
inte
rcro
ppin
g of
cot
ton+
bl
ack
gram
/mai
ze/s
orgh
um•
Man
ures
: FY
M @
10-
12 t
/ha
+ s
heep
m
anur
e @
10–
12 t
/ha
• N:P=90:110
• B
lack
gra
m r
esid
ues
inco
rpor
ated
400–
500
2200
–250
050
035
00–4
000
0.43
0.85
4So
khda
533
P30
• C
otto
n+ g
reen
gra
m–p
earl
mill
et•
FYM
: 30
cart
load
s/ha
• G
reen
gra
m a
s m
anur
e
Cot
ton
Pear
l mill
etSe
asam
um0.
362.
42
1200
–400
015
00–2
000
--
P31
• 2-
year
rot
atio
n of
cot
ton-
sesa
mum
• 5
t/ha
eve
ry fi
ve y
ears
• N
: P: K
: ade
quat
e
1200
–400
015
00–2
000
500–
600
0.50
2.60
5.N
imon
e52
0P
51•
Cot
ton+
pig
eonp
ea•
Sorg
hum
fod
der
and
Sesb
ania
gr
een
man
ure
as r
egul
ar r
otat
ion
• FY
M a
nd f
erti
lizer
: nor
mal
dos
e•
Wat
er r
equi
rem
ent
– 10
00-1
200
mm
/ha
--0.
761.
71
P52
• Su
garc
ane-
whe
at/s
orgh
um•
N: P
: hig
h do
se•
FYM
: nil
• Ir
riga
tion
: 30
per
year
• W
ater
req
uire
men
t: 2
500–
3000
mm
/ha
--0.
762.
64
Hig
hlig
hted
man
agem
ent
leve
ls in
dica
te b
ette
r sy
stem
s fo
r or
gani
c ca
rbon
seq
uest
rati
on
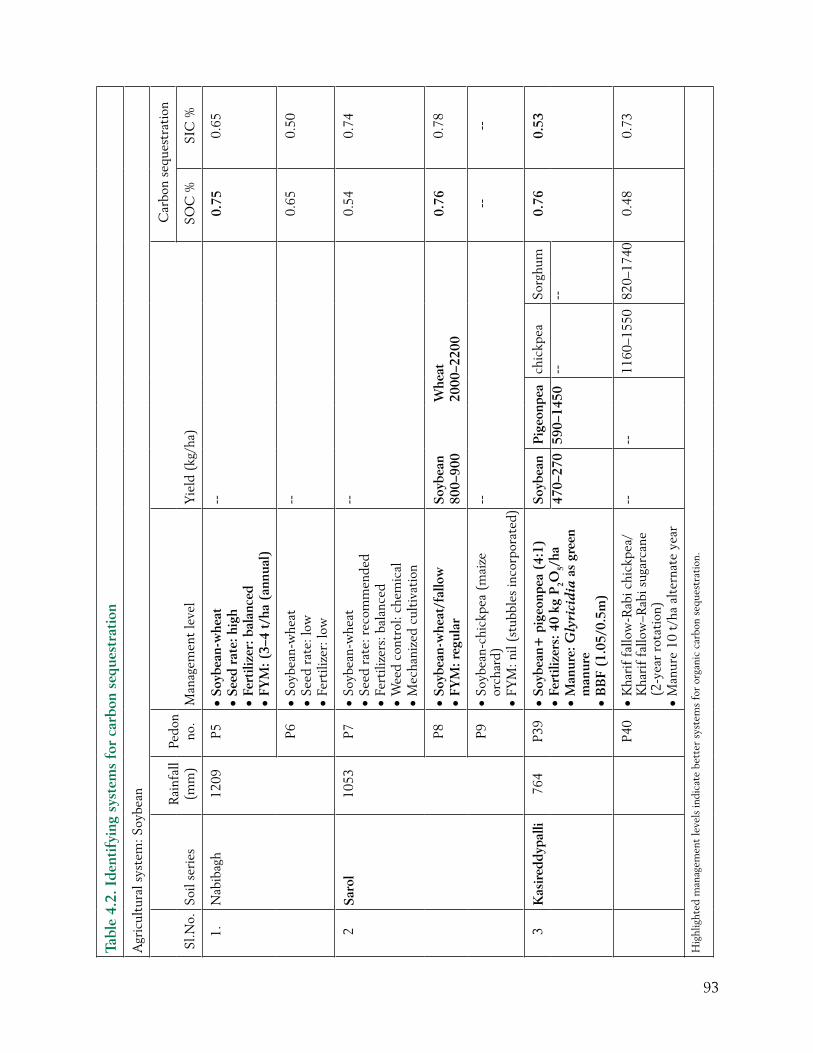
93
Tabl
e 4.
2. I
dent
ifyi
ng s
yste
ms
for
carb
on s
eque
stra
tion
Agr
icul
tura
l sys
tem
: Soy
bean
Sl.N
o.So
il se
ries
Rai
nfal
l (m
m)
Pedo
n no
.M
anag
emen
t le
vel
Yie
ld (
kg/h
a)
Car
bon
sequ
estr
atio
n
SOC
%SI
C %
1.N
abib
agh
1209
P5•
Soyb
ean-
whe
at•
Seed
rat
e: h
igh
• Fe
rtili
zer:
bal
ance
d•
FYM
: (3–
4 t/
ha (
annu
al)
--0.
750.
65
P6•
Soyb
ean-
whe
at•
Seed
rat
e: lo
w•
Fert
ilize
r: lo
w
--0.
650.
50
2Sa
rol
1053
P7•
Soyb
ean-
whe
at•
Seed
rat
e: r
ecom
men
ded
• Fe
rtili
zers
: bal
ance
d•
Wee
d co
ntro
l: ch
emic
al•
Mec
hani
zed
cult
ivat
ion
--0.
540.
74
P8•
Soyb
ean-
whe
at/f
allo
w•
FYM
: reg
ular
Soyb
ean
800–
900
Whe
at
2000
–220
00.
760.
78
P9•
Soyb
ean-
chic
kpea
(m
aize
or
char
d)•
FYM
: nil
(stu
bble
s in
corp
orat
ed)
----
--
3K
asir
eddy
palli
764
P39
• So
ybea
n+ p
igeo
npea
(4:
1)•
Fert
ilize
rs: 4
0 kg
P2O
5/ha
• M
anur
e: G
lyri
cid
ia a
s gr
een
man
ure
• B
BF
(1.0
5/0.
5m)
Soyb
ean
Pig
eonp
each
ickp
eaSo
rghu
m0.
760.
5347
0–27
059
0–14
50--
--
P40
• K
hari
f fa
llow
-Rab
i chi
ckpe
a/K
hari
f fa
llow
–Rab
i sug
arca
ne
(2-y
ear
rota
tion
)•
Man
ure
10 t
/ha
alte
rnat
e ye
ar
----
1160
–155
082
0–17
400.
480.
73
Hig
hlig
hted
man
agem
ent
leve
ls in
dica
te b
ette
r sy
stem
s fo
r or
gani
c ca
rbon
seq
uest
rati
on.
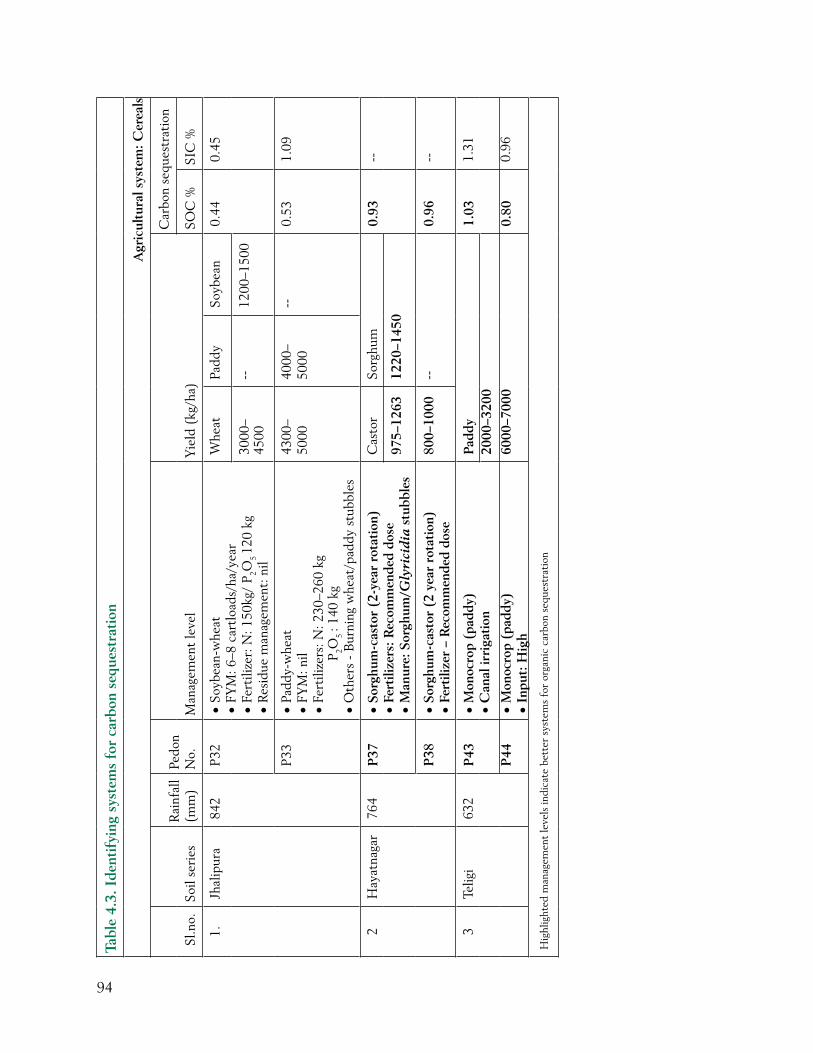
94
Tabl
e 4.
3. I
dent
ifyi
ng s
yste
ms
for
carb
on s
eque
stra
tion
Agr
icul
tura
l sys
tem
: Cer
eals
Sl.n
o.So
il se
ries
Rai
nfal
l (m
m)
Pedo
n N
o.M
anag
emen
t le
vel
Yie
ld (
kg/h
a)
Car
bon
sequ
estr
atio
n
SOC
%SI
C %
1.Jh
alip
ura
842
P32
• So
ybea
n-w
heat
• FY
M: 6
–8 c
artl
oads
/ha/
year
• Fe
rtili
zer:
N: 1
50kg
/ P 2O
5 12
0 kg
• R
esid
ue m
anag
emen
t: n
il
Whe
atPa
ddy
Soyb
ean
0.44
0.45
3000
–45
00--
1200
–150
0
P33
• Pa
ddy-
whe
at•
FYM
: nil
• Fe
rtili
zers
: N: 2
30–2
60 k
g
P2O
5 : 1
40 k
g•
Oth
ers
- B
urni
ng w
heat
/pad
dy s
tubb
les
4300
–50
0040
00–
5000
--0.
531.
09
2H
ayat
naga
r76
4P
37•
Sorg
hum
-cas
tor
(2-y
ear
rota
tion
)•
Fert
ilize
rs: R
ecom
men
ded
dose
• M
anur
e: S
orgh
um/G
lyri
cid
ia s
tubb
les
Cas
tor
Sorg
hum
0.93
--
975–
1263
1220
–145
0
P38
• So
rghu
m-c
asto
r (2
yea
r ro
tati
on)
• Fe
rtili
zer
– R
ecom
men
ded
dose
800–
1000
--0.
96--
3Te
ligi
632
P43
• M
onoc
rop
(pad
dy)
• C
anal
irri
gati
onPa
ddy
1.03
1.31
2000
–320
0P
44•
Mon
ocro
p (p
addy
)•
Inpu
t: H
igh
6000
–700
00.
800.
96
Hig
hlig
hted
man
agem
ent
leve
ls in
dica
te b
ette
r sy
stem
s fo
r or
gani
c ca
rbon
seq
uest
rati
on
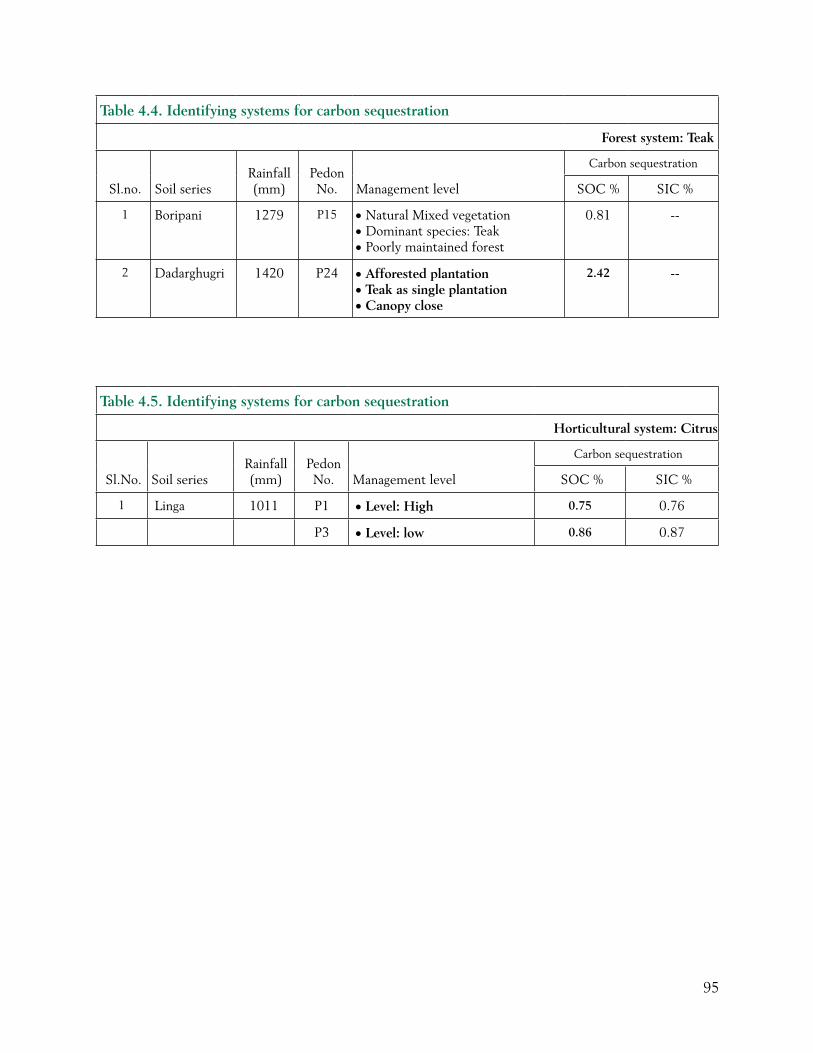
95
Table 4.4. Identifying systems for carbon sequestration
Forest system: Teak
Sl.no. Soil seriesRainfall (mm)
Pedon No. Management level
Carbon sequestration
SOC % SIC %
1 Boripani 1279 P15 • Natural Mixed vegetation• Dominant species: Teak• Poorly maintained forest
0.81 --
2 Dadarghugri 1420 P24 • Afforested plantation • Teak as single plantation• Canopy close
2.42 --
Table 4.5. Identifying systems for carbon sequestration
Horticultural system: Citrus
Sl.No. Soil seriesRainfall (mm)
Pedon No. Management level
Carbon sequestration
SOC % SIC %
1 Linga 1011 P1 • Level: High 0.75 0.76
P3 • Level: low 0.86 0.87
96
References
Arrouays D, Vion I and Kiein JL 1995. Spatial analysis and modeling of topsoil carbon storage in temperate forest loamy soils of France. Soil Science 159:191–198.Balpande SS, Deshpande SB and Pal DK. 1996. Factors and processes of soil degradation in Vertisols of the Purna valley, Maharashtra, India. Land Degradation and Development 7:313 – 324. Bhadwal Suruchi and Singh Roma. 2002. Carbon sequestration estimates for forestry options under different land use scenarios in India. Current Science 83:1380–1386.
Bhattacharyya T. 1984. Nature and characteristics of clay and clay-organic complex occurring in major soil groups of India. Ph.D. thesis, Indian Agricultural Research Institute, New Delhi, India, pp. 223. Bhattacharyya T, Chandran P, Ray SK, Mandal C, Pal DK, Venugopalan MV, Durge SL, Srivastava P, Dubey PN, Kamble GK and Sharma RP. 2003. Characterization of benchmark spots of selected red and black soils in semi-arid tropics India – working report of identifying systems for carbon sequestration and increased productivity in semi-arid tropical environments (RNPS-25) (NATP, ICAR), pp. 370.
Bhattacharyya T and Ghosh SK. 1994. Nature and characteristics of naturally occurring clay -organic complex of two soils from northeastern region. Clay Research 13:1–9.
Bhattacharyya T and Pal DK. 1998. Occurrence of Mollisols-Alfisols-Vertisols associations in central India – their mineralogy and genesis. Presented at a national seminar on developments in soil science, 16–19 November, 1998, Hisar, India.Bhattacharyya T and Pal DK. 2003. Carbon sequestration in soils of the Indo-Gangetic Plains. Pages 68–71 in Addressing Resource Conservation Issues in Rice-Wheat System of South Asia –a Resource Book (RWC-CIMMYT). New Delhi, India: Rice-Wheat Consortium for Indo-Gangetic Plains, International Maize and Wheat Improvement Centre.
Bhattacharyya T, Pal DK and Deshpande SB. 1993. Genesis and transformation of minerals in the formation of red (Alfisols) and black (Inceptisols and Vertisols) soils on Deccan basalt in the Western Ghats, India. Journal of Soil Science 44:159–171.
Bhattacharyya T, Pal DK and Deshpande SB. 1997. On kaolinitic and mixed mineralogy classes of shrink-swell soils. Australian Journal of Soil Research 35:1245–1252.
Bhattacharyya T, Pal DK, Velayutham M, Chandran P and Mandal C. 2000. Carbon stock in Indian soils – issues, priorities and management. Pages 1–46 in Special publication of the International Seminar on Land Resource Management for Food, Employment and Environmental Security (ICLRM) at New Delhi, 8–13 November 2000.
Bhuse SR, Vaidya PH, Bhattacharyya T and Pal DK. 2001. An improvised method to determine clay smectite in Vertisols. Clay Research 20: 65–72.
Cocheme J and Franquin P. 1967. A study of the agroclimatology of the semi-arid areas south of the Sahara in West Africa. Rome, Italy: Food and Agriculture Organization.
Cotching WE, Cooper J, Sparrow LA, McCorkell BE, Rowley W and Hawkinds K. 2002. Effects of agricultural management on Vertisols in Tasmania. Australian Journal of Soil Research 40:1267–1286.
97
De Vos JH and Virgo KJ. 1969. Soil structure in Vertisols of the blue clay plains, Sudan. Journal of Soil Science 20: 189–206.
Dudal R. 1965. Dark clay soils of tropical and subtropical regions. Agriculture Development Paper no. 83. Rome, Italy: FAO, 161 pp.
Ghosh, SK and Raychaudhuri SP. 1974. Distribution of clay minerals in Indian soils. Pages 143–164 in Mineralogy of soil clays and clay minerals (Mukherjee SK and Biswas TD, eds.) New Delhi, India: Indian Society of Soil Science.
Hajabbasi MA, Jalalian A and Karimzadeh HR. 1997. Deforestation effects on soil physical and chemical properties, Lordegan, Iran. Plant and Soil 190: 301–308.
Jackson ML. 1973. Soil chemical analysis. India: Prentice Hall.
Jackson, ML. 1979. Soil chemical analysis: Advanced course. Madison, WI, USA: Published by author.
Jagdish Prasad and Gaikawad ST. 1991. Site characteristics of some soils supporting teak (T. Grandis) and sal (S. Robusta) of Mandla district. Van Vigyan 29: 180–181.
Jenny H and Raychaudhuri SP. 1960. Effect of climate and cultivation on nitrogen and organic matter reserves in Indian soils. New Delhi, India: ICAR, pp. 126.
Jewitt TN, Law RD and Virgo KJ. 1979. Vertisol soils of the tropics and sub-tropics – their management and use. Outlook on Agriculture 10: 33–40 (ICI, Brackwell Berkshire).
Kadu PR, Vaidya PH, Balpande SS, Satyavathi, PLA and Pal DK. 2003. Use of hydraulic conductivity to evaluate the suitability of Vertisols for deep-rooted crops in semi-arid parts of central India. Soil Use and Management 19: 208–216.
Kaiser K and Guggenberger G. 2003. Mineral surfaces and soil organic matter. European Journal of Soil Science 54: 219–236.
Klute A. (ed.) 1986. Methods of soils analysis, part 1, Physical and mineralogical methods (second edition) no.9 (pt 1) in the series Agronomy. Madison, Wisconsin, USA: American Society of Agronomy and Soil Science Society of America.
Krantz BA, Kampen J and Russell MB. 1978. Soil management differences of Alfisols and Vertisols in the semi-arid tropics. Pages 77–95 in Diversity of soils in the tropics. Madison, Wisconsin, U.S.A.: American Society of Agronomy.
Ludwig B, John B, Ellenbrock R, Kaiser M and Flessa H. 2003. Stabilization of carbon from maize in a sandy soil in a long term experiments. European Journal of Soil Science 54: 117–126.
McIntyre DS. 1974. Soil sampling techniques for physical measurements, chapter 3; bulk density chapter 5; and Appendix 1. In Method of analysis of irrigated soils (Loveday J, ed.). Technical Communication no. 54, Comw. Bur. Soils, Comw. Agric. Bureaux. Bucks, England: Farnham Royal,
Naitam R. 2001. Carbon status in selected swell-shrink soils under citrus and cotton-pigeonpea cropping system in Nagpur. M.Sc. thesis, Dr Panjabrao Deshmukh Krishi Vidyapeeth, Akola, Maharashtra, India, pp. 96.
Naitam R and Bhattacharyya T. 2003. Quasi-quilibrium of organic carbon in shrink-swell soils of sub-humid tropics in India under forest, horticulture and agricultural systems. Australian Journal of Soil Research 42: 181–188.
98
Neufldt H, Resck DVS and Ayarza MA. 2002. Texture and land use effects on soil organic matter in Cerrado Oxisols, Central Brazil. Geoderma 107: 151–164.
Pal DK and Deshpande SB. 1987a. Genesis of clay minerals in a red and black complex soils of southern India. Clay Research 6: 6–13.
Pal DK and Deshpande SB. 1987b. Characteristics and genesis of minerals in some benchmark Vertisols of India. Pedologie 37: 259–275.
Pal DK, Dasog DS, Vadivelu S, Ahuja RL and Bhattacharyya T. 2000. Secondary calcium carbonate in soils of arid and semi-arid region of India. Pages 149–185 in Global climate change and pedogenic carbonates (Lal, R, Kimble KM, Eswaran H and Stewart BA, eds.). Boca Raton, USA: CRC Press.
Pal DK, Deshpande SB, Venugopal KR and Kalbande AR. 1989. Formation of di- and trioctahedral smectite as evidence for paleo-climatic changes in southern and central peninsular India. Geoderma 45: 175–184.
Pal DK, Srivastava P, Durge SL and Bhattacharyya T. 2003. Role of micro-topography in the formation of sodic soils in the semi-arid part of the Indo-Gangetic Plains, India. Catena 51:3–31.
Parfitt RL, Parshotam A and Salt GJ. 2002. Carbon turnover in two soils with contrasting mineralogy under long-term maize and pasture. Australian Journal of Soil Research 40: 127– 136.
Poonia SR and Niedderbudde EA. 1990. Exchange equilibria of potassium in soils, V Effect of natural organic matter on K-Ca Exchange. Geoderma 47: 233–242.
Rao KB, Ramavatharam N, Prihar SS and Quasar MA. 1978. Changes in bulk density of soils due to changes in moisture content. Journal of the Indian Society of Soil Science 26: 320 –322.
Ray SK and Reddy RS. 1997. Classification of soils buried by allochthonous material. Journal of the Indian Society of Soil Science 45: 542–547.
Raychaudhuri SP, Roy BB, Gupta SP and Dewan ML. 1963. Black soils of India. Monograph 3. India: National Institute of Science, 47 pp.
Richards LA (ed.). 1954. Diagnosis and improvement of saline and alkali soils. USDA Agriculture Handbook 60. Washington, DC, USA: US Government Printing Office, pp 160.
Saikh H, Varadachari C and Ghosh K. 1998a. Changes in carbon, nitrogen and phosphorus levels due to deforestation and cultivation – a case study in Simplipal National Park, India. Plant and Soil 198: 137–145.
Saikh H, Varadachari C, Ghosh K. 1998b. Effect of deforestation and cultivation on soil CEC and content of exchangeable bases – a case study in Simplipal National Park, India. Plant and Soil 204: 175–181.
Schafer WM and Singer MJ. 1976. A new method for measuring shrink-swell potential using soil paste. Soil Science Society of America Journal 40: 805–806.
Shirsath SK, Bhattacharyya T and Pal DK. 2000. Minimum threshold value of smectite for Vertic properties. Australian Journal of Soil Research 38: 189–201.
Soil Survey Staff. 1999. Soil taxonomy – a basic system of soil classification for making and interpretating soil surveys. 2nd ed. Agriculture Handbook no. 436. Washington, DC, USA: SCS -USDA, US Govt. Printing Office, pp. 869.
99
Srivastava P, Pal DK and Bhattacharyya T. 2002. Significance of the formation of calcium carbonate minerals in the pedogenesis and management of cracking clay soils (Vertisols) of India. Clays and Clay Minerals 50: 111–126.
Tate KR and Theng BKG. 1980. Organic matter and its interaction with inorganic soil constituents. Pages 225–252 in Soils with variable charge (Theng G. ed.). Lower Hutt, New Zealand: New Zealand Society of Soil Science.
USDA. 1972. Soil survey laboratory methods and procedures for collecting soil samples. Soil Survey Investigation Report no. 1. Washington, DC, USA: Conservation Service, US Department of Agriculture, US Government Printing Office.
Vaidya PH and Pal DK. 2002. Microtopography as a factor in the degradation of Vertisols in central India. Land Degradation and Development 13: 429–445.
Velayutham M, Mandal DK, Mandal C and Sehgal JL. 1999. Agro-ecological subregions of India for development and planning. NBSS Publication no. 35. Nagpur, India: National Bureau of Soil Survey and Land Use Planning, pp. 452.
Velayutham M, Pal DK and Bhattacharyya T. 2000. Organic carbon stock in soils of India. Pages 71–95 in Global climate change and tropical ecosystem (Lal R, Kimble JM and Stewarts BA, eds.). Advances in Soil Science. Boca Raton, USA: CRC Press.
Wadia DN. 1989. Geology of India. New Delhi, India: Tata McGraw Hill.
West TO and Post WM. 2002. Soil organic carbon sequestration rates by tillage and crop rotation – a global data analysis. Soil Science Society of America Journal 66:1930–1946.
Yule DF and Ritchie JT. 1980. Soil shrinkage relationship of Texas Vertisols 1 small cores. Soil Science Society of America Journal 44: 1285–1291.

Appendix-1
PHYSICAL PROPERTIES OF
SELECTED SOILS IN
28 BENCHMARK SPOTS

103
BLACK SOILS
(Sub-humid moist)
(MAR: > 1100 mm)
Benchmark Spots: 2, 3, 7, 13
No. of Pedons: 6 (P4, P5, P6, P15, P27, P28)
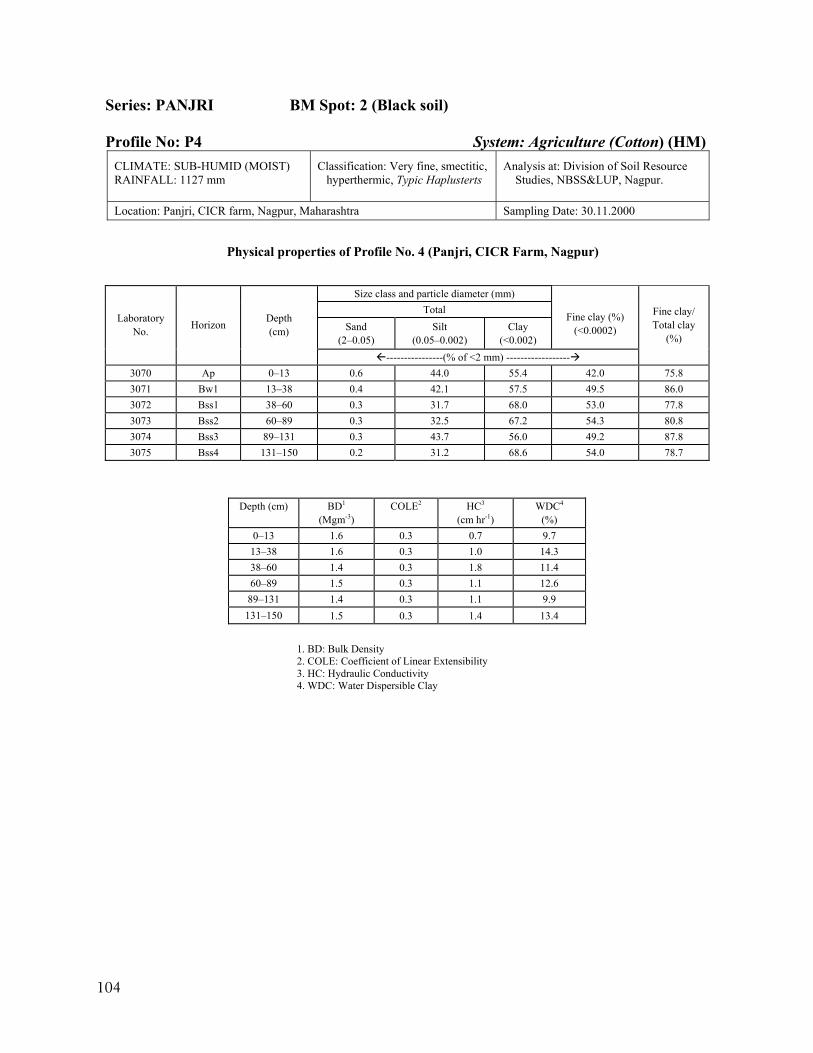
104
Series: PANJRI BM Spot: 2 (Black soil) Profile No: P4 System: Agriculture (Cotton) (HM)
CLIMATE: SUB-HUMID (MOIST) RAINFALL: 1127 mm
Classification: Very fine, smectitic, hyperthermic, Typic Haplusterts
Analysis at: Division of Soil Resource Studies, NBSS&LUP, Nagpur.
Location: Panjri, CICR farm, Nagpur, Maharashtra Sampling Date: 30.11.2000
Physical properties of Profile No. 4 (Panjri, CICR Farm, Nagpur)
Size class and particle diameter (mm)
Total Sand
(2–0.05) Silt
(0.05–0.002) Clay
(<0.002)
Fine clay (%)
(<0.0002) Laboratory
No. Horizon Depth (cm)
----------------(% of <2 mm) ------------------
Fine clay/ Total clay
(%)
3070 Ap 0–13 0.6 44.0 55.4 42.0 75.8 3071 Bw1 13–38 0.4 42.1 57.5 49.5 86.0 3072 Bss1 38–60 0.3 31.7 68.0 53.0 77.8 3073 Bss2 60–89 0.3 32.5 67.2 54.3 80.8 3074 Bss3 89–131 0.3 43.7 56.0 49.2 87.8 3075 Bss4 131–150 0.2 31.2 68.6 54.0 78.7
Depth (cm) BD1
(Mgm-3) COLE2 HC3
(cm hr-1) WDC4
(%) 0–13 1.6 0.3 0.7 9.7 13–38 1.6 0.3 1.0 14.3 38–60 1.4 0.3 1.8 11.4 60–89 1.5 0.3 1.1 12.6
89–131 1.4 0.3 1.1 9.9 131–150 1.5 0.3 1.4 13.4
1. BD: Bulk Density 2. COLE: Coefficient of Linear Extensibility 3. HC: Hydraulic Conductivity 4. WDC: Water Dispersible Clay
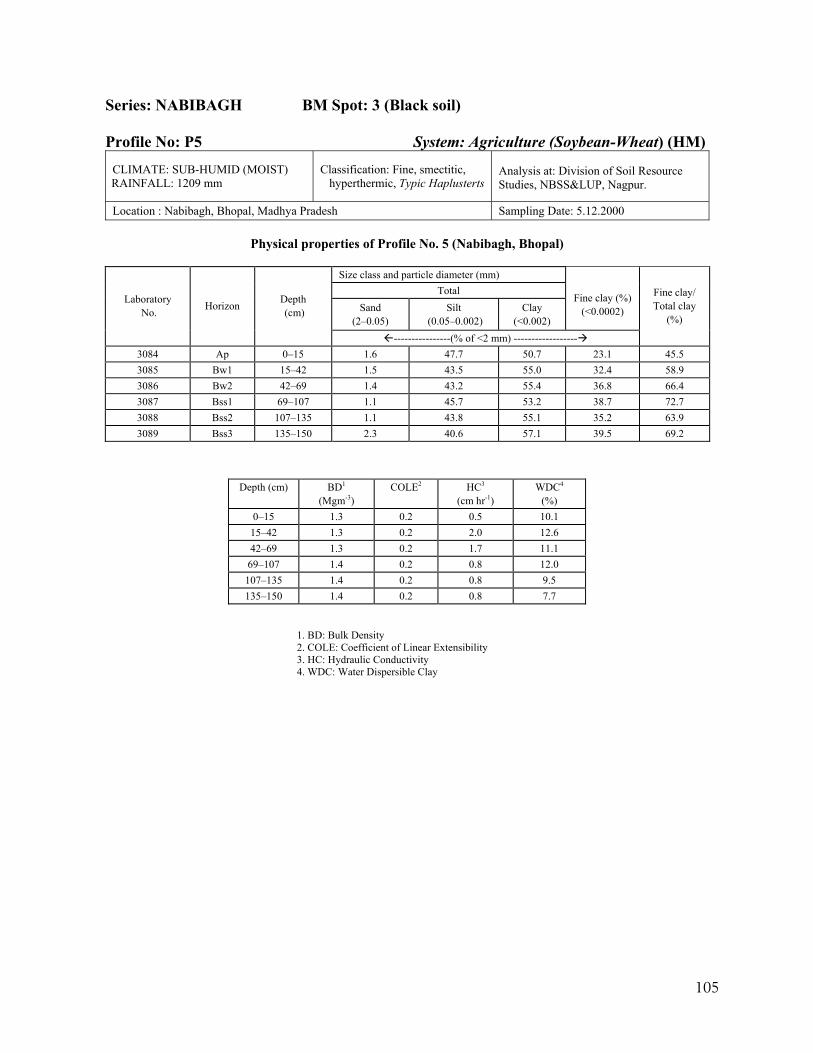
105
Series: NABIBAGH BM Spot: 3 (Black soil) Profile No: P5 System: Agriculture (Soybean-Wheat) (HM)
CLIMATE: SUB-HUMID (MOIST) RAINFALL: 1209 mm
Classification: Fine, smectitic, hyperthermic, Typic Haplusterts
Analysis at: Division of Soil Resource Studies, NBSS&LUP, Nagpur.
Location : Nabibagh, Bhopal, Madhya Pradesh Sampling Date: 5.12.2000
Physical properties of Profile No. 5 (Nabibagh, Bhopal)
Size class and particle diameter (mm) Total
Sand (2–0.05)
Silt (0.05–0.002)
Clay (<0.002)
Fine clay (%)
(<0.0002) Laboratory
No. Horizon Depth (cm)
----------------(% of <2 mm) ------------------
Fine clay/ Total clay
(%)
3084 Ap 0–15 1.6 47.7 50.7 23.1 45.5 3085 Bw1 15–42 1.5 43.5 55.0 32.4 58.9 3086 Bw2 42–69 1.4 43.2 55.4 36.8 66.4 3087 Bss1 69–107 1.1 45.7 53.2 38.7 72.7 3088 Bss2 107–135 1.1 43.8 55.1 35.2 63.9 3089 Bss3 135–150 2.3 40.6 57.1 39.5 69.2
Depth (cm) BD1
(Mgm-3) COLE2 HC3
(cm hr-1) WDC4
(%) 0–15 1.3 0.2 0.5 10.1 15–42 1.3 0.2 2.0 12.6 42–69 1.3 0.2 1.7 11.1
69–107 1.4 0.2 0.8 12.0 107–135 1.4 0.2 0.8 9.5 135–150 1.4 0.2 0.8 7.7
1. BD: Bulk Density 2. COLE: Coefficient of Linear Extensibility 3. HC: Hydraulic Conductivity 4. WDC: Water Dispersible Clay
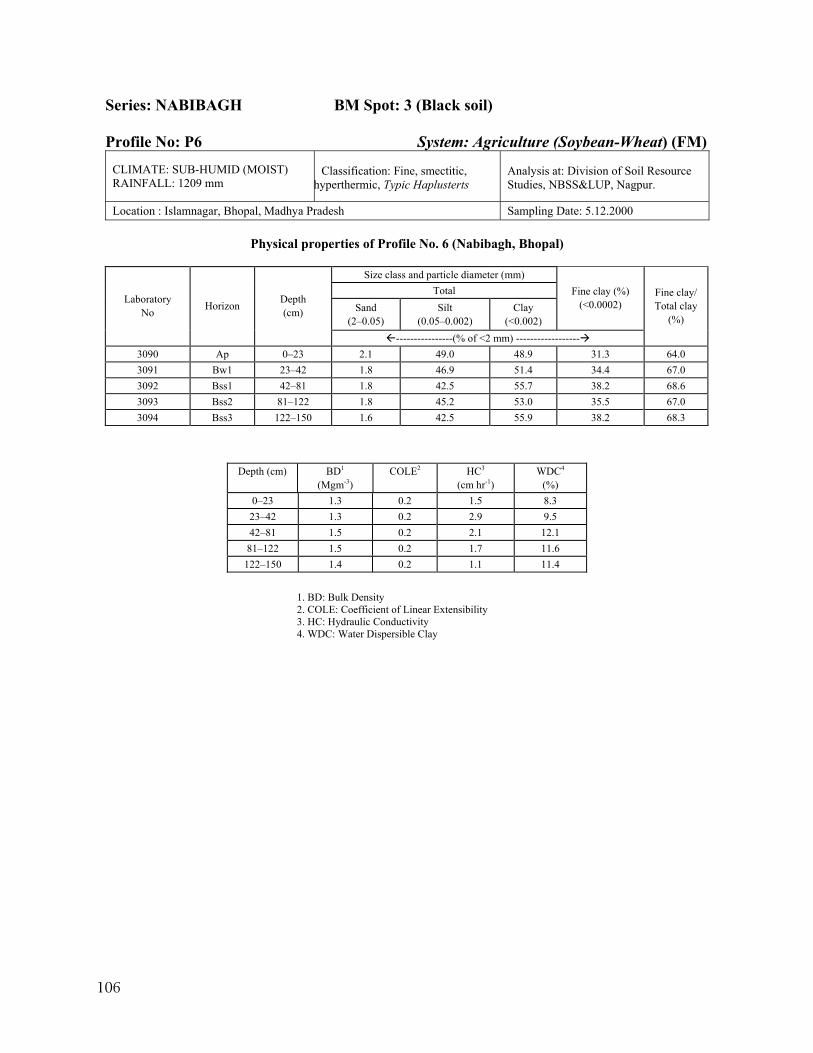
106
Series: NABIBAGH BM Spot: 3 (Black soil) Profile No: P6 System: Agriculture (Soybean-Wheat) (FM)
CLIMATE: SUB-HUMID (MOIST) RAINFALL: 1209 mm
Classification: Fine, smectitic, hyperthermic, Typic Haplusterts
Analysis at: Division of Soil Resource Studies, NBSS&LUP, Nagpur.
Location : Islamnagar, Bhopal, Madhya Pradesh Sampling Date: 5.12.2000
Physical properties of Profile No. 6 (Nabibagh, Bhopal)
Size class and particle diameter (mm) Total
Sand (2–0.05)
Silt (0.05–0.002)
Clay (<0.002)
Fine clay (%) (<0.0002) Laboratory
No Horizon Depth (cm)
----------------(% of <2 mm) ------------------
Fine clay/ Total clay
(%)
3090 Ap 0–23 2.1 49.0 48.9 31.3 64.0 3091 Bw1 23–42 1.8 46.9 51.4 34.4 67.0 3092 Bss1 42–81 1.8 42.5 55.7 38.2 68.6 3093 Bss2 81–122 1.8 45.2 53.0 35.5 67.0 3094 Bss3 122–150 1.6 42.5 55.9 38.2 68.3
Depth (cm) BD1
(Mgm-3) COLE2 HC3
(cm hr-1) WDC4
(%) 0–23 1.3 0.2 1.5 8.3 23–42 1.3 0.2 2.9 9.5 42–81 1.5 0.2 2.1 12.1 81–122 1.5 0.2 1.7 11.6
122–150 1.4 0.2 1.1 11.4
1. BD: Bulk Density 2. COLE: Coefficient of Linear Extensibility 3. HC: Hydraulic Conductivity 4. WDC: Water Dispersible Clay
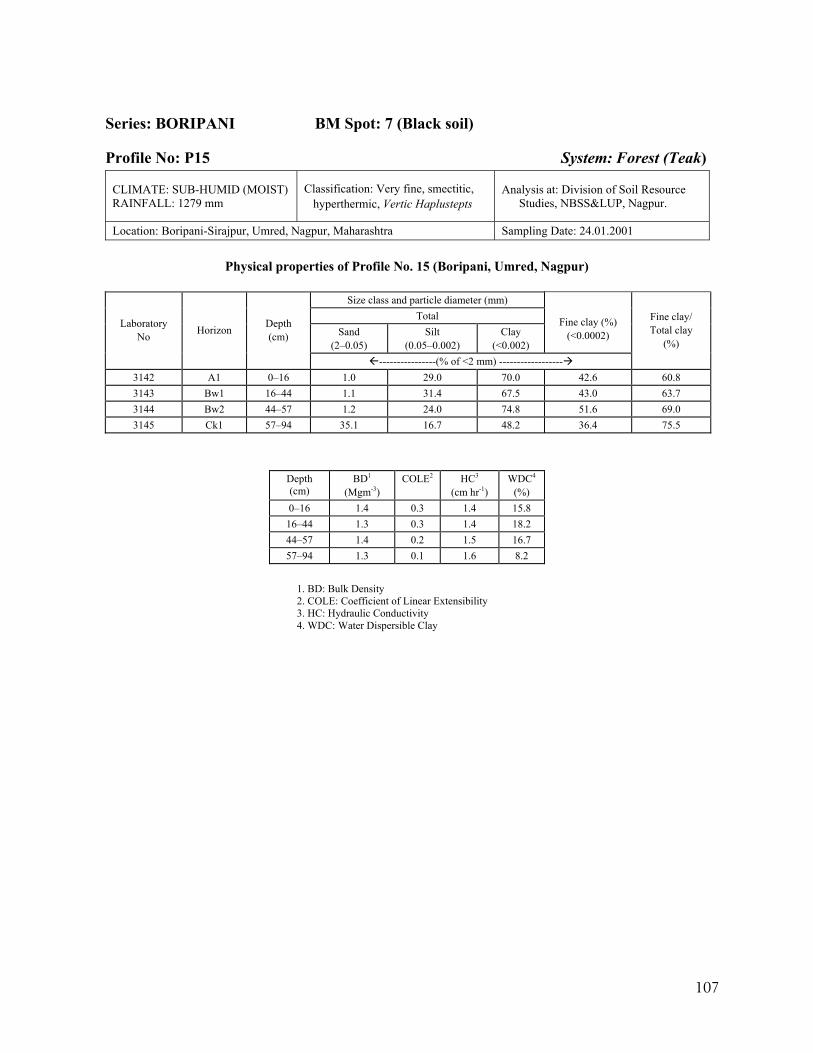
107
Series: BORIPANI BM Spot: 7 (Black soil)
Profile No: P15 System: Forest (Teak)
CLIMATE: SUB-HUMID (MOIST) RAINFALL: 1279 mm
Classification: Very fine, smectitic, hyperthermic, Vertic Haplustepts
Analysis at: Division of Soil Resource Studies, NBSS&LUP, Nagpur.
Location: Boripani-Sirajpur, Umred, Nagpur, Maharashtra Sampling Date: 24.01.2001
Physical properties of Profile No. 15 (Boripani, Umred, Nagpur)
Size class and particle diameter (mm) Total
Sand (2–0.05)
Silt (0.05–0.002)
Clay (<0.002)
Fine clay (%)
(<0.0002) Laboratory
No Horizon Depth (cm)
----------------(% of <2 mm) ------------------
Fine clay/ Total clay
(%)
3142 A1 0–16 1.0 29.0 70.0 42.6 60.8 3143 Bw1 16–44 1.1 31.4 67.5 43.0 63.7 3144 Bw2 44–57 1.2 24.0 74.8 51.6 69.0 3145 Ck1 57–94 35.1 16.7 48.2 36.4 75.5
Depth (cm)
BD1
(Mgm-3) COLE2 HC3
(cm hr-1) WDC4
(%) 0–16 1.4 0.3 1.4 15.8 16–44 1.3 0.3 1.4 18.2 44–57 1.4 0.2 1.5 16.7 57–94 1.3 0.1 1.6 8.2
1. BD: Bulk Density 2. COLE: Coefficient of Linear Extensibility 3. HC: Hydraulic Conductivity 4. WDC: Water Dispersible Clay
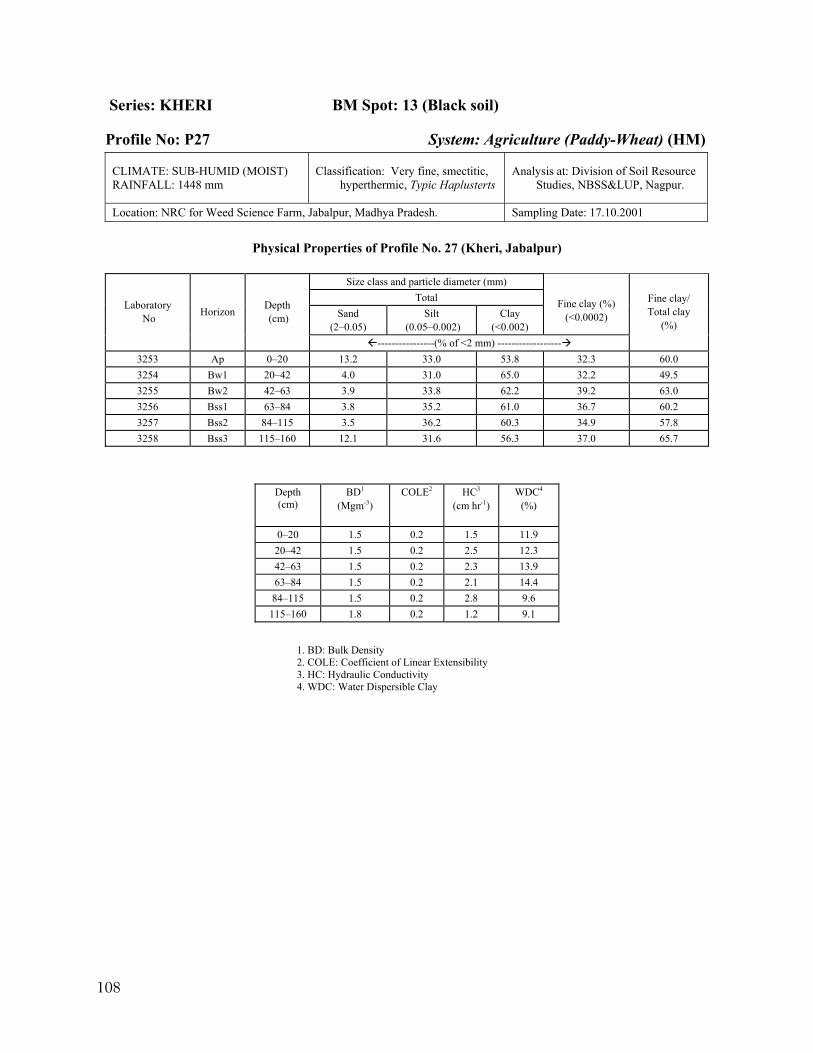
108
Series: KHERI BM Spot: 13 (Black soil)
Profile No: P27 System: Agriculture (Paddy-Wheat) (HM)
CLIMATE: SUB-HUMID (MOIST) RAINFALL: 1448 mm
Classification: Very fine, smectitic, hyperthermic, Typic Haplusterts
Analysis at: Division of Soil Resource Studies, NBSS&LUP, Nagpur.
Location: NRC for Weed Science Farm, Jabalpur, Madhya Pradesh. Sampling Date: 17.10.2001
Physical Properties of Profile No. 27 (Kheri, Jabalpur)
Size class and particle diameter (mm) Total
Sand (2–0.05)
Silt (0.05–0.002)
Clay (<0.002)
Fine clay (%)
(<0.0002) Laboratory
No Horizon Depth (cm)
----------------(% of <2 mm) ------------------
Fine clay/ Total clay
(%)
3253 Ap 0–20 13.2 33.0 53.8 32.3 60.0 3254 Bw1 20–42 4.0 31.0 65.0 32.2 49.5 3255 Bw2 42–63 3.9 33.8 62.2 39.2 63.0 3256 Bss1 63–84 3.8 35.2 61.0 36.7 60.2 3257 Bss2 84–115 3.5 36.2 60.3 34.9 57.8 3258 Bss3 115–160 12.1 31.6 56.3 37.0 65.7
Depth (cm)
BD1
(Mgm-3) COLE2 HC3
(cm hr-1) WDC4
(%)
0–20 1.5 0.2 1.5 11.9 20–42 1.5 0.2 2.5 12.3 42–63 1.5 0.2 2.3 13.9 63–84 1.5 0.2 2.1 14.4 84–115 1.5 0.2 2.8 9.6
115–160 1.8 0.2 1.2 9.1
1. BD: Bulk Density 2. COLE: Coefficient of Linear Extensibility 3. HC: Hydraulic Conductivity 4. WDC: Water Dispersible Clay
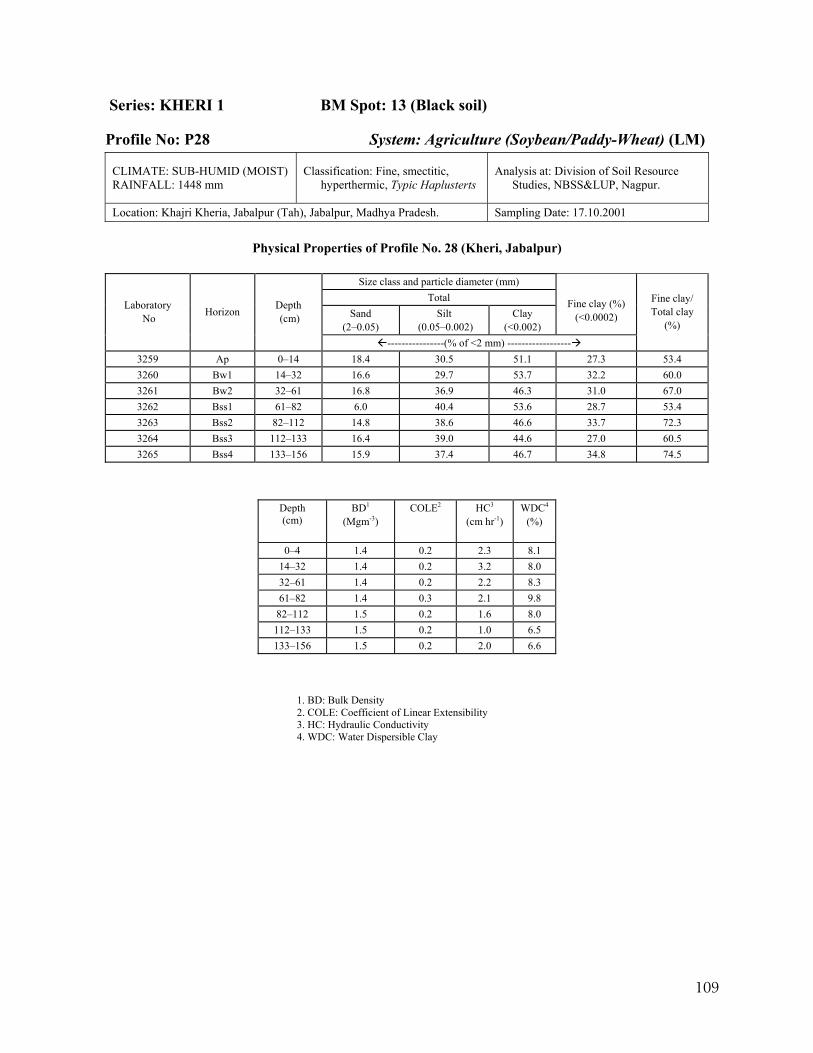
109
Series: KHERI 1 BM Spot: 13 (Black soil)
Profile No: P28 System: Agriculture (Soybean/Paddy-Wheat) (LM)
CLIMATE: SUB-HUMID (MOIST) RAINFALL: 1448 mm
Classification: Fine, smectitic, hyperthermic, Typic Haplusterts
Analysis at: Division of Soil Resource Studies, NBSS&LUP, Nagpur.
Location: Khajri Kheria, Jabalpur (Tah), Jabalpur, Madhya Pradesh. Sampling Date: 17.10.2001
Physical Properties of Profile No. 28 (Kheri, Jabalpur)
Size class and particle diameter (mm) Total
Sand (2–0.05)
Silt (0.05–0.002)
Clay (<0.002)
Fine clay (%)
(<0.0002) Laboratory
No Horizon Depth (cm)
----------------(% of <2 mm) ------------------
Fine clay/ Total clay
(%)
3259 Ap 0–14 18.4 30.5 51.1 27.3 53.4 3260 Bw1 14–32 16.6 29.7 53.7 32.2 60.0 3261 Bw2 32–61 16.8 36.9 46.3 31.0 67.0 3262 Bss1 61–82 6.0 40.4 53.6 28.7 53.4 3263 Bss2 82–112 14.8 38.6 46.6 33.7 72.3 3264 Bss3 112–133 16.4 39.0 44.6 27.0 60.5 3265 Bss4 133–156 15.9 37.4 46.7 34.8 74.5
Depth (cm)
BD1
(Mgm-3) COLE2 HC3
(cm hr-1) WDC4
(%)
0–4 1.4 0.2 2.3 8.1 14–32 1.4 0.2 3.2 8.0 32–61 1.4 0.2 2.2 8.3 61–82 1.4 0.3 2.1 9.8
82–112 1.5 0.2 1.6 8.0 112–133 1.5 0.2 1.0 6.5 133–156 1.5 0.2 2.0 6.6
1. BD: Bulk Density 2. COLE: Coefficient of Linear Extensibility 3. HC: Hydraulic Conductivity 4. WDC: Water Dispersible Clay

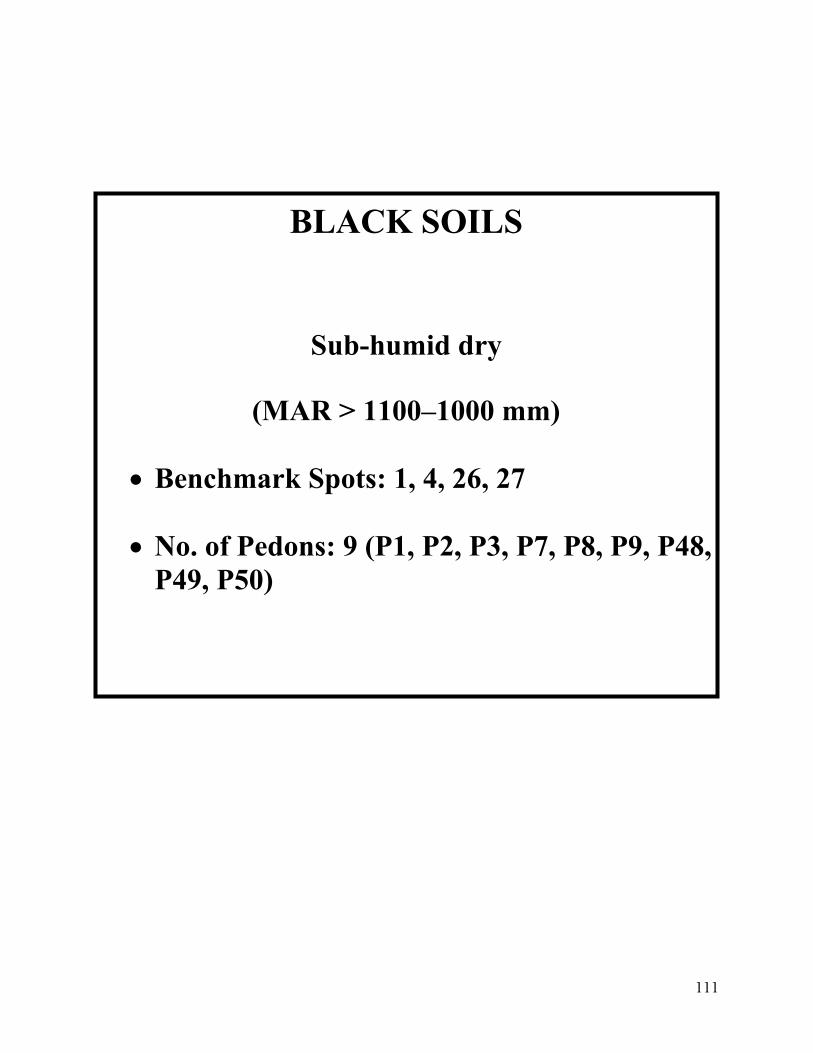
111
BLACK SOILS
Sub-humid dry
(MAR > 1100–1000 mm)
Benchmark Spots: 1, 4, 26, 27
No. of Pedons: 9 (P1, P2, P3, P7, P8, P9, P48, P49, P50)
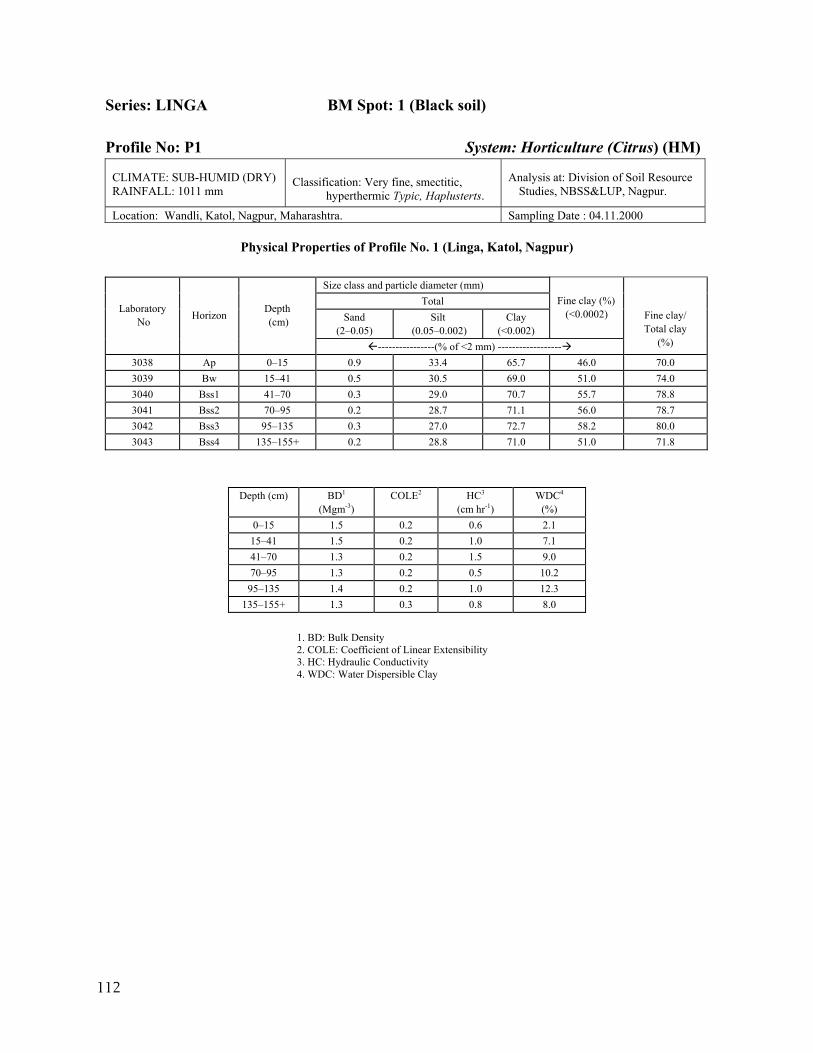
112
Series: LINGA BM Spot: 1 (Black soil) Profile No: P1 System: Horticulture (Citrus) (HM)
CLIMATE: SUB-HUMID (DRY) RAINFALL: 1011 mm
Classification: Very fine, smectitic, hyperthermic Typic, Haplusterts.
Analysis at: Division of Soil Resource Studies, NBSS&LUP, Nagpur.
Location: Wandli, Katol, Nagpur, Maharashtra. Sampling Date : 04.11.2000
Physical Properties of Profile No. 1 (Linga, Katol, Nagpur)
Size class and particle diameter (mm) Total
Sand (2–0.05)
Silt (0.05–0.002)
Clay (<0.002)
Fine clay (%) (<0.0002) Laboratory
No Horizon Depth (cm)
----------------(% of <2 mm) ------------------
Fine clay/ Total clay
(%)
3038 Ap 0–15 0.9 33.4 65.7 46.0 70.0 3039 Bw 15–41 0.5 30.5 69.0 51.0 74.0 3040 Bss1 41–70 0.3 29.0 70.7 55.7 78.8 3041 Bss2 70–95 0.2 28.7 71.1 56.0 78.7 3042 Bss3 95–135 0.3 27.0 72.7 58.2 80.0 3043 Bss4 135–155+ 0.2 28.8 71.0 51.0 71.8
Depth (cm) BD1
(Mgm-3) COLE2 HC3
(cm hr-1) WDC4
(%) 0–15 1.5 0.2 0.6 2.1 15–41 1.5 0.2 1.0 7.1 41–70 1.3 0.2 1.5 9.0 70–95 1.3 0.2 0.5 10.2
95–135 1.4 0.2 1.0 12.3 135–155+ 1.3 0.3 0.8 8.0
1. BD: Bulk Density 2. COLE: Coefficient of Linear Extensibility 3. HC: Hydraulic Conductivity 4. WDC: Water Dispersible Clay
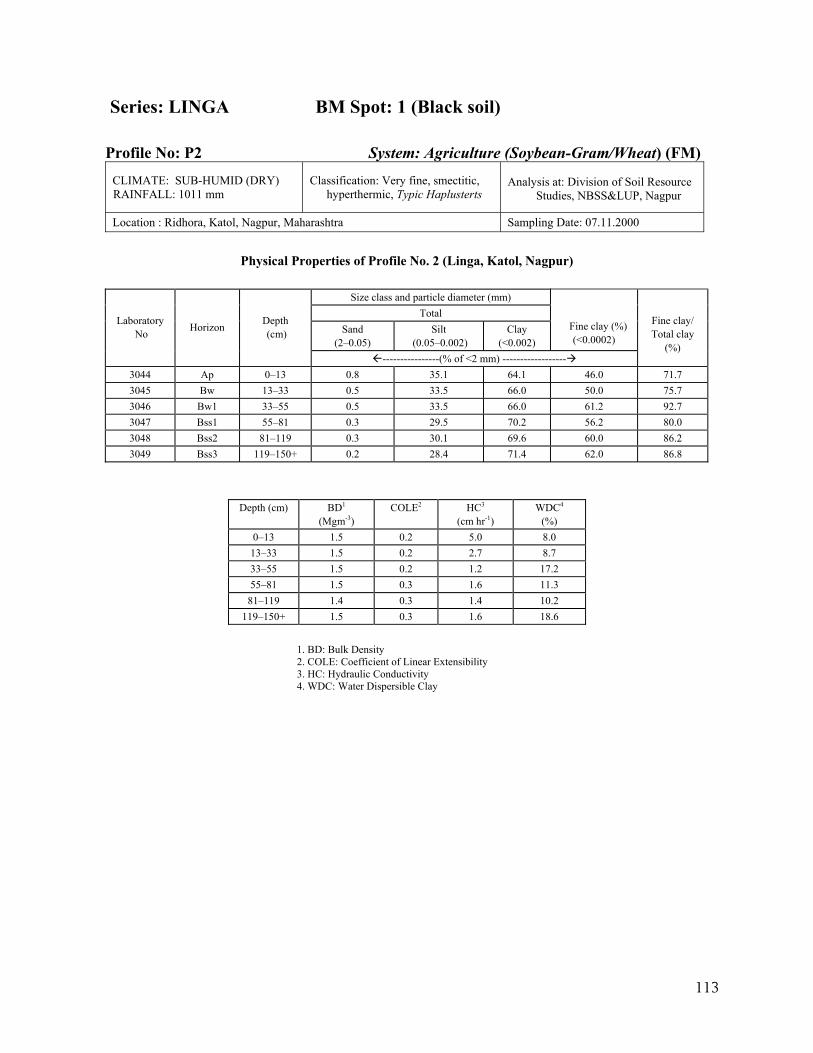
113
Series: LINGA BM Spot: 1 (Black soil) Profile No: P2 System: Agriculture (Soybean-Gram/Wheat) (FM)
CLIMATE: SUB-HUMID (DRY) RAINFALL: 1011 mm
Classification: Very fine, smectitic, hyperthermic, Typic Haplusterts
Analysis at: Division of Soil Resource Studies, NBSS&LUP, Nagpur
Location : Ridhora, Katol, Nagpur, Maharashtra Sampling Date: 07.11.2000
Physical Properties of Profile No. 2 (Linga, Katol, Nagpur)
Size class and particle diameter (mm)
Total Sand
(2–0.05) Silt
(0.05–0.002) Clay
(<0.002) Fine clay (%) (<0.0002)
Laboratory No Horizon Depth
(cm)
----------------(% of <2 mm) ------------------
Fine clay/ Total clay
(%)
3044 Ap 0–13 0.8 35.1 64.1 46.0 71.7 3045 Bw 13–33 0.5 33.5 66.0 50.0 75.7 3046 Bw1 33–55 0.5 33.5 66.0 61.2 92.7 3047 Bss1 55–81 0.3 29.5 70.2 56.2 80.0 3048 Bss2 81–119 0.3 30.1 69.6 60.0 86.2 3049 Bss3 119–150+ 0.2 28.4 71.4 62.0 86.8
Depth (cm) BD1
(Mgm-3) COLE2 HC3
(cm hr-1) WDC4
(%) 0–13 1.5 0.2 5.0 8.0 13–33 1.5 0.2 2.7 8.7 33–55 1.5 0.2 1.2 17.2 55–81 1.5 0.3 1.6 11.3
81–119 1.4 0.3 1.4 10.2 119–150+ 1.5 0.3 1.6 18.6
1. BD: Bulk Density 2. COLE: Coefficient of Linear Extensibility 3. HC: Hydraulic Conductivity 4. WDC: Water Dispersible Clay
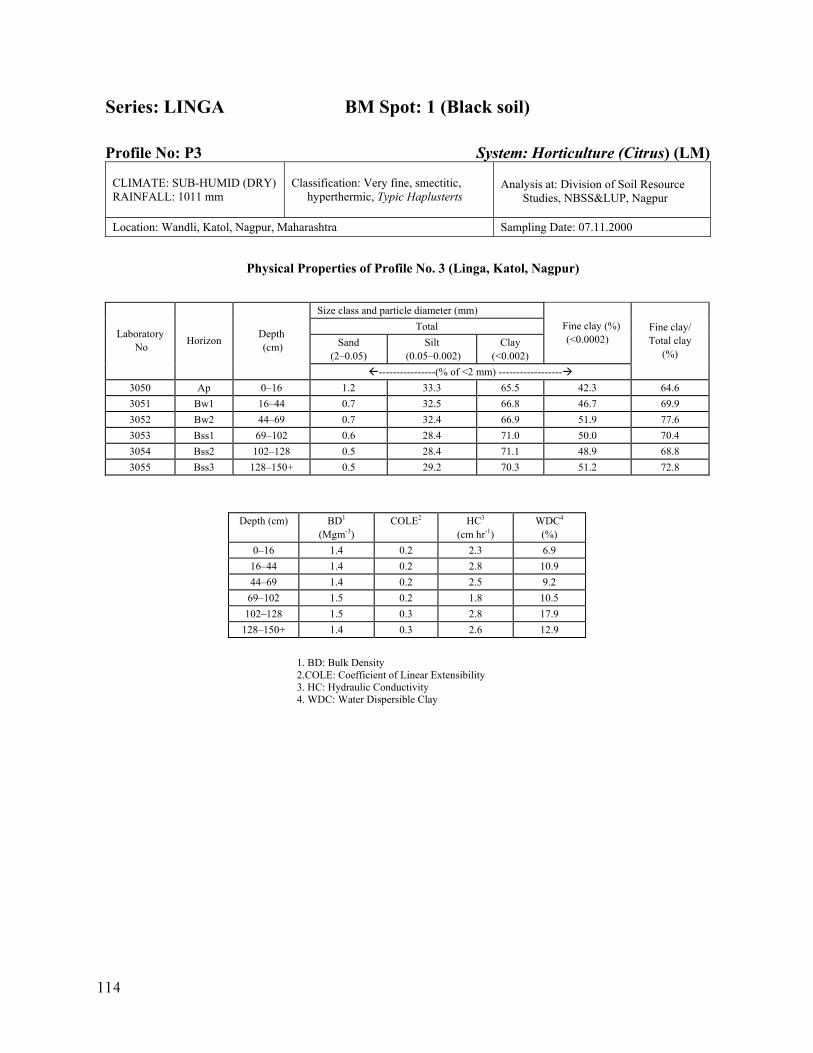
114
Series: LINGA BM Spot: 1 (Black soil) Profile No: P3 System: Horticulture (Citrus) (LM)
CLIMATE: SUB-HUMID (DRY) RAINFALL: 1011 mm
Classification: Very fine, smectitic, hyperthermic, Typic Haplusterts
Analysis at: Division of Soil Resource Studies, NBSS&LUP, Nagpur
Location: Wandli, Katol, Nagpur, Maharashtra Sampling Date: 07.11.2000
Physical Properties of Profile No. 3 (Linga, Katol, Nagpur)
Size class and particle diameter (mm) Total
Sand (2–0.05)
Silt (0.05–0.002)
Clay (<0.002)
Fine clay (%) (<0.0002) Laboratory
No Horizon Depth (cm)
----------------(% of <2 mm) ------------------
Fine clay/ Total clay
(%)
3050 Ap 0–16 1.2 33.3 65.5 42.3 64.6 3051 Bw1 16–44 0.7 32.5 66.8 46.7 69.9 3052 Bw2 44–69 0.7 32.4 66.9 51.9 77.6 3053 Bss1 69–102 0.6 28.4 71.0 50.0 70.4 3054 Bss2 102–128 0.5 28.4 71.1 48.9 68.8 3055 Bss3 128–150+ 0.5 29.2 70.3 51.2 72.8
Depth (cm) BD1
(Mgm-3) COLE2 HC3
(cm hr-1) WDC4
(%) 0–16 1.4 0.2 2.3 6.9 16–44 1.4 0.2 2.8 10.9 44–69 1.4 0.2 2.5 9.2
69–102 1.5 0.2 1.8 10.5 102–128 1.5 0.3 2.8 17.9
128–150+ 1.4 0.3 2.6 12.9
1. BD: Bulk Density 2.COLE: Coefficient of Linear Extensibility 3. HC: Hydraulic Conductivity 4. WDC: Water Dispersible Clay
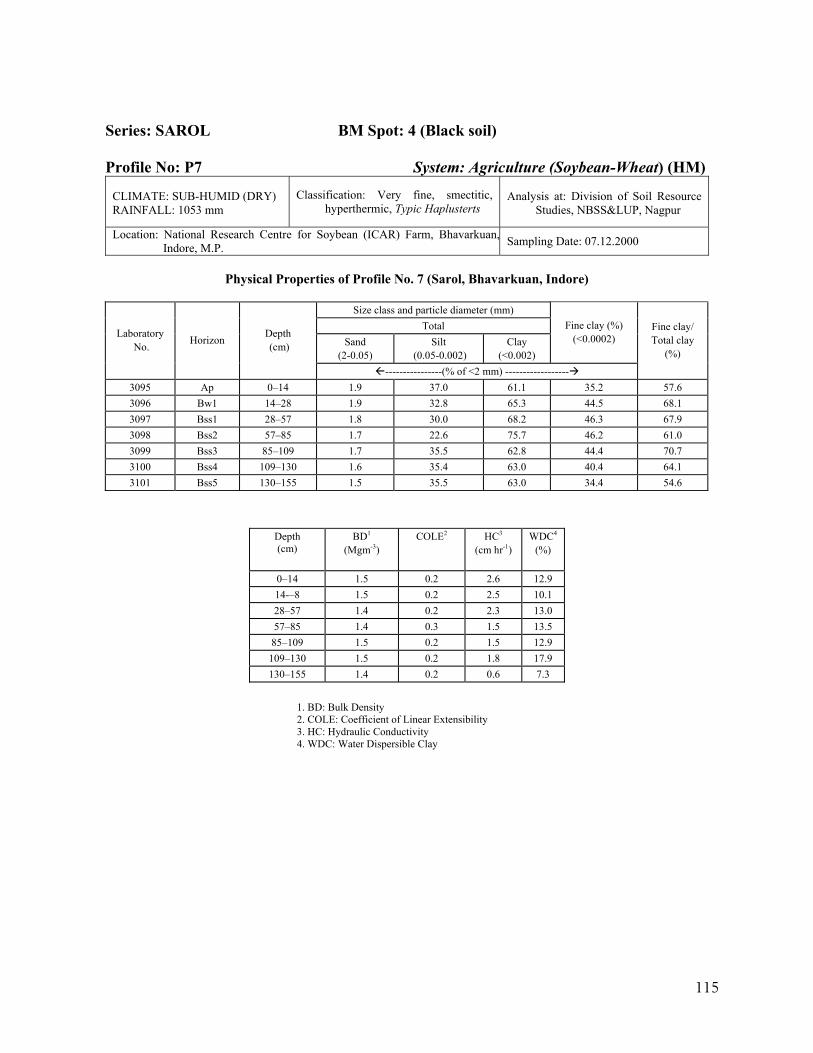
115
Series: SAROL BM Spot: 4 (Black soil) Profile No: P7 System: Agriculture (Soybean-Wheat) (HM)
CLIMATE: SUB-HUMID (DRY) RAINFALL: 1053 mm
Classification: Very fine, smectitic, hyperthermic, Typic Haplusterts
Analysis at: Division of Soil Resource Studies, NBSS&LUP, Nagpur
Location: National Research Centre for Soybean (ICAR) Farm, Bhavarkuan,Indore, M.P. Sampling Date: 07.12.2000
Physical Properties of Profile No. 7 (Sarol, Bhavarkuan, Indore)
Size class and particle diameter (mm)
Total Sand
(2-0.05) Silt
(0.05-0.002) Clay
(<0.002)
Fine clay (%) (<0.0002) Laboratory
No. Horizon Depth (cm)
----------------(% of <2 mm) ------------------
Fine clay/ Total clay
(%)
3095 Ap 0–14 1.9 37.0 61.1 35.2 57.6 3096 Bw1 14–28 1.9 32.8 65.3 44.5 68.1 3097 Bss1 28–57 1.8 30.0 68.2 46.3 67.9 3098 Bss2 57–85 1.7 22.6 75.7 46.2 61.0 3099 Bss3 85–109 1.7 35.5 62.8 44.4 70.7 3100 Bss4 109–130 1.6 35.4 63.0 40.4 64.1 3101 Bss5 130–155 1.5 35.5 63.0 34.4 54.6
Depth (cm)
BD1
(Mgm-3) COLE2 HC3
(cm hr-1) WDC4
(%)
0–14 1.5 0.2 2.6 12.9 14-–8 1.5 0.2 2.5 10.1 28–57 1.4 0.2 2.3 13.0 57–85 1.4 0.3 1.5 13.5
85–109 1.5 0.2 1.5 12.9 109–130 1.5 0.2 1.8 17.9 130–155 1.4 0.2 0.6 7.3
1. BD: Bulk Density 2. COLE: Coefficient of Linear Extensibility 3. HC: Hydraulic Conductivity 4. WDC: Water Dispersible Clay
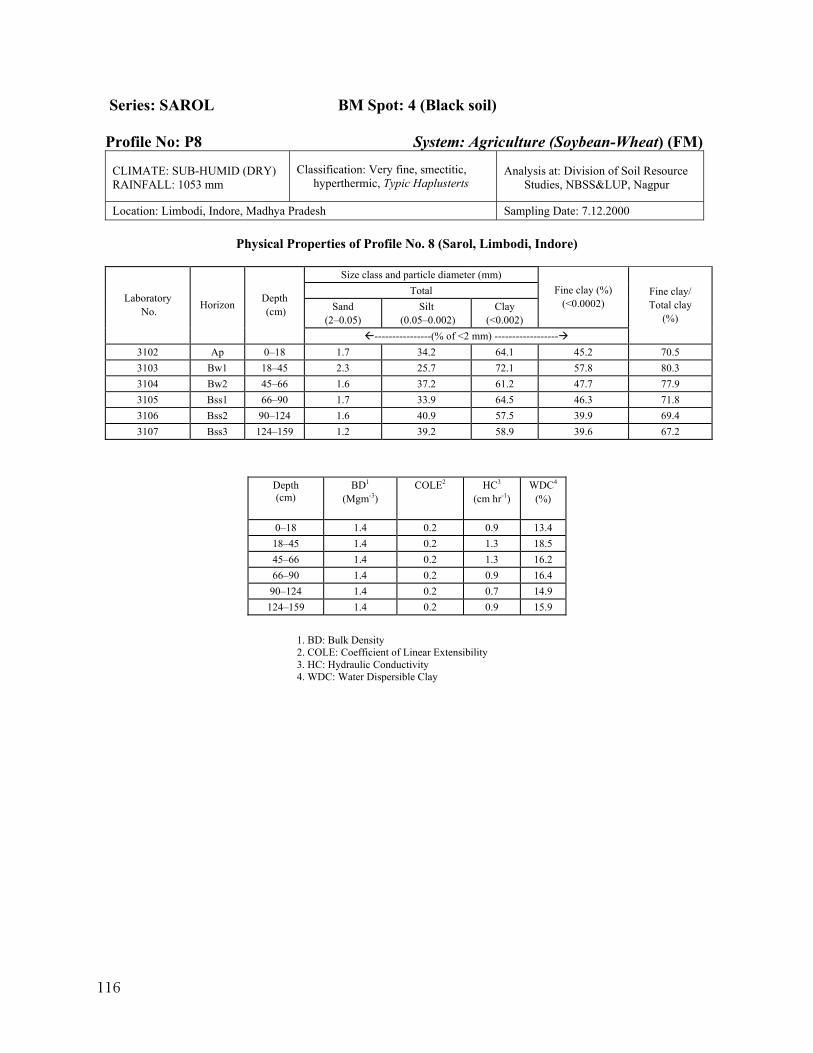
116
Series: SAROL BM Spot: 4 (Black soil) Profile No: P8 System: Agriculture (Soybean-Wheat) (FM)
CLIMATE: SUB-HUMID (DRY) RAINFALL: 1053 mm
Classification: Very fine, smectitic, hyperthermic, Typic Haplusterts
Analysis at: Division of Soil Resource Studies, NBSS&LUP, Nagpur
Location: Limbodi, Indore, Madhya Pradesh Sampling Date: 7.12.2000
Physical Properties of Profile No. 8 (Sarol, Limbodi, Indore)
Size class and particle diameter (mm) Total
Sand (2–0.05)
Silt (0.05–0.002)
Clay (<0.002)
Fine clay (%) (<0.0002) Laboratory
No. Horizon Depth (cm)
----------------(% of <2 mm) ------------------
Fine clay/ Total clay
(%)
3102 Ap 0–18 1.7 34.2 64.1 45.2 70.5 3103 Bw1 18–45 2.3 25.7 72.1 57.8 80.3 3104 Bw2 45–66 1.6 37.2 61.2 47.7 77.9 3105 Bss1 66–90 1.7 33.9 64.5 46.3 71.8 3106 Bss2 90–124 1.6 40.9 57.5 39.9 69.4 3107 Bss3 124–159 1.2 39.2 58.9 39.6 67.2
Depth (cm)
BD1
(Mgm-3) COLE2 HC3
(cm hr-1) WDC4
(%)
0–18 1.4 0.2 0.9 13.4 18–45 1.4 0.2 1.3 18.5 45–66 1.4 0.2 1.3 16.2 66–90 1.4 0.2 0.9 16.4
90–124 1.4 0.2 0.7 14.9 124–159 1.4 0.2 0.9 15.9
1. BD: Bulk Density 2. COLE: Coefficient of Linear Extensibility 3. HC: Hydraulic Conductivity 4. WDC: Water Dispersible Clay
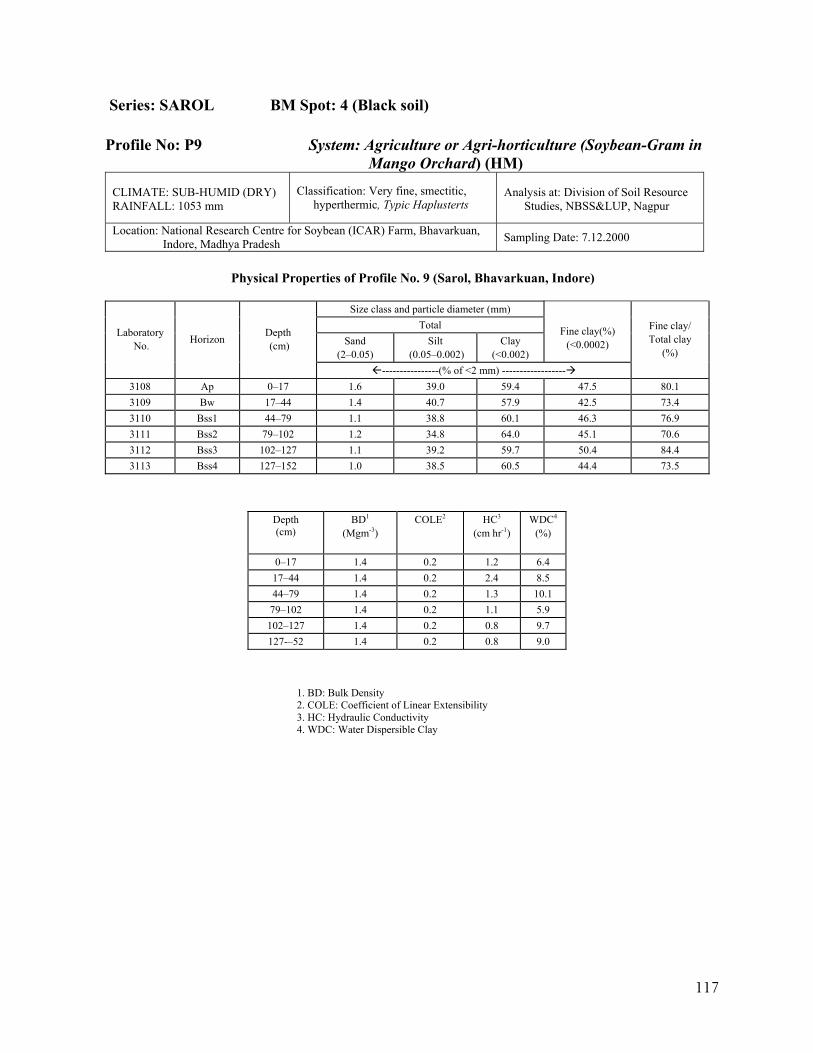
117
Series: SAROL BM Spot: 4 (Black soil) Profile No: P9 System: Agriculture or Agri-horticulture (Soybean-Gram in
Mango Orchard) (HM)
CLIMATE: SUB-HUMID (DRY) RAINFALL: 1053 mm
Classification: Very fine, smectitic, hyperthermic, Typic Haplusterts
Analysis at: Division of Soil Resource Studies, NBSS&LUP, Nagpur
Location: National Research Centre for Soybean (ICAR) Farm, Bhavarkuan, Indore, Madhya Pradesh Sampling Date: 7.12.2000
Physical Properties of Profile No. 9 (Sarol, Bhavarkuan, Indore)
Size class and particle diameter (mm)
Total Sand
(2–0.05) Silt
(0.05–0.002) Clay
(<0.002)
Fine clay(%)
(<0.0002) Laboratory
No. Horizon Depth (cm)
----------------(% of <2 mm) ------------------
Fine clay/ Total clay
(%)
3108 Ap 0–17 1.6 39.0 59.4 47.5 80.1 3109 Bw 17–44 1.4 40.7 57.9 42.5 73.4 3110 Bss1 44–79 1.1 38.8 60.1 46.3 76.9 3111 Bss2 79–102 1.2 34.8 64.0 45.1 70.6 3112 Bss3 102–127 1.1 39.2 59.7 50.4 84.4 3113 Bss4 127–152 1.0 38.5 60.5 44.4 73.5
Depth (cm)
BD1
(Mgm-3) COLE2 HC3
(cm hr-1) WDC4
(%)
0–17 1.4 0.2 1.2 6.4 17–44 1.4 0.2 2.4 8.5 44–79 1.4 0.2 1.3 10.1
79–102 1.4 0.2 1.1 5.9 102–127 1.4 0.2 0.8 9.7 127-–52 1.4 0.2 0.8 9.0
1. BD: Bulk Density 2. COLE: Coefficient of Linear Extensibility 3. HC: Hydraulic Conductivity 4. WDC: Water Dispersible Clay
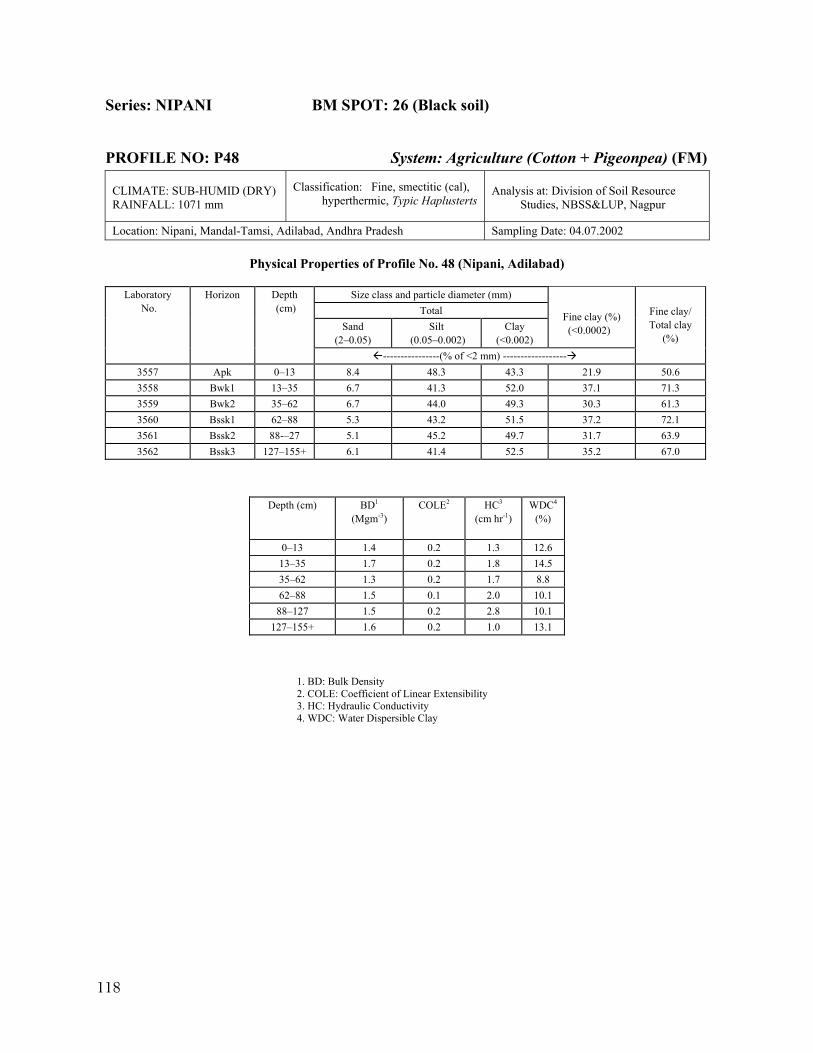
118
Series: NIPANI BM SPOT: 26 (Black soil)
PROFILE NO: P48 System: Agriculture (Cotton + Pigeonpea) (FM)
CLIMATE: SUB-HUMID (DRY) RAINFALL: 1071 mm
Classification: Fine, smectitic (cal), hyperthermic, Typic Haplusterts
Analysis at: Division of Soil Resource Studies, NBSS&LUP, Nagpur
Location: Nipani, Mandal-Tamsi, Adilabad, Andhra Pradesh Sampling Date: 04.07.2002
Physical Properties of Profile No. 48 (Nipani, Adilabad)
Size class and particle diameter (mm) Total
Sand (2–0.05)
Silt (0.05–0.002)
Clay (<0.002)
Fine clay (%) (<0.0002)
Laboratory No.
Horizon Depth (cm)
----------------(% of <2 mm) ------------------
Fine clay/ Total clay
(%)
3557 Apk 0–13 8.4 48.3 43.3 21.9 50.6 3558 Bwk1 13–35 6.7 41.3 52.0 37.1 71.3 3559 Bwk2 35–62 6.7 44.0 49.3 30.3 61.3 3560 Bssk1 62–88 5.3 43.2 51.5 37.2 72.1 3561 Bssk2 88-–27 5.1 45.2 49.7 31.7 63.9 3562 Bssk3 127–155+ 6.1 41.4 52.5 35.2 67.0
Depth (cm) BD1
(Mgm-3) COLE2 HC3
(cm hr-1) WDC4
(%)
0–13 1.4 0.2 1.3 12.6 13–35 1.7 0.2 1.8 14.5 35–62 1.3 0.2 1.7 8.8 62–88 1.5 0.1 2.0 10.1 88–127 1.5 0.2 2.8 10.1
127–155+ 1.6 0.2 1.0 13.1
1. BD: Bulk Density 2. COLE: Coefficient of Linear Extensibility 3. HC: Hydraulic Conductivity 4. WDC: Water Dispersible Clay
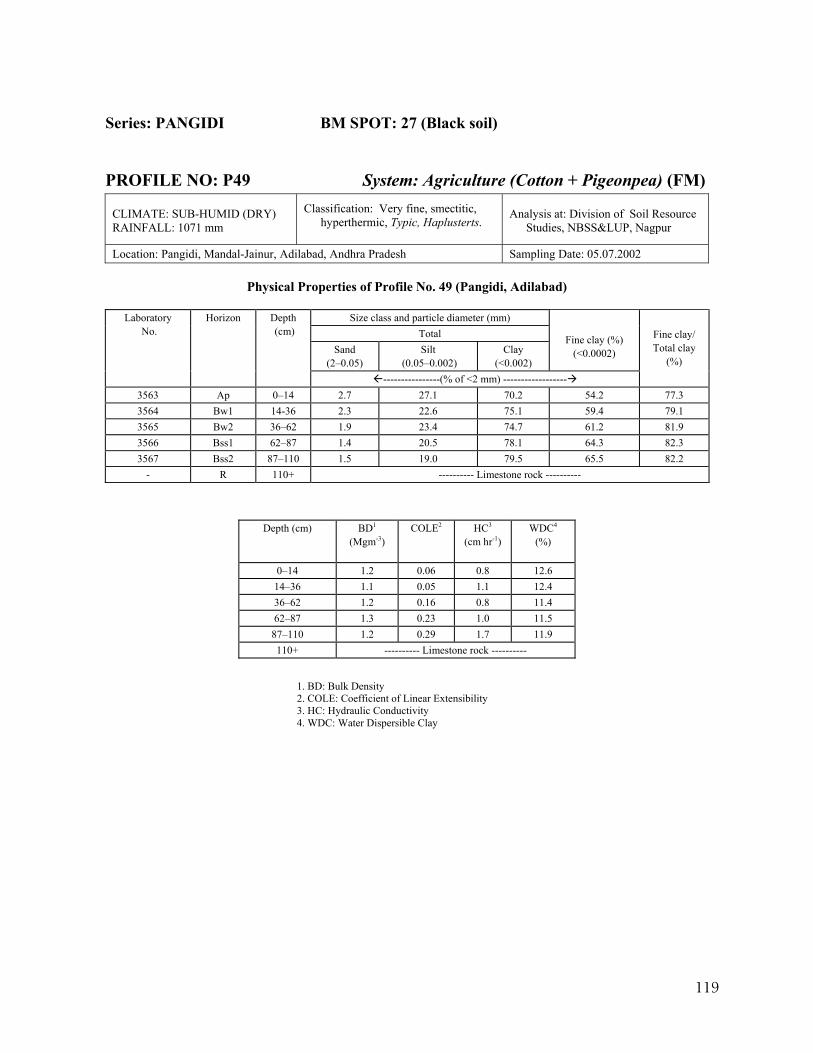
119
Series: PANGIDI BM SPOT: 27 (Black soil)
PROFILE NO: P49 System: Agriculture (Cotton + Pigeonpea) (FM)
CLIMATE: SUB-HUMID (DRY) RAINFALL: 1071 mm
Classification: Very fine, smectitic, hyperthermic, Typic, Haplusterts.
Analysis at: Division of Soil Resource Studies, NBSS&LUP, Nagpur
Location: Pangidi, Mandal-Jainur, Adilabad, Andhra Pradesh Sampling Date: 05.07.2002
Physical Properties of Profile No. 49 (Pangidi, Adilabad)
Size class and particle diameter (mm) Total
Sand (2–0.05)
Silt (0.05–0.002)
Clay (<0.002)
Fine clay (%)
(<0.0002)
Laboratory No.
Horizon Depth (cm)
----------------(% of <2 mm) ------------------
Fine clay/ Total clay
(%)
3563 Ap 0–14 2.7 27.1 70.2 54.2 77.3 3564 Bw1 14-36 2.3 22.6 75.1 59.4 79.1 3565 Bw2 36–62 1.9 23.4 74.7 61.2 81.9 3566 Bss1 62–87 1.4 20.5 78.1 64.3 82.3 3567 Bss2 87–110 1.5 19.0 79.5 65.5 82.2
- R 110+ ---------- Limestone rock ----------
Depth (cm) BD1
(Mgm-3) COLE2 HC3
(cm hr-1) WDC4
(%)
0–14 1.2 0.06 0.8 12.6 14–36 1.1 0.05 1.1 12.4 36–62 1.2 0.16 0.8 11.4 62–87 1.3 0.23 1.0 11.5 87–110 1.2 0.29 1.7 11.9 110+ ---------- Limestone rock ----------
1. BD: Bulk Density 2. COLE: Coefficient of Linear Extensibility 3. HC: Hydraulic Conductivity 4. WDC: Water Dispersible Clay
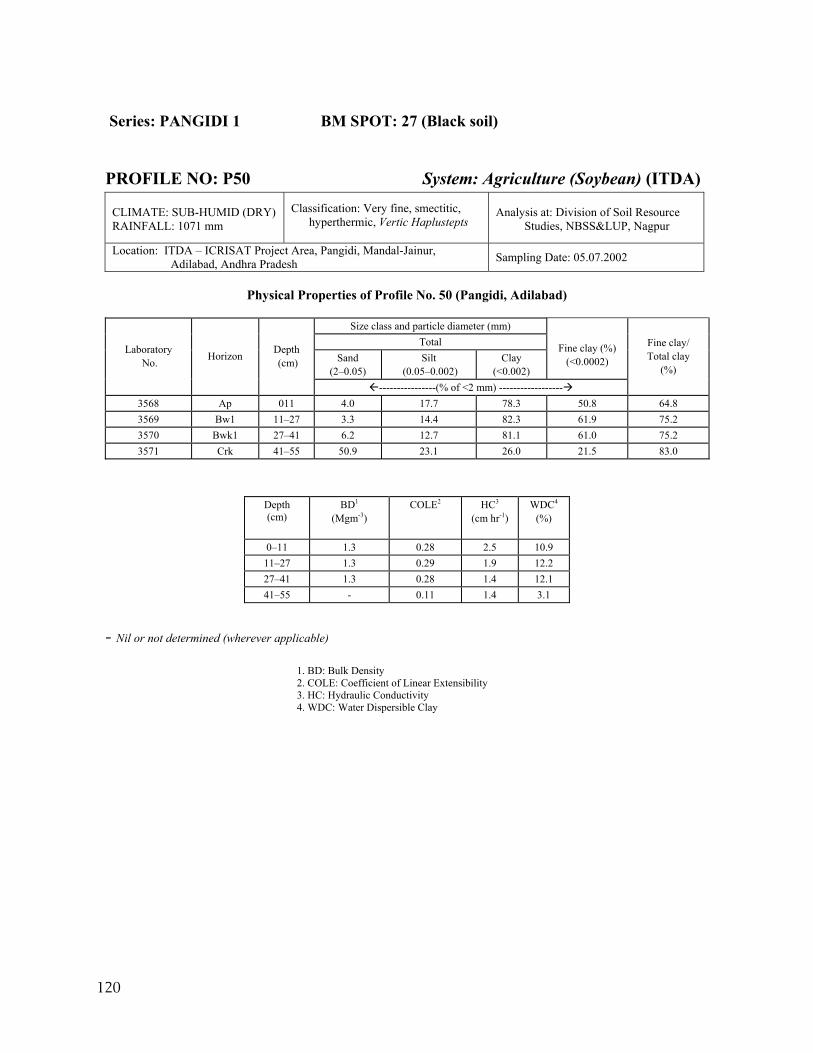
120
Series: PANGIDI 1 BM SPOT: 27 (Black soil)
PROFILE NO: P50 System: Agriculture (Soybean) (ITDA) CLIMATE: SUB-HUMID (DRY) RAINFALL: 1071 mm
Classification: Very fine, smectitic, hyperthermic, Vertic Haplustepts
Analysis at: Division of Soil Resource Studies, NBSS&LUP, Nagpur
Location: ITDA – ICRISAT Project Area, Pangidi, Mandal-Jainur, Adilabad, Andhra Pradesh Sampling Date: 05.07.2002
Physical Properties of Profile No. 50 (Pangidi, Adilabad)
Size class and particle diameter (mm)
Total Sand
(2–0.05) Silt
(0.05–0.002) Clay
(<0.002)
Fine clay (%)
(<0.0002) Laboratory
No. Horizon Depth (cm)
----------------(% of <2 mm) ------------------
Fine clay/ Total clay
(%)
3568 Ap 011 4.0 17.7 78.3 50.8 64.8 3569 Bw1 11–27 3.3 14.4 82.3 61.9 75.2 3570 Bwk1 27–41 6.2 12.7 81.1 61.0 75.2 3571 Crk 41–55 50.9 23.1 26.0 21.5 83.0
Depth (cm)
BD1
(Mgm-3) COLE2 HC3
(cm hr-1) WDC4
(%)
0–11 1.3 0.28 2.5 10.9 11–27 1.3 0.29 1.9 12.2 27–41 1.3 0.28 1.4 12.1 41–55 - 0.11 1.4 3.1
- Nil or not determined (wherever applicable)
1. BD: Bulk Density 2. COLE: Coefficient of Linear Extensibility 3. HC: Hydraulic Conductivity 4. WDC: Water Dispersible Clay
121
BLACK SOILS
(Semi-arid moist)
(MAR > 1000–850 mm)
Benchmark Spots: 5, 22
No. of Pedons: 4 (P10, P11, P12, P42)
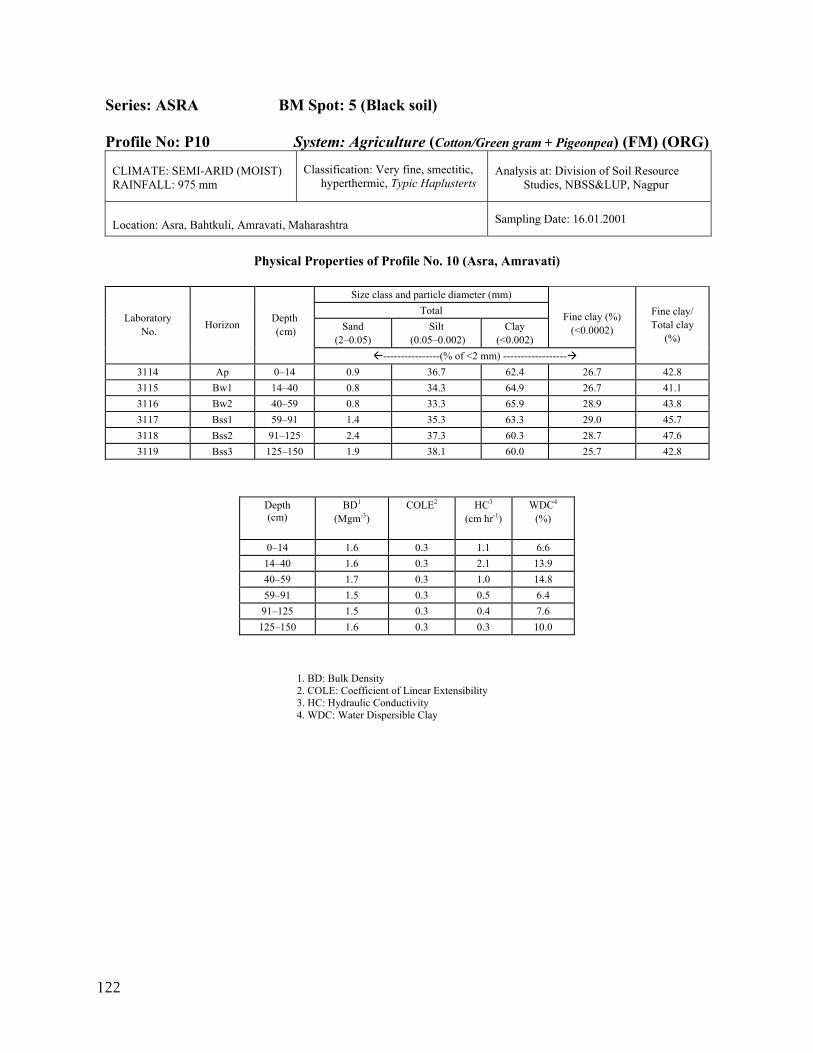
122
Series: ASRA BM Spot: 5 (Black soil) Profile No: P10 System: Agriculture (Cotton/Green gram + Pigeonpea) (FM) (ORG)
CLIMATE: SEMI-ARID (MOIST) RAINFALL: 975 mm
Classification: Very fine, smectitic, hyperthermic, Typic Haplusterts
Analysis at: Division of Soil Resource Studies, NBSS&LUP, Nagpur
Location: Asra, Bahtkuli, Amravati, Maharashtra Sampling Date: 16.01.2001
Physical Properties of Profile No. 10 (Asra, Amravati)
Size class and particle diameter (mm)
Total Sand
(2–0.05) Silt
(0.05–0.002) Clay
(<0.002)
Fine clay (%)
(<0.0002) Laboratory
No. Horizon Depth (cm)
----------------(% of <2 mm) ------------------
Fine clay/ Total clay
(%)
3114 Ap 0–14 0.9 36.7 62.4 26.7 42.8 3115 Bw1 14–40 0.8 34.3 64.9 26.7 41.1 3116 Bw2 40–59 0.8 33.3 65.9 28.9 43.8 3117 Bss1 59–91 1.4 35.3 63.3 29.0 45.7 3118 Bss2 91–125 2.4 37.3 60.3 28.7 47.6 3119 Bss3 125–150 1.9 38.1 60.0 25.7 42.8
Depth (cm)
BD1
(Mgm-3) COLE2 HC3
(cm hr-1) WDC4
(%)
0–14 1.6 0.3 1.1 6.6 14–40 1.6 0.3 2.1 13.9 40–59 1.7 0.3 1.0 14.8 59–91 1.5 0.3 0.5 6.4
91–125 1.5 0.3 0.4 7.6 125–150 1.6 0.3 0.3 10.0
1. BD: Bulk Density 2. COLE: Coefficient of Linear Extensibility 3. HC: Hydraulic Conductivity 4. WDC: Water Dispersible Clay
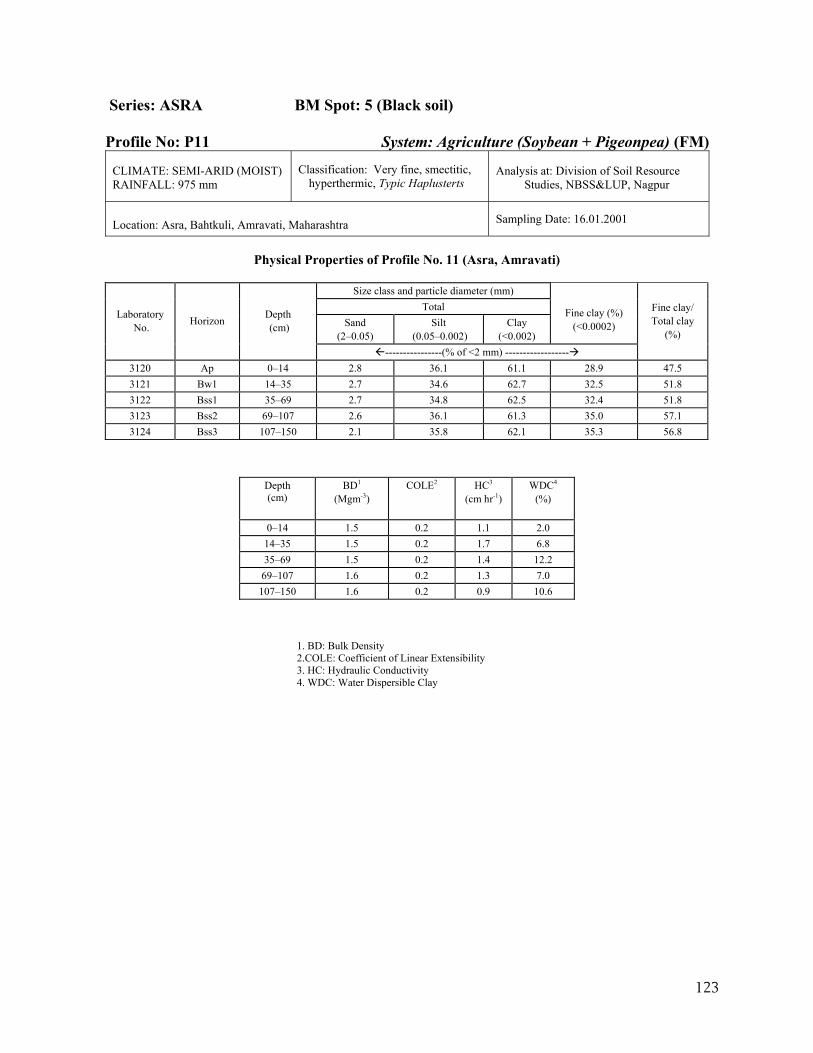
123
Series: ASRA BM Spot: 5 (Black soil) Profile No: P11 System: Agriculture (Soybean + Pigeonpea) (FM)
CLIMATE: SEMI-ARID (MOIST) RAINFALL: 975 mm
Classification: Very fine, smectitic, hyperthermic, Typic Haplusterts
Analysis at: Division of Soil Resource Studies, NBSS&LUP, Nagpur
Location: Asra, Bahtkuli, Amravati, Maharashtra Sampling Date: 16.01.2001
Physical Properties of Profile No. 11 (Asra, Amravati)
Size class and particle diameter (mm)
Total Sand
(2–0.05) Silt
(0.05–0.002) Clay
(<0.002)
Fine clay (%)
(<0.0002) Laboratory
No. Horizon Depth (cm)
----------------(% of <2 mm) ------------------
Fine clay/ Total clay
(%)
3120 Ap 0–14 2.8 36.1 61.1 28.9 47.5 3121 Bw1 14–35 2.7 34.6 62.7 32.5 51.8 3122 Bss1 35–69 2.7 34.8 62.5 32.4 51.8 3123 Bss2 69–107 2.6 36.1 61.3 35.0 57.1 3124 Bss3 107–150 2.1 35.8 62.1 35.3 56.8
Depth (cm)
BD1
(Mgm-3) COLE2 HC3
(cm hr-1) WDC4
(%)
0–14 1.5 0.2 1.1 2.0 14–35 1.5 0.2 1.7 6.8 35–69 1.5 0.2 1.4 12.2
69–107 1.6 0.2 1.3 7.0 107–150 1.6 0.2 0.9 10.6
1. BD: Bulk Density 2.COLE: Coefficient of Linear Extensibility 3. HC: Hydraulic Conductivity 4. WDC: Water Dispersible Clay
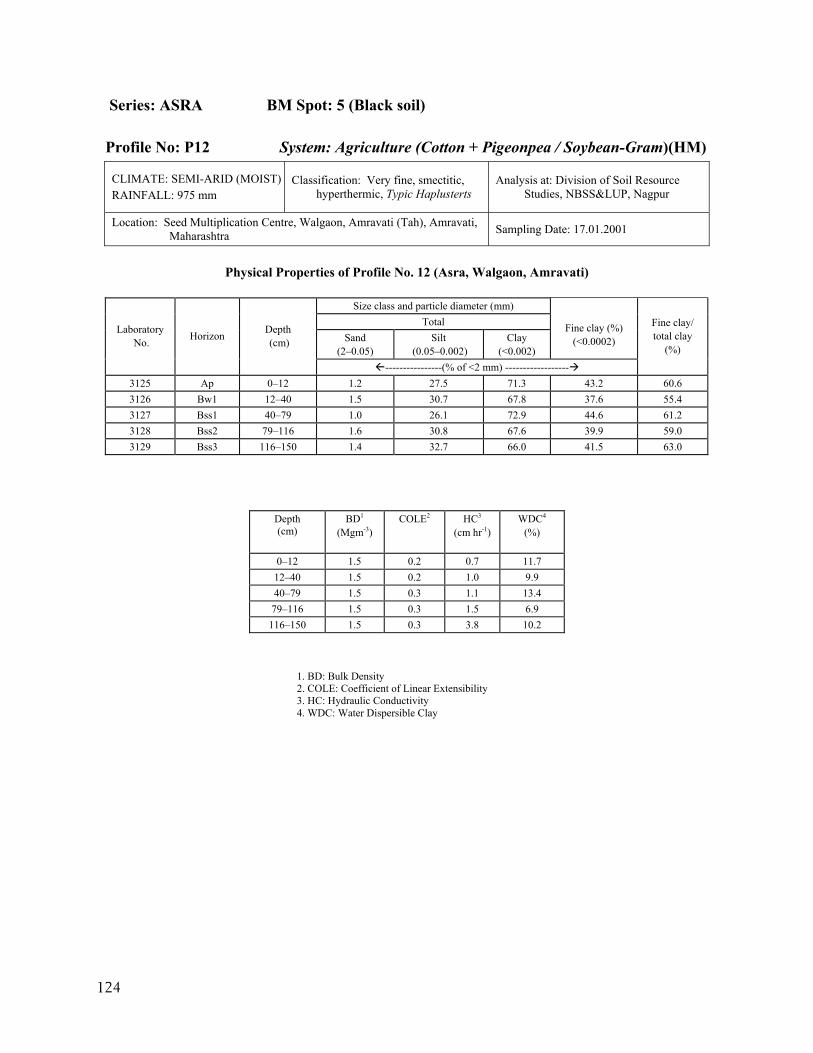
124
Series: ASRA BM Spot: 5 (Black soil) Profile No: P12 System: Agriculture (Cotton + Pigeonpea / Soybean-Gram)(HM)
CLIMATE: SEMI-ARID (MOIST) RAINFALL: 975 mm
Classification: Very fine, smectitic, hyperthermic, Typic Haplusterts
Analysis at: Division of Soil Resource Studies, NBSS&LUP, Nagpur
Location: Seed Multiplication Centre, Walgaon, Amravati (Tah), Amravati, Maharashtra Sampling Date: 17.01.2001
Physical Properties of Profile No. 12 (Asra, Walgaon, Amravati)
Size class and particle diameter (mm)
Total Sand
(2–0.05) Silt
(0.05–0.002) Clay
(<0.002)
Fine clay (%)
(<0.0002) Laboratory
No. Horizon Depth (cm)
----------------(% of <2 mm) ------------------
Fine clay/ total clay
(%)
3125 Ap 0–12 1.2 27.5 71.3 43.2 60.6 3126 Bw1 12–40 1.5 30.7 67.8 37.6 55.4 3127 Bss1 40–79 1.0 26.1 72.9 44.6 61.2 3128 Bss2 79–116 1.6 30.8 67.6 39.9 59.0 3129 Bss3 116–150 1.4 32.7 66.0 41.5 63.0
Depth (cm)
BD1
(Mgm-3) COLE2 HC3
(cm hr-1) WDC4
(%)
0–12 1.5 0.2 0.7 11.7 12–40 1.5 0.2 1.0 9.9 40–79 1.5 0.3 1.1 13.4 79–116 1.5 0.3 1.5 6.9
116–150 1.5 0.3 3.8 10.2
1. BD: Bulk Density 2. COLE: Coefficient of Linear Extensibility 3. HC: Hydraulic Conductivity 4. WDC: Water Dispersible Clay
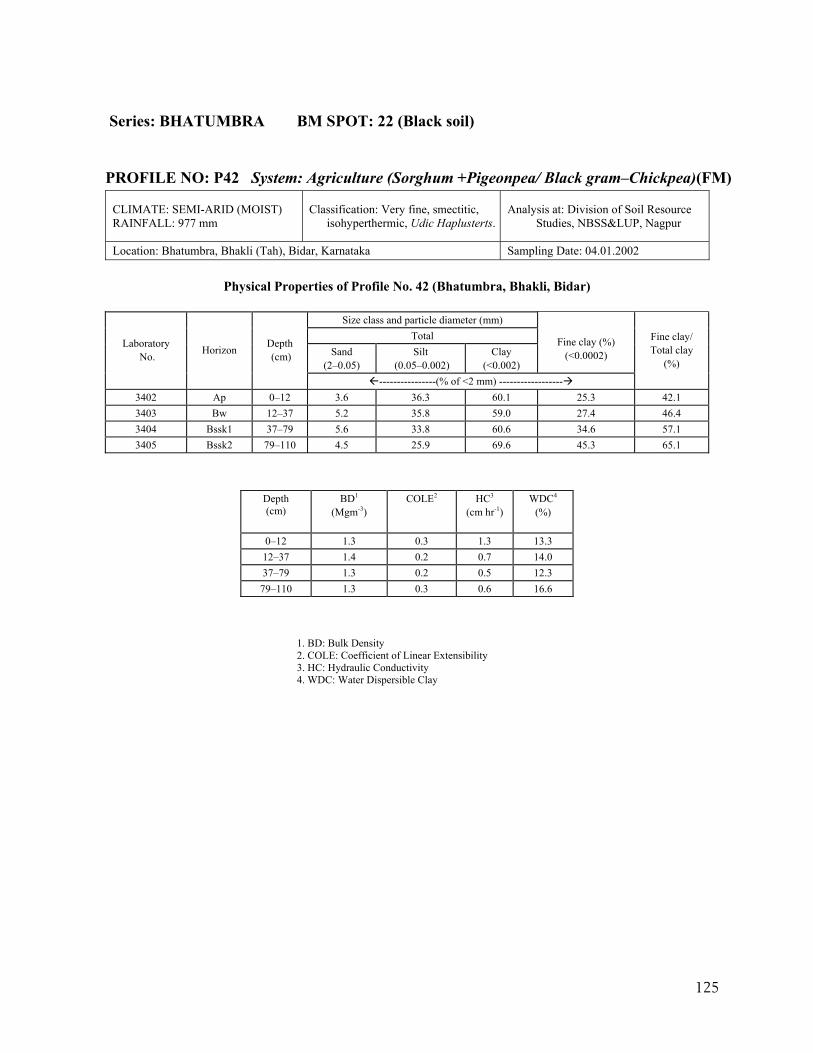
125
Series: BHATUMBRA BM SPOT: 22 (Black soil)
PROFILE NO: P42 System: Agriculture (Sorghum +Pigeonpea/ Black gram–Chickpea)(FM)
CLIMATE: SEMI-ARID (MOIST) RAINFALL: 977 mm
Classification: Very fine, smectitic, isohyperthermic, Udic Haplusterts.
Analysis at: Division of Soil Resource Studies, NBSS&LUP, Nagpur
Location: Bhatumbra, Bhakli (Tah), Bidar, Karnataka Sampling Date: 04.01.2002
Physical Properties of Profile No. 42 (Bhatumbra, Bhakli, Bidar)
Size class and particle diameter (mm) Total
Sand (2–0.05)
Silt (0.05–0.002)
Clay (<0.002)
Fine clay (%)
(<0.0002) Laboratory
No. Horizon Depth (cm)
----------------(% of <2 mm) ------------------
Fine clay/ Total clay
(%)
3402 Ap 0–12 3.6 36.3 60.1 25.3 42.1 3403 Bw 12–37 5.2 35.8 59.0 27.4 46.4 3404 Bssk1 37–79 5.6 33.8 60.6 34.6 57.1 3405 Bssk2 79–110 4.5 25.9 69.6 45.3 65.1
Depth (cm)
BD1
(Mgm-3) COLE2 HC3
(cm hr-1) WDC4
(%)
0–12 1.3 0.3 1.3 13.3 12–37 1.4 0.2 0.7 14.0 37–79 1.3 0.2 0.5 12.3 79–110 1.3 0.3 0.6 16.6
1. BD: Bulk Density 2. COLE: Coefficient of Linear Extensibility 3. HC: Hydraulic Conductivity 4. WDC: Water Dispersible Clay

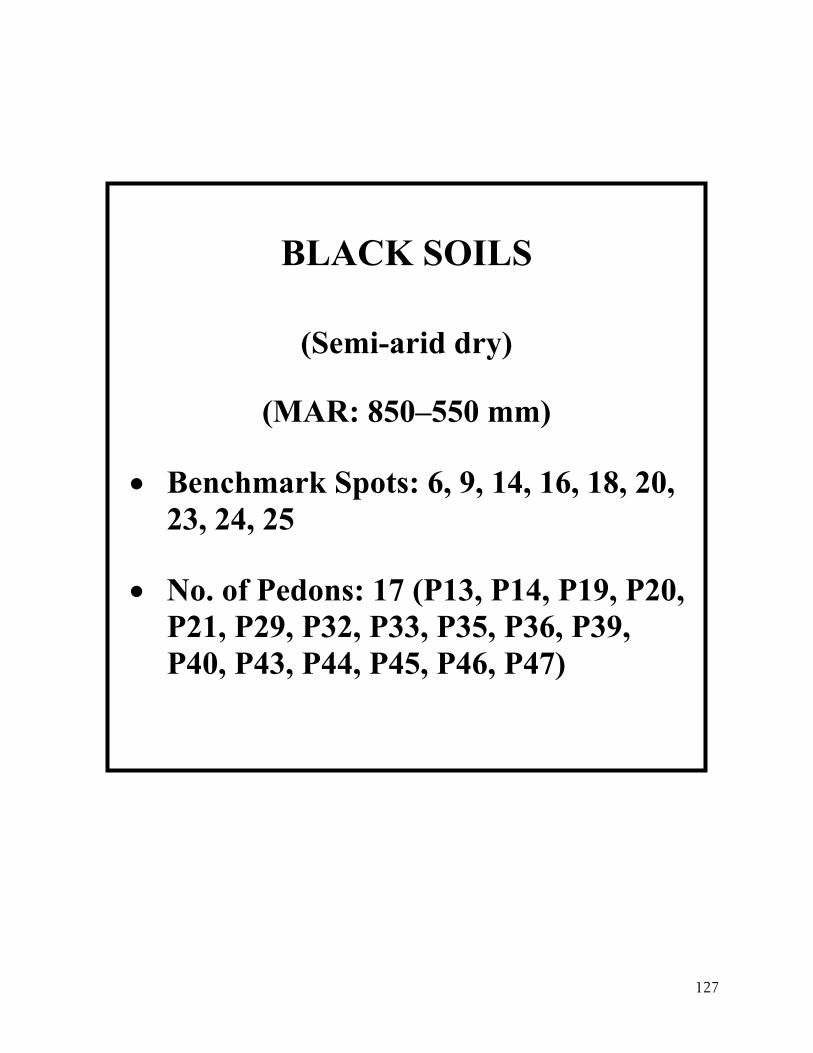
127
BLACK SOILS
(Semi-arid dry)
(MAR: 850–550 mm)
Benchmark Spots: 6, 9, 14, 16, 18, 20, 23, 24, 25
No. of Pedons: 17 (P13, P14, P19, P20, P21, P29, P32, P33, P35, P36, P39, P40, P43, P44, P45, P46, P47)
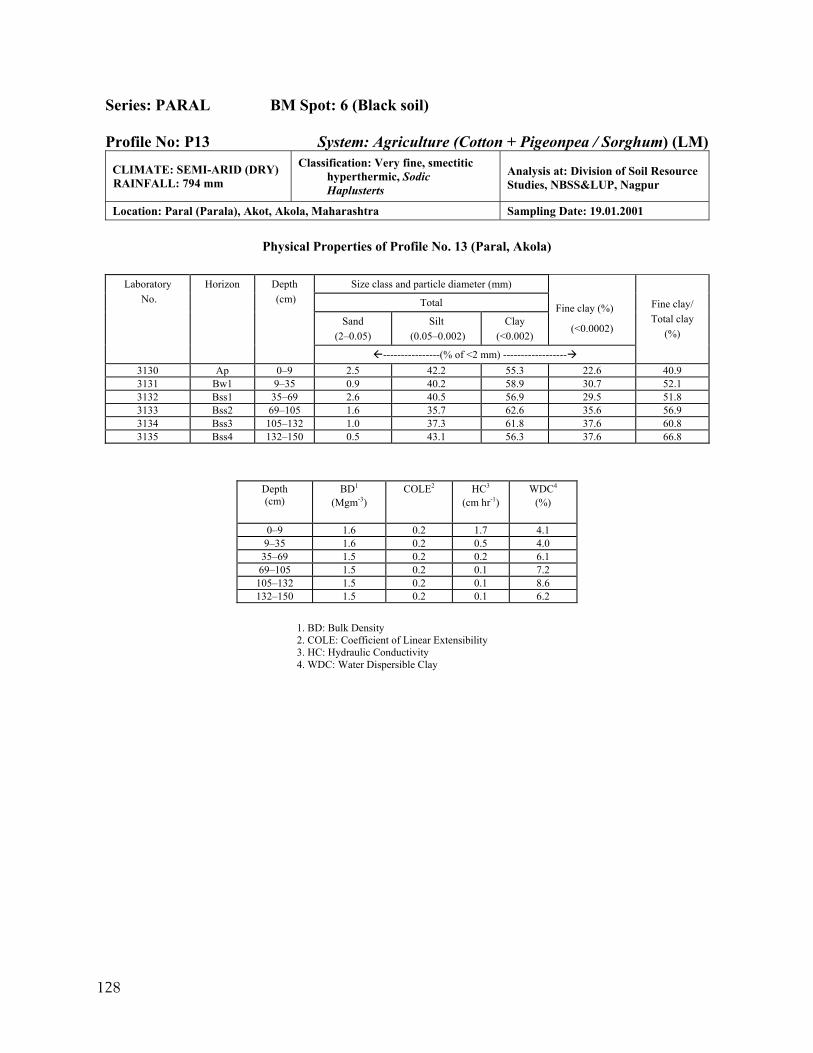
128
Series: PARAL BM Spot: 6 (Black soil) Profile No: P13 System: Agriculture (Cotton + Pigeonpea / Sorghum) (LM)
CLIMATE: SEMI-ARID (DRY) RAINFALL: 794 mm
Classification: Very fine, smectitic hyperthermic, Sodic Haplusterts
Analysis at: Division of Soil Resource Studies, NBSS&LUP, Nagpur
Location: Paral (Parala), Akot, Akola, Maharashtra Sampling Date: 19.01.2001
Physical Properties of Profile No. 13 (Paral, Akola)
Size class and particle diameter (mm)
Total
Sand (2–0.05)
Silt (0.05–0.002)
Clay (<0.002)
Fine clay (%)
(<0.0002)
Laboratory No.
Horizon Depth (cm)
----------------(% of <2 mm) ------------------
Fine clay/ Total clay
(%)
3130 Ap 0–9 2.5 42.2 55.3 22.6 40.9 3131 Bw1 9–35 0.9 40.2 58.9 30.7 52.1 3132 Bss1 35–69 2.6 40.5 56.9 29.5 51.8 3133 Bss2 69–105 1.6 35.7 62.6 35.6 56.9 3134 Bss3 105–132 1.0 37.3 61.8 37.6 60.8 3135 Bss4 132–150 0.5 43.1 56.3 37.6 66.8
Depth (cm)
BD1
(Mgm-3) COLE2 HC3
(cm hr-1) WDC4
(%)
0–9 1.6 0.2 1.7 4.1 9–35 1.6 0.2 0.5 4.0 35–69 1.5 0.2 0.2 6.1 69–105 1.5 0.2 0.1 7.2
105–132 1.5 0.2 0.1 8.6 132–150 1.5 0.2 0.1 6.2
1. BD: Bulk Density 2. COLE: Coefficient of Linear Extensibility 3. HC: Hydraulic Conductivity 4. WDC: Water Dispersible Clay
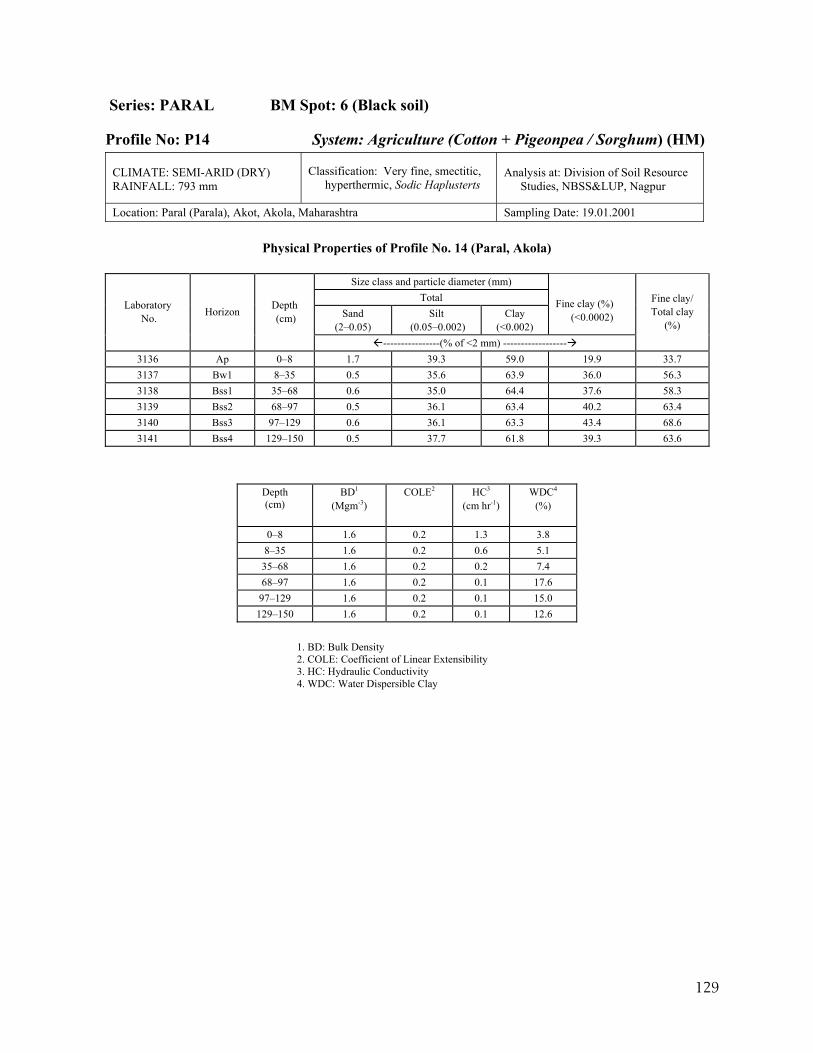
129
Series: PARAL BM Spot: 6 (Black soil)
Profile No: P14 System: Agriculture (Cotton + Pigeonpea / Sorghum) (HM)
CLIMATE: SEMI-ARID (DRY) RAINFALL: 793 mm
Classification: Very fine, smectitic, hyperthermic, Sodic Haplusterts
Analysis at: Division of Soil Resource Studies, NBSS&LUP, Nagpur
Location: Paral (Parala), Akot, Akola, Maharashtra Sampling Date: 19.01.2001
Physical Properties of Profile No. 14 (Paral, Akola)
Size class and particle diameter (mm) Total
Sand (2–0.05)
Silt (0.05–0.002)
Clay (<0.002)
Fine clay (%)
(<0.0002) Laboratory
No. Horizon Depth (cm)
----------------(% of <2 mm) ------------------
Fine clay/ Total clay
(%)
3136 Ap 0–8 1.7 39.3 59.0 19.9 33.7 3137 Bw1 8–35 0.5 35.6 63.9 36.0 56.3 3138 Bss1 35–68 0.6 35.0 64.4 37.6 58.3 3139 Bss2 68–97 0.5 36.1 63.4 40.2 63.4 3140 Bss3 97–129 0.6 36.1 63.3 43.4 68.6 3141 Bss4 129–150 0.5 37.7 61.8 39.3 63.6
Depth (cm)
BD1
(Mgm-3) COLE2 HC3
(cm hr-1) WDC4
(%)
0–8 1.6 0.2 1.3 3.8 8–35 1.6 0.2 0.6 5.1 35–68 1.6 0.2 0.2 7.4 68–97 1.6 0.2 0.1 17.6
97–129 1.6 0.2 0.1 15.0 129–150 1.6 0.2 0.1 12.6
1. BD: Bulk Density 2. COLE: Coefficient of Linear Extensibility 3. HC: Hydraulic Conductivity 4. WDC: Water Dispersible Clay
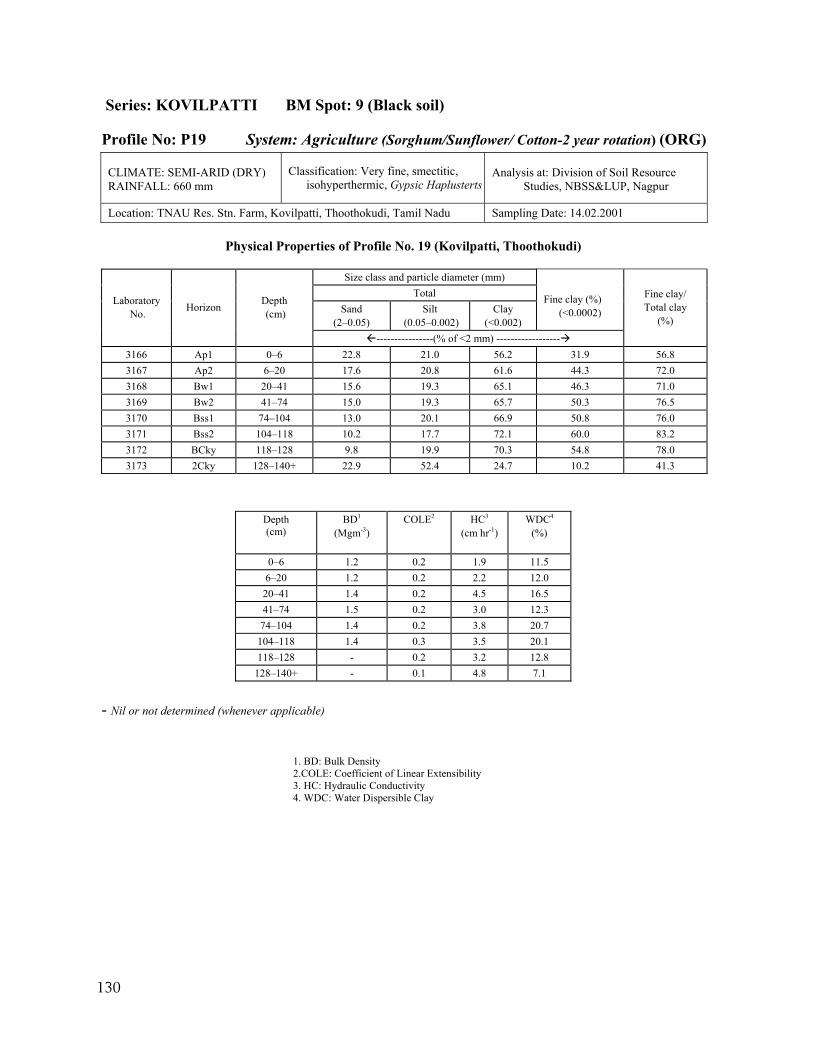
130
Series: KOVILPATTI BM Spot: 9 (Black soil)
Profile No: P19 System: Agriculture (Sorghum/Sunflower/ Cotton-2 year rotation) (ORG)
CLIMATE: SEMI-ARID (DRY) RAINFALL: 660 mm
Classification: Very fine, smectitic, isohyperthermic, Gypsic Haplusterts
Analysis at: Division of Soil Resource Studies, NBSS&LUP, Nagpur
Location: TNAU Res. Stn. Farm, Kovilpatti, Thoothokudi, Tamil Nadu Sampling Date: 14.02.2001
Physical Properties of Profile No. 19 (Kovilpatti, Thoothokudi)
Size class and particle diameter (mm) Total
Sand (2–0.05)
Silt (0.05–0.002)
Clay (<0.002)
Fine clay (%)
(<0.0002) Laboratory
No. Horizon Depth (cm)
----------------(% of <2 mm) ------------------
Fine clay/ Total clay
(%)
3166 Ap1 0–6 22.8 21.0 56.2 31.9 56.8 3167 Ap2 6–20 17.6 20.8 61.6 44.3 72.0 3168 Bw1 20–41 15.6 19.3 65.1 46.3 71.0 3169 Bw2 41–74 15.0 19.3 65.7 50.3 76.5 3170 Bss1 74–104 13.0 20.1 66.9 50.8 76.0 3171 Bss2 104–118 10.2 17.7 72.1 60.0 83.2 3172 BCky 118–128 9.8 19.9 70.3 54.8 78.0 3173 2Cky 128–140+ 22.9 52.4 24.7 10.2 41.3
Depth (cm)
BD1
(Mgm-3) COLE2 HC3
(cm hr-1) WDC4
(%)
0–6 1.2 0.2 1.9 11.5 6–20 1.2 0.2 2.2 12.0 20–41 1.4 0.2 4.5 16.5 41–74 1.5 0.2 3.0 12.3 74–104 1.4 0.2 3.8 20.7
104–118 1.4 0.3 3.5 20.1 118–128 - 0.2 3.2 12.8
128–140+ - 0.1 4.8 7.1
- Nil or not determined (whenever applicable)
1. BD: Bulk Density 2.COLE: Coefficient of Linear Extensibility 3. HC: Hydraulic Conductivity 4. WDC: Water Dispersible Clay
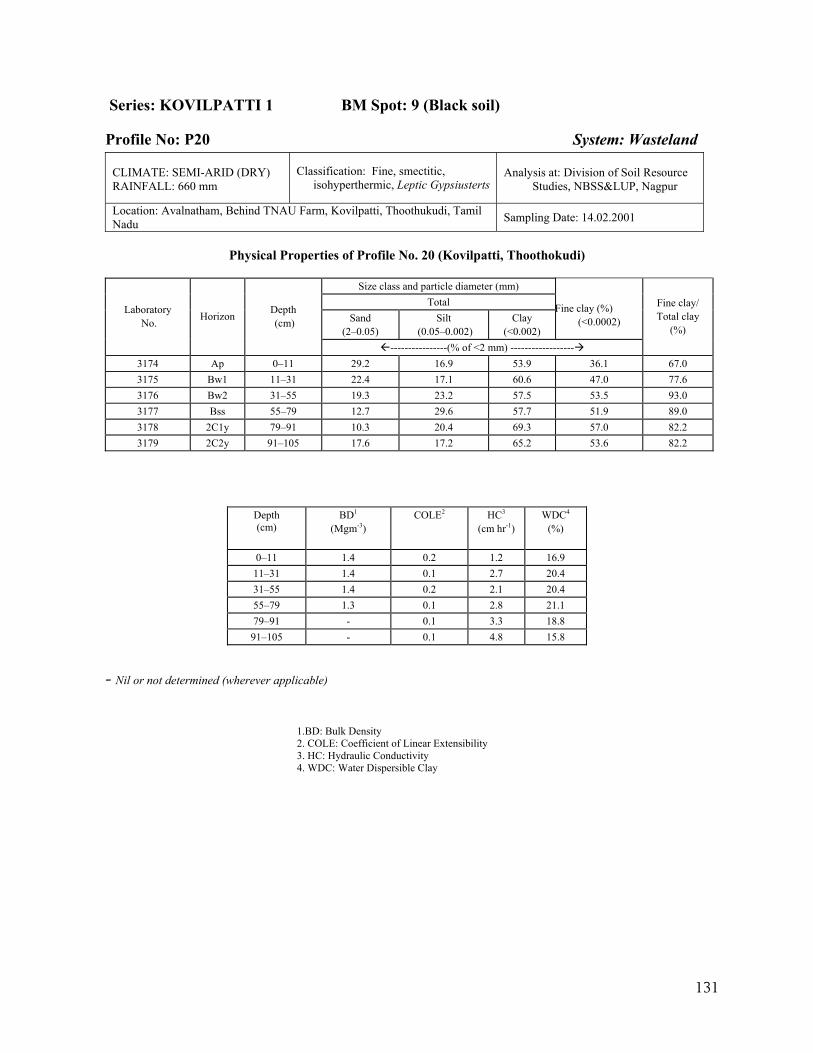
131
Series: KOVILPATTI 1 BM Spot: 9 (Black soil)
Profile No: P20 System: Wasteland
CLIMATE: SEMI-ARID (DRY) RAINFALL: 660 mm
Classification: Fine, smectitic, isohyperthermic, Leptic Gypsiusterts
Analysis at: Division of Soil Resource Studies, NBSS&LUP, Nagpur
Location: Avalnatham, Behind TNAU Farm, Kovilpatti, Thoothukudi, Tamil Nadu Sampling Date: 14.02.2001
Physical Properties of Profile No. 20 (Kovilpatti, Thoothokudi)
Size class and particle diameter (mm)
Total Sand
(2–0.05) Silt
(0.05–0.002) Clay
(<0.002)
Fine clay (%)
(<0.0002) Laboratory
No. Horizon Depth (cm)
----------------(% of <2 mm) ------------------
Fine clay/ Total clay
(%)
3174 Ap 0–11 29.2 16.9 53.9 36.1 67.0 3175 Bw1 11–31 22.4 17.1 60.6 47.0 77.6 3176 Bw2 31–55 19.3 23.2 57.5 53.5 93.0 3177 Bss 55–79 12.7 29.6 57.7 51.9 89.0 3178 2C1y 79–91 10.3 20.4 69.3 57.0 82.2 3179 2C2y 91–105 17.6 17.2 65.2 53.6 82.2
Depth (cm)
BD1
(Mgm-3) COLE2 HC3
(cm hr-1) WDC4
(%)
0–11 1.4 0.2 1.2 16.9 11–31 1.4 0.1 2.7 20.4 31–55 1.4 0.2 2.1 20.4 55–79 1.3 0.1 2.8 21.1 79–91 - 0.1 3.3 18.8 91–105 - 0.1 4.8 15.8
- Nil or not determined (wherever applicable)
1.BD: Bulk Density 2. COLE: Coefficient of Linear Extensibility 3. HC: Hydraulic Conductivity 4. WDC: Water Dispersible Clay
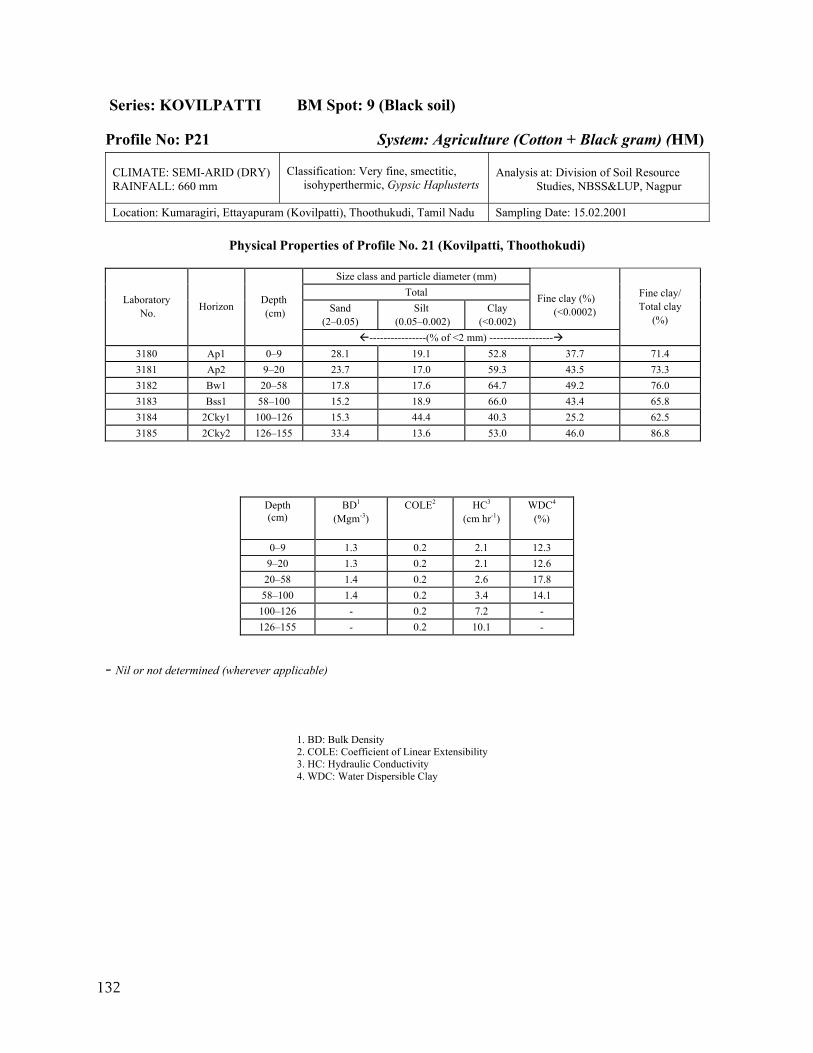
132
Series: KOVILPATTI BM Spot: 9 (Black soil)
Profile No: P21 System: Agriculture (Cotton + Black gram) (HM) CLIMATE: SEMI-ARID (DRY) RAINFALL: 660 mm
Classification: Very fine, smectitic, isohyperthermic, Gypsic Haplusterts
Analysis at: Division of Soil Resource Studies, NBSS&LUP, Nagpur
Location: Kumaragiri, Ettayapuram (Kovilpatti), Thoothukudi, Tamil Nadu Sampling Date: 15.02.2001
Physical Properties of Profile No. 21 (Kovilpatti, Thoothokudi)
Size class and particle diameter (mm) Total
Sand (2–0.05)
Silt (0.05–0.002)
Clay (<0.002)
Fine clay (%)
(<0.0002) Laboratory
No. Horizon Depth (cm)
----------------(% of <2 mm) ------------------
Fine clay/ Total clay
(%)
3180 Ap1 0–9 28.1 19.1 52.8 37.7 71.4 3181 Ap2 9–20 23.7 17.0 59.3 43.5 73.3 3182 Bw1 20–58 17.8 17.6 64.7 49.2 76.0 3183 Bss1 58–100 15.2 18.9 66.0 43.4 65.8 3184 2Cky1 100–126 15.3 44.4 40.3 25.2 62.5 3185 2Cky2 126–155 33.4 13.6 53.0 46.0 86.8
Depth (cm)
BD1
(Mgm-3) COLE2 HC3
(cm hr-1) WDC4
(%)
0–9 1.3 0.2 2.1 12.3 9–20 1.3 0.2 2.1 12.6 20–58 1.4 0.2 2.6 17.8 58–100 1.4 0.2 3.4 14.1
100–126 - 0.2 7.2 - 126–155 - 0.2 10.1 -
- Nil or not determined (wherever applicable)
1. BD: Bulk Density 2. COLE: Coefficient of Linear Extensibility 3. HC: Hydraulic Conductivity 4. WDC: Water Dispersible Clay
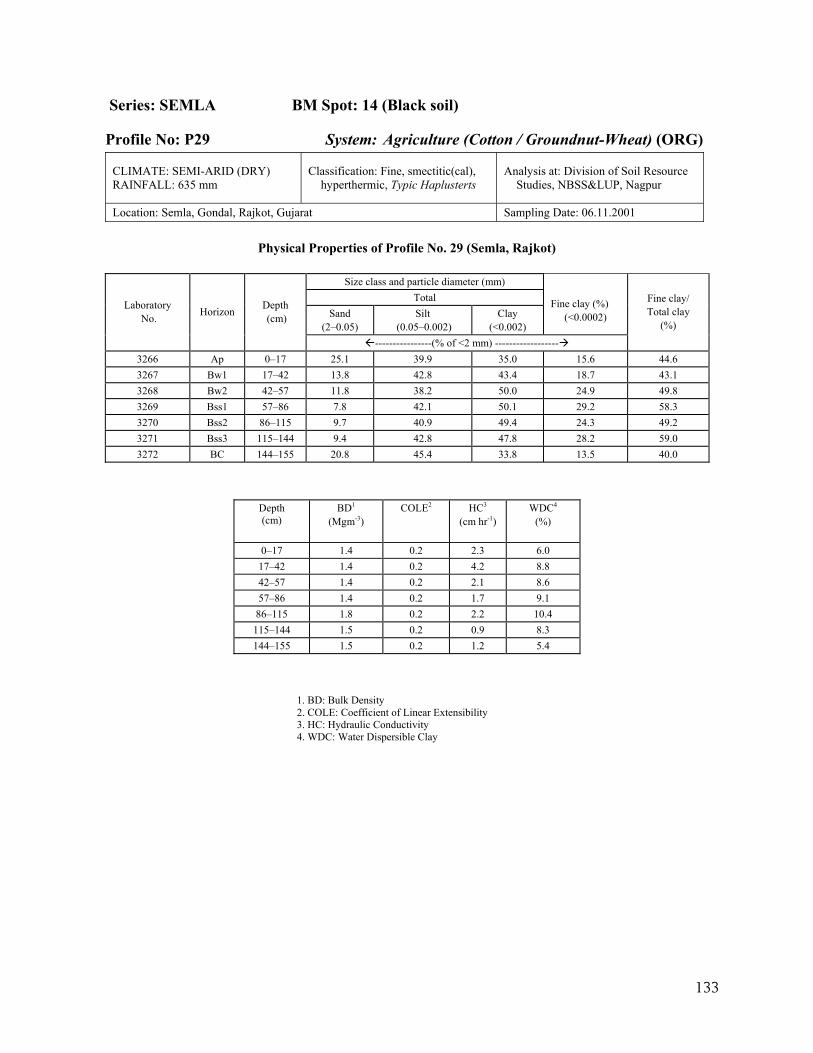
133
Series: SEMLA BM Spot: 14 (Black soil)
Profile No: P29 System: Agriculture (Cotton / Groundnut-Wheat) (ORG)
CLIMATE: SEMI-ARID (DRY) RAINFALL: 635 mm
Classification: Fine, smectitic(cal), hyperthermic, Typic Haplusterts
Analysis at: Division of Soil Resource Studies, NBSS&LUP, Nagpur
Location: Semla, Gondal, Rajkot, Gujarat Sampling Date: 06.11.2001
Physical Properties of Profile No. 29 (Semla, Rajkot)
Size class and particle diameter (mm) Total
Sand (2–0.05)
Silt (0.05–0.002)
Clay (<0.002)
Fine clay (%)
(<0.0002) Laboratory
No. Horizon Depth (cm)
----------------(% of <2 mm) ------------------
Fine clay/ Total clay
(%)
3266 Ap 0–17 25.1 39.9 35.0 15.6 44.6 3267 Bw1 17–42 13.8 42.8 43.4 18.7 43.1 3268 Bw2 42–57 11.8 38.2 50.0 24.9 49.8 3269 Bss1 57–86 7.8 42.1 50.1 29.2 58.3 3270 Bss2 86–115 9.7 40.9 49.4 24.3 49.2 3271 Bss3 115–144 9.4 42.8 47.8 28.2 59.0 3272 BC 144–155 20.8 45.4 33.8 13.5 40.0
Depth (cm)
BD1
(Mgm-3) COLE2 HC3
(cm hr-1) WDC4
(%)
0–17 1.4 0.2 2.3 6.0 17–42 1.4 0.2 4.2 8.8 42–57 1.4 0.2 2.1 8.6 57–86 1.4 0.2 1.7 9.1
86–115 1.8 0.2 2.2 10.4 115–144 1.5 0.2 0.9 8.3 144–155 1.5 0.2 1.2 5.4
1. BD: Bulk Density 2. COLE: Coefficient of Linear Extensibility 3. HC: Hydraulic Conductivity 4. WDC: Water Dispersible Clay
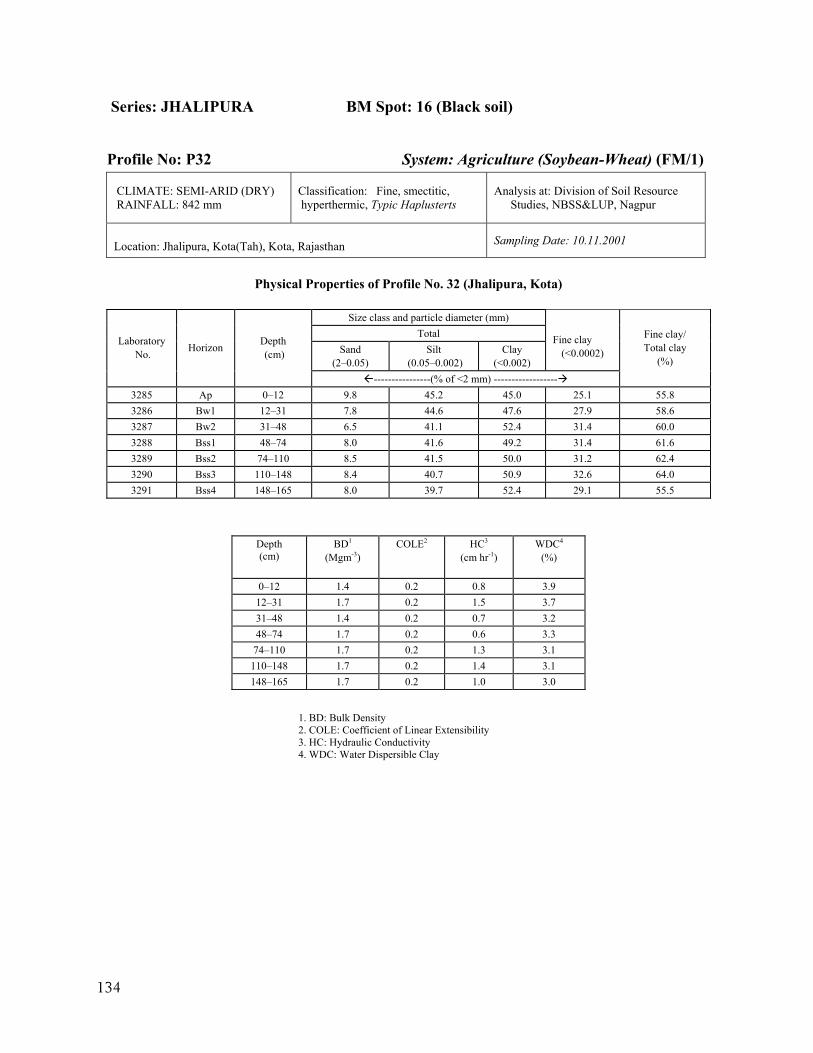
134
Series: JHALIPURA BM Spot: 16 (Black soil)
Profile No: P32 System: Agriculture (Soybean-Wheat) (FM/1)
CLIMATE: SEMI-ARID (DRY) RAINFALL: 842 mm
Classification: Fine, smectitic, hyperthermic, Typic Haplusterts
Analysis at: Division of Soil Resource Studies, NBSS&LUP, Nagpur
Location: Jhalipura, Kota(Tah), Kota, Rajasthan Sampling Date: 10.11.2001
Physical Properties of Profile No. 32 (Jhalipura, Kota)
Size class and particle diameter (mm)
Total Sand
(2–0.05) Silt
(0.05–0.002) Clay
(<0.002)
Fine clay
(<0.0002) Laboratory
No. Horizon Depth (cm)
----------------(% of <2 mm) ------------------
Fine clay/ Total clay
(%)
3285 Ap 0–12 9.8 45.2 45.0 25.1 55.8 3286 Bw1 12–31 7.8 44.6 47.6 27.9 58.6 3287 Bw2 31–48 6.5 41.1 52.4 31.4 60.0 3288 Bss1 48–74 8.0 41.6 49.2 31.4 61.6 3289 Bss2 74–110 8.5 41.5 50.0 31.2 62.4 3290 Bss3 110–148 8.4 40.7 50.9 32.6 64.0 3291 Bss4 148–165 8.0 39.7 52.4 29.1 55.5
Depth (cm)
BD1
(Mgm-3) COLE2 HC3
(cm hr-1) WDC4
(%)
0–12 1.4 0.2 0.8 3.9 12–31 1.7 0.2 1.5 3.7 31–48 1.4 0.2 0.7 3.2 48–74 1.7 0.2 0.6 3.3 74–110 1.7 0.2 1.3 3.1
110–148 1.7 0.2 1.4 3.1 148–165 1.7 0.2 1.0 3.0
1. BD: Bulk Density 2. COLE: Coefficient of Linear Extensibility 3. HC: Hydraulic Conductivity 4. WDC: Water Dispersible Clay
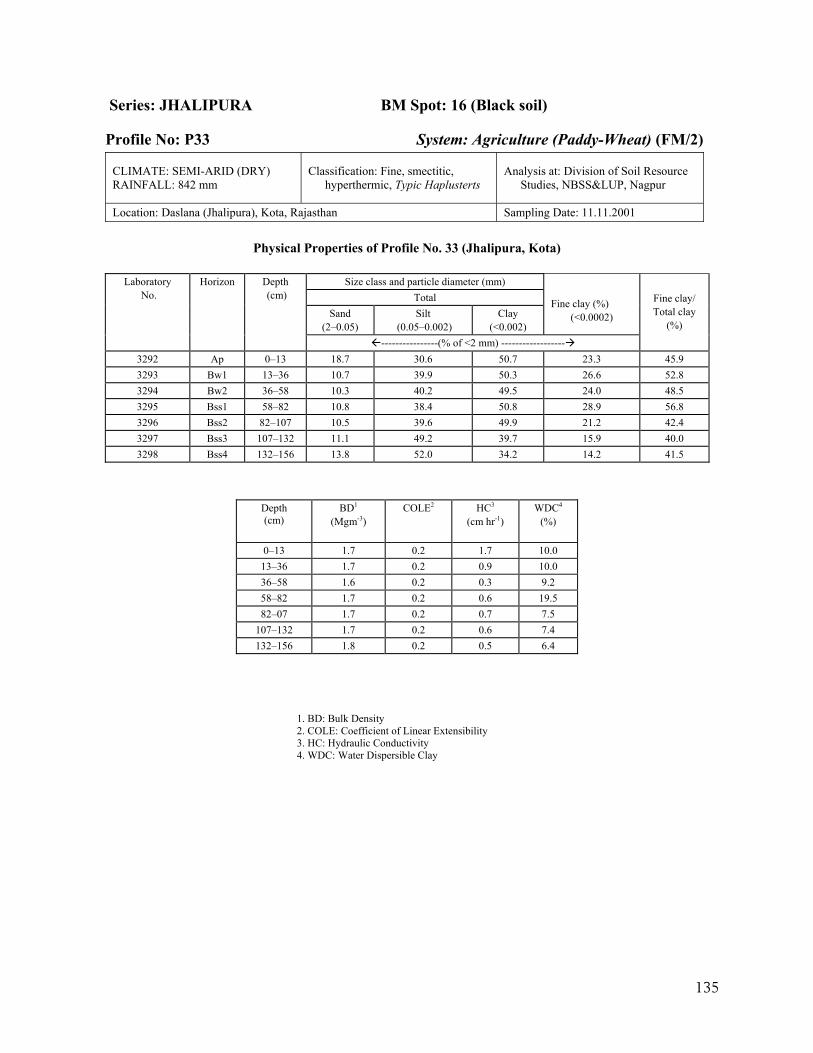
135
Series: JHALIPURA BM Spot: 16 (Black soil)
Profile No: P33 System: Agriculture (Paddy-Wheat) (FM/2)
CLIMATE: SEMI-ARID (DRY) RAINFALL: 842 mm
Classification: Fine, smectitic, hyperthermic, Typic Haplusterts
Analysis at: Division of Soil Resource Studies, NBSS&LUP, Nagpur
Location: Daslana (Jhalipura), Kota, Rajasthan Sampling Date: 11.11.2001
Physical Properties of Profile No. 33 (Jhalipura, Kota)
Size class and particle diameter (mm) Total
Sand (2–0.05)
Silt (0.05–0.002)
Clay (<0.002)
Fine clay (%)
(<0.0002)
Laboratory No.
Horizon Depth (cm)
----------------(% of <2 mm) ------------------
Fine clay/ Total clay
(%)
3292 Ap 0–13 18.7 30.6 50.7 23.3 45.9 3293 Bw1 13–36 10.7 39.9 50.3 26.6 52.8 3294 Bw2 36–58 10.3 40.2 49.5 24.0 48.5 3295 Bss1 58–82 10.8 38.4 50.8 28.9 56.8 3296 Bss2 82–107 10.5 39.6 49.9 21.2 42.4 3297 Bss3 107–132 11.1 49.2 39.7 15.9 40.0 3298 Bss4 132–156 13.8 52.0 34.2 14.2 41.5
Depth (cm)
BD1
(Mgm-3) COLE2 HC3
(cm hr-1) WDC4
(%)
0–13 1.7 0.2 1.7 10.0 13–36 1.7 0.2 0.9 10.0 36–58 1.6 0.2 0.3 9.2 58–82 1.7 0.2 0.6 19.5 82–07 1.7 0.2 0.7 7.5
107–132 1.7 0.2 0.6 7.4 132–156 1.8 0.2 0.5 6.4
1. BD: Bulk Density 2. COLE: Coefficient of Linear Extensibility 3. HC: Hydraulic Conductivity 4. WDC: Water Dispersible Clay
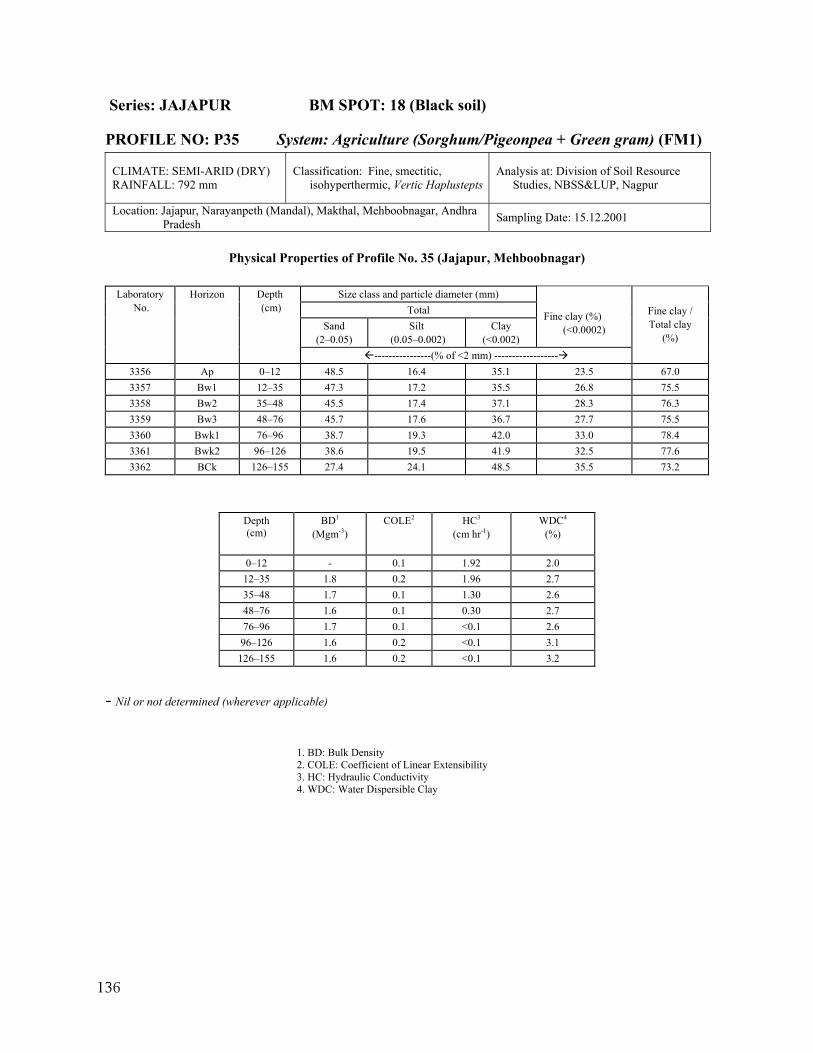
136
Series: JAJAPUR BM SPOT: 18 (Black soil)
PROFILE NO: P35 System: Agriculture (Sorghum/Pigeonpea + Green gram) (FM1)
CLIMATE: SEMI-ARID (DRY) RAINFALL: 792 mm
Classification: Fine, smectitic, isohyperthermic, Vertic Haplustepts
Analysis at: Division of Soil Resource Studies, NBSS&LUP, Nagpur
Location: Jajapur, Narayanpeth (Mandal), Makthal, Mehboobnagar, Andhra Pradesh Sampling Date: 15.12.2001
Physical Properties of Profile No. 35 (Jajapur, Mehboobnagar)
Size class and particle diameter (mm)
Total Sand
(2–0.05) Silt
(0.05–0.002) Clay
(<0.002)
Fine clay (%)
(<0.0002)
Laboratory No.
Horizon Depth (cm)
----------------(% of <2 mm) ------------------
Fine clay / Total clay
(%)
3356 Ap 0–12 48.5 16.4 35.1 23.5 67.0 3357 Bw1 12–35 47.3 17.2 35.5 26.8 75.5 3358 Bw2 35–48 45.5 17.4 37.1 28.3 76.3 3359 Bw3 48–76 45.7 17.6 36.7 27.7 75.5 3360 Bwk1 76–96 38.7 19.3 42.0 33.0 78.4 3361 Bwk2 96–126 38.6 19.5 41.9 32.5 77.6 3362 BCk 126–155 27.4 24.1 48.5 35.5 73.2
Depth (cm)
BD1
(Mgm-3) COLE2 HC3
(cm hr-1) WDC4
(%)
0–12 - 0.1 1.92 2.0 12–35 1.8 0.2 1.96 2.7 35–48 1.7 0.1 1.30 2.6 48–76 1.6 0.1 0.30 2.7 76–96 1.7 0.1 <0.1 2.6 96–126 1.6 0.2 <0.1 3.1
126–155 1.6 0.2 <0.1 3.2
- Nil or not determined (wherever applicable)
1. BD: Bulk Density 2. COLE: Coefficient of Linear Extensibility 3. HC: Hydraulic Conductivity 4. WDC: Water Dispersible Clay
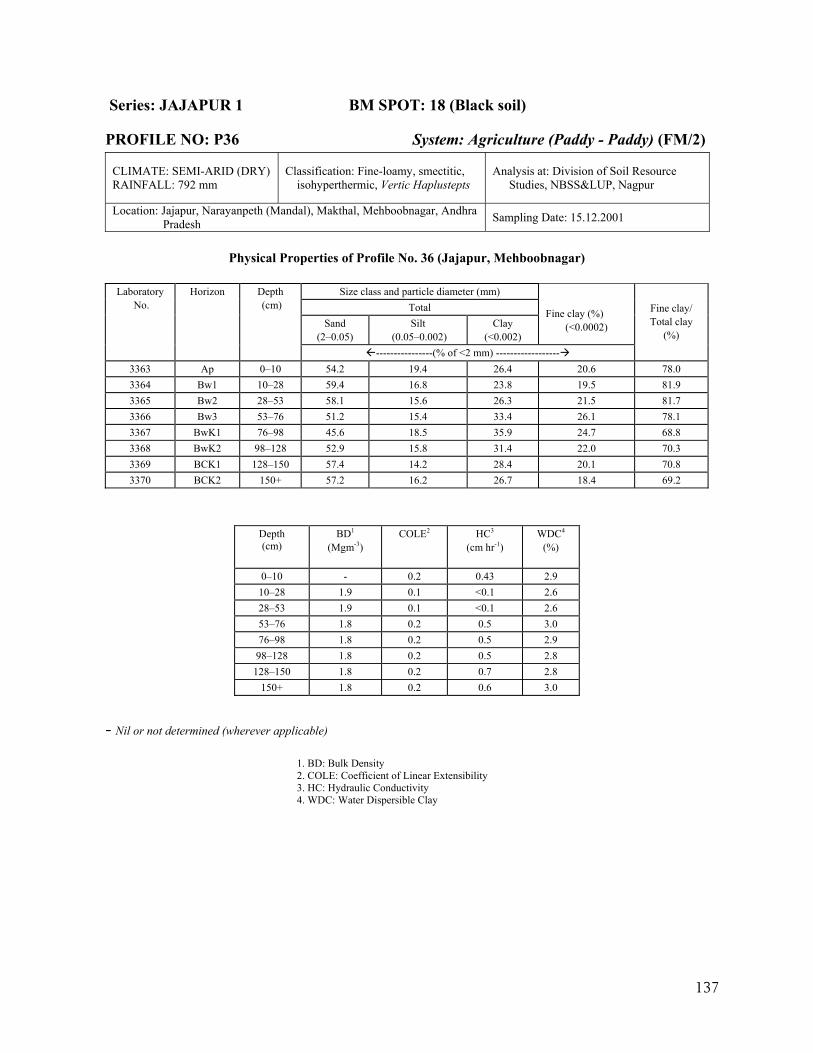
137
Series: JAJAPUR 1 BM SPOT: 18 (Black soil)
PROFILE NO: P36 System: Agriculture (Paddy - Paddy) (FM/2)
CLIMATE: SEMI-ARID (DRY) RAINFALL: 792 mm
Classification: Fine-loamy, smectitic, isohyperthermic, Vertic Haplustepts
Analysis at: Division of Soil Resource Studies, NBSS&LUP, Nagpur
Location: Jajapur, Narayanpeth (Mandal), Makthal, Mehboobnagar, Andhra Pradesh Sampling Date: 15.12.2001
Physical Properties of Profile No. 36 (Jajapur, Mehboobnagar)
Size class and particle diameter (mm)
Total Sand
(2–0.05) Silt
(0.05–0.002) Clay
(<0.002)
Fine clay (%)
(<0.0002)
Laboratory No.
Horizon Depth (cm)
----------------(% of <2 mm) ------------------
Fine clay/ Total clay
(%)
3363 Ap 0–10 54.2 19.4 26.4 20.6 78.0 3364 Bw1 10–28 59.4 16.8 23.8 19.5 81.9 3365 Bw2 28–53 58.1 15.6 26.3 21.5 81.7 3366 Bw3 53–76 51.2 15.4 33.4 26.1 78.1 3367 BwK1 76–98 45.6 18.5 35.9 24.7 68.8 3368 BwK2 98–128 52.9 15.8 31.4 22.0 70.3 3369 BCK1 128–150 57.4 14.2 28.4 20.1 70.8 3370 BCK2 150+ 57.2 16.2 26.7 18.4 69.2
Depth (cm)
BD1
(Mgm-3) COLE2 HC3
(cm hr-1) WDC4
(%)
0–10 - 0.2 0.43 2.9 10–28 1.9 0.1 <0.1 2.6 28–53 1.9 0.1 <0.1 2.6 53–76 1.8 0.2 0.5 3.0 76–98 1.8 0.2 0.5 2.9 98–128 1.8 0.2 0.5 2.8
128–150 1.8 0.2 0.7 2.8 150+ 1.8 0.2 0.6 3.0
- Nil or not determined (wherever applicable)
1. BD: Bulk Density 2. COLE: Coefficient of Linear Extensibility 3. HC: Hydraulic Conductivity 4. WDC: Water Dispersible Clay
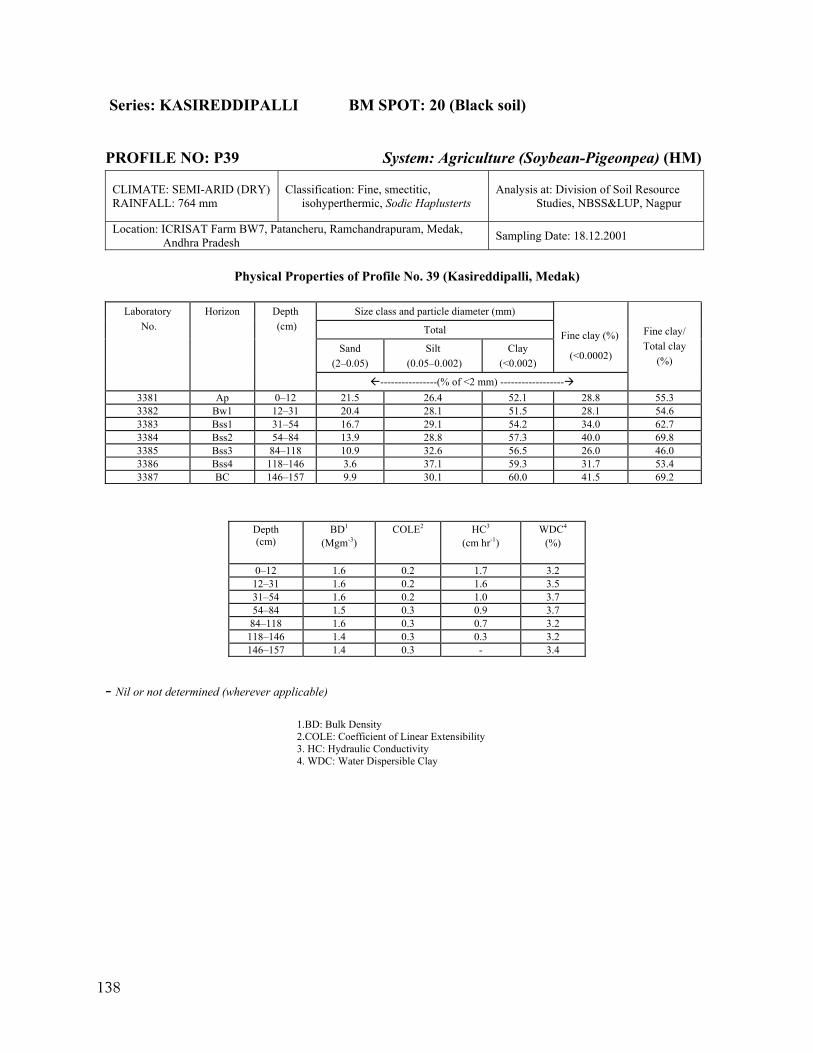
138
Series: KASIREDDIPALLI BM SPOT: 20 (Black soil)
PROFILE NO: P39 System: Agriculture (Soybean-Pigeonpea) (HM)
CLIMATE: SEMI-ARID (DRY) RAINFALL: 764 mm
Classification: Fine, smectitic, isohyperthermic, Sodic Haplusterts
Analysis at: Division of Soil Resource Studies, NBSS&LUP, Nagpur
Location: ICRISAT Farm BW7, Patancheru, Ramchandrapuram, Medak, Andhra Pradesh Sampling Date: 18.12.2001
Physical Properties of Profile No. 39 (Kasireddipalli, Medak)
Size class and particle diameter (mm)
Total
Sand (2–0.05)
Silt (0.05–0.002)
Clay (<0.002)
Fine clay (%)
(<0.0002)
Laboratory No.
Horizon Depth (cm)
----------------(% of <2 mm) ------------------
Fine clay/ Total clay
(%)
3381 Ap 0–12 21.5 26.4 52.1 28.8 55.3 3382 Bw1 12–31 20.4 28.1 51.5 28.1 54.6 3383 Bss1 31–54 16.7 29.1 54.2 34.0 62.7 3384 Bss2 54–84 13.9 28.8 57.3 40.0 69.8 3385 Bss3 84–118 10.9 32.6 56.5 26.0 46.0 3386 Bss4 118–146 3.6 37.1 59.3 31.7 53.4 3387 BC 146–157 9.9 30.1 60.0 41.5 69.2
Depth (cm)
BD1
(Mgm-3) COLE2 HC3
(cm hr-1) WDC4
(%)
0–12 1.6 0.2 1.7 3.2 12–31 1.6 0.2 1.6 3.5 31–54 1.6 0.2 1.0 3.7 54–84 1.5 0.3 0.9 3.7 84–118 1.6 0.3 0.7 3.2
118–146 1.4 0.3 0.3 3.2 146–157 1.4 0.3 - 3.4
- Nil or not determined (wherever applicable)
1.BD: Bulk Density 2.COLE: Coefficient of Linear Extensibility 3. HC: Hydraulic Conductivity 4. WDC: Water Dispersible Clay
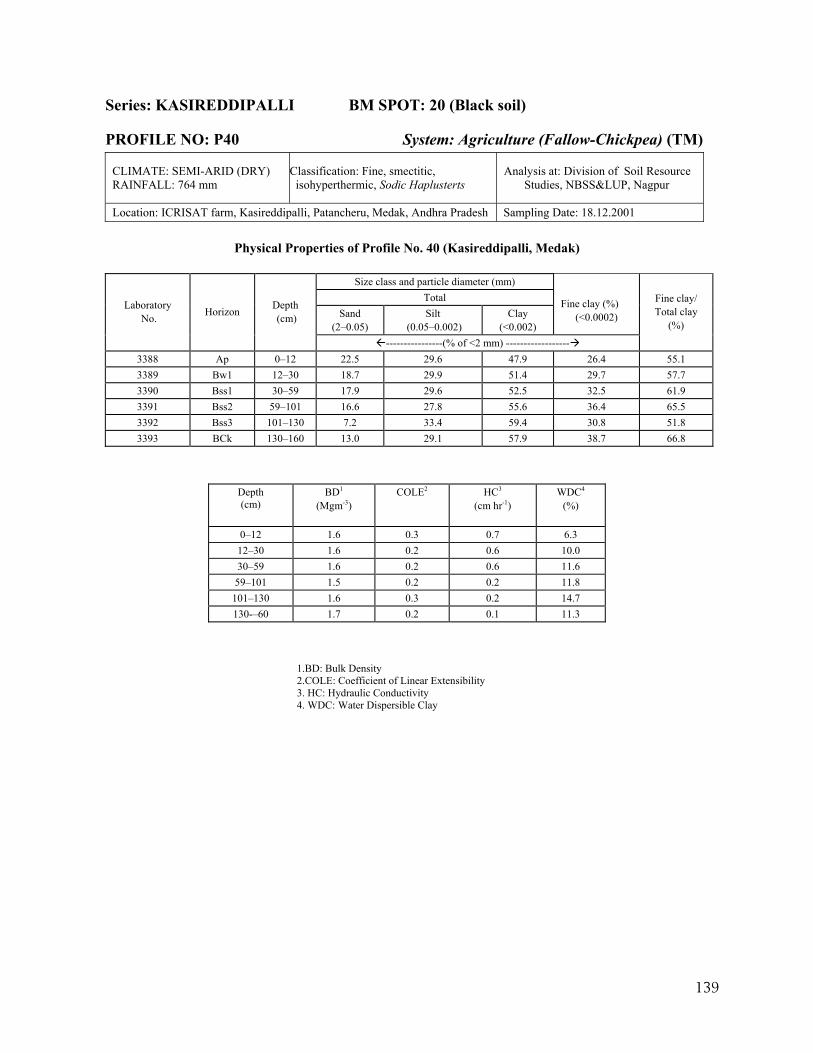
139
Series: KASIREDDIPALLI BM SPOT: 20 (Black soil)
PROFILE NO: P40 System: Agriculture (Fallow-Chickpea) (TM)
CLIMATE: SEMI-ARID (DRY) RAINFALL: 764 mm
Classification: Fine, smectitic, isohyperthermic, Sodic Haplusterts
Analysis at: Division of Soil Resource Studies, NBSS&LUP, Nagpur
Location: ICRISAT farm, Kasireddipalli, Patancheru, Medak, Andhra Pradesh Sampling Date: 18.12.2001
Physical Properties of Profile No. 40 (Kasireddipalli, Medak)
Size class and particle diameter (mm) Total
Sand (2–0.05)
Silt (0.05–0.002)
Clay (<0.002)
Fine clay (%)
(<0.0002) Laboratory
No. Horizon Depth (cm)
----------------(% of <2 mm) ------------------
Fine clay/ Total clay
(%)
3388 Ap 0–12 22.5 29.6 47.9 26.4 55.1 3389 Bw1 12–30 18.7 29.9 51.4 29.7 57.7 3390 Bss1 30–59 17.9 29.6 52.5 32.5 61.9 3391 Bss2 59–101 16.6 27.8 55.6 36.4 65.5 3392 Bss3 101–130 7.2 33.4 59.4 30.8 51.8 3393 BCk 130–160 13.0 29.1 57.9 38.7 66.8
Depth (cm)
BD1
(Mgm-3) COLE2 HC3
(cm hr-1) WDC4
(%)
0–12 1.6 0.3 0.7 6.3 12–30 1.6 0.2 0.6 10.0 30–59 1.6 0.2 0.6 11.6 59–101 1.5 0.2 0.2 11.8
101–130 1.6 0.3 0.2 14.7 130-–60 1.7 0.2 0.1 11.3
1.BD: Bulk Density 2.COLE: Coefficient of Linear Extensibility 3. HC: Hydraulic Conductivity 4. WDC: Water Dispersible Clay
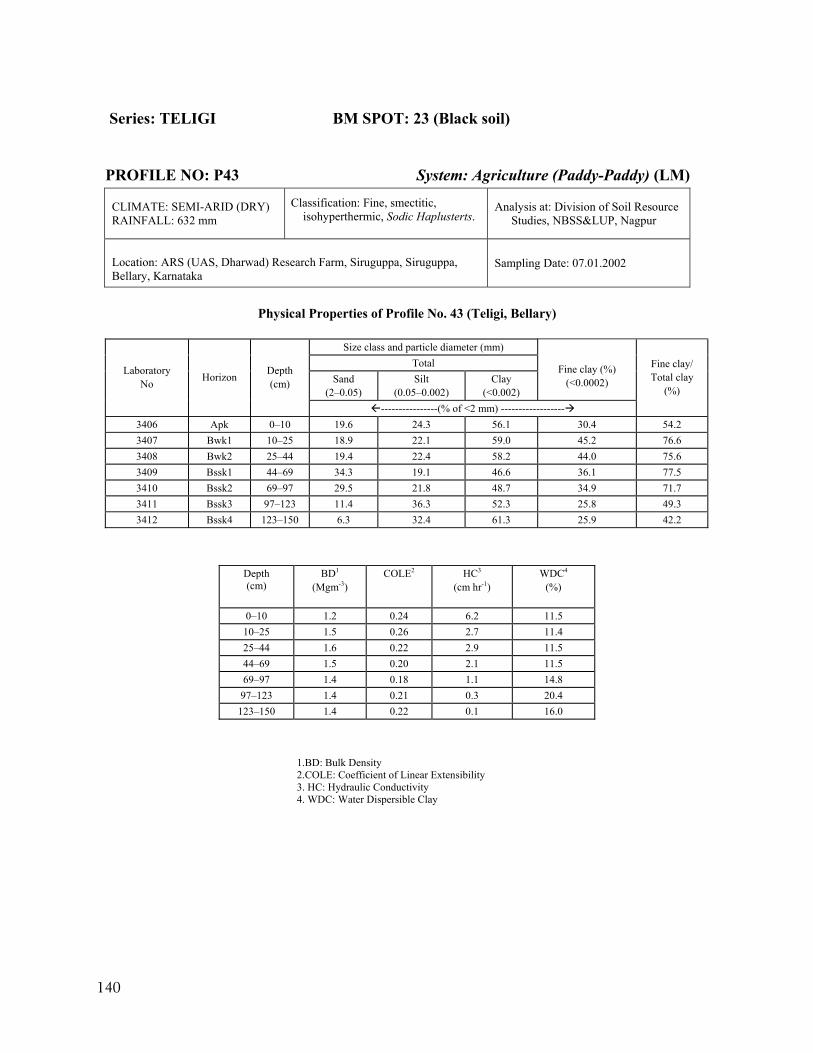
140
Series: TELIGI BM SPOT: 23 (Black soil)
PROFILE NO: P43 System: Agriculture (Paddy-Paddy) (LM)
CLIMATE: SEMI-ARID (DRY) RAINFALL: 632 mm
Classification: Fine, smectitic, isohyperthermic, Sodic Haplusterts.
Analysis at: Division of Soil Resource Studies, NBSS&LUP, Nagpur
Location: ARS (UAS, Dharwad) Research Farm, Siruguppa, Siruguppa, Bellary, Karnataka
Sampling Date: 07.01.2002
Physical Properties of Profile No. 43 (Teligi, Bellary)
Size class and particle diameter (mm)
Total Sand
(2–0.05) Silt
(0.05–0.002) Clay
(<0.002)
Fine clay (%)
(<0.0002) Laboratory
No Horizon Depth (cm)
----------------(% of <2 mm) ------------------
Fine clay/ Total clay
(%)
3406 Apk 0–10 19.6 24.3 56.1 30.4 54.2 3407 Bwk1 10–25 18.9 22.1 59.0 45.2 76.6 3408 Bwk2 25–44 19.4 22.4 58.2 44.0 75.6 3409 Bssk1 44–69 34.3 19.1 46.6 36.1 77.5 3410 Bssk2 69–97 29.5 21.8 48.7 34.9 71.7 3411 Bssk3 97–123 11.4 36.3 52.3 25.8 49.3 3412 Bssk4 123–150 6.3 32.4 61.3 25.9 42.2
Depth (cm)
BD1
(Mgm-3) COLE2 HC3
(cm hr-1) WDC4
(%)
0–10 1.2 0.24 6.2 11.5 10–25 1.5 0.26 2.7 11.4 25–44 1.6 0.22 2.9 11.5 44–69 1.5 0.20 2.1 11.5 69–97 1.4 0.18 1.1 14.8 97–123 1.4 0.21 0.3 20.4
123–150 1.4 0.22 0.1 16.0
1.BD: Bulk Density 2.COLE: Coefficient of Linear Extensibility 3. HC: Hydraulic Conductivity 4. WDC: Water Dispersible Clay
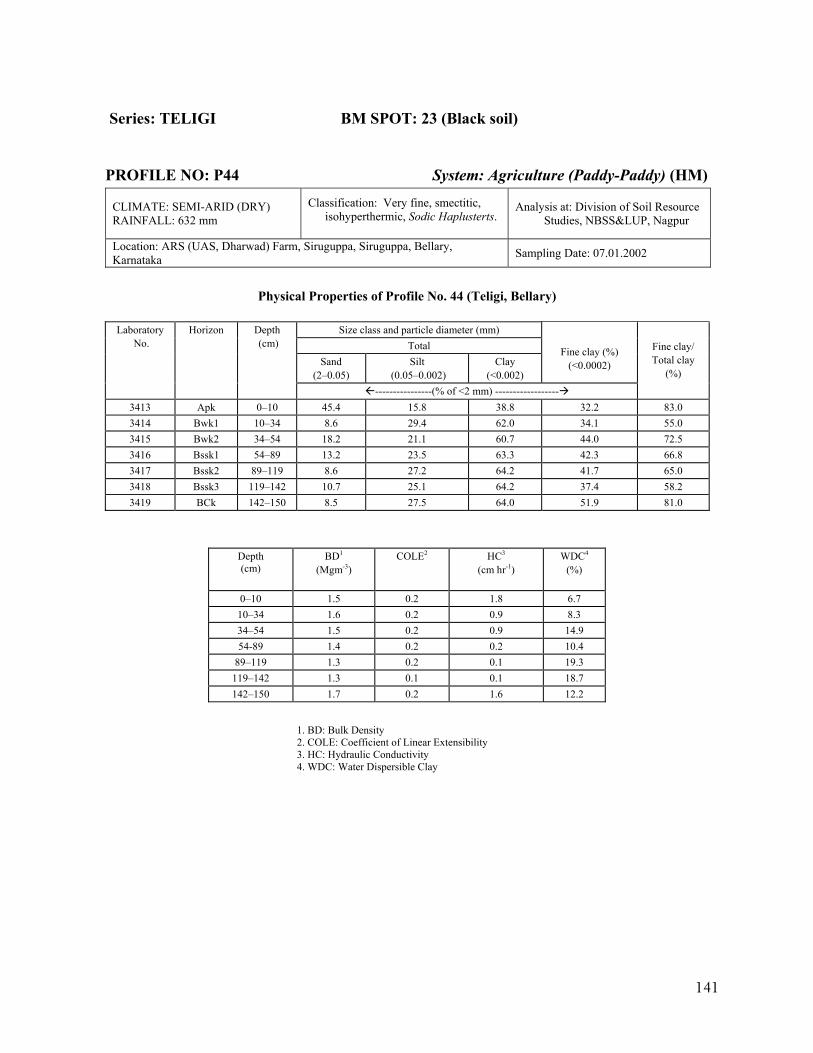
141
Series: TELIGI BM SPOT: 23 (Black soil)
PROFILE NO: P44 System: Agriculture (Paddy-Paddy) (HM)
CLIMATE: SEMI-ARID (DRY) RAINFALL: 632 mm
Classification: Very fine, smectitic, isohyperthermic, Sodic Haplusterts.
Analysis at: Division of Soil Resource Studies, NBSS&LUP, Nagpur
Location: ARS (UAS, Dharwad) Farm, Siruguppa, Siruguppa, Bellary, Karnataka Sampling Date: 07.01.2002
Physical Properties of Profile No. 44 (Teligi, Bellary)
Size class and particle diameter (mm)
Total Sand
(2–0.05) Silt
(0.05–0.002) Clay
(<0.002)
Fine clay (%)
(<0.0002)
Laboratory No.
Horizon Depth (cm)
----------------(% of <2 mm) ------------------
Fine clay/ Total clay
(%)
3413 Apk 0–10 45.4 15.8 38.8 32.2 83.0 3414 Bwk1 10–34 8.6 29.4 62.0 34.1 55.0 3415 Bwk2 34–54 18.2 21.1 60.7 44.0 72.5 3416 Bssk1 54–89 13.2 23.5 63.3 42.3 66.8 3417 Bssk2 89–119 8.6 27.2 64.2 41.7 65.0 3418 Bssk3 119–142 10.7 25.1 64.2 37.4 58.2 3419 BCk 142–150 8.5 27.5 64.0 51.9 81.0
Depth (cm)
BD1
(Mgm-3) COLE2 HC3
(cm hr-1) WDC4
(%)
0–10 1.5 0.2 1.8 6.7 10–34 1.6 0.2 0.9 8.3 34–54 1.5 0.2 0.9 14.9 54-89 1.4 0.2 0.2 10.4
89–119 1.3 0.2 0.1 19.3 119–142 1.3 0.1 0.1 18.7 142–150 1.7 0.2 1.6 12.2
1. BD: Bulk Density 2. COLE: Coefficient of Linear Extensibility 3. HC: Hydraulic Conductivity 4. WDC: Water Dispersible Clay
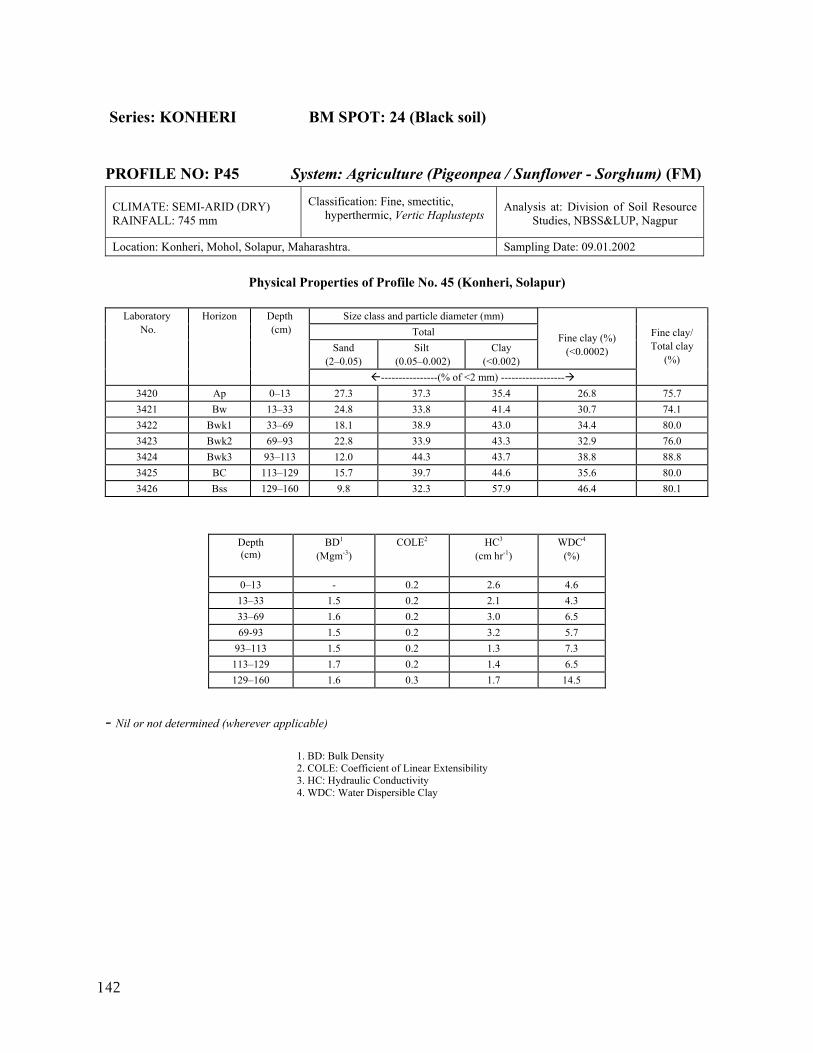
142
Series: KONHERI BM SPOT: 24 (Black soil)
PROFILE NO: P45 System: Agriculture (Pigeonpea / Sunflower - Sorghum) (FM)
CLIMATE: SEMI-ARID (DRY) RAINFALL: 745 mm
Classification: Fine, smectitic, hyperthermic, Vertic Haplustepts
Analysis at: Division of Soil Resource Studies, NBSS&LUP, Nagpur
Location: Konheri, Mohol, Solapur, Maharashtra. Sampling Date: 09.01.2002
Physical Properties of Profile No. 45 (Konheri, Solapur)
Size class and particle diameter (mm) Total
Sand (2–0.05)
Silt (0.05–0.002)
Clay (<0.002)
Fine clay (%)
(<0.0002)
Laboratory No.
Horizon Depth (cm)
----------------(% of <2 mm) ------------------
Fine clay/ Total clay
(%)
3420 Ap 0–13 27.3 37.3 35.4 26.8 75.7 3421 Bw 13–33 24.8 33.8 41.4 30.7 74.1 3422 Bwk1 33–69 18.1 38.9 43.0 34.4 80.0 3423 Bwk2 69–93 22.8 33.9 43.3 32.9 76.0 3424 Bwk3 93–113 12.0 44.3 43.7 38.8 88.8 3425 BC 113–129 15.7 39.7 44.6 35.6 80.0 3426 Bss 129–160 9.8 32.3 57.9 46.4 80.1
Depth (cm)
BD1
(Mgm-3) COLE2 HC3
(cm hr-1) WDC4
(%)
0–13 - 0.2 2.6 4.6 13–33 1.5 0.2 2.1 4.3 33–69 1.6 0.2 3.0 6.5 69-93 1.5 0.2 3.2 5.7
93–113 1.5 0.2 1.3 7.3 113–129 1.7 0.2 1.4 6.5 129–160 1.6 0.3 1.7 14.5
- Nil or not determined (wherever applicable)
1. BD: Bulk Density 2. COLE: Coefficient of Linear Extensibility 3. HC: Hydraulic Conductivity 4. WDC: Water Dispersible Clay
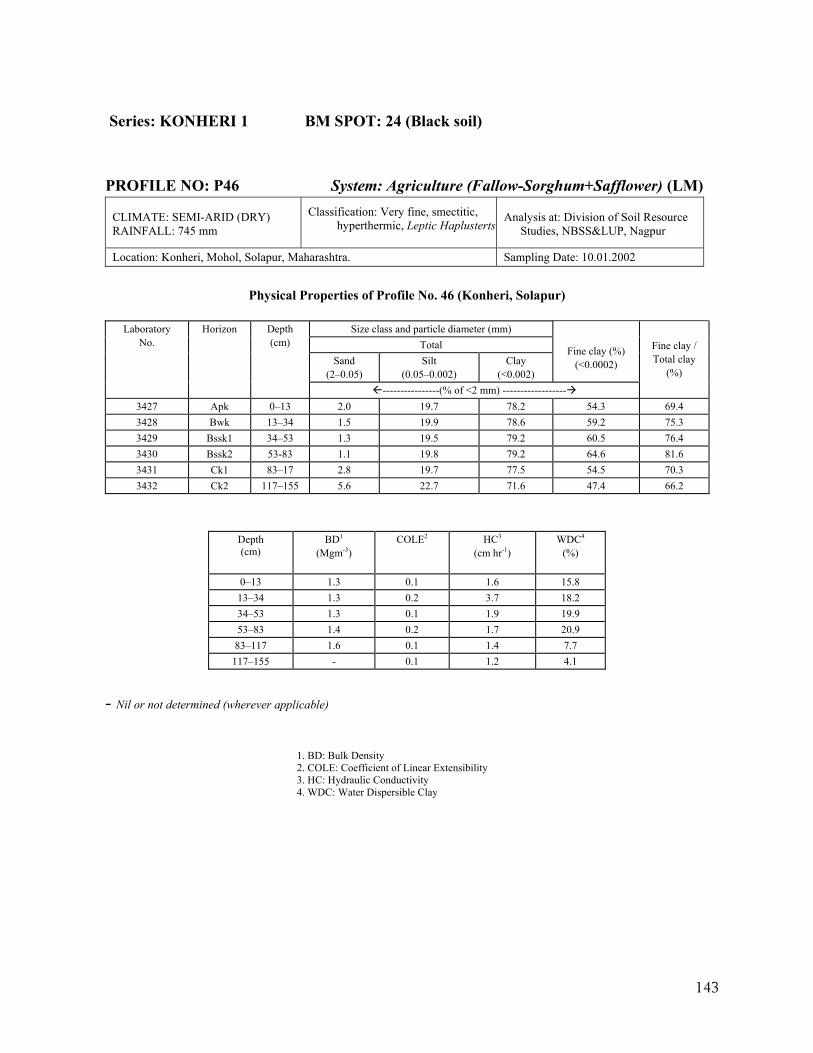
143
Series: KONHERI 1 BM SPOT: 24 (Black soil) PROFILE NO: P46 System: Agriculture (Fallow-Sorghum+Safflower) (LM)
CLIMATE: SEMI-ARID (DRY) RAINFALL: 745 mm
Classification: Very fine, smectitic, hyperthermic, Leptic Haplusterts
Analysis at: Division of Soil Resource Studies, NBSS&LUP, Nagpur
Location: Konheri, Mohol, Solapur, Maharashtra. Sampling Date: 10.01.2002
Physical Properties of Profile No. 46 (Konheri, Solapur)
Size class and particle diameter (mm)
Total Sand
(2–0.05) Silt
(0.05–0.002) Clay
(<0.002)
Fine clay (%)
(<0.0002)
Laboratory No.
Horizon Depth (cm)
----------------(% of <2 mm) ------------------
Fine clay / Total clay
(%)
3427 Apk 0–13 2.0 19.7 78.2 54.3 69.4 3428 Bwk 13–34 1.5 19.9 78.6 59.2 75.3 3429 Bssk1 34–53 1.3 19.5 79.2 60.5 76.4 3430 Bssk2 53-83 1.1 19.8 79.2 64.6 81.6 3431 Ck1 83–17 2.8 19.7 77.5 54.5 70.3 3432 Ck2 117–155 5.6 22.7 71.6 47.4 66.2
Depth (cm)
BD1
(Mgm-3) COLE2 HC3
(cm hr-1) WDC4
(%)
0–13 1.3 0.1 1.6 15.8 13–34 1.3 0.2 3.7 18.2 34–53 1.3 0.1 1.9 19.9 53–83 1.4 0.2 1.7 20.9 83–117 1.6 0.1 1.4 7.7
117–155 - 0.1 1.2 4.1
- Nil or not determined (wherever applicable)
1. BD: Bulk Density 2. COLE: Coefficient of Linear Extensibility 3. HC: Hydraulic Conductivity 4. WDC: Water Dispersible Clay
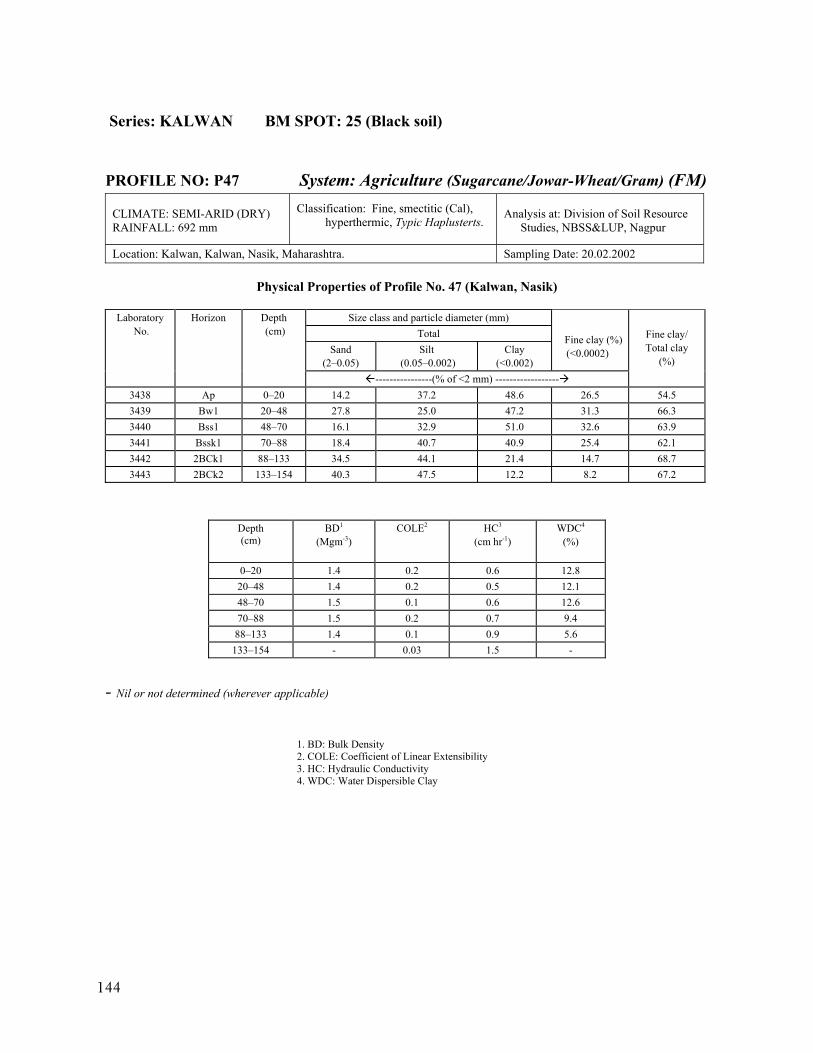
144
Series: KALWAN BM SPOT: 25 (Black soil)
PROFILE NO: P47 System: Agriculture (Sugarcane/Jowar-Wheat/Gram) (FM)
CLIMATE: SEMI-ARID (DRY) RAINFALL: 692 mm
Classification: Fine, smectitic (Cal), hyperthermic, Typic Haplusterts.
Analysis at: Division of Soil Resource Studies, NBSS&LUP, Nagpur
Location: Kalwan, Kalwan, Nasik, Maharashtra. Sampling Date: 20.02.2002
Physical Properties of Profile No. 47 (Kalwan, Nasik)
Size class and particle diameter (mm) Total
Sand (2–0.05)
Silt (0.05–0.002)
Clay (<0.002)
Fine clay (%) (<0.0002)
Laboratory No.
Horizon Depth (cm)
----------------(% of <2 mm) ------------------
Fine clay/ Total clay
(%)
3438 Ap 0–20 14.2 37.2 48.6 26.5 54.5 3439 Bw1 20–48 27.8 25.0 47.2 31.3 66.3 3440 Bss1 48–70 16.1 32.9 51.0 32.6 63.9 3441 Bssk1 70–88 18.4 40.7 40.9 25.4 62.1 3442 2BCk1 88–133 34.5 44.1 21.4 14.7 68.7 3443 2BCk2 133–154 40.3 47.5 12.2 8.2 67.2
Depth (cm)
BD1
(Mgm-3) COLE2 HC3
(cm hr-1) WDC4
(%)
0–20 1.4 0.2 0.6 12.8 20–48 1.4 0.2 0.5 12.1 48–70 1.5 0.1 0.6 12.6 70–88 1.5 0.2 0.7 9.4 88–133 1.4 0.1 0.9 5.6
133–154 - 0.03 1.5 -
- Nil or not determined (wherever applicable)
1. BD: Bulk Density 2. COLE: Coefficient of Linear Extensibility 3. HC: Hydraulic Conductivity 4. WDC: Water Dispersible Clay

145
BLACK SOILS
(Arid)
(MAR : < 550 mm)
Benchmark Spots: 15, 28
No. of Pedons: 4 (P30, P31, P51, P52)
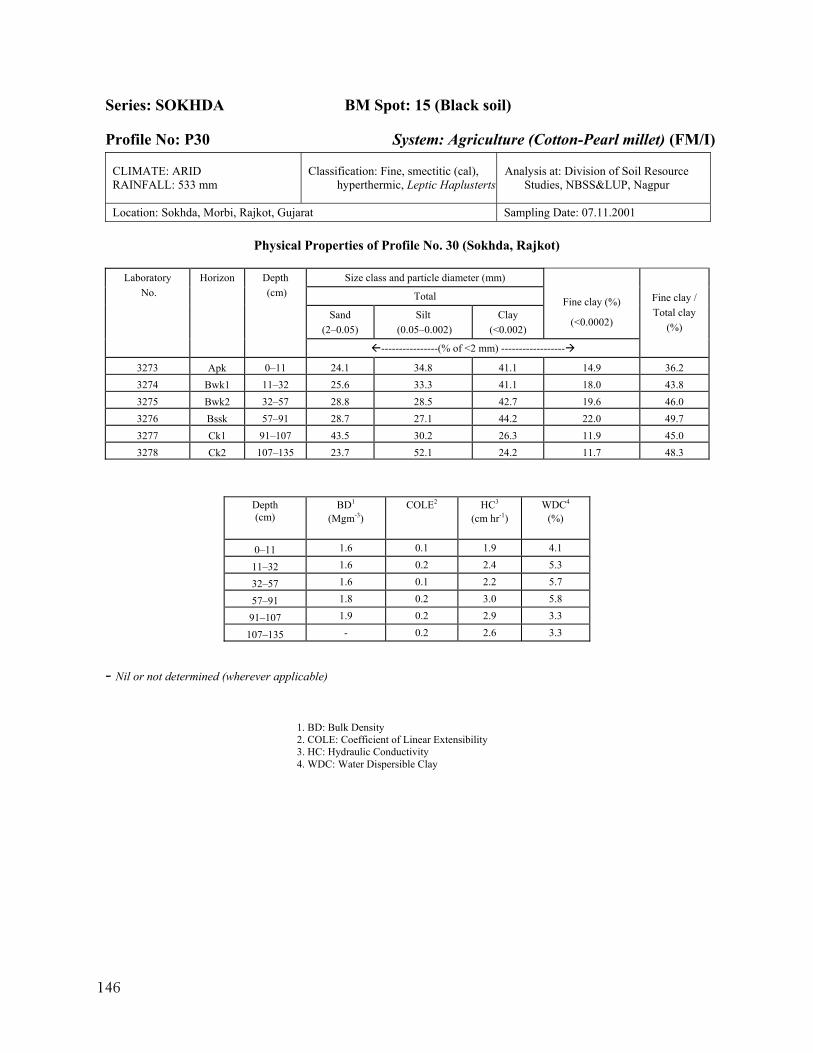
146
Series: SOKHDA BM Spot: 15 (Black soil)
Profile No: P30 System: Agriculture (Cotton-Pearl millet) (FM/I)
CLIMATE: ARID RAINFALL: 533 mm
Classification: Fine, smectitic (cal), hyperthermic, Leptic Haplusterts
Analysis at: Division of Soil Resource Studies, NBSS&LUP, Nagpur
Location: Sokhda, Morbi, Rajkot, Gujarat Sampling Date: 07.11.2001
Physical Properties of Profile No. 30 (Sokhda, Rajkot)
Size class and particle diameter (mm)
Total
Sand (2–0.05)
Silt (0.05–0.002)
Clay (<0.002)
Fine clay (%)
(<0.0002)
Laboratory No.
Horizon Depth (cm)
----------------(% of <2 mm) ------------------
Fine clay / Total clay
(%)
3273 Apk 0–11 24.1 34.8 41.1 14.9 36.2 3274 Bwk1 11–32 25.6 33.3 41.1 18.0 43.8 3275 Bwk2 32–57 28.8 28.5 42.7 19.6 46.0 3276 Bssk 57–91 28.7 27.1 44.2 22.0 49.7 3277 Ck1 91–107 43.5 30.2 26.3 11.9 45.0 3278 Ck2 107–135 23.7 52.1 24.2 11.7 48.3
Depth (cm)
BD1
(Mgm-3) COLE2 HC3
(cm hr-1) WDC4
(%)
0–11 1.6 0.1 1.9 4.1
11–32 1.6 0.2 2.4 5.3
32–57 1.6 0.1 2.2 5.7
57–91 1.8 0.2 3.0 5.8
91–107 1.9 0.2 2.9 3.3
107–135 - 0.2 2.6 3.3
- Nil or not determined (wherever applicable)
1. BD: Bulk Density 2. COLE: Coefficient of Linear Extensibility 3. HC: Hydraulic Conductivity 4. WDC: Water Dispersible Clay
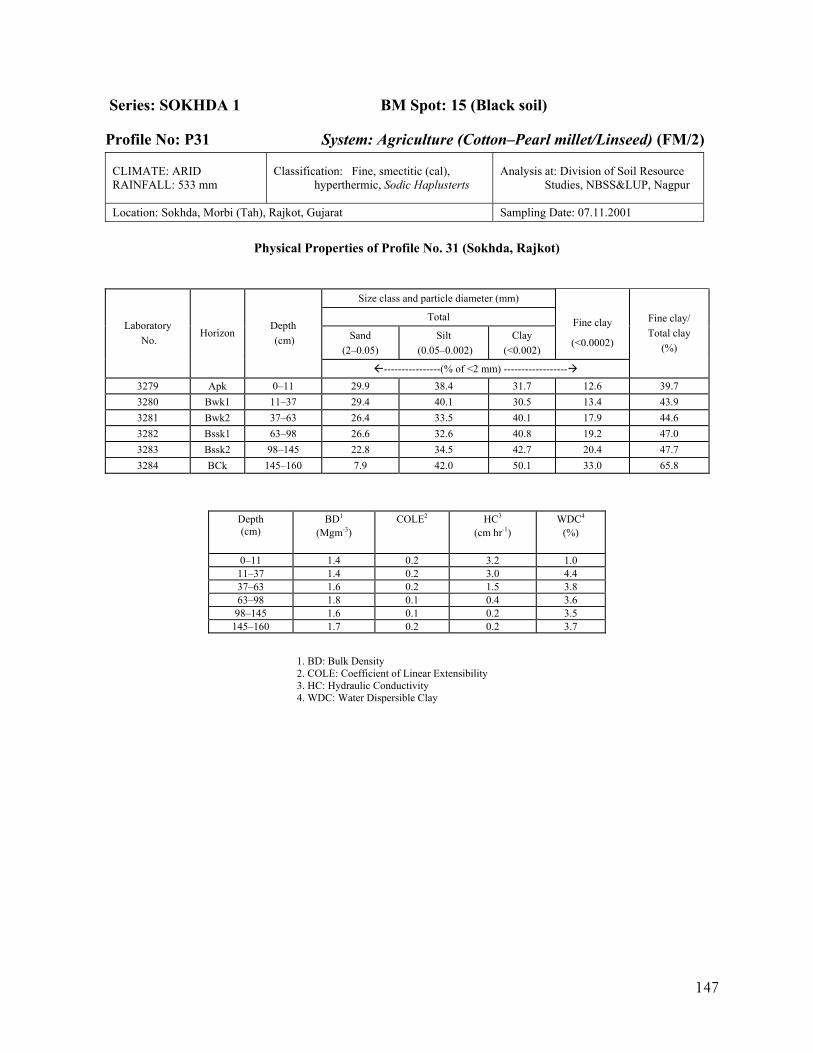
147
Series: SOKHDA 1 BM Spot: 15 (Black soil)
Profile No: P31 System: Agriculture (Cotton–Pearl millet/Linseed) (FM/2)
CLIMATE: ARID RAINFALL: 533 mm
Classification: Fine, smectitic (cal), hyperthermic, Sodic Haplusterts
Analysis at: Division of Soil Resource Studies, NBSS&LUP, Nagpur
Location: Sokhda, Morbi (Tah), Rajkot, Gujarat Sampling Date: 07.11.2001
Physical Properties of Profile No. 31 (Sokhda, Rajkot)
Size class and particle diameter (mm)
Total
Sand (2–0.05)
Silt (0.05–0.002)
Clay (<0.002)
Fine clay
(<0.0002) Laboratory
No. Horizon
Depth (cm)
----------------(% of <2 mm) ------------------
Fine clay/ Total clay
(%)
3279 Apk 0–11 29.9 38.4 31.7 12.6 39.7 3280 Bwk1 11–37 29.4 40.1 30.5 13.4 43.9 3281 Bwk2 37–63 26.4 33.5 40.1 17.9 44.6 3282 Bssk1 63–98 26.6 32.6 40.8 19.2 47.0 3283 Bssk2 98–145 22.8 34.5 42.7 20.4 47.7 3284 BCk 145–160 7.9 42.0 50.1 33.0 65.8
Depth (cm)
BD1
(Mgm-3) COLE2 HC3
(cm hr-1) WDC4
(%)
0–11 1.4 0.2 3.2 1.0 11–37 1.4 0.2 3.0 4.4 37–63 1.6 0.2 1.5 3.8 63–98 1.8 0.1 0.4 3.6 98–145 1.6 0.1 0.2 3.5
145–160 1.7 0.2 0.2 3.7
1. BD: Bulk Density 2. COLE: Coefficient of Linear Extensibility 3. HC: Hydraulic Conductivity 4. WDC: Water Dispersible Clay
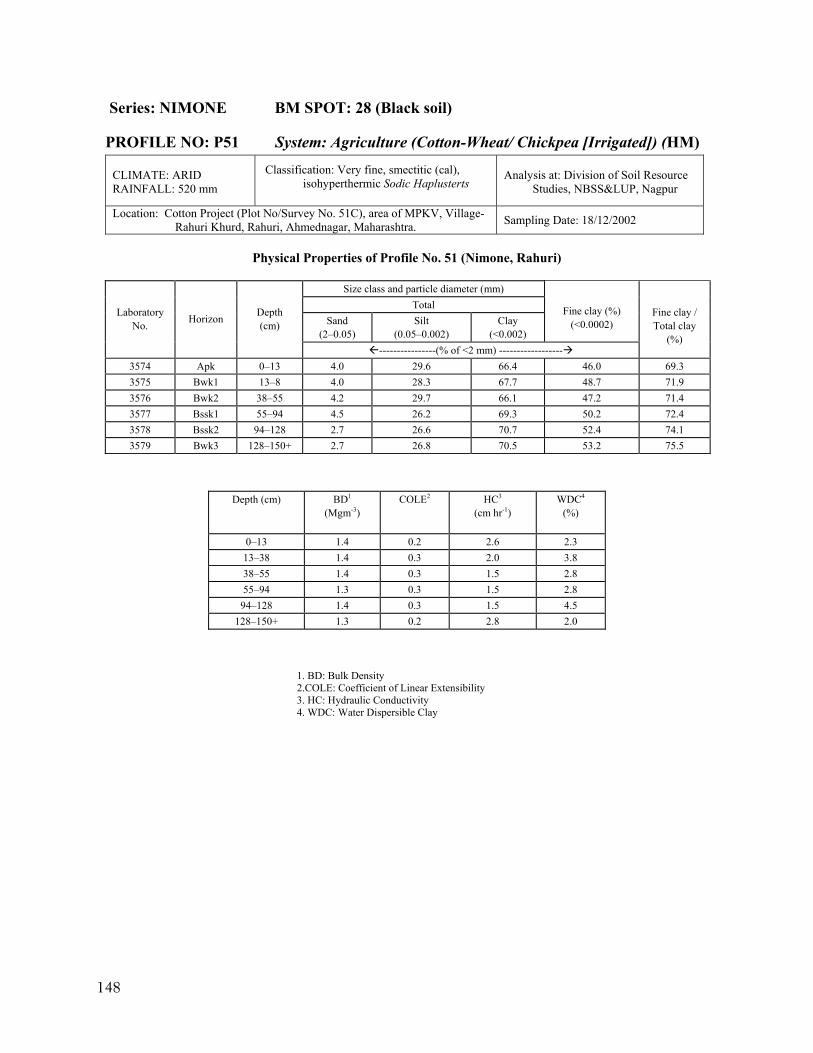
148
Series: NIMONE BM SPOT: 28 (Black soil)
PROFILE NO: P51 System: Agriculture (Cotton-Wheat/ Chickpea [Irrigated]) (HM)
CLIMATE: ARID RAINFALL: 520 mm
Classification: Very fine, smectitic (cal), isohyperthermic Sodic Haplusterts
Analysis at: Division of Soil Resource Studies, NBSS&LUP, Nagpur
Location: Cotton Project (Plot No/Survey No. 51C), area of MPKV, Village- Rahuri Khurd, Rahuri, Ahmednagar, Maharashtra. Sampling Date: 18/12/2002
Physical Properties of Profile No. 51 (Nimone, Rahuri)
Size class and particle diameter (mm)
Total Sand
(2–0.05) Silt
(0.05–0.002) Clay
(<0.002)
Fine clay (%)
(<0.0002) Laboratory
No. Horizon Depth (cm)
----------------(% of <2 mm) ------------------
Fine clay / Total clay
(%)
3574 Apk 0–13 4.0 29.6 66.4 46.0 69.3 3575 Bwk1 13–8 4.0 28.3 67.7 48.7 71.9 3576 Bwk2 38–55 4.2 29.7 66.1 47.2 71.4 3577 Bssk1 55–94 4.5 26.2 69.3 50.2 72.4 3578 Bssk2 94–128 2.7 26.6 70.7 52.4 74.1 3579 Bwk3 128–150+ 2.7 26.8 70.5 53.2 75.5
Depth (cm) BD1
(Mgm-3) COLE2 HC3
(cm hr-1) WDC4
(%)
0–13 1.4 0.2 2.6 2.3 13–38 1.4 0.3 2.0 3.8 38–55 1.4 0.3 1.5 2.8 55–94 1.3 0.3 1.5 2.8
94–128 1.4 0.3 1.5 4.5 128–150+ 1.3 0.2 2.8 2.0
1. BD: Bulk Density 2.COLE: Coefficient of Linear Extensibility 3. HC: Hydraulic Conductivity 4. WDC: Water Dispersible Clay
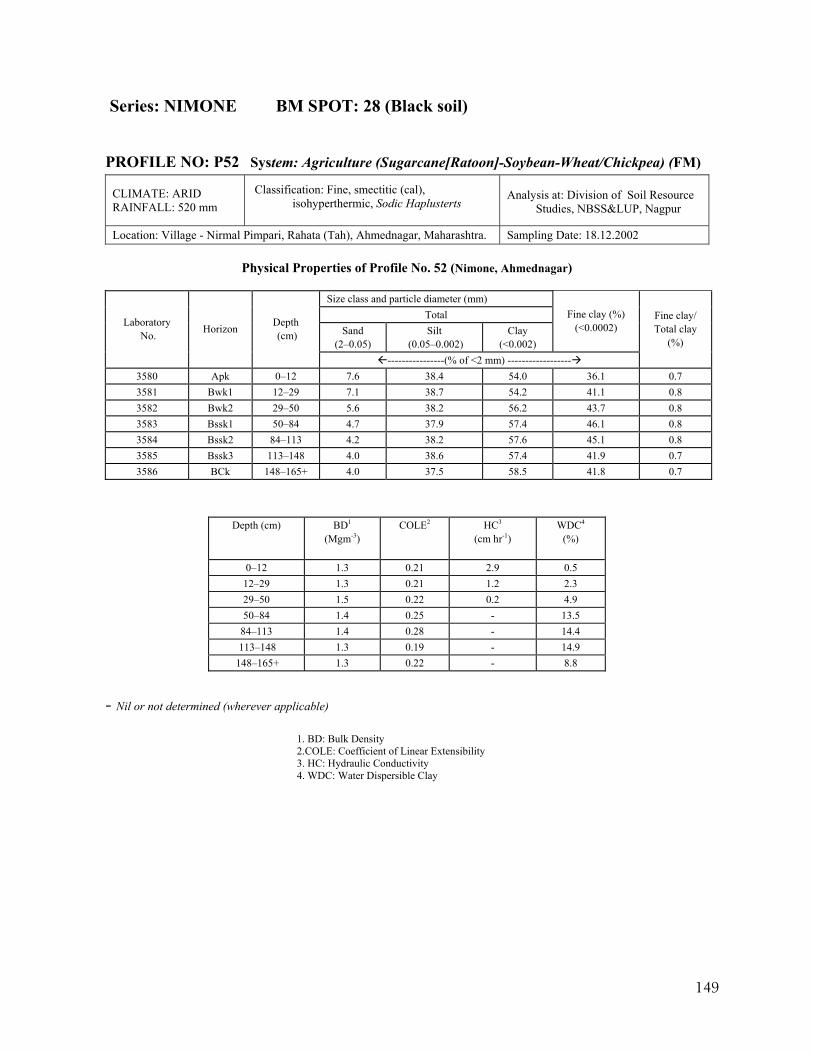
149
Series: NIMONE BM SPOT: 28 (Black soil)
PROFILE NO: P52 System: Agriculture (Sugarcane[Ratoon]-Soybean-Wheat/Chickpea) (FM)
CLIMATE: ARID RAINFALL: 520 mm
Classification: Fine, smectitic (cal), isohyperthermic, Sodic Haplusterts
Analysis at: Division of Soil Resource Studies, NBSS&LUP, Nagpur
Location: Village - Nirmal Pimpari, Rahata (Tah), Ahmednagar, Maharashtra. Sampling Date: 18.12.2002
Physical Properties of Profile No. 52 (Nimone, Ahmednagar)
Size class and particle diameter (mm) Total
Sand (2–0.05)
Silt (0.05–0.002)
Clay (<0.002)
Fine clay (%) (<0.0002) Laboratory
No. Horizon Depth (cm)
----------------(% of <2 mm) ------------------
Fine clay/ Total clay
(%)
3580 Apk 0–12 7.6 38.4 54.0 36.1 0.7 3581 Bwk1 12–29 7.1 38.7 54.2 41.1 0.8 3582 Bwk2 29–50 5.6 38.2 56.2 43.7 0.8 3583 Bssk1 50–84 4.7 37.9 57.4 46.1 0.8 3584 Bssk2 84–113 4.2 38.2 57.6 45.1 0.8 3585 Bssk3 113–148 4.0 38.6 57.4 41.9 0.7 3586 BCk 148–165+ 4.0 37.5 58.5 41.8 0.7
Depth (cm) BD1
(Mgm-3) COLE2 HC3
(cm hr-1) WDC4
(%)
0–12 1.3 0.21 2.9 0.5 12–29 1.3 0.21 1.2 2.3 29–50 1.5 0.22 0.2 4.9 50–84 1.4 0.25 - 13.5
84–113 1.4 0.28 - 14.4 113–148 1.3 0.19 - 14.9
148–165+ 1.3 0.22 - 8.8
- Nil or not determined (wherever applicable)
1. BD: Bulk Density 2.COLE: Coefficient of Linear Extensibility 3. HC: Hydraulic Conductivity 4. WDC: Water Dispersible Clay


151
RED SOILS
(Sub-humid moist)
(MAR: > 1100 mm)
Benchmark Spots: 11, 12
No. of Pedons: 4 (P23, P24, P25, P26)
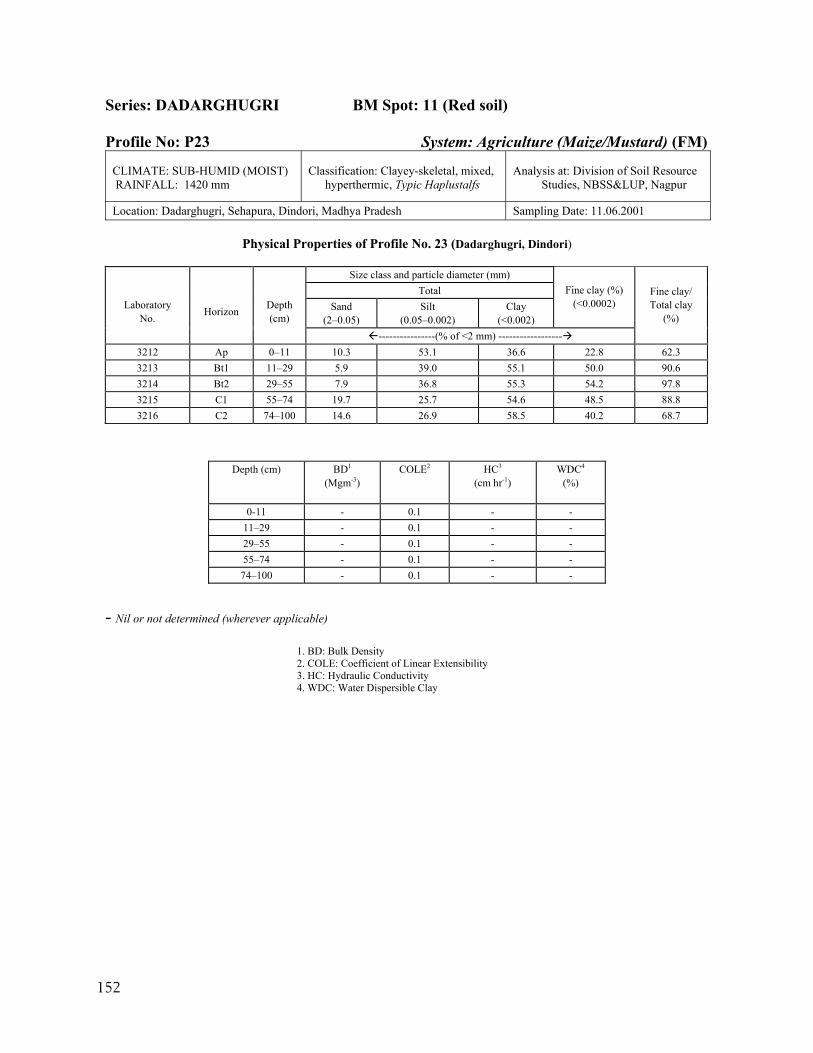
152
Series: DADARGHUGRI BM Spot: 11 (Red soil) Profile No: P23 System: Agriculture (Maize/Mustard) (FM)
CLIMATE: SUB-HUMID (MOIST) RAINFALL: 1420 mm
Classification: Clayey-skeletal, mixed, hyperthermic, Typic Haplustalfs
Analysis at: Division of Soil Resource Studies, NBSS&LUP, Nagpur
Location: Dadarghugri, Sehapura, Dindori, Madhya Pradesh Sampling Date: 11.06.2001
Physical Properties of Profile No. 23 (Dadarghugri, Dindori)
Size class and particle diameter (mm) Total
Sand (2–0.05)
Silt (0.05–0.002)
Clay (<0.002)
Fine clay (%) (<0.0002)
Laboratory
No.
Horizon
Depth (cm)
----------------(% of <2 mm) ------------------
Fine clay/ Total clay
(%)
3212 Ap 0–11 10.3 53.1 36.6 22.8 62.3 3213 Bt1 11–29 5.9 39.0 55.1 50.0 90.6 3214 Bt2 29–55 7.9 36.8 55.3 54.2 97.8 3215 C1 55–74 19.7 25.7 54.6 48.5 88.8 3216 C2 74–100 14.6 26.9 58.5 40.2 68.7
Depth (cm) BD1
(Mgm-3) COLE2 HC3
(cm hr-1) WDC4
(%)
0-11 - 0.1 - - 11–29 - 0.1 - - 29–55 - 0.1 - - 55–74 - 0.1 - -
74–100 - 0.1 - -
- Nil or not determined (wherever applicable)
1. BD: Bulk Density 2. COLE: Coefficient of Linear Extensibility 3. HC: Hydraulic Conductivity 4. WDC: Water Dispersible Clay
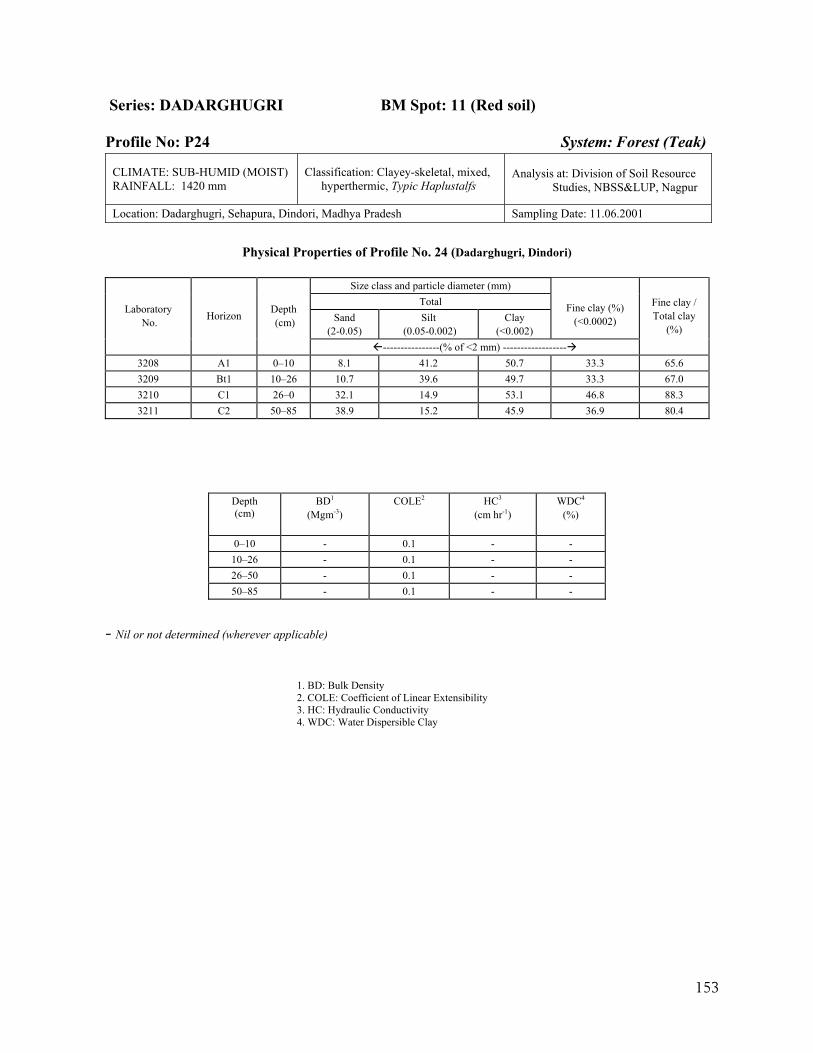
153
Series: DADARGHUGRI BM Spot: 11 (Red soil) Profile No: P24 System: Forest (Teak)
CLIMATE: SUB-HUMID (MOIST) RAINFALL: 1420 mm
Classification: Clayey-skeletal, mixed, hyperthermic, Typic Haplustalfs
Analysis at: Division of Soil Resource Studies, NBSS&LUP, Nagpur
Location: Dadarghugri, Sehapura, Dindori, Madhya Pradesh Sampling Date: 11.06.2001
Physical Properties of Profile No. 24 (Dadarghugri, Dindori)
Size class and particle diameter (mm)
Total Sand
(2-0.05) Silt
(0.05-0.002) Clay
(<0.002)
Fine clay (%)
(<0.0002) Laboratory
No. Horizon Depth (cm)
----------------(% of <2 mm) ------------------
Fine clay / Total clay
(%)
3208 A1 0–10 8.1 41.2 50.7 33.3 65.6 3209 Bt1 10–26 10.7 39.6 49.7 33.3 67.0 3210 C1 26–0 32.1 14.9 53.1 46.8 88.3 3211 C2 50–85 38.9 15.2 45.9 36.9 80.4
Depth (cm)
BD1
(Mgm-3) COLE2 HC3
(cm hr-1) WDC4
(%)
0–10 - 0.1 - - 10–26 - 0.1 - - 26–50 - 0.1 - - 50–85 - 0.1 - -
- Nil or not determined (wherever applicable)
1. BD: Bulk Density 2. COLE: Coefficient of Linear Extensibility 3. HC: Hydraulic Conductivity 4. WDC: Water Dispersible Clay
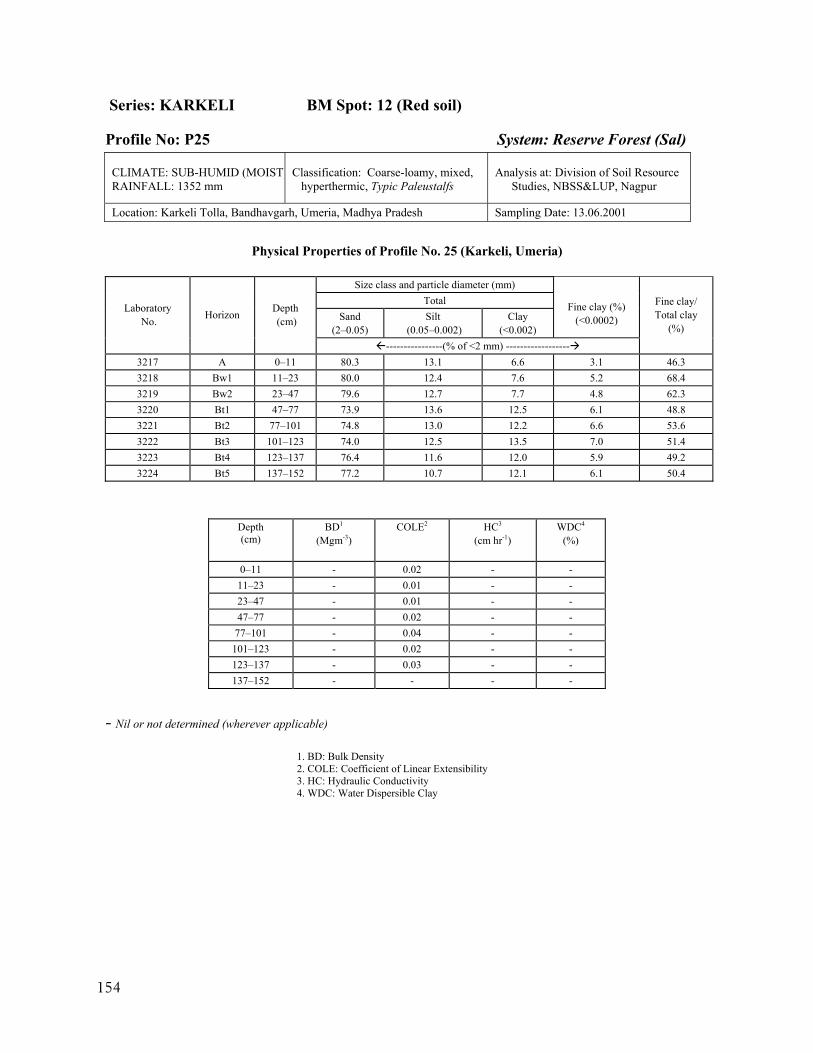
154
Series: KARKELI BM Spot: 12 (Red soil)
Profile No: P25 System: Reserve Forest (Sal)
CLIMATE: SUB-HUMID (MOIST)RAINFALL: 1352 mm
Classification: Coarse-loamy, mixed, hyperthermic, Typic Paleustalfs
Analysis at: Division of Soil Resource Studies, NBSS&LUP, Nagpur
Location: Karkeli Tolla, Bandhavgarh, Umeria, Madhya Pradesh Sampling Date: 13.06.2001
Physical Properties of Profile No. 25 (Karkeli, Umeria)
Size class and particle diameter (mm)
Total Sand
(2–0.05) Silt
(0.05–0.002) Clay
(<0.002)
Fine clay (%)
(<0.0002) Laboratory
No. Horizon Depth (cm)
----------------(% of <2 mm) ------------------
Fine clay/ Total clay
(%)
3217 A 0–11 80.3 13.1 6.6 3.1 46.3 3218 Bw1 11–23 80.0 12.4 7.6 5.2 68.4 3219 Bw2 23–47 79.6 12.7 7.7 4.8 62.3 3220 Bt1 47–77 73.9 13.6 12.5 6.1 48.8 3221 Bt2 77–101 74.8 13.0 12.2 6.6 53.6 3222 Bt3 101–123 74.0 12.5 13.5 7.0 51.4 3223 Bt4 123–137 76.4 11.6 12.0 5.9 49.2 3224 Bt5 137–152 77.2 10.7 12.1 6.1 50.4
Depth (cm)
BD1
(Mgm-3) COLE2 HC3
(cm hr-1) WDC4
(%)
0–11 - 0.02 - - 11–23 - 0.01 - - 23–47 - 0.01 - - 47–77 - 0.02 - - 77–101 - 0.04 - -
101–123 - 0.02 - - 123–137 - 0.03 - - 137–152 - - - -
- Nil or not determined (wherever applicable)
1. BD: Bulk Density 2. COLE: Coefficient of Linear Extensibility 3. HC: Hydraulic Conductivity 4. WDC: Water Dispersible Clay
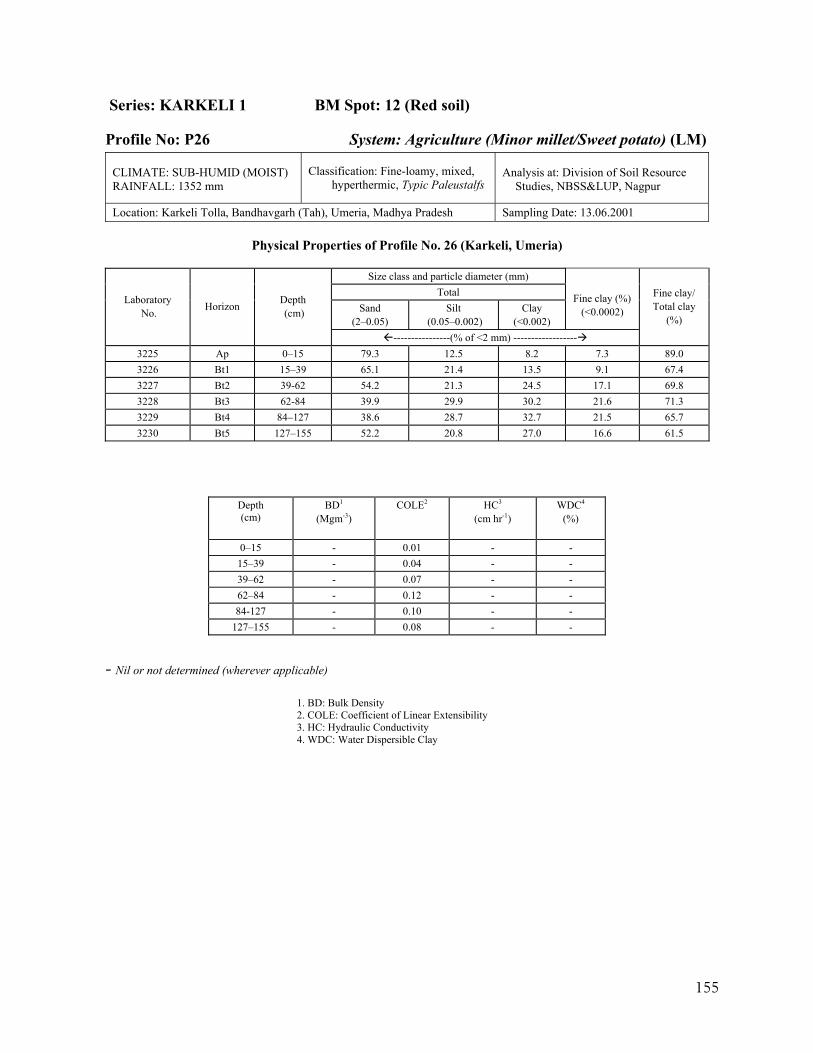
155
Series: KARKELI 1 BM Spot: 12 (Red soil)
Profile No: P26 System: Agriculture (Minor millet/Sweet potato) (LM)
CLIMATE: SUB-HUMID (MOIST) RAINFALL: 1352 mm
Classification: Fine-loamy, mixed, hyperthermic, Typic Paleustalfs
Analysis at: Division of Soil Resource Studies, NBSS&LUP, Nagpur
Location: Karkeli Tolla, Bandhavgarh (Tah), Umeria, Madhya Pradesh Sampling Date: 13.06.2001
Physical Properties of Profile No. 26 (Karkeli, Umeria)
Size class and particle diameter (mm) Total
Sand (2–0.05)
Silt (0.05–0.002)
Clay (<0.002)
Fine clay (%)
(<0.0002) Laboratory
No. Horizon Depth (cm)
----------------(% of <2 mm) ------------------
Fine clay/ Total clay
(%)
3225 Ap 0–15 79.3 12.5 8.2 7.3 89.0 3226 Bt1 15–39 65.1 21.4 13.5 9.1 67.4 3227 Bt2 39-62 54.2 21.3 24.5 17.1 69.8 3228 Bt3 62-84 39.9 29.9 30.2 21.6 71.3 3229 Bt4 84–127 38.6 28.7 32.7 21.5 65.7 3230 Bt5 127–155 52.2 20.8 27.0 16.6 61.5
Depth (cm)
BD1
(Mgm-3) COLE2 HC3
(cm hr-1) WDC4
(%)
0–15 - 0.01 - - 15–39 - 0.04 - - 39–62 - 0.07 - - 62–84 - 0.12 - - 84-127 - 0.10 - -
127–155 - 0.08 - -
- Nil or not determined (wherever applicable)
1. BD: Bulk Density 2. COLE: Coefficient of Linear Extensibility 3. HC: Hydraulic Conductivity 4. WDC: Water Dispersible Clay

157
RED SOILS
(Semi-arid moist)
(MAR : > 1000-850 mm)
Benchmark Spots: 8
No. of Pedons: 3 (P16, P17, P18)
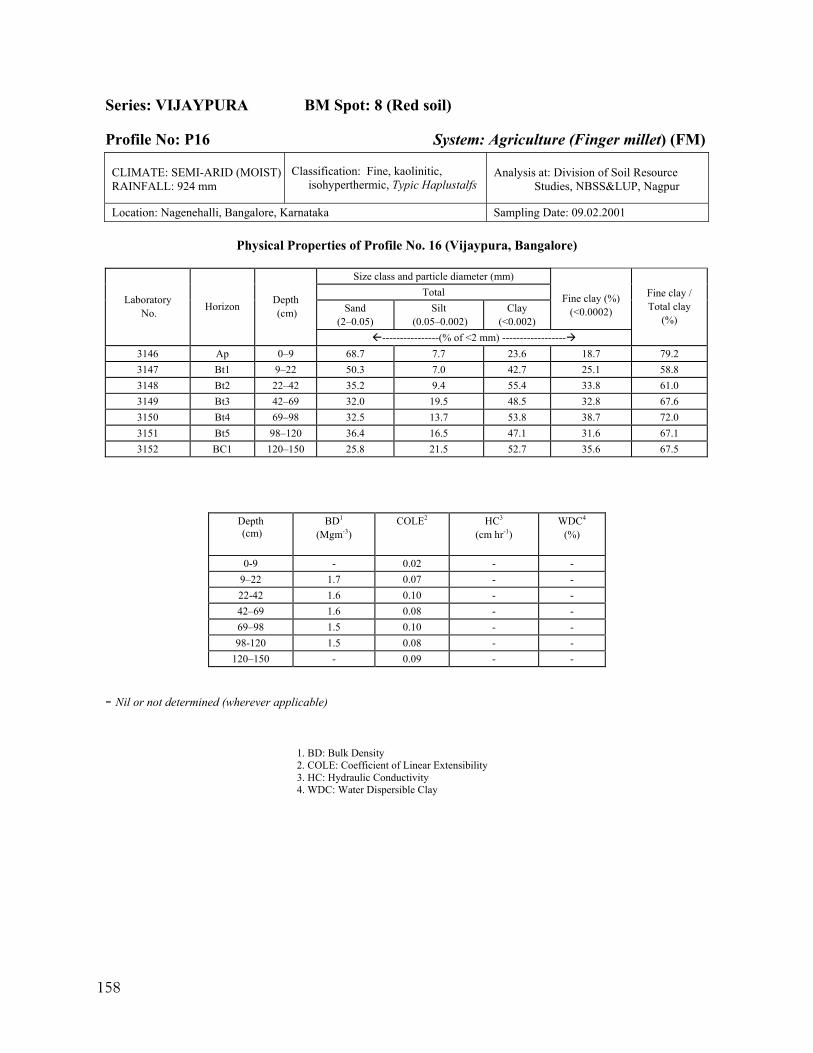
158
Series: VIJAYPURA BM Spot: 8 (Red soil)
Profile No: P16 System: Agriculture (Finger millet) (FM)
CLIMATE: SEMI-ARID (MOIST) RAINFALL: 924 mm
Classification: Fine, kaolinitic, isohyperthermic, Typic Haplustalfs
Analysis at: Division of Soil Resource Studies, NBSS&LUP, Nagpur
Location: Nagenehalli, Bangalore, Karnataka Sampling Date: 09.02.2001
Physical Properties of Profile No. 16 (Vijaypura, Bangalore)
Size class and particle diameter (mm) Total
Sand (2–0.05)
Silt (0.05–0.002)
Clay (<0.002)
Fine clay (%)
(<0.0002) Laboratory
No. Horizon Depth (cm)
----------------(% of <2 mm) ------------------
Fine clay / Total clay
(%)
3146 Ap 0–9 68.7 7.7 23.6 18.7 79.2 3147 Bt1 9–22 50.3 7.0 42.7 25.1 58.8 3148 Bt2 22–42 35.2 9.4 55.4 33.8 61.0 3149 Bt3 42–69 32.0 19.5 48.5 32.8 67.6 3150 Bt4 69–98 32.5 13.7 53.8 38.7 72.0 3151 Bt5 98–120 36.4 16.5 47.1 31.6 67.1 3152 BC1 120–150 25.8 21.5 52.7 35.6 67.5
Depth (cm)
BD1
(Mgm-3) COLE2 HC3
(cm hr-1) WDC4
(%)
0-9 - 0.02 - - 9–22 1.7 0.07 - - 22-42 1.6 0.10 - - 42–69 1.6 0.08 - - 69–98 1.5 0.10 - - 98-120 1.5 0.08 - -
120–150 - 0.09 - -
- Nil or not determined (wherever applicable)
1. BD: Bulk Density 2. COLE: Coefficient of Linear Extensibility 3. HC: Hydraulic Conductivity 4. WDC: Water Dispersible Clay
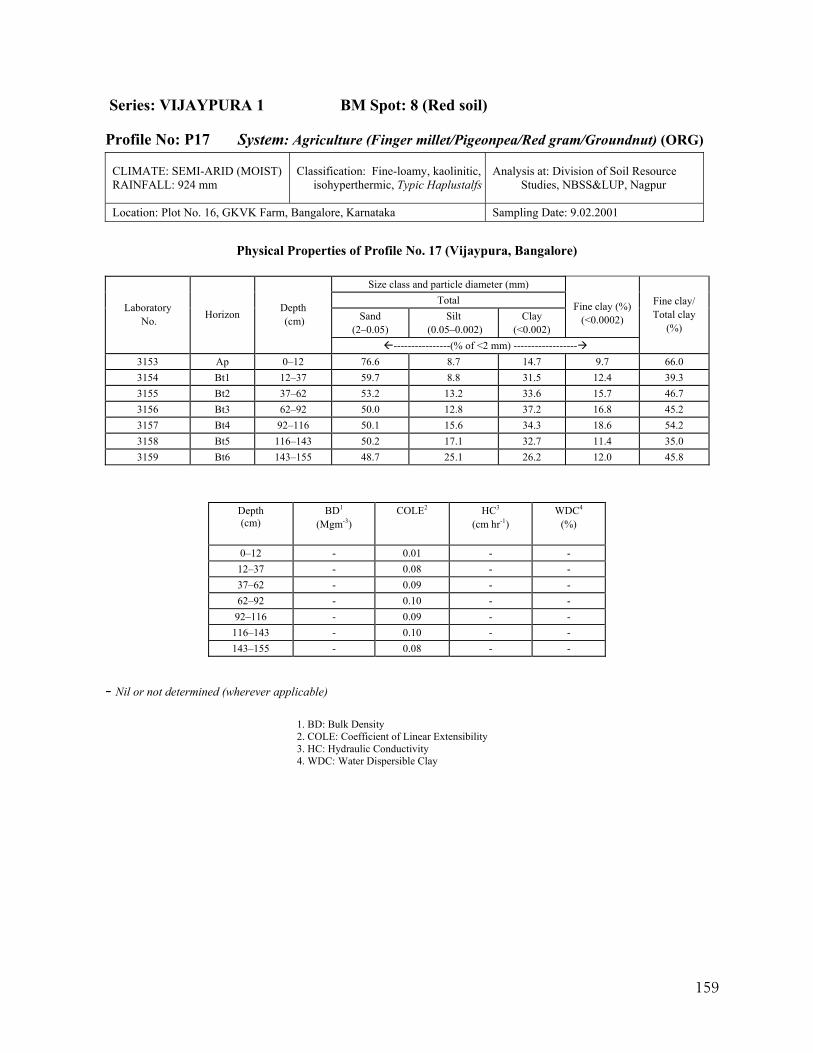
159
Series: VIJAYPURA 1 BM Spot: 8 (Red soil)
Profile No: P17 System: Agriculture (Finger millet/Pigeonpea/Red gram/Groundnut) (ORG)
CLIMATE: SEMI-ARID (MOIST) RAINFALL: 924 mm
Classification: Fine-loamy, kaolinitic, isohyperthermic, Typic Haplustalfs
Analysis at: Division of Soil Resource Studies, NBSS&LUP, Nagpur
Location: Plot No. 16, GKVK Farm, Bangalore, Karnataka Sampling Date: 9.02.2001
Physical Properties of Profile No. 17 (Vijaypura, Bangalore)
Size class and particle diameter (mm)
Total Sand
(2–0.05) Silt
(0.05–0.002) Clay
(<0.002)
Fine clay (%)
(<0.0002) Laboratory
No. Horizon Depth (cm)
----------------(% of <2 mm) ------------------
Fine clay/ Total clay
(%)
3153 Ap 0–12 76.6 8.7 14.7 9.7 66.0 3154 Bt1 12–37 59.7 8.8 31.5 12.4 39.3 3155 Bt2 37–62 53.2 13.2 33.6 15.7 46.7 3156 Bt3 62–92 50.0 12.8 37.2 16.8 45.2 3157 Bt4 92–116 50.1 15.6 34.3 18.6 54.2 3158 Bt5 116–143 50.2 17.1 32.7 11.4 35.0 3159 Bt6 143–155 48.7 25.1 26.2 12.0 45.8
Depth (cm)
BD1
(Mgm-3) COLE2 HC3
(cm hr-1) WDC4
(%)
0–12 - 0.01 - - 12–37 - 0.08 - - 37–62 - 0.09 - - 62–92 - 0.10 - -
92–116 - 0.09 - - 116–143 - 0.10 - - 143–155 - 0.08 - -
- Nil or not determined (wherever applicable)
1. BD: Bulk Density 2. COLE: Coefficient of Linear Extensibility 3. HC: Hydraulic Conductivity 4. WDC: Water Dispersible Clay
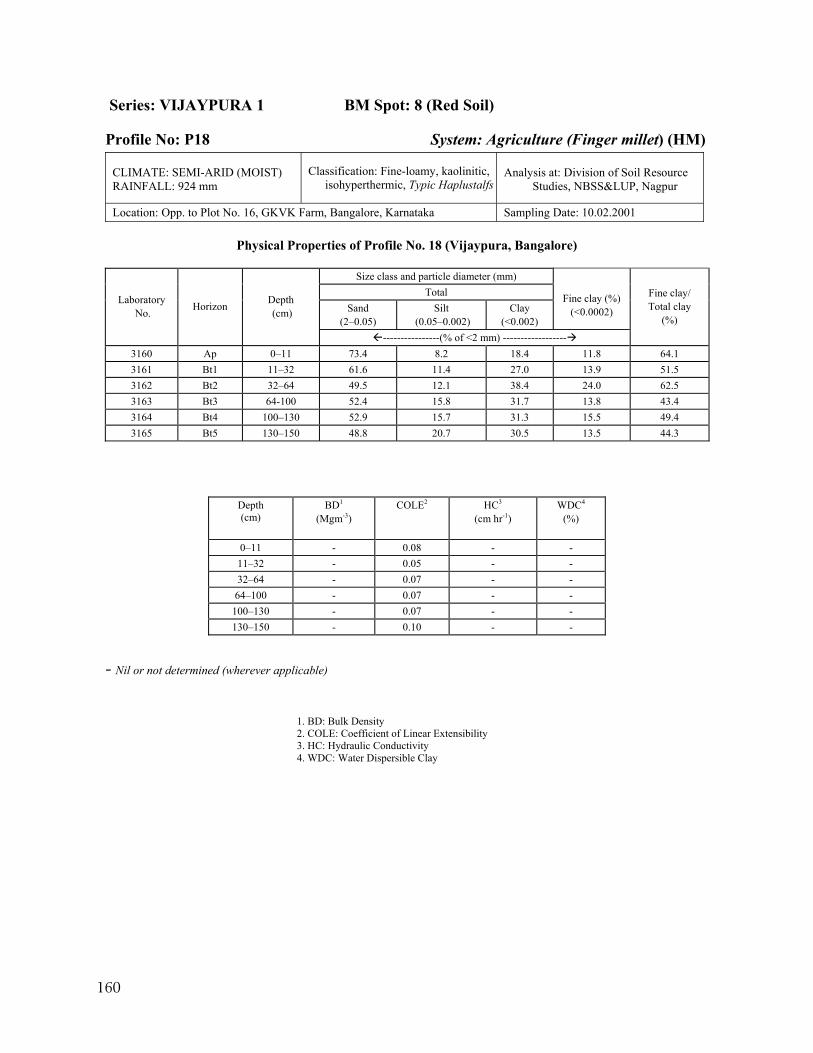
160
Series: VIJAYPURA 1 BM Spot: 8 (Red Soil)
Profile No: P18 System: Agriculture (Finger millet) (HM)
CLIMATE: SEMI-ARID (MOIST) RAINFALL: 924 mm
Classification: Fine-loamy, kaolinitic, isohyperthermic, Typic Haplustalfs
Analysis at: Division of Soil Resource Studies, NBSS&LUP, Nagpur
Location: Opp. to Plot No. 16, GKVK Farm, Bangalore, Karnataka Sampling Date: 10.02.2001
Physical Properties of Profile No. 18 (Vijaypura, Bangalore)
Size class and particle diameter (mm) Total
Sand (2–0.05)
Silt (0.05–0.002)
Clay (<0.002)
Fine clay (%)
(<0.0002) Laboratory
No. Horizon Depth (cm)
----------------(% of <2 mm) ------------------
Fine clay/ Total clay
(%)
3160 Ap 0–11 73.4 8.2 18.4 11.8 64.1 3161 Bt1 11–32 61.6 11.4 27.0 13.9 51.5 3162 Bt2 32–64 49.5 12.1 38.4 24.0 62.5 3163 Bt3 64-100 52.4 15.8 31.7 13.8 43.4 3164 Bt4 100–130 52.9 15.7 31.3 15.5 49.4 3165 Bt5 130–150 48.8 20.7 30.5 13.5 44.3
Depth (cm)
BD1
(Mgm-3) COLE2 HC3
(cm hr-1) WDC4
(%)
0–11 - 0.08 - - 11–32 - 0.05 - - 32–64 - 0.07 - - 64–100 - 0.07 - -
100–130 - 0.07 - - 130–150 - 0.10 - -
- Nil or not determined (wherever applicable)
1. BD: Bulk Density 2. COLE: Coefficient of Linear Extensibility 3. HC: Hydraulic Conductivity 4. WDC: Water Dispersible Clay
161
RED SOILS
(Semi-arid dry)
(MAR : 850-550 mm)
Benchmark Spots: 10, 17, 19, 21
No. of Pedons: 5 (P22, P34, P37, P38, P41)
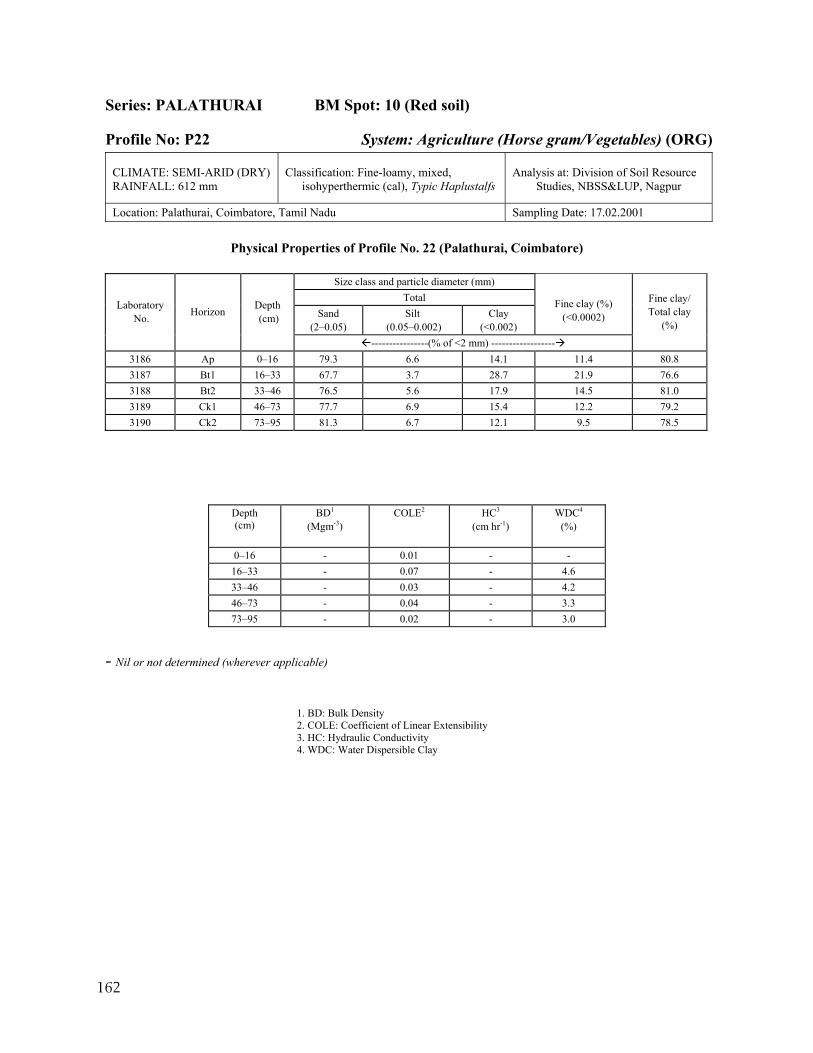
162
Series: PALATHURAI BM Spot: 10 (Red soil)
Profile No: P22 System: Agriculture (Horse gram/Vegetables) (ORG)
CLIMATE: SEMI-ARID (DRY) RAINFALL: 612 mm
Classification: Fine-loamy, mixed, isohyperthermic (cal), Typic Haplustalfs
Analysis at: Division of Soil Resource Studies, NBSS&LUP, Nagpur
Location: Palathurai, Coimbatore, Tamil Nadu Sampling Date: 17.02.2001
Physical Properties of Profile No. 22 (Palathurai, Coimbatore)
Size class and particle diameter (mm) Total
Sand (2–0.05)
Silt (0.05–0.002)
Clay (<0.002)
Fine clay (%)
(<0.0002) Laboratory
No. Horizon Depth (cm)
----------------(% of <2 mm) ------------------
Fine clay/ Total clay
(%)
3186 Ap 0–16 79.3 6.6 14.1 11.4 80.8 3187 Bt1 16–33 67.7 3.7 28.7 21.9 76.6 3188 Bt2 33–46 76.5 5.6 17.9 14.5 81.0 3189 Ck1 46–73 77.7 6.9 15.4 12.2 79.2 3190 Ck2 73–95 81.3 6.7 12.1 9.5 78.5
Depth (cm)
BD1
(Mgm-3) COLE2 HC3
(cm hr-1) WDC4
(%)
0–16 - 0.01 - - 16–33 - 0.07 - 4.6 33–46 - 0.03 - 4.2 46–73 - 0.04 - 3.3 73–95 - 0.02 - 3.0
- Nil or not determined (wherever applicable)
1. BD: Bulk Density 2. COLE: Coefficient of Linear Extensibility 3. HC: Hydraulic Conductivity 4. WDC: Water Dispersible Clay
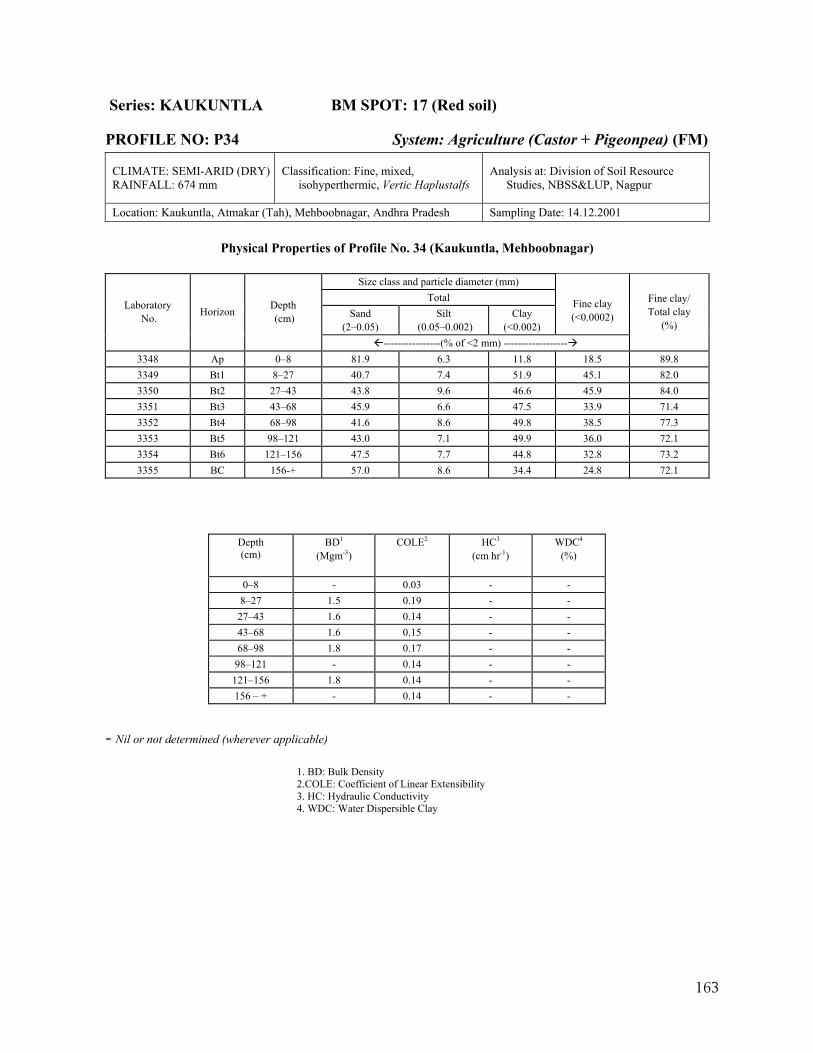
163
Series: KAUKUNTLA BM SPOT: 17 (Red soil)
PROFILE NO: P34 System: Agriculture (Castor + Pigeonpea) (FM) CLIMATE: SEMI-ARID (DRY) RAINFALL: 674 mm
Classification: Fine, mixed, isohyperthermic, Vertic Haplustalfs
Analysis at: Division of Soil Resource Studies, NBSS&LUP, Nagpur
Location: Kaukuntla, Atmakar (Tah), Mehboobnagar, Andhra Pradesh Sampling Date: 14.12.2001
Physical Properties of Profile No. 34 (Kaukuntla, Mehboobnagar)
Size class and particle diameter (mm) Total
Sand (2–0.05)
Silt (0.05–0.002)
Clay (<0.002)
Fine clay (<0.0002)
Laboratory No. Horizon Depth
(cm)
----------------(% of <2 mm) ------------------
Fine clay/ Total clay
(%)
3348 Ap 0–8 81.9 6.3 11.8 18.5 89.8 3349 Bt1 8–27 40.7 7.4 51.9 45.1 82.0 3350 Bt2 27–43 43.8 9.6 46.6 45.9 84.0 3351 Bt3 43–68 45.9 6.6 47.5 33.9 71.4 3352 Bt4 68–98 41.6 8.6 49.8 38.5 77.3 3353 Bt5 98–121 43.0 7.1 49.9 36.0 72.1 3354 Bt6 121–156 47.5 7.7 44.8 32.8 73.2 3355 BC 156-+ 57.0 8.6 34.4 24.8 72.1
Depth (cm)
BD1
(Mgm-3) COLE2 HC3
(cm hr-1) WDC4
(%)
0–8 - 0.03 - - 8–27 1.5 0.19 - - 27–43 1.6 0.14 - - 43–68 1.6 0.15 - - 68–98 1.8 0.17 - -
98–121 - 0.14 - - 121–156 1.8 0.14 - - 156 – + - 0.14 - -
- Nil or not determined (wherever applicable)
1. BD: Bulk Density 2.COLE: Coefficient of Linear Extensibility 3. HC: Hydraulic Conductivity 4. WDC: Water Dispersible Clay
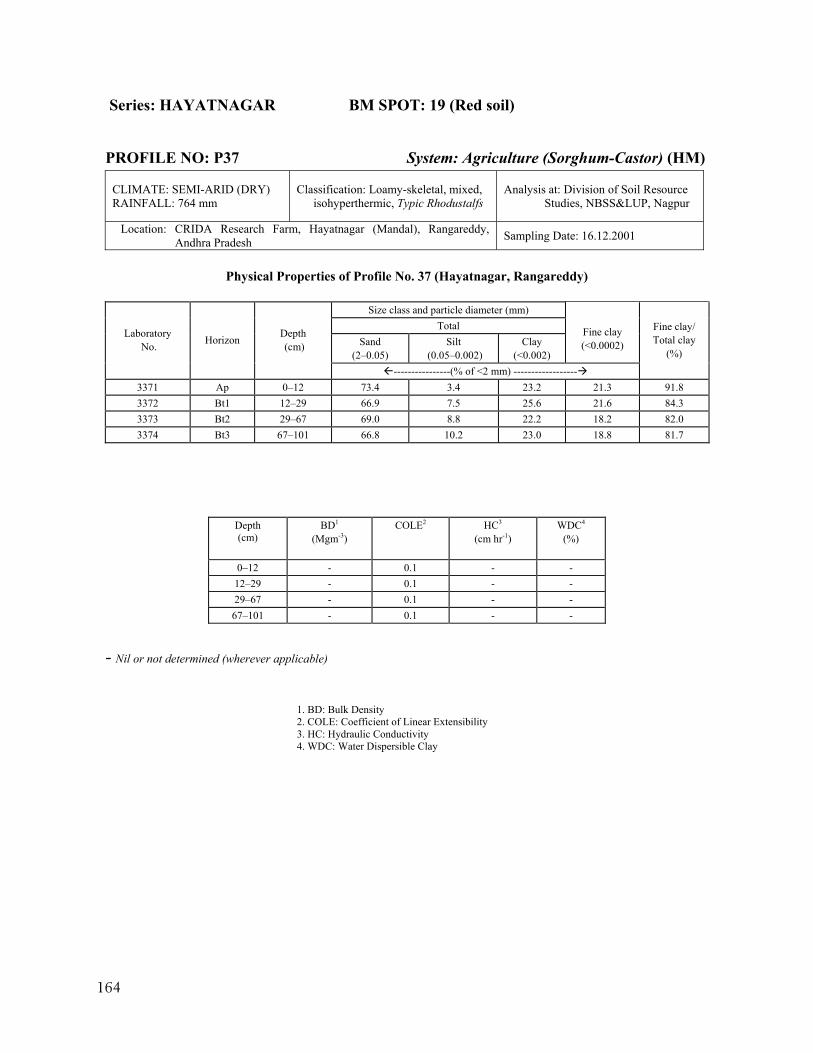
164
Series: HAYATNAGAR BM SPOT: 19 (Red soil)
PROFILE NO: P37 System: Agriculture (Sorghum-Castor) (HM)
CLIMATE: SEMI-ARID (DRY) RAINFALL: 764 mm
Classification: Loamy-skeletal, mixed, isohyperthermic, Typic Rhodustalfs
Analysis at: Division of Soil Resource Studies, NBSS&LUP, Nagpur
Location: CRIDA Research Farm, Hayatnagar (Mandal), Rangareddy, Andhra Pradesh Sampling Date: 16.12.2001
Physical Properties of Profile No. 37 (Hayatnagar, Rangareddy)
Size class and particle diameter (mm)
Total Sand
(2–0.05) Silt
(0.05–0.002) Clay
(<0.002)
Fine clay (<0.0002)
Laboratory No. Horizon Depth
(cm)
----------------(% of <2 mm) ------------------
Fine clay/ Total clay
(%)
3371 Ap 0–12 73.4 3.4 23.2 21.3 91.8 3372 Bt1 12–29 66.9 7.5 25.6 21.6 84.3 3373 Bt2 29–67 69.0 8.8 22.2 18.2 82.0 3374 Bt3 67–101 66.8 10.2 23.0 18.8 81.7
Depth (cm)
BD1
(Mgm-3) COLE2 HC3
(cm hr-1) WDC4
(%)
0–12 - 0.1 - - 12–29 - 0.1 - - 29–67 - 0.1 - - 67–101 - 0.1 - -
- Nil or not determined (wherever applicable)
1. BD: Bulk Density 2. COLE: Coefficient of Linear Extensibility 3. HC: Hydraulic Conductivity 4. WDC: Water Dispersible Clay
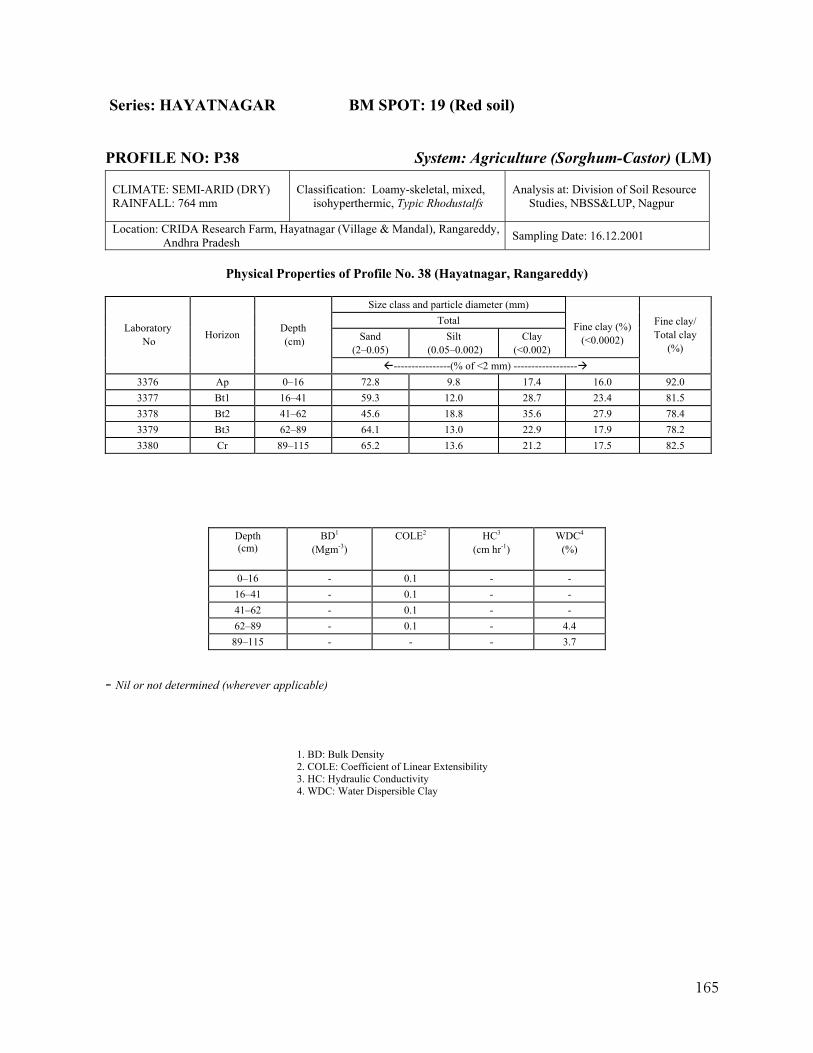
165
Series: HAYATNAGAR BM SPOT: 19 (Red soil)
PROFILE NO: P38 System: Agriculture (Sorghum-Castor) (LM)
CLIMATE: SEMI-ARID (DRY) RAINFALL: 764 mm
Classification: Loamy-skeletal, mixed, isohyperthermic, Typic Rhodustalfs
Analysis at: Division of Soil Resource Studies, NBSS&LUP, Nagpur
Location: CRIDA Research Farm, Hayatnagar (Village & Mandal), Rangareddy, Andhra Pradesh Sampling Date: 16.12.2001
Physical Properties of Profile No. 38 (Hayatnagar, Rangareddy)
Size class and particle diameter (mm)
Total Sand
(2–0.05) Silt
(0.05–0.002) Clay
(<0.002)
Fine clay (%)
(<0.0002) Laboratory
No Horizon Depth (cm)
----------------(% of <2 mm) ------------------
Fine clay/ Total clay
(%)
3376 Ap 0–16 72.8 9.8 17.4 16.0 92.0 3377 Bt1 16–41 59.3 12.0 28.7 23.4 81.5 3378 Bt2 41–62 45.6 18.8 35.6 27.9 78.4 3379 Bt3 62–89 64.1 13.0 22.9 17.9 78.2 3380 Cr 89–115 65.2 13.6 21.2 17.5 82.5
Depth (cm)
BD1
(Mgm-3) COLE2 HC3
(cm hr-1) WDC4
(%)
0–16 - 0.1 - - 16–41 - 0.1 - - 41–62 - 0.1 - - 62–89 - 0.1 - 4.4
89–115 - - - 3.7
- Nil or not determined (wherever applicable)
1. BD: Bulk Density 2. COLE: Coefficient of Linear Extensibility 3. HC: Hydraulic Conductivity 4. WDC: Water Dispersible Clay
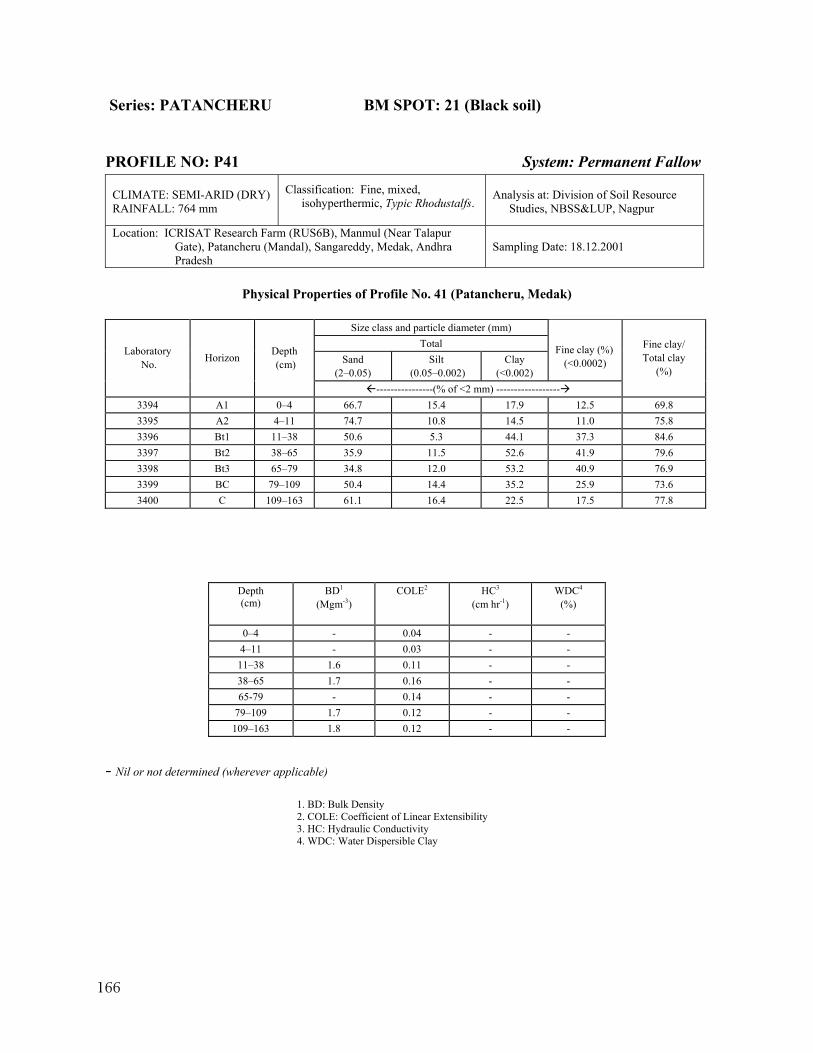
166
Series: PATANCHERU BM SPOT: 21 (Black soil)
PROFILE NO: P41 System: Permanent Fallow
CLIMATE: SEMI-ARID (DRY) RAINFALL: 764 mm
Classification: Fine, mixed, isohyperthermic, Typic Rhodustalfs.
Analysis at: Division of Soil Resource Studies, NBSS&LUP, Nagpur
Location: ICRISAT Research Farm (RUS6B), Manmul (Near Talapur Gate), Patancheru (Mandal), Sangareddy, Medak, Andhra Pradesh
Sampling Date: 18.12.2001
Physical Properties of Profile No. 41 (Patancheru, Medak)
Size class and particle diameter (mm)
Total Sand
(2–0.05) Silt
(0.05–0.002) Clay
(<0.002)
Fine clay (%)
(<0.0002) Laboratory
No. Horizon Depth (cm)
----------------(% of <2 mm) ------------------
Fine clay/ Total clay
(%)
3394 A1 0–4 66.7 15.4 17.9 12.5 69.8 3395 A2 4–11 74.7 10.8 14.5 11.0 75.8 3396 Bt1 11–38 50.6 5.3 44.1 37.3 84.6 3397 Bt2 38–65 35.9 11.5 52.6 41.9 79.6 3398 Bt3 65–79 34.8 12.0 53.2 40.9 76.9 3399 BC 79–109 50.4 14.4 35.2 25.9 73.6 3400 C 109–163 61.1 16.4 22.5 17.5 77.8
Depth (cm)
BD1
(Mgm-3) COLE2 HC3
(cm hr-1) WDC4
(%)
0–4 - 0.04 - - 4–11 - 0.03 - - 11–38 1.6 0.11 - - 38–65 1.7 0.16 - - 65-79 - 0.14 - -
79–109 1.7 0.12 - - 109–163 1.8 0.12 - -
- Nil or not determined (wherever applicable)
1. BD: Bulk Density 2. COLE: Coefficient of Linear Extensibility 3. HC: Hydraulic Conductivity 4. WDC: Water Dispersible Clay
167
Appendix-II
CHEMICAL PROPERTIES OF
SELECTED SOILS IN
28 BENCHMARK SPOTS

169
BLACK SOILS
(Sub-humid moist)
(MAR: > 1100 mm)
Benchmark Spots: 2, 3, 7, 13
No. of Pedons: 6 (P4, P5, P6, P15, P27, P28)
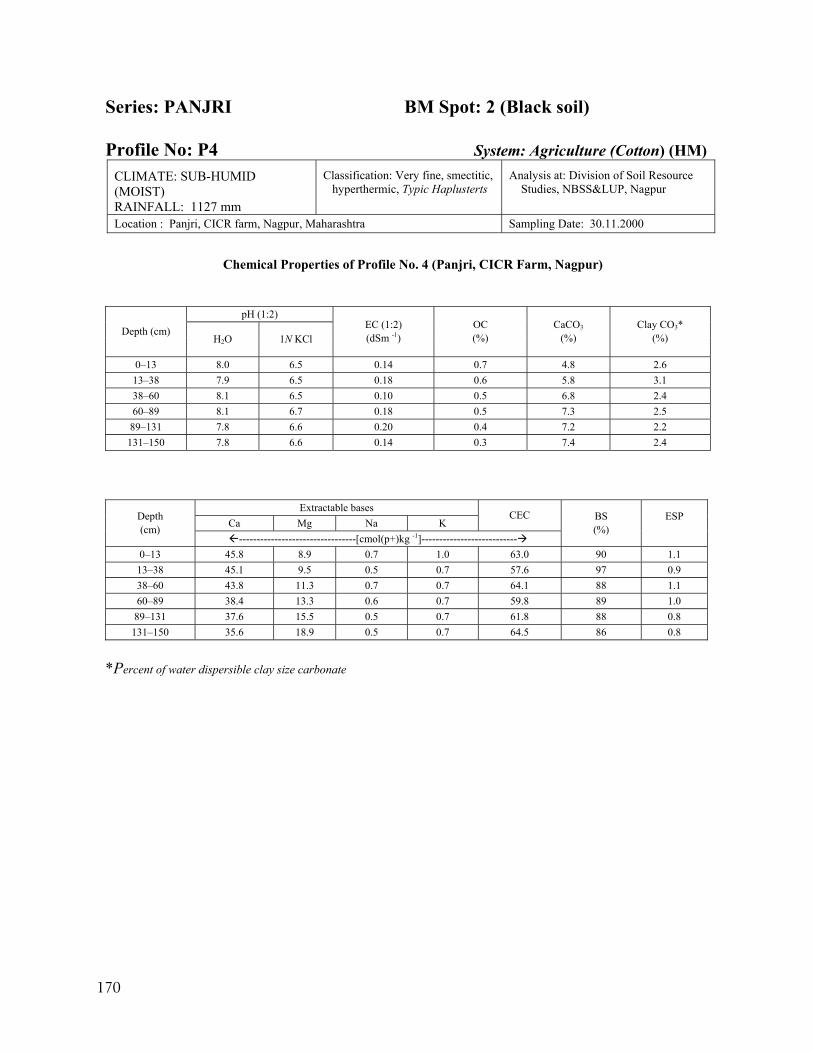
170
Series: PANJRI BM Spot: 2 (Black soil) Profile No: P4 System: Agriculture (Cotton) (HM)
CLIMATE: SUB-HUMID (MOIST) RAINFALL: 1127 mm
Classification: Very fine, smectitic, hyperthermic, Typic Haplusterts
Analysis at: Division of Soil Resource Studies, NBSS&LUP, Nagpur
Location : Panjri, CICR farm, Nagpur, Maharashtra Sampling Date: 30.11.2000
Chemical Properties of Profile No. 4 (Panjri, CICR Farm, Nagpur)
pH (1:2)
Depth (cm) H2O 1N KCl
EC (1:2) (dSm -1)
OC (%)
CaCO3 (%)
Clay CO3*
(%)
0–13 8.0 6.5 0.14 0.7 4.8 2.6 13–38 7.9 6.5 0.18 0.6 5.8 3.1 38–60 8.1 6.5 0.10 0.5 6.8 2.4 60–89 8.1 6.7 0.18 0.5 7.3 2.5
89–131 7.8 6.6 0.20 0.4 7.2 2.2 131–150 7.8 6.6 0.14 0.3 7.4 2.4
Extractable bases Ca Mg Na K
CEC Depth (cm)
---------------------------------[cmol(p+)kg -1]---------------------------
BS (%)
ESP
0–13 45.8 8.9 0.7 1.0 63.0 90 1.1 13–38 45.1 9.5 0.5 0.7 57.6 97 0.9 38–60 43.8 11.3 0.7 0.7 64.1 88 1.1 60–89 38.4 13.3 0.6 0.7 59.8 89 1.0
89–131 37.6 15.5 0.5 0.7 61.8 88 0.8 131–150 35.6 18.9 0.5 0.7 64.5 86 0.8
*Percent of water dispersible clay size carbonate
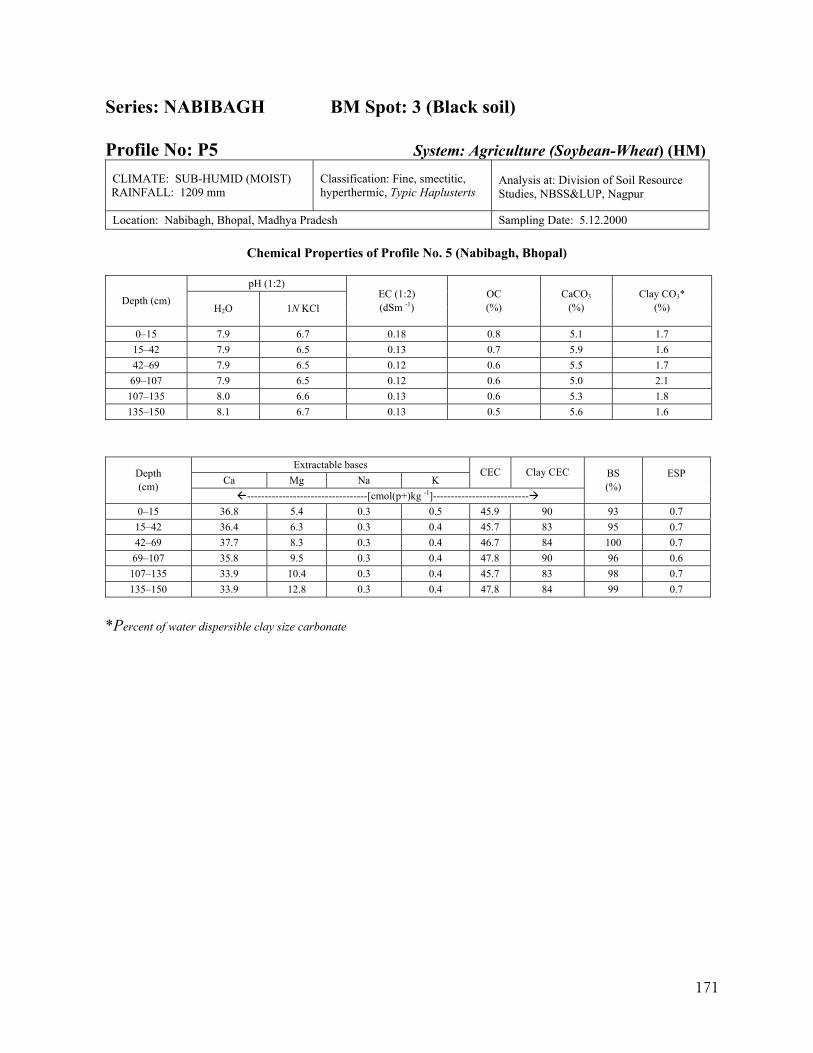
171
Series: NABIBAGH BM Spot: 3 (Black soil) Profile No: P5 System: Agriculture (Soybean-Wheat) (HM)
CLIMATE: SUB-HUMID (MOIST) RAINFALL: 1209 mm
Classification: Fine, smectitic, hyperthermic, Typic Haplusterts
Analysis at: Division of Soil Resource Studies, NBSS&LUP, Nagpur
Location: Nabibagh, Bhopal, Madhya Pradesh Sampling Date: 5.12.2000
Chemical Properties of Profile No. 5 (Nabibagh, Bhopal)
pH (1:2) Depth (cm)
H2O 1N KCl EC (1:2) (dSm -1)
OC (%)
CaCO3 (%)
Clay CO3*
(%)
0–15 7.9 6.7 0.18 0.8 5.1 1.7 15–42 7.9 6.5 0.13 0.7 5.9 1.6 42–69 7.9 6.5 0.12 0.6 5.5 1.7
69–107 7.9 6.5 0.12 0.6 5.0 2.1 107–135 8.0 6.6 0.13 0.6 5.3 1.8 135–150 8.1 6.7 0.13 0.5 5.6 1.6
Extractable bases Ca Mg Na K
CEC Clay CEC Depth (cm)
----------------------------------[cmol(p+)kg -1]---------------------------
BS (%)
ESP
0–15 36.8 5.4 0.3 0.5 45.9 90 93 0.7 15–42 36.4 6.3 0.3 0.4 45.7 83 95 0.7 42–69 37.7 8.3 0.3 0.4 46.7 84 100 0.7 69–107 35.8 9.5 0.3 0.4 47.8 90 96 0.6
107–135 33.9 10.4 0.3 0.4 45.7 83 98 0.7 135–150 33.9 12.8 0.3 0.4 47.8 84 99 0.7
*Percent of water dispersible clay size carbonate
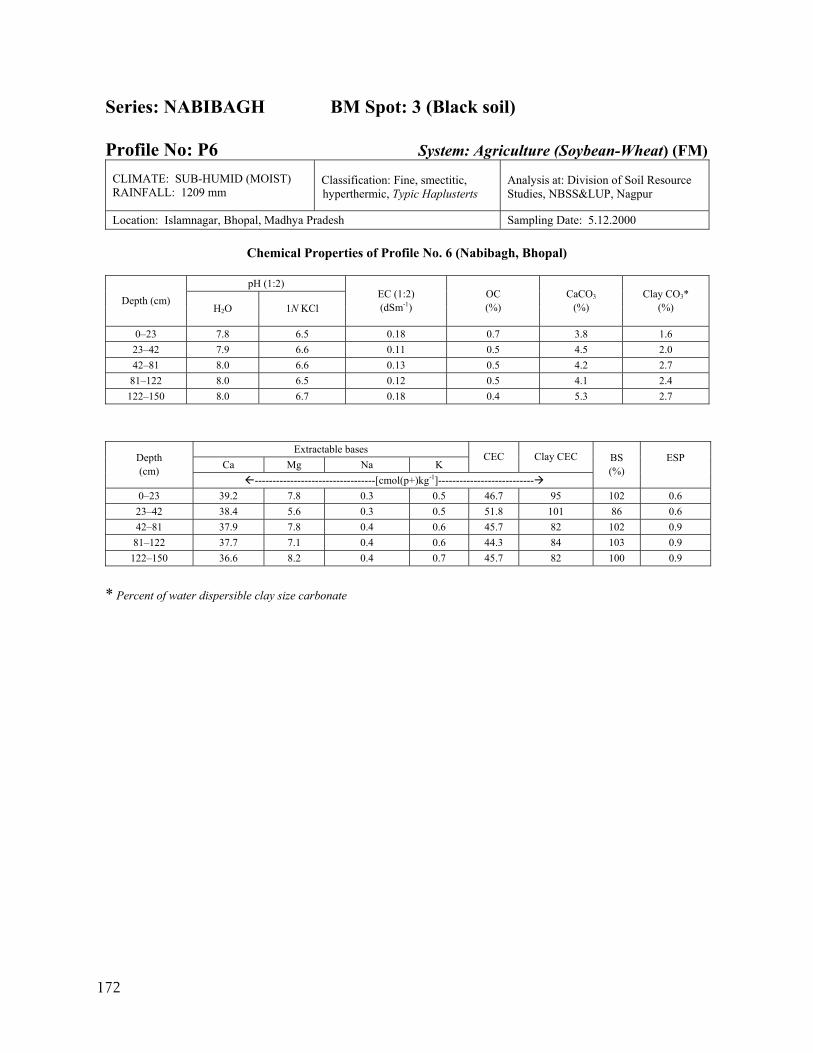
172
Series: NABIBAGH BM Spot: 3 (Black soil) Profile No: P6 System: Agriculture (Soybean-Wheat) (FM)
CLIMATE: SUB-HUMID (MOIST) RAINFALL: 1209 mm
Classification: Fine, smectitic, hyperthermic, Typic Haplusterts
Analysis at: Division of Soil Resource Studies, NBSS&LUP, Nagpur
Location: Islamnagar, Bhopal, Madhya Pradesh Sampling Date: 5.12.2000
Chemical Properties of Profile No. 6 (Nabibagh, Bhopal)
pH (1:2) Depth (cm)
H2O 1N KCl EC (1:2) (dSm-1)
OC (%)
CaCO3 (%)
Clay CO3*
(%)
0–23 7.8 6.5 0.18 0.7 3.8 1.6 23–42 7.9 6.6 0.11 0.5 4.5 2.0 42–81 8.0 6.6 0.13 0.5 4.2 2.7
81–122 8.0 6.5 0.12 0.5 4.1 2.4 122–150 8.0 6.7 0.18 0.4 5.3 2.7
Extractable bases Ca Mg Na K
CEC Clay CEC Depth (cm)
----------------------------------[cmol(p+)kg-1]---------------------------
BS (%)
ESP
0–23 39.2 7.8 0.3 0.5 46.7 95 102 0.6 23–42 38.4 5.6 0.3 0.5 51.8 101 86 0.6 42–81 37.9 7.8 0.4 0.6 45.7 82 102 0.9 81–122 37.7 7.1 0.4 0.6 44.3 84 103 0.9
122–150 36.6 8.2 0.4 0.7 45.7 82 100 0.9
* Percent of water dispersible clay size carbonate
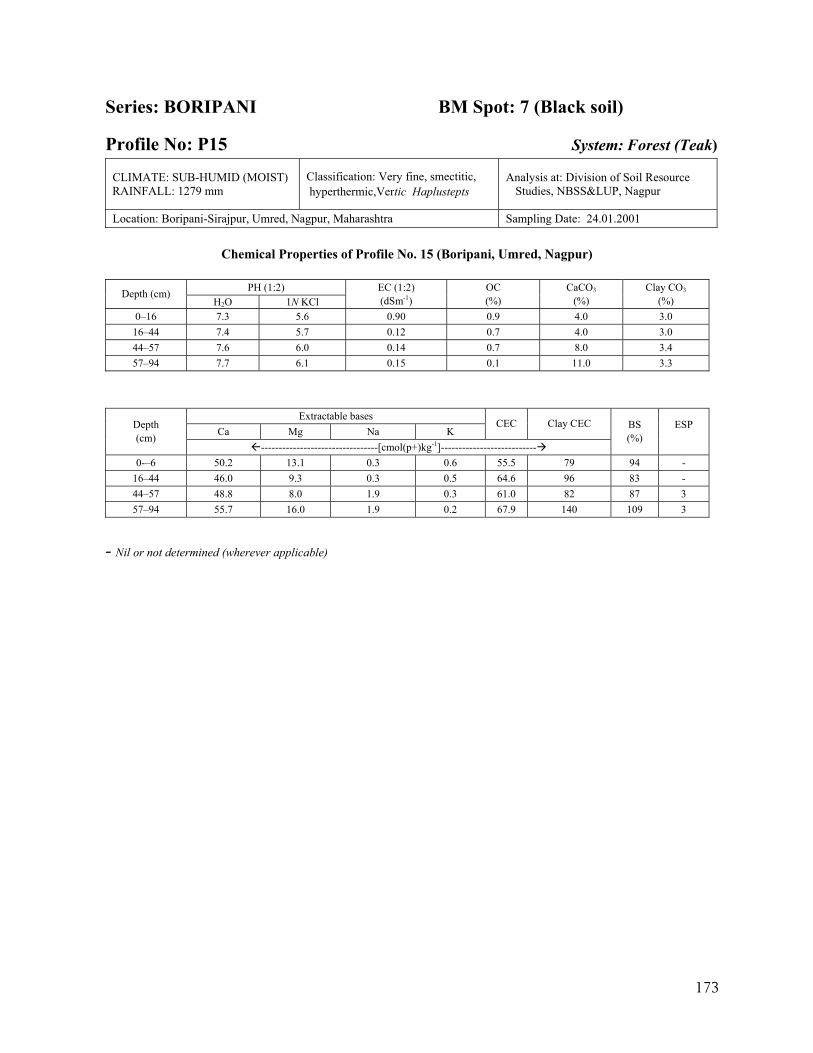
173
Series: BORIPANI BM Spot: 7 (Black soil)
Profile No: P15 System: Forest (Teak)
CLIMATE: SUB-HUMID (MOIST) RAINFALL: 1279 mm
Classification: Very fine, smectitic, hyperthermic,Vertic Haplustepts
Analysis at: Division of Soil Resource Studies, NBSS&LUP, Nagpur
Location: Boripani-Sirajpur, Umred, Nagpur, Maharashtra Sampling Date: 24.01.2001
Chemical Properties of Profile No. 15 (Boripani, Umred, Nagpur)
PH (1:2) Depth (cm) H2O 1N KCl
EC (1:2) (dSm-1)
OC (%)
CaCO3 (%)
Clay CO3
(%) 0–16 7.3 5.6 0.90 0.9 4.0 3.0 16–44 7.4 5.7 0.12 0.7 4.0 3.0 44–57 7.6 6.0 0.14 0.7 8.0 3.4 57–94 7.7 6.1 0.15 0.1 11.0 3.3
Extractable bases Ca Mg Na K
CEC Clay CEC Depth (cm)
---------------------------------[cmol(p+)kg-1]---------------------------
BS (%)
ESP
0-–6 50.2 13.1 0.3 0.6 55.5 79 94 - 16–44 46.0 9.3 0.3 0.5 64.6 96 83 - 44–57 48.8 8.0 1.9 0.3 61.0 82 87 3 57–94 55.7 16.0 1.9 0.2 67.9 140 109 3
- Nil or not determined (wherever applicable)
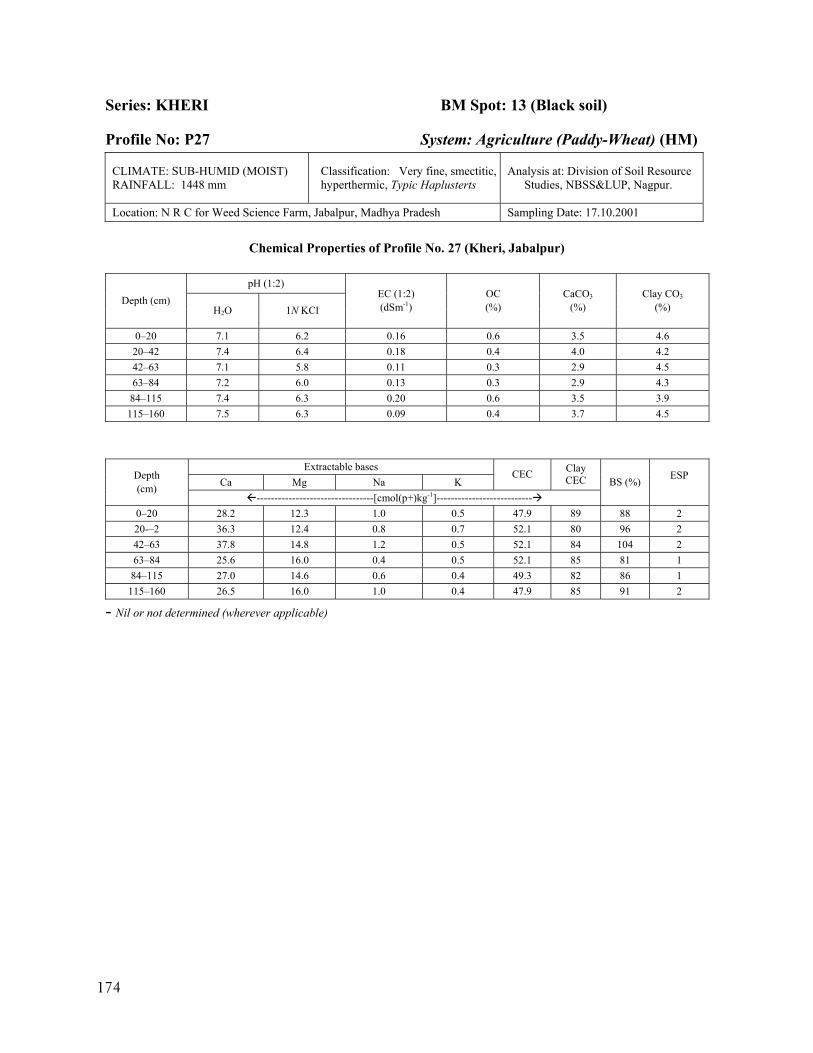
174
Series: KHERI BM Spot: 13 (Black soil)
Profile No: P27 System: Agriculture (Paddy-Wheat) (HM)
CLIMATE: SUB-HUMID (MOIST) RAINFALL: 1448 mm
Classification: Very fine, smectitic, hyperthermic, Typic Haplusterts
Analysis at: Division of Soil Resource Studies, NBSS&LUP, Nagpur.
Location: N R C for Weed Science Farm, Jabalpur, Madhya Pradesh Sampling Date: 17.10.2001
Chemical Properties of Profile No. 27 (Kheri, Jabalpur)
pH (1:2) Depth (cm)
H2O 1N KCl EC (1:2) (dSm-1)
OC (%)
CaCO3 (%)
Clay CO3
(%)
0–20 7.1 6.2 0.16 0.6 3.5 4.6 20–42 7.4 6.4 0.18 0.4 4.0 4.2 42–63 7.1 5.8 0.11 0.3 2.9 4.5 63–84 7.2 6.0 0.13 0.3 2.9 4.3 84–115 7.4 6.3 0.20 0.6 3.5 3.9
115–160 7.5 6.3 0.09 0.4 3.7 4.5
Extractable bases Ca Mg Na K
CEC Clay CEC Depth
(cm) ---------------------------------[cmol(p+)kg-1]---------------------------
BS (%) ESP
0–20 28.2 12.3 1.0 0.5 47.9 89 88 2 20-–2 36.3 12.4 0.8 0.7 52.1 80 96 2 42–63 37.8 14.8 1.2 0.5 52.1 84 104 2 63–84 25.6 16.0 0.4 0.5 52.1 85 81 1 84–115 27.0 14.6 0.6 0.4 49.3 82 86 1
115–160 26.5 16.0 1.0 0.4 47.9 85 91 2
- Nil or not determined (wherever applicable)
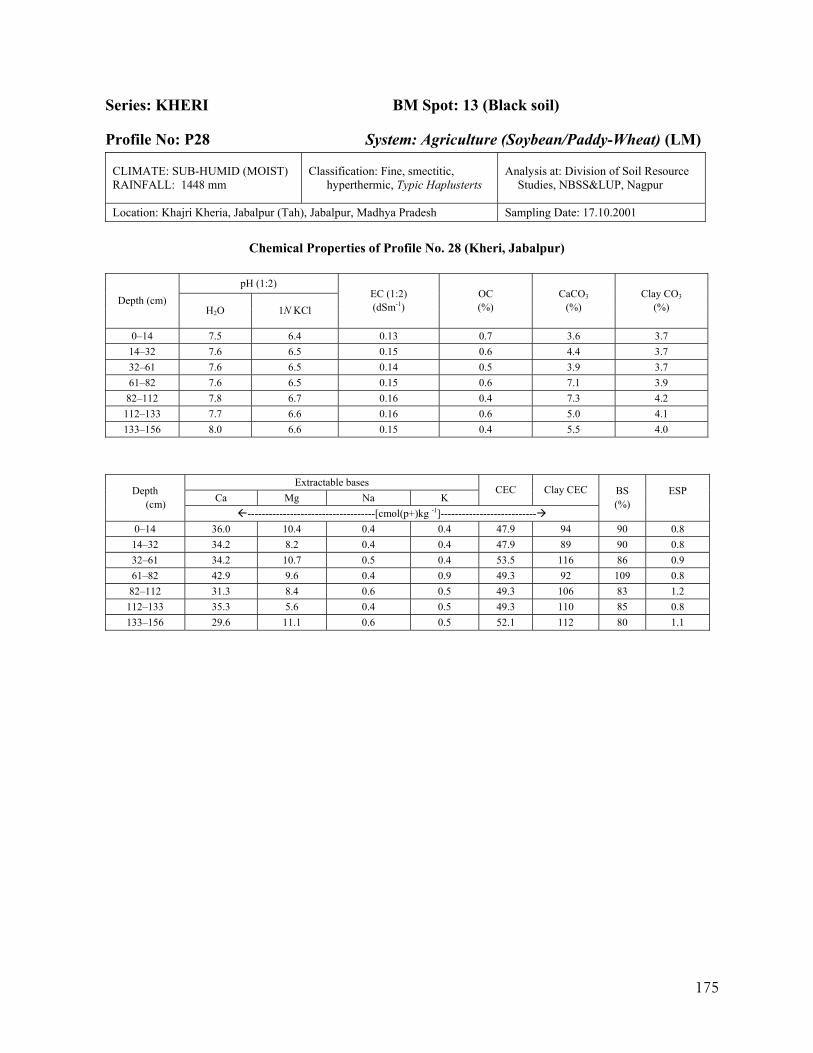
175
Series: KHERI BM Spot: 13 (Black soil)
Profile No: P28 System: Agriculture (Soybean/Paddy-Wheat) (LM)
CLIMATE: SUB-HUMID (MOIST) RAINFALL: 1448 mm
Classification: Fine, smectitic, hyperthermic, Typic Haplusterts
Analysis at: Division of Soil Resource Studies, NBSS&LUP, Nagpur
Location: Khajri Kheria, Jabalpur (Tah), Jabalpur, Madhya Pradesh Sampling Date: 17.10.2001
Chemical Properties of Profile No. 28 (Kheri, Jabalpur)
pH (1:2) Depth (cm)
H2O 1N KCl EC (1:2) (dSm-1)
OC (%)
CaCO3 (%)
Clay CO3
(%)
0–14 7.5 6.4 0.13 0.7 3.6 3.7 14–32 7.6 6.5 0.15 0.6 4.4 3.7 32–61 7.6 6.5 0.14 0.5 3.9 3.7 61–82 7.6 6.5 0.15 0.6 7.1 3.9
82–112 7.8 6.7 0.16 0.4 7.3 4.2 112–133 7.7 6.6 0.16 0.6 5.0 4.1 133–156 8.0 6.6 0.15 0.4 5.5 4.0
Extractable bases Ca Mg Na K
CEC Clay CEC Depth (cm)
------------------------------------[cmol(p+)kg -1]---------------------------
BS (%)
ESP
0–14 36.0 10.4 0.4 0.4 47.9 94 90 0.8 14–32 34.2 8.2 0.4 0.4 47.9 89 90 0.8 32–61 34.2 10.7 0.5 0.4 53.5 116 86 0.9 61–82 42.9 9.6 0.4 0.9 49.3 92 109 0.8 82–112 31.3 8.4 0.6 0.5 49.3 106 83 1.2
112–133 35.3 5.6 0.4 0.5 49.3 110 85 0.8 133–156 29.6 11.1 0.6 0.5 52.1 112 80 1.1

177
BLACK SOILS
Sub-humid dry
(MAR > 1100–1000 mm)
Benchmark Spots: 1, 4, 26, 27
No. of Pedons: 9 (P1, P2, P3, P7, P8, P9, P48, P49, P50)
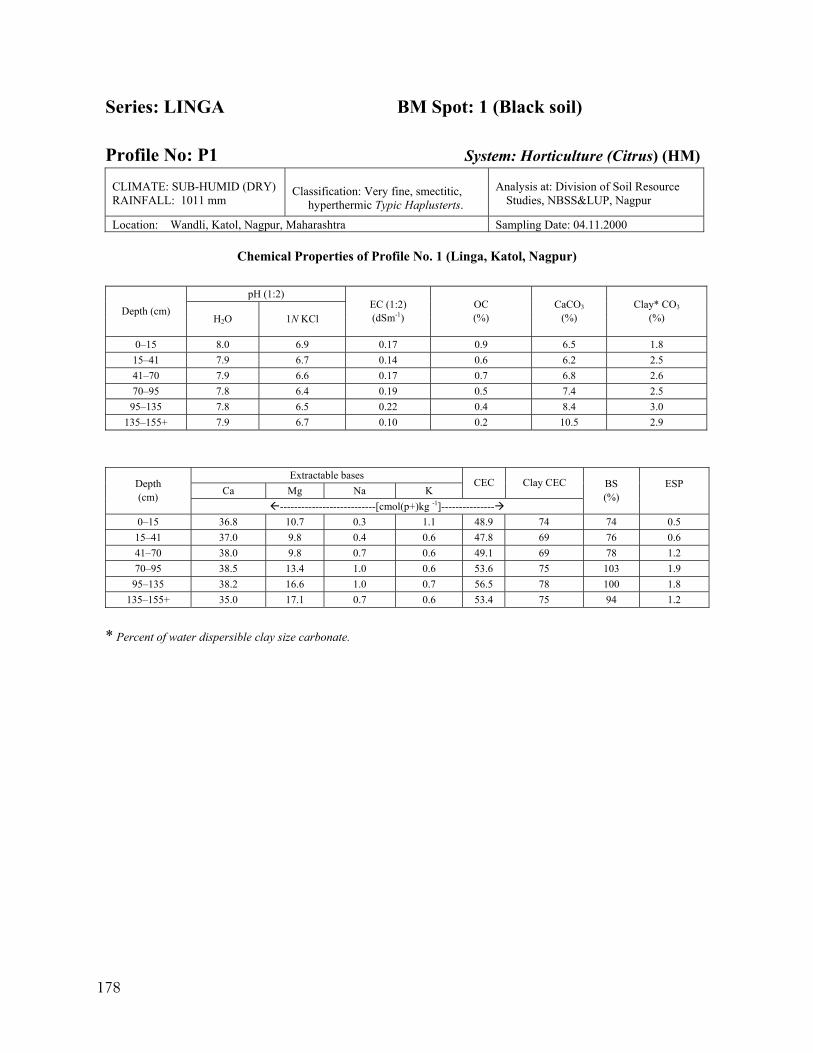
178
Series: LINGA BM Spot: 1 (Black soil) Profile No: P1 System: Horticulture (Citrus) (HM)
CLIMATE: SUB-HUMID (DRY) RAINFALL: 1011 mm
Classification: Very fine, smectitic, hyperthermic Typic Haplusterts.
Analysis at: Division of Soil Resource Studies, NBSS&LUP, Nagpur
Location: Wandli, Katol, Nagpur, Maharashtra Sampling Date: 04.11.2000
Chemical Properties of Profile No. 1 (Linga, Katol, Nagpur)
pH (1:2) Depth (cm)
H2O 1N KCl EC (1:2) (dSm-1)
OC (%)
CaCO3 (%)
Clay* CO3
(%)
0–15 8.0 6.9 0.17 0.9 6.5 1.8 15–41 7.9 6.7 0.14 0.6 6.2 2.5 41–70 7.9 6.6 0.17 0.7 6.8 2.6 70–95 7.8 6.4 0.19 0.5 7.4 2.5
95–135 7.8 6.5 0.22 0.4 8.4 3.0 135–155+ 7.9 6.7 0.10 0.2 10.5 2.9
Extractable bases Ca Mg Na K
CEC Clay CEC Depth (cm)
---------------------------[cmol(p+)kg -1]---------------
BS (%)
ESP
0–15 36.8 10.7 0.3 1.1 48.9 74 74 0.5 15–41 37.0 9.8 0.4 0.6 47.8 69 76 0.6 41–70 38.0 9.8 0.7 0.6 49.1 69 78 1.2 70–95 38.5 13.4 1.0 0.6 53.6 75 103 1.9
95–135 38.2 16.6 1.0 0.7 56.5 78 100 1.8 135–155+ 35.0 17.1 0.7 0.6 53.4 75 94 1.2
* Percent of water dispersible clay size carbonate.
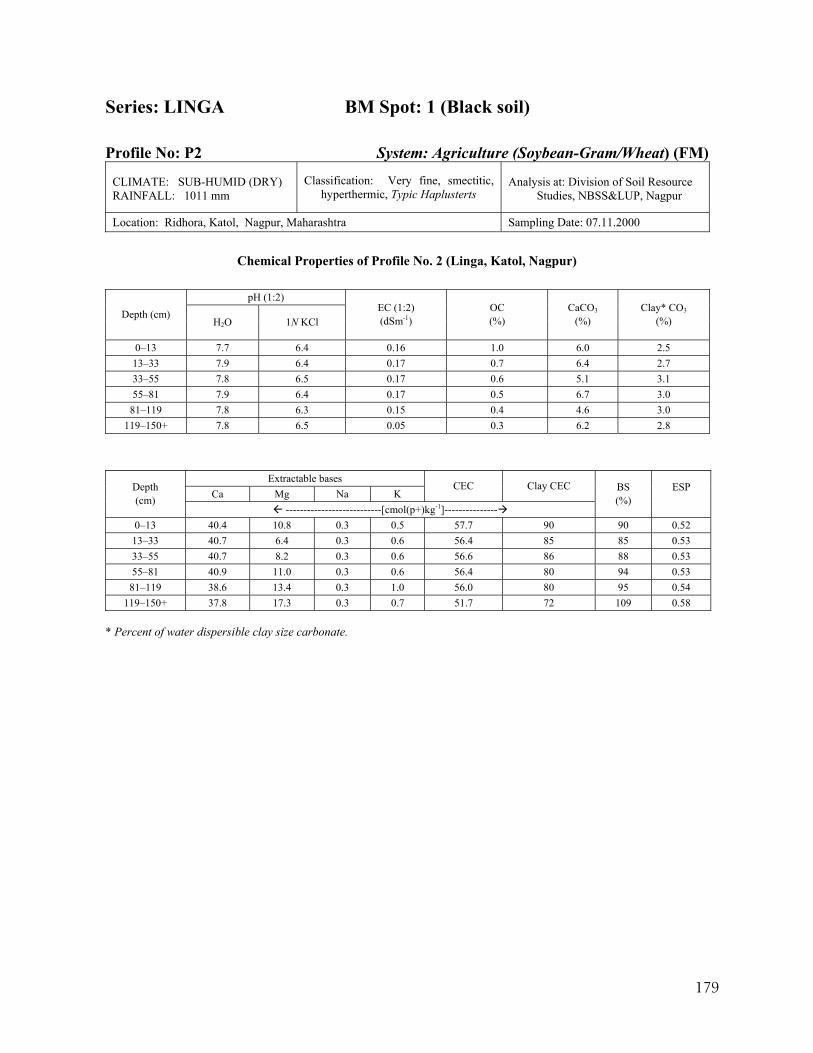
179
Series: LINGA BM Spot: 1 (Black soil) Profile No: P2 System: Agriculture (Soybean-Gram/Wheat) (FM)
CLIMATE: SUB-HUMID (DRY) RAINFALL: 1011 mm
Classification: Very fine, smectitic, hyperthermic, Typic Haplusterts
Analysis at: Division of Soil Resource Studies, NBSS&LUP, Nagpur
Location: Ridhora, Katol, Nagpur, Maharashtra Sampling Date: 07.11.2000
Chemical Properties of Profile No. 2 (Linga, Katol, Nagpur)
pH (1:2)
Depth (cm) H2O 1N KCl
EC (1:2) (dSm-1)
OC (%)
CaCO3 (%)
Clay* CO3 (%)
0–13 7.7 6.4 0.16 1.0 6.0 2.5 13–33 7.9 6.4 0.17 0.7 6.4 2.7 33–55 7.8 6.5 0.17 0.6 5.1 3.1 55–81 7.9 6.4 0.17 0.5 6.7 3.0
81–119 7.8 6.3 0.15 0.4 4.6 3.0 119–150+ 7.8 6.5 0.05 0.3 6.2 2.8
Extractable bases Ca Mg Na K
CEC Clay CEC Depth (cm)
---------------------------[cmol(p+)kg-1]---------------
BS (%)
ESP
0–13 40.4 10.8 0.3 0.5 57.7 90 90 0.52 13–33 40.7 6.4 0.3 0.6 56.4 85 85 0.53 33–55 40.7 8.2 0.3 0.6 56.6 86 88 0.53 55–81 40.9 11.0 0.3 0.6 56.4 80 94 0.53 81–119 38.6 13.4 0.3 1.0 56.0 80 95 0.54
119–150+ 37.8 17.3 0.3 0.7 51.7 72 109 0.58 * Percent of water dispersible clay size carbonate.
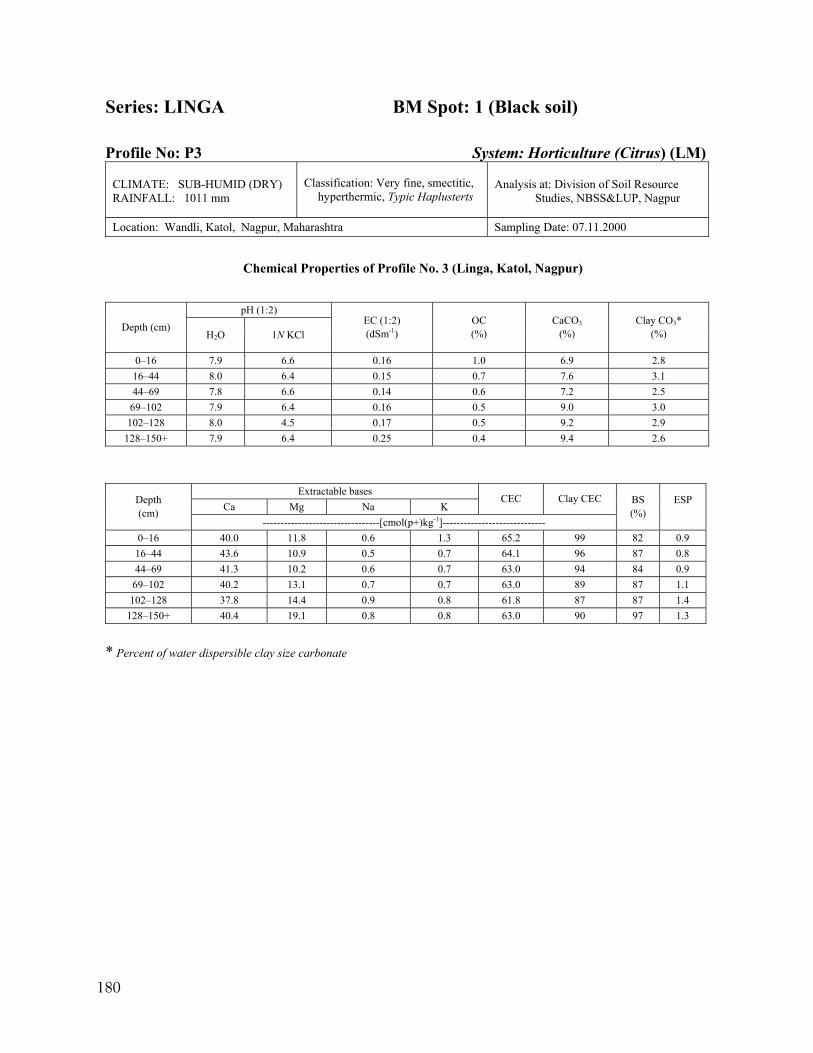
180
Series: LINGA BM Spot: 1 (Black soil) Profile No: P3 System: Horticulture (Citrus) (LM)
CLIMATE: SUB-HUMID (DRY) RAINFALL: 1011 mm
Classification: Very fine, smectitic, hyperthermic, Typic Haplusterts
Analysis at: Division of Soil Resource Studies, NBSS&LUP, Nagpur
Location: Wandli, Katol, Nagpur, Maharashtra Sampling Date: 07.11.2000
Chemical Properties of Profile No. 3 (Linga, Katol, Nagpur)
pH (1:2) Depth (cm)
H2O 1N KCl EC (1:2) (dSm-1)
OC (%)
CaCO3 (%)
Clay CO3*
(%)
0–16 7.9 6.6 0.16 1.0 6.9 2.8 16–44 8.0 6.4 0.15 0.7 7.6 3.1 44–69 7.8 6.6 0.14 0.6 7.2 2.5
69–102 7.9 6.4 0.16 0.5 9.0 3.0 102–128 8.0 4.5 0.17 0.5 9.2 2.9
128–150+ 7.9 6.4 0.25 0.4 9.4 2.6
Extractable bases Ca Mg Na K
CEC Clay CEC Depth (cm)
---------------------------------[cmol(p+)kg-1]-----------------------------
BS (%)
ESP
0–16 40.0 11.8 0.6 1.3 65.2 99 82 0.9 16–44 43.6 10.9 0.5 0.7 64.1 96 87 0.8 44–69 41.3 10.2 0.6 0.7 63.0 94 84 0.9
69–102 40.2 13.1 0.7 0.7 63.0 89 87 1.1 102–128 37.8 14.4 0.9 0.8 61.8 87 87 1.4
128–150+ 40.4 19.1 0.8 0.8 63.0 90 97 1.3
* Percent of water dispersible clay size carbonate
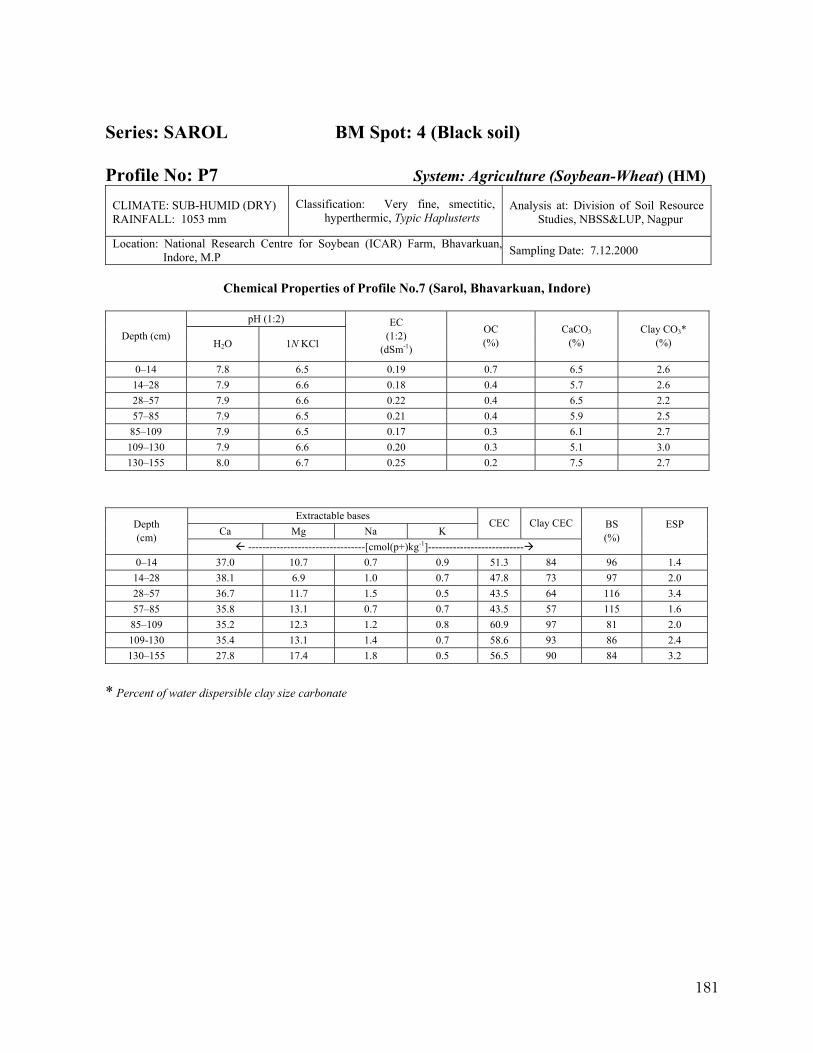
181
Series: SAROL BM Spot: 4 (Black soil) Profile No: P7 System: Agriculture (Soybean-Wheat) (HM)
CLIMATE: SUB-HUMID (DRY) RAINFALL: 1053 mm
Classification: Very fine, smectitic, hyperthermic, Typic Haplusterts
Analysis at: Division of Soil Resource Studies, NBSS&LUP, Nagpur
Location: National Research Centre for Soybean (ICAR) Farm, Bhavarkuan,Indore, M.P Sampling Date: 7.12.2000
Chemical Properties of Profile No.7 (Sarol, Bhavarkuan, Indore)
pH (1:2)
Depth (cm) H2O 1N KCl
EC (1:2)
(dSm-1)
OC (%)
CaCO3 (%)
Clay CO3*
(%)
0–14 7.8 6.5 0.19 0.7 6.5 2.6 14–28 7.9 6.6 0.18 0.4 5.7 2.6 28–57 7.9 6.6 0.22 0.4 6.5 2.2 57–85 7.9 6.5 0.21 0.4 5.9 2.5
85–109 7.9 6.5 0.17 0.3 6.1 2.7 109–130 7.9 6.6 0.20 0.3 5.1 3.0 130–155 8.0 6.7 0.25 0.2 7.5 2.7
Extractable bases Ca Mg Na K
CEC Clay CEC Depth (cm)
---------------------------------[cmol(p+)kg-1]---------------------------
BS (%)
ESP
0–14 37.0 10.7 0.7 0.9 51.3 84 96 1.4 14–28 38.1 6.9 1.0 0.7 47.8 73 97 2.0 28–57 36.7 11.7 1.5 0.5 43.5 64 116 3.4 57–85 35.8 13.1 0.7 0.7 43.5 57 115 1.6 85–109 35.2 12.3 1.2 0.8 60.9 97 81 2.0 109-130 35.4 13.1 1.4 0.7 58.6 93 86 2.4 130–155 27.8 17.4 1.8 0.5 56.5 90 84 3.2
* Percent of water dispersible clay size carbonate
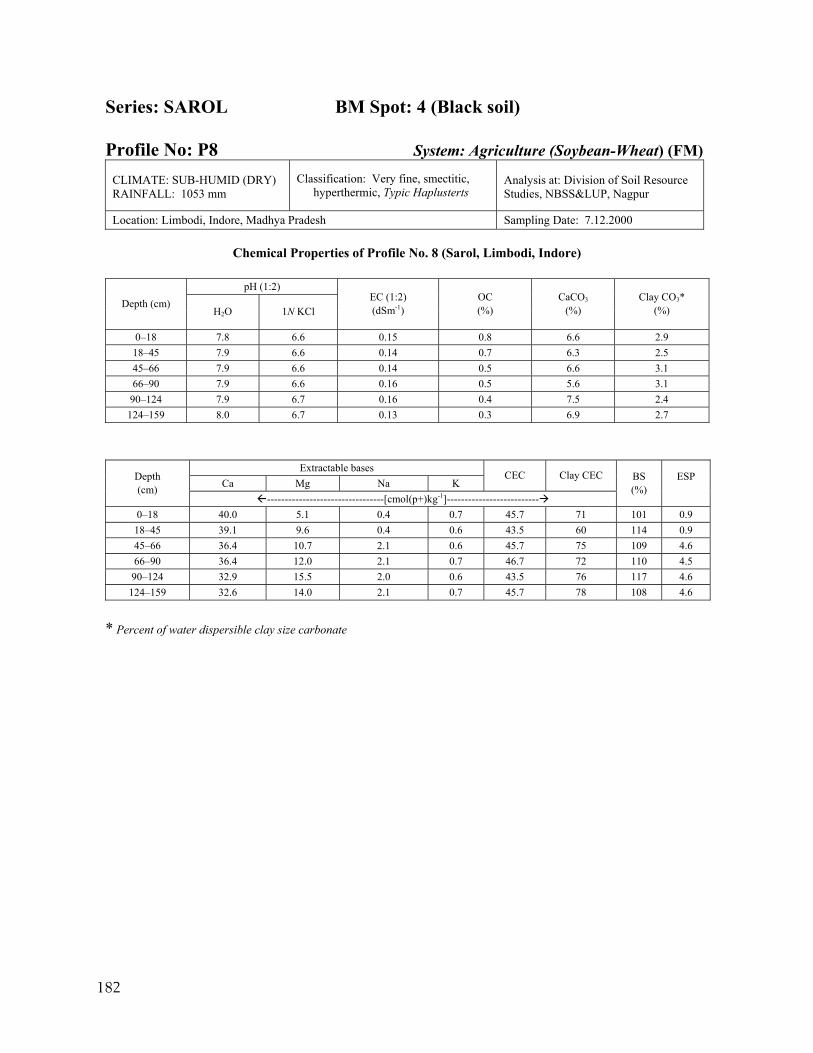
182
Series: SAROL BM Spot: 4 (Black soil) Profile No: P8 System: Agriculture (Soybean-Wheat) (FM)
CLIMATE: SUB-HUMID (DRY) RAINFALL: 1053 mm
Classification: Very fine, smectitic, hyperthermic, Typic Haplusterts
Analysis at: Division of Soil Resource Studies, NBSS&LUP, Nagpur
Location: Limbodi, Indore, Madhya Pradesh Sampling Date: 7.12.2000
Chemical Properties of Profile No. 8 (Sarol, Limbodi, Indore)
pH (1:2) Depth (cm)
H2O 1N KCl EC (1:2) (dSm-1)
OC (%)
CaCO3 (%)
Clay CO3*
(%)
0–18 7.8 6.6 0.15 0.8 6.6 2.9 18–45 7.9 6.6 0.14 0.7 6.3 2.5 45–66 7.9 6.6 0.14 0.5 6.6 3.1 66–90 7.9 6.6 0.16 0.5 5.6 3.1
90–124 7.9 6.7 0.16 0.4 7.5 2.4 124–159 8.0 6.7 0.13 0.3 6.9 2.7
Extractable bases Ca Mg Na K
CEC Clay CEC Depth (cm)
---------------------------------[cmol(p+)kg-1]--------------------------
BS (%)
ESP
0–18 40.0 5.1 0.4 0.7 45.7 71 101 0.9 18–45 39.1 9.6 0.4 0.6 43.5 60 114 0.9 45–66 36.4 10.7 2.1 0.6 45.7 75 109 4.6 66–90 36.4 12.0 2.1 0.7 46.7 72 110 4.5
90–124 32.9 15.5 2.0 0.6 43.5 76 117 4.6 124–159 32.6 14.0 2.1 0.7 45.7 78 108 4.6
* Percent of water dispersible clay size carbonate
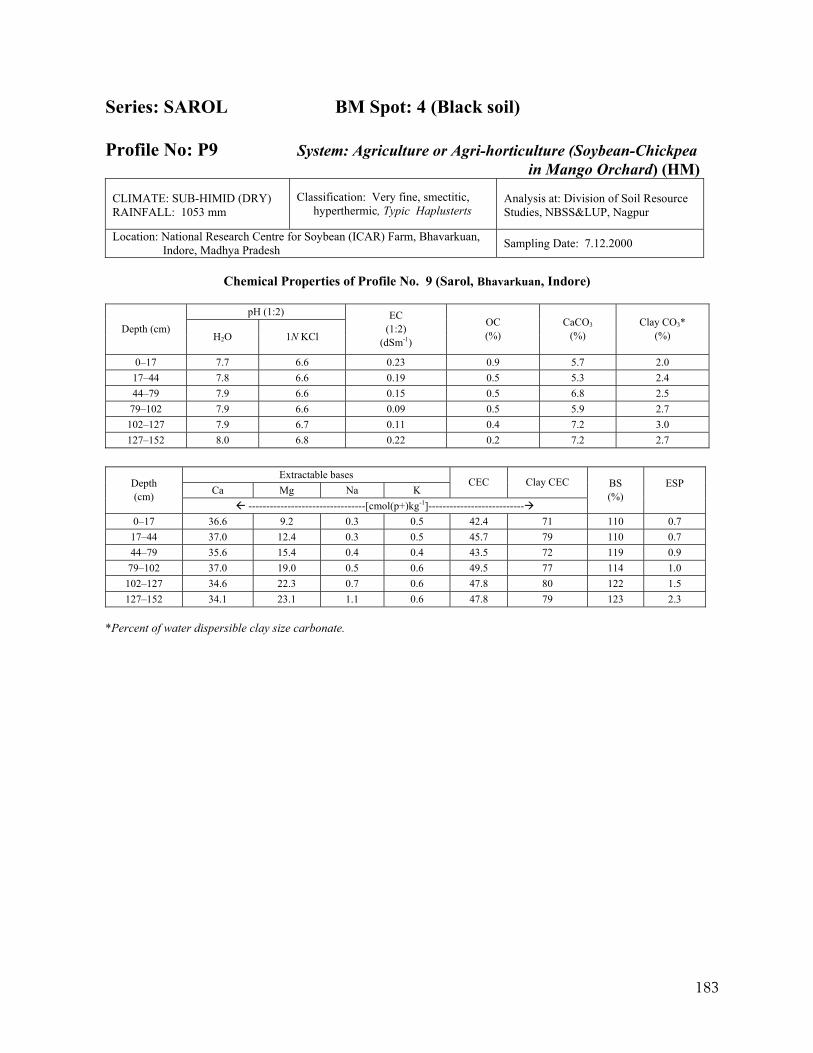
183
Series: SAROL BM Spot: 4 (Black soil) Profile No: P9 System: Agriculture or Agri-horticulture (Soybean-Chickpea
in Mango Orchard) (HM)
CLIMATE: SUB-HIMID (DRY) RAINFALL: 1053 mm
Classification: Very fine, smectitic, hyperthermic, Typic Haplusterts
Analysis at: Division of Soil Resource Studies, NBSS&LUP, Nagpur
Location: National Research Centre for Soybean (ICAR) Farm, Bhavarkuan, Indore, Madhya Pradesh Sampling Date: 7.12.2000
Chemical Properties of Profile No. 9 (Sarol, Bhavarkuan, Indore)
pH (1:2)
Depth (cm) H2O 1N KCl
EC (1:2)
(dSm-1)
OC (%)
CaCO3 (%)
Clay CO3*
(%)
0–17 7.7 6.6 0.23 0.9 5.7 2.0 17–44 7.8 6.6 0.19 0.5 5.3 2.4 44–79 7.9 6.6 0.15 0.5 6.8 2.5
79–102 7.9 6.6 0.09 0.5 5.9 2.7 102–127 7.9 6.7 0.11 0.4 7.2 3.0 127–152 8.0 6.8 0.22 0.2 7.2 2.7
Extractable bases
Ca Mg Na K CEC Clay CEC Depth
(cm) ---------------------------------[cmol(p+)kg-1]---------------------------
BS (%)
ESP
0–17 36.6 9.2 0.3 0.5 42.4 71 110 0.7 17–44 37.0 12.4 0.3 0.5 45.7 79 110 0.7 44–79 35.6 15.4 0.4 0.4 43.5 72 119 0.9
79–102 37.0 19.0 0.5 0.6 49.5 77 114 1.0 102–127 34.6 22.3 0.7 0.6 47.8 80 122 1.5 127–152 34.1 23.1 1.1 0.6 47.8 79 123 2.3
*Percent of water dispersible clay size carbonate.
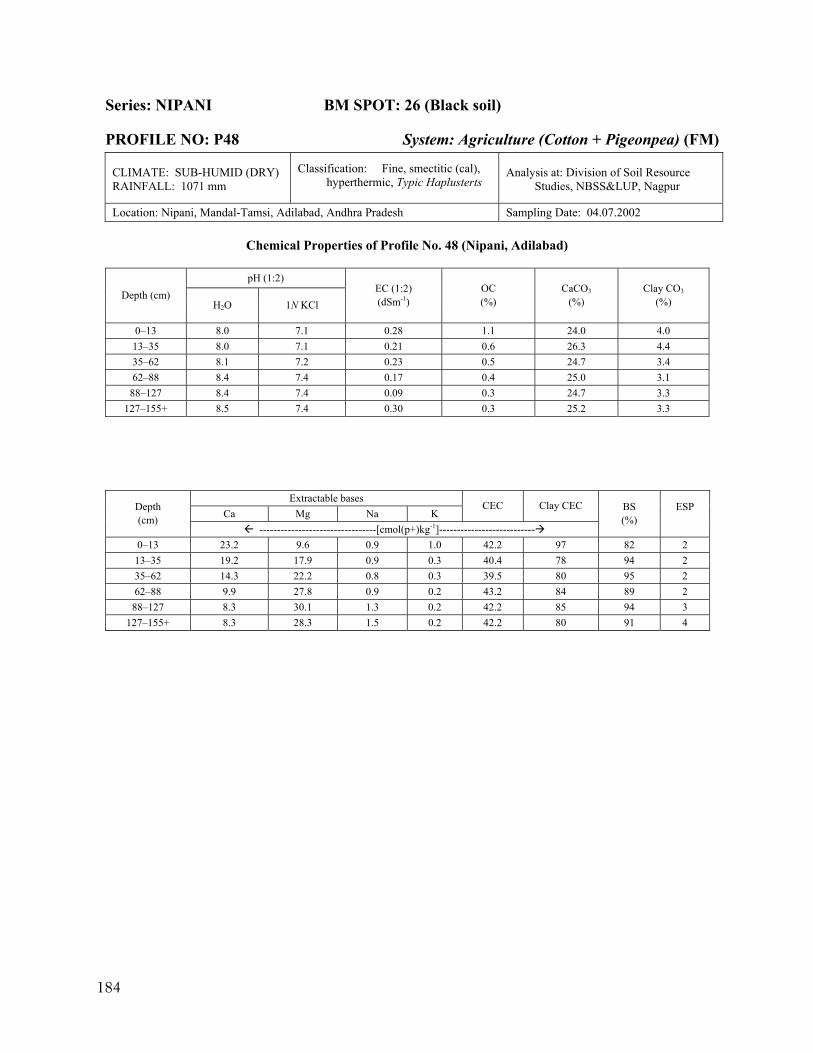
184
Series: NIPANI BM SPOT: 26 (Black soil)
PROFILE NO: P48 System: Agriculture (Cotton + Pigeonpea) (FM)
CLIMATE: SUB-HUMID (DRY) RAINFALL: 1071 mm
Classification: Fine, smectitic (cal), hyperthermic, Typic Haplusterts
Analysis at: Division of Soil Resource Studies, NBSS&LUP, Nagpur
Location: Nipani, Mandal-Tamsi, Adilabad, Andhra Pradesh Sampling Date: 04.07.2002
Chemical Properties of Profile No. 48 (Nipani, Adilabad)
pH (1:2) Depth (cm)
H2O 1N KCl EC (1:2) (dSm-1)
OC (%)
CaCO3 (%)
Clay CO3
(%)
0–13 8.0 7.1 0.28 1.1 24.0 4.0 13–35 8.0 7.1 0.21 0.6 26.3 4.4 35–62 8.1 7.2 0.23 0.5 24.7 3.4 62–88 8.4 7.4 0.17 0.4 25.0 3.1
88–127 8.4 7.4 0.09 0.3 24.7 3.3 127–155+ 8.5 7.4 0.30 0.3 25.2 3.3
Extractable bases Ca Mg Na K
CEC Clay CEC Depth (cm)
---------------------------------[cmol(p+)kg-1]---------------------------
BS (%)
ESP
0–13 23.2 9.6 0.9 1.0 42.2 97 82 2 13–35 19.2 17.9 0.9 0.3 40.4 78 94 2 35–62 14.3 22.2 0.8 0.3 39.5 80 95 2 62–88 9.9 27.8 0.9 0.2 43.2 84 89 2
88–127 8.3 30.1 1.3 0.2 42.2 85 94 3 127–155+ 8.3 28.3 1.5 0.2 42.2 80 91 4
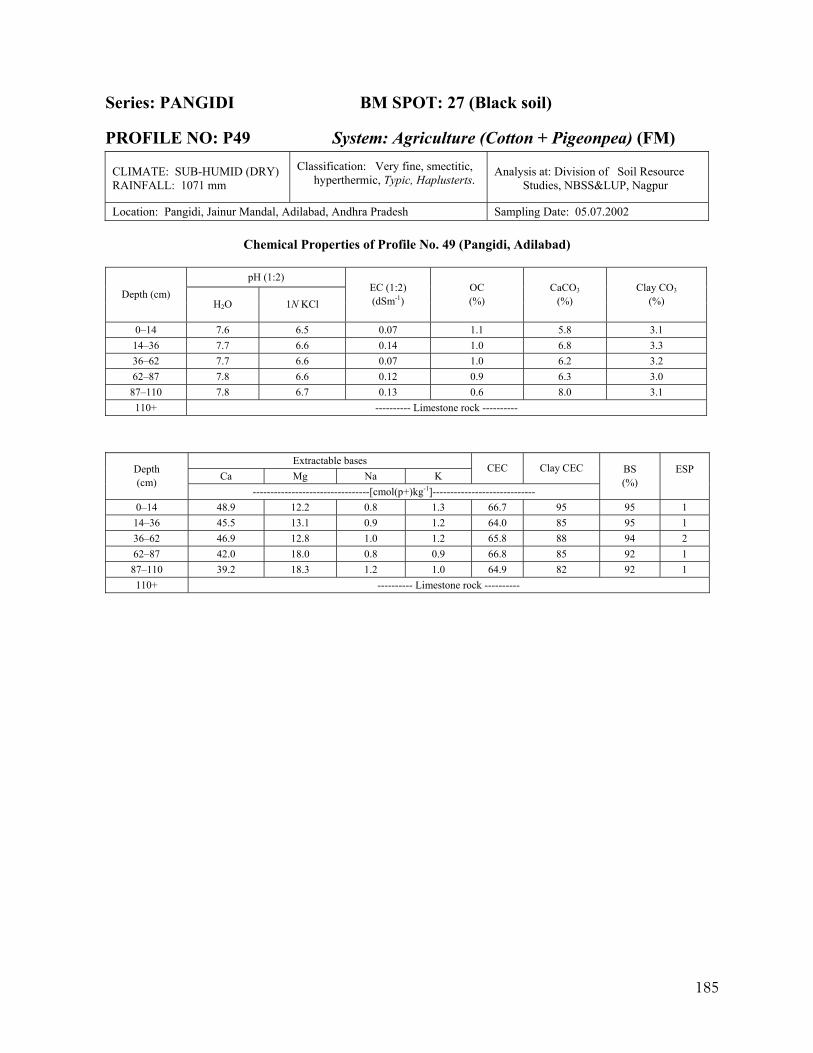
185
Series: PANGIDI BM SPOT: 27 (Black soil)
PROFILE NO: P49 System: Agriculture (Cotton + Pigeonpea) (FM)
CLIMATE: SUB-HUMID (DRY) RAINFALL: 1071 mm
Classification: Very fine, smectitic, hyperthermic, Typic, Haplusterts.
Analysis at: Division of Soil Resource Studies, NBSS&LUP, Nagpur
Location: Pangidi, Jainur Mandal, Adilabad, Andhra Pradesh Sampling Date: 05.07.2002
Chemical Properties of Profile No. 49 (Pangidi, Adilabad)
pH (1:2) Depth (cm)
H2O 1N KCl EC (1:2) (dSm-1)
OC (%)
CaCO3 (%)
Clay CO3
(%)
0–14 7.6 6.5 0.07 1.1 5.8 3.1 14–36 7.7 6.6 0.14 1.0 6.8 3.3 36–62 7.7 6.6 0.07 1.0 6.2 3.2 62–87 7.8 6.6 0.12 0.9 6.3 3.0
87–110 7.8 6.7 0.13 0.6 8.0 3.1 110+ ---------- Limestone rock ----------
Extractable bases Ca Mg Na K
CEC Clay CEC Depth (cm)
---------------------------------[cmol(p+)kg-1]-----------------------------
BS (%)
ESP
0–14 48.9 12.2 0.8 1.3 66.7 95 95 1 14–36 45.5 13.1 0.9 1.2 64.0 85 95 1 36–62 46.9 12.8 1.0 1.2 65.8 88 94 2 62–87 42.0 18.0 0.8 0.9 66.8 85 92 1 87–110 39.2 18.3 1.2 1.0 64.9 82 92 1 110+ ---------- Limestone rock ----------
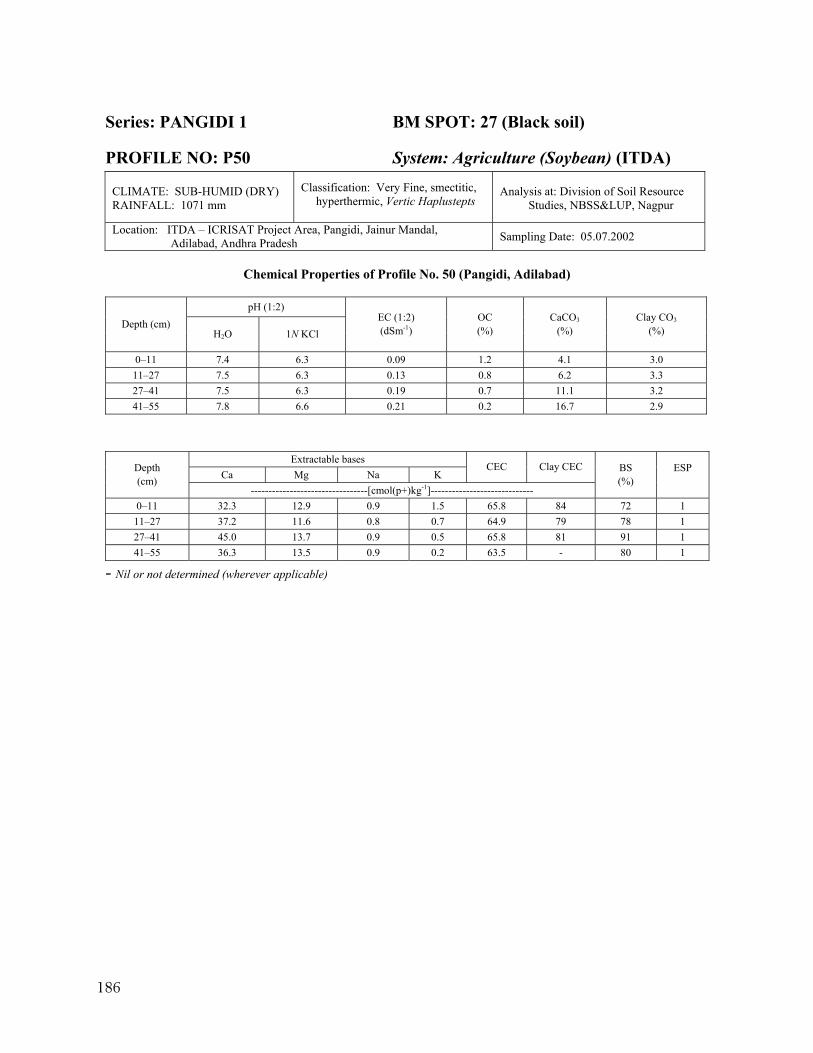
186
Series: PANGIDI 1 BM SPOT: 27 (Black soil)
PROFILE NO: P50 System: Agriculture (Soybean) (ITDA) CLIMATE: SUB-HUMID (DRY) RAINFALL: 1071 mm
Classification: Very Fine, smectitic, hyperthermic, Vertic Haplustepts
Analysis at: Division of Soil Resource Studies, NBSS&LUP, Nagpur
Location: ITDA – ICRISAT Project Area, Pangidi, Jainur Mandal, Adilabad, Andhra Pradesh Sampling Date: 05.07.2002
Chemical Properties of Profile No. 50 (Pangidi, Adilabad)
pH (1:2)
Depth (cm) H2O 1N KCl
EC (1:2) (dSm-1)
OC (%)
CaCO3 (%)
Clay CO3
(%)
0–11 7.4 6.3 0.09 1.2 4.1 3.0 11–27 7.5 6.3 0.13 0.8 6.2 3.3 27–41 7.5 6.3 0.19 0.7 11.1 3.2 41–55 7.8 6.6 0.21 0.2 16.7 2.9
Extractable bases Ca Mg Na K
CEC Clay CEC Depth (cm)
---------------------------------[cmol(p+)kg-1]-----------------------------
BS (%)
ESP
0–11 32.3 12.9 0.9 1.5 65.8 84 72 1 11–27 37.2 11.6 0.8 0.7 64.9 79 78 1 27–41 45.0 13.7 0.9 0.5 65.8 81 91 1 41–55 36.3 13.5 0.9 0.2 63.5 - 80 1
- Nil or not determined (wherever applicable)
187
BLACK SOILS
(Semi-arid moist)
(MAR > 1000–850 mm)
Benchmark Spots: 5, 22
No. of Pedons: 4 (P10, P11, P12, P42)
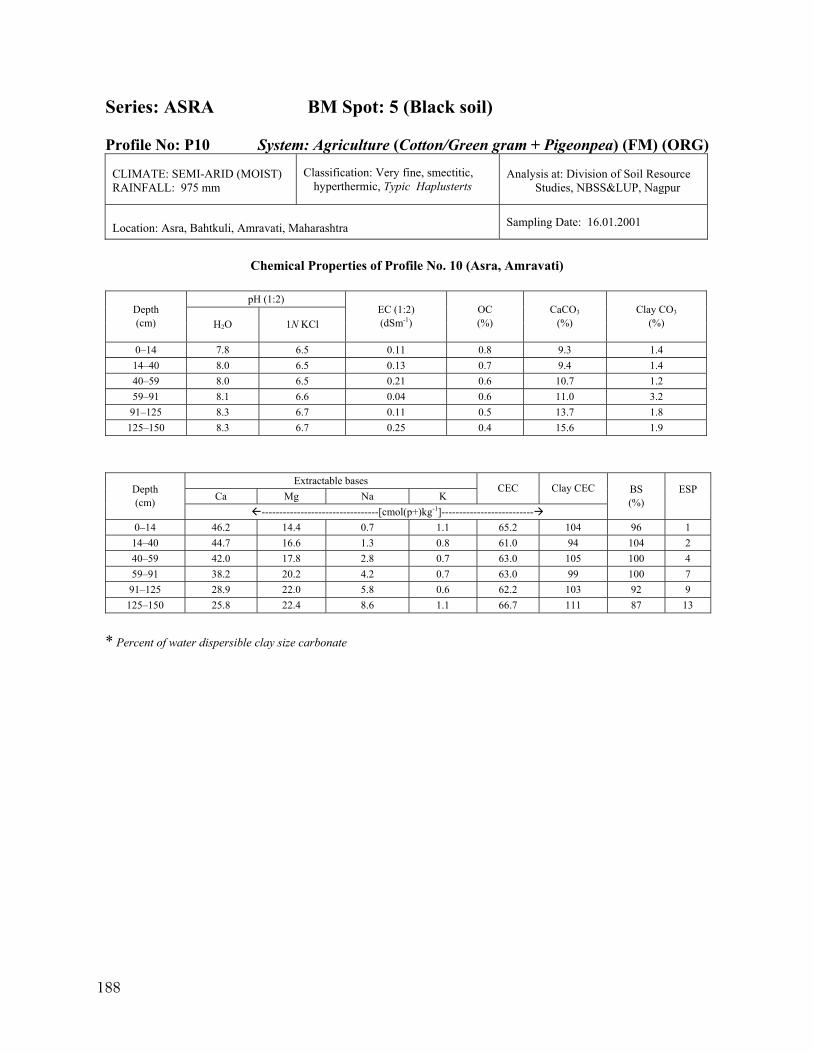
188
Series: ASRA BM Spot: 5 (Black soil) Profile No: P10 System: Agriculture (Cotton/Green gram + Pigeonpea) (FM) (ORG)
CLIMATE: SEMI-ARID (MOIST) RAINFALL: 975 mm
Classification: Very fine, smectitic, hyperthermic, Typic Haplusterts
Analysis at: Division of Soil Resource Studies, NBSS&LUP, Nagpur
Location: Asra, Bahtkuli, Amravati, Maharashtra Sampling Date: 16.01.2001
Chemical Properties of Profile No. 10 (Asra, Amravati)
pH (1:2)
Depth (cm) H2O 1N KCl
EC (1:2) (dSm-1)
OC (%)
CaCO3 (%)
Clay CO3
(%)
0–14 7.8 6.5 0.11 0.8 9.3 1.4 14–40 8.0 6.5 0.13 0.7 9.4 1.4 40–59 8.0 6.5 0.21 0.6 10.7 1.2 59–91 8.1 6.6 0.04 0.6 11.0 3.2
91–125 8.3 6.7 0.11 0.5 13.7 1.8 125–150 8.3 6.7 0.25 0.4 15.6 1.9
Extractable bases Ca Mg Na K
CEC Clay CEC Depth (cm)
---------------------------------[cmol(p+)kg-1]--------------------------
BS (%)
ESP
0–14 46.2 14.4 0.7 1.1 65.2 104 96 1 14–40 44.7 16.6 1.3 0.8 61.0 94 104 2 40–59 42.0 17.8 2.8 0.7 63.0 105 100 4 59–91 38.2 20.2 4.2 0.7 63.0 99 100 7
91–125 28.9 22.0 5.8 0.6 62.2 103 92 9 125–150 25.8 22.4 8.6 1.1 66.7 111 87 13
* Percent of water dispersible clay size carbonate
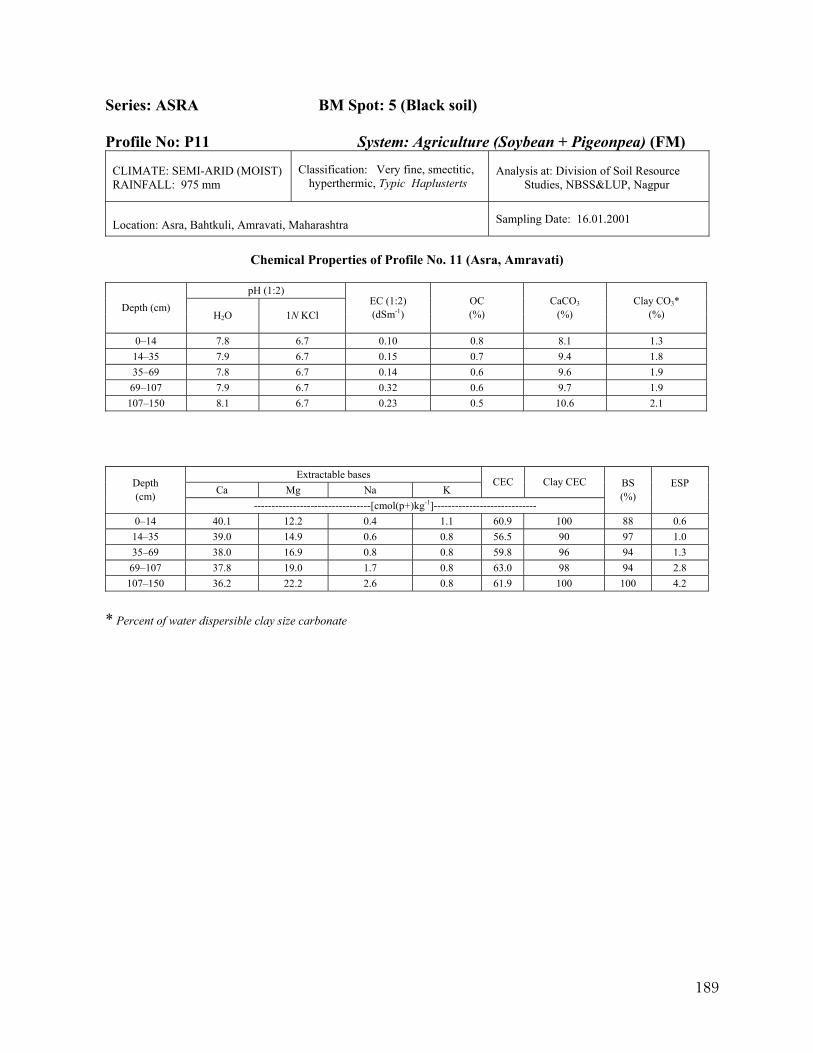
189
Series: ASRA BM Spot: 5 (Black soil) Profile No: P11 System: Agriculture (Soybean + Pigeonpea) (FM)
CLIMATE: SEMI-ARID (MOIST) RAINFALL: 975 mm
Classification: Very fine, smectitic, hyperthermic, Typic Haplusterts
Analysis at: Division of Soil Resource Studies, NBSS&LUP, Nagpur
Location: Asra, Bahtkuli, Amravati, Maharashtra Sampling Date: 16.01.2001
Chemical Properties of Profile No. 11 (Asra, Amravati)
pH (1:2)
Depth (cm) H2O 1N KCl
EC (1:2) (dSm-1)
OC (%)
CaCO3 (%)
Clay CO3*
(%)
0–14 7.8 6.7 0.10 0.8 8.1 1.3 14–35 7.9 6.7 0.15 0.7 9.4 1.8 35–69 7.8 6.7 0.14 0.6 9.6 1.9
69–107 7.9 6.7 0.32 0.6 9.7 1.9 107–150 8.1 6.7 0.23 0.5 10.6 2.1
Extractable bases Ca Mg Na K
CEC Clay CEC Depth (cm)
---------------------------------[cmol(p+)kg-1]-----------------------------
BS (%)
ESP
0–14 40.1 12.2 0.4 1.1 60.9 100 88 0.6 14–35 39.0 14.9 0.6 0.8 56.5 90 97 1.0 35–69 38.0 16.9 0.8 0.8 59.8 96 94 1.3
69–107 37.8 19.0 1.7 0.8 63.0 98 94 2.8 107–150 36.2 22.2 2.6 0.8 61.9 100 100 4.2
* Percent of water dispersible clay size carbonate
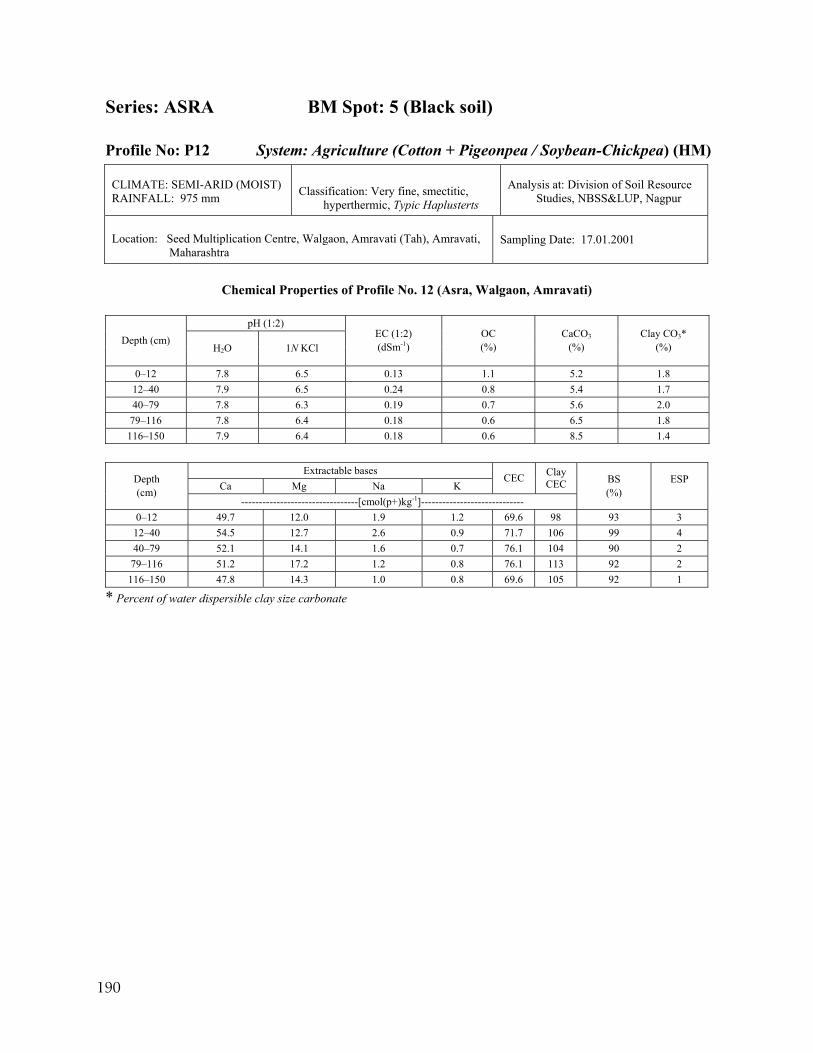
190
Series: ASRA BM Spot: 5 (Black soil) Profile No: P12 System: Agriculture (Cotton + Pigeonpea / Soybean-Chickpea) (HM)
CLIMATE: SEMI-ARID (MOIST) RAINFALL: 975 mm Classification: Very fine, smectitic,
hyperthermic, Typic Haplusterts
Analysis at: Division of Soil Resource Studies, NBSS&LUP, Nagpur
Location: Seed Multiplication Centre, Walgaon, Amravati (Tah), Amravati, Maharashtra
Sampling Date: 17.01.2001
Chemical Properties of Profile No. 12 (Asra, Walgaon, Amravati)
pH (1:2)
Depth (cm) H2O 1N KCl
EC (1:2) (dSm-1)
OC (%)
CaCO3 (%)
Clay CO3*
(%)
0–12 7.8 6.5 0.13 1.1 5.2 1.8 12–40 7.9 6.5 0.24 0.8 5.4 1.7 40–79 7.8 6.3 0.19 0.7 5.6 2.0
79–116 7.8 6.4 0.18 0.6 6.5 1.8 116–150 7.9 6.4 0.18 0.6 8.5 1.4
Extractable bases
Ca Mg Na K CEC Clay
CEC Depth (cm)
---------------------------------[cmol(p+)kg-1]-----------------------------
BS (%)
ESP
0–12 49.7 12.0 1.9 1.2 69.6 98 93 3 12–40 54.5 12.7 2.6 0.9 71.7 106 99 4 40–79 52.1 14.1 1.6 0.7 76.1 104 90 2
79–116 51.2 17.2 1.2 0.8 76.1 113 92 2 116–150 47.8 14.3 1.0 0.8 69.6 105 92 1
* Percent of water dispersible clay size carbonate
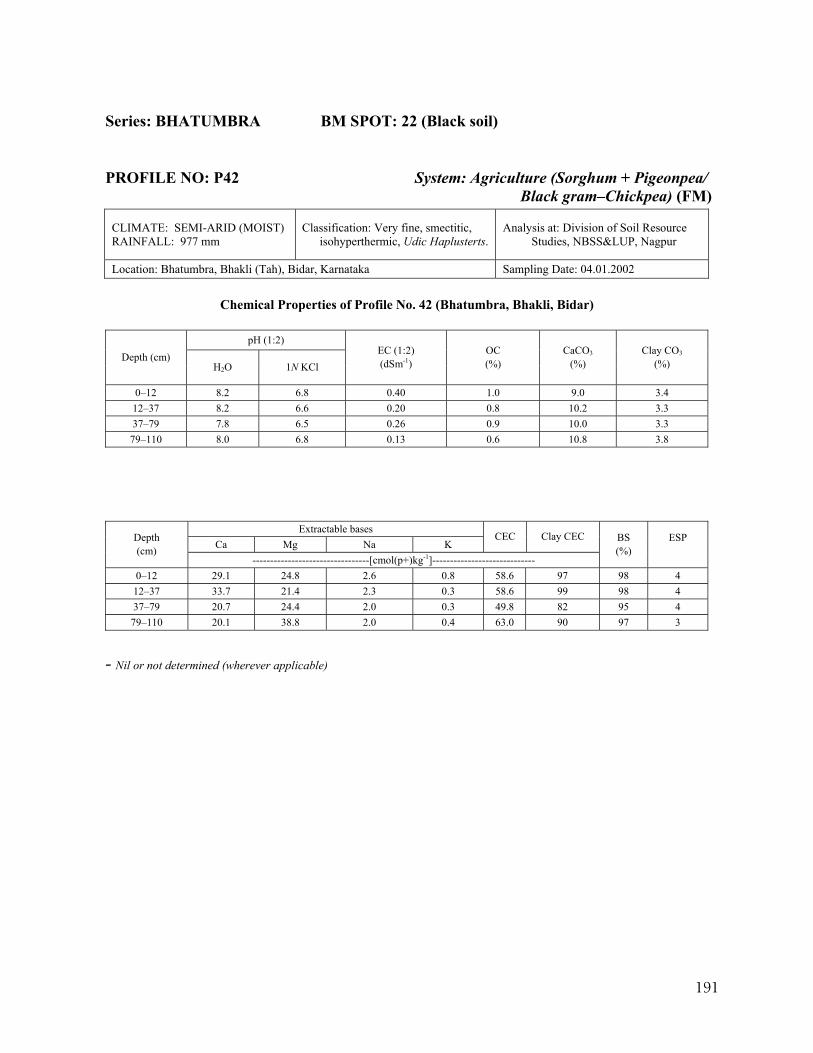
191
Series: BHATUMBRA BM SPOT: 22 (Black soil)
PROFILE NO: P42 System: Agriculture (Sorghum + Pigeonpea/ Black gram–Chickpea) (FM)
CLIMATE: SEMI-ARID (MOIST) RAINFALL: 977 mm
Classification: Very fine, smectitic, isohyperthermic, Udic Haplusterts.
Analysis at: Division of Soil Resource Studies, NBSS&LUP, Nagpur
Location: Bhatumbra, Bhakli (Tah), Bidar, Karnataka Sampling Date: 04.01.2002
Chemical Properties of Profile No. 42 (Bhatumbra, Bhakli, Bidar)
pH (1:2) Depth (cm)
H2O 1N KCl EC (1:2) (dSm-1)
OC (%)
CaCO3 (%)
Clay CO3
(%)
0–12 8.2 6.8 0.40 1.0 9.0 3.4 12–37 8.2 6.6 0.20 0.8 10.2 3.3 37–79 7.8 6.5 0.26 0.9 10.0 3.3 79–110 8.0 6.8 0.13 0.6 10.8 3.8
Extractable bases Ca Mg Na K
CEC Clay CEC Depth (cm)
---------------------------------[cmol(p+)kg-1]-----------------------------
BS (%)
ESP
0–12 29.1 24.8 2.6 0.8 58.6 97 98 4 12–37 33.7 21.4 2.3 0.3 58.6 99 98 4 37–79 20.7 24.4 2.0 0.3 49.8 82 95 4 79–110 20.1 38.8 2.0 0.4 63.0 90 97 3
- Nil or not determined (wherever applicable)

193
BLACK SOILS
(Semi-arid dry)
(MAR: 850–550 mm)
Benchmark Spots: 6, 9, 14, 16, 18, 20, 23, 24, 25
No. of Pedons: 17 (P13, P14, P19, P20, P21, P29, P32, P33, P35, P36, P39, P40, P43, P44, P45, P46, P47)
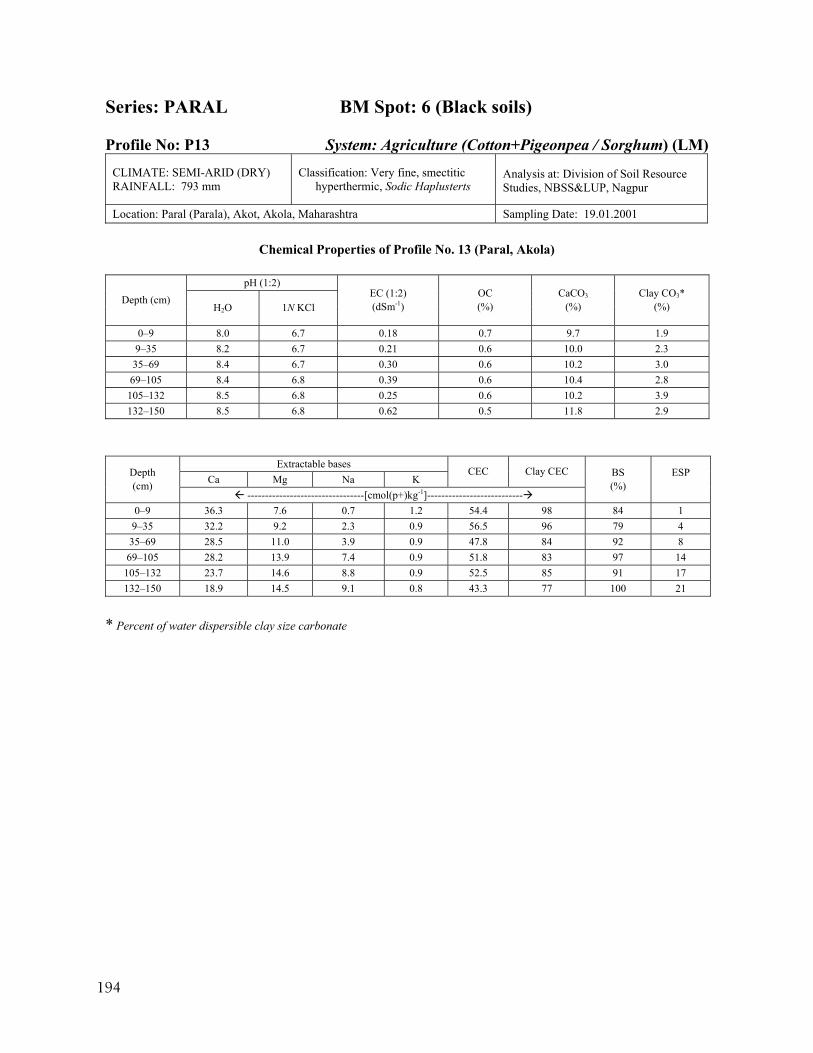
194
Series: PARAL BM Spot: 6 (Black soils) Profile No: P13 System: Agriculture (Cotton+Pigeonpea / Sorghum) (LM)
CLIMATE: SEMI-ARID (DRY) RAINFALL: 793 mm
Classification: Very fine, smectitic hyperthermic, Sodic Haplusterts
Analysis at: Division of Soil Resource Studies, NBSS&LUP, Nagpur
Location: Paral (Parala), Akot, Akola, Maharashtra Sampling Date: 19.01.2001
Chemical Properties of Profile No. 13 (Paral, Akola)
pH (1:2) Depth (cm)
H2O 1N KCl EC (1:2) (dSm-1)
OC (%)
CaCO3 (%)
Clay CO3*
(%)
0–9 8.0 6.7 0.18 0.7 9.7 1.9 9–35 8.2 6.7 0.21 0.6 10.0 2.3 35–69 8.4 6.7 0.30 0.6 10.2 3.0
69–105 8.4 6.8 0.39 0.6 10.4 2.8 105–132 8.5 6.8 0.25 0.6 10.2 3.9 132–150 8.5 6.8 0.62 0.5 11.8 2.9
Extractable bases Ca Mg Na K
CEC Clay CEC Depth (cm)
---------------------------------[cmol(p+)kg-1]---------------------------
BS (%)
ESP
0–9 36.3 7.6 0.7 1.2 54.4 98 84 1 9–35 32.2 9.2 2.3 0.9 56.5 96 79 4 35–69 28.5 11.0 3.9 0.9 47.8 84 92 8 69–105 28.2 13.9 7.4 0.9 51.8 83 97 14
105–132 23.7 14.6 8.8 0.9 52.5 85 91 17 132–150 18.9 14.5 9.1 0.8 43.3 77 100 21
* Percent of water dispersible clay size carbonate
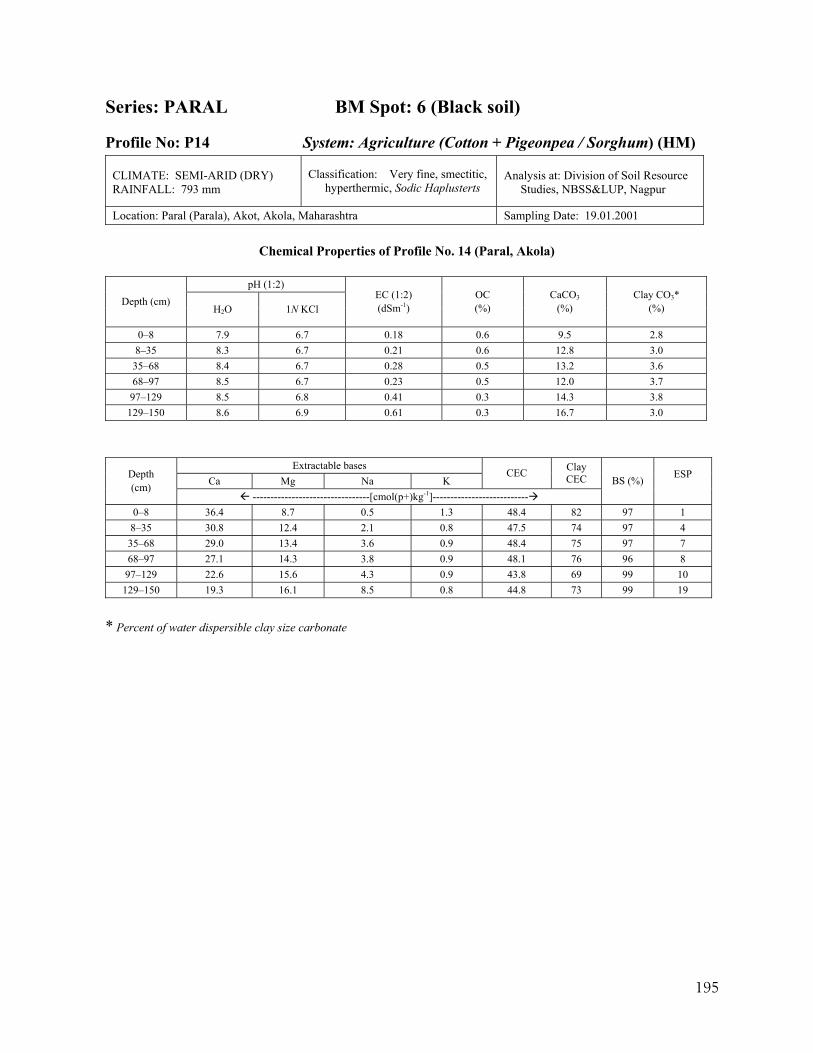
195
Series: PARAL BM Spot: 6 (Black soil)
Profile No: P14 System: Agriculture (Cotton + Pigeonpea / Sorghum) (HM)
CLIMATE: SEMI-ARID (DRY) RAINFALL: 793 mm
Classification: Very fine, smectitic, hyperthermic, Sodic Haplusterts
Analysis at: Division of Soil Resource Studies, NBSS&LUP, Nagpur
Location: Paral (Parala), Akot, Akola, Maharashtra Sampling Date: 19.01.2001
Chemical Properties of Profile No. 14 (Paral, Akola)
pH (1:2) Depth (cm)
H2O 1N KCl EC (1:2) (dSm-1)
OC (%)
CaCO3 (%)
Clay CO3*
(%)
0–8 7.9 6.7 0.18 0.6 9.5 2.8 8–35 8.3 6.7 0.21 0.6 12.8 3.0 35–68 8.4 6.7 0.28 0.5 13.2 3.6 68–97 8.5 6.7 0.23 0.5 12.0 3.7 97–129 8.5 6.8 0.41 0.3 14.3 3.8
129–150 8.6 6.9 0.61 0.3 16.7 3.0
Extractable bases Ca Mg Na K
CEC Clay CEC Depth
(cm) ---------------------------------[cmol(p+)kg-1]---------------------------
BS (%) ESP
0–8 36.4 8.7 0.5 1.3 48.4 82 97 1 8–35 30.8 12.4 2.1 0.8 47.5 74 97 4 35–68 29.0 13.4 3.6 0.9 48.4 75 97 7 68–97 27.1 14.3 3.8 0.9 48.1 76 96 8
97–129 22.6 15.6 4.3 0.9 43.8 69 99 10 129–150 19.3 16.1 8.5 0.8 44.8 73 99 19
* Percent of water dispersible clay size carbonate
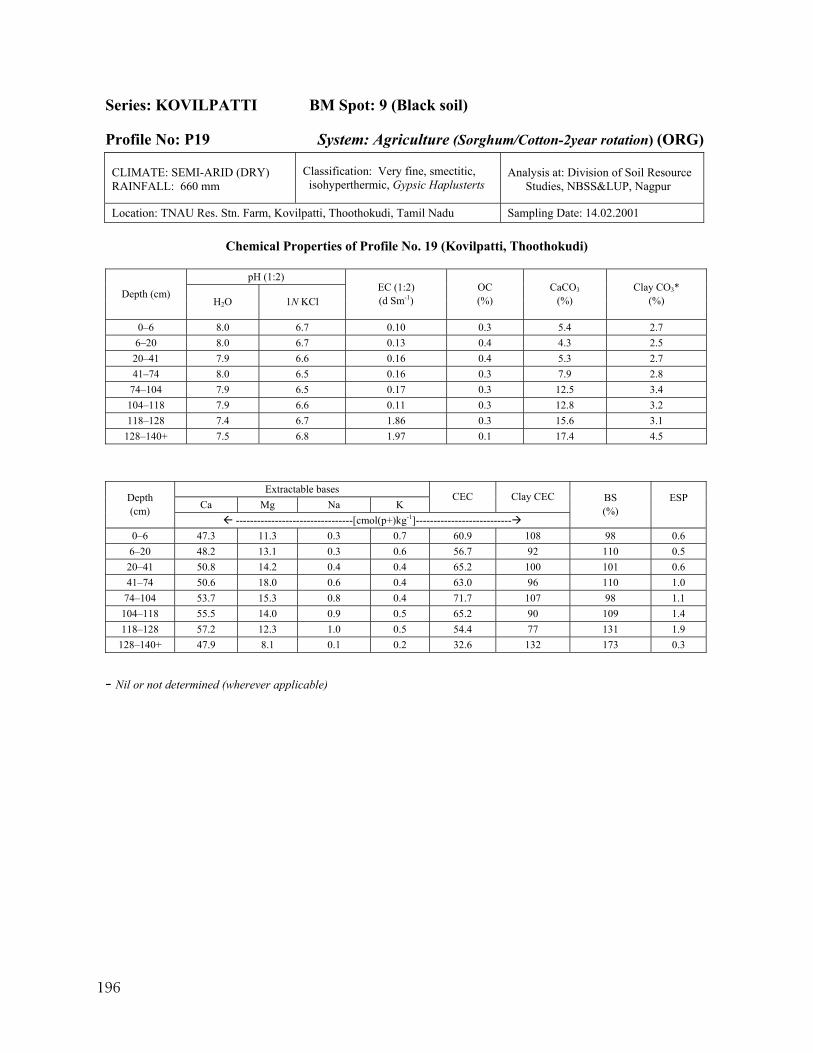
196
Series: KOVILPATTI BM Spot: 9 (Black soil)
Profile No: P19 System: Agriculture (Sorghum/Cotton-2year rotation) (ORG)
CLIMATE: SEMI-ARID (DRY) RAINFALL: 660 mm
Classification: Very fine, smectitic, isohyperthermic, Gypsic Haplusterts
Analysis at: Division of Soil Resource Studies, NBSS&LUP, Nagpur
Location: TNAU Res. Stn. Farm, Kovilpatti, Thoothokudi, Tamil Nadu Sampling Date: 14.02.2001
Chemical Properties of Profile No. 19 (Kovilpatti, Thoothokudi)
pH (1:2) Depth (cm)
H2O 1N KCl EC (1:2) (d Sm-1)
OC (%)
CaCO3 (%)
Clay CO3*
(%)
0–6 8.0 6.7 0.10 0.3 5.4 2.7 6–20 8.0 6.7 0.13 0.4 4.3 2.5 20–41 7.9 6.6 0.16 0.4 5.3 2.7 41–74 8.0 6.5 0.16 0.3 7.9 2.8
74–104 7.9 6.5 0.17 0.3 12.5 3.4 104–118 7.9 6.6 0.11 0.3 12.8 3.2 118–128 7.4 6.7 1.86 0.3 15.6 3.1
128–140+ 7.5 6.8 1.97 0.1 17.4 4.5
Extractable bases Ca Mg Na K
CEC Clay CEC Depth (cm)
---------------------------------[cmol(p+)kg-1]---------------------------
BS (%)
ESP
0–6 47.3 11.3 0.3 0.7 60.9 108 98 0.6 6–20 48.2 13.1 0.3 0.6 56.7 92 110 0.5 20–41 50.8 14.2 0.4 0.4 65.2 100 101 0.6 41–74 50.6 18.0 0.6 0.4 63.0 96 110 1.0
74–104 53.7 15.3 0.8 0.4 71.7 107 98 1.1 104–118 55.5 14.0 0.9 0.5 65.2 90 109 1.4 118–128 57.2 12.3 1.0 0.5 54.4 77 131 1.9
128–140+ 47.9 8.1 0.1 0.2 32.6 132 173 0.3
- Nil or not determined (wherever applicable)
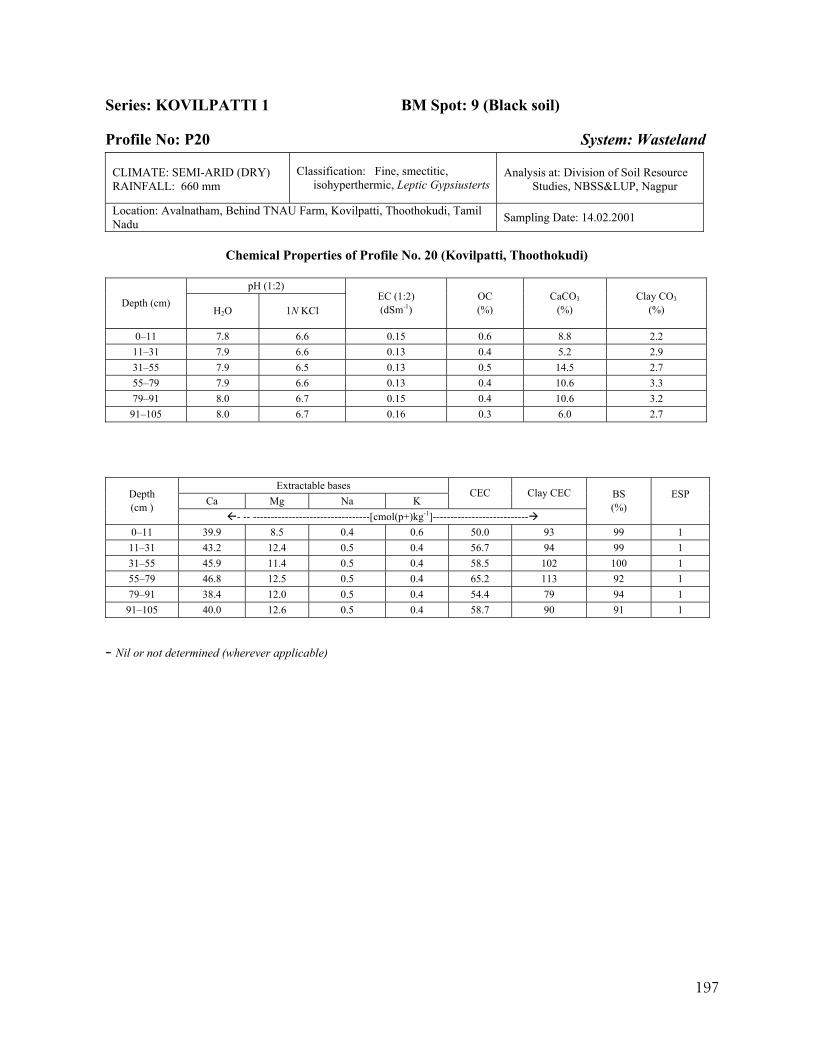
197
Series: KOVILPATTI 1 BM Spot: 9 (Black soil)
Profile No: P20 System: Wasteland
CLIMATE: SEMI-ARID (DRY) RAINFALL: 660 mm
Classification: Fine, smectitic, isohyperthermic, Leptic Gypsiusterts
Analysis at: Division of Soil Resource Studies, NBSS&LUP, Nagpur
Location: Avalnatham, Behind TNAU Farm, Kovilpatti, Thoothokudi, Tamil Nadu Sampling Date: 14.02.2001
Chemical Properties of Profile No. 20 (Kovilpatti, Thoothokudi)
pH (1:2)
Depth (cm) H2O 1N KCl
EC (1:2) (dSm-1)
OC (%)
CaCO3 (%)
Clay CO3
(%)
0–11 7.8 6.6 0.15 0.6 8.8 2.2 11–31 7.9 6.6 0.13 0.4 5.2 2.9 31–55 7.9 6.5 0.13 0.5 14.5 2.7 55–79 7.9 6.6 0.13 0.4 10.6 3.3 79–91 8.0 6.7 0.15 0.4 10.6 3.2
91–105 8.0 6.7 0.16 0.3 6.0 2.7
Extractable bases Ca Mg Na K
CEC Clay CEC Depth (cm )
- -- ---------------------------------[cmol(p+)kg-1]---------------------------
BS (%)
ESP
0–11 39.9 8.5 0.4 0.6 50.0 93 99 1 11–31 43.2 12.4 0.5 0.4 56.7 94 99 1 31–55 45.9 11.4 0.5 0.4 58.5 102 100 1 55–79 46.8 12.5 0.5 0.4 65.2 113 92 1 79–91 38.4 12.0 0.5 0.4 54.4 79 94 1 91–105 40.0 12.6 0.5 0.4 58.7 90 91 1
- Nil or not determined (wherever applicable)
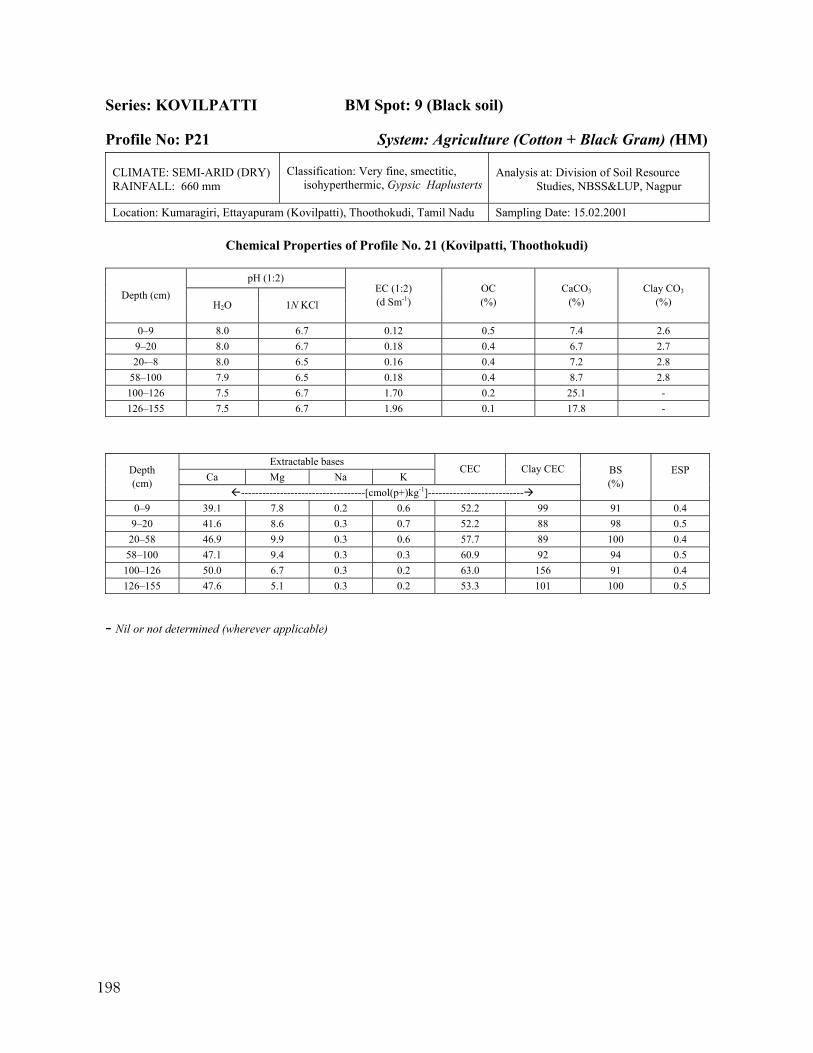
198
Series: KOVILPATTI BM Spot: 9 (Black soil)
Profile No: P21 System: Agriculture (Cotton + Black Gram) (HM) CLIMATE: SEMI-ARID (DRY) RAINFALL: 660 mm
Classification: Very fine, smectitic, isohyperthermic, Gypsic Haplusterts
Analysis at: Division of Soil Resource Studies, NBSS&LUP, Nagpur
Location: Kumaragiri, Ettayapuram (Kovilpatti), Thoothokudi, Tamil Nadu Sampling Date: 15.02.2001
Chemical Properties of Profile No. 21 (Kovilpatti, Thoothokudi)
pH (1:2) Depth (cm)
H2O 1N KCl EC (1:2) (d Sm-1)
OC (%)
CaCO3 (%)
Clay CO3
(%)
0–9 8.0 6.7 0.12 0.5 7.4 2.6 9–20 8.0 6.7 0.18 0.4 6.7 2.7 20-–8 8.0 6.5 0.16 0.4 7.2 2.8
58–100 7.9 6.5 0.18 0.4 8.7 2.8 100–126 7.5 6.7 1.70 0.2 25.1 - 126–155 7.5 6.7 1.96 0.1 17.8 -
Extractable bases Ca Mg Na K
CEC Clay CEC Depth (cm)
-----------------------------------[cmol(p+)kg-1]---------------------------
BS (%)
ESP
0–9 39.1 7.8 0.2 0.6 52.2 99 91 0.4 9–20 41.6 8.6 0.3 0.7 52.2 88 98 0.5 20–58 46.9 9.9 0.3 0.6 57.7 89 100 0.4 58–100 47.1 9.4 0.3 0.3 60.9 92 94 0.5
100–126 50.0 6.7 0.3 0.2 63.0 156 91 0.4 126–155 47.6 5.1 0.3 0.2 53.3 101 100 0.5
- Nil or not determined (wherever applicable)
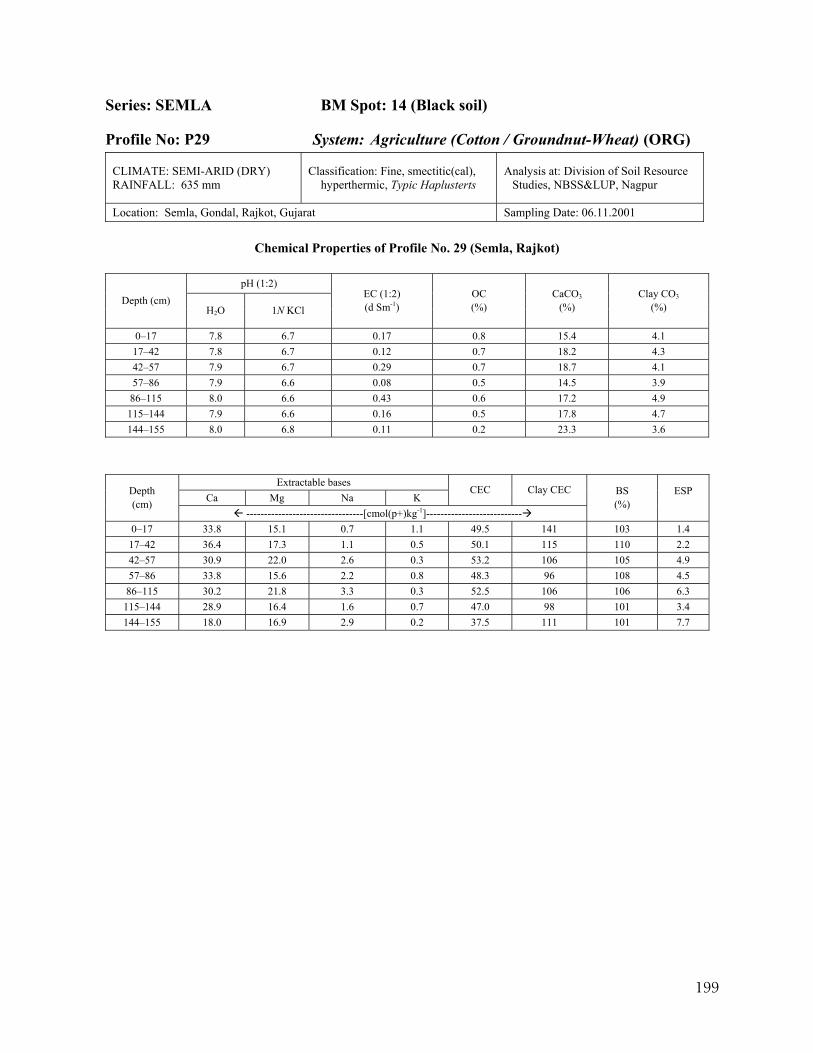
199
Series: SEMLA BM Spot: 14 (Black soil)
Profile No: P29 System: Agriculture (Cotton / Groundnut-Wheat) (ORG)
CLIMATE: SEMI-ARID (DRY) RAINFALL: 635 mm
Classification: Fine, smectitic(cal), hyperthermic, Typic Haplusterts
Analysis at: Division of Soil Resource Studies, NBSS&LUP, Nagpur
Location: Semla, Gondal, Rajkot, Gujarat Sampling Date: 06.11.2001
Chemical Properties of Profile No. 29 (Semla, Rajkot)
pH (1:2) Depth (cm)
H2O 1N KCl EC (1:2) (d Sm-1)
OC (%)
CaCO3 (%)
Clay CO3
(%)
0–17 7.8 6.7 0.17 0.8 15.4 4.1 17–42 7.8 6.7 0.12 0.7 18.2 4.3 42–57 7.9 6.7 0.29 0.7 18.7 4.1 57–86 7.9 6.6 0.08 0.5 14.5 3.9
86–115 8.0 6.6 0.43 0.6 17.2 4.9 115–144 7.9 6.6 0.16 0.5 17.8 4.7 144–155 8.0 6.8 0.11 0.2 23.3 3.6
Extractable bases Ca Mg Na K
CEC Clay CEC Depth (cm)
---------------------------------[cmol(p+)kg-1]---------------------------
BS (%)
ESP
0–17 33.8 15.1 0.7 1.1 49.5 141 103 1.4 17–42 36.4 17.3 1.1 0.5 50.1 115 110 2.2 42–57 30.9 22.0 2.6 0.3 53.2 106 105 4.9 57–86 33.8 15.6 2.2 0.8 48.3 96 108 4.5 86–115 30.2 21.8 3.3 0.3 52.5 106 106 6.3
115–144 28.9 16.4 1.6 0.7 47.0 98 101 3.4 144–155 18.0 16.9 2.9 0.2 37.5 111 101 7.7
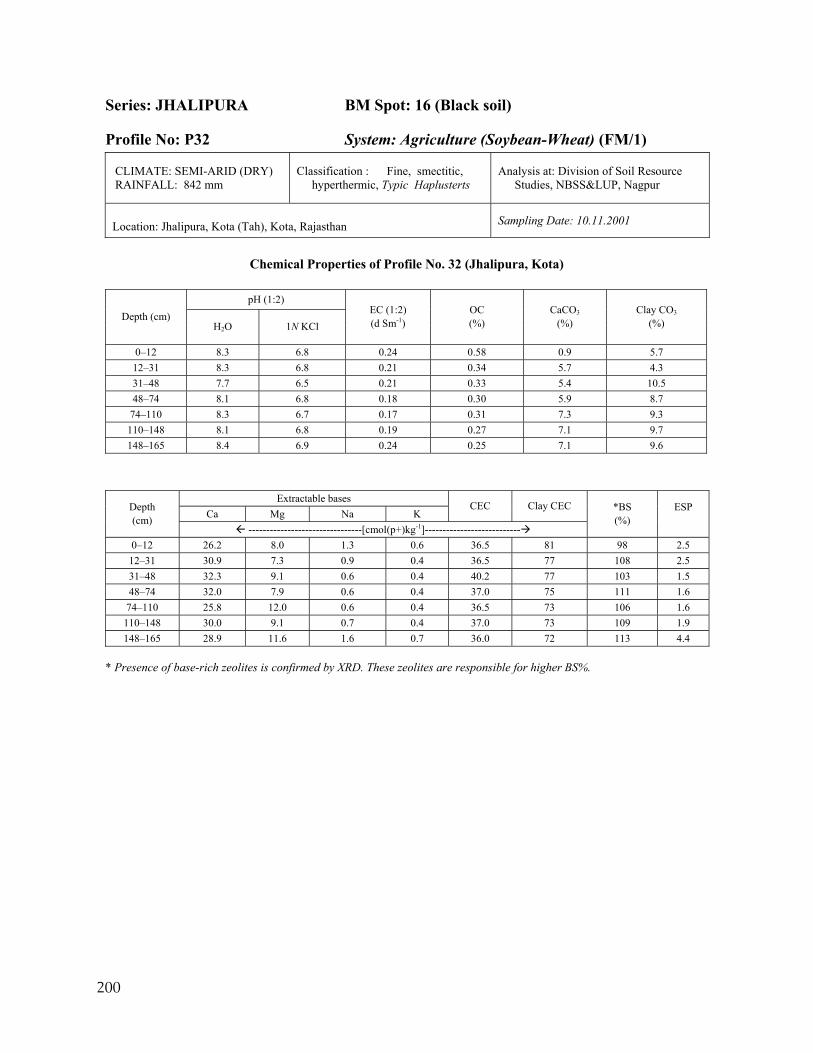
200
Series: JHALIPURA BM Spot: 16 (Black soil)
Profile No: P32 System: Agriculture (Soybean-Wheat) (FM/1)
CLIMATE: SEMI-ARID (DRY) RAINFALL: 842 mm
Classification : Fine, smectitic, hyperthermic, Typic Haplusterts
Analysis at: Division of Soil Resource Studies, NBSS&LUP, Nagpur
Location: Jhalipura, Kota (Tah), Kota, Rajasthan Sampling Date: 10.11.2001
Chemical Properties of Profile No. 32 (Jhalipura, Kota)
pH (1:2)
Depth (cm) H2O 1N KCl
EC (1:2) (d Sm-1)
OC (%)
CaCO3 (%)
Clay CO3
(%)
0–12 8.3 6.8 0.24 0.58 0.9 5.7 12–31 8.3 6.8 0.21 0.34 5.7 4.3 31–48 7.7 6.5 0.21 0.33 5.4 10.5 48–74 8.1 6.8 0.18 0.30 5.9 8.7
74–110 8.3 6.7 0.17 0.31 7.3 9.3 110–148 8.1 6.8 0.19 0.27 7.1 9.7 148–165 8.4 6.9 0.24 0.25 7.1 9.6
Extractable bases Ca Mg Na K
CEC Clay CEC Depth (cm)
--------------------------------[cmol(p+)kg-1]---------------------------
*BS (%)
ESP
0–12 26.2 8.0 1.3 0.6 36.5 81 98 2.5 12–31 30.9 7.3 0.9 0.4 36.5 77 108 2.5 31–48 32.3 9.1 0.6 0.4 40.2 77 103 1.5 48–74 32.0 7.9 0.6 0.4 37.0 75 111 1.6 74–110 25.8 12.0 0.6 0.4 36.5 73 106 1.6
110–148 30.0 9.1 0.7 0.4 37.0 73 109 1.9 148–165 28.9 11.6 1.6 0.7 36.0 72 113 4.4
* Presence of base-rich zeolites is confirmed by XRD. These zeolites are responsible for higher BS%.
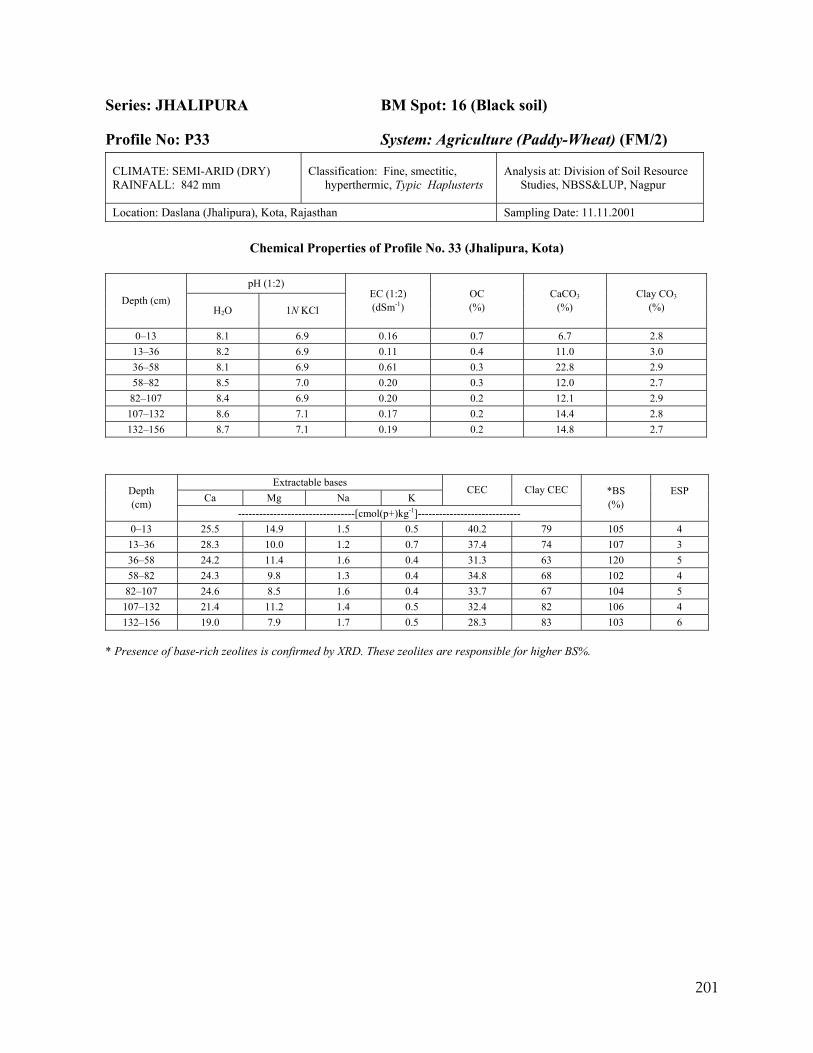
201
Series: JHALIPURA BM Spot: 16 (Black soil)
Profile No: P33 System: Agriculture (Paddy-Wheat) (FM/2)
CLIMATE: SEMI-ARID (DRY) RAINFALL: 842 mm
Classification: Fine, smectitic, hyperthermic, Typic Haplusterts
Analysis at: Division of Soil Resource Studies, NBSS&LUP, Nagpur
Location: Daslana (Jhalipura), Kota, Rajasthan Sampling Date: 11.11.2001
Chemical Properties of Profile No. 33 (Jhalipura, Kota)
pH (1:2) Depth (cm)
H2O 1N KCl EC (1:2) (dSm-1)
OC (%)
CaCO3 (%)
Clay CO3
(%)
0–13 8.1 6.9 0.16 0.7 6.7 2.8 13–36 8.2 6.9 0.11 0.4 11.0 3.0 36–58 8.1 6.9 0.61 0.3 22.8 2.9 58–82 8.5 7.0 0.20 0.3 12.0 2.7
82–107 8.4 6.9 0.20 0.2 12.1 2.9 107–132 8.6 7.1 0.17 0.2 14.4 2.8 132–156 8.7 7.1 0.19 0.2 14.8 2.7
Extractable bases Ca Mg Na K
CEC Clay CEC Depth (cm)
---------------------------------[cmol(p+)kg-1]-----------------------------
*BS (%)
ESP
0–13 25.5 14.9 1.5 0.5 40.2 79 105 4 13–36 28.3 10.0 1.2 0.7 37.4 74 107 3 36–58 24.2 11.4 1.6 0.4 31.3 63 120 5 58–82 24.3 9.8 1.3 0.4 34.8 68 102 4 82–107 24.6 8.5 1.6 0.4 33.7 67 104 5
107–132 21.4 11.2 1.4 0.5 32.4 82 106 4 132–156 19.0 7.9 1.7 0.5 28.3 83 103 6
* Presence of base-rich zeolites is confirmed by XRD. These zeolites are responsible for higher BS%.
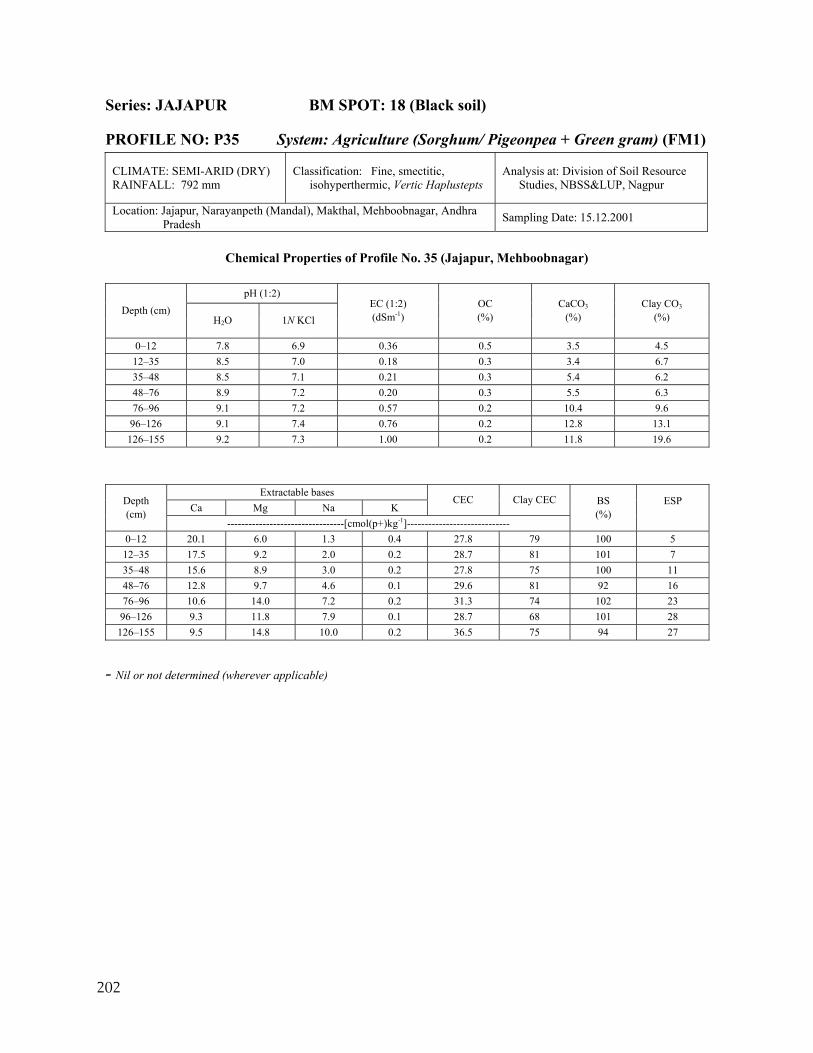
202
Series: JAJAPUR BM SPOT: 18 (Black soil)
PROFILE NO: P35 System: Agriculture (Sorghum/ Pigeonpea + Green gram) (FM1)
CLIMATE: SEMI-ARID (DRY) RAINFALL: 792 mm
Classification: Fine, smectitic, isohyperthermic, Vertic Haplustepts
Analysis at: Division of Soil Resource Studies, NBSS&LUP, Nagpur
Location: Jajapur, Narayanpeth (Mandal), Makthal, Mehboobnagar, Andhra Pradesh Sampling Date: 15.12.2001
Chemical Properties of Profile No. 35 (Jajapur, Mehboobnagar)
pH (1:2)
Depth (cm) H2O 1N KCl
EC (1:2) (dSm-1)
OC (%)
CaCO3 (%)
Clay CO3
(%)
0–12 7.8 6.9 0.36 0.5 3.5 4.5 12–35 8.5 7.0 0.18 0.3 3.4 6.7 35–48 8.5 7.1 0.21 0.3 5.4 6.2 48–76 8.9 7.2 0.20 0.3 5.5 6.3 76–96 9.1 7.2 0.57 0.2 10.4 9.6
96–126 9.1 7.4 0.76 0.2 12.8 13.1 126–155 9.2 7.3 1.00 0.2 11.8 19.6
Extractable bases Ca Mg Na K
CEC Clay CEC Depth (cm)
---------------------------------[cmol(p+)kg-1]-----------------------------
BS (%)
ESP
0–12 20.1 6.0 1.3 0.4 27.8 79 100 5 12–35 17.5 9.2 2.0 0.2 28.7 81 101 7 35–48 15.6 8.9 3.0 0.2 27.8 75 100 11 48–76 12.8 9.7 4.6 0.1 29.6 81 92 16 76–96 10.6 14.0 7.2 0.2 31.3 74 102 23
96–126 9.3 11.8 7.9 0.1 28.7 68 101 28 126–155 9.5 14.8 10.0 0.2 36.5 75 94 27
- Nil or not determined (wherever applicable)
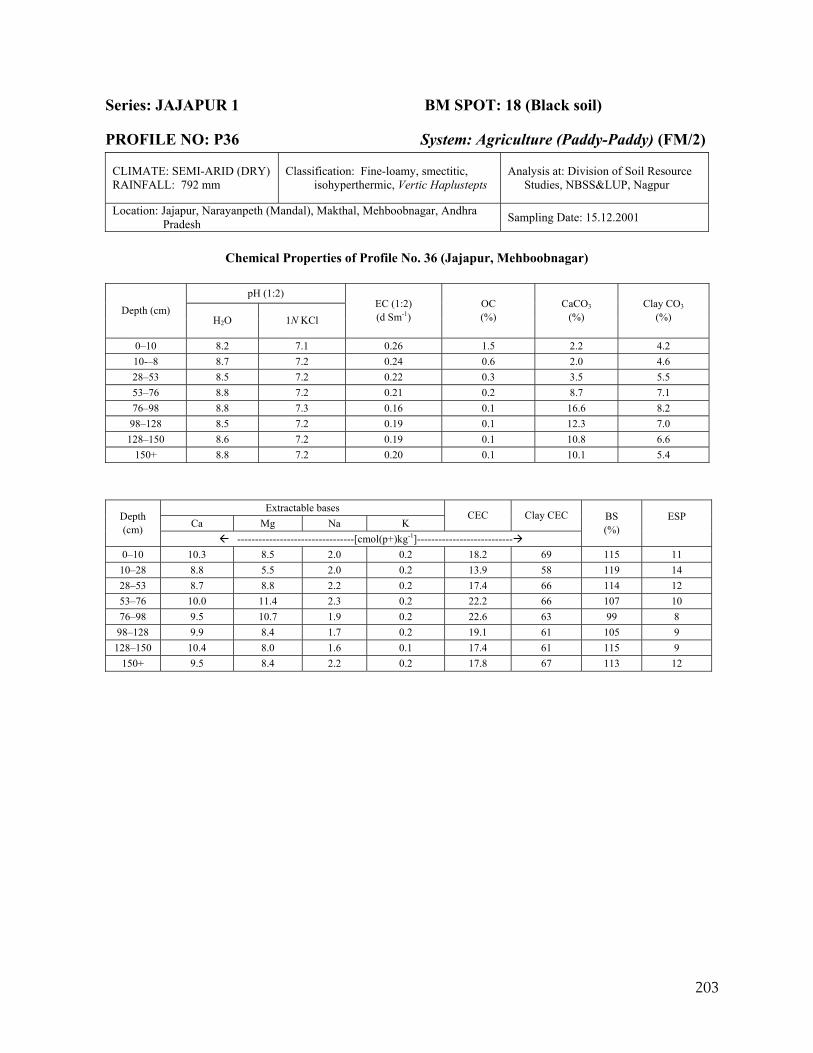
203
Series: JAJAPUR 1 BM SPOT: 18 (Black soil)
PROFILE NO: P36 System: Agriculture (Paddy-Paddy) (FM/2)
CLIMATE: SEMI-ARID (DRY) RAINFALL: 792 mm
Classification: Fine-loamy, smectitic, isohyperthermic, Vertic Haplustepts
Analysis at: Division of Soil Resource Studies, NBSS&LUP, Nagpur
Location: Jajapur, Narayanpeth (Mandal), Makthal, Mehboobnagar, Andhra Pradesh Sampling Date: 15.12.2001
Chemical Properties of Profile No. 36 (Jajapur, Mehboobnagar)
pH (1:2)
Depth (cm) H2O 1N KCl
EC (1:2) (d Sm-1)
OC (%)
CaCO3 (%)
Clay CO3
(%)
0–10 8.2 7.1 0.26 1.5 2.2 4.2 10-–8 8.7 7.2 0.24 0.6 2.0 4.6 28–53 8.5 7.2 0.22 0.3 3.5 5.5 53–76 8.8 7.2 0.21 0.2 8.7 7.1 76–98 8.8 7.3 0.16 0.1 16.6 8.2
98–128 8.5 7.2 0.19 0.1 12.3 7.0 128–150 8.6 7.2 0.19 0.1 10.8 6.6
150+ 8.8 7.2 0.20 0.1 10.1 5.4
Extractable bases Ca Mg Na K
CEC Clay CEC Depth (cm)
---------------------------------[cmol(p+)kg-1]---------------------------
BS (%)
ESP
0–10 10.3 8.5 2.0 0.2 18.2 69 115 11 10–28 8.8 5.5 2.0 0.2 13.9 58 119 14 28–53 8.7 8.8 2.2 0.2 17.4 66 114 12 53–76 10.0 11.4 2.3 0.2 22.2 66 107 10 76–98 9.5 10.7 1.9 0.2 22.6 63 99 8
98–128 9.9 8.4 1.7 0.2 19.1 61 105 9 128–150 10.4 8.0 1.6 0.1 17.4 61 115 9
150+ 9.5 8.4 2.2 0.2 17.8 67 113 12
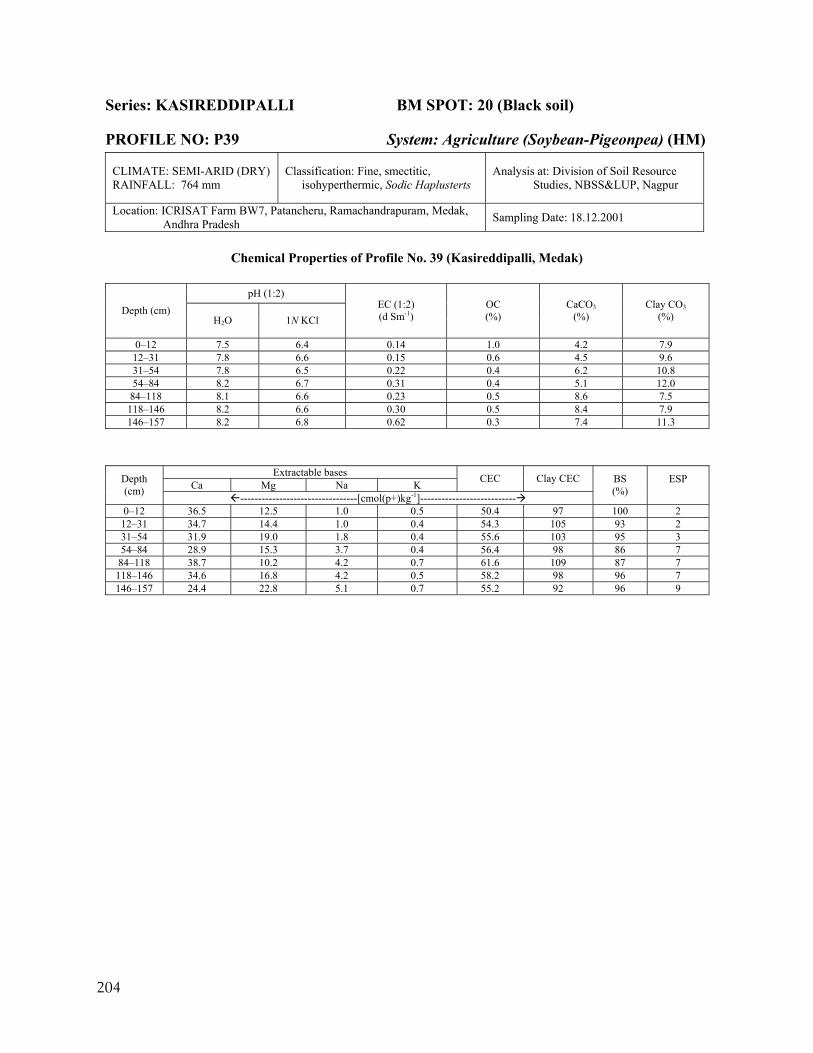
204
Series: KASIREDDIPALLI BM SPOT: 20 (Black soil)
PROFILE NO: P39 System: Agriculture (Soybean-Pigeonpea) (HM)
CLIMATE: SEMI-ARID (DRY) RAINFALL: 764 mm
Classification: Fine, smectitic, isohyperthermic, Sodic Haplusterts
Analysis at: Division of Soil Resource Studies, NBSS&LUP, Nagpur
Location: ICRISAT Farm BW7, Patancheru, Ramachandrapuram, Medak, Andhra Pradesh Sampling Date: 18.12.2001
Chemical Properties of Profile No. 39 (Kasireddipalli, Medak)
pH (1:2)
Depth (cm) H2O 1N KCl
EC (1:2) (d Sm-1)
OC (%)
CaCO3 (%)
Clay CO3 (%)
0–12 7.5 6.4 0.14 1.0 4.2 7.9 12–31 7.8 6.6 0.15 0.6 4.5 9.6 31–54 7.8 6.5 0.22 0.4 6.2 10.8 54–84 8.2 6.7 0.31 0.4 5.1 12.0
84–118 8.1 6.6 0.23 0.5 8.6 7.5 118–146 8.2 6.6 0.30 0.5 8.4 7.9 146–157 8.2 6.8 0.62 0.3 7.4 11.3
Extractable bases Ca Mg Na K CEC Clay CEC Depth
(cm) ---------------------------------[cmol(p+)kg-1]---------------------------
BS (%)
ESP
0–12 36.5 12.5 1.0 0.5 50.4 97 100 2 12–31 34.7 14.4 1.0 0.4 54.3 105 93 2 31–54 31.9 19.0 1.8 0.4 55.6 103 95 3 54–84 28.9 15.3 3.7 0.4 56.4 98 86 7
84–118 38.7 10.2 4.2 0.7 61.6 109 87 7 118–146 34.6 16.8 4.2 0.5 58.2 98 96 7 146–157 24.4 22.8 5.1 0.7 55.2 92 96 9
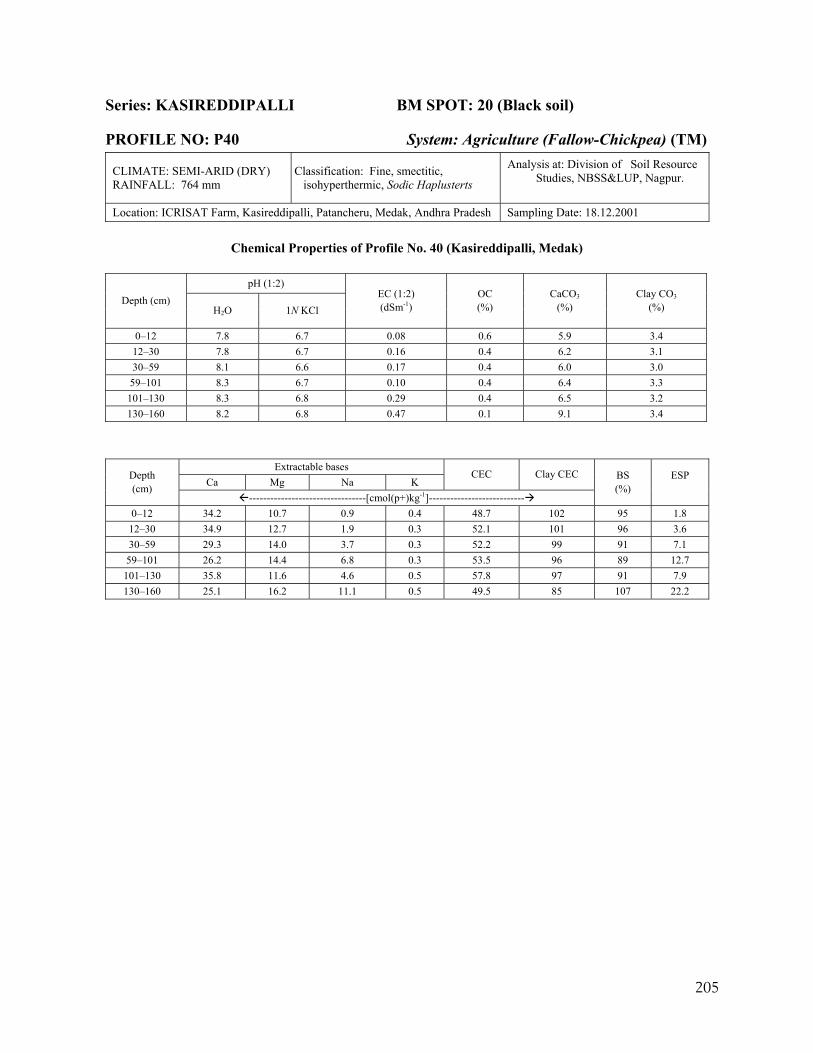
205
Series: KASIREDDIPALLI BM SPOT: 20 (Black soil)
PROFILE NO: P40 System: Agriculture (Fallow-Chickpea) (TM)
CLIMATE: SEMI-ARID (DRY) RAINFALL: 764 mm
Classification: Fine, smectitic, isohyperthermic, Sodic Haplusterts
Analysis at: Division of Soil Resource Studies, NBSS&LUP, Nagpur.
Location: ICRISAT Farm, Kasireddipalli, Patancheru, Medak, Andhra Pradesh Sampling Date: 18.12.2001
Chemical Properties of Profile No. 40 (Kasireddipalli, Medak)
pH (1:2) Depth (cm)
H2O 1N KCl EC (1:2) (dSm-1)
OC (%)
CaCO3 (%)
Clay CO3
(%)
0–12 7.8 6.7 0.08 0.6 5.9 3.4 12–30 7.8 6.7 0.16 0.4 6.2 3.1 30–59 8.1 6.6 0.17 0.4 6.0 3.0
59–101 8.3 6.7 0.10 0.4 6.4 3.3 101–130 8.3 6.8 0.29 0.4 6.5 3.2 130–160 8.2 6.8 0.47 0.1 9.1 3.4
Extractable bases Ca Mg Na K
CEC Clay CEC Depth (cm)
---------------------------------[cmol(p+)kg-1]---------------------------
BS (%)
ESP
0–12 34.2 10.7 0.9 0.4 48.7 102 95 1.8 12–30 34.9 12.7 1.9 0.3 52.1 101 96 3.6 30–59 29.3 14.0 3.7 0.3 52.2 99 91 7.1 59–101 26.2 14.4 6.8 0.3 53.5 96 89 12.7
101–130 35.8 11.6 4.6 0.5 57.8 97 91 7.9 130–160 25.1 16.2 11.1 0.5 49.5 85 107 22.2
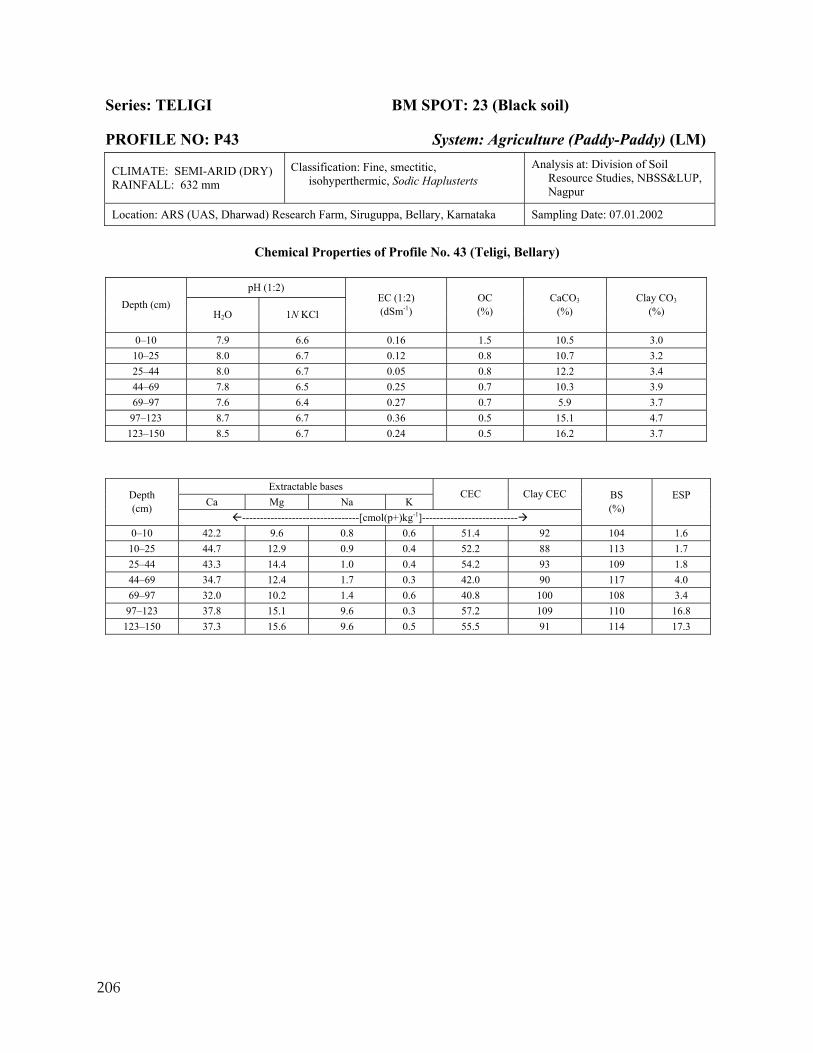
206
Series: TELIGI BM SPOT: 23 (Black soil)
PROFILE NO: P43 System: Agriculture (Paddy-Paddy) (LM)
CLIMATE: SEMI-ARID (DRY) RAINFALL: 632 mm
Classification: Fine, smectitic, isohyperthermic, Sodic Haplusterts
Analysis at: Division of Soil Resource Studies, NBSS&LUP, Nagpur
Location: ARS (UAS, Dharwad) Research Farm, Siruguppa, Bellary, Karnataka Sampling Date: 07.01.2002
Chemical Properties of Profile No. 43 (Teligi, Bellary)
pH (1:2)
Depth (cm) H2O 1N KCl
EC (1:2) (dSm-1)
OC (%)
CaCO3 (%)
Clay CO3
(%)
0–10 7.9 6.6 0.16 1.5 10.5 3.0 10–25 8.0 6.7 0.12 0.8 10.7 3.2 25–44 8.0 6.7 0.05 0.8 12.2 3.4 44–69 7.8 6.5 0.25 0.7 10.3 3.9 69–97 7.6 6.4 0.27 0.7 5.9 3.7
97–123 8.7 6.7 0.36 0.5 15.1 4.7 123–150 8.5 6.7 0.24 0.5 16.2 3.7
Extractable bases Ca Mg Na K
CEC Clay CEC Depth (cm)
---------------------------------[cmol(p+)kg-1]---------------------------
BS (%)
ESP
0–10 42.2 9.6 0.8 0.6 51.4 92 104 1.6 10–25 44.7 12.9 0.9 0.4 52.2 88 113 1.7 25–44 43.3 14.4 1.0 0.4 54.2 93 109 1.8 44–69 34.7 12.4 1.7 0.3 42.0 90 117 4.0 69–97 32.0 10.2 1.4 0.6 40.8 100 108 3.4 97–123 37.8 15.1 9.6 0.3 57.2 109 110 16.8
123–150 37.3 15.6 9.6 0.5 55.5 91 114 17.3
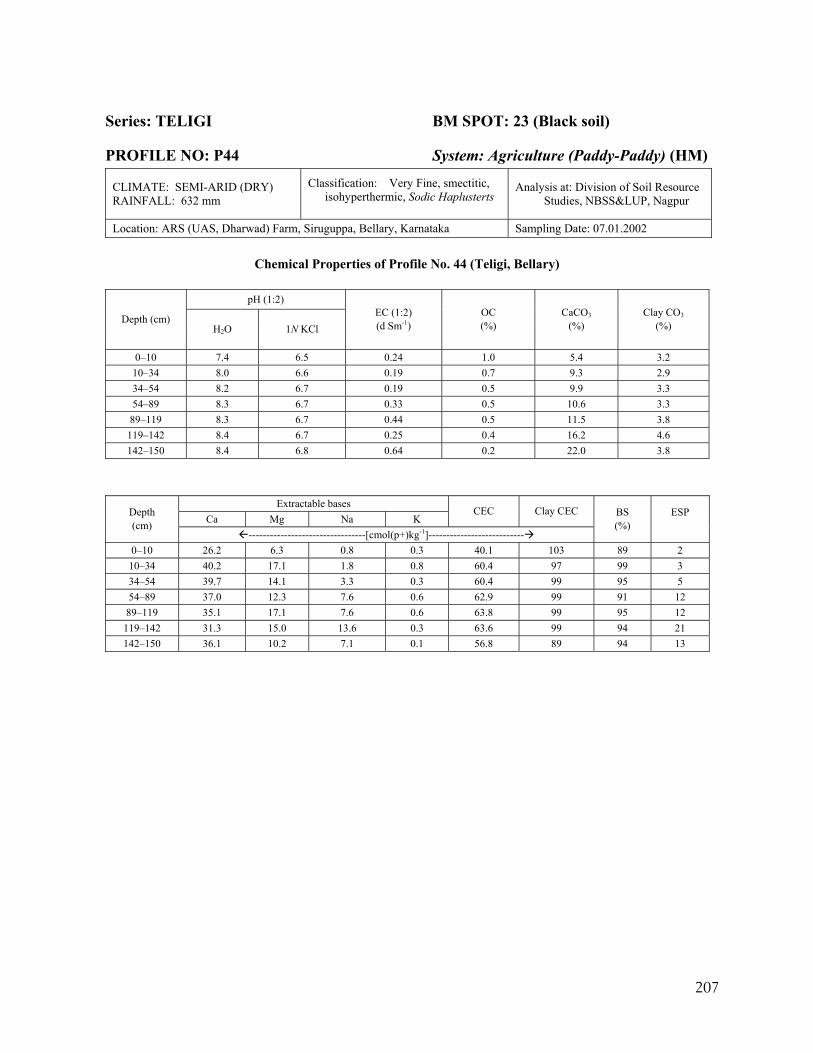
207
Series: TELIGI BM SPOT: 23 (Black soil)
PROFILE NO: P44 System: Agriculture (Paddy-Paddy) (HM)
CLIMATE: SEMI-ARID (DRY) RAINFALL: 632 mm
Classification: Very Fine, smectitic, isohyperthermic, Sodic Haplusterts
Analysis at: Division of Soil Resource Studies, NBSS&LUP, Nagpur
Location: ARS (UAS, Dharwad) Farm, Siruguppa, Bellary, Karnataka Sampling Date: 07.01.2002
Chemical Properties of Profile No. 44 (Teligi, Bellary)
pH (1:2)
Depth (cm) H2O 1N KCl
EC (1:2) (d Sm-1)
OC (%)
CaCO3 (%)
Clay CO3
(%)
0–10 7.4 6.5 0.24 1.0 5.4 3.2 10–34 8.0 6.6 0.19 0.7 9.3 2.9 34–54 8.2 6.7 0.19 0.5 9.9 3.3 54–89 8.3 6.7 0.33 0.5 10.6 3.3
89–119 8.3 6.7 0.44 0.5 11.5 3.8 119–142 8.4 6.7 0.25 0.4 16.2 4.6 142–150 8.4 6.8 0.64 0.2 22.0 3.8
Extractable bases Ca Mg Na K
CEC Clay CEC Depth (cm)
---------------------------------[cmol(p+)kg-1]---------------------------
BS (%)
ESP
0–10 26.2 6.3 0.8 0.3 40.1 103 89 2 10–34 40.2 17.1 1.8 0.8 60.4 97 99 3 34–54 39.7 14.1 3.3 0.3 60.4 99 95 5 54–89 37.0 12.3 7.6 0.6 62.9 99 91 12
89–119 35.1 17.1 7.6 0.6 63.8 99 95 12 119–142 31.3 15.0 13.6 0.3 63.6 99 94 21 142–150 36.1 10.2 7.1 0.1 56.8 89 94 13
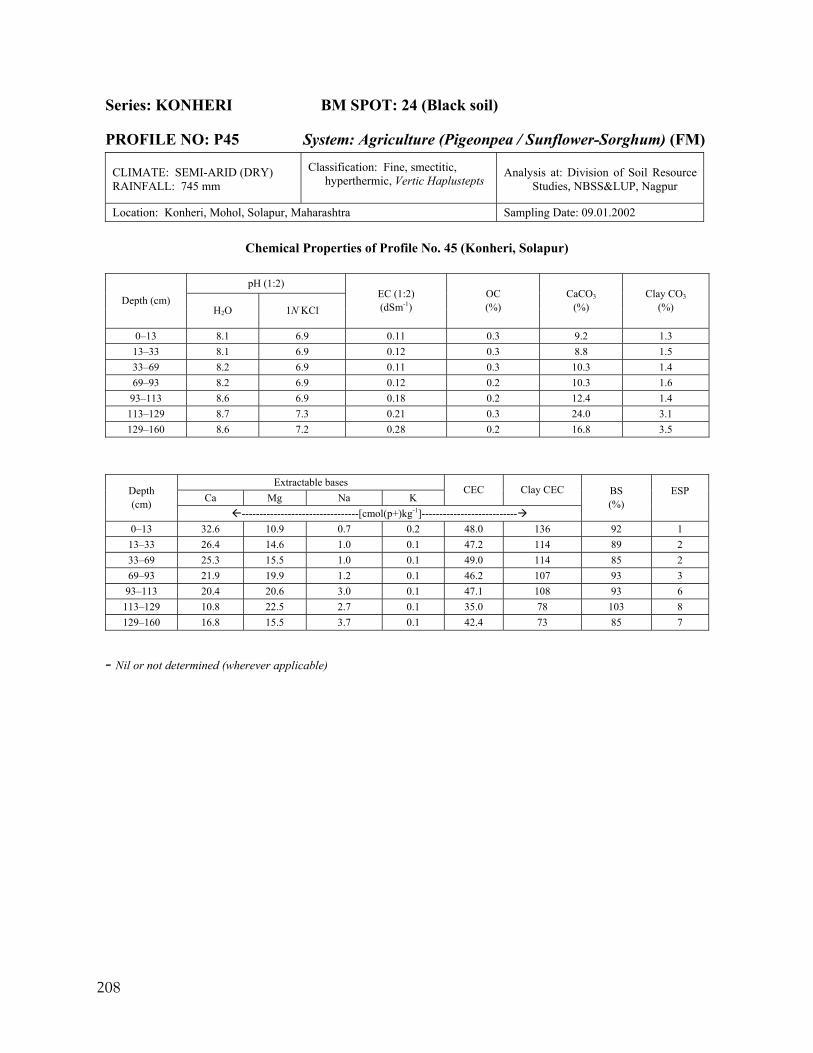
208
Series: KONHERI BM SPOT: 24 (Black soil)
PROFILE NO: P45 System: Agriculture (Pigeonpea / Sunflower-Sorghum) (FM)
CLIMATE: SEMI-ARID (DRY) RAINFALL: 745 mm
Classification: Fine, smectitic, hyperthermic, Vertic Haplustepts
Analysis at: Division of Soil Resource Studies, NBSS&LUP, Nagpur
Location: Konheri, Mohol, Solapur, Maharashtra Sampling Date: 09.01.2002
Chemical Properties of Profile No. 45 (Konheri, Solapur)
pH (1:2) Depth (cm)
H2O 1N KCl EC (1:2) (dSm-1)
OC (%)
CaCO3 (%)
Clay CO3
(%)
0–13 8.1 6.9 0.11 0.3 9.2 1.3 13–33 8.1 6.9 0.12 0.3 8.8 1.5 33–69 8.2 6.9 0.11 0.3 10.3 1.4 69–93 8.2 6.9 0.12 0.2 10.3 1.6
93–113 8.6 6.9 0.18 0.2 12.4 1.4 113–129 8.7 7.3 0.21 0.3 24.0 3.1 129–160 8.6 7.2 0.28 0.2 16.8 3.5
Extractable bases Ca Mg Na K
CEC Clay CEC Depth (cm)
---------------------------------[cmol(p+)kg-1]---------------------------
BS (%)
ESP
0–13 32.6 10.9 0.7 0.2 48.0 136 92 1 13–33 26.4 14.6 1.0 0.1 47.2 114 89 2 33–69 25.3 15.5 1.0 0.1 49.0 114 85 2 69–93 21.9 19.9 1.2 0.1 46.2 107 93 3
93–113 20.4 20.6 3.0 0.1 47.1 108 93 6 113–129 10.8 22.5 2.7 0.1 35.0 78 103 8 129–160 16.8 15.5 3.7 0.1 42.4 73 85 7
- Nil or not determined (wherever applicable)
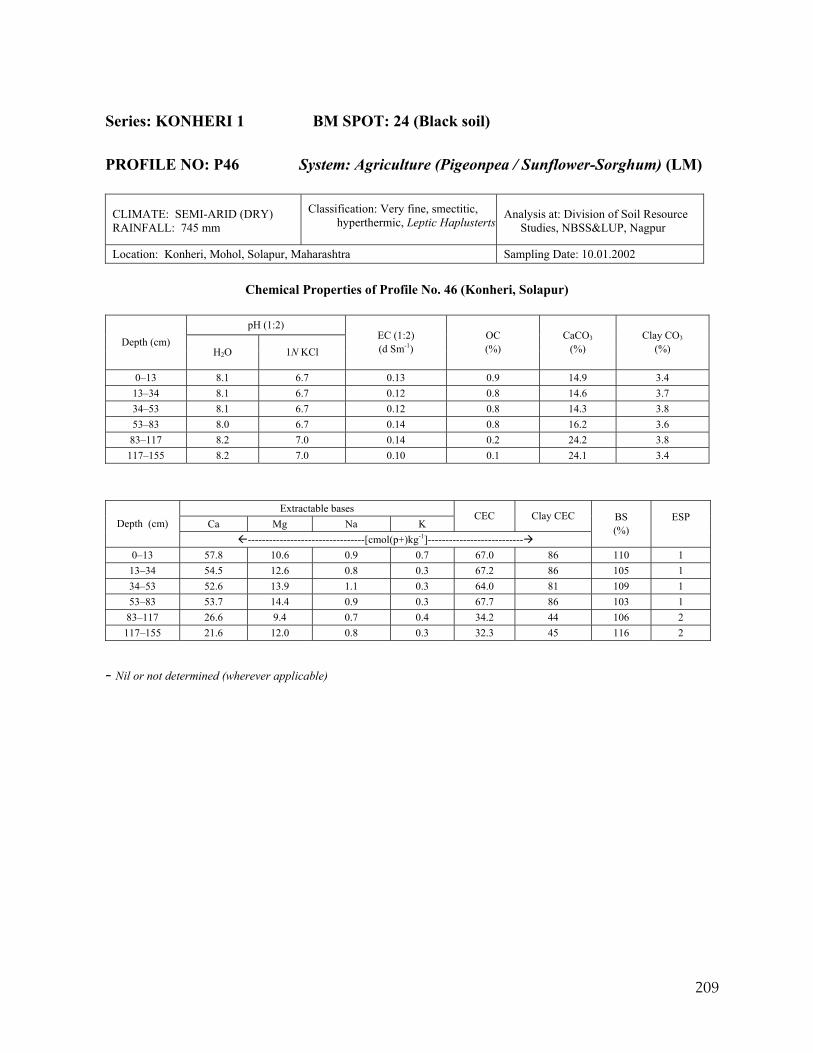
209
Series: KONHERI 1 BM SPOT: 24 (Black soil) PROFILE NO: P46 System: Agriculture (Pigeonpea / Sunflower-Sorghum) (LM)
CLIMATE: SEMI-ARID (DRY) RAINFALL: 745 mm
Classification: Very fine, smectitic, hyperthermic, Leptic Haplusterts
Analysis at: Division of Soil Resource Studies, NBSS&LUP, Nagpur
Location: Konheri, Mohol, Solapur, Maharashtra Sampling Date: 10.01.2002
Chemical Properties of Profile No. 46 (Konheri, Solapur)
pH (1:2) Depth (cm)
H2O 1N KCl EC (1:2) (d Sm-1)
OC (%)
CaCO3 (%)
Clay CO3
(%)
0–13 8.1 6.7 0.13 0.9 14.9 3.4 13–34 8.1 6.7 0.12 0.8 14.6 3.7 34–53 8.1 6.7 0.12 0.8 14.3 3.8 53–83 8.0 6.7 0.14 0.8 16.2 3.6
83–117 8.2 7.0 0.14 0.2 24.2 3.8 117–155 8.2 7.0 0.10 0.1 24.1 3.4
Extractable bases Ca Mg Na K
CEC Clay CEC Depth (cm)
---------------------------------[cmol(p+)kg-1]---------------------------
BS (%)
ESP
0–13 57.8 10.6 0.9 0.7 67.0 86 110 1 13–34 54.5 12.6 0.8 0.3 67.2 86 105 1 34–53 52.6 13.9 1.1 0.3 64.0 81 109 1 53–83 53.7 14.4 0.9 0.3 67.7 86 103 1
83–117 26.6 9.4 0.7 0.4 34.2 44 106 2 117–155 21.6 12.0 0.8 0.3 32.3 45 116 2
- Nil or not determined (wherever applicable)
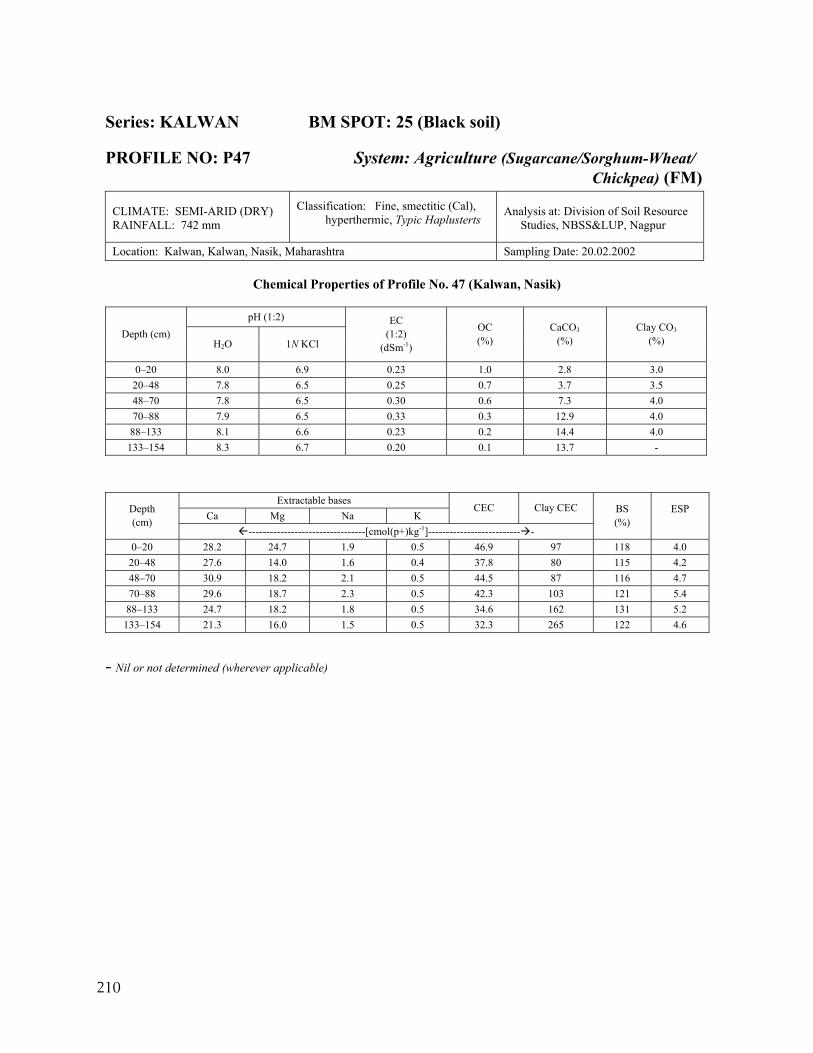
210
Series: KALWAN BM SPOT: 25 (Black soil)
PROFILE NO: P47 System: Agriculture (Sugarcane/Sorghum-Wheat/ Chickpea) (FM)
CLIMATE: SEMI-ARID (DRY) RAINFALL: 742 mm
Classification: Fine, smectitic (Cal), hyperthermic, Typic Haplusterts
Analysis at: Division of Soil Resource Studies, NBSS&LUP, Nagpur
Location: Kalwan, Kalwan, Nasik, Maharashtra Sampling Date: 20.02.2002
Chemical Properties of Profile No. 47 (Kalwan, Nasik)
pH (1:2) Depth (cm)
H2O 1N KCl
EC (1:2)
(dSm-1)
OC (%)
CaCO3 (%)
Clay CO3
(%)
0–20 8.0 6.9 0.23 1.0 2.8 3.0 20–48 7.8 6.5 0.25 0.7 3.7 3.5 48–70 7.8 6.5 0.30 0.6 7.3 4.0 70–88 7.9 6.5 0.33 0.3 12.9 4.0
88–133 8.1 6.6 0.23 0.2 14.4 4.0 133–154 8.3 6.7 0.20 0.1 13.7 -
Extractable bases Ca Mg Na K
CEC Clay CEC Depth (cm)
---------------------------------[cmol(p+)kg-1]-------------------------- -
BS (%)
ESP
0–20 28.2 24.7 1.9 0.5 46.9 97 118 4.0 20–48 27.6 14.0 1.6 0.4 37.8 80 115 4.2 48–70 30.9 18.2 2.1 0.5 44.5 87 116 4.7 70–88 29.6 18.7 2.3 0.5 42.3 103 121 5.4 88–133 24.7 18.2 1.8 0.5 34.6 162 131 5.2
133–154 21.3 16.0 1.5 0.5 32.3 265 122 4.6
- Nil or not determined (wherever applicable)
211
BLACK SOILS
(Arid)
(MAR: < 550 mm)
Benchmark Spots: 15, 28
No. of Pedons: 4 (P30, P31, P51, P52)
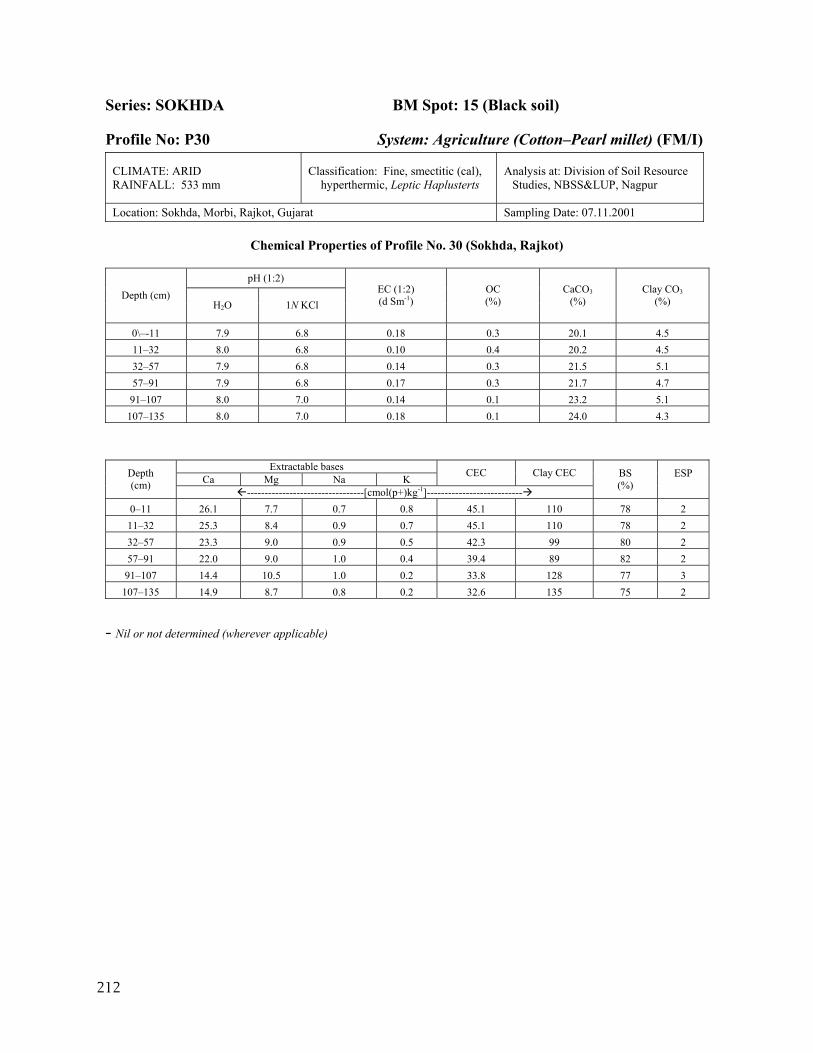
212
Series: SOKHDA BM Spot: 15 (Black soil)
Profile No: P30 System: Agriculture (Cotton–Pearl millet) (FM/I)
CLIMATE: ARID RAINFALL: 533 mm
Classification: Fine, smectitic (cal), hyperthermic, Leptic Haplusterts
Analysis at: Division of Soil Resource Studies, NBSS&LUP, Nagpur
Location: Sokhda, Morbi, Rajkot, Gujarat Sampling Date: 07.11.2001
Chemical Properties of Profile No. 30 (Sokhda, Rajkot)
pH (1:2) Depth (cm)
H2O 1N KCl EC (1:2) (d Sm-1)
OC (%)
CaCO3 (%)
Clay CO3 (%)
0\–-11 7.9 6.8 0.18 0.3 20.1 4.5 11–32 8.0 6.8 0.10 0.4 20.2 4.5 32–57 7.9 6.8 0.14 0.3 21.5 5.1 57–91 7.9 6.8 0.17 0.3 21.7 4.7 91–107 8.0 7.0 0.14 0.1 23.2 5.1
107–135 8.0 7.0 0.18 0.1 24.0 4.3
Extractable bases Ca Mg Na K CEC Clay CEC Depth
(cm) ---------------------------------[cmol(p+)kg-1]---------------------------
BS (%)
ESP
0–11 26.1 7.7 0.7 0.8 45.1 110 78 2 11–32 25.3 8.4 0.9 0.7 45.1 110 78 2 32–57 23.3 9.0 0.9 0.5 42.3 99 80 2 57–91 22.0 9.0 1.0 0.4 39.4 89 82 2 91–107 14.4 10.5 1.0 0.2 33.8 128 77 3
107–135 14.9 8.7 0.8 0.2 32.6 135 75 2
- Nil or not determined (wherever applicable)
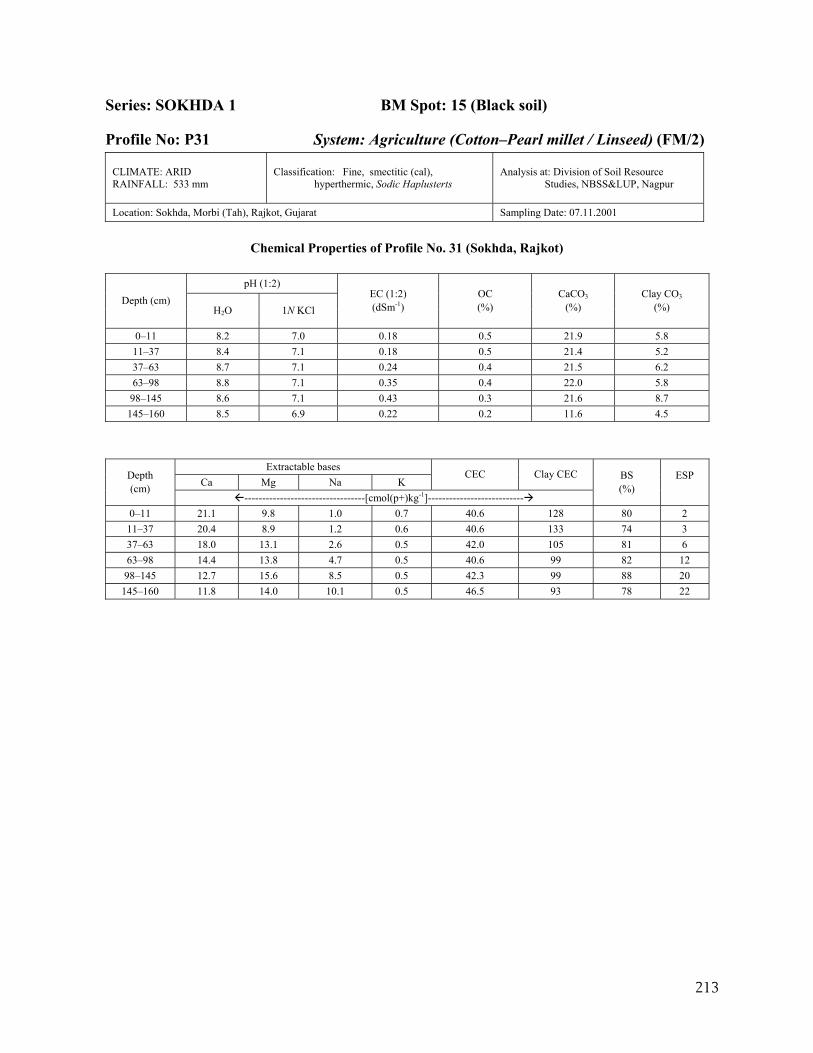
213
Series: SOKHDA 1 BM Spot: 15 (Black soil)
Profile No: P31 System: Agriculture (Cotton–Pearl millet / Linseed) (FM/2)
CLIMATE: ARID RAINFALL: 533 mm
Classification: Fine, smectitic (cal), hyperthermic, Sodic Haplusterts
Analysis at: Division of Soil Resource Studies, NBSS&LUP, Nagpur
Location: Sokhda, Morbi (Tah), Rajkot, Gujarat Sampling Date: 07.11.2001
Chemical Properties of Profile No. 31 (Sokhda, Rajkot)
pH (1:2)
Depth (cm) H2O 1N KCl
EC (1:2) (dSm-1)
OC (%)
CaCO3 (%)
Clay CO3
(%)
0–11 8.2 7.0 0.18 0.5 21.9 5.8 11–37 8.4 7.1 0.18 0.5 21.4 5.2 37–63 8.7 7.1 0.24 0.4 21.5 6.2 63–98 8.8 7.1 0.35 0.4 22.0 5.8
98–145 8.6 7.1 0.43 0.3 21.6 8.7 145–160 8.5 6.9 0.22 0.2 11.6 4.5
Extractable bases Ca Mg Na K
CEC Clay CEC Depth (cm)
----------------------------------[cmol(p+)kg-1]---------------------------
BS (%)
ESP
0–11 21.1 9.8 1.0 0.7 40.6 128 80 2 11–37 20.4 8.9 1.2 0.6 40.6 133 74 3 37–63 18.0 13.1 2.6 0.5 42.0 105 81 6 63–98 14.4 13.8 4.7 0.5 40.6 99 82 12 98–145 12.7 15.6 8.5 0.5 42.3 99 88 20
145–160 11.8 14.0 10.1 0.5 46.5 93 78 22
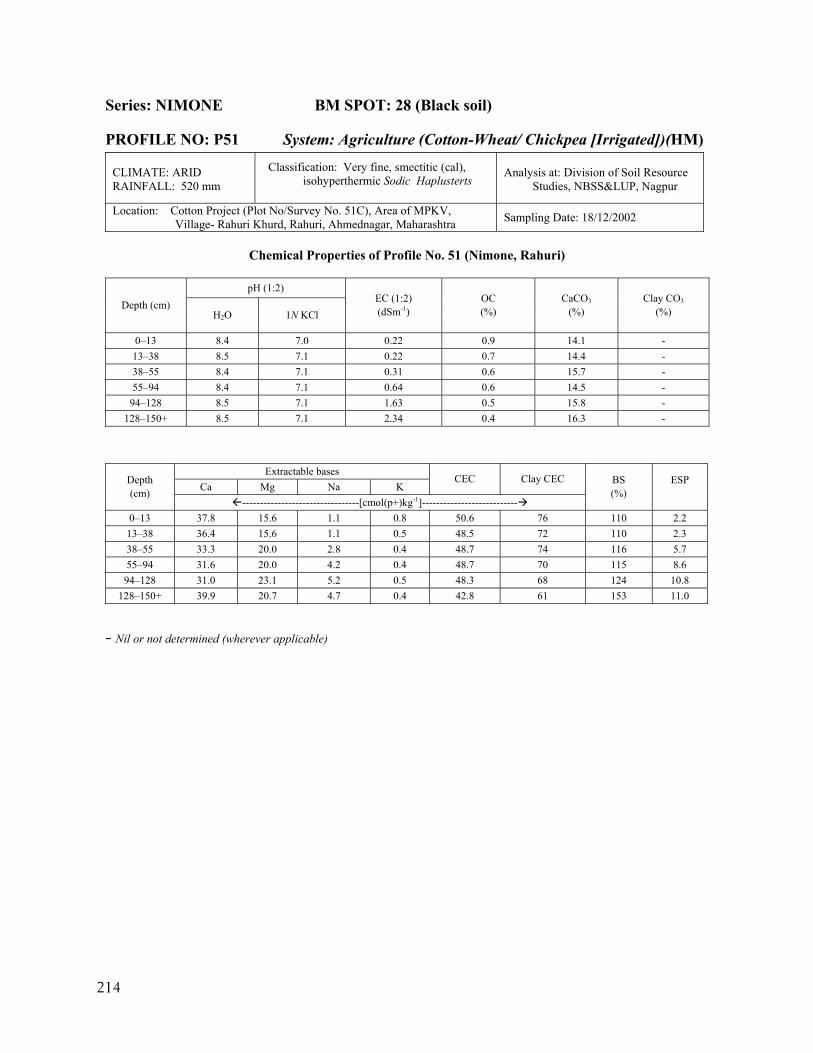
214
Series: NIMONE BM SPOT: 28 (Black soil)
PROFILE NO: P51 System: Agriculture (Cotton-Wheat/ Chickpea [Irrigated])(HM)
CLIMATE: ARID RAINFALL: 520 mm
Classification: Very fine, smectitic (cal), isohyperthermic Sodic Haplusterts
Analysis at: Division of Soil Resource Studies, NBSS&LUP, Nagpur
Location: Cotton Project (Plot No/Survey No. 51C), Area of MPKV, Village- Rahuri Khurd, Rahuri, Ahmednagar, Maharashtra Sampling Date: 18/12/2002
Chemical Properties of Profile No. 51 (Nimone, Rahuri)
pH (1:2)
Depth (cm) H2O 1N KCl
EC (1:2) (dSm-1)
OC (%)
CaCO3 (%)
Clay CO3
(%)
0–13 8.4 7.0 0.22 0.9 14.1 - 13–38 8.5 7.1 0.22 0.7 14.4 - 38–55 8.4 7.1 0.31 0.6 15.7 - 55–94 8.4 7.1 0.64 0.6 14.5 -
94–128 8.5 7.1 1.63 0.5 15.8 - 128–150+ 8.5 7.1 2.34 0.4 16.3 -
Extractable bases Ca Mg Na K
CEC Clay CEC Depth (cm)
---------------------------------[cmol(p+)kg-1]---------------------------
BS (%)
ESP
0–13 37.8 15.6 1.1 0.8 50.6 76 110 2.2 13–38 36.4 15.6 1.1 0.5 48.5 72 110 2.3 38–55 33.3 20.0 2.8 0.4 48.7 74 116 5.7 55–94 31.6 20.0 4.2 0.4 48.7 70 115 8.6 94–128 31.0 23.1 5.2 0.5 48.3 68 124 10.8
128–150+ 39.9 20.7 4.7 0.4 42.8 61 153 11.0
- Nil or not determined (wherever applicable)
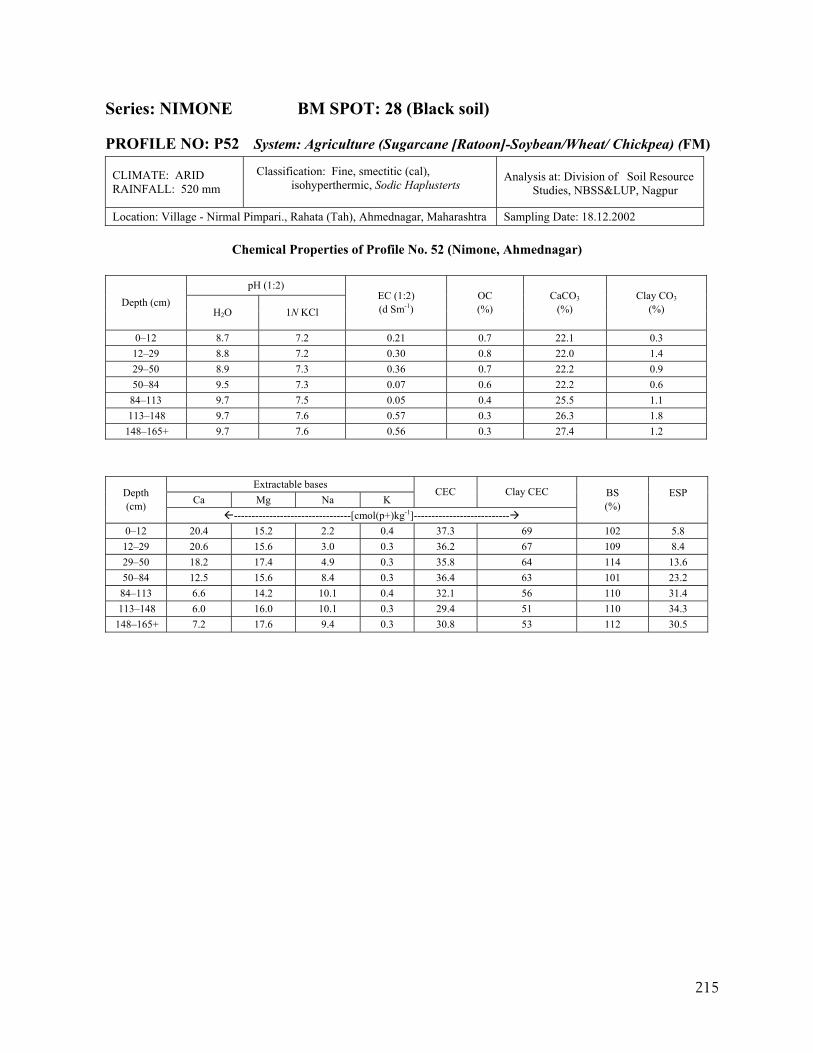
215
Series: NIMONE BM SPOT: 28 (Black soil)
PROFILE NO: P52 System: Agriculture (Sugarcane [Ratoon]-Soybean/Wheat/ Chickpea) (FM)
CLIMATE: ARID RAINFALL: 520 mm
Classification: Fine, smectitic (cal), isohyperthermic, Sodic Haplusterts
Analysis at: Division of Soil Resource Studies, NBSS&LUP, Nagpur
Location: Village - Nirmal Pimpari., Rahata (Tah), Ahmednagar, Maharashtra Sampling Date: 18.12.2002
Chemical Properties of Profile No. 52 (Nimone, Ahmednagar)
pH (1:2) Depth (cm)
H2O 1N KCl EC (1:2) (d Sm-1)
OC (%)
CaCO3 (%)
Clay CO3
(%)
0–12 8.7 7.2 0.21 0.7 22.1 0.3 12–29 8.8 7.2 0.30 0.8 22.0 1.4 29–50 8.9 7.3 0.36 0.7 22.2 0.9 50–84 9.5 7.3 0.07 0.6 22.2 0.6
84–113 9.7 7.5 0.05 0.4 25.5 1.1 113–148 9.7 7.6 0.57 0.3 26.3 1.8
148–165+ 9.7 7.6 0.56 0.3 27.4 1.2
Extractable bases Ca Mg Na K
CEC Clay CEC Depth (cm)
---------------------------------[cmol(p+)kg-1]---------------------------
BS (%)
ESP
0–12 20.4 15.2 2.2 0.4 37.3 69 102 5.8 12–29 20.6 15.6 3.0 0.3 36.2 67 109 8.4 29–50 18.2 17.4 4.9 0.3 35.8 64 114 13.6 50–84 12.5 15.6 8.4 0.3 36.4 63 101 23.2 84–113 6.6 14.2 10.1 0.4 32.1 56 110 31.4 113–148 6.0 16.0 10.1 0.3 29.4 51 110 34.3
148–165+ 7.2 17.6 9.4 0.3 30.8 53 112 30.5

217
RED SOILS
(Sub-humid moist)
(MAR: > 1100 mm)
Benchmark Spots: 11, 12
No. of Pedons: 4 (P23, P24, P25, P26)
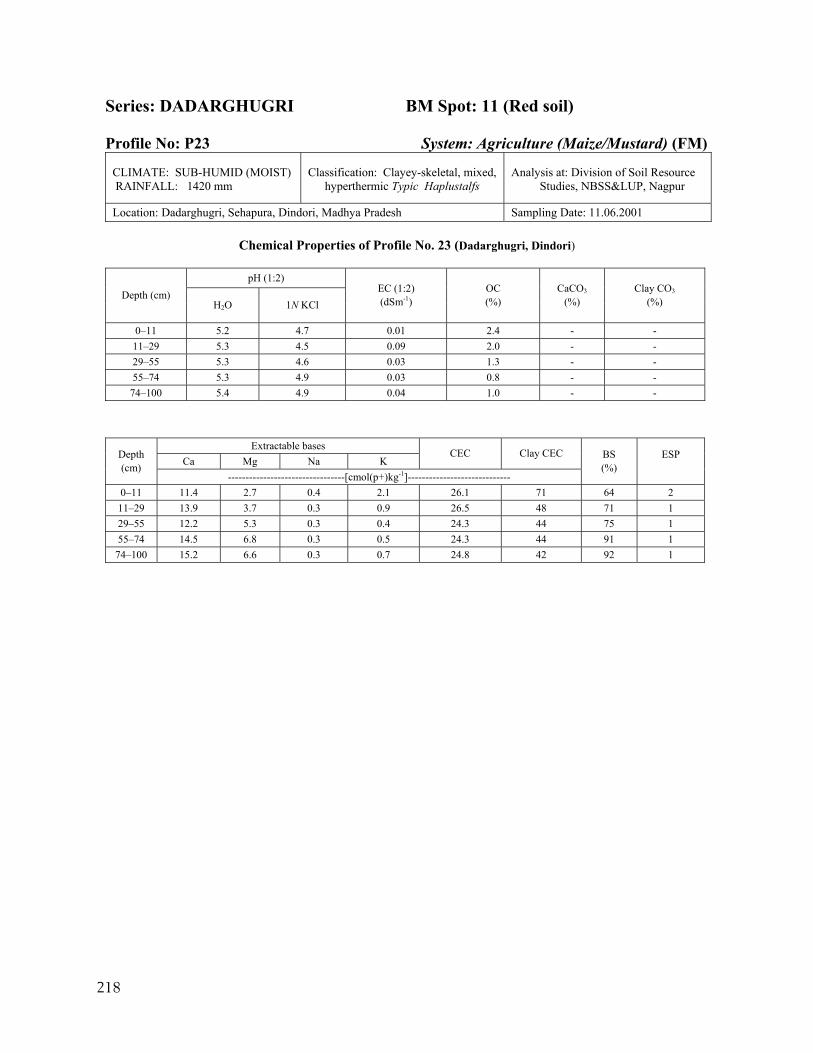
218
Series: DADARGHUGRI BM Spot: 11 (Red soil) Profile No: P23 System: Agriculture (Maize/Mustard) (FM)
CLIMATE: SUB-HUMID (MOIST) RAINFALL: 1420 mm
Classification: Clayey-skeletal, mixed, hyperthermic Typic Haplustalfs
Analysis at: Division of Soil Resource Studies, NBSS&LUP, Nagpur
Location: Dadarghugri, Sehapura, Dindori, Madhya Pradesh Sampling Date: 11.06.2001
Chemical Properties of Profile No. 23 (Dadarghugri, Dindori)
pH (1:2) Depth (cm)
H2O 1N KCl EC (1:2) (dSm-1)
OC (%)
CaCO3 (%)
Clay CO3
(%)
0–11 5.2 4.7 0.01 2.4 - - 11–29 5.3 4.5 0.09 2.0 - - 29–55 5.3 4.6 0.03 1.3 - - 55–74 5.3 4.9 0.03 0.8 - -
74–100 5.4 4.9 0.04 1.0 - -
Extractable bases Ca Mg Na K
CEC Clay CEC Depth (cm)
---------------------------------[cmol(p+)kg-1]-----------------------------
BS (%)
ESP
0–11 11.4 2.7 0.4 2.1 26.1 71 64 2 11–29 13.9 3.7 0.3 0.9 26.5 48 71 1 29–55 12.2 5.3 0.3 0.4 24.3 44 75 1 55–74 14.5 6.8 0.3 0.5 24.3 44 91 1
74–100 15.2 6.6 0.3 0.7 24.8 42 92 1
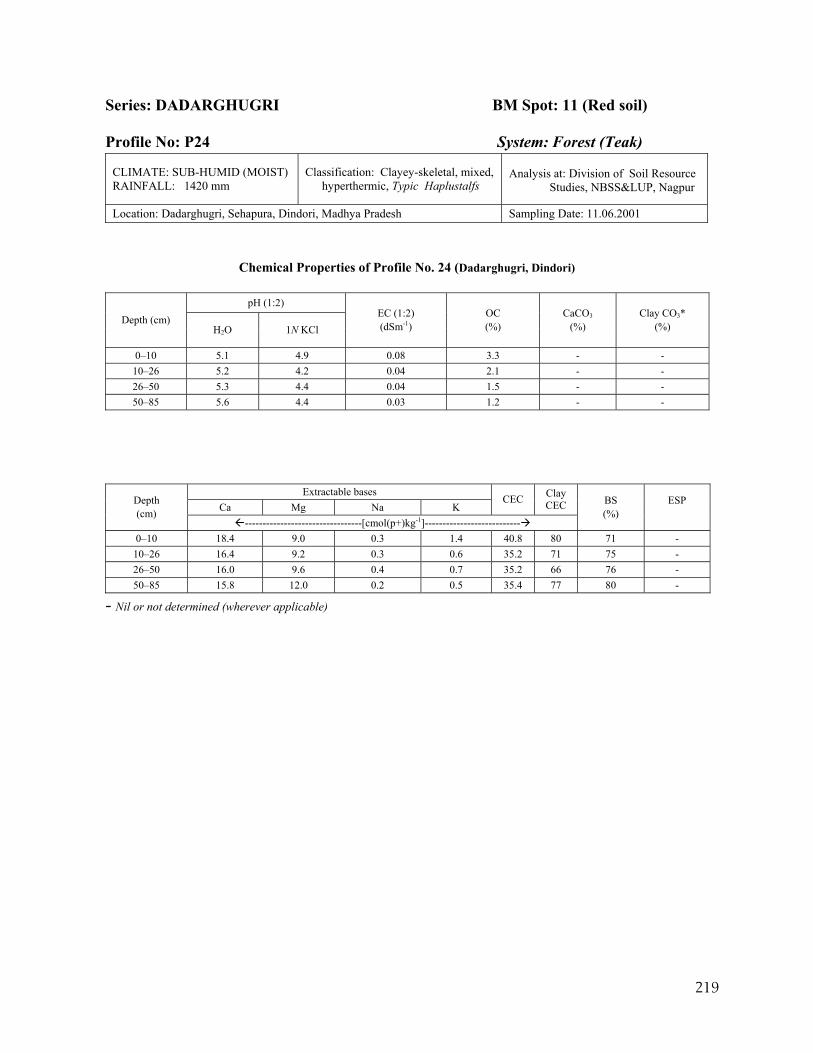
219
Series: DADARGHUGRI BM Spot: 11 (Red soil) Profile No: P24 System: Forest (Teak)
CLIMATE: SUB-HUMID (MOIST) RAINFALL: 1420 mm
Classification: Clayey-skeletal, mixed, hyperthermic, Typic Haplustalfs
Analysis at: Division of Soil Resource Studies, NBSS&LUP, Nagpur
Location: Dadarghugri, Sehapura, Dindori, Madhya Pradesh Sampling Date: 11.06.2001
Chemical Properties of Profile No. 24 (Dadarghugri, Dindori)
pH (1:2) Depth (cm)
H2O 1N KCl EC (1:2) (dSm-1)
OC (%)
CaCO3 (%)
Clay CO3*
(%)
0–10 5.1 4.9 0.08 3.3 - - 10–26 5.2 4.2 0.04 2.1 - - 26–50 5.3 4.4 0.04 1.5 - - 50–85 5.6 4.4 0.03 1.2 - -
Extractable bases Ca Mg Na K
CEC Clay CEC Depth
(cm) ---------------------------------[cmol(p+)kg-1]---------------------------
BS (%)
ESP
0–10 18.4 9.0 0.3 1.4 40.8 80 71 - 10–26 16.4 9.2 0.3 0.6 35.2 71 75 - 26–50 16.0 9.6 0.4 0.7 35.2 66 76 - 50–85 15.8 12.0 0.2 0.5 35.4 77 80 -
- Nil or not determined (wherever applicable)
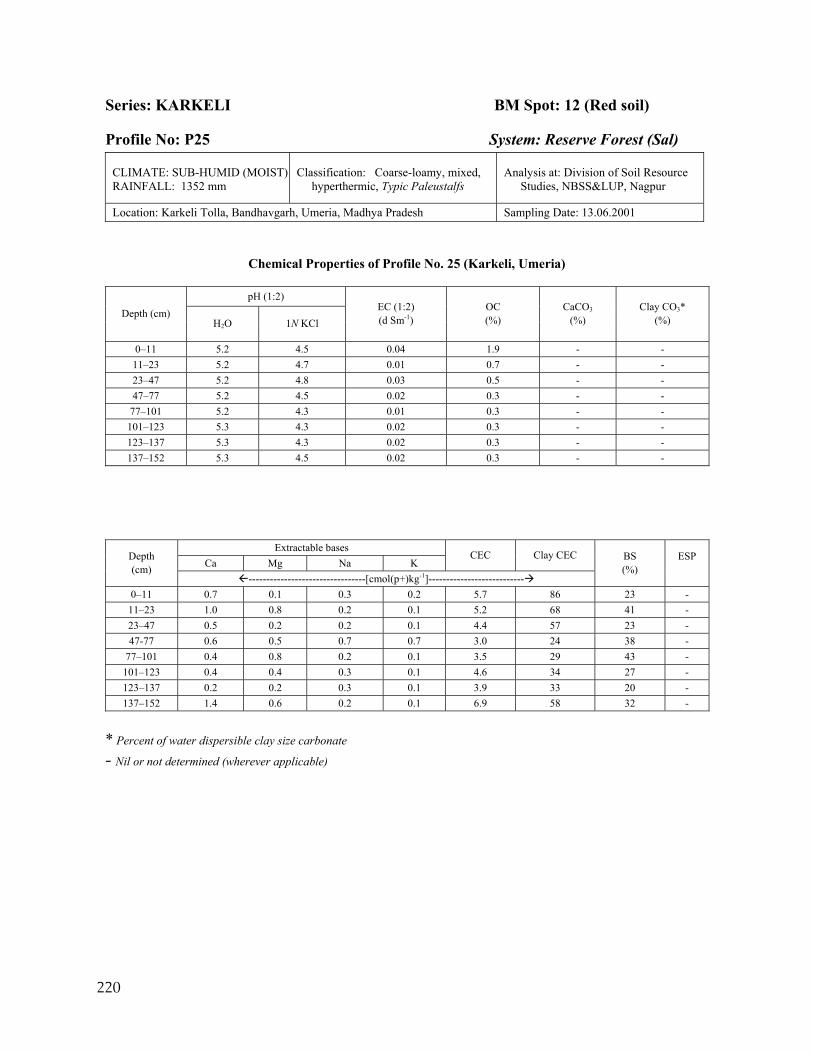
220
Series: KARKELI BM Spot: 12 (Red soil)
Profile No: P25 System: Reserve Forest (Sal)
CLIMATE: SUB-HUMID (MOIST) RAINFALL: 1352 mm
Classification: Coarse-loamy, mixed, hyperthermic, Typic Paleustalfs
Analysis at: Division of Soil Resource Studies, NBSS&LUP, Nagpur
Location: Karkeli Tolla, Bandhavgarh, Umeria, Madhya Pradesh Sampling Date: 13.06.2001
Chemical Properties of Profile No. 25 (Karkeli, Umeria)
pH (1:2) Depth (cm)
H2O 1N KCl EC (1:2) (d Sm-1)
OC (%)
CaCO3 (%)
Clay CO3*
(%)
0–11 5.2 4.5 0.04 1.9 - - 11–23 5.2 4.7 0.01 0.7 - - 23–47 5.2 4.8 0.03 0.5 - - 47–77 5.2 4.5 0.02 0.3 - -
77–101 5.2 4.3 0.01 0.3 - - 101–123 5.3 4.3 0.02 0.3 - - 123–137 5.3 4.3 0.02 0.3 - - 137–152 5.3 4.5 0.02 0.3 - -
Extractable bases Ca Mg Na K
CEC Clay CEC Depth (cm)
---------------------------------[cmol(p+)kg-1]---------------------------
BS (%)
ESP
0–11 0.7 0.1 0.3 0.2 5.7 86 23 - 11–23 1.0 0.8 0.2 0.1 5.2 68 41 - 23–47 0.5 0.2 0.2 0.1 4.4 57 23 - 47-77 0.6 0.5 0.7 0.7 3.0 24 38 -
77–101 0.4 0.8 0.2 0.1 3.5 29 43 - 101–123 0.4 0.4 0.3 0.1 4.6 34 27 - 123–137 0.2 0.2 0.3 0.1 3.9 33 20 - 137–152 1.4 0.6 0.2 0.1 6.9 58 32 -
* Percent of water dispersible clay size carbonate - Nil or not determined (wherever applicable)
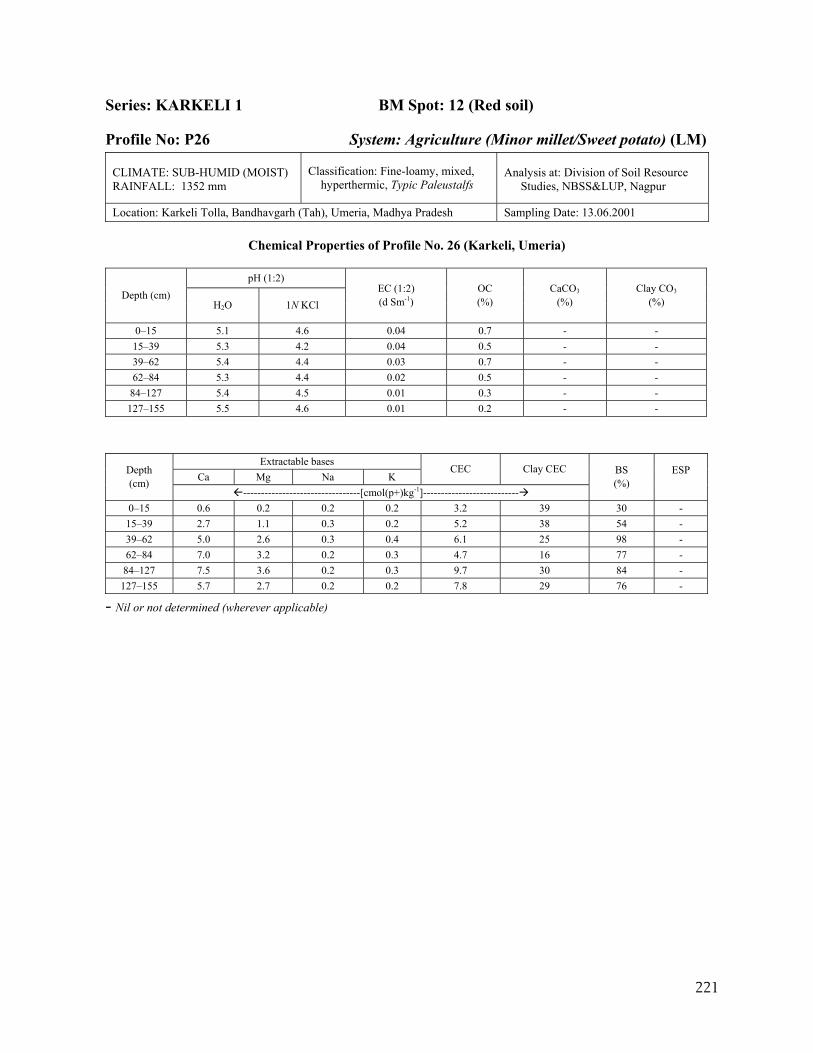
221
Series: KARKELI 1 BM Spot: 12 (Red soil)
Profile No: P26 System: Agriculture (Minor millet/Sweet potato) (LM)
CLIMATE: SUB-HUMID (MOIST) RAINFALL: 1352 mm
Classification: Fine-loamy, mixed, hyperthermic, Typic Paleustalfs
Analysis at: Division of Soil Resource Studies, NBSS&LUP, Nagpur
Location: Karkeli Tolla, Bandhavgarh (Tah), Umeria, Madhya Pradesh Sampling Date: 13.06.2001
Chemical Properties of Profile No. 26 (Karkeli, Umeria)
pH (1:2) Depth (cm)
H2O 1N KCl EC (1:2) (d Sm-1)
OC (%)
CaCO3 (%)
Clay CO3
(%)
0–15 5.1 4.6 0.04 0.7 - - 15–39 5.3 4.2 0.04 0.5 - - 39–62 5.4 4.4 0.03 0.7 - - 62–84 5.3 4.4 0.02 0.5 - -
84–127 5.4 4.5 0.01 0.3 - - 127–155 5.5 4.6 0.01 0.2 - -
Extractable bases Ca Mg Na K
CEC Clay CEC Depth (cm)
---------------------------------[cmol(p+)kg-1]---------------------------
BS (%)
ESP
0–15 0.6 0.2 0.2 0.2 3.2 39 30 - 15–39 2.7 1.1 0.3 0.2 5.2 38 54 - 39–62 5.0 2.6 0.3 0.4 6.1 25 98 - 62–84 7.0 3.2 0.2 0.3 4.7 16 77 -
84–127 7.5 3.6 0.2 0.3 9.7 30 84 - 127–155 5.7 2.7 0.2 0.2 7.8 29 76 -
- Nil or not determined (wherever applicable)

223
RED SOILS
(Semi-arid moist)
(MAR: > 1000-850 mm)
Benchmark Spots: 8
No. of Pedons: 3 (P16, P17, P18)
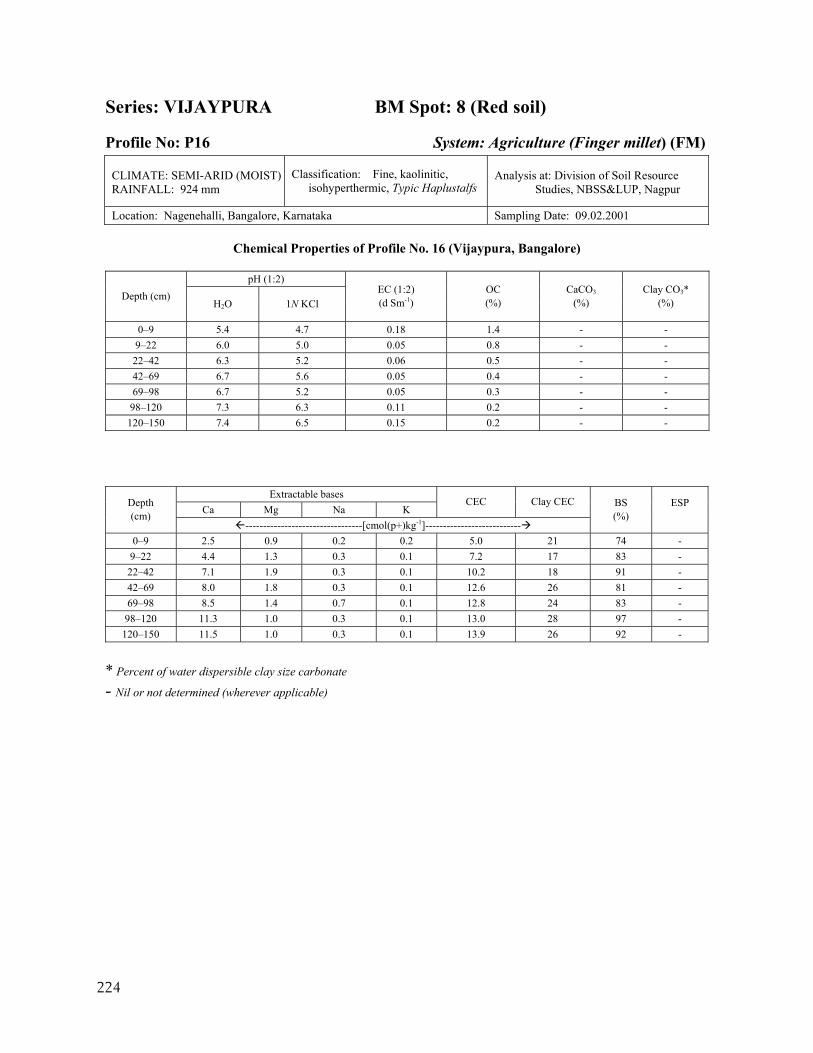
224
Series: VIJAYPURA BM Spot: 8 (Red soil)
Profile No: P16 System: Agriculture (Finger millet) (FM)
CLIMATE: SEMI-ARID (MOIST) RAINFALL: 924 mm
Classification: Fine, kaolinitic, isohyperthermic, Typic Haplustalfs
Analysis at: Division of Soil Resource Studies, NBSS&LUP, Nagpur
Location: Nagenehalli, Bangalore, Karnataka Sampling Date: 09.02.2001
Chemical Properties of Profile No. 16 (Vijaypura, Bangalore)
pH (1:2) Depth (cm)
H2O 1N KCl EC (1:2) (d Sm-1)
OC (%)
CaCO3 (%)
Clay CO3*
(%)
0–9 5.4 4.7 0.18 1.4 - - 9–22 6.0 5.0 0.05 0.8 - - 22–42 6.3 5.2 0.06 0.5 - - 42–69 6.7 5.6 0.05 0.4 - - 69–98 6.7 5.2 0.05 0.3 - -
98–120 7.3 6.3 0.11 0.2 - - 120–150 7.4 6.5 0.15 0.2 - -
Extractable bases Ca Mg Na K
CEC Clay CEC Depth (cm)
---------------------------------[cmol(p+)kg-1]---------------------------
BS (%)
ESP
0–9 2.5 0.9 0.2 0.2 5.0 21 74 - 9–22 4.4 1.3 0.3 0.1 7.2 17 83 - 22–42 7.1 1.9 0.3 0.1 10.2 18 91 - 42–69 8.0 1.8 0.3 0.1 12.6 26 81 - 69–98 8.5 1.4 0.7 0.1 12.8 24 83 - 98–120 11.3 1.0 0.3 0.1 13.0 28 97 -
120–150 11.5 1.0 0.3 0.1 13.9 26 92 -
* Percent of water dispersible clay size carbonate - Nil or not determined (wherever applicable)
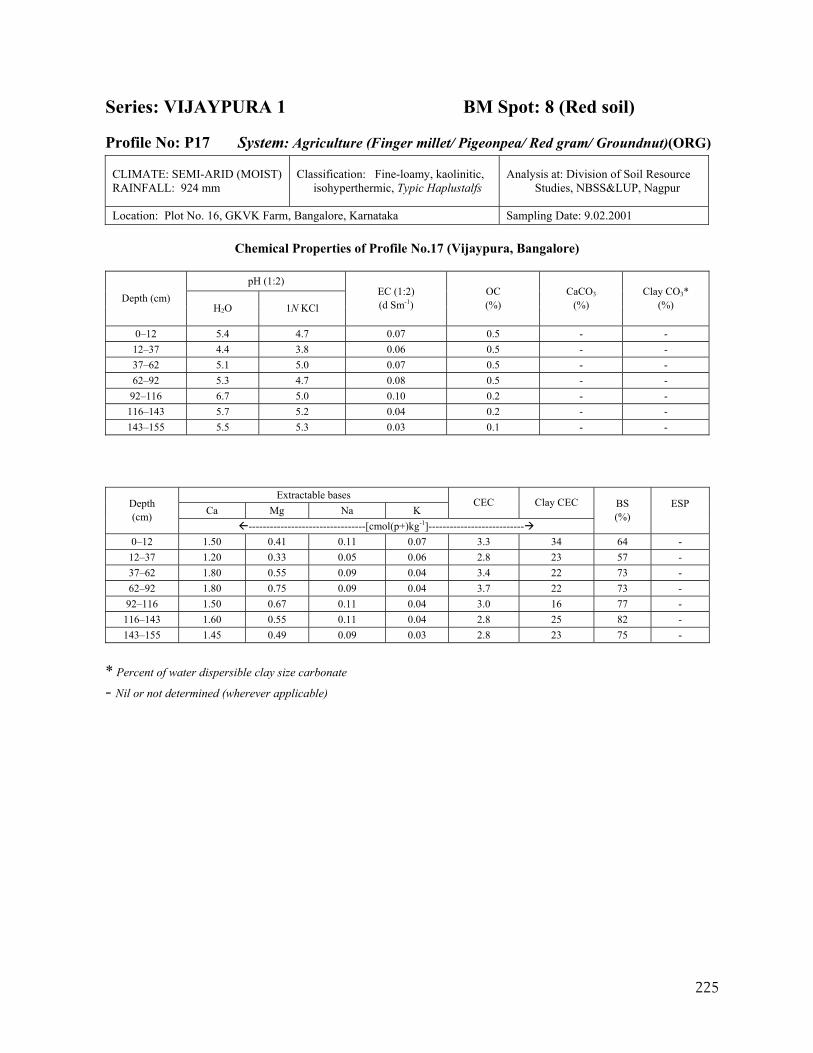
225
Series: VIJAYPURA 1 BM Spot: 8 (Red soil)
Profile No: P17 System: Agriculture (Finger millet/ Pigeonpea/ Red gram/ Groundnut)(ORG)
CLIMATE: SEMI-ARID (MOIST) RAINFALL: 924 mm
Classification: Fine-loamy, kaolinitic, isohyperthermic, Typic Haplustalfs
Analysis at: Division of Soil Resource Studies, NBSS&LUP, Nagpur
Location: Plot No. 16, GKVK Farm, Bangalore, Karnataka Sampling Date: 9.02.2001
Chemical Properties of Profile No.17 (Vijaypura, Bangalore)
pH (1:2) Depth (cm)
H2O 1N KCl EC (1:2) (d Sm-1)
OC (%)
CaCO3 (%)
Clay CO3*
(%)
0–12 5.4 4.7 0.07 0.5 - - 12–37 4.4 3.8 0.06 0.5 - - 37–62 5.1 5.0 0.07 0.5 - - 62–92 5.3 4.7 0.08 0.5 - -
92–116 6.7 5.0 0.10 0.2 - - 116–143 5.7 5.2 0.04 0.2 - - 143–155 5.5 5.3 0.03 0.1 - -
Extractable bases Ca Mg Na K
CEC Clay CEC Depth (cm)
---------------------------------[cmol(p+)kg-1]---------------------------
BS (%)
ESP
0–12 1.50 0.41 0.11 0.07 3.3 34 64 - 12–37 1.20 0.33 0.05 0.06 2.8 23 57 - 37–62 1.80 0.55 0.09 0.04 3.4 22 73 - 62–92 1.80 0.75 0.09 0.04 3.7 22 73 -
92–116 1.50 0.67 0.11 0.04 3.0 16 77 - 116–143 1.60 0.55 0.11 0.04 2.8 25 82 - 143–155 1.45 0.49 0.09 0.03 2.8 23 75 -
* Percent of water dispersible clay size carbonate - Nil or not determined (wherever applicable)
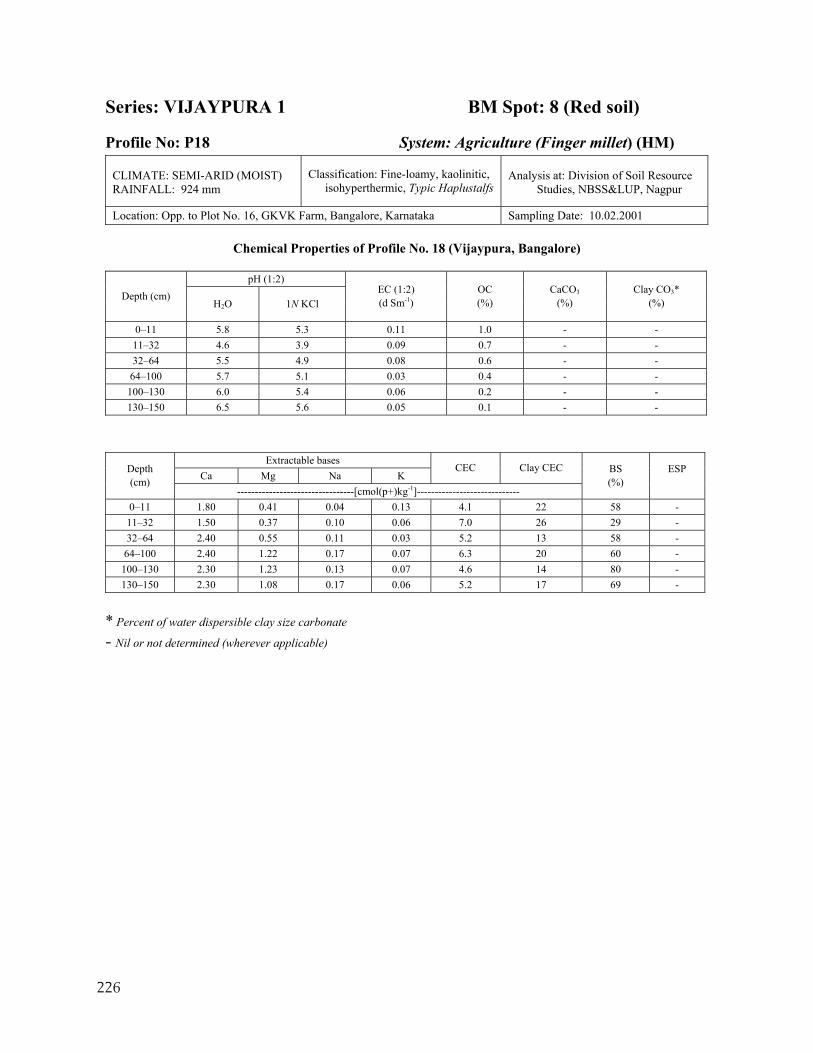
226
Series: VIJAYPURA 1 BM Spot: 8 (Red soil)
Profile No: P18 System: Agriculture (Finger millet) (HM)
CLIMATE: SEMI-ARID (MOIST) RAINFALL: 924 mm
Classification: Fine-loamy, kaolinitic, isohyperthermic, Typic Haplustalfs
Analysis at: Division of Soil Resource Studies, NBSS&LUP, Nagpur
Location: Opp. to Plot No. 16, GKVK Farm, Bangalore, Karnataka Sampling Date: 10.02.2001
Chemical Properties of Profile No. 18 (Vijaypura, Bangalore)
pH (1:2) Depth (cm)
H2O 1N KCl EC (1:2) (d Sm-1)
OC (%)
CaCO3 (%)
Clay CO3*
(%)
0–11 5.8 5.3 0.11 1.0 - - 11–32 4.6 3.9 0.09 0.7 - - 32–64 5.5 4.9 0.08 0.6 - -
64–100 5.7 5.1 0.03 0.4 - - 100–130 6.0 5.4 0.06 0.2 - - 130–150 6.5 5.6 0.05 0.1 - -
Extractable bases Ca Mg Na K
CEC Clay CEC Depth (cm)
---------------------------------[cmol(p+)kg-1]-----------------------------
BS (%)
ESP
0–11 1.80 0.41 0.04 0.13 4.1 22 58 - 11–32 1.50 0.37 0.10 0.06 7.0 26 29 - 32–64 2.40 0.55 0.11 0.03 5.2 13 58 - 64–100 2.40 1.22 0.17 0.07 6.3 20 60 -
100–130 2.30 1.23 0.13 0.07 4.6 14 80 - 130–150 2.30 1.08 0.17 0.06 5.2 17 69 -
* Percent of water dispersible clay size carbonate - Nil or not determined (wherever applicable)
227
RED SOILS
(Semi-arid dry)
(MAR: 850–550 mm)
Benchmark Spots: 10, 17, 19, 21
No. of Pedons: 5 (P22, P34, P37, P38, P41)
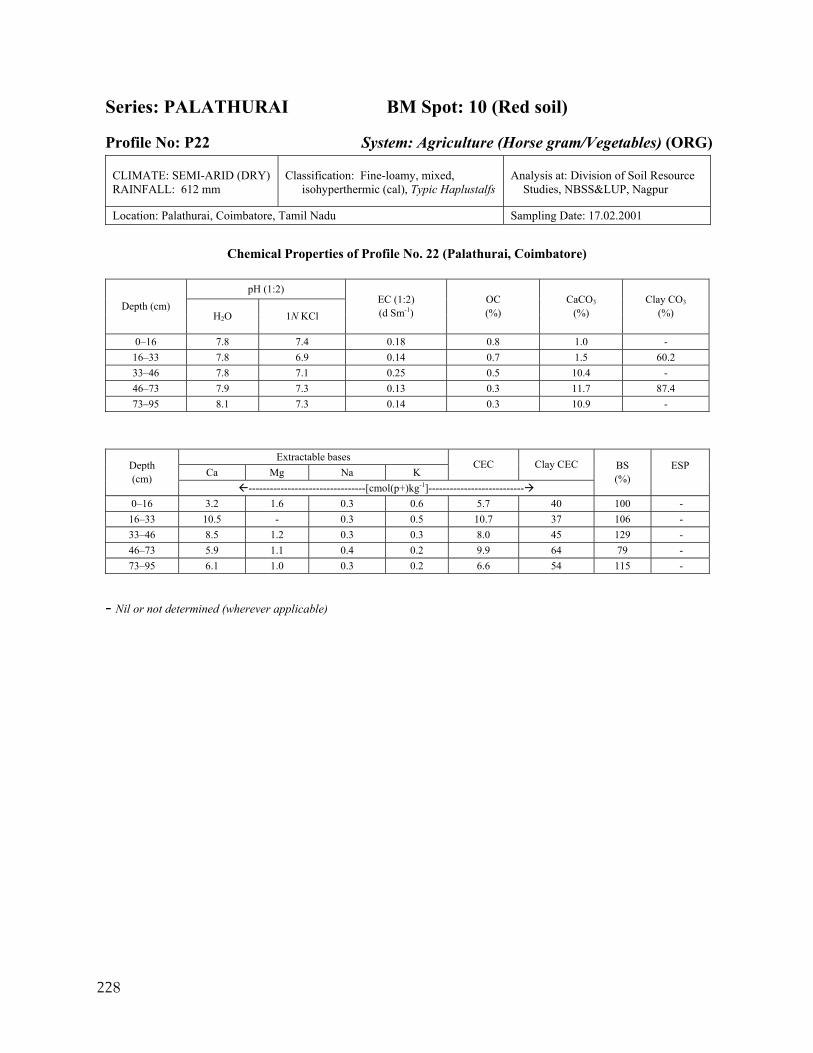
228
Series: PALATHURAI BM Spot: 10 (Red soil)
Profile No: P22 System: Agriculture (Horse gram/Vegetables) (ORG)
CLIMATE: SEMI-ARID (DRY) RAINFALL: 612 mm
Classification: Fine-loamy, mixed, isohyperthermic (cal), Typic Haplustalfs
Analysis at: Division of Soil Resource Studies, NBSS&LUP, Nagpur
Location: Palathurai, Coimbatore, Tamil Nadu Sampling Date: 17.02.2001
Chemical Properties of Profile No. 22 (Palathurai, Coimbatore)
pH (1:2)
Depth (cm) H2O 1N KCl
EC (1:2) (d Sm-1)
OC (%)
CaCO3 (%)
Clay CO3
(%)
0–16 7.8 7.4 0.18 0.8 1.0 - 16–33 7.8 6.9 0.14 0.7 1.5 60.2 33–46 7.8 7.1 0.25 0.5 10.4 - 46–73 7.9 7.3 0.13 0.3 11.7 87.4 73–95 8.1 7.3 0.14 0.3 10.9 -
Extractable bases Ca Mg Na K
CEC Clay CEC Depth (cm)
---------------------------------[cmol(p+)kg-1]---------------------------
BS (%)
ESP
0–16 3.2 1.6 0.3 0.6 5.7 40 100 - 16–33 10.5 - 0.3 0.5 10.7 37 106 - 33–46 8.5 1.2 0.3 0.3 8.0 45 129 - 46–73 5.9 1.1 0.4 0.2 9.9 64 79 - 73–95 6.1 1.0 0.3 0.2 6.6 54 115 -
- Nil or not determined (wherever applicable)
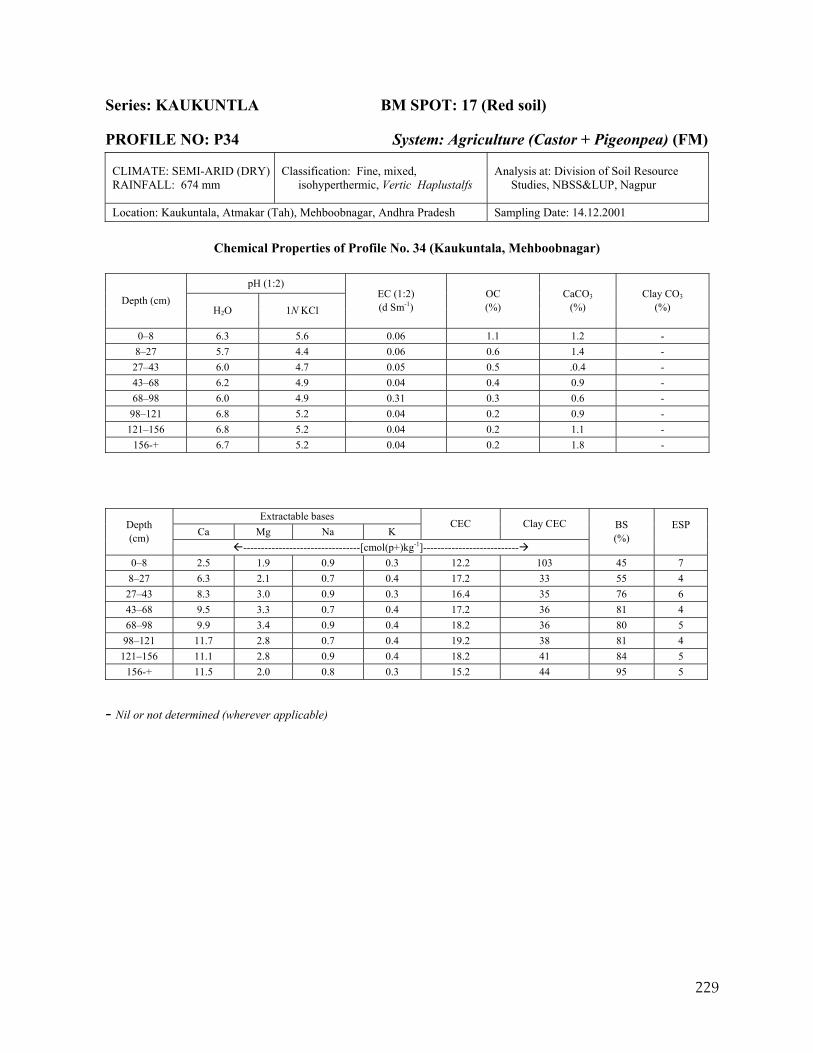
229
Series: KAUKUNTLA BM SPOT: 17 (Red soil)
PROFILE NO: P34 System: Agriculture (Castor + Pigeonpea) (FM) CLIMATE: SEMI-ARID (DRY) RAINFALL: 674 mm
Classification: Fine, mixed, isohyperthermic, Vertic Haplustalfs
Analysis at: Division of Soil Resource Studies, NBSS&LUP, Nagpur
Location: Kaukuntala, Atmakar (Tah), Mehboobnagar, Andhra Pradesh Sampling Date: 14.12.2001
Chemical Properties of Profile No. 34 (Kaukuntala, Mehboobnagar)
pH (1:2) Depth (cm)
H2O 1N KCl EC (1:2) (d Sm-1)
OC (%)
CaCO3 (%)
Clay CO3
(%)
0–8 6.3 5.6 0.06 1.1 1.2 - 8–27 5.7 4.4 0.06 0.6 1.4 - 27–43 6.0 4.7 0.05 0.5 .0.4 - 43–68 6.2 4.9 0.04 0.4 0.9 - 68–98 6.0 4.9 0.31 0.3 0.6 -
98–121 6.8 5.2 0.04 0.2 0.9 - 121–156 6.8 5.2 0.04 0.2 1.1 -
156-+ 6.7 5.2 0.04 0.2 1.8 -
Extractable bases Ca Mg Na K
CEC Clay CEC Depth (cm)
---------------------------------[cmol(p+)kg-1]---------------------------
BS (%)
ESP
0–8 2.5 1.9 0.9 0.3 12.2 103 45 7 8–27 6.3 2.1 0.7 0.4 17.2 33 55 4 27–43 8.3 3.0 0.9 0.3 16.4 35 76 6 43–68 9.5 3.3 0.7 0.4 17.2 36 81 4 68–98 9.9 3.4 0.9 0.4 18.2 36 80 5
98–121 11.7 2.8 0.7 0.4 19.2 38 81 4 121–156 11.1 2.8 0.9 0.4 18.2 41 84 5
156-+ 11.5 2.0 0.8 0.3 15.2 44 95 5
- Nil or not determined (wherever applicable)
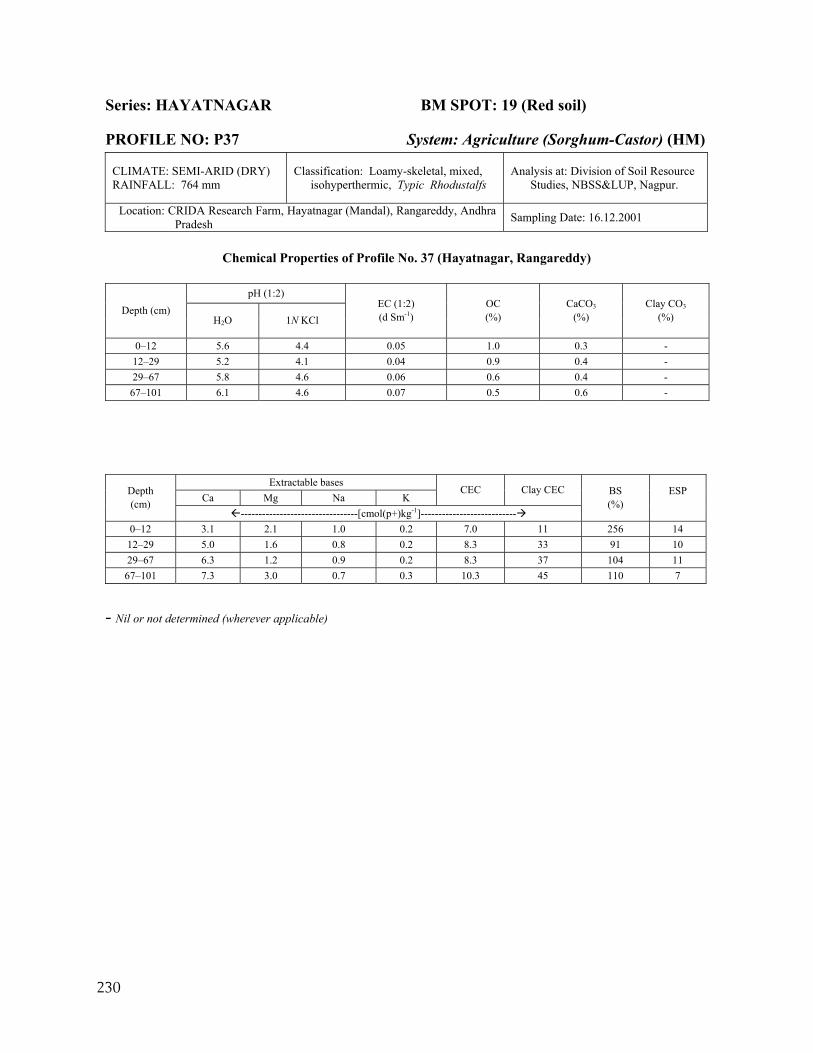
230
Series: HAYATNAGAR BM SPOT: 19 (Red soil)
PROFILE NO: P37 System: Agriculture (Sorghum-Castor) (HM)
CLIMATE: SEMI-ARID (DRY) RAINFALL: 764 mm
Classification: Loamy-skeletal, mixed, isohyperthermic, Typic Rhodustalfs
Analysis at: Division of Soil Resource Studies, NBSS&LUP, Nagpur.
Location: CRIDA Research Farm, Hayatnagar (Mandal), Rangareddy, Andhra Pradesh Sampling Date: 16.12.2001
Chemical Properties of Profile No. 37 (Hayatnagar, Rangareddy)
pH (1:2)
Depth (cm) H2O 1N KCl
EC (1:2) (d Sm-1)
OC (%)
CaCO3 (%)
Clay CO3
(%)
0–12 5.6 4.4 0.05 1.0 0.3 - 12–29 5.2 4.1 0.04 0.9 0.4 - 29–67 5.8 4.6 0.06 0.6 0.4 -
67–101 6.1 4.6 0.07 0.5 0.6 -
Extractable bases Ca Mg Na K
CEC Clay CEC Depth (cm)
---------------------------------[cmol(p+)kg-1]---------------------------
BS (%)
ESP
0–12 3.1 2.1 1.0 0.2 7.0 11 256 14 12–29 5.0 1.6 0.8 0.2 8.3 33 91 10 29–67 6.3 1.2 0.9 0.2 8.3 37 104 11 67–101 7.3 3.0 0.7 0.3 10.3 45 110 7
- Nil or not determined (wherever applicable)
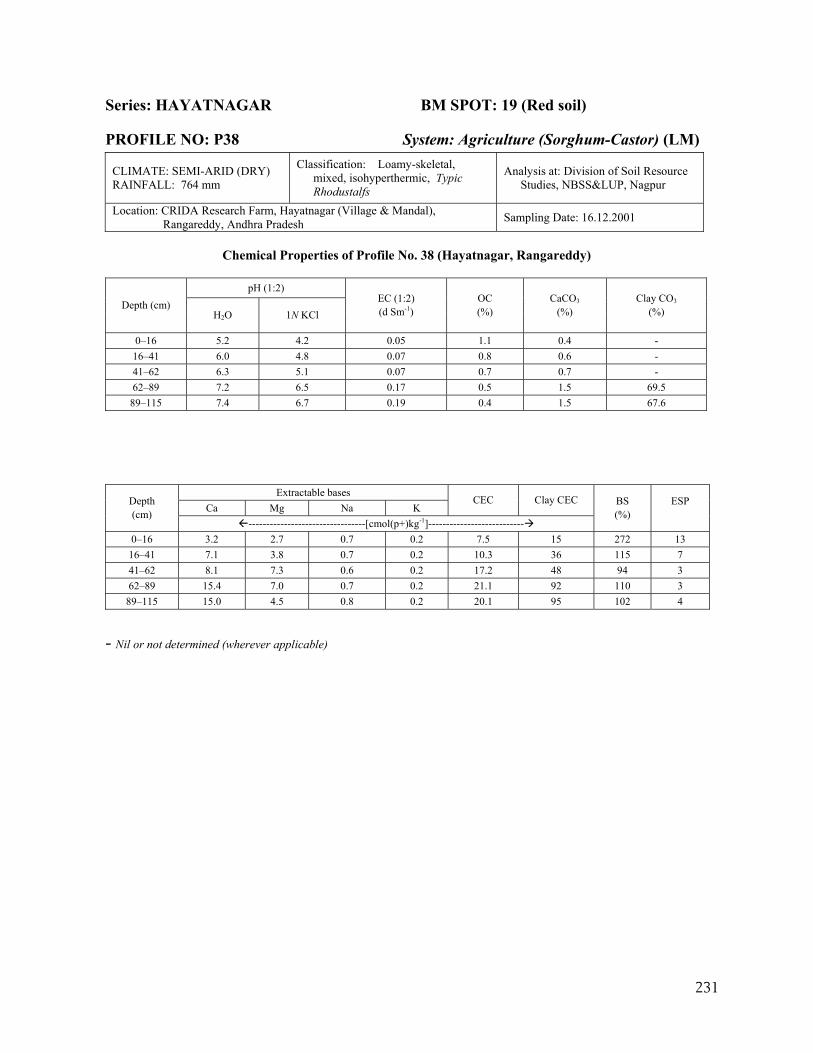
231
Series: HAYATNAGAR BM SPOT: 19 (Red soil)
PROFILE NO: P38 System: Agriculture (Sorghum-Castor) (LM)
CLIMATE: SEMI-ARID (DRY) RAINFALL: 764 mm
Classification: Loamy-skeletal, mixed, isohyperthermic, Typic Rhodustalfs
Analysis at: Division of Soil Resource Studies, NBSS&LUP, Nagpur
Location: CRIDA Research Farm, Hayatnagar (Village & Mandal), Rangareddy, Andhra Pradesh Sampling Date: 16.12.2001
Chemical Properties of Profile No. 38 (Hayatnagar, Rangareddy)
pH (1:2)
Depth (cm) H2O 1N KCl
EC (1:2) (d Sm-1)
OC (%)
CaCO3 (%)
Clay CO3
(%)
0–16 5.2 4.2 0.05 1.1 0.4 - 16–41 6.0 4.8 0.07 0.8 0.6 - 41–62 6.3 5.1 0.07 0.7 0.7 - 62–89 7.2 6.5 0.17 0.5 1.5 69.5
89–115 7.4 6.7 0.19 0.4 1.5 67.6
Extractable bases Ca Mg Na K
CEC Clay CEC Depth (cm)
---------------------------------[cmol(p+)kg-1]---------------------------
BS (%)
ESP
0–16 3.2 2.7 0.7 0.2 7.5 15 272 13 16–41 7.1 3.8 0.7 0.2 10.3 36 115 7 41–62 8.1 7.3 0.6 0.2 17.2 48 94 3 62–89 15.4 7.0 0.7 0.2 21.1 92 110 3
89–115 15.0 4.5 0.8 0.2 20.1 95 102 4
- Nil or not determined (wherever applicable)
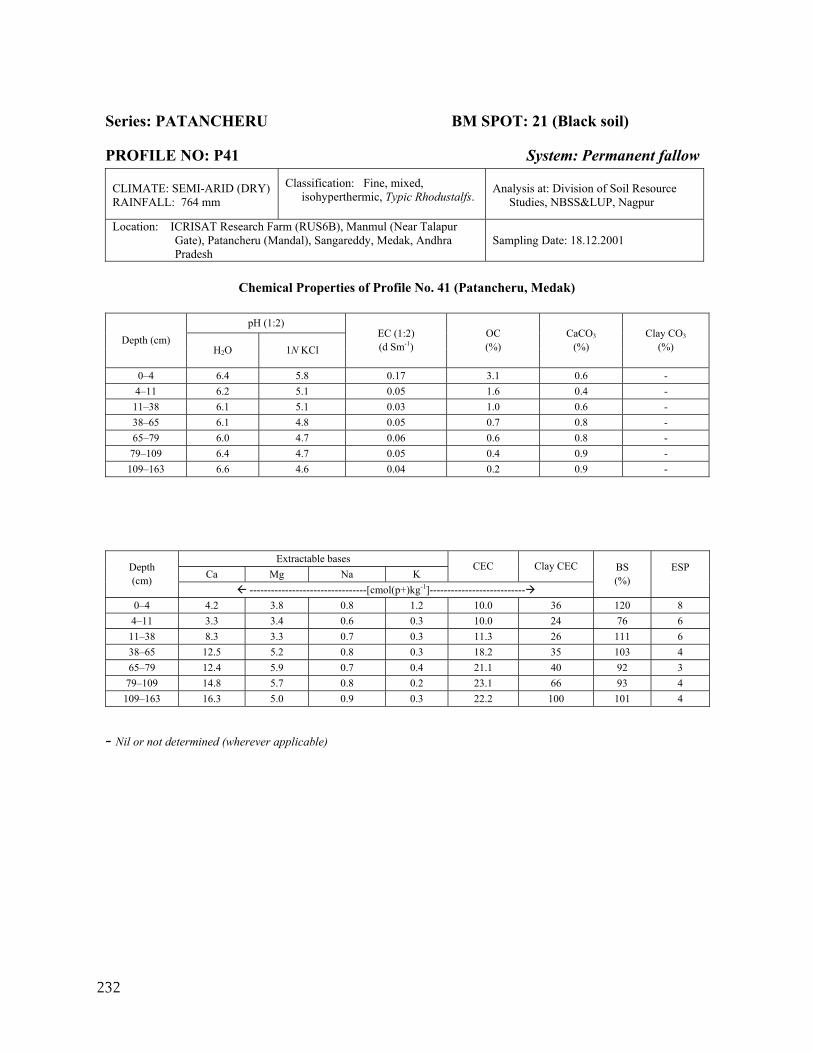
232
Series: PATANCHERU BM SPOT: 21 (Black soil)
PROFILE NO: P41 System: Permanent fallow
CLIMATE: SEMI-ARID (DRY) RAINFALL: 764 mm
Classification: Fine, mixed, isohyperthermic, Typic Rhodustalfs.
Analysis at: Division of Soil Resource Studies, NBSS&LUP, Nagpur
Location: ICRISAT Research Farm (RUS6B), Manmul (Near Talapur Gate), Patancheru (Mandal), Sangareddy, Medak, Andhra Pradesh
Sampling Date: 18.12.2001
Chemical Properties of Profile No. 41 (Patancheru, Medak)
pH (1:2)
Depth (cm) H2O 1N KCl
EC (1:2) (d Sm-1)
OC (%)
CaCO3 (%)
Clay CO3
(%)
0–4 6.4 5.8 0.17 3.1 0.6 - 4–11 6.2 5.1 0.05 1.6 0.4 - 11–38 6.1 5.1 0.03 1.0 0.6 - 38–65 6.1 4.8 0.05 0.7 0.8 - 65–79 6.0 4.7 0.06 0.6 0.8 -
79–109 6.4 4.7 0.05 0.4 0.9 - 109–163 6.6 4.6 0.04 0.2 0.9 -
Extractable bases Ca Mg Na K
CEC Clay CEC Depth (cm)
---------------------------------[cmol(p+)kg-1]---------------------------
BS (%)
ESP
0–4 4.2 3.8 0.8 1.2 10.0 36 120 8 4–11 3.3 3.4 0.6 0.3 10.0 24 76 6 11–38 8.3 3.3 0.7 0.3 11.3 26 111 6 38–65 12.5 5.2 0.8 0.3 18.2 35 103 4 65–79 12.4 5.9 0.7 0.4 21.1 40 92 3
79–109 14.8 5.7 0.8 0.2 23.1 66 93 4 109–163 16.3 5.0 0.9 0.3 22.2 100 101 4
- Nil or not determined (wherever applicable)
119–2007
® ®About ICRISAT
Contact Information
ICRISAT-Patancheru(Headquarters)Patancheru 502 324Andhra Pradesh, IndiaTel +91 40 30713071Fax +91 40 [email protected]
ICRISAT Liaison OfficeCG Centers BlockNASC ComplexDev Prakash Shastri MargNew Delhi 110 012, IndiaTel +91 11 32472306 to 08 Fax +91 11 25841294
ICRISAT-Nairobi(Regional hub ESA)PO Box 39063, Nairobi, KenyaTel +254 20 7224550Fax +254 20 [email protected]
ICRISAT-Niamey(Regional hub WCA)BP 12404Niamey, Niger (Via Paris)Tel +227 722529, 722725Fax +227 [email protected]
ICRISAT-BamakoBP 320Bamako, MaliTel +223 2223375Fax +223 [email protected]
ICRISAT-BulawayoMatopos Research StationPO Box 776,Bulawayo, ZimbabweTel +263 83 8311 to 15Fax +263 83 8253/[email protected]
ICRISAT-LilongweChitedze Agricultural Research StationPO Box 1096Lilongwe, MalawiTel +265 1 707297/071/067/057Fax +265 1 [email protected]
ICRISAT-Maputoc/o IIAM, Av. das FPLM No 2698Caixa Postal 1906Maputo, MozambiqueTel +258 21 461657Fax +258 21 [email protected]
Visit us at www.icrisat.org
®
The International Crops Research Institute for the Semi-Arid Tropics (ICRISAT) is a nonprofit, non-political organization that does innovative agricultural research and capacity building for sustainable development with a wide array of partners across the globe. ICRISAT’s mission is to help empower 600 million poor people to overcome hunger, poverty and a degraded environment in the dry tropics through better agriculture. ICRISAT belongs to the Alliance of Centers of the Consultative Group on International Agricultural Research (CGIAR).
Physical and Chemical Properties of Red and Black Soils of Selected Benchmark
Spots for Carbon Sequestration Studies in Semi-Arid Tropics of India
Global Theme on AgroecosystemsReport no. 35