report # matc-unl: 225 final...
TRANSCRIPT

®
The contents of this report reflect the views of the authors, who are responsible for the facts and the accuracy of the information presented herein. This document is disseminated under the sponsorship of the Department of Transportation
University Transportation Centers Program, in the interest of information exchange. The U.S. Government assumes no liability for the contents or use thereof.
Truck Safety at Highway-Rail Grade Crossings
Report # MATC-UNL: 225 Final Report
Aemal Khattak, Ph.D.Associate ProfessorDepartment of Civil EngineeringUniversity of Nebraska-Lincoln
Miao GaoGraduate Research Assistant
2012
A Cooperative Research Project sponsored by the U.S. Department of Transportation Research and Innovative Technology Administration
25-1121-0001-225
Truck Safety at Highway-Rail Grade Crossings
Aemal Khattak, Ph.D.
Associate Professor
Department of Civil Engineering
University of Nebraska-Lincoln
Miao Gao
Graduate Research Assistant
Department of Civil Engineering
University of Nebraska-Lincoln
A Report on Research Sponsored by
Mid-America Transportation Center
University of Nebraska-Lincoln
June 2012
ii
Technical Report Documentation Page
1. Report No.
25-1121-0001-225
2. Government Accession No.
3. Recipient's Catalog No.
4. Title and Subtitle
Truck Safety at Highway-Rail Grade Crossings
5. Report Date
June 2012
6. Performing Organization Code
7. Author(s)
Aemal Khattak and Miao Gao
8. Performing Organization Report No.
25-1121-0001-225
9. Performing Organization Name and Address
Mid-America Transportation Center
2200 Vine St.
PO Box 830851
Lincoln, NE 68583-0851
10. Work Unit No. (TRAIS)
11. Contract or Grant No.
12. Sponsoring Agency Name and Address
Research and Innovative Technology Administration
1200 New Jersey Ave., SE
Washington, D.C. 20590
13. Type of Report and Period Covered
Final Report
14. Sponsoring Agency Code
MATC TRB RiP No. 18469
15. Supplementary Notes
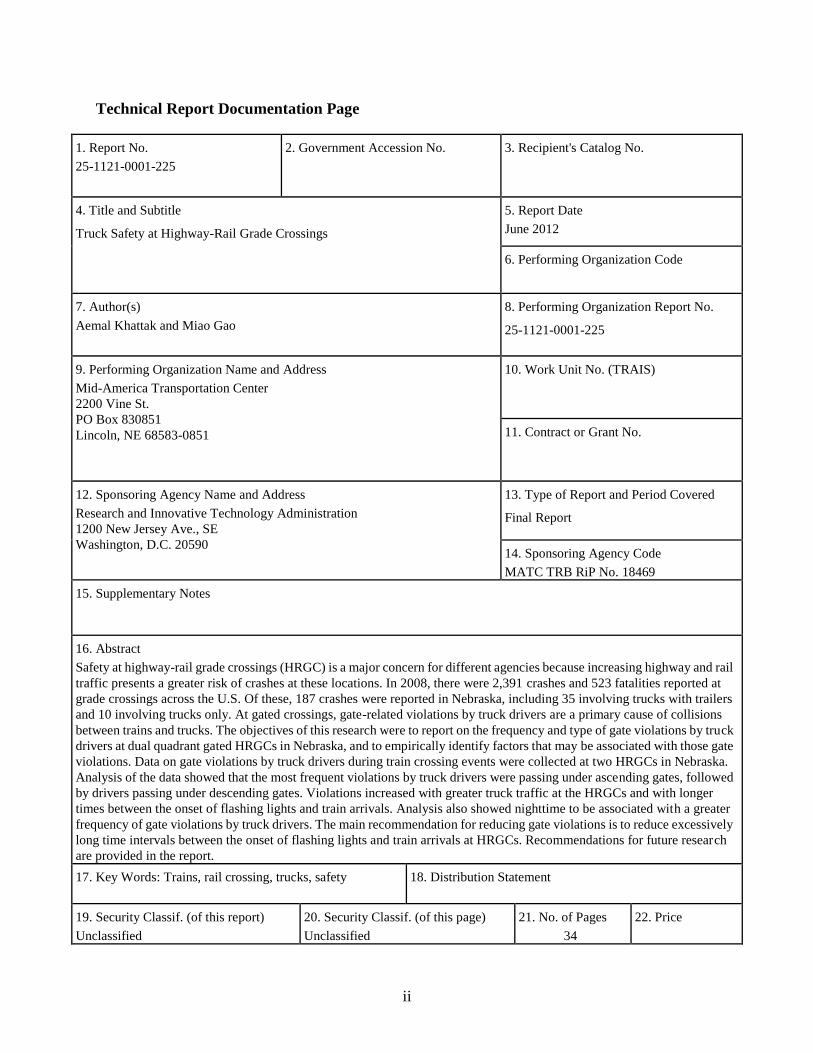
16. Abstract
Safety at highway-rail grade crossings (HRGC) is a major concern for different agencies because increasing highway and rail
traffic presents a greater risk of crashes at these locations. In 2008, there were 2,391 crashes and 523 fatalities reported at
grade crossings across the U.S. Of these, 187 crashes were reported in Nebraska, including 35 involving trucks with trailers
and 10 involving trucks only. At gated crossings, gate-related violations by truck drivers are a primary cause of collisions
between trains and trucks. The objectives of this research were to report on the frequency and type of gate violations by truck
drivers at dual quadrant gated HRGCs in Nebraska, and to empirically identify factors that may be associated with those gate
violations. Data on gate violations by truck drivers during train crossing events were collected at two HRGCs in Nebraska.
Analysis of the data showed that the most frequent violations by truck drivers were passing under ascending gates, followed
by drivers passing under descending gates. Violations increased with greater truck traffic at the HRGCs and with longer
times between the onset of flashing lights and train arrivals. Analysis also showed nighttime to be associated with a greater
frequency of gate violations by truck drivers. The main recommendation for reducing gate violations is to reduce excessively
long time intervals between the onset of flashing lights and train arrivals at HRGCs. Recommendations for future research
are provided in the report.
17. Key Words: Trains, rail crossing, trucks, safety
18. Distribution Statement
19. Security Classif. (of this report)
Unclassified
20. Security Classif. (of this page)
Unclassified
21. No. of Pages
34
22. Price

iii
Table of Contents
Disclaimer vii
Executive Summary viii
Chapter 1 Introduction 1
1.1 Problem Statement 2
1.2 Research Objectives and Hypotheses 2
1.3 Research Approach 3
1.4 Research Assumptions 5
1.5 Report Organization 5
Chapter 2 Literature Review 6
2.1 Traffic Safety at HRGCs 6
2.2 Unsafe Driver Actions at HRGCs 7
2.3 Categorization of Unsafe Maneuvers 8
2.4 Statistical Models for Count Data 9
2.5 Summary of Literature Review 10
Chapter 3 Data Collection 12
3.1 Study Sites and Field Data Collection 12
Chapter 4 Data Analysis 19
4.1 Preliminary Data Analysis 19
4.2 Detailed Data Analysis 24
References 32

iv
List of Figures
Figure 3.1 HRGC at N 141st Street in Waverly, NE 13
Figure 3.2 HRGC at M Street crossing in Fremont, NE 14
Figure 3.3 Interface of DVR software 17
Figure 3.4 Onset of HRGC gate activation 18
Figure 4.1 Observations with different number of gate violations 20
Figure 4.2 Frequency of different types of gate violations 20
Figure 4.3 Collection of observations on different days of the week 21
Figure 4.4 Time of day distribution of observations 22

v
List of Tables
Table 1.1 Research hypotheses 3
Table 1.2 Variables possibly associated with truck drivers’ propensity for gate
violations in proximity of HRGCs 4
Table 3.1 Variables and coding scheme 15
Table 3.2 Example of data extraction for a single observation 18
Table 4.1 Descriptive statistics for the collected data 22
Table 4.2 Estimated model for gate violations by trucks at HRGCs 27

vi
List of Abbreviations
After Train (AT)
Digital Video Recorder (DVR)
Fatality Analysis Reporting System (FARS)
Federal Railroad Administration (FRA)
Flashing Light (FL)
Highway-Rail Grade Crossing (HRGC)
Mid-America Transportation Center (MATC)
Single Unit (SU)
Typically Enforced Violations (TEV)
United States Department of Transportation (US DOT)
Zero-Inflated Poisson (ZIP)

vii
Disclaimer
The contents of this report reflect the views of the authors, who are responsible for the
facts and the accuracy of the information presented herein. This document is disseminated under
the sponsorship of the Department of Transportation University Transportation Centers Program,
in the interest of information exchange. The U.S. Government assumes no liability for the
contents or use thereof.

viii
Executive Summary
Safety at highway-rail grade crossings (HRGC) is a major concern for different agencies
because increasing highway and rail traffic presents a greater risk of crashes at these locations. In
2008, there were 2,391 crashes and 523 fatalities reported at grade crossings across the U.S. Of
these, 187 crashes were reported in Nebraska, including 35 involving trucks with trailers and 10
involving trucks only. At gated crossings, gate-related violations by truck drivers are a primary
cause of collisions between trains and trucks. The objectives of this research were to report on the
frequency and type of gate violations by truck drivers at dual quadrant gated HRGCs in Nebraska,
and to empirically identify factors that may be associated with those gate violations. Data on gate
violations by truck drivers during train crossing events were collected at two HRGCs in Nebraska.
Analysis of the data showed that the most frequent violations by truck drivers were passing under
ascending gates, followed by drivers passing under descending gates. Violations increased with
greater truck traffic at the HRGCs and with longer times between the onset of flashing lights and
train arrivals. Analysis also showed nighttime to be associated with a greater frequency of gate
violations by truck drivers. The main recommendation for reducing gate violations is to reduce
excessively long time intervals between the onset of flashing lights and train arrivals at HRGCs.
Recommendations for future research are provided in the report.

1
Chapter 1 Introduction
According to year 2008 statistics from the Federal Railroad Administration (FRA), there
are 222,178 highway-rail grade crossings (HRGC) across the U.S. Grade-separated crossings
mitigate the conflict between highways and railroads, but they are expensive to construct and
sometimes face opposition from local communities due to negative impacts on businesses. Safety
at HRGCs is a concern of different transportation agencies, as the increasing highway and rail
traffic presents greater risks of crashes at these locations. In 2004, the Secretary of
Transportation’s Action Plan for Highway-Rail Grade Crossing Safety was issued by the US DOT.
The objectives of this plan were to elevate the importance of highway-rail crossing safety and of
adopting uniform measures to deal with the safety issue. During 2008, 2,391 crashes and 523
fatalities were reported at grade crossings across the U.S. by the Fatality Analysis Reporting
System (FARS). Of these, 187 crashes were reported in Nebraska, including thirty-five involving
trucks with trailers and ten involving single unit (SU) trucks. Therefore, about 24% of the total
reported crashes at rail crossings in Nebraska involved trucks.
According to Veli-Pekka et al. (2002), the passing time for a trailer tuck at rail crossings is
about four times greater than the passing time of an automobile at the same location. Davery et al.
(2008) reported that the danger posed by heavy vehicles at rail crossings was related to factors
associated with their physically larger size and heavier mass, as well as the behavior of motor
vehicle drivers. In addition, trucks and railroads frequently carry hazardous materials. Therefore,
the implications of a truck-involved crash at an HRGC are more ominous. Since significant

2
economic losses and societal impacts may result from truck-involved crashes at HRGCs, and
given that rail and truck traffic in the U.S. is expected to grow, it is prudent to investigate factors
that contribute to truck-involved crashes at HRGCs. The ultimate goal is to improve HRGC safety.
1.1 Problem Statement
Knowledge of the frequency and type of gate violations by truck drivers at HRGCs, and the
factors associated with these violations, is needed to better understand factors that contribute to
truck-involved crashes at HRGCs and subsequently implement appropriate safety
countermeasures. Unsafe maneuvers by truck drivers in the vicinity of HRGCs with approaching
trains are a primary underlying cause of collisions between trains and trucks. Although not all gate
violations by truck drivers result in crashes, the frequency of such maneuvers at crossings is an
indication of crossing safety. Council et al. (1980) showed that gate violations are an appropriate
surrogate measure of crashes. Several studies on unsafe driver behavior at HRGCs have been
reported in the literature (reviewed in chapter 2 of the current study), but no published studies on
the frequency and type of gate violations by truck drivers at HRGCs were uncovered in the current
research. Therefore, there is a need to investigate gate violations at HRGCs by truck drivers.
1.2 Research Objectives and Hypotheses
The objectives of this research were to report on the frequency and type of gate violations
by truck drivers at dual quadrant gated HRGCs located in Nebraska, and to empirically identify
factors that may be statistically significantly associated with those gate violations. Data were
collected at two HRGCs to assess different types of gate violations by truck drivers and counts of

3
those gate violations. An appropriate statistical model was used to investigate relationships
between gate violations and different independent variables. Specifically, the hypotheses listed in
table 1.1 were statistically tested for validation.
Table 1.1 Research hypotheses
Hypothesis
Number
Description
1 The frequency of gate violations by truck drivers at dual quadrant gated HRGCs
increases with greater truck traffic during train crossings at the HRGC.
2 The frequency of gate violations by truck drivers increases with longer times
between onset of flashing lights and actual train arrivals at crossings.
3 Greater number of gate violations by truck drivers occurs during nighttime
compared to other times.
4 The frequency of gate violations at dual quadrant gated HRGCs by truck drivers
decreases in rain.
5 The frequency of gate violations at dual quadrant gated HRGCs by truck drivers
increases with longer total duration of gate closure.
6 The frequency of gate violations by trucks is greater on weekends compared to
weekdays.
1.3 Research Approach
The two study sites utilized in this research were dual quadrant HRGCs in Nebraska. The
frequency of gate violations by truck drivers and other factors that may be associated with such
maneuvers were observed at these two locations. Other researchers have adopted a similar
methodology; for example, Abraham et al. (1998) identified several factors associated with
driving violations in evaluating HRGCs in Michigan. The data collection method for the current
study is described in the research program section of this report.

4
The main variable of interest in this research was the count of gate violations by truck
drivers at gated HRGCs during train crossing events. Table 2 provides a list of variables that were
deemed to be possibly associated with truck drivers’ propensity for gate violations. An attempt
was made in this research to collect data on as many factors listed in Table 2 as possible, subject to
time and budget constraints.
Table 1.2 Variables possibly associated with truck drivers’ propensity for gate violations in
proximity of HRGCs
Category Variable
Traffic control at
HRGC
Type of traffic signing at crossing, pavement markings, advance
train warning time, Time between start of flashing lights and train
arrival
Roadway
characteristics
Average daily traffic, motor vehicle queue at HRGC when train
has passed, pavement type, angle of intersection
Truck characteristics Number of trucks at crossings, type of truck, weight of truck, trailer
length, onboard load
Rail characteristics Number of trains at the crossing, train length, train speed, train
stoppage, train backup
Temporal
characteristics
Time of day (peak hour or off peak time),day of week (weekday or
weekend), duration of gate closure
Environmental
characteristics
Weather conditions, light conditions, time of day, land use around
the HRGC
A digital video recorder (DVR) continuously recorded video footage at the two HRGCs
from which train crossing events were extracted. Clips of train crossing videos were visually

5
reviewed and information on gate violations by truck drivers, along with other pertinent data, were
extracted and populated in a spreadsheet. Data analysis consisted of initially examining descriptive
statistics for the collected variables, followed by statistical hypothesis testing.
1.4 Research Assumptions
This research assumed that different types of gate violations by truck drivers at HRGCs
were indicative of truck-train HRGC safety. This assumption is supported by the fact that the vast
majority of crashes at HRGCs are the result of errors by motor vehicle drivers. Another
assumption in this research was that there were no changes in factors that were not collected in this
study that may impact truck drivers’ behavior. For example, the intensity of traffic law
enforcement at the study site was assumed to remain constant for the duration of the study.
1.5 Report Organization
The current chapter is followed by a description of the published literature in chapter 2.
Development of a truck-train safety interaction scheme and data collection at the study site are
described in chapter 3. Analyses performed on the collected data are presented in chapter 4.
Research conclusions are presented in chapter 5 while a reference list completes this report.

6
Chapter 2 Literature Review
This literature review covers traffic safety at HRGCs, unsafe driver actions at HRGCs, and
categorization of gate violations at HRGCs. It also covers statistical modeling when the variable of
interest is a count of events (e.g., number of gate violations at an HRGC by truck drivers). A
summary of the literature review appears at the end of this chapter.
2.1 Traffic Safety at HRGCs
Transport of freight via rail and trucks has increased, and will likely keep increasing in the
future. As a result, more and more trucks will negotiate HRGCs, thereby increasing the chances of
truck-train crashes. Multiple publications report on safety systems at rail crossings. Shinar and Raz
(1982) studied three different crossing protection systems and found that vehicle speeds reduced
significantly when the lights were switched on and the gates were coming down, but reduced only
slightly when the lights were switched off and the gates were raised. Gordon et al. (1984)
recommended that a perception-reaction time of 3.5 seconds, which is one second longer than the
standard 2.5 seconds. Hauer and Persaud (1987) showed that the safety of a rail-highway crossing
could be estimated by factors such as train and traffic flows, types of warning measures, geometry,
and the accident history of sites. Meeker and Barr (1989) observed that two-thirds of 57 drivers
crossed the crossing in front of oncoming trains and only four drivers slowed or stopped; they
concluded that drivers made their decision to cross based on their perception of the distance of
trains and the time needed to cross.

7
Publications were reviewed that involved driver characteristics that are prominent factors
in HRGC safety. For example, Klein et al. (1994) investigated factors involved in rail crossing
fatalities by analyzing FARS data from 1975 to 1992. They reported that frequency of fatal crashes
at rail crossings was positively related to: roads with posted speed limits of 55 mph; rural areas;
Midwestern states; mostly passenger cars; male drivers; Caucasian drivers between ages of 25 and
34; alcohol involvement; and drivers with relatively less education. Jutaek et al. (2006) examined
factors associated with rail crossing crashes. They reported that crash rates increased with greater
total traffic volume and average daily train volumes. Davey et al. (2008) reported that risky driving
behaviors were mainly caused by misjudgment, drivers trying to save time, higher levels of
crossing familiarity, poor sight distances, and inadequate warnings.
2.2 Unsafe Driver Actions at HRGCs
Most crashes at HRGCs are the result of a combination of factors including drivers’ failed
judgments, HRGC geometric characteristics, traffic control characteristics, and environmental
factors. However, gate violations by motor vehicle drivers at HRGCs are also major contributing
factors. A study by Sabey and Taylor (1980) showed that human factors contributed to about 95%
of all crashes, either singularly or in combination with other factors. Human factors, in
combination with roadway and environmental factors, contributed to 28% of all reported crashes.
Leibowitz (1985) showed that inaccurate judgments of train size and speed by motor
vehicle drivers frequently made drivers cross hazardously. Tenkink and Van der Horst (1990)
observed driver behavior at two Dutch rail crossings with automatic flashing warning lights. The

8
authors reported overall good compliance by drivers; however, some drivers were noted for
proceeding immediately after the passage of a train instead of waiting for the end of
flashing/warning signs.
A study by Meeker et al. (1997) showed that 67% of drivers crossed rail crossings with
flashing lights and bells in front of approaching trains, and 38% of drivers still violated after gates
were installed. Most of the drivers who violated did not stop or slow down when the crossing was
equipped with gates. The hypothesis of the researchers was that drivers felt it was safer to violate
the gate without stopping or slowing. Abraham et al. (1998) found that drivers’ behavior was
relative to their perception of warning signs; decision making; vehicle control; and risk-taking.
Longer warning times led to an increase in unsafe crossing behavior. Davey et al. (2008) reported
that a common perception of train drivers was that truck drivers often deliberately increased their
speed at HRGCs to “beat the oncoming train.” The explanation by truck drivers for this willful risk
taking was avoiding delays caused by waiting for trains.
Yeh and Multer (2008) provide a comprehensive review of research that addresses driver
behavior at grade crossings, in order to better understand the decisions and actions made by drivers
so that countermeasure could be developed to discourage dangerous driving behavior at HRGCs.
The document updated an earlier report by Lerner et al. (1990).
2.3 Categorization of Unsafe Maneuvers
Fitzpatrick et al. (1997) classified driver violations into three categories according to time
of violation occurrence. Flashing light (FL) violations occurred in a time period from the onset of

9
flashing lights to two seconds after the gate arms began to go down. Typically enforced violations
(TEV) were in the period beginning two seconds after the gates started going down (the end of FL
period) until train arrival at the crossing. The third category of violations, after train (AT), was
recorded after the train departure until the end of flashing lights. Goodell-Grivas (2000) classified
violations at HRGCs before the arrival of trains as more risky in comparison to violations
occurring after train departure. Hellman et al. (2001) used two categories for four-quadrant gated
HRGCs. The first consisted of violations characterized by passing through the crossing after
activation of the signal but before the gates were fully lowered. The second consisted of violations
that occurred after the gates were lowered but before train arrival. Finally, Khattak (2007, 2008,
2009) considered several categories of maneuvers at HRGCs, including passing around lowered
gates or gates in motion, making U-turns when gates were fully lowered, and vehicles backing up
from the crossing.
2.4 Statistical Models for Count Data
Traditional linear regression models are not suitable for investigating relationships
between dependent variables representing counts of events and other independent variables, since
one of the requirements is that the dependent variable be continuous. The Poisson model and its
variants, e.g., the negative binomial and the gamma models, are frequently used to model a count
variable (Joshua and Garber 1990; Miaou and Lum 1993; Mitra et al. 2002; Geedipally and Lord
2008). The Poisson distribution requires that the mean and variance of a count variable be equal;
frequently the variance of a count variable is greater than its mean. Observational data, such as the

10
number of traffic crashes in a year, frequently exhibit this property, which is termed
overdispersion. Under such circumstances the negative binomial model is used, which relaxes the
requirement that a mean and variance of a count variable be equal. The negative binomial model is
based on the Poisson model, except that it has an additional parameter alpha (α), called the
overdispersion parameter, that is used to decide which model (Poisson versus negative binomial)
is more suitable. Statistical significance of the estimated alpha parameter in a negative binomial
model shows the appropriateness of the negative binomial compared to the Poisson model.
Washington et al. (2003) and Miaou (1994) have illustrated the use of negative binomial models in
the highway safety context. A gamma model is suitable when the variance of a count variable is less
than its mean, i.e., the data are underdispersed (Greene 2007).
Other variations of the Poisson model are the zero-inflated Poisson (ZIP) and the
zero-inflated negative binomial models (ZINP). These models are useful for count variables that
contain more zeros than expected under a Poisson or negative binomial distribution. These models
may sometimes offer improved statistical fit and better predictive performance compared to
traditional Poisson and NB models (Shankar et al. 1997).
2.5 Summary of Literature Review
In brief, a number of researchers have focused on different aspects of HRGCs safety and
classified gate violations in different ways. A review of modeling techniques revealed the
appropriateness of the Poisson models for count data with several variations, including the
negative binomial, gamma, zero-inflated Poisson, and the zero-inflated negative binomial models.

11
However, the review did not reveal any published documents specifically dealing with truck
drivers’ gate related violations at HRGCs.

12
Chapter 3 Data Collection
Data collection consisted of focusing on different types of gate violations by truck drivers
at two HRGCs located in Nebraska. The following four gate violations were taken into account.
1. Trucks crossing the HRGC with gates descending.
2. Trucks crossing with HRGC gates fully lowered.
3. Trucks crossing between successive trains with fully lowered gates.
4. Trucks crossing while the gates were ascending.
Trucks included in this research were SU trucks and trucks with trailer units (semis).
Interaction between trucks and trains constituted an observation, along with a list of associated
factors that were extracted from recorded video. A spreadsheet including a coding scheme was
developed, which was populated with the collected data.
3.1 Study Sites and Field Data Collection
The data were collected at the N141st St. grade crossing in Waverly and the M-St.
crossing in Fremont, both located in Nebraska. The Waverly HRGC (US DOT crossing no.
074940T) comprised of four sets of rail tracks crossing two lanes of roadway and protected by
dual-quadrant gates, while the Fremont crossing (US DOT crossing 074662E) consisted of two
sets of tracks crossing two lanes of a roadway and protected by dual quadrant gates. Both crossings
were equipped with flashing lights, crossbuck signs, and audible bells. Figures 3.1 and 3.2 show
the two study sites.

13
Figure 3.1 HRGC at N 141st street in Waverly, NE (source: Google, Inc.)

14
Figure 3.2 HRGC at M St. crossing in Fremont, NE (source: Google, Inc.)
A noticeable aspect of the Waverly HRGC was the short distance between the highway
traffic signal (on Highway 6 and 141st St.) and the rail crossing. Additionally, a grain elevator in
close proximity to the crossing attracted a considerable number of trucks. Day- and night-vision
cameras and DVR were installed at both locations to record train crossings. The camera at
Waverly was installed on top of a fire station located in the southeast corner of the crossing to
capture video footage of train crossings; the camera in Fremont was installed on a utility pole.

15
Video was recorded during the month of November, 2008, and was later observed in the office.
Instances of train crossings with trucks present at the crossing were extracted from the video
footage. These video clips were then used for pertinent data extraction and population in a
spreadsheet.
A total of 29 variables representing traffic control characteristics, roadway
characteristics, temporal characteristics, and environmental characteristics of the HRGC were
recorded for each observation. Table 3.1 presents a complete list of those variables and their
respective coding.
Table 3.1 Variables and coding scheme
VARIABLE LABEL CODING/UNITS
S_NO Serial number
DATE Date of observation
DAY Day of week Mon=1, Tue=2, ....., Sun=7
G_DOWN Gate down time from start to end of
flashing lights
Seconds
T_ARRIVAL Time between light flashing and train
arrival
Seconds
TRAINS Number of crossing trains
SIMULTANEO
US
Dummy for simultaneous train
crossings
1 if simultaneous, 0 otherwise
STOP Dummy for train stopped at crossing 1 if stopped, 0 otherwise
CLEAR Dummy for clear weather 1 if clear, 0 otherwise
RAIN Dummy for rain 1 if raining, 0 otherwise
WET Dummy for wet pavement 1 if pavement is wet, 0 otherwise
SNOW Dummy for snow 1 if snowing, 0 otherwise
SNOW_PVT Dummy for snow on pavement 1 if snow on pavement, 0 otherwise
FOG Dummy for fog 1 if fog, 0 otherwise
DAYTIME Light condition 0 if nighttime, 1 if daytime, 2 if dawn
or dusk, 3 if dark or cloudy, 4 if other

16
Table 3.1 (cont’d.) Variables and coding scheme
N_SU_TRUCK
S
Total number of SU trucks observed
(includes queue+unsafe maneuvers)
Integer
N_SEMIS Total number of semis observed
(includes queue+unsafe maneuvers)
Integer
SU_GR1 Number of SU trucks crossing with
descending gates
Integer
SU_GR2 Number of SU trucks crossing with
gates fully lowered
Integer
SU_GR3 Number of SU trucks crossing with
gates ascending
Integer
SU_GR4 Number of SU trucks crossing
between successive trains
Integer
SEMI_GR1 Number of semis crossing with gates
descending
Integer
SEMI_GR2 Number of semis crossing with gates
fully lowered
Integer
SEMI_GR3 Number of semis crossing with gates
ascending
Integer
SEMI_GR4 Number of semis crossing between
successive trains
Integer
SU_UTURN Number of SU trucks making U-turns Integer
SU_B_UP Numbers of SU trucks backing up Integer
SEMI_UTURN Number of semis making U-turns Integer
SEMI_B_UP Numbers of semis backing up Integer
An example of data extraction is aided by figures 3.3 and 3.4, and table 3.2. In figure 3.3,
time and date information for the observation is displayed at the bottom-left of the screen. Using
the controls visible to the right of the screen, the video clip was played and observed for gate
violations by trucks. Weather conditions from the video clip were observed by data collectors.
Figure 3.4 shows the onset of a gate activation due to an oncoming train. The total time of the train

17
crossing event was calculated by noting the times of flashing light activation and de-activation.
The time interval between flashing light activation and train arrival at the crossing was calculated
in a similar manner. Other variables, such as number of trains, stoppage of trains, violations of
truck drivers, and truck traffic, were observed by data collectors and populated in a spreadsheet
with pre-defined variables and values (given in table 3.1). Table 3.2 shows a sample of observation
data populated from the captured video. A total of 476 train crossing observations with trucks were
collected.
Figure 3.3 Interface of DVR software

18
Figure 3.4 Onset of HRGC gate activation
Table 3.2 Example of data extraction for a single observation
S_NO DATE DAY G_DOWN T_ARRIVAL TRAINS
51 12/10/2008 1 150 33 1
SIMULTANEO
US STOP CLEAR RAIN WET SNOW
0 0 1 0 0 0
SNOW_PVT FOG DAYTIME
N_SU_TRUCK
S N_SEMIS SU_GR1
0 0 1 1 1 0
SU_GR2 SU_GR3 SU_GR4 SEMI_GR1 SEMI_GR2 SEMI_GR3
0 0 0 1 0 0
SEMI_GR4 SU_UTURN SU_B_UP SEMI_UTURN SEMI_B_UP
0 0 0 0 0

19
Chapter 4 Data Analysis
Data analysis began with a preliminary and was followed by a more detailed analysis of
gate violations by truck drivers. The preliminary analysis consisted of calculating frequencies,
means, and variances for different variables. The preliminary analysis was performed mainly
using SPSS (version 18); this analysis is subsequently described.
4.1 Preliminary Data Analysis
As previously stated, four different types of gate violations were monitored during data
collection. These included passing under descending gates, passing around fully lowered gates,
passing under ascending gates, and passing around fully lowered gates between successive trains.
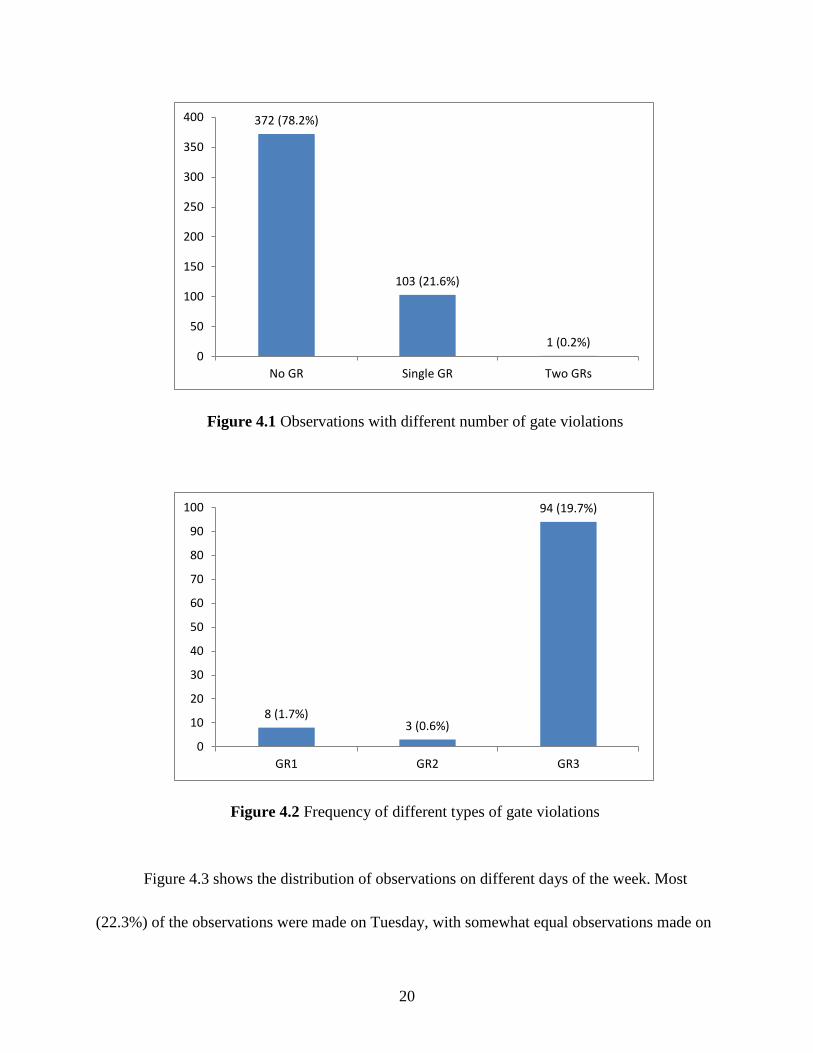
Figure 4.1 shows the number of observations with zero, one, or two gate violations. No gate
violation was observed in 78.2% of the observations, while a single violation was observed in
21.6% of the observations. Only in a single observation were two trucks involved in gate-related
violations. Figure 4.2 shows the frequency of different types of observed gate violations; the most
frequent was passing under ascending gates (19.7%), followed by passing under descending gates
(1.7%), while 0.6% of the violations involved SU trucks passing around fully lowered gates. No
trucks were observed passing around gates between successive trains at the two observed HRGCs.
20
Figure 4.1 Observations with different number of gate violations
Figure 4.2 Frequency of different types of gate violations
Figure 4.3 shows the distribution of observations on different days of the week. Most
(22.3%) of the observations were made on Tuesday, with somewhat equal observations made on
372 (78.2%)
103 (21.6%)
1 (0.2%) 0
50
100
150
200
250
300
350
400
No GR Single GR Two GRs
8 (1.7%) 3 (0.6%)
94 (19.7%)
0
10
20
30
40
50
60
70
80
90
100
GR1 GR2 GR3

21
Monday, Wednesday, Thursday, and Friday. Fewer observations were collected on Saturday and
Sunday. Figure 4.4 presents the distribution of observations across different times of the day. The
majority (69.1%) of observations were collected during daytime, while somewhat equivalent
observations were collected under dark or cloudy, dawn or dusk, and nighttime conditions,
respectively.
Table 4.1 presents descriptive statistics for the collected data. The average event time was
363.5 seconds (about 6 minutes). The mean time between the start of flashing lights and train
arrival at the crossing was 46.1 seconds (provision of 20 seconds as a minimum is mandated). The
following section presents a more detailed analysis that includes the testing of the hypotheses
listed in table 1.1.
Figure 4.3 Collection of observations on different days of the week
71 (14.9%)
106 (22.3%)
80 (16.8%)
68 (14.3%) 69 (14.5%)
40 (8.4%) 42 (8.8%)
0
20
40
60
80
100
120
Mon Tue Wed Thu Fri Sat Sun

22
Figure 4.4 Time of day distribution of observations
Table 4.1 Descriptive statistics for the collected data
Variable Description Missing
Values
Mean Std.
Deviation
Minimum Maximum
GR_TOTAL Total truck (su+semi) gate rushes 0 0.221 0.420 0 2
DAY Day of week, Mon=1,..Sun=7 0 3.517 1.857 1 7
G_DOWN Gate down time from start to end of
flashing lights (seconds)
2 363.568 309.960 43 3019
T_ARRIVAL Time between light flashing and train
arrival (seconds)
3 46.106 40.598 0 859
TRAINS Number of crossing trains 0 1.143 0.401 0 3
SIMULTANEOUS Dummy for simultaneous train
crossings
0 0.139 0.346 0 1
STOP Dummy for train stopped at crossings 0 0.193 0.395 0 1
CLEAR Dummy for clear weather 0 0.893 0.310 0 1
RAIN Dummy for rain 0 0.032 0.175 0 1
WET Dummy for wet pavement 0 0.084 0.278 0 1
SNOW Dummy for snow 0 0.019 0.136 0 1
SNOW_PVT Dummy for snow pavement 0 0.080 0.271 0 1
FOG Dummy for fog 0 0.004 0.065 0 1
48 (10.1%)
329 (69.1%)
39 (8.2%) 60 (12.6%)
0
50
100
150
200
250
300
350
Nighttime Daytime Dawn or dusk Dark or Cloudy

23
Table 4.1 (cont’d.) Descriptive statistics for the collected data
DAYTIME Light condition,
0=nighttime,1=daytime,2=dawn or
dusk,3=dark or cloudy,4=other
0 1.233 0.796 0 3
N_SU_TRUCKS Total number of single unit trucks
observed (includes queue+unsafe
maneuvers)
0 0.708 0.559 0 3
N_SEMIS Total number of semis observed
(includes queue+unsafe maneuvers)
0 0.309 0.485 0 2
SU_GR1 Number of single unit trucks crossing
with gates descending
0 0.008 0.091 0 1
SU_GR2 Number of single unit trucks crossing
with gates fully lowered
0 0.006 0.079 0 1
SU_GR3 Number of single unit trucks crossing
with gates ascending
0 0.147 0.355 0 1
SU_GR4 Number of single unit trucks crossing
between successive trains
0 0.000 0.000 0 0
SEMI_GR1 Number of semis crossing with gates
descending
0 0.008 0.091 0 1
SEMI_GR2 Number of large semis crossing with
gates fully lowered
0 0.000 0.000 0 0
SEMI_GR3 Number of semis crossing with gates
ascending
0 0.050 0.219 0 1
SEMI_GR4 Number of semis crossing between
successive trains
0 0.000 0.000 0 0
LOCATION Fremont or Waverly 0 1.534 0.499 1 2
TRUCK QUEUE Number of trucks in queue 0 1.126 0.391 1 4
WEEKEND Dummy for weekend 0 0.172 0.378 0 1
DAY Dummy for daytime (daytime=1) 0 0.691 0.462 0 1

24
4.2 Detailed Data Analysis
Detailed data analysis involved analyzing the frequency of gate related violations by truck
drivers and statistically testing the hypotheses listed in table 1.1 The Poisson model or its
variations were appropriate for use, as the variable of interest consisted of gate violation counts
during train crossing events. The Poisson model allows the establishment of a relationship
between a dependent (count) variable and a number of independent variables. For a discrete
random variable Y, such as number of gate violations, with observed frequencies yi = 1, 2, …,N
(where yi ≥ 0), the probability that the observed frequencies are the real frequencies is:
(4.1)
(4.2)
where,
= estimated vector of parameters
= vector of gate rush relevant characterizes for observation i, and
= mean and the variance of the observed gate rush frequency

25
The Poisson model requires that the mean and variance of the count variable be the same.
Many times this requirement is not met, and an alternative model is needed. The negative binomial
model relaxes this requirement and serves as an alternate model. The resulting probability
distribution is:
(4.3)
where,
= error term, (1, α2). Integrating out of the above equation produces the unconditional
distribution of . The equation for this distribution is:
(4.4)
where,
probability of the ith gate violation,
= , and
Both the Poisson and the negative binomial models can be estimated by the standard
maximum-likelihood methods. A measure of the goodness-of-fit for an estimated model is the
fraction of a restricted log-likelihood:

26
(4.5)
where,
= log likelihood and = restricted log likelihood.
The value of for an estimated model is between 0 and 1; a greater value of indicates
a better fitting model compared to models with lower values of . A chi square test is used to judge
the overall usefulness of the model, which measures the sum of the differences between observed
and expected outcome frequencies; therefore the statistical significance of chi square indicates that
the model is providing useful information. The equation is:
∑
(4.6)
NLOGIT 4.0 was used for model estimation. Estimated coefficients in the model were
statistically tested using a student’s t-test to assess if they were different than zero at 95% or 90%
confidence levels. Absolute t-statistic values of 1.96 or greater and 1.64 or greater indicated
statistical significance at the 95% and 90% confidence levels, respectively.

27
Table 4.2 shows the estimated model with relevant summary statistics. Overall, the
estimated model provided useful information even though the overall model fit was not very good.
A positive estimated coefficient shows that the frequency of gate violations by trucks increased
with increasing values of the variable, while a negative estimated coefficient indicates that gate
violations decreased with increasing values of the variable.
Table 4.2 Estimated model for gate violations by trucks at HRGCs
Variable Description Est. Coeff. Std.
error
t-statistic Mean
N_SU_TRUCK Total number of SU trucks 0.709 0.212 3.345 0.706
N_SEMIS Total number of semis 0.586 0.254 2.308 0.309
T_ARRIVAL Time between lights flashing and
train arrival (sec) 0.003 0.002 1.989 46.106
NIGHT Dummy variable for nighttime 0.477 0.273 1.750 0.101
RAIN Dummy variable for rain -1.221 0.958 -1.275 0.032
Constant Constant in the model -2.424 0.275 -8.808 -
Model summary statistics
Number of observations 473
Log likelihood -255.821
Restricted Log likelihood -263.732
Rho-squared 0.030
Chi squared 15.822
P-value for chi squared 0.007
Two variables indicating the number of SU trucks (N_SU_TRUCKS) and semis
(N_SEMIS) encountered during train crossing events were included in the model specification to
test Hypothesis 1 (listed in table 1.1). Together, the variables represent truck exposure to
28
involvement in gate violations. Both variables were statistically significant at the 95% confidence
level, indicating that gate violations increased with greater numbers of SU trucks and semis
arriving at HRGCs, thus confirming Hypothesis 1. The greater value of the estimated coefficient
for SU trucks compared to the coefficient for semis showed that SU truck drivers were more prone
to gate violations, in comparison to drivers of semis.
The variable T_ARRIVAL represented the time between the start of flashing lights and
train arrival at the crossings. This time depends on the speed of approaching trains, and a minimum
stipulated value of 20 seconds must be provided. The estimated coefficient was positive and
statistically significant at the 95% confidence level, showing that longer values of T_ARRIVAL
were associated with greater gate violations at the HRGCs. This result confirms Hypothesis 2
listed in Table 1.
To test Hypothesis 3, the model specification included a dummy variable for nighttime.
The estimated coefficient for this variable was positive and statistically significant at the 90%
confidence level (t-statistic >1.64), thus confirming Hypothesis 3. The finding regarding nighttime
was that it was associated with a greater frequency of gate related violations in comparison to
daylight, dawn, and dusk, etc. Finally, a dummy variable for rain was included in the model to
explore its association with the frequency of gate related violations by trucks (i.e., Hypothesis 4).
The estimated coefficient was negative, indicating that gate violations occurred less frequently
during conditions of rain; however, the estimate was not statistically significant at the 90%
confidence level, and therefore the collected data did not provide enough evidence to make a

29
conclusive statement regarding the effect of rain on gate violations by truck drivers. Hypotheses 5
(duration of gate closure) and 6 (weekends versus weekdays) were tested and found to not be
substantiated by the model. These two variables were then removed from the model specification.
Other variables available in the database were also tested in the model specification, but
were found not to be statistically significant. These included: the number of crossing trains, train
stoppage on the crossing, and a dummy variable for crossing location (Waverly or Fremont).
These variables were excluded from the model specification for parsimony.

30
Chapter 5 Conclusions and Recommendations
The objectives of this research were to report on the frequency and type of gate violations
by truck drivers and to empirically identify factors associated with such gate violations. Four types
of violations were monitored: trucks passing under descending gates, trucks passing around fully
lowered gates, trucks passing under ascending gates, and trucks passing around fully lowered gates
between successive trains. Data were collected at two HRGCs and analyzed; no trucks were
observed passing around gates between successive trains at the two observed HRGCs. Analysis
indicated that about 20% of the observations involved trucks passing under ascending gates, with
relatively few trucks passing under descending gates, and even fewer trucks passing around fully
lowered gates. Results of a Poisson model confirmed the hypotheses that a greater frequency of
violations was associated with the variables of greater truck traffic at the HRGCs; longer durations
between the onset of flashing lights and train arrival at the crossing; and nighttime. Based on these
findings, the following conclusions were reached.
Gate related violations at HRGCs by truck drivers mainly included passing under
descending or ascending gates.
Longer times between the onset of flashing lights and train arrivals at HRGCs contributed
to greater frequencies of gate violations.
Nighttime was associated with greater frequencies of gate violations by truck drivers.

31
To improve safety at HRGCs the following recommendations were offered:
The time interval between the onset of flashing lights and actual train arrival at HRGCs
should not be excessively large beyond the minimum 20 seconds required.
Countermeasures aimed at reducing gate violations at nighttime should be investigated,
including driver education and enforcement of motor vehicle laws at HRGCs.
Certain aspects of truck safety at HRGCs need further investigation. These include the
collection and analysis of data on characteristics of drivers involved in gate violations; wider
geographic and temporal coverage of HRGCs in the analysis; and implementation and assessment
of countermeasures for reducing gate violations by truck drivers. Moreover, though this research
did not find statistically significant evidence regarding the effect of rain on gate violations by truck
drivers, the effects of weather on HRGC safety warrant future study.

32
References
Abraham, J., S. Datta, and T. Datta. 1998. “Driver behavior at rail-highway crossings.”
Transportation Research Record: Journal of the Transportation Research Board, 1648:
28-34.
Council, F. M., D. W. Reinfurt, B. J. Campbell, F. L. Roediger, C. L. Carrol, A. K. Dutt, and J. R.
Dunham. 1980. Accident research manual. University of North Carolina Highway Safety
Center, Chapel Hill, N. C.
Davey J., A. Wallace, N. Stenson and J. Freeman. 2007. “The experiences and perceptions of
heavy vehicle drivers and train drivers of dangers at railway level crossings.” Accident
Analysis and Prevention, 40: 1217–1222.
Federal Railroad Administration Highway-Rail Crossing Web Accident Prediction System
(WBAPS). Accessed March 3, 2009.
http://safetydata.fra.dot.gov/OfficeofSafety/default.aspx.
Fitzpatrick, K., P. J. Carlson, and J. A. Bean. 1997. “Traffic violations at gated highway-railroad
crossings.” Research Report 2987-1, Texas Transportation Institute, in cooperation with
the Texas Dept. of Transportation, College Station, TX.
Geedipally, S. R. and D. Lord. 2008. Effects of varying dispersion parameter of Poisson-Gamma
models on estimation of confidence intervals of crash prediction model. Transportation
Research Record, 2061: 46-54.
Goodell-Grivas, Inc. 2000. Driver behavior study at rail-highway crossings. Michigan
Department of Transportation, Lansing, MI.
Gordon, D. A., McGee, H. W., and Hooper, K. G. 1984. “Driver characteristics impacting on
highway design and operations.” Public Roads, 48, no. 1: 12-16.
Greene, W. H. Econometric analysis sixth edition. New Jersey: Prentice Hall.
Hauer, E., and B. Persaud. 1987. “How to estimate the safety of Rail-Highway Grade Crossings
and the safety effects of warning devices.” Transportation Research Record, 1114:
131-140
Hellman, A. D., A. Carroll, A., M. Lee, and M. Haines. 2001. “Preliminary evaluation of the
School Street four-quadrant gate highway railroad grade crossing.” Proceedings of the
California Public Utilities Commission Railroad Grade Crossings Meeting, San Diego,
CA.

33
Joshua, S. C., and N. J. Garber. 1990. “Estimating truck accident rate and involvements using
linear and Poisson regression models.” Transportation Planning and Technology, 15, no.
1: 41-58.
Jutaek. O, S. P. Washington, and D. Nam. 2006. Accident prediction model for railway-highway
interfaces.” Accident Analysis and Prevention, 38: 346-356.
Kallberg, V. –P., Anila, M., Pajunen, K., Kallio, M., & Hytonen, J. 2002. “Assessment and
improvement of safety at Finnish railway-road grade crossings.” Transportation Research
Record, 1801: 54-60.
Khattak, A. 2007. “Reducing undesirable motor vehicle driver actions at railroad-highway grade
crossings.” Transportation Research Record, 2030: 54-58.
Khattak, A. 2009. “Comparison of driver behavior at highway-railroad crossings in two cities.”
Transportation Research Record, 2122: 72-77.
Khattak, A, and G. McKnight. 2008. “Gate rushing at highway-railroad grade crossings: Driver's
response to a centerline barrier.” Transportation Research Record, 2061: 104-109.
Lerner, N., Ratte, D., and Walker, J. 1990. “Driver behavior at rail-highway crossings.” Report
FHWA-SA-90-008, Washington, D.C., United States Department of Transportation,
Federal Highway Administration, Office of Highway Safety.
Meeker, F. and R.A Barr, 1989. “An observational study of driver behavior at a protected railroad
grade crossing as trains approach.” Accident Analysis and Prevention, 3: 255–262.
Meeker, F., D. Fox, and C. Weber, 1997. “A comparison of driver behavior at railroad grade
crossings with two different protection systems.” Accident Analysis and Prevention, 29:
11–16.
Miaou, S. P. 1994. “The relationship between truck accident and geometric design of road
Sections: Poisson versus negative binomial regressions.” Accident Analysis and
Prevention, 26, 471-482.
Miaou, S. -P., and H. Lum. 1993. “A statistical evaluation of the effects of highway geometric
design on truck accident involvements.” Transportation Research Record, 1407: 11-23.
Mitra, S., H. C. Chin, and M. A. Quddus. 2002. “Study of intersection accidents by maneuver
type.” Transportation Research Record, 1784: 43-50.
Sabey, B., and H. Taylor. 1980. “The known risks we ran: The highway.” Supplementary report
SR 567, Transport and Road Research Laboratory, Crowthorne, UK.

34
Shankar V., J. Milton, and F.L. Mannering. 1997. “Modeling accident frequency as zero-altered
probability processes: an empirical inquiry.” Accident Analysis and Prevention, 29: 829–
837.
Shinar, D., and S. Raz. 1982. “Driver response to different railroad crossing protection systems.”
Ergonomics, 25: 801–808.
Tenkink, E. and R. Van der Horst. 1990. “Car driver behavior at flashing light railroad grade
crossings.” Accident Analysis and Prevention, 22: 229-239.
Washington, S., M. Karlaftis, and F. Mannering. 2003. Statistical and econometric methods for
transportation data analysis. Boca Raton, FL: Chapman and Hall/CRC.
Yeh, M., and J. Multer. 2008. “Driver behavior at highway-railroad grade crossings: A literature
review from 1990-2006.” Report DOT/FRA/ORG-08/03, Washington, D.C., United States
Department of Transportation, Federal Railroad Administration.