rencarex (renal cell carcinoma)- analysis and …transitional cell carcinoma, wilms' tumor...
TRANSCRIPT
SAMPLE
Rencarex (Renal Cell Carcinoma) – Analysis and Forecasts to
2022
Published: March 2012
Page 1
© GlobalData. This report is a licensed product and is not to be photocopied
Rencarex (Renal Cell Carcinoma)- Analysis and Forecasts to 2022
Reference Code: GDHC0004RCCDVR Publication Date: March 2012
The Renal Cell Carcinoma (RCC) Disease Therapeutics
Market
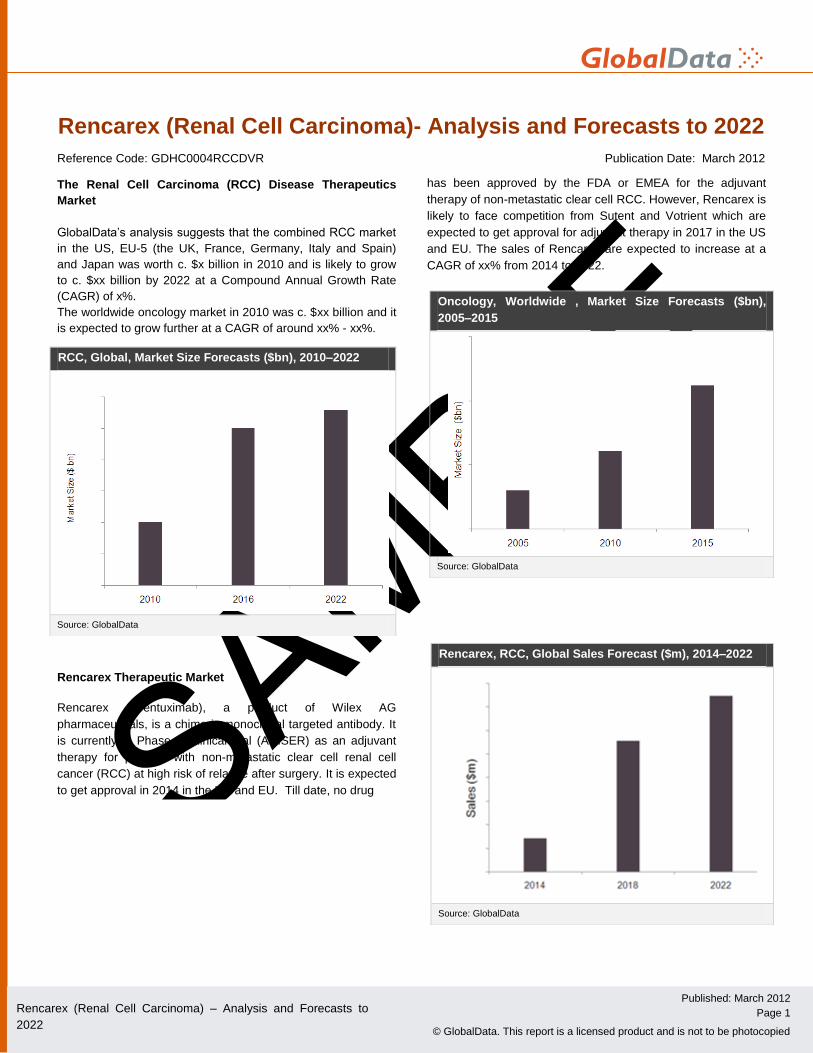
GlobalData’s analysis suggests that the combined RCC market
in the US, EU-5 (the UK, France, Germany, Italy and Spain)
and Japan was worth c. $x billion in 2010 and is likely to grow
to c. $xx billion by 2022 at a Compound Annual Growth Rate
(CAGR) of x%.
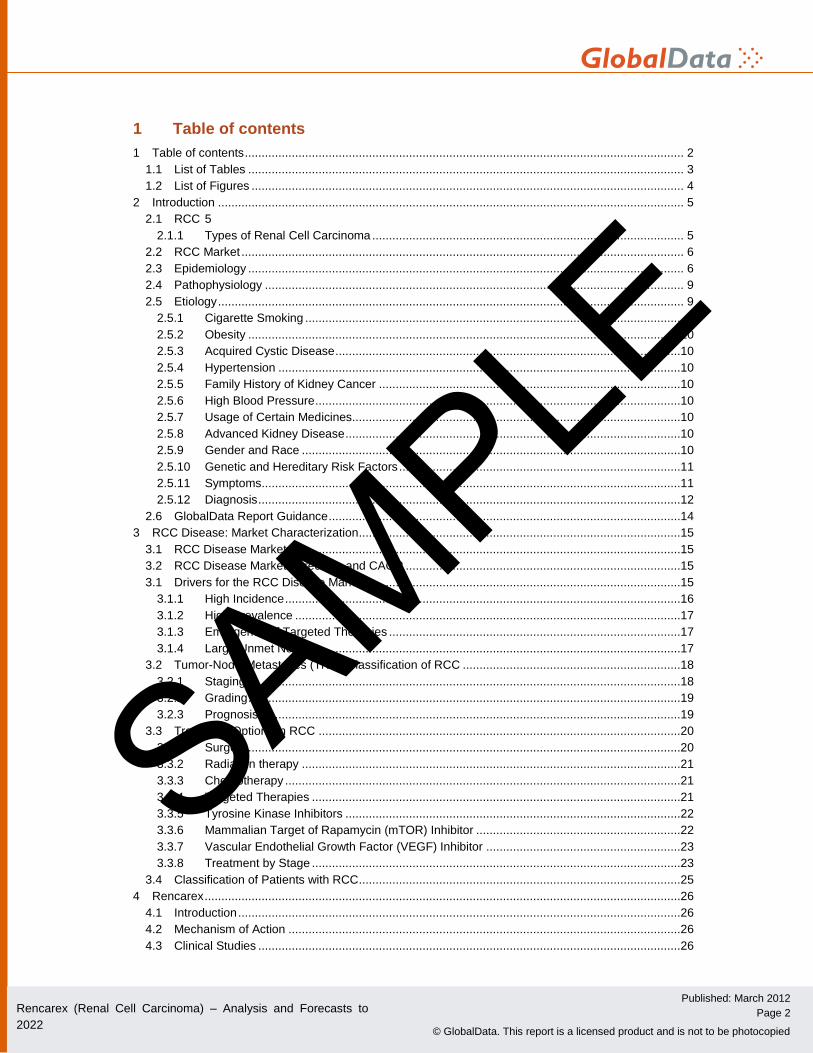
The worldwide oncology market in 2010 was c. $xx billion and it
is expected to grow further at a CAGR of around xx% - xx%.
Rencarex Therapeutic Market
Rencarex (girentuximab), a product of Wilex AG
pharmaceuticals, is a chimeric monoclonal targeted antibody. It
is currently in Phase III clinical trial (ARISER) as an adjuvant
therapy for patients with non-metastatic clear cell renal cell
cancer (RCC) at high risk of relapse after surgery. It is expected
to get approval in 2014 in the US and EU. Till date, no drug
has been approved by the FDA or EMEA for the adjuvant
therapy of non-metastatic clear cell RCC. However, Rencarex is
likely to face competition from Sutent and Votrient which are
expected to get approval for adjuvant therapy in 2017 in the US
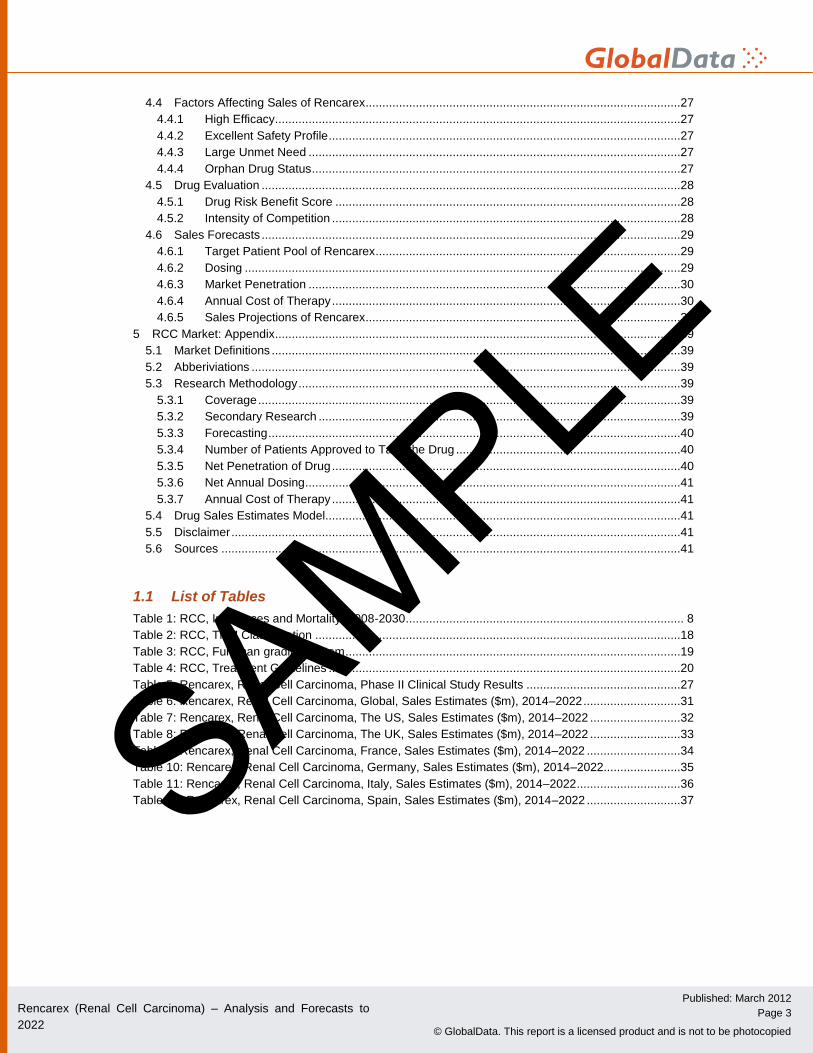
and EU. The sales of Rencarex are expected to increase at a
CAGR of xx% from 2014 to 2022.
Oncology, Worldwide , Market Size Forecasts ($bn),
2005–2015
Source: GlobalData
RCC, Global, Market Size Forecasts ($bn), 2010–2022
Source: GlobalData
Rencarex, RCC, Global Sales Forecast ($m), 2014–2022
Source: GlobalData
SAMPLE
Rencarex (Renal Cell Carcinoma) – Analysis and Forecasts to
2022
Published: March 2012
Page 2
© GlobalData. This report is a licensed product and is not to be photocopied
1 Table of contents
1 Table of contents ................................................................................................................................... 2 1.1 List of Tables .................................................................................................................................. 3 1.2 List of Figures ................................................................................................................................. 4
2 Introduction ........................................................................................................................................... 5 2.1 RCC 5
2.1.1 Types of Renal Cell Carcinoma ............................................................................................. 5 2.2 RCC Market .................................................................................................................................... 6 2.3 Epidemiology .................................................................................................................................. 6 2.4 Pathophysiology ............................................................................................................................. 9 2.5 Etiology ........................................................................................................................................... 9
2.5.1 Cigarette Smoking ................................................................................................................. 9 2.5.2 Obesity .................................................................................................................................10 2.5.3 Acquired Cystic Disease .......................................................................................................10 2.5.4 Hypertension ........................................................................................................................10 2.5.5 Family History of Kidney Cancer ..........................................................................................10 2.5.6 High Blood Pressure .............................................................................................................10 2.5.7 Usage of Certain Medicines ..................................................................................................10 2.5.8 Advanced Kidney Disease ....................................................................................................10 2.5.9 Gender and Race .................................................................................................................10 2.5.10 Genetic and Hereditary Risk Factors ....................................................................................11 2.5.11 Symptoms .............................................................................................................................11 2.5.12 Diagnosis ..............................................................................................................................12
2.6 GlobalData Report Guidance .........................................................................................................14 3 RCC Disease: Market Characterization ................................................................................................15
3.1 RCC Disease Market .....................................................................................................................15 3.2 RCC Disease Market Forecasts and CAGR ..................................................................................15 3.1 Drivers for the RCC Disease Market ..............................................................................................15
3.1.1 High Incidence ......................................................................................................................16 3.1.2 High Prevalence ...................................................................................................................17 3.1.3 Emergence of Targeted Therapies .......................................................................................17 3.1.4 Large Unmet Need ...............................................................................................................17
3.2 Tumor-Node-Metastases (TNM) Classification of RCC .................................................................18 3.2.1 Staging .................................................................................................................................18 3.2.2 Grading .................................................................................................................................19 3.2.3 Prognosis..............................................................................................................................19
3.3 Treatment Options in RCC ............................................................................................................20 3.3.1 Surgery .................................................................................................................................20 3.3.2 Radiation therapy .................................................................................................................21 3.3.3 Chemotherapy ......................................................................................................................21 3.3.4 Targeted Therapies ..............................................................................................................21 3.3.5 Tyrosine Kinase Inhibitors ....................................................................................................22 3.3.6 Mammalian Target of Rapamycin (mTOR) Inhibitor .............................................................22 3.3.7 Vascular Endothelial Growth Factor (VEGF) Inhibitor ..........................................................23 3.3.8 Treatment by Stage ..............................................................................................................23
3.4 Classification of Patients with RCC ................................................................................................25 4 Rencarex ..............................................................................................................................................26
4.1 Introduction ....................................................................................................................................26 4.2 Mechanism of Action .....................................................................................................................26 4.3 Clinical Studies ..............................................................................................................................26
SAMPLE
Rencarex (Renal Cell Carcinoma) – Analysis and Forecasts to
2022
Published: March 2012
Page 3
© GlobalData. This report is a licensed product and is not to be photocopied
4.4 Factors Affecting Sales of Rencarex ..............................................................................................27 4.4.1 High Efficacy .........................................................................................................................27 4.4.2 Excellent Safety Profile .........................................................................................................27 4.4.3 Large Unmet Need ...............................................................................................................27 4.4.4 Orphan Drug Status ..............................................................................................................27
4.5 Drug Evaluation .............................................................................................................................28 4.5.1 Drug Risk Benefit Score .......................................................................................................28 4.5.2 Intensity of Competition ........................................................................................................28
4.6 Sales Forecasts .............................................................................................................................29 4.6.1 Target Patient Pool of Rencarex ...........................................................................................29 4.6.2 Dosing ..................................................................................................................................29 4.6.3 Market Penetration ...............................................................................................................30 4.6.4 Annual Cost of Therapy ........................................................................................................30 4.6.5 Sales Projections of Rencarex ..............................................................................................31
5 RCC Market: Appendix .........................................................................................................................39 5.1 Market Definitions ..........................................................................................................................39 5.2 Abberiviations ................................................................................................................................39 5.3 Research Methodology ..................................................................................................................39
5.3.1 Coverage ..............................................................................................................................39 5.3.2 Secondary Research ............................................................................................................39 5.3.3 Forecasting ...........................................................................................................................40 5.3.4 Number of Patients Approved to Take the Drug ...................................................................40 5.3.5 Net Penetration of Drug ........................................................................................................40 5.3.6 Net Annual Dosing ................................................................................................................41 5.3.7 Annual Cost of Therapy ........................................................................................................41
5.4 Drug Sales Estimates Model..........................................................................................................41 5.5 Disclaimer ......................................................................................................................................41 5.6 Sources .........................................................................................................................................41
1.1 List of Tables
Table 1: RCC, Incidences and Mortality, 2008-2030 ................................................................................... 8 Table 2: RCC, TNM Classification .............................................................................................................18 Table 3: RCC, Fuhrman grading system ....................................................................................................19 Table 4: RCC, Treatment Guidelines .........................................................................................................20 Table 5: Rencarex, Renal Cell Carcinoma, Phase II Clinical Study Results ..............................................27 Table 6: Rencarex, Renal Cell Carcinoma, Global, Sales Estimates ($m), 2014–2022 .............................31 Table 7: Rencarex, Renal Cell Carcinoma, The US, Sales Estimates ($m), 2014–2022 ...........................32 Table 8: Rencarex, Renal Cell Carcinoma, The UK, Sales Estimates ($m), 2014–2022 ...........................33 Table 9: Rencarex, Renal Cell Carcinoma, France, Sales Estimates ($m), 2014–2022 ............................34 Table 10: Rencarex, Renal Cell Carcinoma, Germany, Sales Estimates ($m), 2014–2022.......................35 Table 11: Rencarex, Renal Cell Carcinoma, Italy, Sales Estimates ($m), 2014–2022 ...............................36 Table 12: Rencarex, Renal Cell Carcinoma, Spain, Sales Estimates ($m), 2014–2022 ............................37
SAMPLE
Rencarex (Renal Cell Carcinoma) – Analysis and Forecasts to
2022
Published: March 2012
Page 4
© GlobalData. This report is a licensed product and is not to be photocopied
1.2 List of Figures
Figure 1: Worldwide Incidence and Mortality Distribution of Top 20 Cancers (%), 2010 ............................. 7 Figure 2: Total number of cigarettes consumed, The US, 1976-2006 ......................................................... 9 Figure 3: RCC, Global, Market Size Forecasts ($bn), 2010–2022 .............................................................15 Figure 4: RCC, Global, Incidence (in million), 2008-2030 .........................................................................16 Figure 5: Oncology, Worldwide, Incidence (in million), 2008-2030 ..........................................................16 Figure 6: Classification of Patients with RCC .............................................................................................25 Figure 7: Renal Cell Carcinoma, Rencarex, Drug Model Diagram .............................................................29 Figure 8: Rencarex, Renal Cell Carcinoma, Global, Sales Estimates ($m), 2014–2022 ............................31 Figure 9: Rencarex, Renal Cell Carcinoma, The US, Sales Estimates ($m), 2014–2022 ..........................32 Figure 10: Rencarex, Renal Cell Carcinoma, The UK, Sales Estimates ($m), 2014–2022 ........................33 Figure 11: Rencarex, Renal Cell Carcinoma, France, Sales Estimates ($m), 2014-2022 ..........................34 Figure 12: Rencarex, Renal Cell Carcinoma, Germany, Sales Estimates ($m), 2014–2022 .....................35 Figure 13: Rencarex, Renal Cell Carcinoma, Italy, Sales Estimates ($m), 2014–2022 .............................36 Figure 14: Rencarex, Renal Cell Carcinoma, Spain, Sales Estimates ($m), 2014–2022 ...........................37 Figure 15: Rencarex, Renal Cell Carcinoma, Global, Sales Distribution by Country (%), 2022 .................38 Figure 16: Patients Approved for the Drug .................................................................................................40
SAMPLE
Rencarex (Renal Cell Carcinoma) – Analysis and Forecasts to
2022
Published: March 2012
Page 5
© GlobalData. This report is a licensed product and is not to be photocopied
2 Introduction
2.1 RCC
Renal cell carcinoma (RCC) is classified under Code C-64 according to International Classification of
Disease (ICD-10) and is a cancer that develops in the lining of renal tubules, also called as renal cell
cancer or renal cell adenocarcinoma.RCC is most common type of kidney cancer and about 9 out of 10
kidney cancers are renal cell carcinomas. RCC is the 15th most common cancer (by incidence) and ninth
most common cancer in women accounting for 2-3% of all adult malignancies. RCC accounts for 80 to
85% of primary malignant renal tumors. Transitional cell carcinoma, Wilms' tumor (most often in children),
and sarcoma are the less common primary renal cell tumors known. Male to female incidence ratio is 3:2
and people affected are usually between 50 to 70 years of age.
In RCC malignant cancer cells are found in the lining of the tubules in the kidney. Cancer originating in the
ureter or the renal pelvis is different from RCC. Symptoms usually appear very late, when the tumor may
already become large and metastatic. Most metastatic sites include lymph nodes, lungs, adrenal glands,
liver, and bone. Renal cell cancer is also called renal adenocarcinoma or hypernephroma.
2.1.1 Types of Renal Cell Carcinoma
According to ACS (American Cancer Society) based on microscopic findings RCC has several subtypes
2.1.1.1 Clear cell renal cell carcinoma
This is the most common form of renal cell carcinoma. About 7 out of 10 people with renal cell carcinoma
have this kind of cancer. The cells that make up clear cell RCC look very pale or clear under a
microscope.
2.1.1.2 Papillary renal cell carcinoma
This is the second most common subtype about 1 one out of 10 RCC cases. These cancers form little
finger-like projections (called papillae) in some, if not most, of the tumor. This subtype is also called
chromophilic as the cancer cells look pink under a microscope when stained with certain dyes.
2.1.1.3 Chromophobe renal cell carcinoma
This subtype accounts for about 5% (5 cases in 100) of RCCs. The cells of these cancers are also pale,
like the clear cells, however comparatively these cells are much larger and have other distinguishing
features as well.
2.1.1.4 Collecting duct renal cell carcinoma
Very rare subtype and formation of irregular tubes by the cancer cells is the major distinguishing feature.
2.1.1.5 Unclassified renal cell carcinoma
Renal cell cancers are labelled as unclassified when they do not into any of the other categories or
because there is more than one type of cell present. According to WHO RCC can be classified by three
major histological subtypes:
• Clear cell (cRCC, 80-90%)
• Papillary (pRCC, 10-15%)
• Chromophobe (chRCC, 4-5%)
SAMPLE
Rencarex (Renal Cell Carcinoma) – Analysis and Forecasts to
2022
Published: March 2012
Page 14
© GlobalData. This report is a licensed product and is not to be photocopied
2.6 GlobalData Report Guidance
The report comprises:
A snapshot that includes the global RCC market forecasts from 2010 to 2022. It includes the Global
Rencarex sales forecasts from 2014 to 2022.
Chapter 1 includes the RCC incidences and mortality in major countries. It also discusses various risk
factors associated with RCC.
Chapter 2 includes the RCC market forecasts and drivers for the RCC market.
Chapter 3 includes the Tumor Node Metastases (TNM) classification of RCC in the US, EU-5 and
Japan.
Chapter 4 gives a comprehensive Assessment of Rencarex in RCC Market wherein promising results
of clinical trials, mode of mechanism and toxicity profile of the drug are discussed. It includes
Rencarex’s sales forecasts in different countries based on standard pricing of Rencarex and
standardized market penetration.
SAMPLE
Rencarex (Renal Cell Carcinoma) – Analysis and Forecasts to
2022
Published: March 2012
Page 15
© GlobalData. This report is a licensed product and is not to be photocopied
3 RCC Disease: Market Characterization
3.1 RCC Disease Market
3.2 RCC Disease Market Forecasts and CAGR
3.1 Drivers for the RCC Disease Market
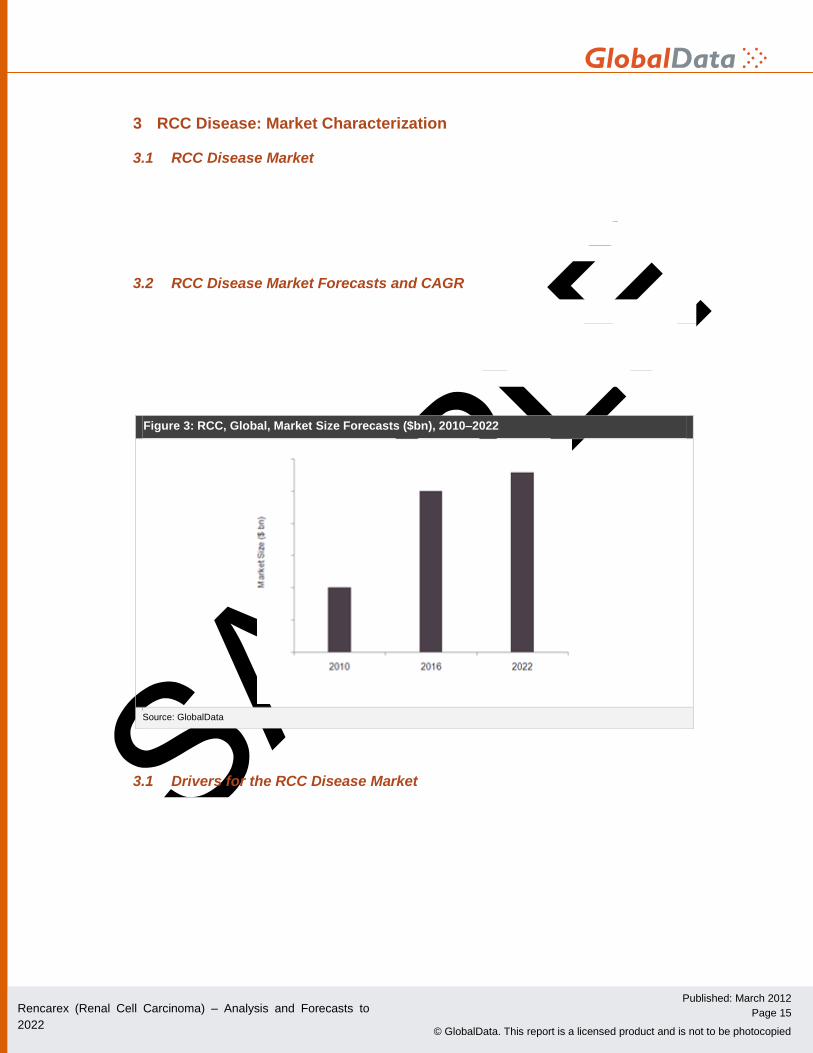
Figure 3: RCC, Global, Market Size Forecasts ($bn), 2010–2022
Source: GlobalData
SAMPLE
Rencarex (Renal Cell Carcinoma) – Analysis and Forecasts to
2022
Published: March 2012
Page 16
© GlobalData. This report is a licensed product and is not to be photocopied
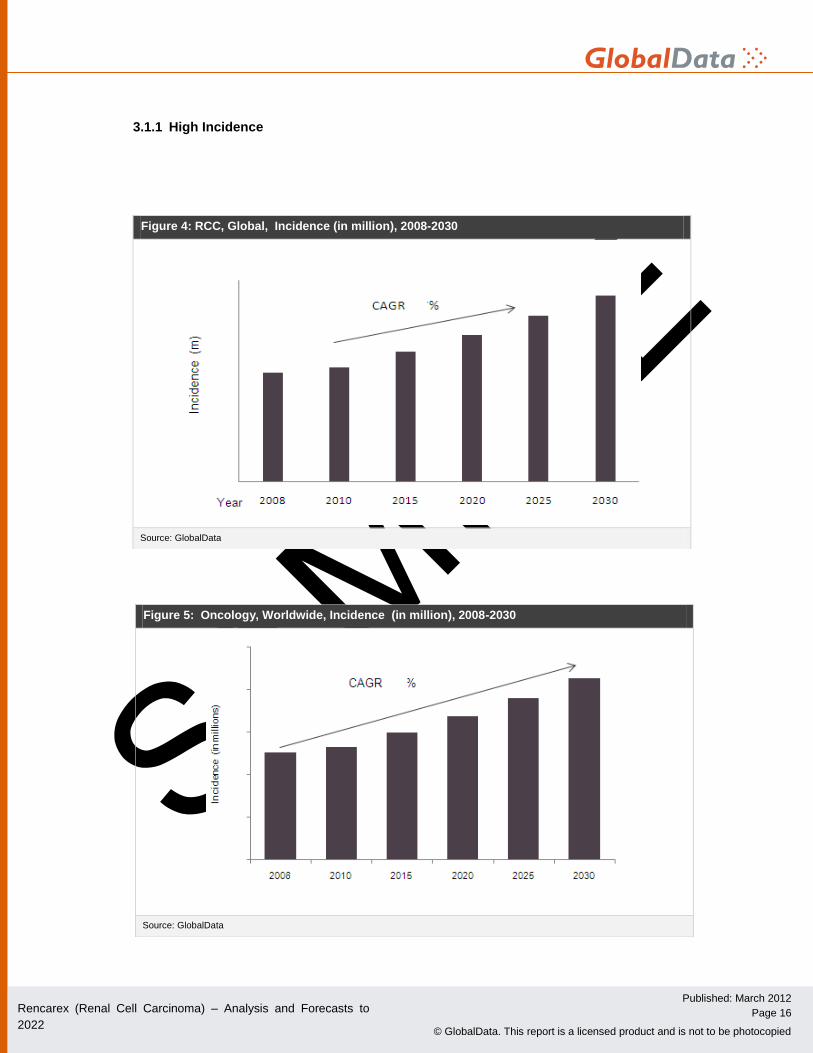
3.1.1 High Incidence
Figure 4: RCC, Global, Incidence (in million), 2008-2030
Source: GlobalData
Figure 5: Oncology, Worldwide, Incidence (in million), 2008-2030
Source: GlobalData
SAMPLE
Rencarex (Renal Cell Carcinoma) – Analysis and Forecasts to
2022
Published: March 2012
Page 17
© GlobalData. This report is a licensed product and is not to be photocopied
3.1.2 High Prevalence
3.1.3 Emergence of Targeted Therapies
3.1.4 Large Unmet Need
SAMPLE
Rencarex (Renal Cell Carcinoma) – Analysis and Forecasts to
2022
Published: March 2012
Page 18
© GlobalData. This report is a licensed product and is not to be photocopied
3.2 Tumor-Node-Metastases (TNM) Classification of RCC
3.2.1 Staging
Table 2: RCC, TNM Classification
Stages Primary Tumor (T) Regional Lymph Node (N) Distant Metastasis (M)
Primary Tumor (T)
Regional Lymph Node (N)
Distant Metastasis (M)
Source: GlobalData, American Joint Committee on Cancer
SAMPLE
Rencarex (Renal Cell Carcinoma) – Analysis and Forecasts to
2022
Published: March 2012
Page 19
© GlobalData. This report is a licensed product and is not to be photocopied
3.2.1.1 Stage I
3.2.1.2 Stage IA
3.2.1.3 Stage IB
3.2.2 Grading
Table 3: RCC, Fuhrman grading system
Grading System (G1-G3) Definition
Source: GlobalData, American Joint Committee on Cancer
3.2.3 Prognosis
SAMPLE
Rencarex (Renal Cell Carcinoma) – Analysis and Forecasts to
2022
Published: March 2012
Page 39
© GlobalData. This report is a licensed product and is not to be photocopied
5 RCC Market: Appendix
5.1 Market Definitions
The Global RCC Market: The global RCC market includes the market for the treatment of renal cell
carcinoma in seven countries namely the US, the UK, Germany, France, Spain, Italy and Japan.
The Worldwide Oncology Market: The worldwide oncology market includes the market for the treatment
of all cancers in the major countries of the world.
5.2 Abberiviations
RCC: Renal Cell Carcinoma
mRCC: Metastatic Renal Cell Carcinoma
TNM: Tumor, Nodes, Metastasis
GIST: Gastrointestinal Stromal Tumor
NSCLC: Non Small Cell Lung Cancer
CAGR: Compounded Annual Growth Rate
FDA: Food and Drug Administration
NICE: National Institute for Health and Clinical Excellence
VEGFR: Vascular Epidermal Growth Factor Receptor
PDGFR: Platelet Derived Epidermal Growth Factor Receptor
RTK: Receptor Tyrosine Kinase
IFNα: Interferon Alfa
PFS: Progression Free Survival
5.3 Research Methodology
GlobalData’s dedicated research and analysis teams consist of experienced professionals with a pedigree
in marketing and market research, consulting backgrounds in the pharmaceutical industry and advanced
statistical expertise.
GlobalData adheres to the Codes of Practice of the Market Research Society (www.mrs.org.uk) and the
Society of Competitive Intelligence Professionals (www.scip.org). All GlobalData databases are
continuously updated and revised. The following research methodology is followed for all databases and
reports.
5.3.1 Coverage
The objective of updating GlobalData’s coverage is to ensure that it represents the most up to date vision
of the industry possible.
The drug coverage is based on few key factors such as drug’s importance as a treatment option, sales
potential of the drug and its innovation potential.
GlobalData aims to cover all major marketed and late stage pipeline drugs for a particular indication. The
indications which are of particular interest or making the news are prioritized. The scope is to cover the
market and drug sales in seven major countries namely the US, the UK, Germany, France, Spain, Italy
and Japan.
5.3.2 Secondary Research
The research process begins with exhaustive secondary research on internal and external sources, being
carried out to source qualitative and quantitative information relating to each market.
The secondary research sources that are typically referred to include, but are not limited to:
Company websites, annual reports, financial reports, investor presentations and SEC Filings.
SAMPLE
Rencarex (Renal Cell Carcinoma) – Analysis and Forecasts to
2022
Published: March 2012
Page 40
© GlobalData. This report is a licensed product and is not to be photocopied
Industry trade journals, scientific journals and other technical literature;
Internal and external proprietary databases.
Relevant patent and regulatory databases.
National government documents, statistical databases and market reports;
Procedure registries.
News articles, press releases and web–casts specific to the companies operating in the market.
5.3.3 Forecasting
GlobalData uses a comprehensive epidemiology-based treatment flow model that uses drug risk benefit
score and competition intensity to forecast sales of a drug for a particular therapeutic indication.
GlobalData reports cover seven major geographies, namely the US, the UK, Germany, France, Spain,
Italy and Japan. The forecasting model used at GlobalData gathers data from various secondary sources.
The drug sales are calculated as the product of number of patients who are taking the drug and annual
cost of therapy.
Annual Drug Sales = Number of patient taking the drug * Annual cost of therapy
The number of patients taking the drug can be calculated as below
Number of patients taking the drug = Drug Market Penetration * Number of Patients approved to take the
drug
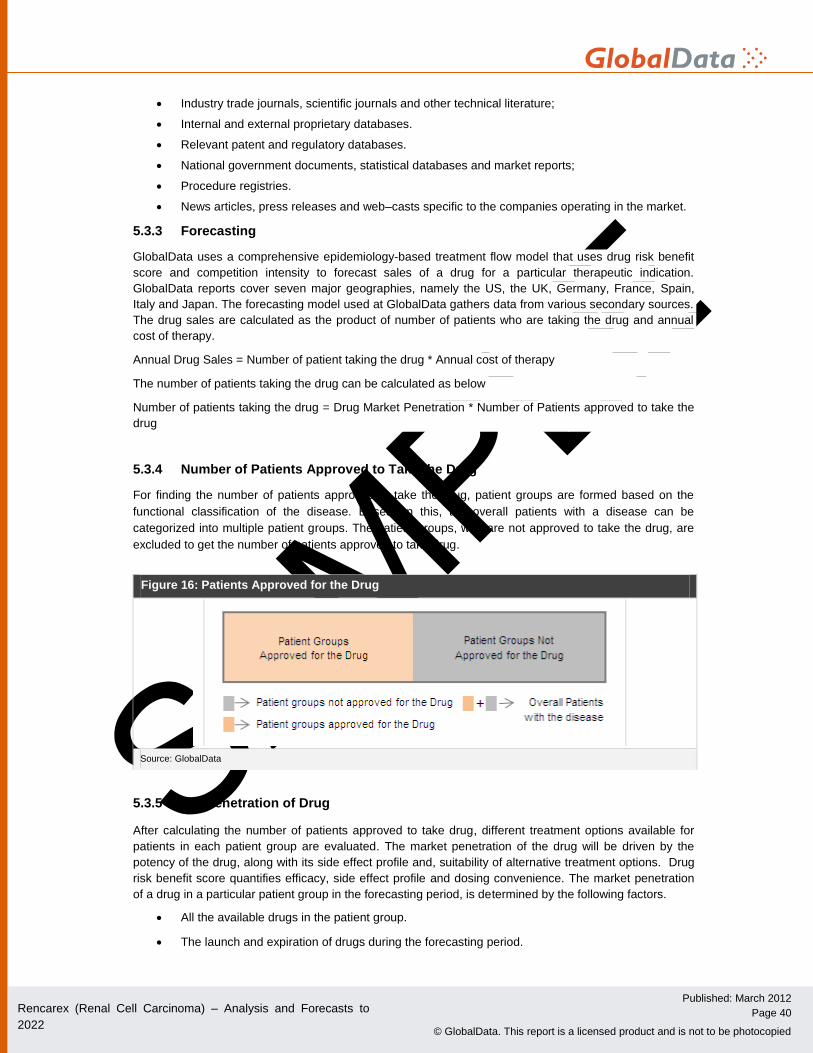
5.3.4 Number of Patients Approved to Take the Drug
For finding the number of patients approved to take the drug, patient groups are formed based on the
functional classification of the disease. Based on this, the overall patients with a disease can be
categorized into multiple patient groups. The patient groups, who are not approved to take the drug, are
excluded to get the number of patients approved to take drug.
5.3.5 Net Penetration of Drug
After calculating the number of patients approved to take drug, different treatment options available for
patients in each patient group are evaluated. The market penetration of the drug will be driven by the
potency of the drug, along with its side effect profile and, suitability of alternative treatment options. Drug
risk benefit score quantifies efficacy, side effect profile and dosing convenience. The market penetration
of a drug in a particular patient group in the forecasting period, is determined by the following factors.
All the available drugs in the patient group.
The launch and expiration of drugs during the forecasting period.
Figure 16: Patients Approved for the Drug
Source: GlobalData
SAMPLE
Rencarex (Renal Cell Carcinoma) – Analysis and Forecasts to
2022
Published: March 2012
Page 41
© GlobalData. This report is a licensed product and is not to be photocopied
The potency of the drug along with its side effect profile and suitability of alternative treatment
options.
An analogous forecasting methodology is used to account for the introduction of new products, the patent
expiries of branded products and the subsequent introduction of generics.
5.3.6 Net Annual Dosing
Annual dosing of the drug is calculated by multiplying the recommended dosage of the drug with the
treatment regimen.
5.3.7 Annual Cost of Therapy
The annual cost of therapy is the product of net annual dosing and the price per unit of the drug.
Annual Cost of Therapy = Net Annual Dosing * Price per Unit of Drug.
5.4 Drug Sales Estimates Model
Drug sales reports are supported by a comprehensive patient based model, which provides detailed
information on key inputs including prevalence rates, market penetration, and annual cost of therapy. The
model also includes a unique methodology to evaluate a drug based on its efficacy, safety and other
parameters, which are key determiners of a drug’s success, and evaluates potential competition that the
drug might face during its lifecycle. The drug model also has an inbuilt interactive tool to allow users to
input their own assumptions such as market penetration and annual cost of therapy to arrive at their own
estimates of sales. This model is available as a part of subscription to GlobalData's Pharma eTrack.
5.5 Disclaimer
All Rights Reserved.
No part of this publication may be reproduced, stored in a retrieval system or transmitted in any form by
any means, electronic, mechanical, photocopying, recording or otherwise, without the prior permission of
the publisher, GlobalData.
5.6 Sources
Pfizer Pharmaceuticals website (http://www.pfizer.com/home/)
Annual reports of Pfizer Pharmaceuticals
American Association of Urology (http://www.auanet.org/)
European Association of Urology (http:/www.uroweb.org/)
Globocan (http://www-dep.iarc.fr/)
Cancer Journal of Clinicians (http://caonline.amcancersoc.org/)
Cancer Research UK (http://caonline.amcancersoc.org/)
American Cancer Society (www.cancer.org/)
http://jnci.oxfordjournals.org
www.fda.gov
http://www.clinicaltrials.gov/
www.rxlist.com