renaissance jewellery ltd. corporate presentation · about renaissance jewellery ltd •...
TRANSCRIPT
Renaissance Jewellery Ltd.Corporate Presentation
FY 2015
Table of Contents
1. About Renaissance Jewellery Ltd
2. Financial Snapshot
3. Jewellery Segment
4. Home Retail Segment
5. Management Team
2

About Renaissance Jewellery Ltd
About Renaissance Jewellery Ltd
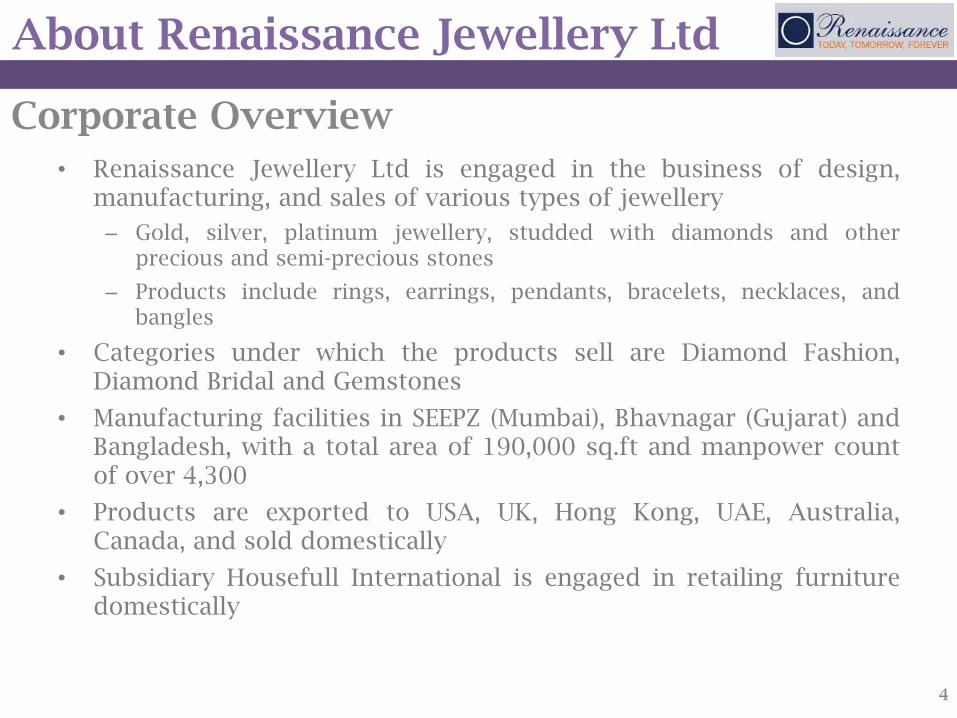
• Renaissance Jewellery Ltd is engaged in the business of design,manufacturing, and sales of various types of jewellery
– Gold, silver, platinum jewellery, studded with diamonds and otherprecious and semi-precious stones
– Products include rings, earrings, pendants, bracelets, necklaces, andbangles
• Categories under which the products sell are Diamond Fashion,Diamond Bridal and Gemstones
• Manufacturing facilities in SEEPZ (Mumbai), Bhavnagar (Gujarat) andBangladesh, with a total area of 190,000 sq.ft and manpower countof over 4,300
• Products are exported to USA, UK, Hong Kong, UAE, Australia,Canada, and sold domestically
• Subsidiary Housefull International is engaged in retailing furnituredomestically
Corporate Overview
4
About Renaissance Jewellery Ltd
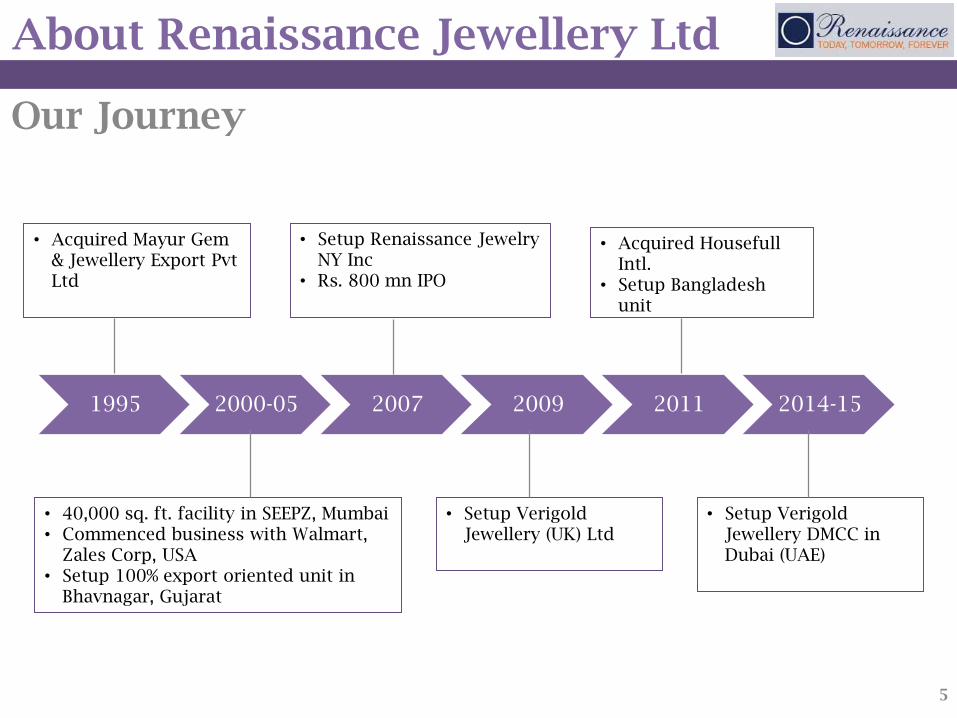
Our Journey
1995 2000-05 2007 2009 2011 2014-15
• Acquired Mayur Gem & Jewellery Export Pvt Ltd
• 40,000 sq. ft. facility in SEEPZ, Mumbai• Commenced business with Walmart,
Zales Corp, USA• Setup 100% export oriented unit in
Bhavnagar, Gujarat
• Setup Renaissance Jewelry NY Inc
• Rs. 800 mn IPO
• Setup Verigold Jewellery (UK) Ltd
• Acquired Housefull Intl.
• Setup Bangladesh unit
• Setup Verigold Jewellery DMCC in Dubai (UAE)
5
About Renaissance Jewellery Ltd
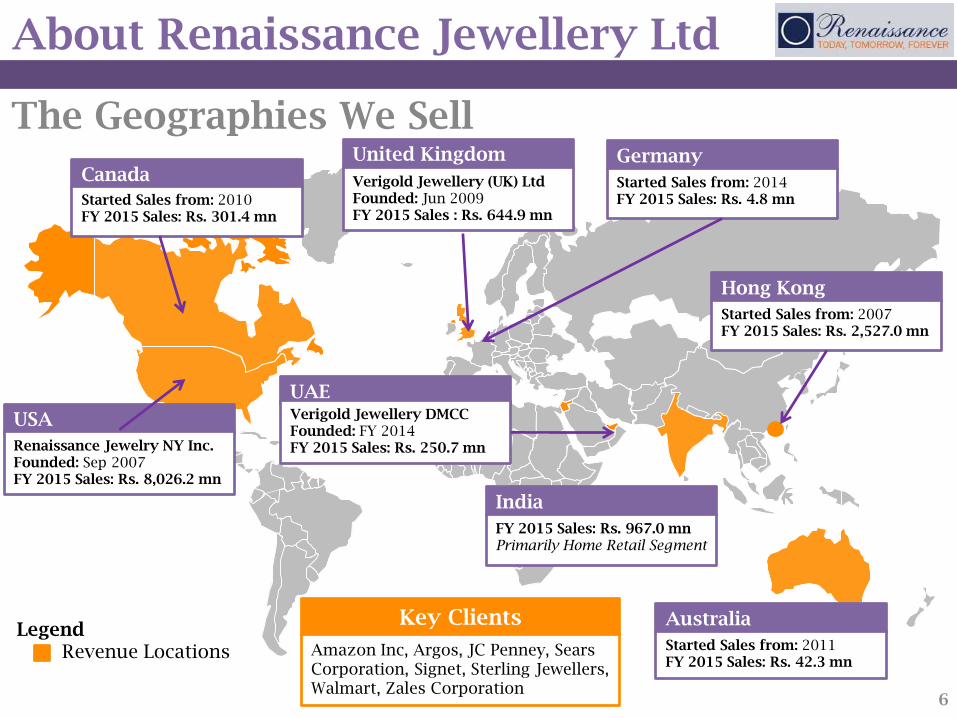
The Geographies We Sell
LegendRevenue Locations
USA
Renaissance Jewelry NY Inc.Founded: Sep 2007FY 2015 Sales: Rs. 8,026.2 mn
Canada
Started Sales from: 2010FY 2015 Sales: Rs. 301.4 mn
United Kingdom
Verigold Jewellery (UK) LtdFounded: Jun 2009FY 2015 Sales : Rs. 644.9 mn
India
FY 2015 Sales: Rs. 967.0 mnPrimarily Home Retail Segment
Hong Kong
Started Sales from: 2007FY 2015 Sales: Rs. 2,527.0 mn
UAEVerigold Jewellery DMCCFounded: FY 2014FY 2015 Sales: Rs. 250.7 mn
Australia
Started Sales from: 2011FY 2015 Sales: Rs. 42.3 mn
6
Germany
Started Sales from: 2014FY 2015 Sales: Rs. 4.8 mn
Key Clients
Amazon Inc, Argos, JC Penney, Sears Corporation, Signet, Sterling Jewellers, Walmart, Zales Corporation
About Renaissance Jewellery Ltd
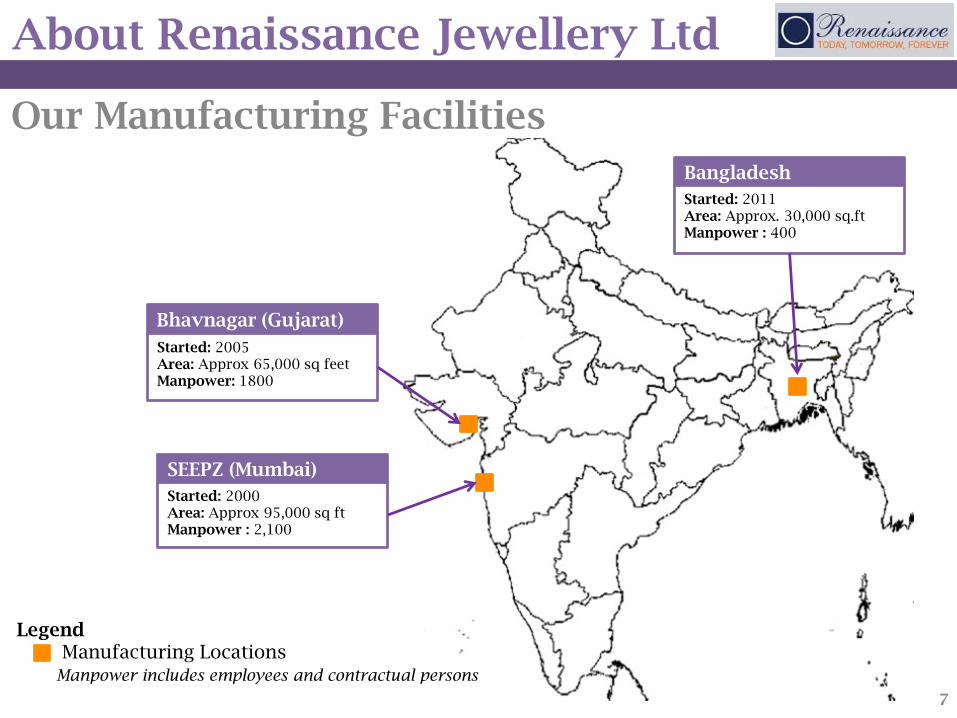
Our Manufacturing Facilities
LegendManufacturing Locations
Manpower includes employees and contractual persons
SEEPZ (Mumbai)
Started: 2000Area: Approx 95,000 sq ftManpower : 2,100
7
Bhavnagar (Gujarat)
Started: 2005Area: Approx 65,000 sq feetManpower: 1800
Bangladesh
Started: 2011Area: Approx. 30,000 sq.ftManpower : 400
About Renaissance Jewellery Ltd
• The IMF expects global GDP to grow by 3.8% in 2016
– US and UK expected to grow at 3.1% and 2.3% respectively; Indiaat 7.5%
– This, along with lower oil prices, will lead to higher disposableincomes in key markets, increasing demand for Jewellery
• The value of the sector is expected to grow at the CAGR of over 5%over the next five years with revenues of over $257 billion by 2017(1)
• The market is predominantly driven by the Asia Pacific and theMiddle Eastern markets, but U.S. continues to remain the dominantplayer in the industry
• The gems and jewellery sector contributes about 6-7% to Indian GDP
• The sector contributed $40 billion towards Indian’s foreign exchangeearnings in FY2015(2)
Market Size and Opportunity
(1) Global Gems and Jewellery Market Forecast & Opportunities-2018(2) Gem Jewellery Export Promotion Council
8
Financial Snapshot
Financial Snapshot
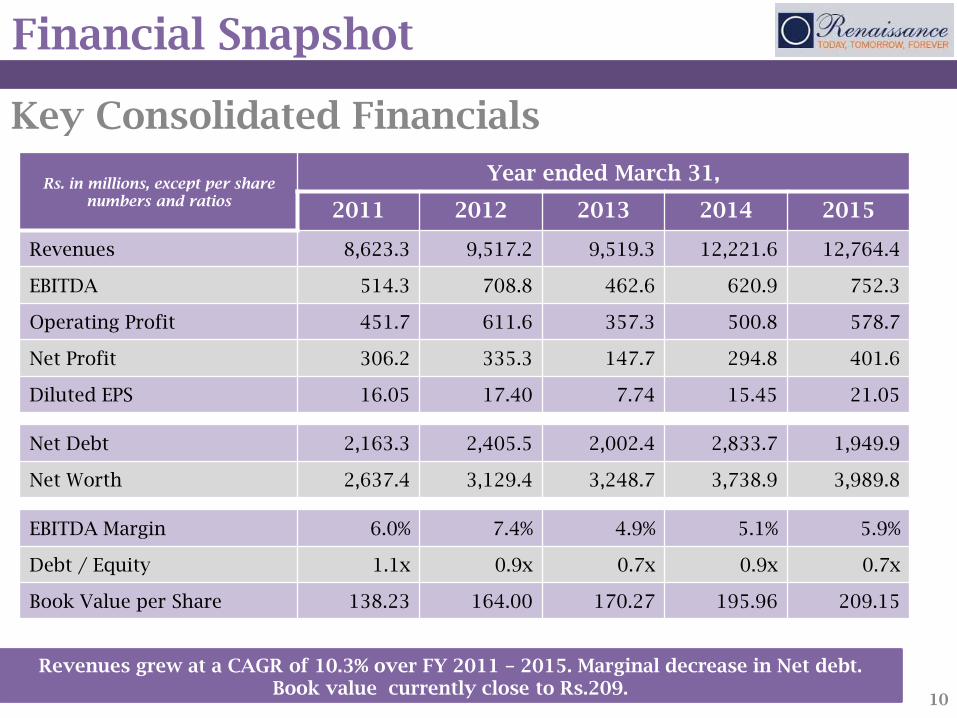
Rs. in millions, except per share numbers and ratios
Year ended March 31,
2011 2012 2013 2014 2015
Revenues 8,623.3 9,517.2 9,519.3 12,221.6 12,764.4
EBITDA 514.3 708.8 462.6 620.9 752.3
Operating Profit 451.7 611.6 357.3 500.8 578.7
Net Profit 306.2 335.3 147.7 294.8 401.6
Diluted EPS 16.05 17.40 7.74 15.45 21.05
Net Debt 2,163.3 2,405.5 2,002.4 2,833.7 1,949.9
Net Worth 2,637.4 3,129.4 3,248.7 3,738.9 3,989.8
EBITDA Margin 6.0% 7.4% 4.9% 5.1% 5.9%
Debt / Equity 1.1x 0.9x 0.7x 0.9x 0.7x
Book Value per Share 138.23 164.00 170.27 195.96 209.15
Key Consolidated Financials
10
Revenues grew at a CAGR of 10.3% over FY 2011 – 2015. Marginal decrease in Net debt. Book value currently close to Rs.209.
Financial Snapshot
Segmental Financials
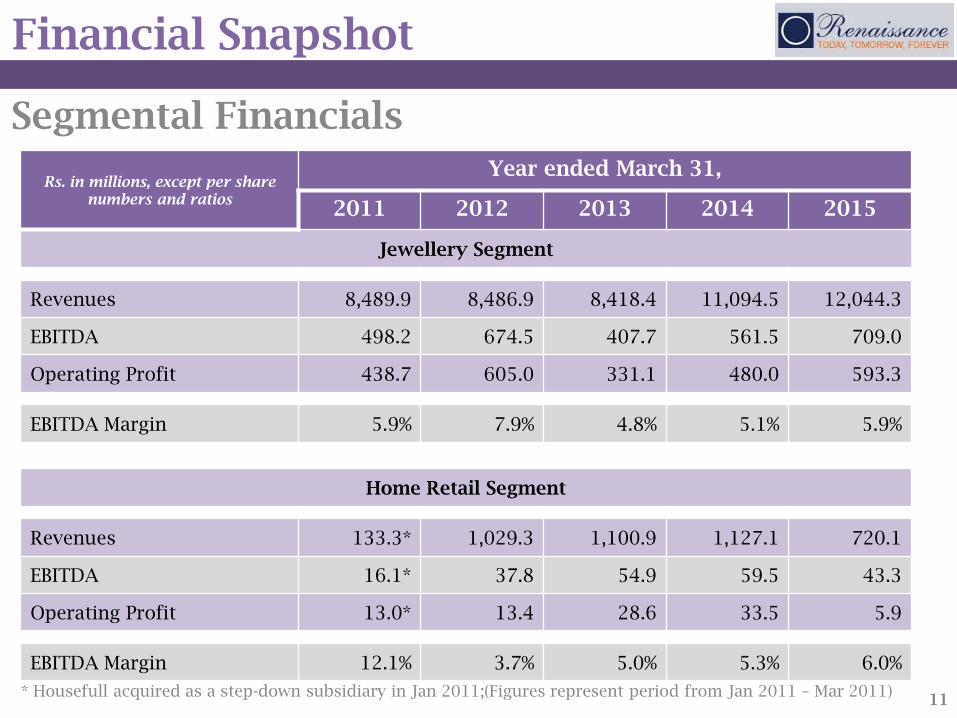
Rs. in millions, except per share numbers and ratios
Year ended March 31,
2011 2012 2013 2014 2015
Jewellery Segment
Revenues 8,489.9 8,486.9 8,418.4 11,094.5 12,044.3
EBITDA 498.2 674.5 407.7 561.5 709.0
Operating Profit 438.7 605.0 331.1 480.0 593.3
EBITDA Margin 5.9% 7.9% 4.8% 5.1% 5.9%
Home Retail Segment
Revenues 133.3* 1,029.3 1,100.9 1,127.1 720.1
EBITDA 16.1* 37.8 54.9 59.5 43.3
Operating Profit 13.0* 13.4 28.6 33.5 5.9
EBITDA Margin 12.1% 3.7% 5.0% 5.3% 6.0%
11* Housefull acquired as a step-down subsidiary in Jan 2011;(Figures represent period from Jan 2011 – Mar 2011)
Financial Snapshot
• Sales grew by 4.4% over 2014. This was mainly due to
• Increased focus towards profitability, hence rejecting certain lowmargin business, leading to flattish sales growth and improvedmargins
• EBITDA margins increased to 5.9% in 2015 from 5.1% in 2014
• Better mix of geographical sales- margins in Europe are higher
• Manufacturing costs are in rupees. Stable dollar in the 61-64 range, led toimproved margins
• Efficient working capital / inventory management
• Net Debt has reduced from ~Rs.2800 mn to ~ Rs.1950 mn due to efficientcash and inventory management
• Renewed thrust to sell unsold goods at sales subsidiaries at marginal lossrather than melting these goods
Analysis for FY2015
12
Jewellery Segment
Jewellery Segment
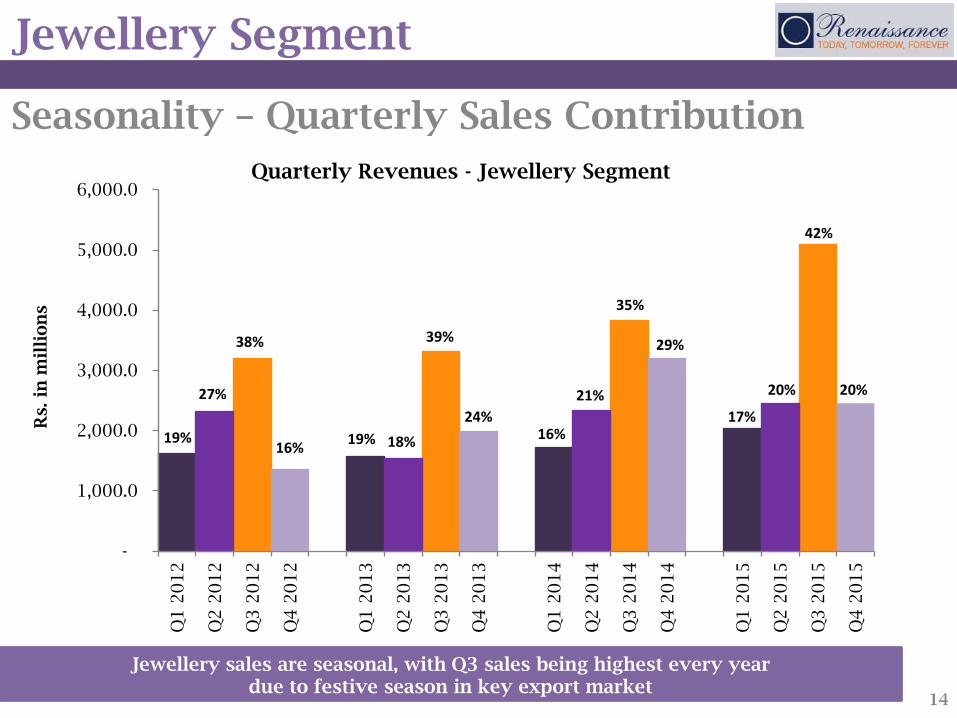
Seasonality – Quarterly Sales Contribution
Jewellery sales are seasonal, with Q3 sales being highest every year due to festive season in key export market
14
-
1,000.0
2,000.0
3,000.0
4,000.0
5,000.0
6,000.0Q
1 2
01
2
Q2
20
12
Q3
20
12
Q4
20
12
Q1
20
13
Q2
20
13
Q3
20
13
Q4
20
13
Q1
20
14
Q2
20
14
Q3
20
14
Q4
20
14
Q1
20
15
Q2
20
15
Q3
20
15
Q4
20
15
Rs. in
mil
lion
s
Quarterly Revenues - Jewellery Segment
19%
27%
38%
16%19% 18%
39%
24%16%
21%
35%
29%
17%
20%
42%
20%
Jewellery Segment
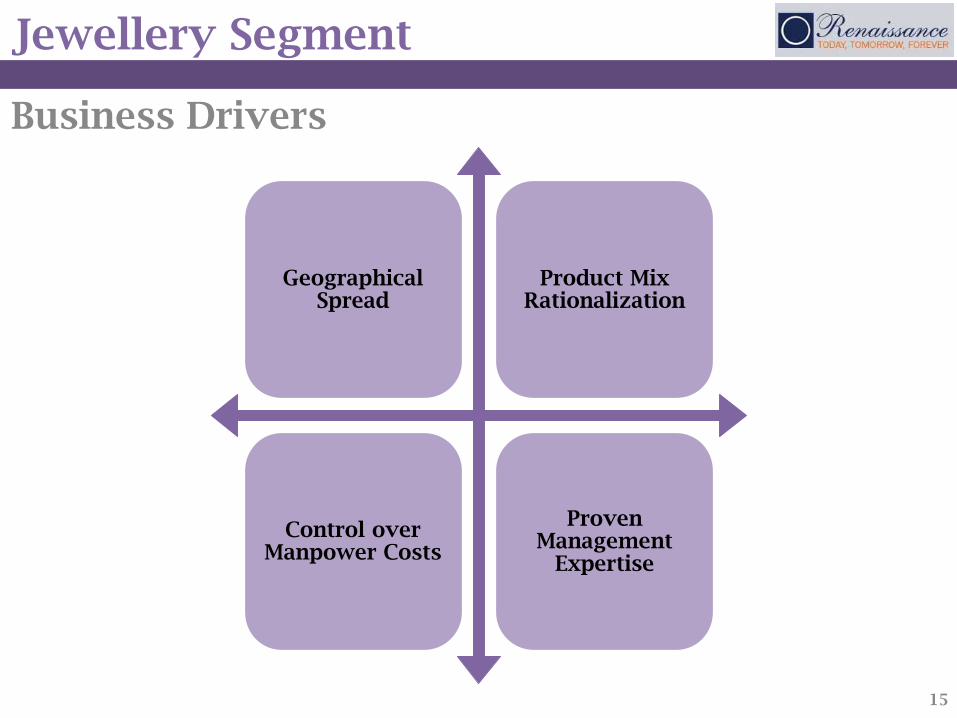
Business Drivers
Geographical Spread
Product Mix Rationalization
Control over Manpower Costs
Proven Management
Expertise
15
Jewellery Segment
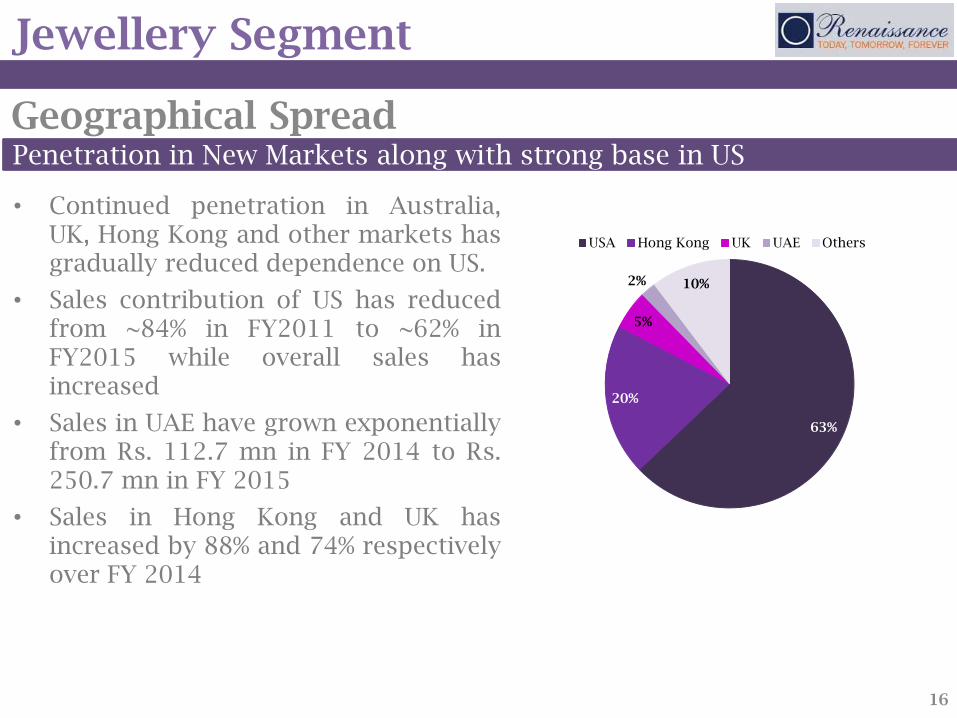
Geographical Spread
• Continued penetration in Australia,UK, Hong Kong and other markets hasgradually reduced dependence on US.
• Sales contribution of US has reducedfrom ~84% in FY2011 to ~62% inFY2015 while overall sales hasincreased
• Sales in UAE have grown exponentiallyfrom Rs. 112.7 mn in FY 2014 to Rs.250.7 mn in FY 2015
• Sales in Hong Kong and UK hasincreased by 88% and 74% respectivelyover FY 2014
16
Penetration in New Markets along with strong base in US
63%
20%
5%
2% 10%
USA Hong Kong UK UAE Others
Jewellery Segment
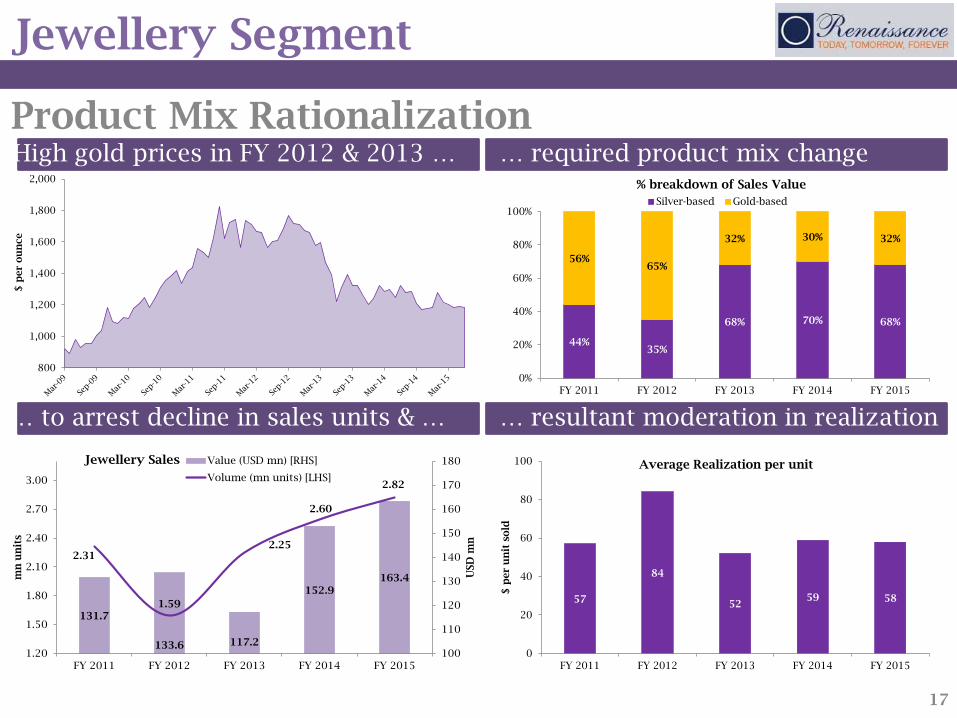
Product Mix RationalizationHigh gold prices in FY 2012 & 2013 … … required product mix change
… resultant moderation in realization… to arrest decline in sales units & …
17
800
1,000
1,200
1,400
1,600
1,800
2,000
$ p
er
ou
nce
44%35%
68% 70% 68%
56%65%
32% 30% 32%
0%
20%
40%
60%
80%
100%
FY 2011 FY 2012 FY 2013 FY 2014 FY 2015
% breakdown of Sales Value
Silver-based Gold-based
131.7
133.6 117.2
152.9
163.4
2.31
1.59
2.25
2.60
2.82
100
110
120
130
140
150
160
170
180
1.20
1.50
1.80
2.10
2.40
2.70
3.00
FY 2011 FY 2012 FY 2013 FY 2014 FY 2015
USD
mn
mn
un
its
Jewellery Sales Value (USD mn) [RHS]
Volume (mn units) [LHS]
57
84
5259 58
0
20
40
60
80
100
FY 2011 FY 2012 FY 2013 FY 2014 FY 2015
$ p
er
un
it s
old
Average Realization per unit
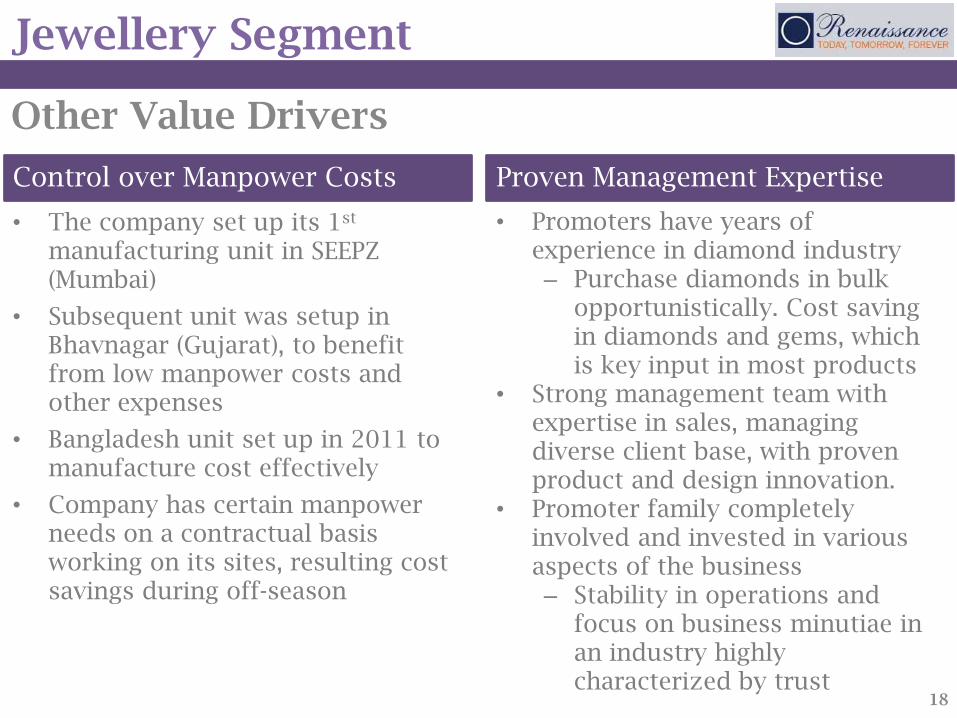
• The company set up its 1st
manufacturing unit in SEEPZ (Mumbai)
• Subsequent unit was setup in Bhavnagar (Gujarat), to benefit from low manpower costs and other expenses
• Bangladesh unit set up in 2011 to manufacture cost effectively
• Company has certain manpower needs on a contractual basis working on its sites, resulting cost savings during off-season
• Promoters have years of experience in diamond industry– Purchase diamonds in bulk
opportunistically. Cost saving in diamonds and gems, which is key input in most products
• Strong management team with expertise in sales, managing diverse client base, with proven product and design innovation.
• Promoter family completely involved and invested in various aspects of the business– Stability in operations and
focus on business minutiae in an industry highly characterized by trust
Jewellery Segment
Other Value Drivers
Control over Manpower Costs Proven Management Expertise
18
Jewellery Segment
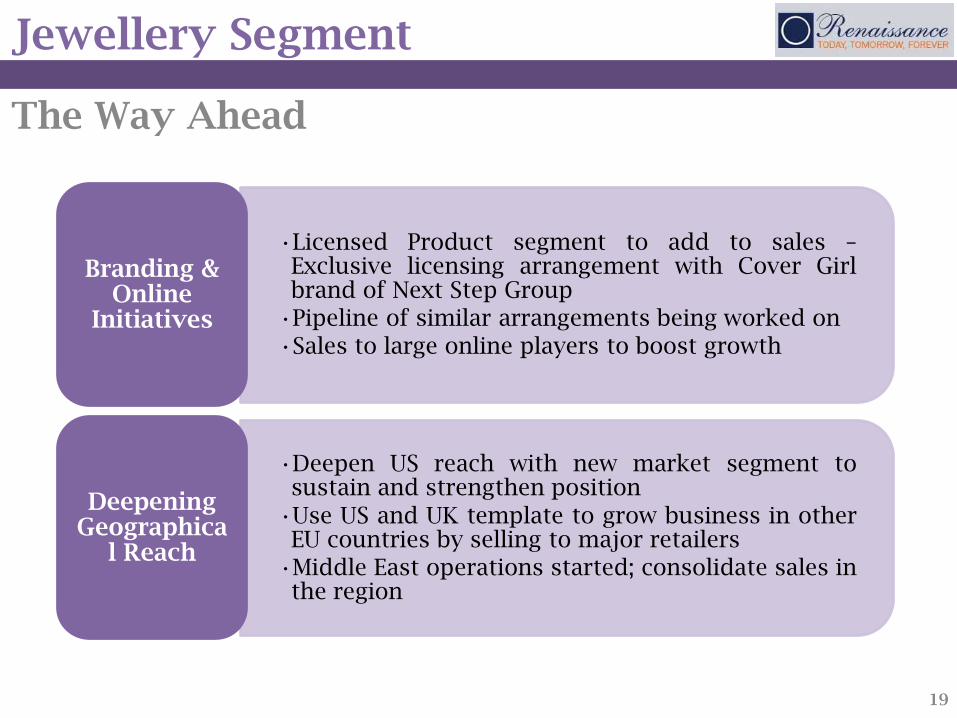
The Way Ahead
19
•Licensed Product segment to add to sales –Exclusive licensing arrangement with Cover Girlbrand of Next Step Group
•Pipeline of similar arrangements being worked on
•Sales to large online players to boost growth
Branding & Online
Initiatives
•Deepen US reach with new market segment tosustain and strengthen position
•Use US and UK template to grow business in otherEU countries by selling to major retailers
•Middle East operations started; consolidate sales inthe region
Deepening Geographica
l Reach
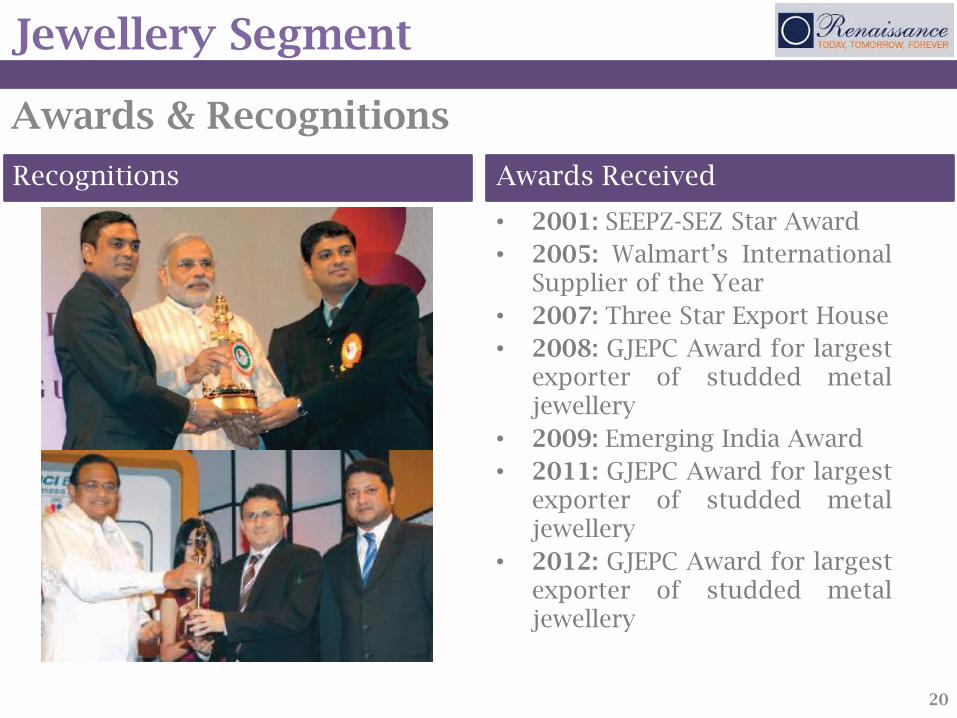
• 2001: SEEPZ-SEZ Star Award
• 2005: Walmart’s InternationalSupplier of the Year
• 2007: Three Star Export House
• 2008: GJEPC Award for largestexporter of studded metaljewellery
• 2009: Emerging India Award
• 2011: GJEPC Award for largestexporter of studded metaljewellery
• 2012: GJEPC Award for largestexporter of studded metaljewellery
Jewellery Segment
Awards & Recognitions
Recognitions Awards Received
20

Home Retail Segment
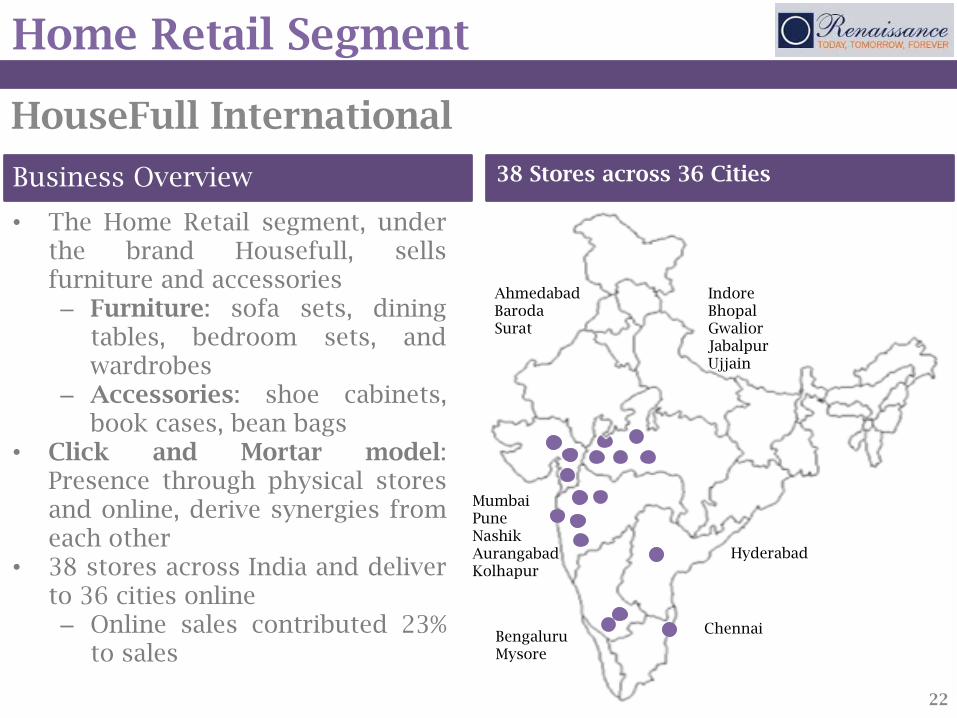
• The Home Retail segment, underthe brand Housefull, sellsfurniture and accessories– Furniture: sofa sets, dining
tables, bedroom sets, andwardrobes
– Accessories: shoe cabinets,book cases, bean bags
• Click and Mortar model:Presence through physical storesand online, derive synergies fromeach other
• 38 stores across India and deliverto 36 cities online– Online sales contributed 23%
to sales
Home Retail Segment
HouseFull International
Business Overview 38 Stores across 36 Cities
22
AhmedabadBarodaSurat
MumbaiPuneNashikAurangabadKolhapur
BengaluruMysore
Chennai
Hyderabad
IndoreBhopalGwaliorJabalpurUjjain
Home Retail Segment
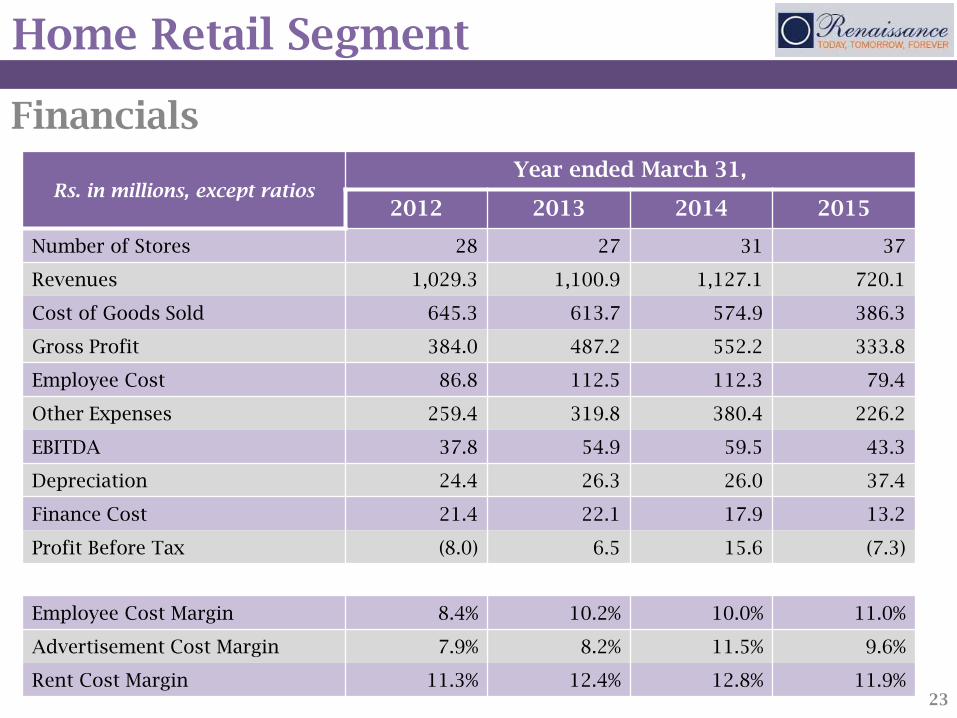
Financials
Rs. in millions, except ratiosYear ended March 31,
2012 2013 2014 2015
Number of Stores 28 27 31 37
Revenues 1,029.3 1,100.9 1,127.1 720.1
Cost of Goods Sold 645.3 613.7 574.9 386.3
Gross Profit 384.0 487.2 552.2 333.8
Employee Cost 86.8 112.5 112.3 79.4
Other Expenses 259.4 319.8 380.4 226.2
EBITDA 37.8 54.9 59.5 43.3
Depreciation 24.4 26.3 26.0 37.4
Finance Cost 21.4 22.1 17.9 13.2
Profit Before Tax (8.0) 6.5 15.6 (7.3)
Employee Cost Margin 8.4% 10.2% 10.0% 11.0%
Advertisement Cost Margin 7.9% 8.2% 11.5% 9.6%
Rent Cost Margin 11.3% 12.4% 12.8% 11.9%23
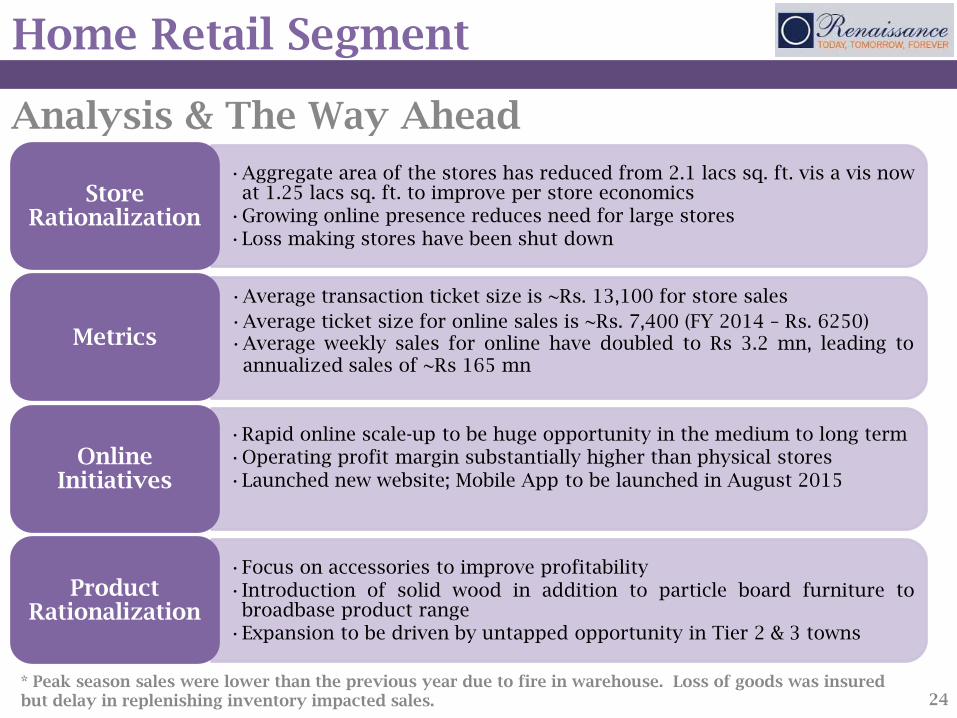
Home Retail Segment
Analysis & The Way Ahead
24
•Aggregate area of the stores has reduced from 2.1 lacs sq. ft. vis a vis nowat 1.25 lacs sq. ft. to improve per store economics
•Growing online presence reduces need for large stores
•Loss making stores have been shut down
Store Rationalization
•Average transaction ticket size is ~Rs. 13,100 for store sales
•Average ticket size for online sales is ~Rs. 7,400 (FY 2014 – Rs. 6250)•Average weekly sales for online have doubled to Rs 3.2 mn, leading to
annualized sales of ~Rs 165 mn
Metrics
•Rapid online scale-up to be huge opportunity in the medium to long term
•Operating profit margin substantially higher than physical stores
•Launched new website; Mobile App to be launched in August 2015Online
Initiatives
•Focus on accessories to improve profitability
•Introduction of solid wood in addition to particle board furniture tobroadbase product range
•Expansion to be driven by untapped opportunity in Tier 2 & 3 towns
Product Rationalization
* Peak season sales were lower than the previous year due to fire in warehouse. Loss of goods was insured but delay in replenishing inventory impacted sales.
Management Team
Management Team
26
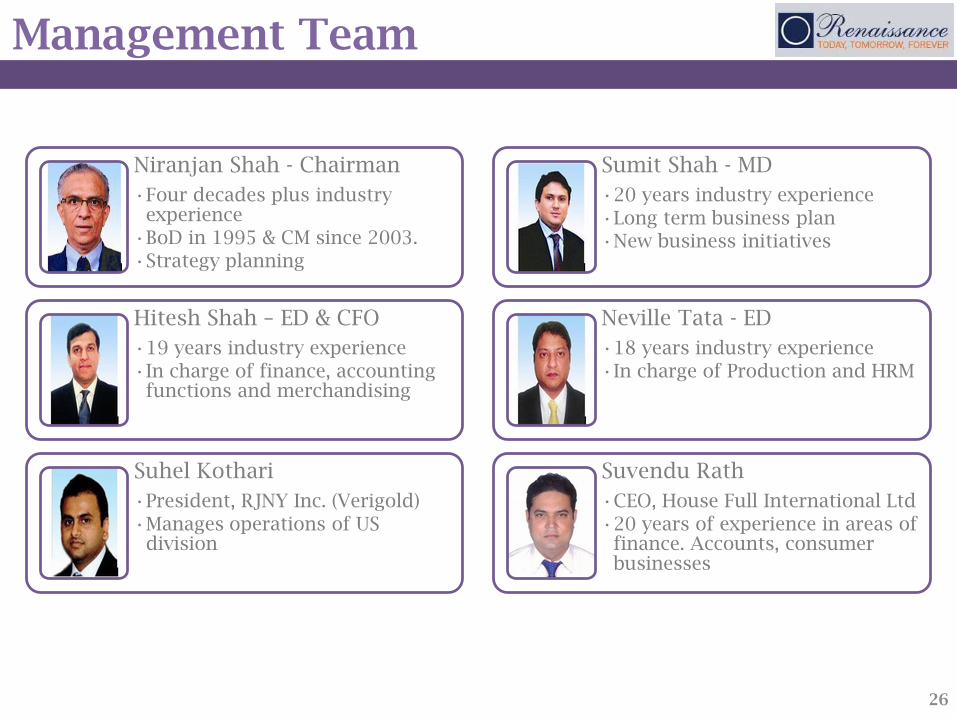
Niranjan Shah - Chairman
•Four decades plus industry experience
•BoD in 1995 & CM since 2003.
•Strategy planning
Hitesh Shah – ED & CFO
•19 years industry experience
•In charge of finance, accounting functions and merchandising
Suhel Kothari
•President, RJNY Inc. (Verigold)
•Manages operations of US division
Sumit Shah - MD
•20 years industry experience
•Long term business plan
•New business initiatives
Neville Tata - ED
•18 years industry experience
•In charge of Production and HRM
Suvendu Rath
•CEO, House Full International Ltd
•20 years of experience in areas of finance. Accounts, consumer businesses
Thank You
RENAISSANCE JEWELLERY LTD.Plot No. 36A & 37, Seepz - SEZ, Andheri (E), Mumbai - 400096. INDIATel: +91 22 40551200 Fax: +91 22 28292146Email: [email protected]
For any investor queries, please contact:
Compliance Officer G.M. WalavalkarInvestor Grievance Redressal Cell Email: [email protected]
27