remote sensing of soil moisture
TRANSCRIPT
Adv. SpaceRes.Vol. 7, No. 11, pp. (11)139—(11)145,1987 0273—1177/87$0.00+.50Printedin GreatBritain. All rights reserved. Copyright© 1987 COSPAR
REMOTE SENSING OF SOIL MOISTURE
H. L. McKim,* T. Pangburn,*J. E. Walsh** andP. J. LaPotin**
* U.S. Army Corps of Engineers, Cold Regions Researchand Engineering
Laboratory, 72 LymeRoad, Hanover,NH 03755, U.S.A.* *Departmentof Physics and Astronomy, Dartmouth College, Hanover, NH
03755, U.S.A.
BACKGROUND
The U.S. Army Corps of Engineers requires accurate hydrologic forecasts when it performs emer-gency operations during potential or actual flooding situations. These forecasts also includethe prediction and assessment of drought conditions. Current hydrometeorological data basesand techniques for interactive data usage are limited in providing a reliable real—time hydro-logic forecast capability.
Several factors related to climate, frozen ground, and regional soil moisture combine to makehydrologic forecasting difficult. Hydrologic models are normally designed to use point mea-surements of precipitation and the water equivalent of snow cover as indices of actual arealmean values. Synoptic measurements of the occurrence of frozen ground and soil moisture arepractically nonexistent.
The ability to measure soil moisture in situ is important in all water resources disciplines,and is critical in the planning, design, construction, operation and management of any systemwhere soil is a major component. The major problem in measuring soil moisture concerns thespatial inhomogeneity of a soil system, both horizontally and vertically. The number of mea-surements needed to obtain a representative moisture value is a difficult determination, as is
the location of the measurement sites.
Many field procedures have been employed to measure soil moisture in situ /8,14/. Each pro-cedure has advantages and disadvantages stemming from the complexity of the instrumentation,difficulty of instrument calibration, and the cost of data acquisition and analysis. The se-lection of a procedure should be based on how the soil moisture value is to be used. If verydetailed information is required for research modelling, one should choose a sophisticatedmeasurement technique. But in many engineering, design and operational programs a less so-phisticated sensor and procedure can be developed that will provide adequate information forhydrologic models rapidly and at low cost.
The Army requires a nondestructive technique that allows for the measurement and monitoring ofsoil moisture and temperature during changes in climatic conditions. The point sensor needsto be solid state and reliable, and should allow for interrogation via any communication sys-tem. The point data serve to calibrate airborne and satellite systems that are also beingtested. A spatial averaging procedure needs to be developed that can use the soil moistureand temperature point measurements, soil type, aspect, elevation, cover type and other param-eters to produce a soil moisture map. Corps water resource personnel could then access andmerge these data with other information on hydrologic conditions to assess flood impact.
When all constraints are considered, a sensor that relies on the moisture dependence of soilimpedance is the most convenient technique. The basic idea of relating the electrical proper-ties of soil to moisture is not new, and detailed discussions of both the merits and diffi-culties of this method exist /4,5,21/. However, a sensor that can read an electrical signaland transform it into a soil moisture value that can be easily interfaced to a system for datamonitoring and transmisson is not commercially available. Based on these considerations, asensor that measures the dielectric constant and conductivity of soil has been developed.
SYSTEM CONFIGURATION
Thenretieal ConsiderationsThe dielectric properties of soil depend on the moisture content /2,3,6,12,13,16,17,18,19,20/and a sensor designed to determine the capacitive component of soil impedance was used to mon-itor moisture changes.
In the frequency ranges of interest (0—10 MHz), the typical values of the dielectric constant(Er) for dry soils will lie between 3 and 5, while that of water will be approxixnately80. Therelative dielectric constant of the soil water mixture will vary from the dry value (3—5) upto a range of 30-40 at saturation. The addition of small amounts of water to a volume of soil
(11) 139
(11)140 H. L. McKim et a!.
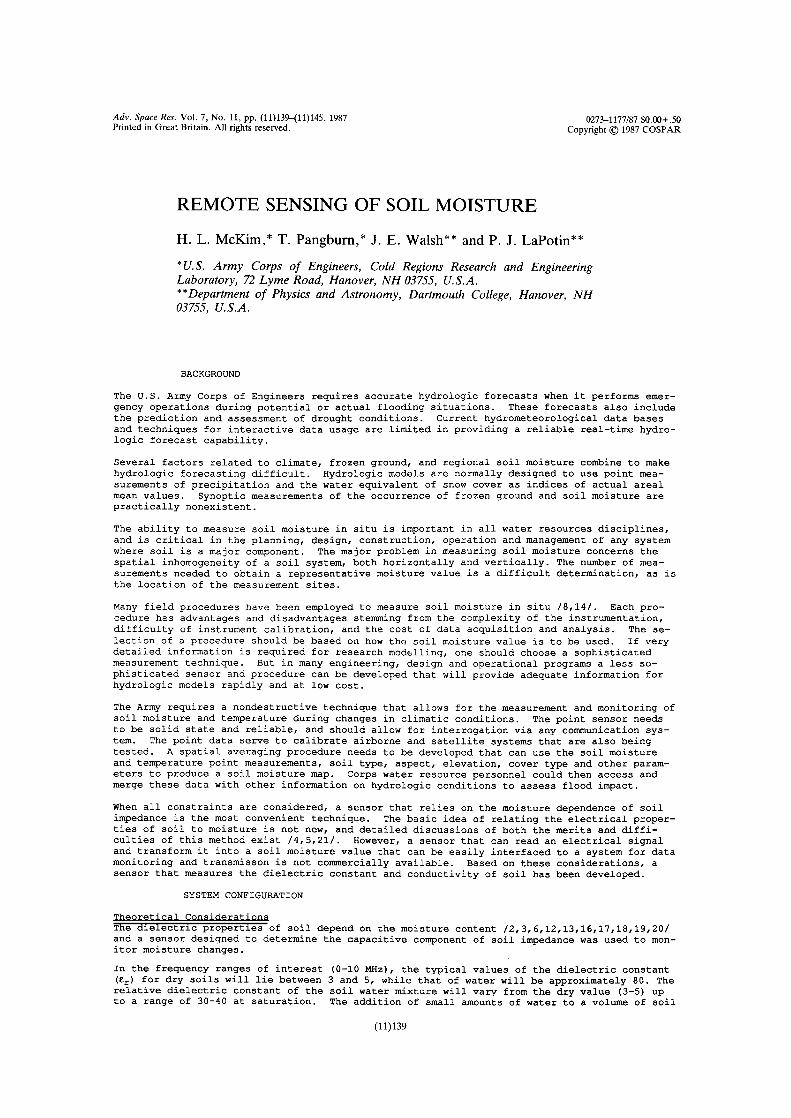
Fig. 1. Soil moisture sensor.
can be detected as an increase in the electrical energy storage capacity. This effect was thebasis of a very simple but precise soil moisture sensor.
The present sensor design consists of four electrodes that are placed in the soil (Figure 1).When a potential is applied, the soil in a known area of influence is polarized. The largerthe dielectric constant, the larger the polarization. The polarization can be measured bymeasuring the electrical capacitance:
C = Cr C0
where C is the electrical capacitance, C0 is ~.tse sensor capacitance in the absence of thesample, and Er is the dielectric constant of the material in the sample. Adding moisture in-creases Er and hence C. In principle, this is a simple device.
In practice, a number of complications arise. The material will be dispersive, and in generalthere will be more than one physical mechanism contributing to the overall relaxation. In ad-dition to the conductivity due to the dipolar relaxation, the presence of free ions will makefurther contributions to the conductivity of moist soil as well as lead to complicated elec-trode—related effects.
The dielectric constant, in the dispersive soil fabric is a frequency-dependent complex re-sponse function E(W):
E(w) Er(O)) — jEj(CO)
where:
0) = the angular frequency of the applied electric field
the real part of the dielectric response function
= the imaginary part of the dielectric response function
Physically, Er is a measure of the polarizability of the medium (energy storage) and Cj is ameasure of dipolar relaxation and conduction (energy dissipation)
When the capacitor is inserted in a material an equivalent circuit for the device becomes aparallel resistor (R) and capacitor (C) combination. Since the response of the radio fre-quency probe to free water is well understood, deviations under conditions of extreme drynessand/or in complicated material will yield information about the structure of such materials.The addition of water also increases the conductivity (both intrinsic and extrinsic) of asoil. In fact the relative change of the effective resistance of the probe used in the pre-liminary research is much greater than the change in C over the same range of water concen-tration. It is important to measure both components of the sensor impedance because the largeR change can mask the smaller change in C.
Although large, observation of the change in R alone is not a good independent measure ofmoisture content. When used in conjunction with the change in C, which is proportional to theabsolute amount of water in the area of influence of the probe, it is a useful piece ofadditional information. There may also be applications where the absolute value of R is ofinterest; thus, it is better to design a probe to measure both R and C. In any real soil
Soil Moisture (11)141
there are likely to be materials which become ionic conductors in the presence of water. Thiscontributes to conductivity and to the bulk of Er but in practical situations this is general-ly negligible.
The presence of ions leads to one other complication that is not always negligible. Generallythe electrode material is impervious to the ions and hence a “layer” of ions can be formed onthe electrode. There, together with the equal and opposite “image” charge which appears inthe electrode, they form a double layer of charge. This is another parallel resistor capacit-or combination, the addition of which can greatly complicate the overall equivalent circuit ofthe sensor. In practice, however, the mass of the ions is large, their mobility is low, andthe effective spacing of the capacitive electrode layer is small (a few ionic radii) . Thismeans that both the effective capacitance and resistance of the electrode are large. At fre-quencies above the RC time constant of the electrode, the electrode capacitance of the sampleand its contribution to the total impedance is small. Unless data at low frequencies aresought for their own sake, interpretation of the sensor data is simplified by operating at afrequency above which the electrode contribution is small. The electrode contribution can bekept small by modifying the surface—to—volume ratio of the sensor. We have found that theprobe shows no evidence of electrode contributions when they are operated above a few MHz.
Basic Sensor Network
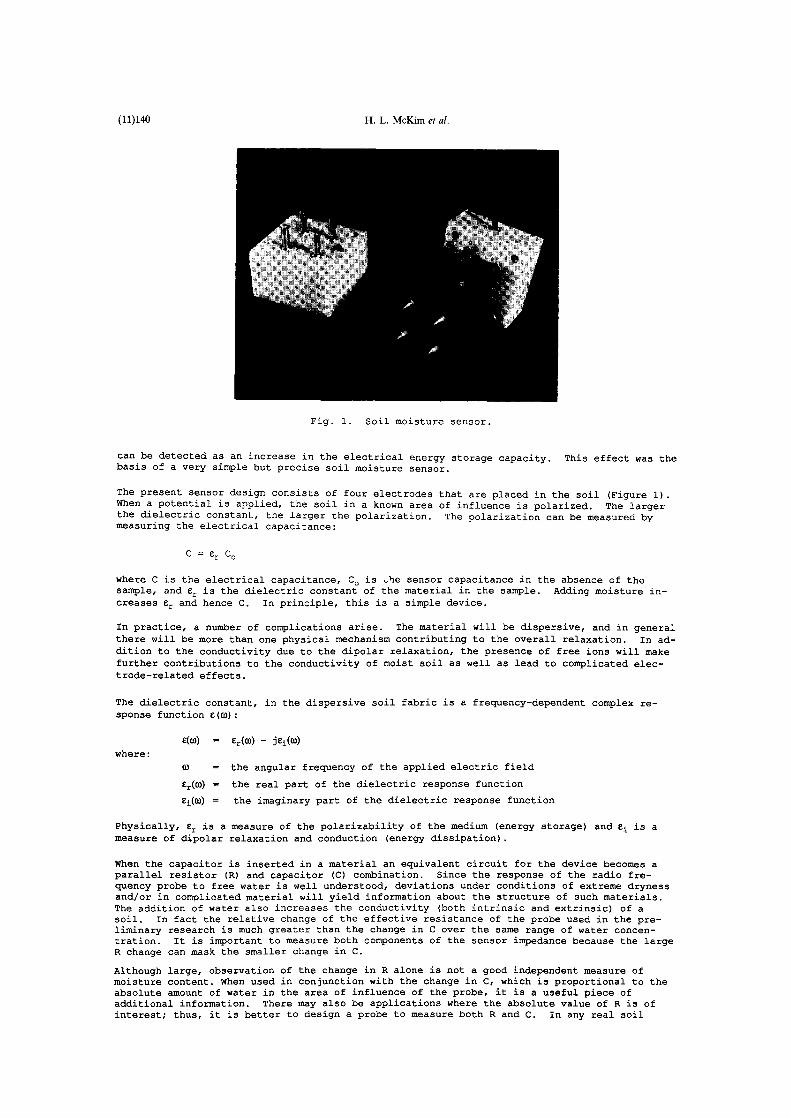
The basic Wien bridge sensor network is shown in Figure 2. The elements R and C in series arelumped components mounted in a series with one side of the actual sensor. The sensor consistsof two (or more> electrodes embeddedin soil. Since the soil—water combination stores anddissipates electrical energy, the equivalent circuit is a parallel combination R
5 and Cs.
When a voltage V1 is applied to the top of the circuit there is a voltage V2 and a frequency
(0:
0)2 = l/RR5CC5
such that V2 is in phase with V1. The voltage division at this frequency is:
v1/V2 1/(1 + R/R5 + C5/C)
Since R and C are known, measurementsof (I) and V1/V2 determine R5 and C~. C~is dependent onthe number of grams of H2O in the area of influence of the sensor.
It is implied in Figure 2 that the entire R5 is due to the soil, and operation in this mode isquite practical. It is also possible, however, to shunt the probe with a known resistanceand/or a known capacitance. A parallel resistance is desirable if R5 is very large, and to-gether with a parallel capacitance, can be used to control the range of frequency over whichmeasurementsare made. Because additional parallel elements do not change the basic principleof operation, the mechanical probe design is very flexible and can be adjusted to meet almostall field applications. We have found that it is possible to make accurate measurements with
a probe where a Wien bridge arm is made up of lumped elements and an extra electrode (a singlemetal rod) inserted in the soil. Using a voltage divider technique of this kind leads to agreat deal of flexibility in design of the readout circuitry.
PROTOTYPERADIO FREQUENCYSENSORTEST
Initial AnalvsiaIn the low frequency regime, a Wien bridge circuit was used. The resistance and capacitance
form the lower part of the bridge circuit, labeled R3 and C3, which is a capacitor that can beimplanted in the soil (Figure 2) . The resistance, R5, may be entirely due to the soil or, if
0v2
~R__
C 2_ ____
Y21:CSR
Fig. 2. Circuit of the sensor.
(11)142 H. L. McKim et al.
desired, may in part be composed of an external shunt resistance. The condition for resonance0), and the voltage division on resonance, V
1/V2, can be used to determine R5 and C5. In atest run on a silt loam soil, the relative electric susceptibility, which was proportional to
the measured change in capacitance as water was added, is approximately linear in percentmoisture. In this case a simple shift of the resonance that ignored the change in conduc-tivity would lead to a substantial error. Three different geometrical configurations weretested to ensure that the sensor was measuring a representative sample of soil water. It wasanticipated that all three would perform under freezing, thawing and unknown soil conditions.The type of sensor configuration would therefore depend only on the area of influence requiredfor the soil moisture measurement.
1.0 i i
1i~~j,oj,’~I )~~‘l’I 11111111 I 111111
Os S
— 50 —
~- (O)PoIorizabiIity.E, 5 0
~ 11 Absorption,C
1 0
• °0— S 0 • —
.• 0 •.
. 0S
5 0. 00 I •
I Illil 1 ‘III I thu1
iD~6 IO~ IO~ IO~ l0~ 0’Frequency (MHzl
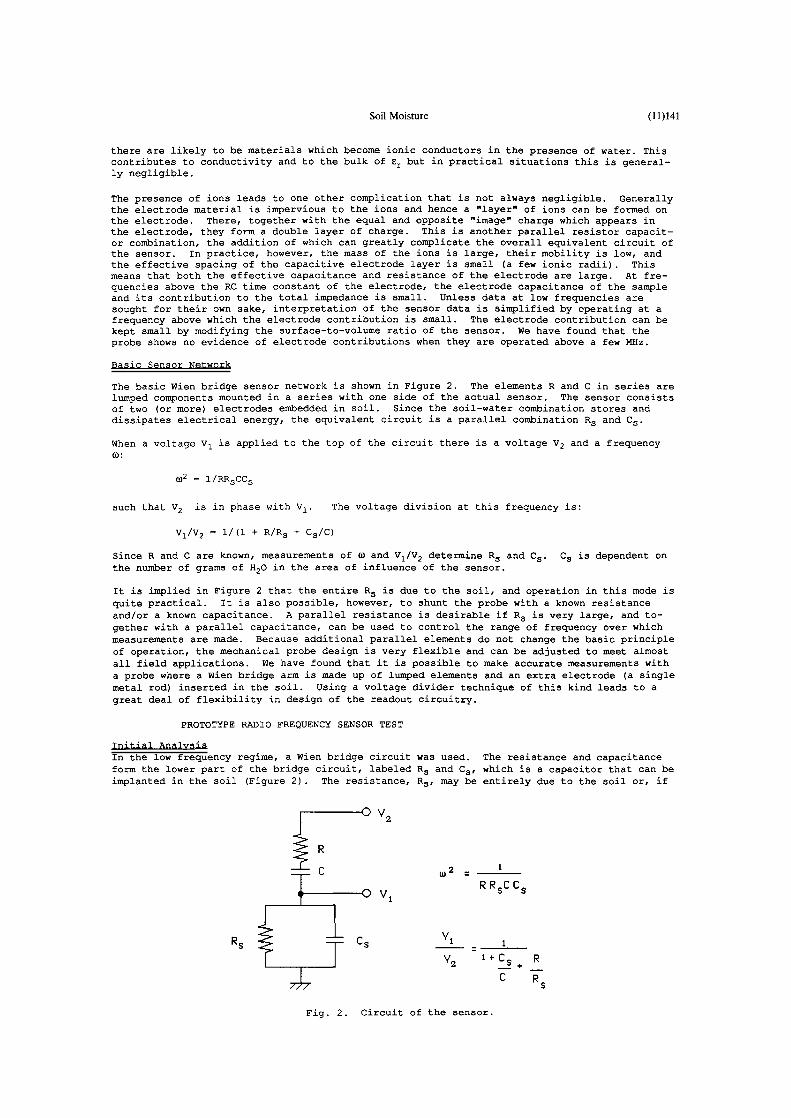
Fig. 3. Dielectric response of ice.
Detailed Laboratory TestingThe data shown in Figure 3 indicate that low frequency operation of a soil moisture sensor ispossible. This enhances the possibility of operation near the ice transition frequency andallows monitoring of moisture change near the freezing front in a soil system. A sensor ofthis type would have to operate at several different frequencies, which would introduce com-plications. However, it is possible to monitor the moisture content of partially frozen soil.
At frequencies of 1 to 20 MHz, water in its liquid state at standard temperature has a dielec-tric constant of about 80. As the temperature decreases, the dielectric constant increases toa maximum of 88 at 32°F. On freezing it drops rapidly to about 3 at —0.4°F.
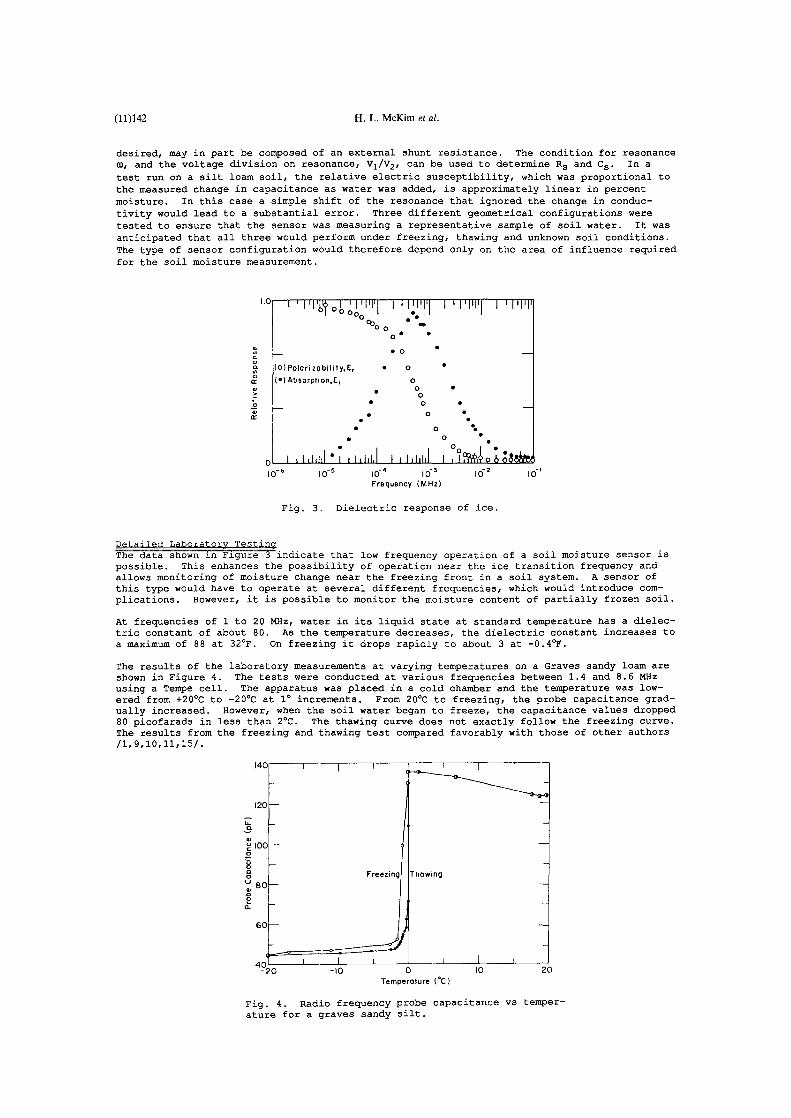
The results of the laboratory measurementsat varying temperatures on a Graves sandy loam areshown in Figure 4. The tests were conducted at various frequencies between 1.4 and 8.6 MHzusing a Tempe cell. The apparatus was placed in a cold chamber and the temperature was low-ered from +20°C to —20°Cat 1° increments. From 20°C to freezing, the probe capacitance grad-ually increased. However, when the soil water began to freeze, the capacitance values dropped80 picofarads in less than 2°C. The thawing curve does not exactly follow the freezing curve.The results from the freezing and thawing test compared favorably with those of other authors/1,9,10,11,15/.
l4(.. - I
120—
- -
~Ioo— —
Freezing Thawing
- -
60— —
4C 1-_——--_ ~1 I —-20 -10 0 10 20Temperature 1°C)
Fig. 4. Radio frequency probe capacitance vs temper-ature for a graves sandy silt.

Soil Moisture (11)143
The response of the soil moisture sensor to unfrozen water is shown in Figure 5. These soilswere chosen to provide data over a wide range of particle sizes. Three soil types —— modifiedEllsworth sandy clay (MESC), Morin clay (MOO) and Graves sandy silt (GSS) —— were selected todetermine the effect of texture on probe accuracy. The soils were chosen to represent thelargest range of soil texture types occurring in cold—dominated areas.
The results from the test indicate that the relationship between the capacitance and volumet-ric water content is linear from about 5% to saturation. However, there is an inflectionpoint at the level of 5% volumetric water content. The rapid decrease in capacitance at lowmoisture contents is probably due to the orientation of the water around individual soil par-ticles. The radio frequency soil moisture sensor is very precise and can measure very smallchanges in soil moisture. The accuracy of the sensor was found to be ±5%by volumetric watercontent under field conditions /7/.
The similar trends of the soil capacitance versus volumetric water content for the three soiltypes indicate that soil capacitance may be a useful term in physically based soil moisturemodels. The results further show that the maximum error in volumetric water content among thethree soil types is less than 5% at low moisture contents and less than 10% at close to satur-ated conditions. We know from field experiments that this difference can be decreased by mod-ifying the design of the sensor.
160
A
140
120 1
~100.
x~8O
0 60 0 CGSSA CMESCX CMOC
40 ~
20 • I • I • I
0 10 20 30 40 50
Volumetric Water Content (%)
Fig. 5. Capacitance vs volumetric water content
for three soil types.
PROCESSINGOF PROBE DATA TO MAP FORMAT
Once Soil moisture data are obtained in near real time it is possible to create a data basethat can be combined with ancillary data to prepare a soil moisture map. The sensor can beelectronically interfaced or linked to a readout which converts the measured value to a volu-metric water content and places the data into a digital data base. The data communicationssystem could be a hardwired link (RS232 port), line of sight FM radio, or an earth/satellitelink like the NOAAGOESsystem. In the U. S. Army Corps of Engineers the data are received bya host computer and placed in a data base management system called }IEC-DSS (Hydrologic Engi-neering Center - Data Storage System).
The near real time in situ soil moisture data from the radio frequency sensor are input to ageographic information system (GIS) which also contains terrain data including soil type, ele-vation and aspect, etc. These data are also stored and analyzed in the GIS for the prepara-tion of a real time soil moisture map. The map can serve as a source for calculation of soilstorage required for any model that has a soil moisture subroutine or for traffic—ability/mobility models that are used to determine how well vehicles can move in the field.
SPATIALLY AVERAGINGDATA FROMTHE SOIL MOISTURE PROBE
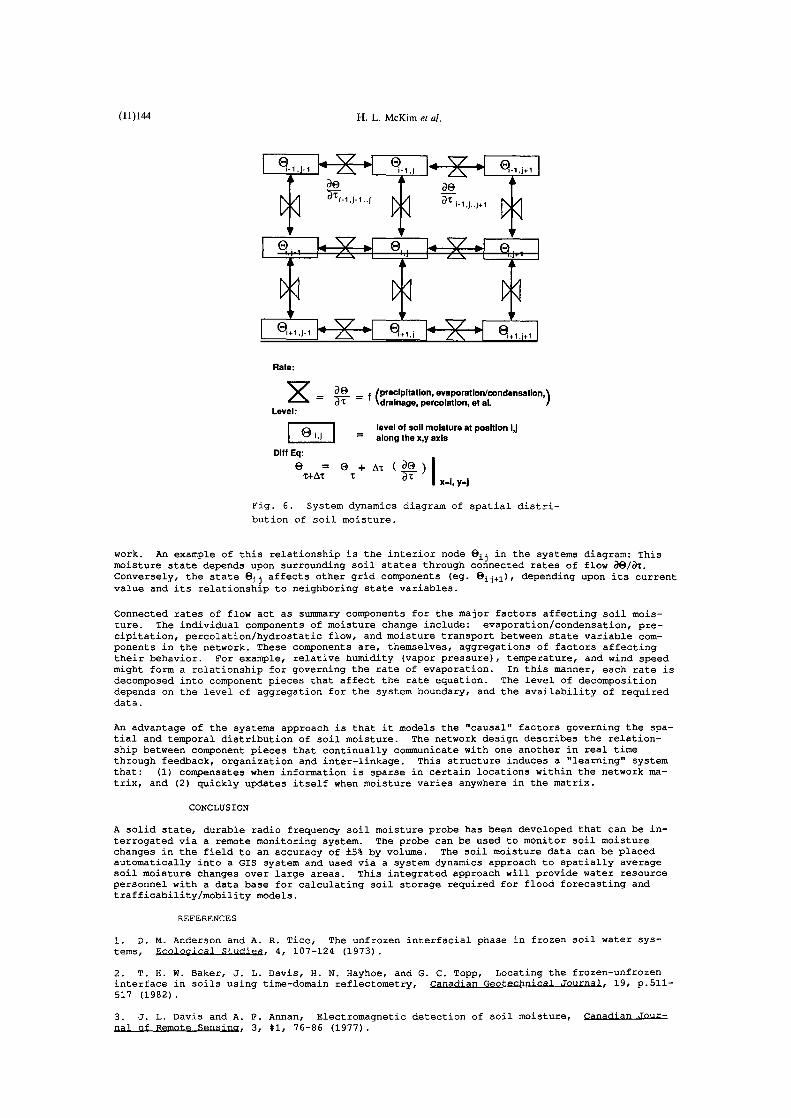
Sampling an area to determine the spatial distribution of soil moisture, in time, requires anin—depth understanding of how moisture flows within and between system boundaries. A systemboundary is determined in the initial stages of an experimental design and is dependent uponthe number of probes available and the heterogeneity of the network. In our approach, thenetwork design is simply composed of levels and rates. Levels are state variables represent-ing soil moisture at a fixed spatial location (Figure 6) . Network levels (for soil moisture)change as a function of their corresponding rates. These rates are composed of the hydro-logic factors that govern moisture flow between interconnected level components in the net—
JASS 7:t.1—J
(11)144 H. L. McKim et al.
q1, k X ~i °I,l 1’~—Z~I~ I
I ~÷~.i-i k X ‘~ ~ I~X ~i ~+1.i+1 IRate:
= — (precipitation, evaporation/condensation,at — ~dralnage,percolation, etLevel:
Olevel of soil moisture at position l,J
1,1 along the x,y axis
Diff Eq:o =
t+At t atx=i, y=J
Fig. 6. System dynamics diagram of spatial distri-
bution of soil moisture.
work. An example of this relationship is the interior node Oj~ in the systems diagram: Thismoisture state depends upon surrounding soil states through connected rates of flow ae/at.Conversely, the state
8jj affects other grid components (eg. 8ij+i)~ depending upon its current
value and its relationship to neighboring state variables.
Connected rates of flow act as summary components for the major factors affecting soil mois-ture. The individual components of moisture change include: evaporation/condensation, pre-cipitation, percolation/hydrostatic flow, and moisture transport between state variable com-ponents in the network. These components are, themselves, aggregations of factors affectingtheir behavior. For example, relative humidity (vapor pressure), temperature, and wind speedmight form a relationship for governing the rate of evaporation. In this manner, each rate isdecomposed into component pieces that affect the rate equation. The level of decompositiondepends on the level of aggregation for the system boundary, and the availability of requireddata.
An advantage of the systems approach is that it models the “causal” factors governing the spa-
tial and temporal distribution of soil moisture. The network design describes the relation-ship between component pieces that continually communicate with one another in real timethrough feedback, organization and inter-linkage. This structure induces a “learning” systemthat: (1) compensates when information is sparse in certain locations within the network ma-trix, and (2) quickly updates itself when moisture varies anywhere in the matrix.
CONCLUSION
A solid state, durable radio frequency soil moisture probe has been developed that can be in-terrogated via a remote monitoring system. The probe can be used to monitor soil moisturechanges in the field to an accuracy of ±5%by volume. The soil moisture data can be placedautomatically into a GIS system and used via a system dynamics approach to spatially averagesoil moisture changes over large areas. This integrated approach will provide water resourcepersonnel with a data base for calculating soil storage required for flood forecasting andtrafficability/mobility models.
REFERENCES
1. D. M. Anderson and A. R. Tice, The unfrozen interfacial phase in frozen soil water sys-tems, Ecological Studies, 4, 107—124 (1973)
2. T. H. W. Baker, J. L. Davis, H. N. Hayhoe, and G. C. Topp, Locating the frozen—unfrozeninterface in soils using time—domain reflectomatry, Canadian Geotechoical Journal, 19, p.511-517 (1982)
3. J. L. Davis and A. P. Annan, Electromagnetic detection of soil moisture, Canadian JOur-ET1 w449 82 m511 82 lSBTnal of Remote Sensing, 3, #1, 76—86 (1977)
Soil Moisture (11)145
4. J. B. Hasted, Aqueous dielectrics, Chapman & Hall, London, 1976.
5. J. E. Hipp, Soil electromagnetic parameters as a function of frequency, in: Proceedings.~ 62, 98—103 (1974)
6. P. Hoekstra and A. Delaney, Dielectric properties of soils at UHF and microwave frequen-cies, Journal of Geophysical Research, 79, 1699—1700 (1974)
7. H. L. McKin, J.E. Walsh, and T. Pangburn, Comparison of radio frequency, tensiometers andgravimetric soil moisture techniques, in: Proceedinos of the Third Colloquium on Planetary~ State University of New York, Buffalo 1980, p.129—135.
8. H. L. McKim and J. E. Walsh, Review of techniques for measurement of soil moisture insitu, CREEL Special Report ~ U. S. Army Cold Regions Research and Engineering Labora-tory, Hanover, New Hampshire (1980).
9. Y. Nakano, A. R. Tice, J. L. Oliphant, and T. F. Jenkins, Soil diffusivity of unsaturatedfrozen soils, in: Proceedings of the Fourth International Conference on Permafrost, NationalAcademy Press, Fairbanks, Alaska 1983, p.889—893.
10. J. L. Oliphant, A. R. Tice and Y. Nakano, Water migration due to temperature gradient infrozen soil, in: Proceedings of the Fourth International Conference on Permafrost, Fair-banks, Alaska 1983, p.95l—956.
11. D. E. Patterson and H. W. Smith, The measurement of unfrozen water content by time do-main reflectonetry: results from laboratory tests, Canadian Geotechnicsl Journal, 18, 131—144 (1981)
12. E. T. Selig end S. Mansukhani, Relationship of soil moisture to the dielectric property,in: Geotechnical Engineering Division, Proceedings of the American Society of Civil Engi-ET1 w281 489 m505 489 lSBTneers. 100, #GT8, 755—770 (1975>
13. M. W. Smith, Electromagnetic detection of water: Use of TDR on frozen soils, in: ~
ceedinos of the Third Colloquium on Planetary Water, State University of New York, Buffalo1980, p.
182—185.
14. T. J. Schmugge, T. J. Jackson and H. L. McKim, Survey of Insitu and Remote SensingMethods for Soil Moisture Determination, Satellite Hydrology, American Water Resources Assoc-iation, p.333—353 (1979)
15. A. R. Tice, J. L. Oliphant, Y. Nakano, and T. F. Jenkins, Relationship between the iceand unfrozen water phases in frozen soil as determined by pulsed nuclear magnetic resonanceand physical desorption data, CREEL Report ~ Hanover, New Hampshire (1982).
16. G. C. Topp, J. L. Davis, and A. P. Annan, Electromagnetic determination of soil watercontent: Measurements in coaxial transmission lines, Water Resources Research, 16, 574—582(1980)
17. G. C. Topp, J. L. Davis, and A. P. Annan, Electromagnetic determination of soil watercontent using TDR: I. Applications to wetting fronts and steep gradients, Soil ScienceSociety of America Journal, 46, 672—678 (1982)
18. G. C. Topp, J. L. Davis, and A. P. Annan, Electromagnetic determination of soil water
content using TDR: II. Evaluation of installation and configuration of parallel transmissionlines, Soil Science Society of America Journal, 46, 678—684 (1982)
19. J. R. Wang, The dielectric properties of soil-water mixtures at microwave frequencies,NASA I GSFC TM 80597 (1979>
20. J. R. Wang and T. J. Schmugge, An empirical model for the complex dielectric permittiv-ity of soils as a function of water content, NASA I GSFC TM 79659 (1978)
21. 0. Wobschall, A frequency shift soil moisture sensor, IEEE Transactions on GeoscienceElectronics, GE—16, #2, 112—118 (1978)