remote sensing of chlorophyll and nitrogen in cotton...
TRANSCRIPT

Ger
man
Rem
ote
Sen
sin
g D
ata
Cen
ter
RemoteRemote SensingSensing of Chlorophyll and of Chlorophyll and NitrogenNitrogen in in
CottonCotton Fields in Khorezm, Fields in Khorezm, UzbekistanUzbekistan
Gerd Ruecker1, Wouter Dorigo1, John Lamers2, Nazirbay Ibragimov3, Kirsten Kienzler2, Guenter Strunz1, Paul Vlek2
1German Aerospace Center (DLR), Oberpfaffenhofen, Germany2Center for Development Research (ZEF), Bonn, Germany
3Uzbekistan National Cotton Growing Research Institute, Tashkent, Uzbekistan

Ger
man
Rem
ote
Sen
sin
g D
ata
Cen
ter
Contents1. Background & Objective 2. Study Area3. Methods & Activities in 20054. Results
4.1 Biochemical parameter variation & SPAD calibration forcotton leaves
4.2 Relationships between VI & leaf chlorophyll / nitrogen incotton canopies
4.3 Estimation of cotton leaf chlorophyll / nitrogen status using CHRIS/Proba data
5. Conclusions & Outlook

Ger
man
Rem
ote
Sen
sin
g D
ata
Cen
ter
1. Background and Long-term Objectives
▶ ZEF/UNESCO Project: Economic and Ecological Restructuring of Land- and Water Use in Khorezm, Uzbekistan
▶ Long-term scientific cooperation (2002-2011)▶ Human capacity building of young Usbek students▶ Interdisciplinary integration of science▶ Science-based restructuring concept (www.khorezm-uni-bonn.de)

Ger
man
Rem
ote
Sen
sin
g D
ata
Cen
ter
ZEF/UNESCO Project: GIS-Center Khorezm
▶ Interdisciplinary data are processed for easy use by many users▶ Central GIS-Databases is backbone for long-term project▶ Internet-Metainformation Database for information retrieval
▶ GIS-Modelling of • land suitability• optimized land use• soil salinity pattern• groundwater pattern
▶ Remote sensing of• land use distribution • cotton yield • evapotranspiration• leaf chlorophyll

Ger
man
Rem
ote
Sen
sin
g D
ata
Cen
ter1. Background & Specific Objective
Background: ▶ Different nitrogen (N) status of cotton in fields within a region
▶ Need for N status estimation for targeted fertilizer application
Objective: ▶ Estimation of cotton leaf chlorophyll / N status in fields of
Khorezm

Ger
man
Rem
ote
Sen
sin
g D
ata
Cen
ter
2. Study Area
Study area: 14 km2, Khorezm region, Amu Darya Basin, UzbekistanLand uses: Mainly cottonField sizes: 1 – 25 haCalibration field: N-trial (Khorezm-127 cotton variety)Validation field: 7.5 ha (same variety)

Ger
man
Rem
ote
Sen
sin
g D
ata
Cen
ter
3. Methods & Activities in 2005
Conceptual framework:
Leaf Leaf
CanopyCanopy
Field / Field / RegionRegion
SPAD Chlorophyll meter SPAD calibration
Reflectance measurement VI evaluationSPAD measurement
CHRIS image datapreprocessing
CHRIS VI calculation
CHRIS VI evaluation
Chlorophyll extraction
VIs calculation
Chl. estimation
ScaleScale MeasurementsMeasurements / / PreprocessingPreprocessing CalculationsCalculations ResultsResults
Regression

Ger
man
Rem
ote
Sen
sin
g D
ata
Cen
ter
Field data & laboratory analyses (100 leaves):
▶ Calibration field: 0, 150, 200, 250 kg ha-1 N on cotton▶ Measurements: SPAD▶ Laboratory analyses: Chlorophyll a, b, total N
(Lichtenthaler, 1987; Nelson and Sommers, 1972)

Ger
man
Rem
ote
Sen
sin
g D
ata
Cen
ter
Field data & analyses
▶ Validation field: 250 kg ha-1 N on cotton▶ Measurements: SPAD (4 upper leaves, 4 leaves along vertical profile)
Reflectance (183 plants at 20m x 20m grid)
▶ Analyses: Spatial patterns of chlorophyll, N
21
2
1

Ger
man
Rem
ote
Sen
sin
g D
ata
Cen
ter
CHRIS image, ground truthing, image proc.
▶ CHRIS/Proba image acquisition: Mode 1 on 24th August 2005
▶ Reflectance measurements: Bright, dark targets with ASD-field spectr.
▶ GPS-measurements: 31 ground control points by Garmin GPS
▶ Image processing: destripinggeoreferencingradiometric calibrationatmospheric correction(ATCOR 6.3)

Ger
man
Rem
ote
Sen
sin
g D
ata
Cen
ter
Spectral data processing & selection of VI
▶ Spectra spectralon correction, deviations of white ref.processing: VNIR/SWIR1/SWIR2 spectrometer jumps, outliers
averaging, resampling to CHRIS-wavelengths
▶ VI selection: 1. Broad band VIsNDVI, RVI
2. Hybrid VIsSAVI, SAVI2, MSAVI, OSAVI, TSAVI, RDVI, MTVI1, MTVI2
3. Narrow band chlorophyll VIsTCARI, MCARI, MCARI1, MCARI2
4. Derivates VIsDGVI1, DGVI2

Ger
man
Rem
ote
Sen
sin
g D
ata
Cen
ter
4. Results4.1 Biochemical parameter variation & SPAD calibration
for cotton leaves
Parameter Minimum Maximum Mean STD
SPADCal._field () 3.3 70.2 45.2 15.5 Chlorophyll a+bLab (µg cm-2) 1.52 64.6 34.4 16.9 Total NitrogenLab (%) 0.01 1.35 0.72 0.36
SPADVal._field () 26.9 59.6 39.2 5.70 Chlorophyll a+bVal.field (µg cm-2) 16.3 52.2 29.8 7.16 Total NitrogenVal. field (µg cm-2) 0.35 0.99 0.60 0.11
▶ Calibration field: Wide SPAD, chlorophyll a+b, N range ▶ Validation field: Small variation of biochemical parameter
Note: STD=Standard deviation, Cal. field = Calibration field, Val. field = validation field; Lab = laboratory analyses; N= 100 samples from Cal. field; N= 183 samples from Val. field.

Ger
man
Rem
ote
Sen
sin
g D
ata
Cen
ter
4.1 Biochemical parameter variation & SPAD calibration for cotton leaves of Khorezm-127 variety
SPAD Chlorophyll a+b SPAD Total N Chlorophyll Total N
▶ Good calibration of SPAD chlorophyll meter
▶ Use of SPAD for quick, easy & non-destructive estimation ofleaf chlorophyll & N in cotton in Uzbekistan
y = 1.0403x - 12.752R2 = 0.89
0
10
20
30
40
50
60
70
0 10 20 30 40 50 60 70 80
SPAD ( )
Chlo
roph
yll a
+b (µ
g cm
-2) y = 0.0196x - 0.1724
R2 = 0.75
0
0.2
0.4
0.6
0.8
1
1.2
1.4
0 10 20 30 40 50 60 70 80
SPAD ()
Tota
l Nitr
ogen
(%)
y = 0.0194x + 0.0494R2 = 0.89
0
0.2
0.4
0.6
0.8
1
1.2
1.4
0 10 20 30 40 50 60 70
Chlorophyll a+b (µg cm-2)
Tota
l Nitr
ogen
(%)

Ger
man
Rem
ote
Sen
sin
g D
ata
Cen
ter
4.2 Relationships between VI & leaf chlorophyll a+b in cotton plants
18 20 22 24 26 28 30 32 34 36 38Mean Chlorophyll a+b (µg cm -2)
in upper 4 leaves of plants
02468
1012
Freq
uenc
y
18 22 26 30 34 38 42 46Mean Chlorophylla+b (µg cm-2) of 4 vertical profile leaves of plants
0
1
2
3
4
5
6
7
8
9
Freq
uenc
y
▶ Identification of representative leaves for measuring chlorophyll - to spatially match with reflectance measurements - to estimate leaf chlorophyll for whole plant
20
25
30
35
40
45
0 5 10 15 20 25 30 35 40 45 50 55 60Cotton plant #C
hlor
ophy
ll a+
b (µ
g cm
-2)
upper leaves leaves along vertical profile

Ger
man
Rem
ote
Sen
sin
g D
ata
Cen
ter
4.2 Relationships between VI & chlorophyll a+b in cotton plants
▶ Poor performance of broad band, hybrid VIs▶ Moderate performance of narrow band Chl. VIs (TCARI/MCARI)
▶ Soil background, plant & row structure, LAI not captured▶ Upper & vertical leaves sampling to capture representative leaves
0.00
0.10
0.20
0.30
0.40
0.50
NDVIRVISAVISAVI2MSAVIOSAVITS
AVIRDVI
TVI
MTVI1
MTVI2
TCARI
TCARI/O
SAVIMCARIMCARI1MCARI2
DGVI1DGVI2
R2
upper leaves upper l. +1 profile l. upper l. +1-2 profile l.
upper l. +1-3 profile l. upper l. + 1-4 profile l.
Ger
man
Rem
ote
Sen
sin
g D
ata
Cen
ter
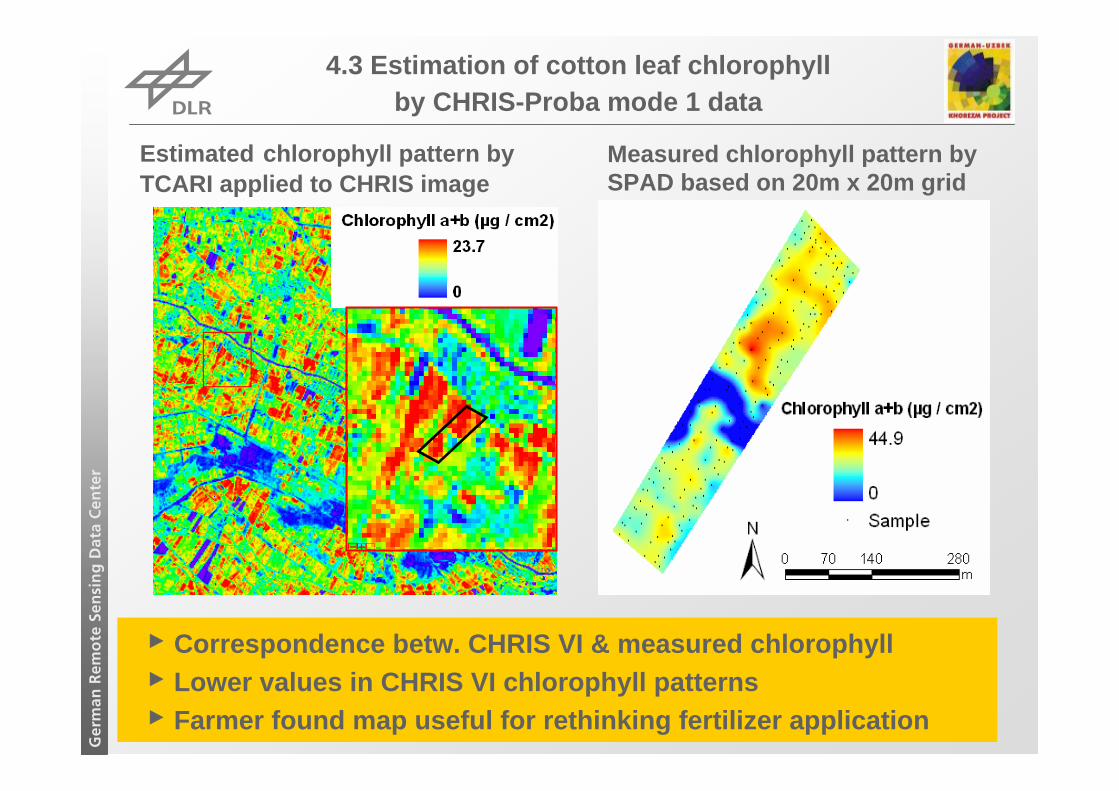
4.3 Estimation of cotton leaf chlorophyll by CHRIS-Proba mode 1 data
Estimated chlorophyll pattern byTCARI applied to CHRIS image
▶ Correspondence betw. CHRIS VI & measured chlorophyll▶ Lower values in CHRIS VI chlorophyll patterns ▶ Farmer found map useful for rethinking fertilizer application
Measured chlorophyll pattern bySPAD based on 20m x 20m grid

Ger
man
Rem
ote
Sen
sin
g D
ata
Cen
ter
5. Conclusions & Outlook
Conclusions▶ Successful calibration of SPAD▶ TCARI best VI, but only moderate relationship with Chl.▶ CHRIS TCARI pattern generally fair, but Chl. underestimated
CHRIS promising for Chlorophyll estimation in Khorezm
Outlook▶ CHRIS data acquistion during prime fertilization stages▶ Chl. estimation using PROSPECT/SAIL model▶ Transfer of Chl. patterns with other
data into fertilizer recommendations

Ger
man
Rem
ote
Sen
sin
g D
ata
Cen
terThank You for Your Attention !
Thanks to: ▶ ESA PROBA mission team (esp. Peter F., Bianca H.), Surrey Sat. Techn. Ltd▶ ZEF/UNESCO Khorezm project leader (Dr. Martius)▶ Field assistants, farmers▶ Uzhydromet, Tashkent (Mrs. Smolkova) ▶ German Ministry for Education and Research