remote sensing in hydrology - bibliothek.fzk.debibliothek.fzk.de/zb/veroeff/77199.pdf · of remote...
TRANSCRIPT
1 Institute for Meteorology and Climate Research IMK-IFU
Integration of Remote Sensing Information in
Hydrological Models
Harald KunstmannInstitute for Meteorology and Climate Research IMK-IFU
Garmisch-Partenkirchen
Email: [email protected]
2 Institute for Meteorology and Climate Research IMK-IFU
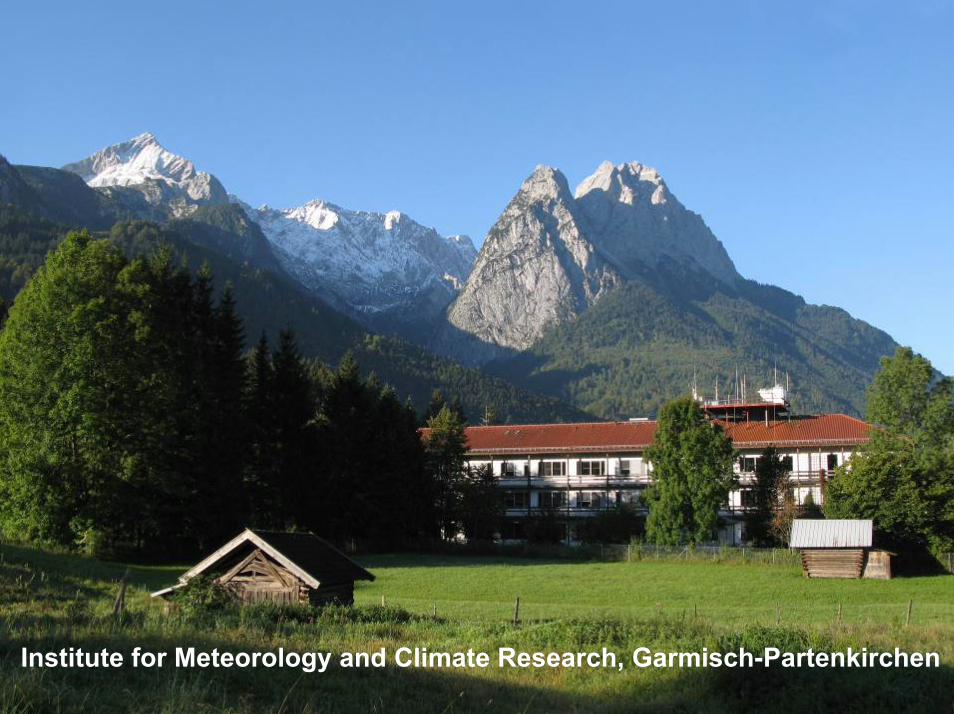
Institute for Meteorology and Climate Research, Garmisch-Partenkirchen
3 Institute for Meteorology and Climate Research IMK-IFU
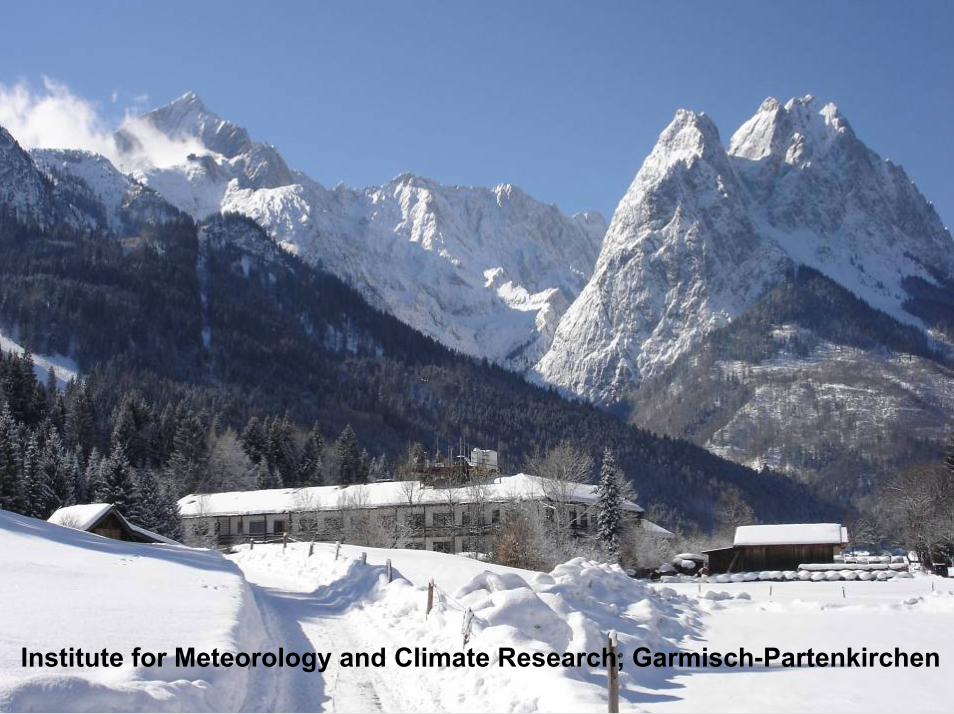
Institute for Meteorology and Climate Research, Garmisch-Partenkirchen
4 Institute for Meteorology and Climate Research IMK-IFU
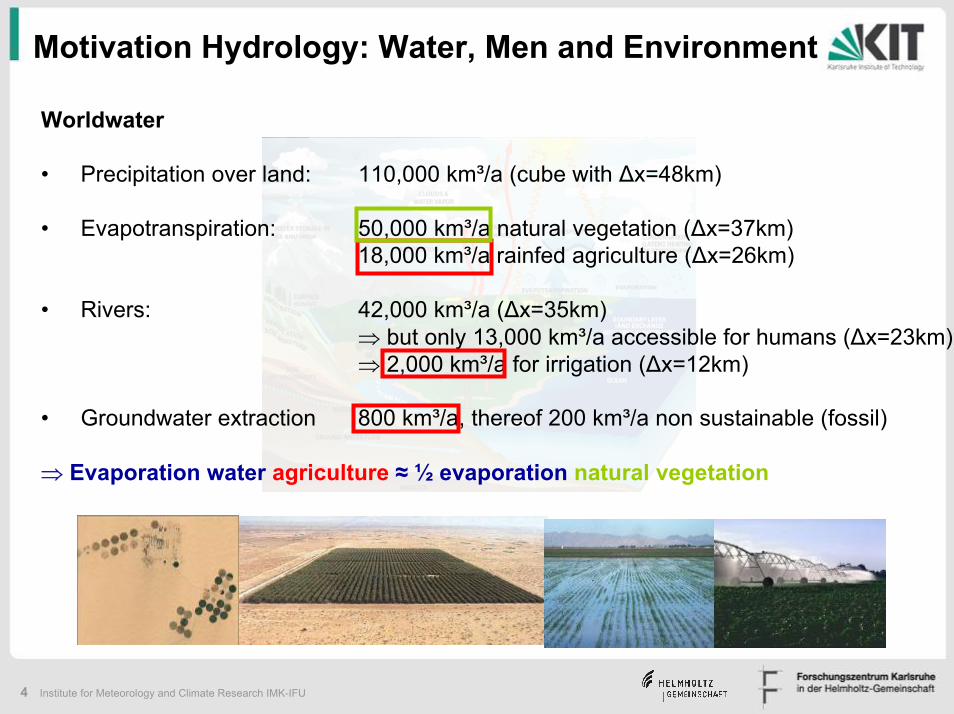
Motivation Hydrology: Water, Men and Environment
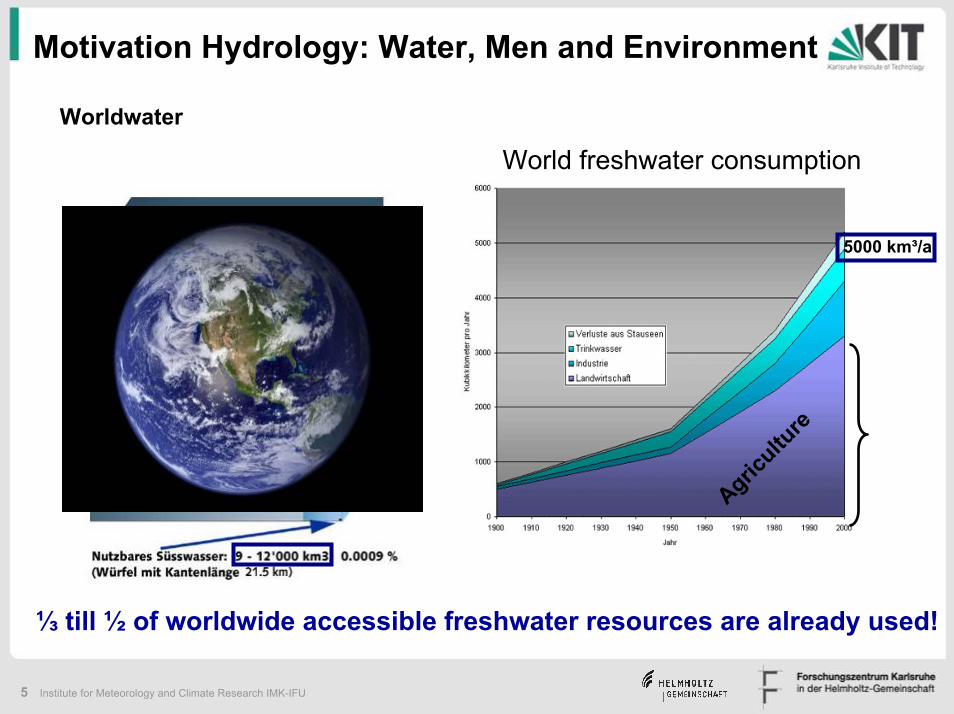
Worldwater
• Precipitation over land: 110,000 km³/a (cube with ∆x=48km)
• Evapotranspiration: 50,000 km³/a natural vegetation (∆x=37km)18,000 km³/a rainfed agriculture (∆x=26km)
• Rivers: 42,000 km³/a (∆x=35km)⇒ but only 13,000 km³/a accessible for humans (∆x=23km)⇒ 2,000 km³/a for irrigation (∆x=12km)
• Groundwater extraction 800 km³/a, thereof 200 km³/a non sustainable (fossil)
⇒ Evaporation water agriculture ≈ ½ evaporation natural vegetation
5 Institute for Meteorology and Climate Research IMK-IFU
Motivation Hydrology: Water, Men and Environment
Worldwater
World freshwater consumption
Agricultu
re
5000 km³/a
⅓ till ½ of worldwide accessible freshwater resources are already used!
6 Institute for Meteorology and Climate Research IMK-IFU
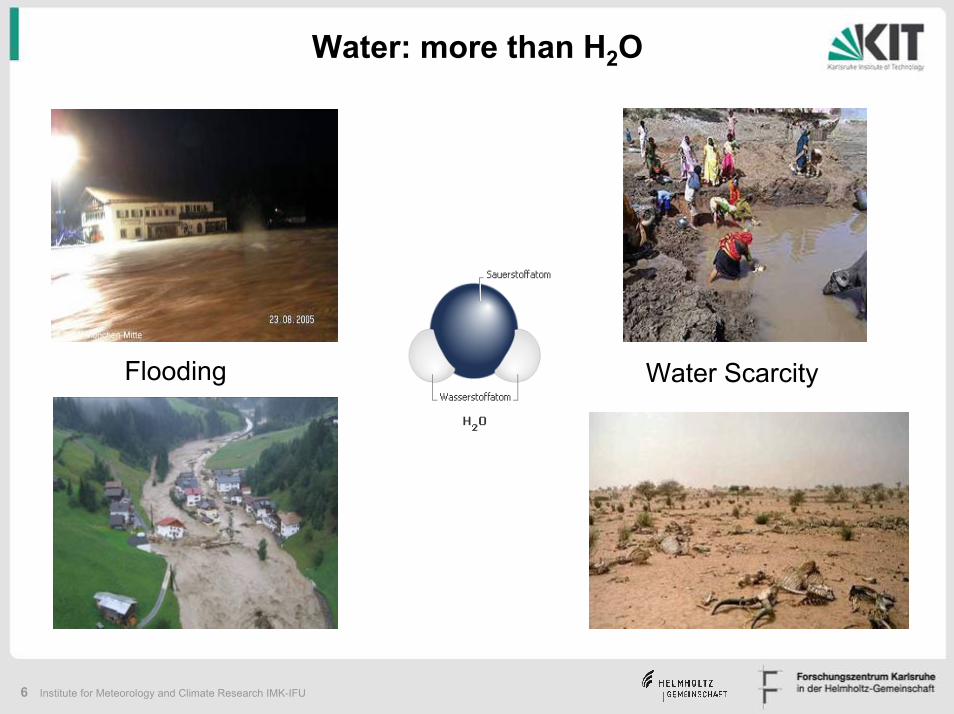
Water: more than H2O
Flooding Water Scarcity
7 Institute for Meteorology and Climate Research IMK-IFU
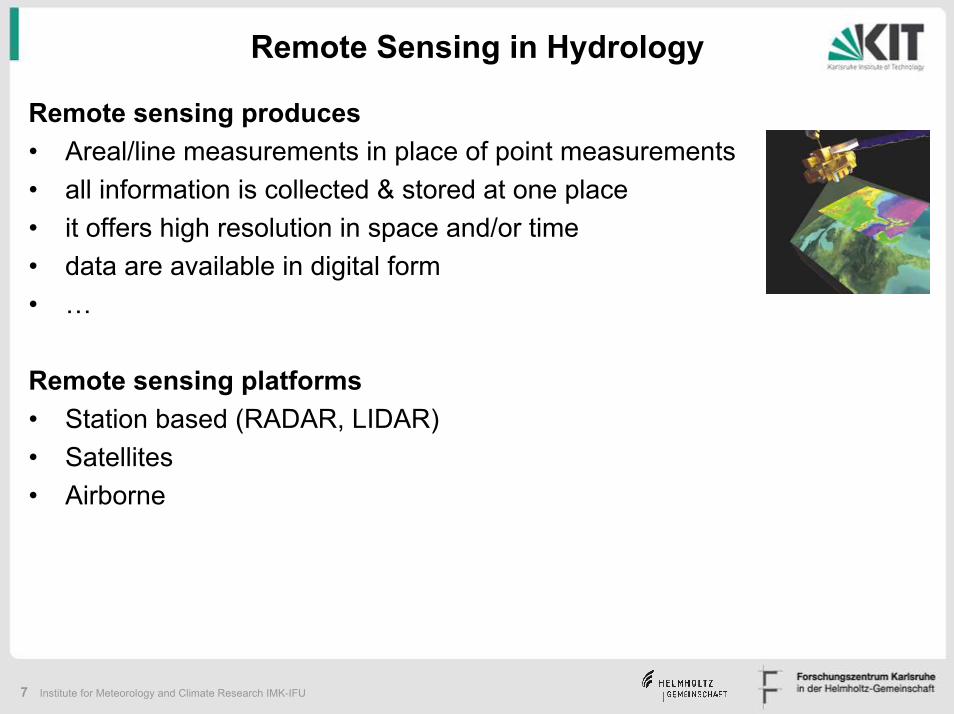
Remote Sensing in Hydrology
Remote sensing produces • Areal/line measurements in place of point measurements• all information is collected & stored at one place • it offers high resolution in space and/or time • data are available in digital form • …
Remote sensing platforms • Station based (RADAR, LIDAR)• Satellites• Airborne
8 Institute for Meteorology and Climate Research IMK-IFU
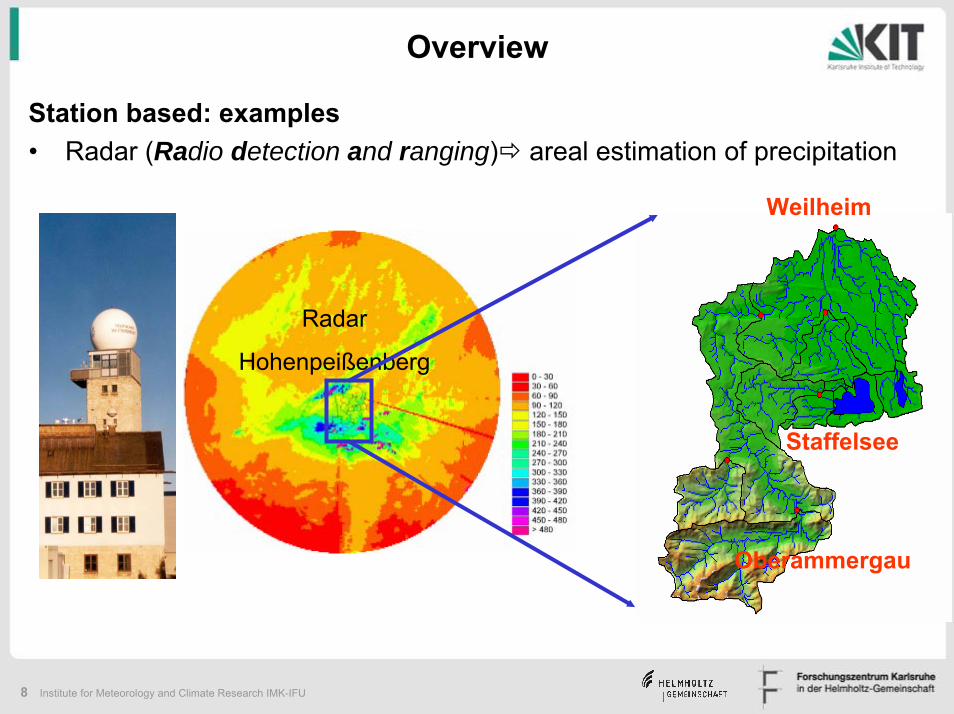
Overview
Station based: examples • Radar (Radio detection and ranging) areal estimation of precipitation
Weilheim
Staffelsee
Oberammergau
Radar
Hohenpeißenberg
9 Institute for Meteorology and Climate Research IMK-IFU
Overview
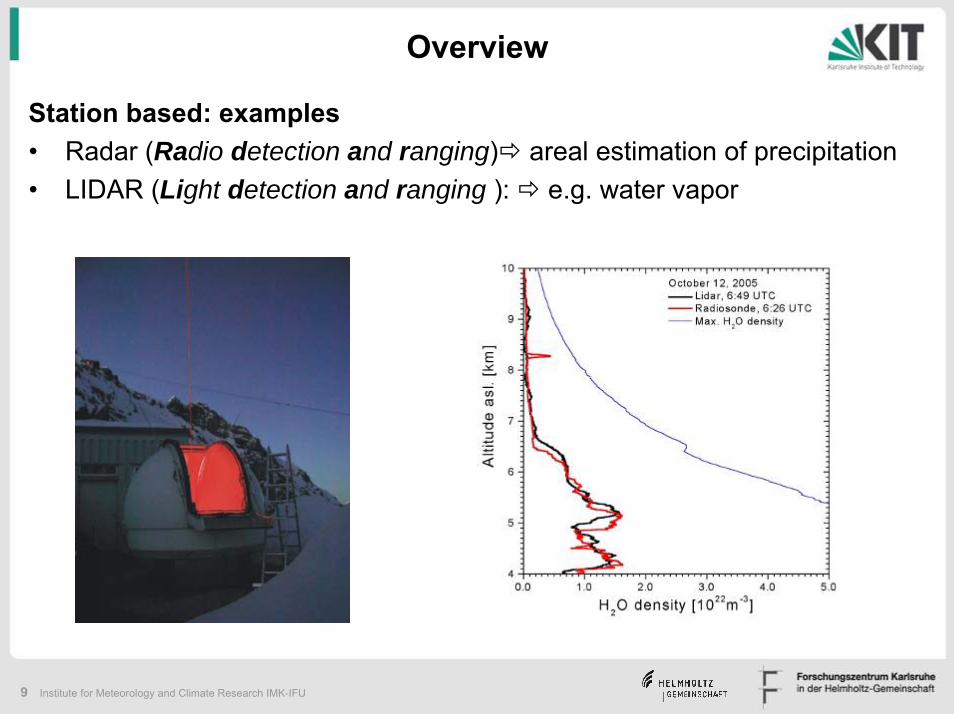
Station based: examples • Radar (Radio detection and ranging) areal estimation of precipitation• LIDAR (Light detection and ranging ): e.g. water vapor
10 Institute for Meteorology and Climate Research IMK-IFU
Overview
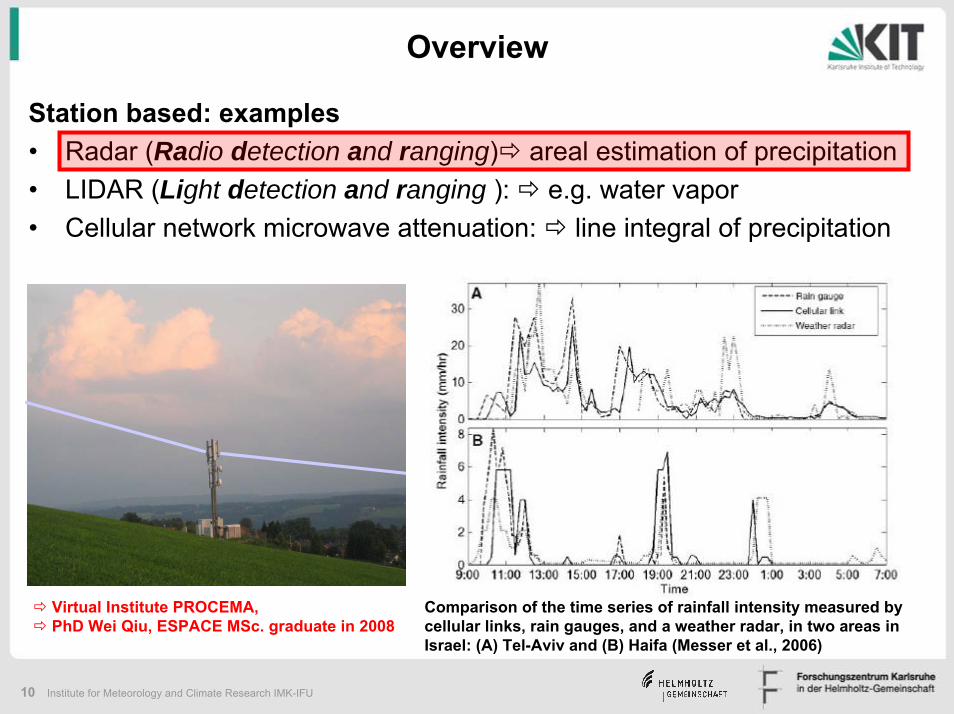
Station based: examples • Radar (Radio detection and ranging) areal estimation of precipitation• LIDAR (Light detection and ranging ): e.g. water vapor• Cellular network microwave attenuation: line integral of precipitation
Comparison of the time series of rainfall intensity measured bycellular links, rain gauges, and a weather radar, in two areas in Israel: (A) Tel-Aviv and (B) Haifa (Messer et al., 2006)
Virtual Institute PROCEMA, PhD Wei Qiu, ESPACE MSc. graduate in 2008
11 Institute for Meteorology and Climate Research IMK-IFU
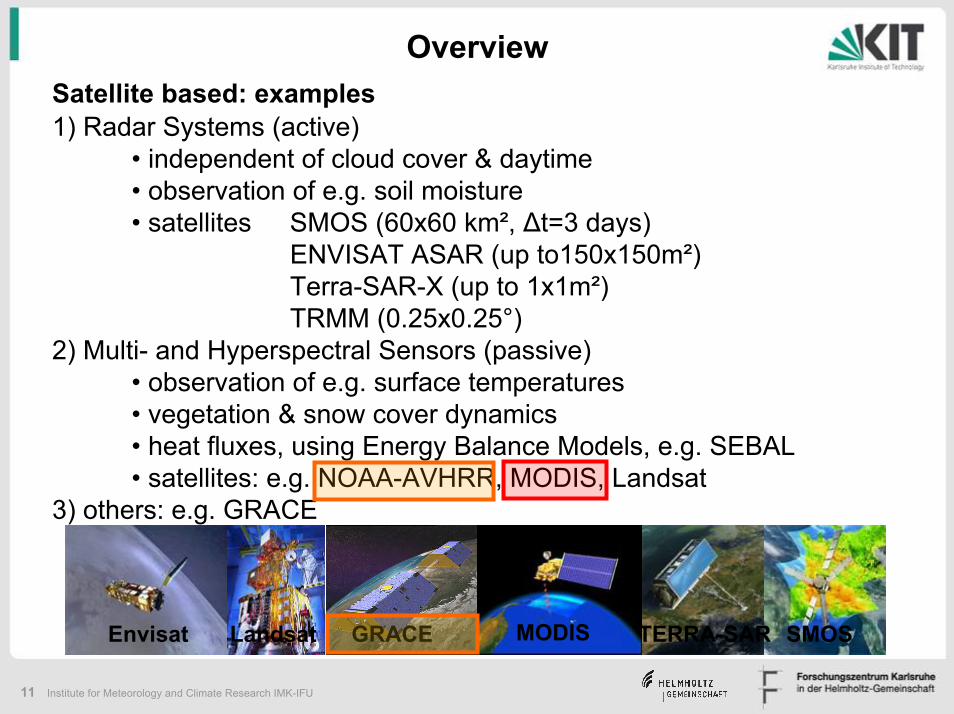
Satellite based: examples1) Radar Systems (active)
• independent of cloud cover & daytime• observation of e.g. soil moisture• satellites SMOS (60x60 km², ∆t=3 days)
ENVISAT ASAR (up to150x150m²)Terra-SAR-X (up to 1x1m²)TRMM (0.25x0.25°)
2) Multi- and Hyperspectral Sensors (passive) • observation of e.g. surface temperatures • vegetation & snow cover dynamics• heat fluxes, using Energy Balance Models, e.g. SEBAL• satellites: e.g. NOAA-AVHRR, MODIS, Landsat
3) others: e.g. GRACE
MODIS SMOSGRACE TERRA-SARLandsatEnvisat
Overview
12 Institute for Meteorology and Climate Research IMK-IFU
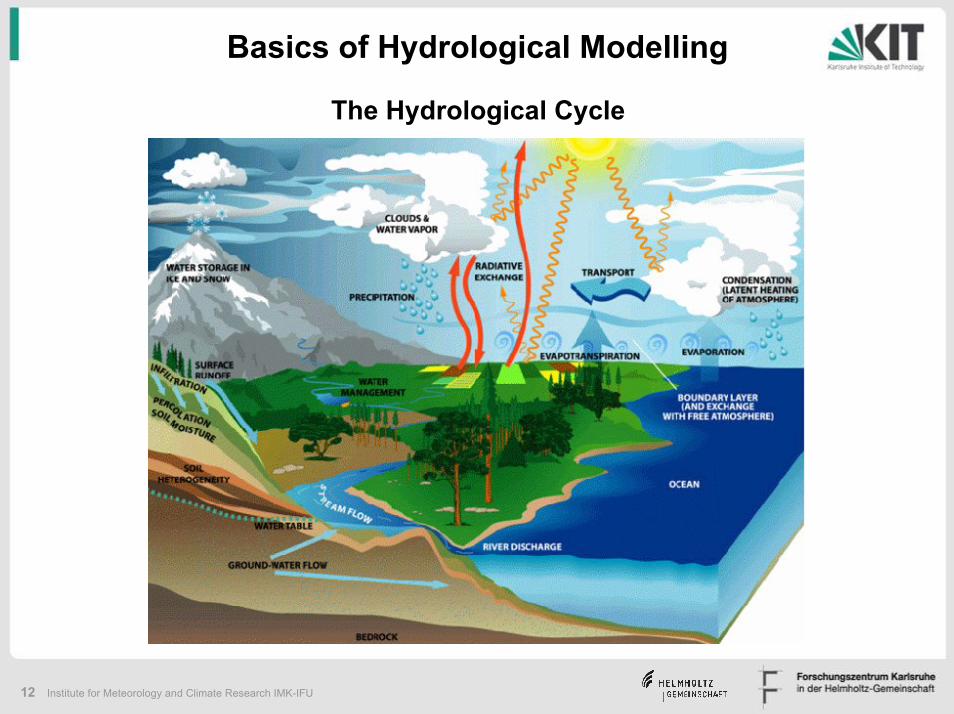
Basics of Hydrological Modelling
The Hydrological Cycle
13 Institute for Meteorology and Climate Research IMK-IFU
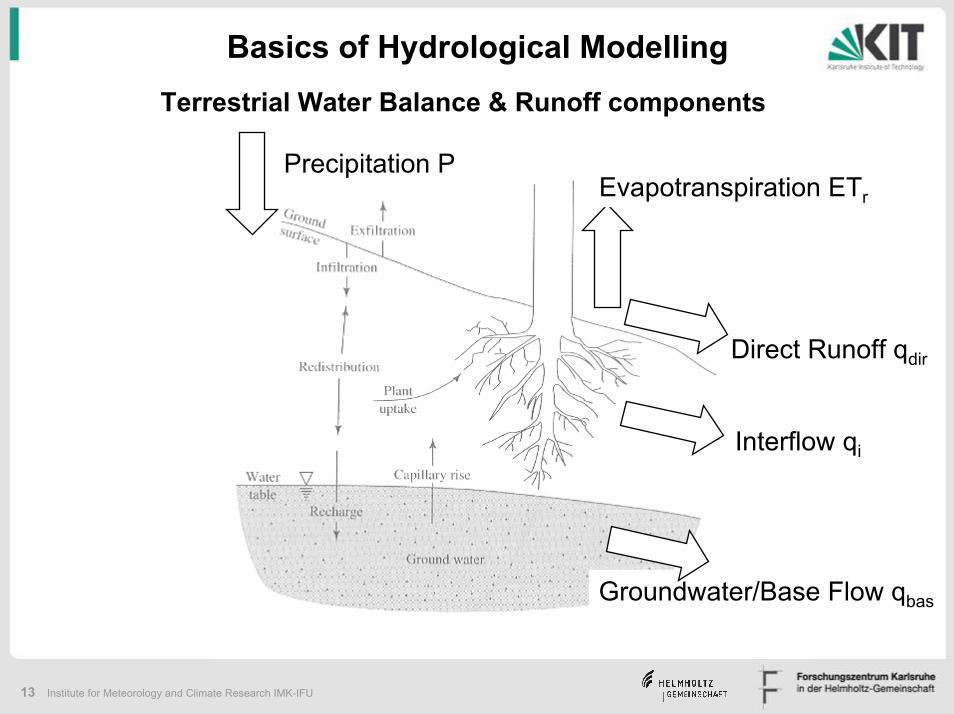
Basics of Hydrological ModellingTerrestrial Water Balance & Runoff components
Interflow qi
Direct Runoff qdir
Groundwater/Base Flow qbas
Evapotranspiration ETr
Precipitation P
14 Institute for Meteorology and Climate Research IMK-IFU
Basics of Hydrological Modelling
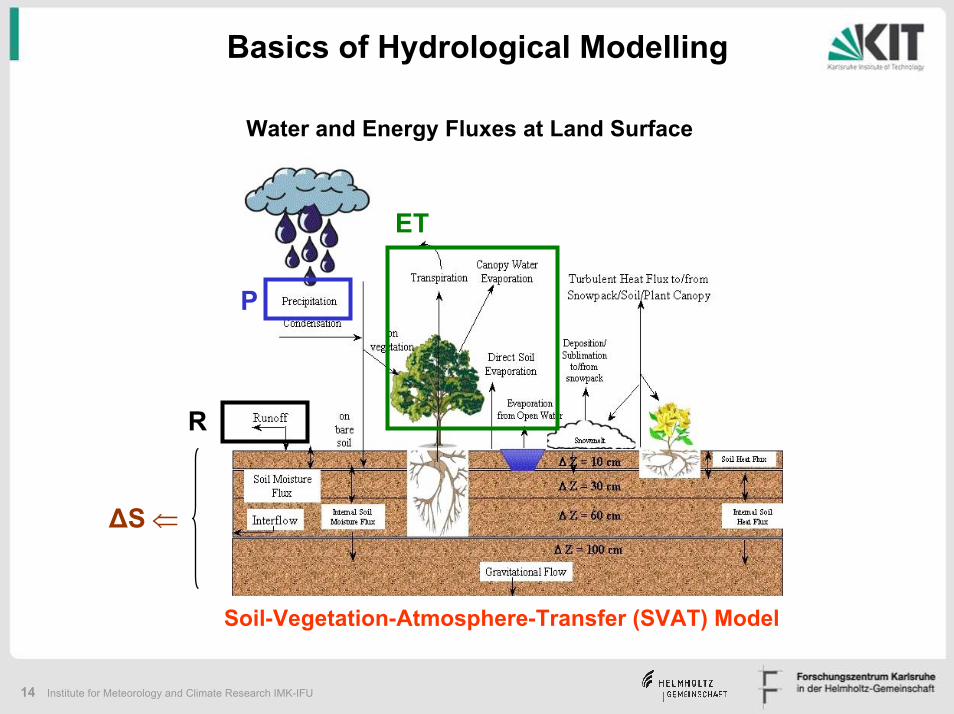
Water and Energy Fluxes at Land Surface
P
ET
R
∆S ⇐
Soil-Vegetation-Atmosphere-Transfer (SVAT) Model
15 Institute for Meteorology and Climate Research IMK-IFU
Flächendifferenzierte Wasserhaushaltsmodellierung
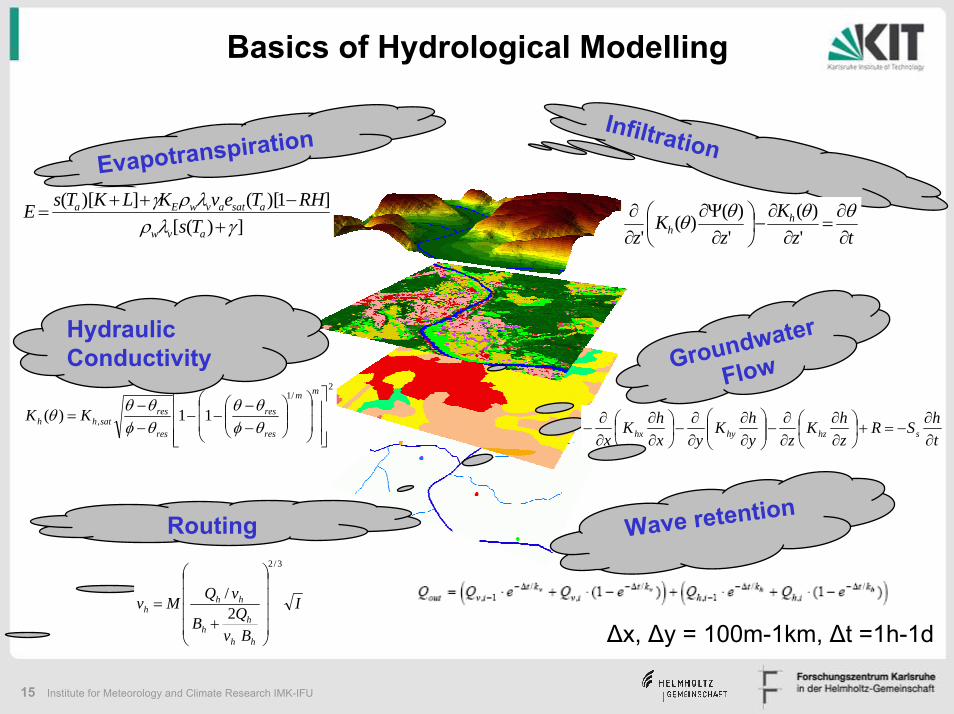
EvapotranspirationInfiltration
Groundwater
Flow
])([]1)[(])[(
γλρλργ+
−++=
avw
asatavwEa
TsRHTevKLKTsE
thSR
zhK
zyhK
yxhK
x shzhyhx ∂∂
−=+⎟⎠⎞
⎜⎝⎛
∂∂
∂∂
−⎟⎟⎠
⎞⎜⎜⎝
⎛∂∂
∂∂
−⎟⎠⎞
⎜⎝⎛
∂∂
∂∂
−
2/1
, 11)(⎥⎥⎥
⎦
⎤
⎢⎢⎢
⎣
⎡
⎟⎟
⎠
⎞
⎜⎜
⎝
⎛⎟⎟⎠
⎞⎜⎜⎝
⎛−−
−−−−
=
mm
res
res
res
ressathh KK
θφθθ
θφθθθ
tzK
zK
zh
h ∂∂
=∂
∂−⎟⎠⎞
⎜⎝⎛
∂Ψ∂
∂∂ θθθθ
')(
')()(
'
Routing Wave retention
I
BvQB
vQMv
hh
hh
hhh
3/2
2/
⎟⎟⎟⎟
⎠
⎞
⎜⎜⎜⎜
⎝
⎛
+=
Basics of Hydrological Modelling
HydraulicConductivity
∆x, ∆y = 100m-1km, ∆t =1h-1d
16 Institute for Meteorology and Climate Research IMK-IFU
Example 1: Radar & Precipitation
17 Institute for Meteorology and Climate Research IMK-IFU
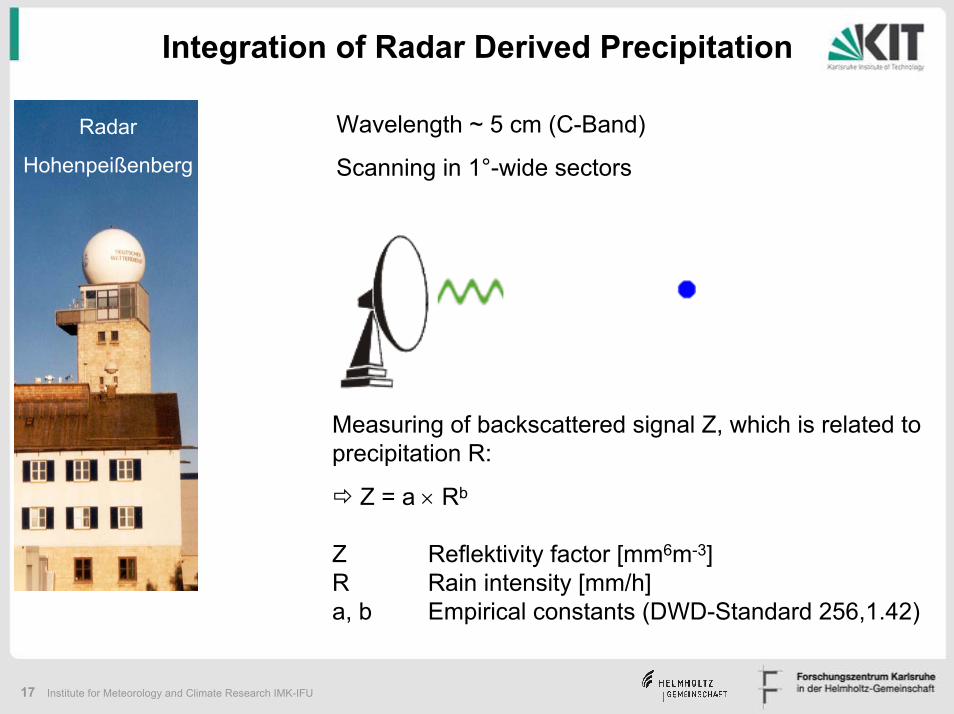
Integration of Radar Derived Precipitation
Radar
Hohenpeißenberg
Wavelength ~ 5 cm (C-Band)
Scanning in 1°-wide sectors
Measuring of backscattered signal Z, which is related to precipitation R:
Z = a × Rb
Z Reflektivity factor [mm6m-3] R Rain intensity [mm/h]a, b Empirical constants (DWD-Standard 256,1.42)
18 Institute for Meteorology and Climate Research IMK-IFU
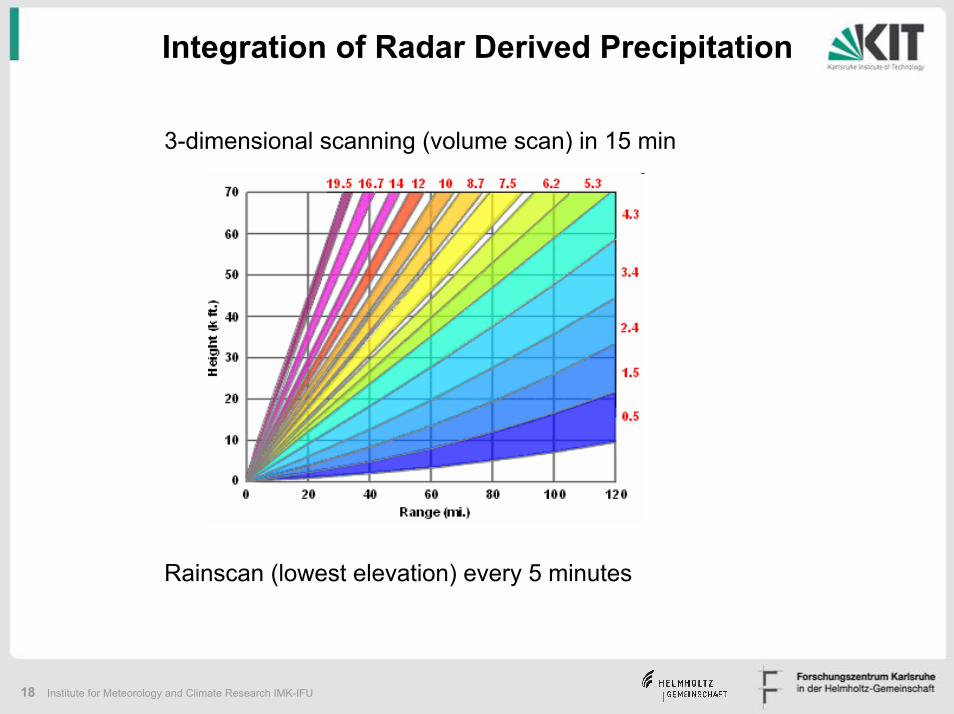
Integration of Radar Derived Precipitation
3-dimensional scanning (volume scan) in 15 min
Rainscan (lowest elevation) every 5 minutes
19 Institute for Meteorology and Climate Research IMK-IFU
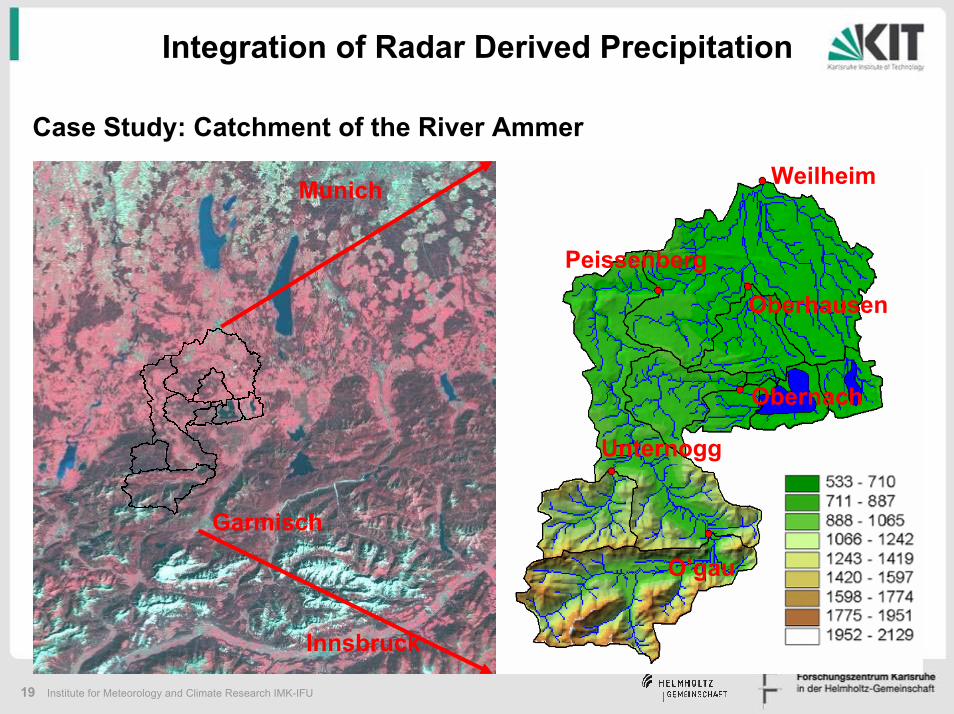
Integration of Radar Derived Precipitation
Case Study: Catchment of the River Ammer
Weilheim
Oberhausen
Peissenberg
Obernach
Unternogg
O’gau
Munich
Garmisch
Innsbruck
20 Institute for Meteorology and Climate Research IMK-IFU
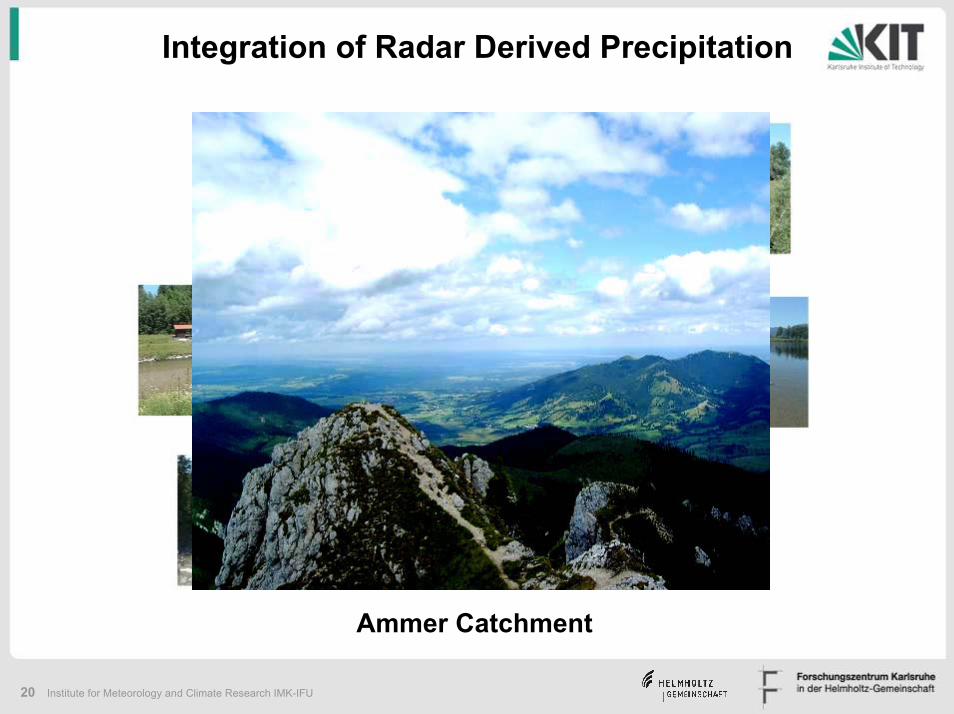
Integration of Radar Derived Precipitation
Ammer Catchment
21 Institute for Meteorology and Climate Research IMK-IFU
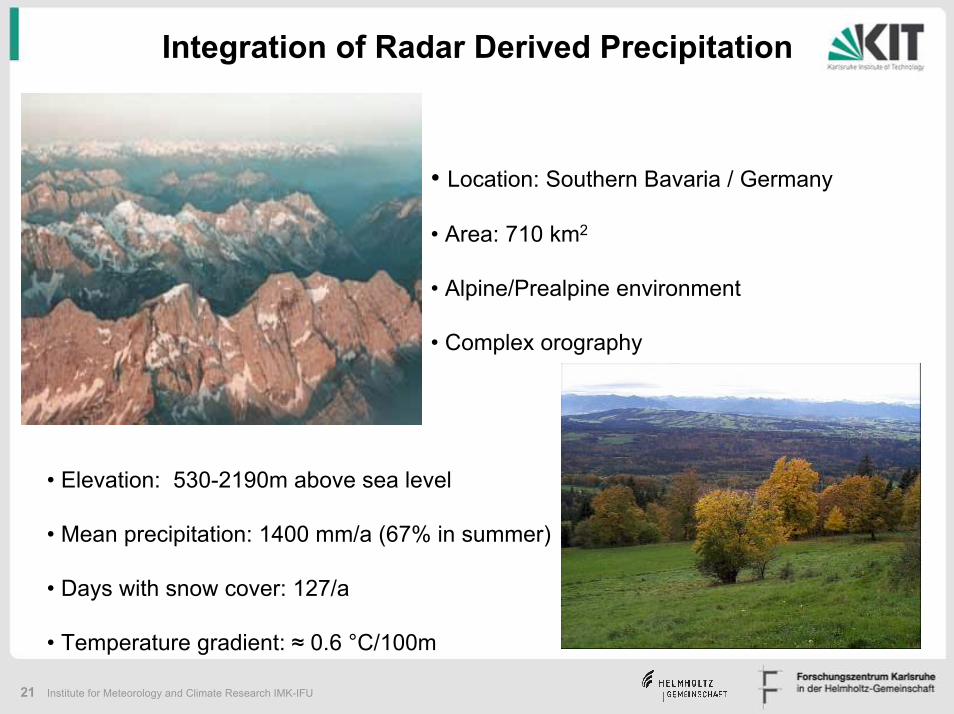
Integration of Radar Derived Precipitation
• Location: Southern Bavaria / Germany
• Area: 710 km2
• Alpine/Prealpine environment
• Complex orography
• Elevation: 530-2190m above sea level
• Mean precipitation: 1400 mm/a (67% in summer)
• Days with snow cover: 127/a
• Temperature gradient: ≈ 0.6 °C/100m
22 Institute for Meteorology and Climate Research IMK-IFU
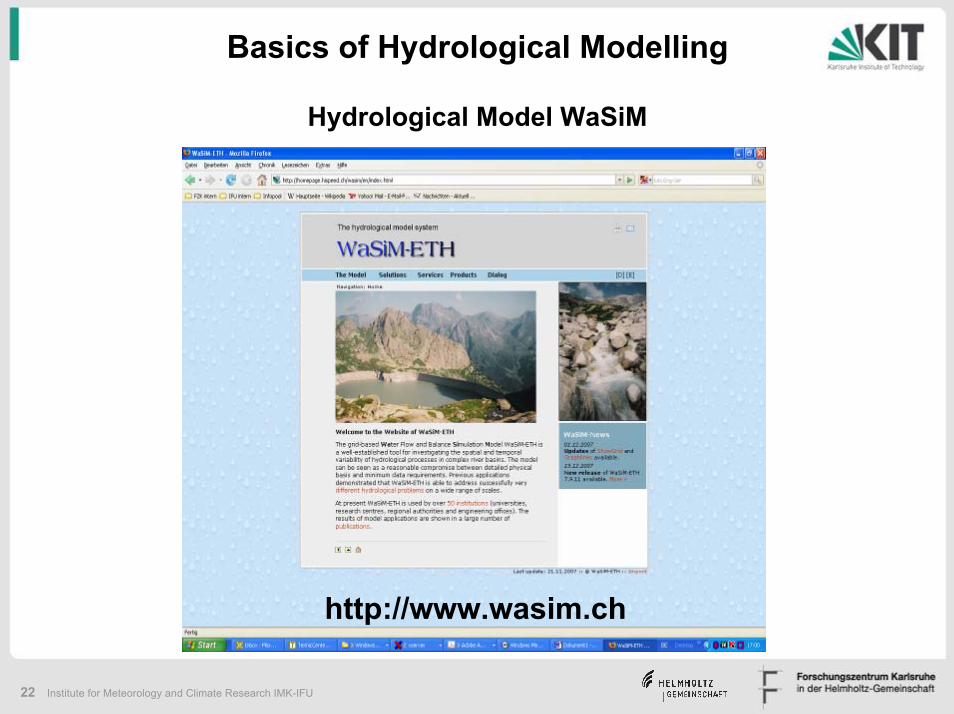
Basics of Hydrological Modelling
Hydrological Model WaSiM
http://www.wasim.ch
23 Institute for Meteorology and Climate Research IMK-IFU
Basics of Hydrological Modelling
Special features WaSiM (incomplete):
• Variable cell sizes• Dynamic simulation of vegetation development (LAI Dynamics)• Advanced landuse table• Advanced soil table• Macropore runoff• Exfiltration and re-infiltration of groundwater• Irrigation management• Considering (artificial) drainage• Considering ponds• Modelling of glacier runoff• Considering reservoir management• Considering external abstractions and inflows• Online coupling with external models• Coupling of sequential model runs• Coupling of substance transport ( tracer) with water flow
24 Institute for Meteorology and Climate Research IMK-IFU
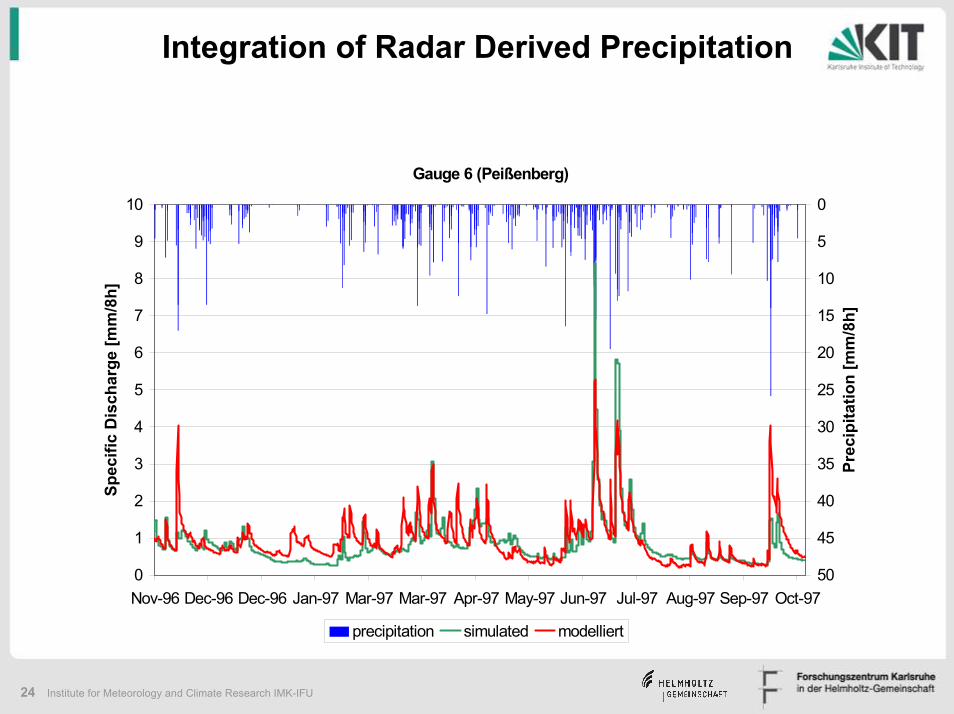
Integration of Radar Derived Precipitation
Gauge 6 (Peißenberg)
0
1
2
3
4
5
6
7
8
9
10
Nov-96 Dec-96 Dec-96 Jan-97 Mar-97 Mar-97 Apr-97 May-97 Jun-97 Jul-97 Aug-97 Sep-97 Oct-97
Spec
ific
Dis
char
ge [m
m/8
h]
0
5
10
15
20
25
30
35
40
45
50
Prec
ipita
tion
[mm
/8h]
precipitation simulated modelliert
25 Institute for Meteorology and Climate Research IMK-IFU
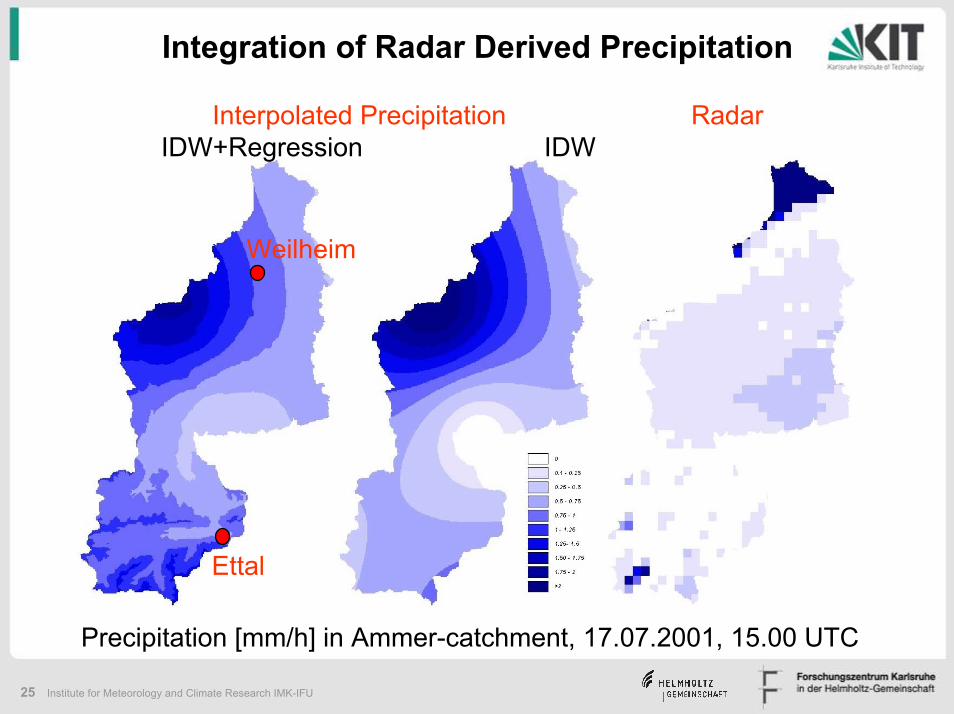
Integration of Radar Derived Precipitation
Interpolated Precipitation RadarIDW+Regression IDW
Weilheim
Ettal
Precipitation [mm/h] in Ammer-catchment, 17.07.2001, 15.00 UTC
26 Institute for Meteorology and Climate Research IMK-IFU
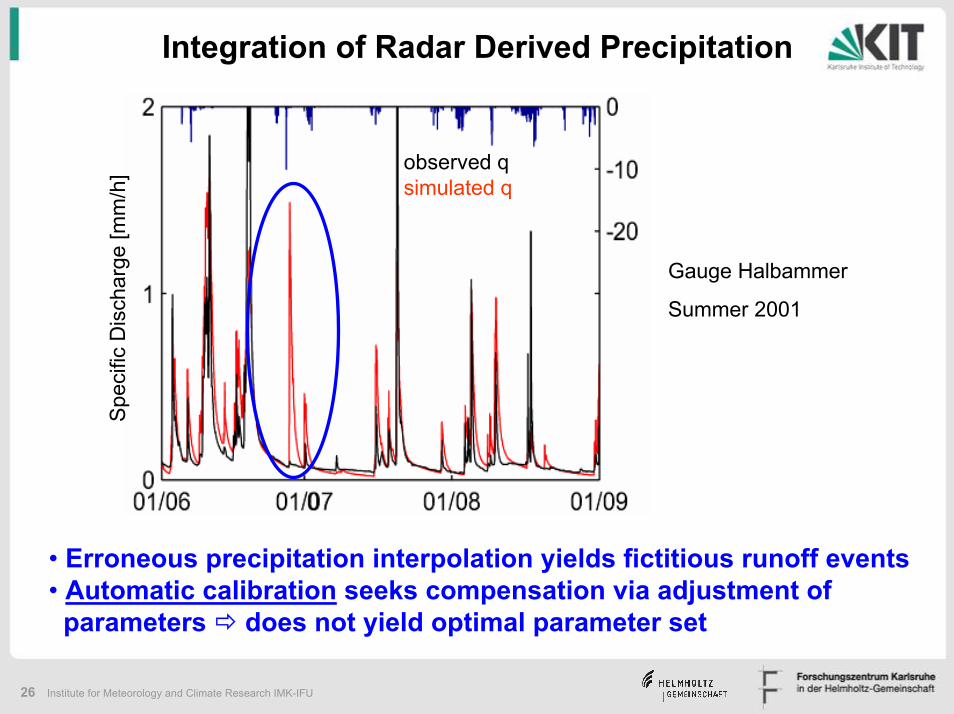
Integration of Radar Derived Precipitation
Spe
cific
Dis
char
ge [m
m/h
] observed q simulated q
Gauge Halbammer
Summer 2001
• Erroneous precipitation interpolation yields fictitious runoff events• Automatic calibration seeks compensation via adjustment ofparameters does not yield optimal parameter set
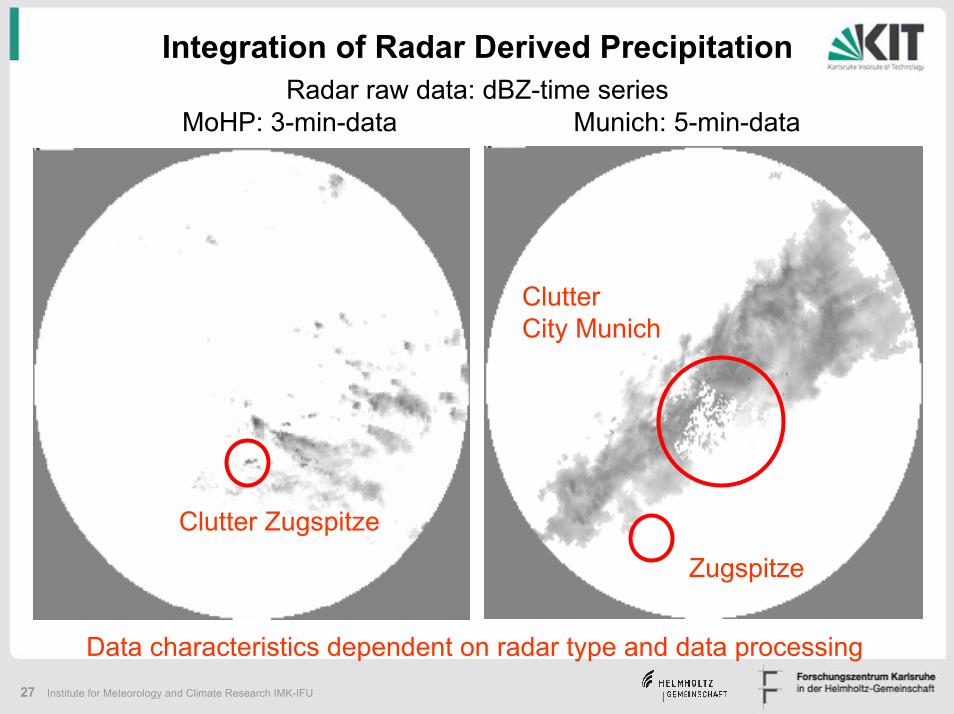
27 Institute for Meteorology and Climate Research IMK-IFU
Radar raw data: dBZ-time series
Clutter Zugspitze
Clutter City Munich
Zugspitze
MoHP: 3-min-data Munich: 5-min-data
Integration of Radar Derived Precipitation
Data characteristics dependent on radar type and data processing
28 Institute for Meteorology and Climate Research IMK-IFU
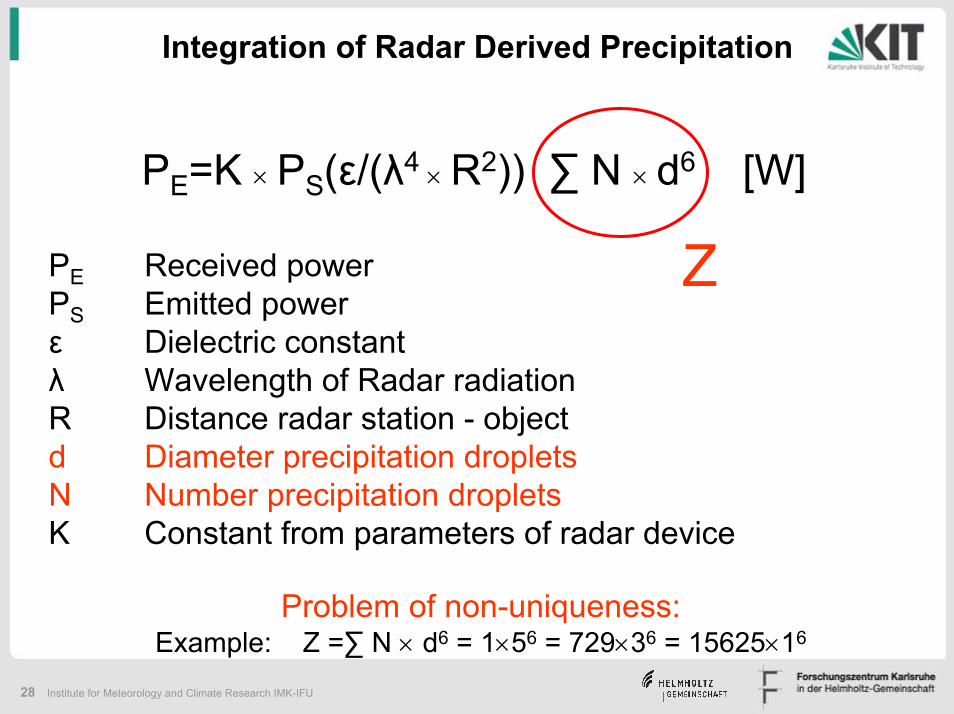
Integration of Radar Derived Precipitation
PE=K × PS(ε/(λ4 × R2)) ∑ N × d6 [W]
PE Received powerPS Emitted powerε Dielectric constantλ Wavelength of Radar radiationR Distance radar station - objectd Diameter precipitation dropletsN Number precipitation dropletsK Constant from parameters of radar device
Z
Problem of non-uniqueness:Example: Z =∑ N × d6 = 1×56 = 729×36 = 15625×16
29 Institute for Meteorology and Climate Research IMK-IFU
Integration of Radar Derived Precipitation
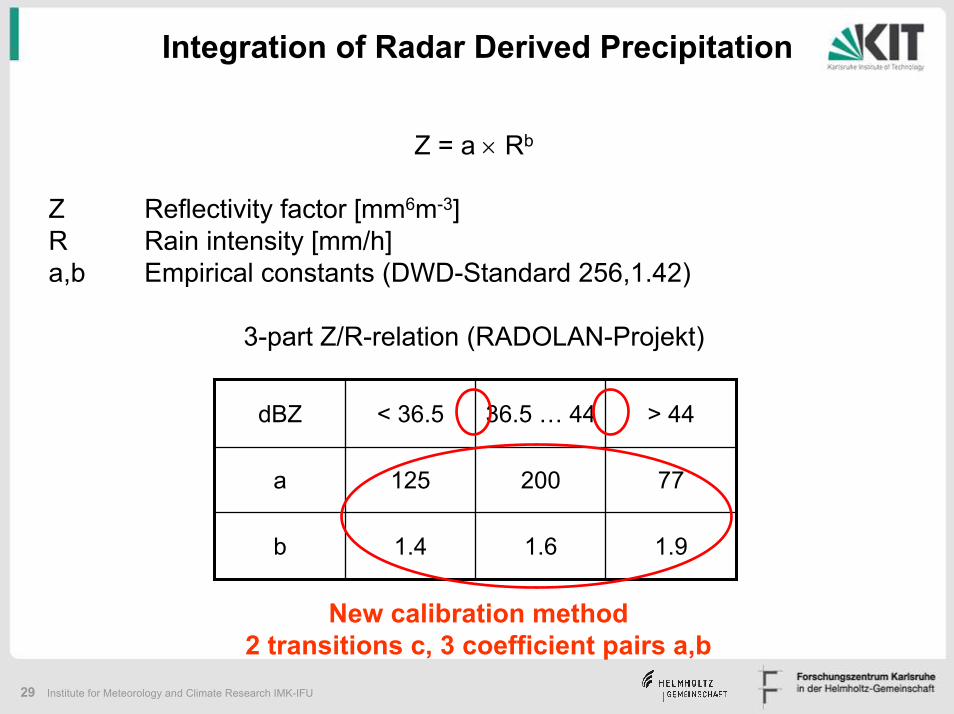
Z = a × Rb
Z Reflectivity factor [mm6m-3] R Rain intensity [mm/h]a,b Empirical constants (DWD-Standard 256,1.42)
3-part Z/R-relation (RADOLAN-Projekt)
dBZ < 36.5 36.5 … 44 > 44
a 125 200 77
b 1.4 1.6 1.9
New calibration method2 transitions c, 3 coefficient pairs a,b
30 Institute for Meteorology and Climate Research IMK-IFU
Integration of Radar Derived Precipitation
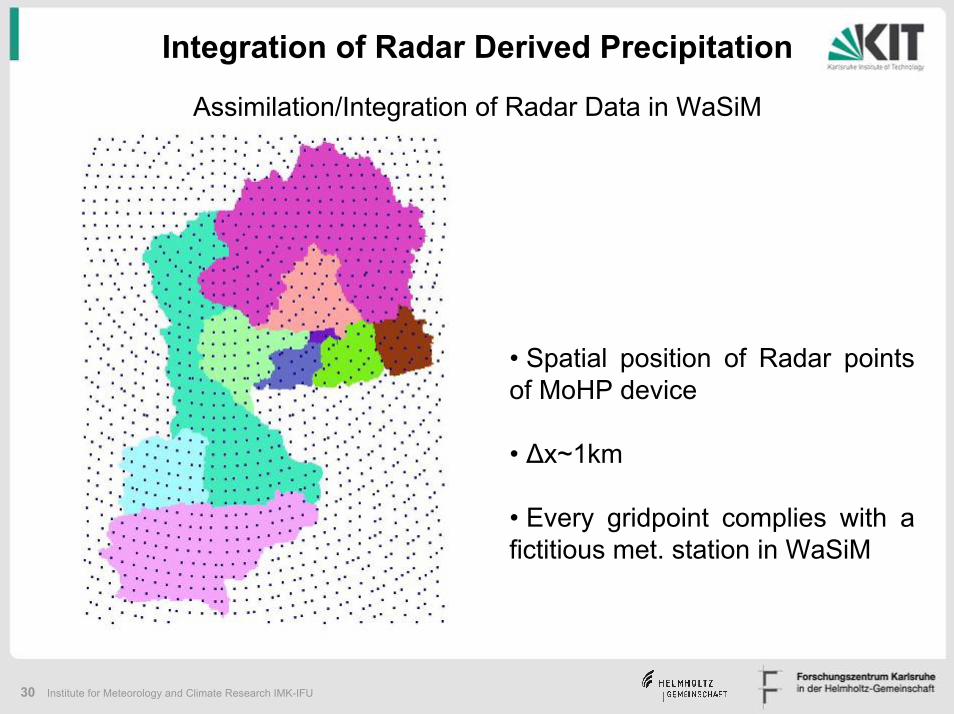
Assimilation/Integration of Radar Data in WaSiM
• Spatial position of Radar points of MoHP device
• ∆x~1km
• Every gridpoint complies with a fictitious met. station in WaSiM
31 Institute for Meteorology and Climate Research IMK-IFU
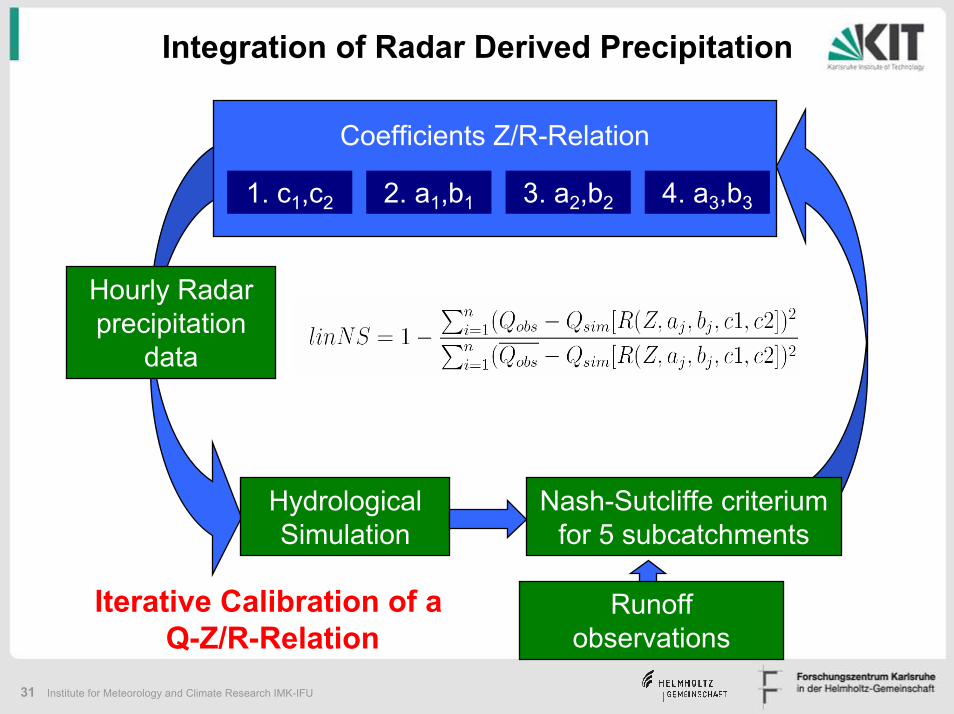
Integration of Radar Derived Precipitation
Coefficients Z/R-Relation
Iterative Calibration of a Q-Z/R-Relation
1. c1,c2 2. a1,b1 3. a2,b2 4. a3,b3
Hourly Radar precipitation
data
Hydrological Simulation
Nash-Sutcliffe criteriumfor 5 subcatchments
Runoff observations
32 Institute for Meteorology and Climate Research IMK-IFU
Integration of Radar Derived Precipitation
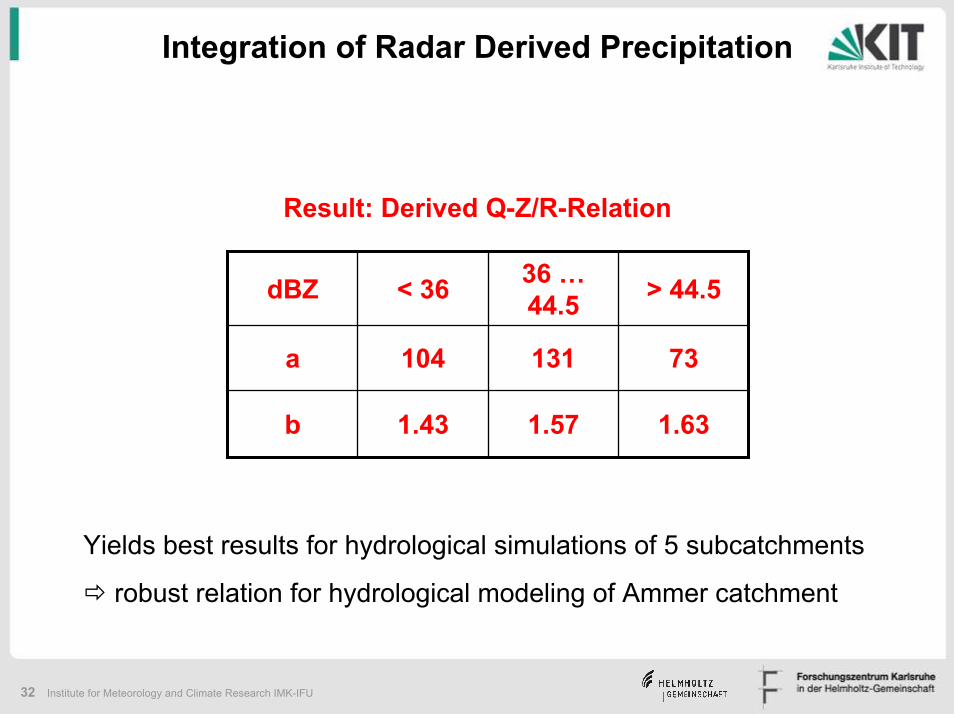
Result: Derived Q-Z/R-Relation
dBZ < 36 36 …44.5 > 44.5
a 104 131 73
b 1.43 1.57 1.63
Yields best results for hydrological simulations of 5 subcatchments
robust relation for hydrological modeling of Ammer catchment
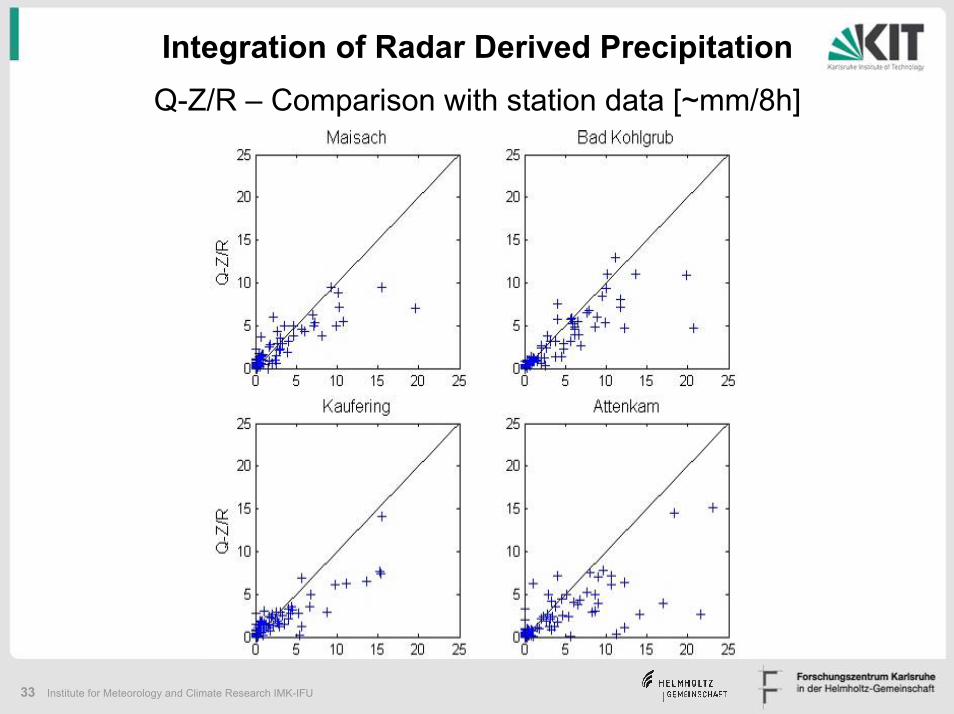
33 Institute for Meteorology and Climate Research IMK-IFU
Integration of Radar Derived PrecipitationQ-Z/R – Comparison with station data [~mm/8h]
34 Institute for Meteorology and Climate Research IMK-IFU
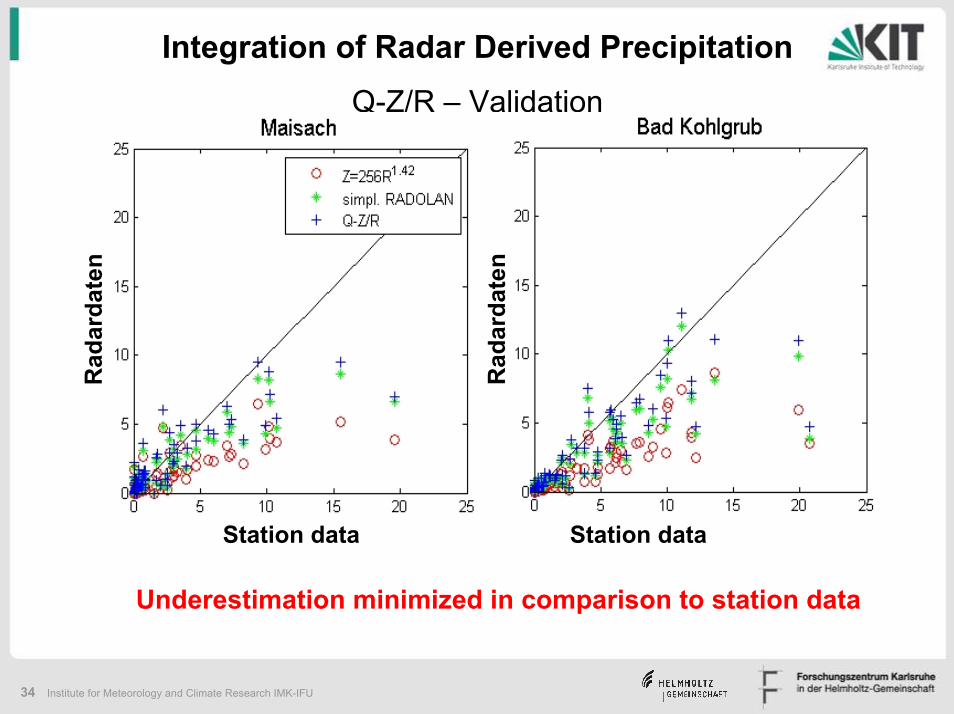
Integration of Radar Derived PrecipitationQ-Z/R – Validation
Station data Station data
Rad
arda
ten
Rad
arda
ten
Underestimation minimized in comparison to station data
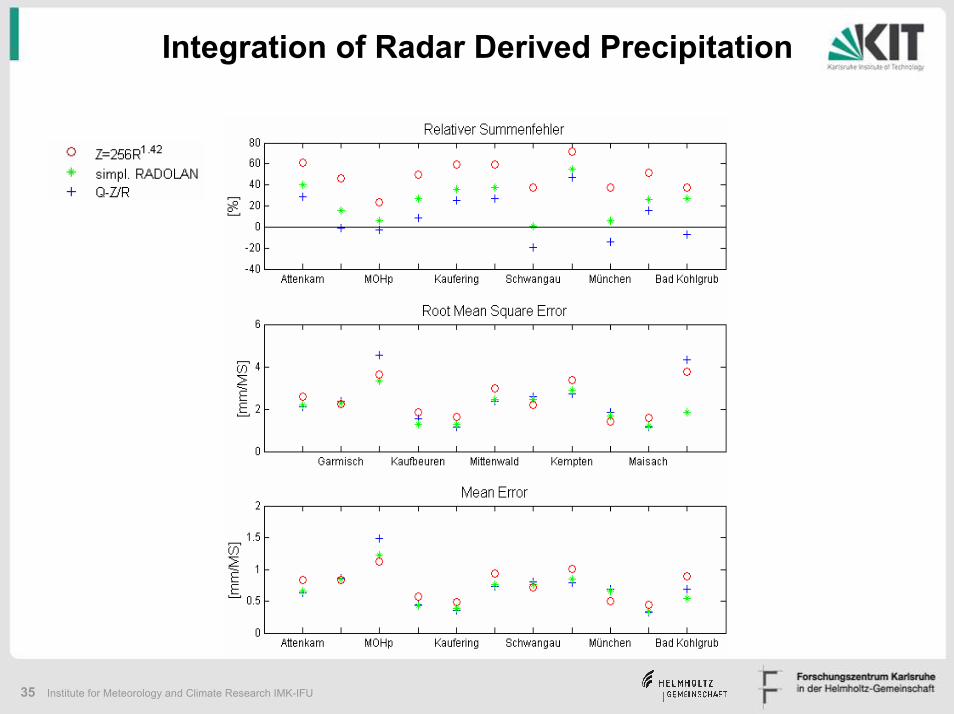
35 Institute for Meteorology and Climate Research IMK-IFU
Integration of Radar Derived Precipitation
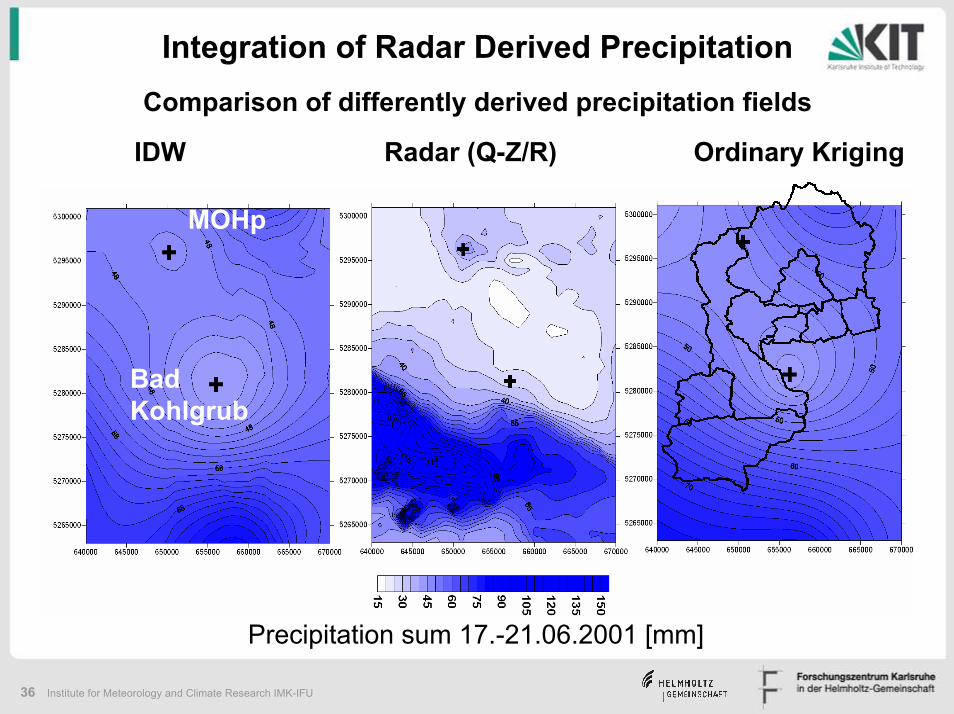
36 Institute for Meteorology and Climate Research IMK-IFU
Integration of Radar Derived PrecipitationComparison of differently derived precipitation fields
MOHp
Bad Kohlgrub
IDW Radar (Q-Z/R) Ordinary Kriging
Precipitation sum 17.-21.06.2001 [mm]
37 Institute for Meteorology and Climate Research IMK-IFU
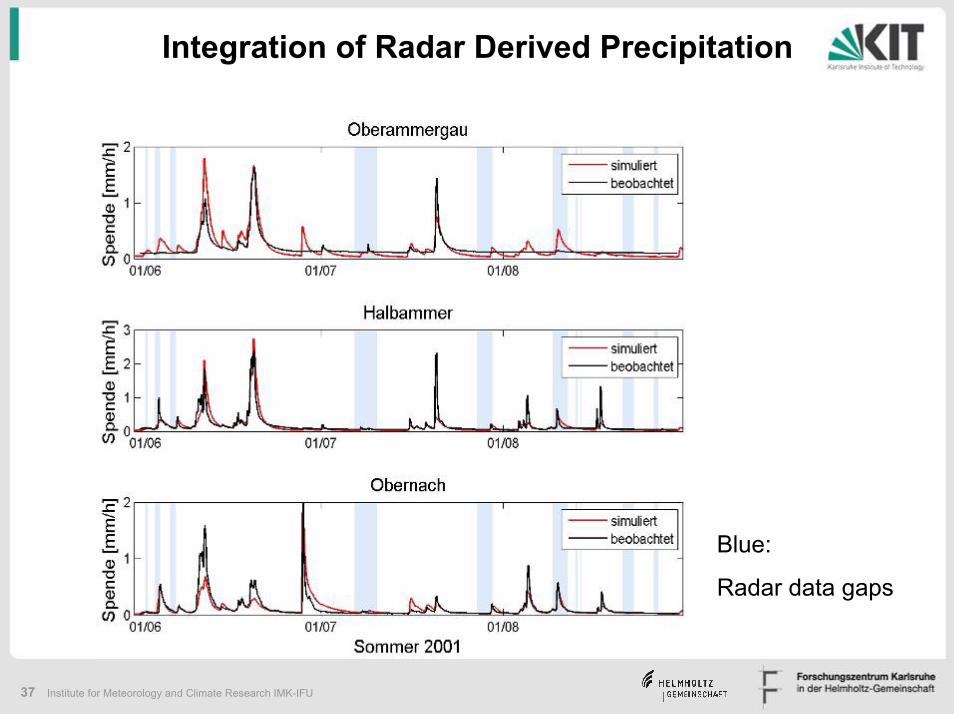
Integration of Radar Derived Precipitation
Blue:
Radar data gaps
38 Institute for Meteorology and Climate Research IMK-IFU
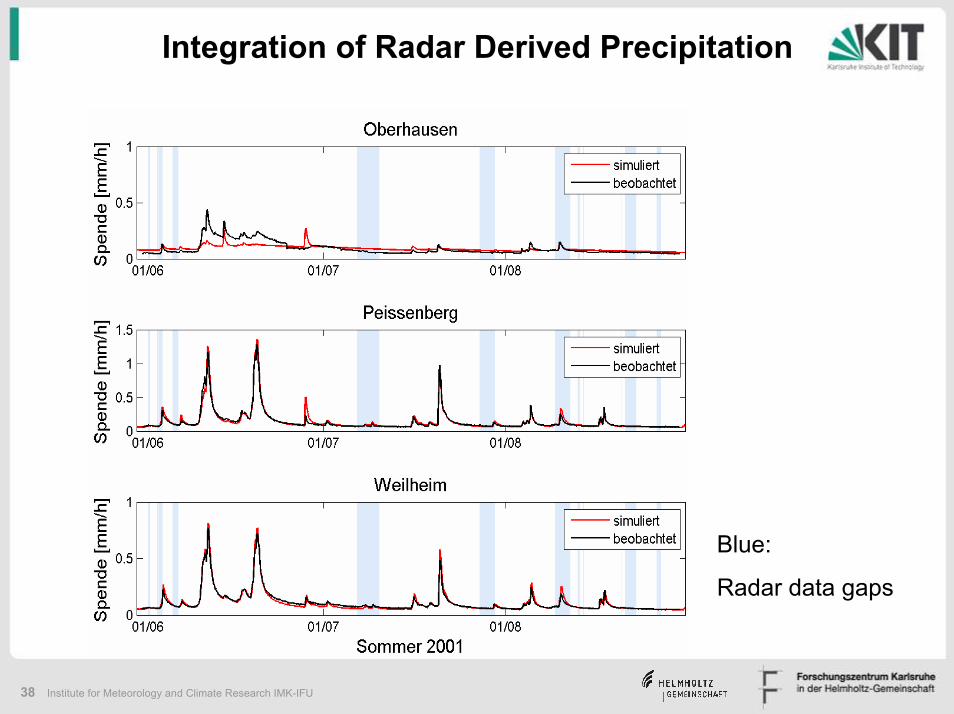
Integration of Radar Derived Precipitation
Blue:
Radar data gaps
39 Institute for Meteorology and Climate Research IMK-IFU
Integration of Radar Derived Precipitation
Summary
• Derivation of Q-Z/R-relation based on discharge measurements and calibrated hydrological model
• Radar driven continuous hydrological simulation over 3 months period yield reasonable good results
• Adaptation of Q-Z/R-relation yields minimisation/reduction of (Radar typical-) underestimation compared to station data

40 Institute for Meteorology and Climate Research IMK-IFU
Example 2: MODIS & Land Surface Properties
41 Institute for Meteorology and Climate Research IMK-IFU
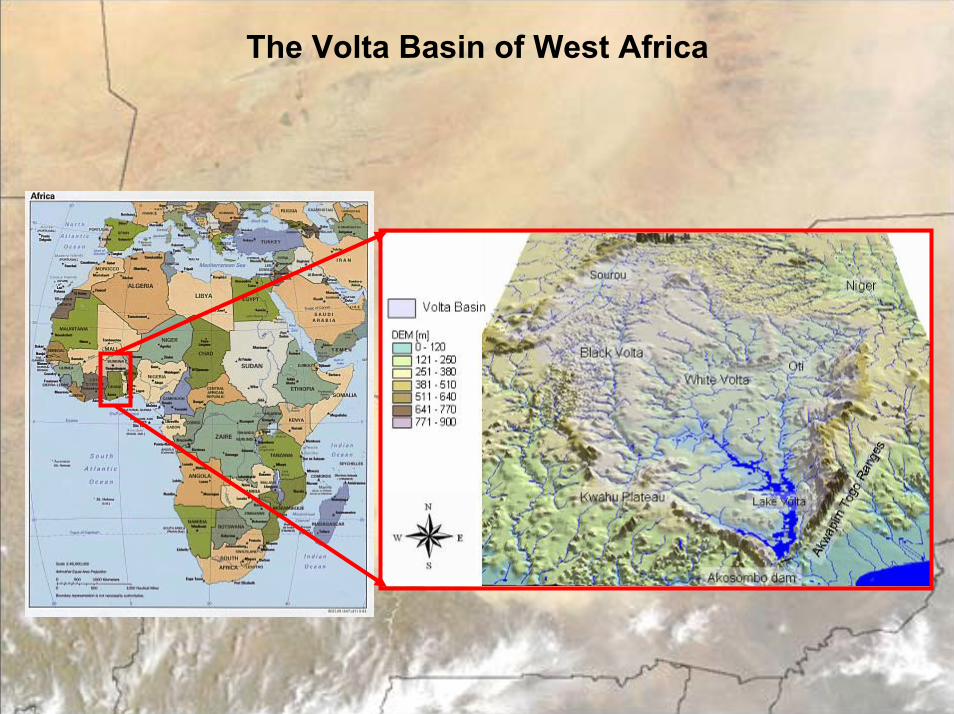
The Volta Basin of West Africa
42 Institute for Meteorology and Climate Research IMK-IFU
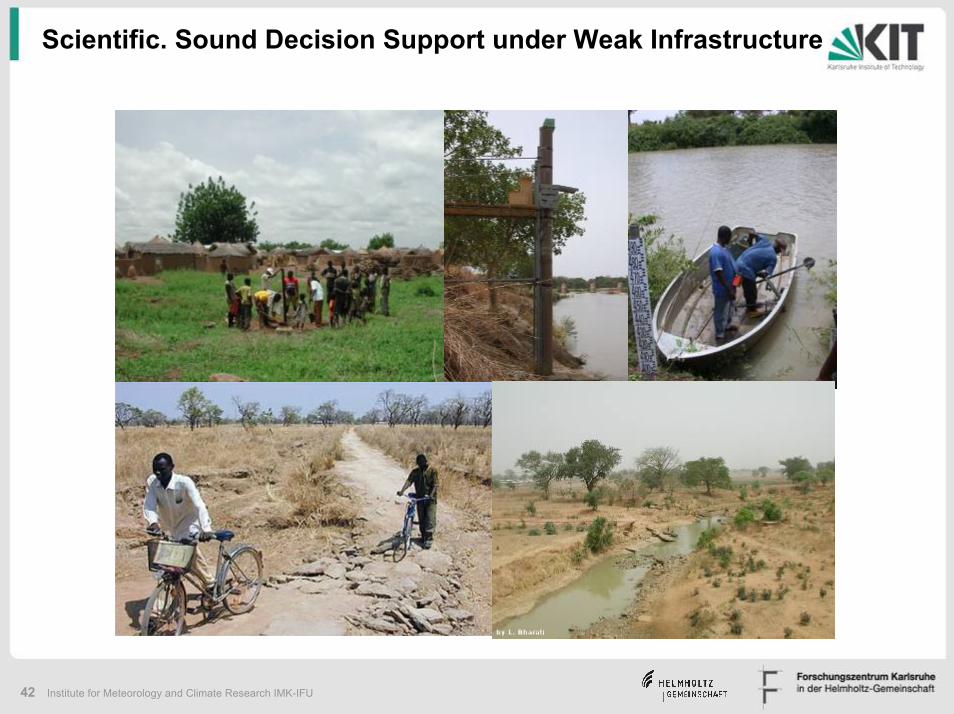
Scientific. Sound Decision Support under Weak Infrastructure
43 Institute for Meteorology and Climate Research IMK-IFU
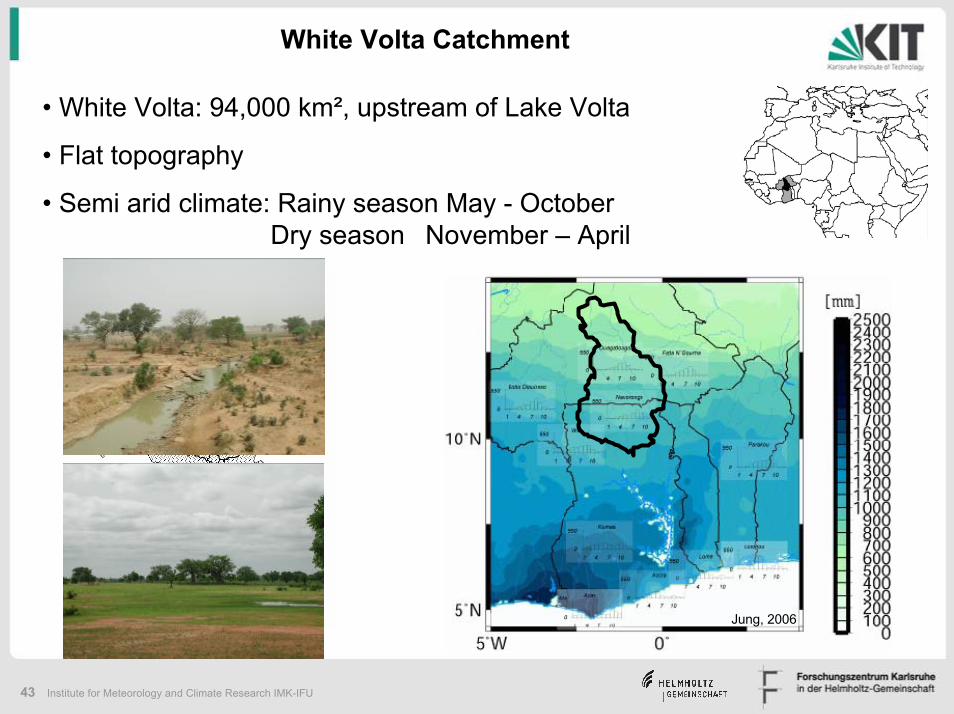
White Volta Catchment
• White Volta: 94,000 km², upstream of Lake Volta
• Flat topography
• Semi arid climate: Rainy season May - October Dry season November – April
Jung, 2006
44 Institute for Meteorology and Climate Research IMK-IFU
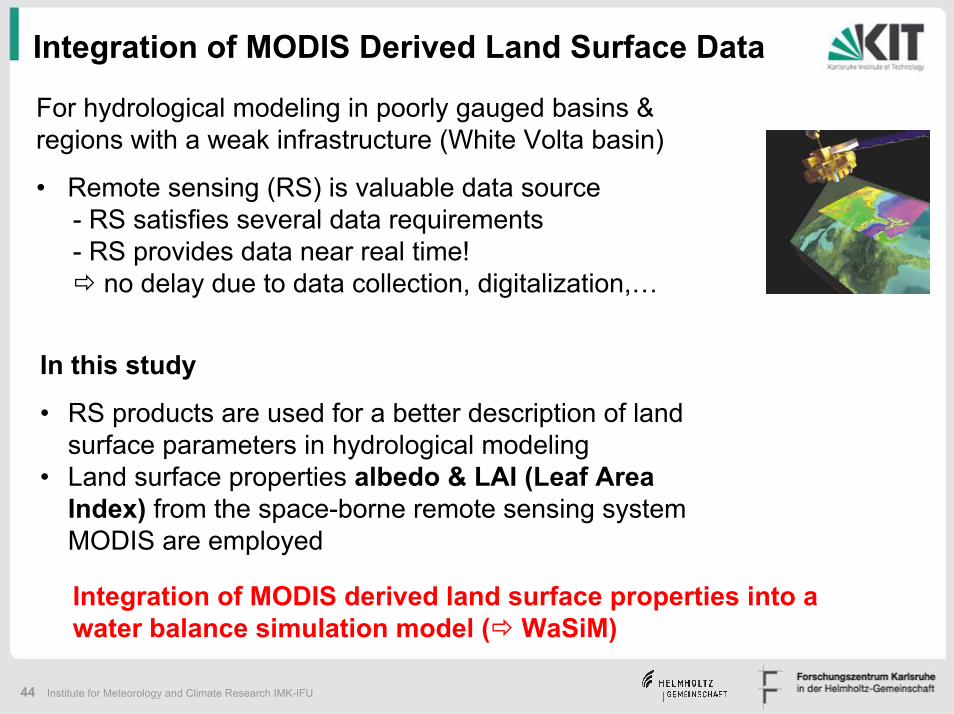
Integration of MODIS Derived Land Surface Data
For hydrological modeling in poorly gauged basins & regions with a weak infrastructure (White Volta basin)
• Remote sensing (RS) is valuable data source - RS satisfies several data requirements - RS provides data near real time!
no delay due to data collection, digitalization,…
In this study
• RS products are used for a better description of land surface parameters in hydrological modeling
• Land surface properties albedo & LAI (Leaf Area Index) from the space-borne remote sensing system MODIS are employed
Integration of MODIS derived land surface properties into a water balance simulation model ( WaSiM)
45 Institute for Meteorology and Climate Research IMK-IFU
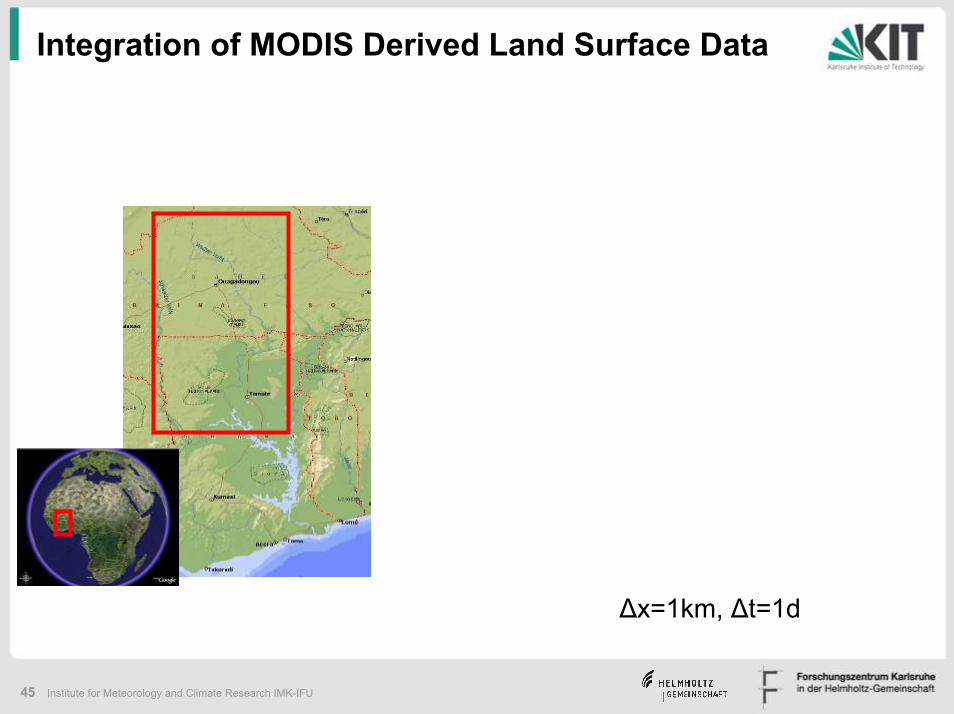
Integration of MODIS Derived Land Surface Data
Digital Elevation Model
∆x=1km, ∆t=1d
46 Institute for Meteorology and Climate Research IMK-IFU
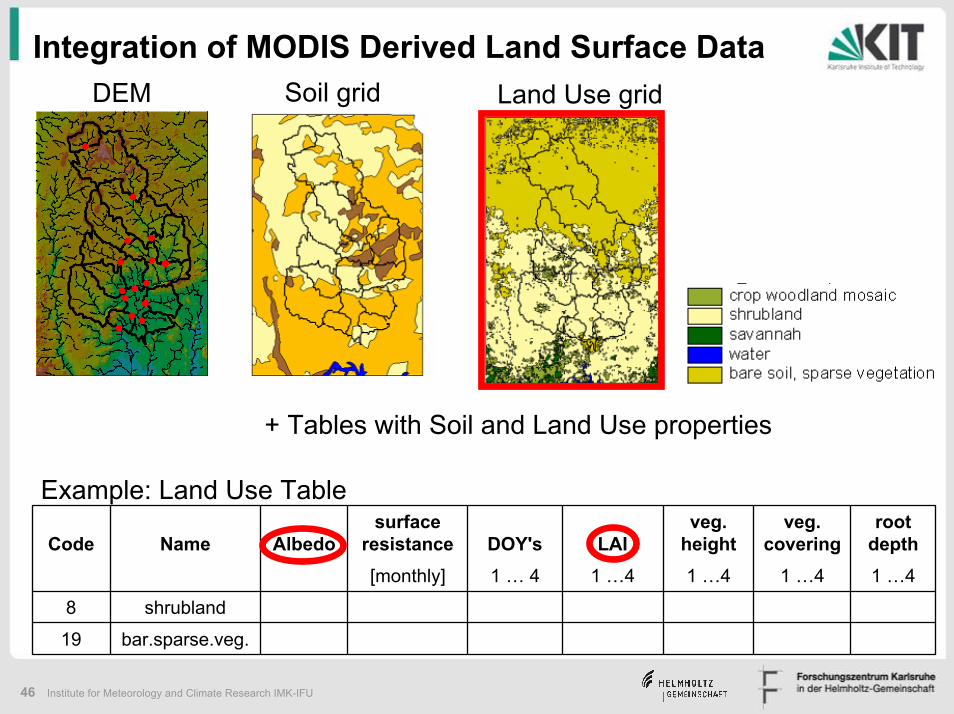
Integration of MODIS Derived Land Surface DataDEM Soil grid Land Use grid
+ Tables with Soil and Land Use properties
Code Name Albedosurface
resistance DOY's LAIveg.
height veg.
coveringroot
depth[monthly] 1 … 4 1 …4 1 …4 1 …4 1 …4
8 shrubland
19 bar.sparse.veg.
Example: Land Use Table
47 Institute for Meteorology and Climate Research IMK-IFU
Integration of MODIS Derived Land Surface Data
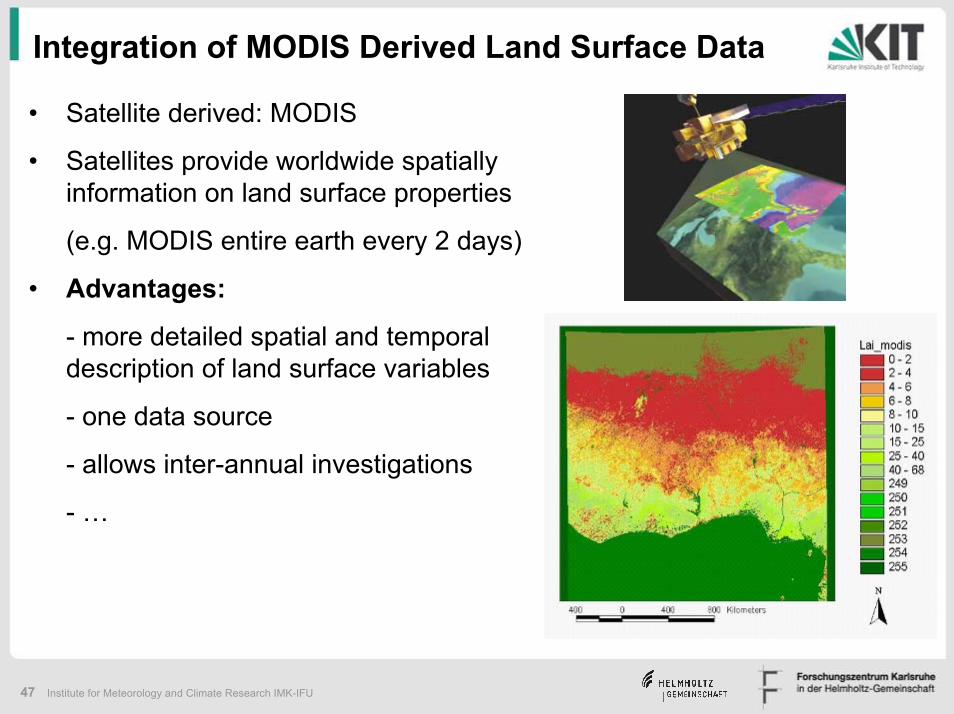
• Satellite derived: MODIS
• Satellites provide worldwide spatially information on land surface properties
(e.g. MODIS entire earth every 2 days)
• Advantages:
- more detailed spatial and temporal description of land surface variables
- one data source
- allows inter-annual investigations
- …
48 Institute for Meteorology and Climate Research IMK-IFU
Integration of MODIS Derived Land Surface Data
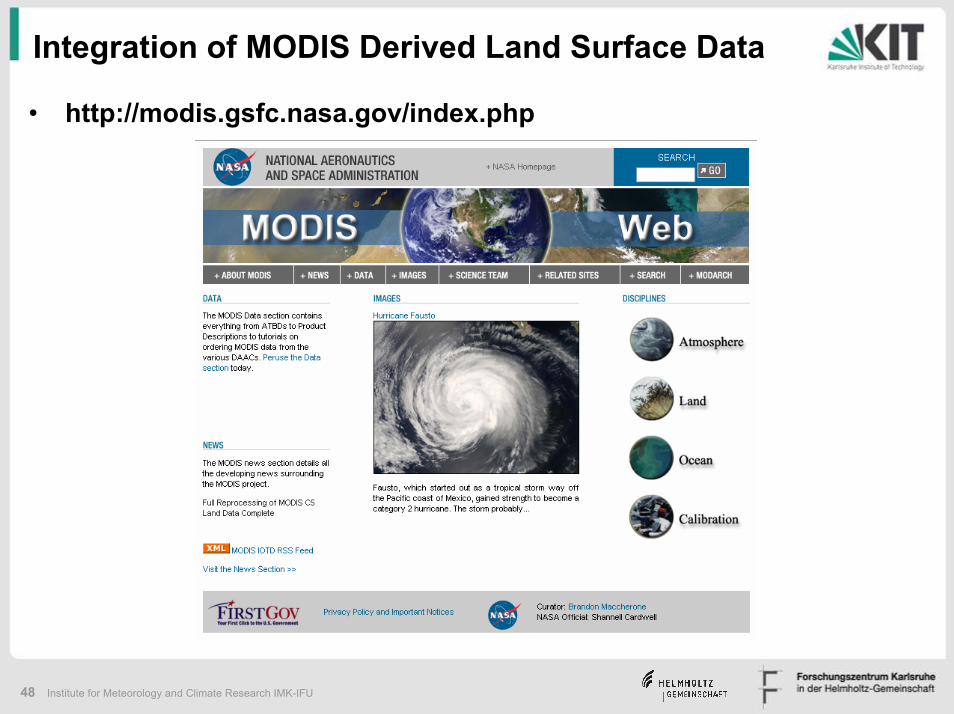
• http://modis.gsfc.nasa.gov/index.php
49 Institute for Meteorology and Climate Research IMK-IFU
Integration of MODIS Derived Land Surface Data
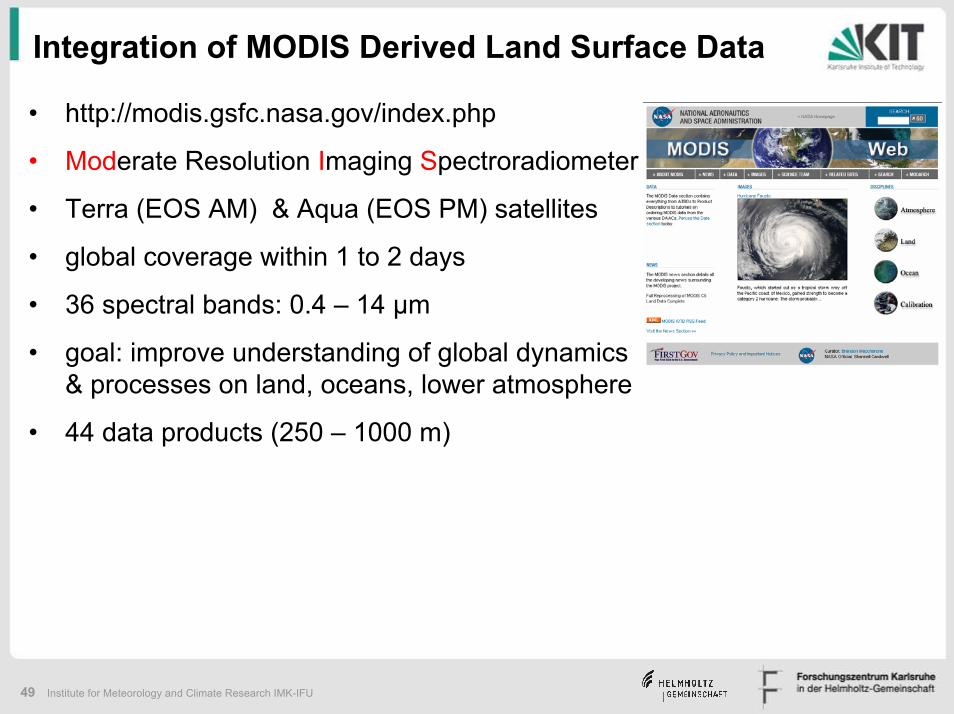
• http://modis.gsfc.nasa.gov/index.php
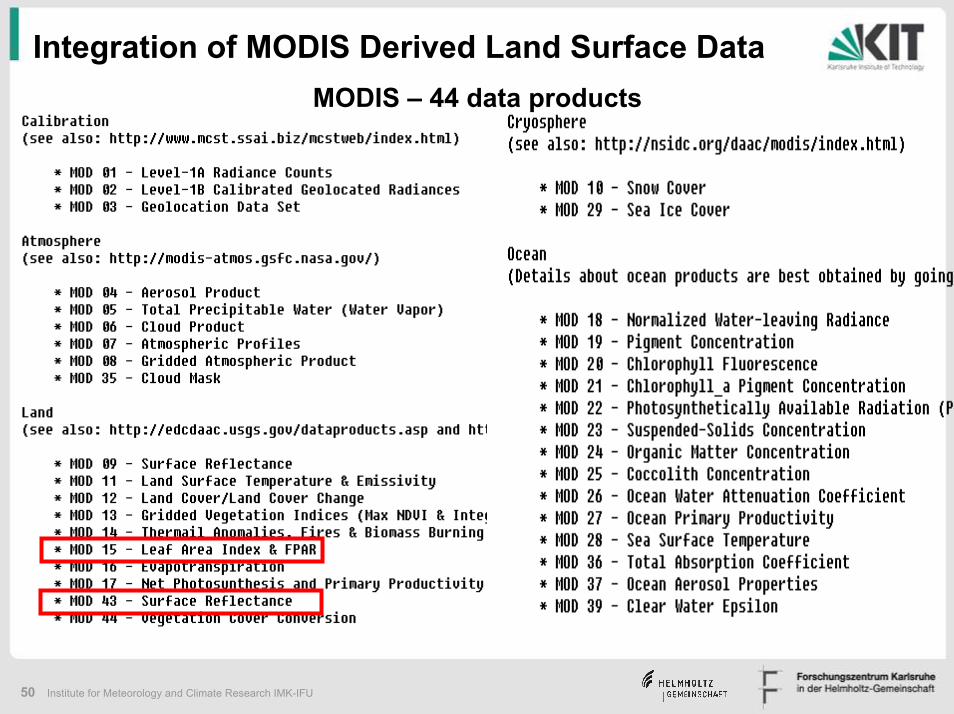
• Moderate Resolution Imaging Spectroradiometer
• Terra (EOS AM) & Aqua (EOS PM) satellites
• global coverage within 1 to 2 days
• 36 spectral bands: 0.4 – 14 µm
• goal: improve understanding of global dynamics & processes on land, oceans, lower atmosphere
• 44 data products (250 – 1000 m)
50 Institute for Meteorology and Climate Research IMK-IFU
MODIS – 44 data products
Integration of MODIS Derived Land Surface Data
51 Institute for Meteorology and Climate Research IMK-IFU
Integration of MODIS Derived Land Surface Data
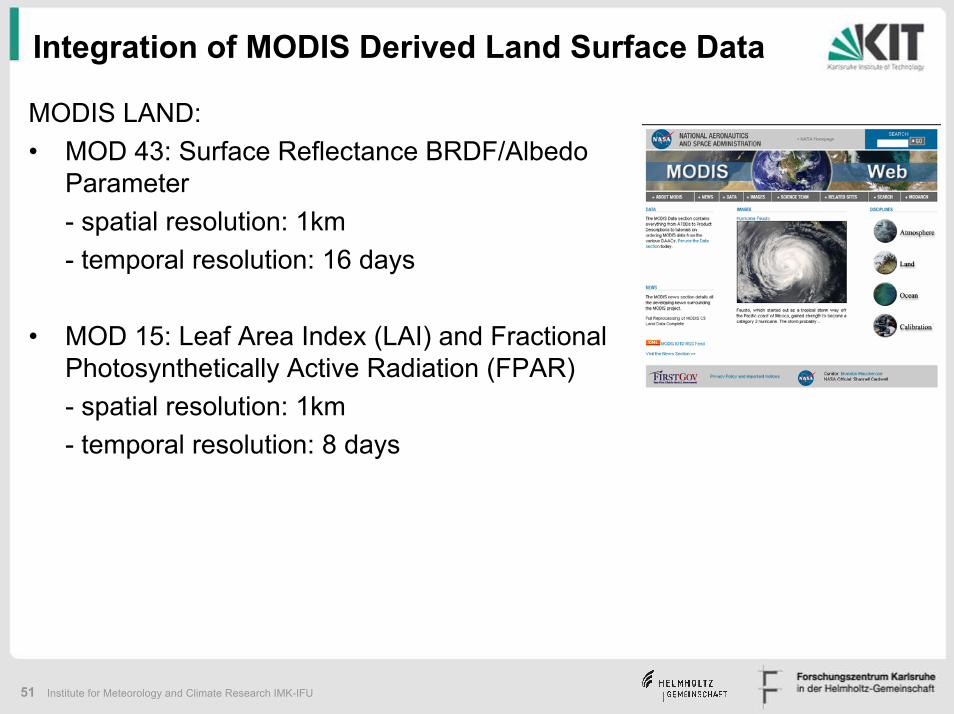
MODIS LAND: • MOD 43: Surface Reflectance BRDF/Albedo
Parameter - spatial resolution: 1km- temporal resolution: 16 days
• MOD 15: Leaf Area Index (LAI) and Fractional Photosynthetically Active Radiation (FPAR)- spatial resolution: 1km- temporal resolution: 8 days
52 Institute for Meteorology and Climate Research IMK-IFU
Potential evapotranspiration
α
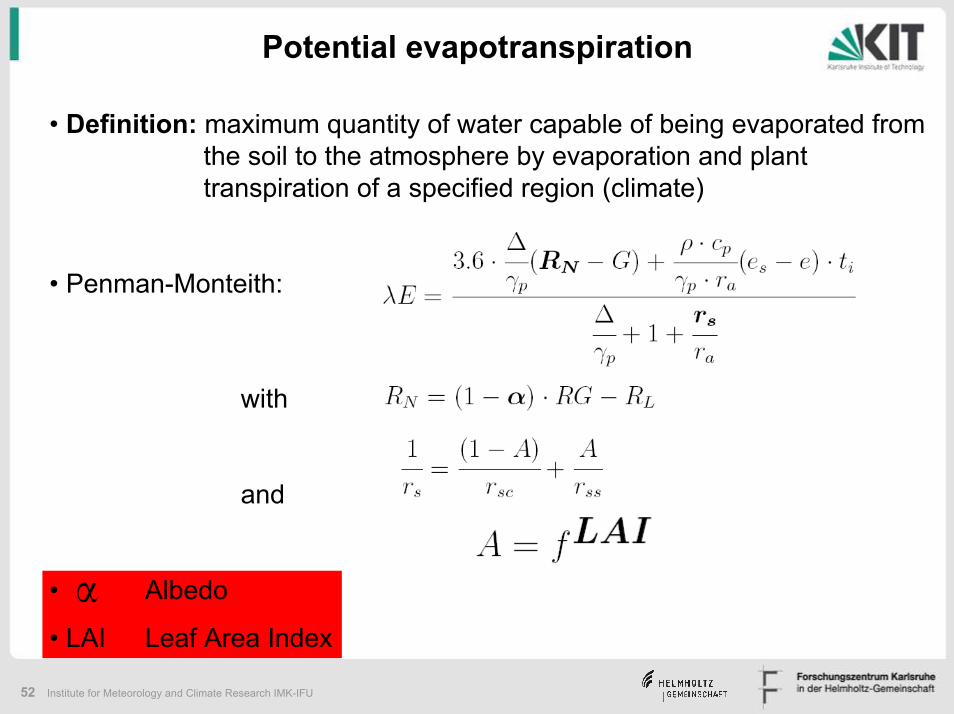
• Definition: maximum quantity of water capable of being evaporated from the soil to the atmosphere by evaporation and plant transpiration of a specified region (climate)
• Penman-Monteith:
with
and
• Albedo
• LAI Leaf Area Index
53 Institute for Meteorology and Climate Research IMK-IFU
Potential evapotranspiration
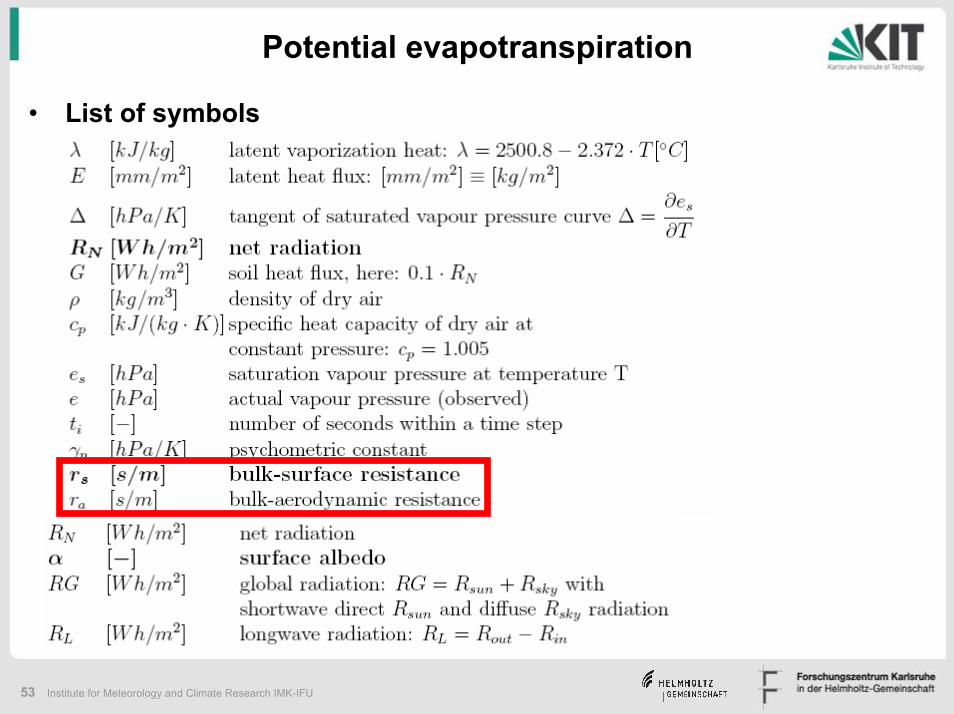
• List of symbols
54 Institute for Meteorology and Climate Research IMK-IFU
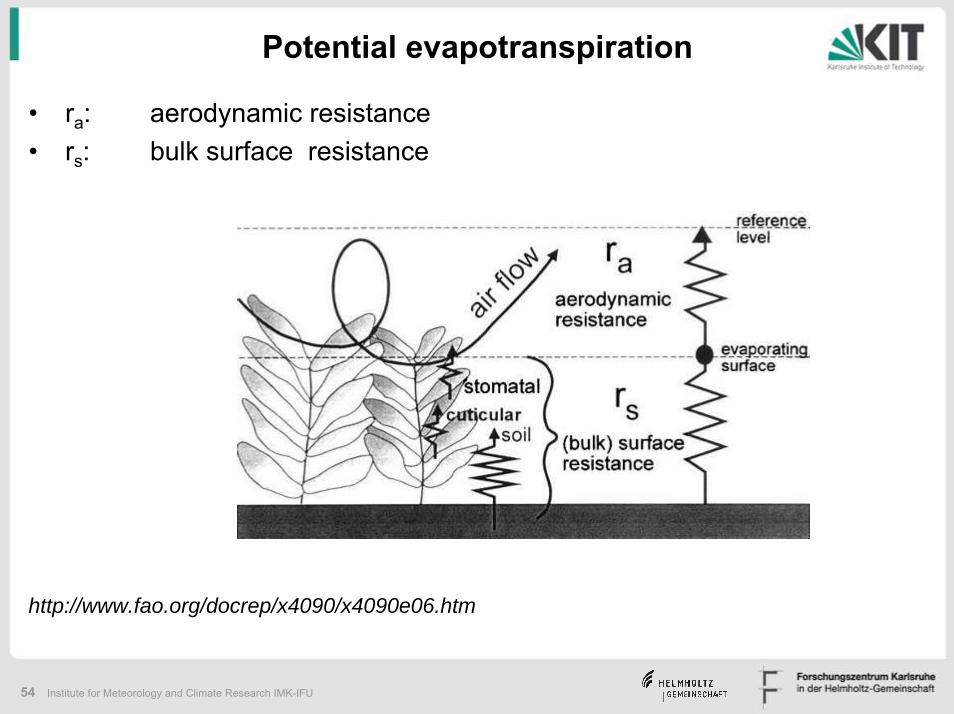
Potential evapotranspiration
• ra: aerodynamic resistance• rs: bulk surface resistance
http://www.fao.org/docrep/x4090/x4090e06.htm
55 Institute for Meteorology and Climate Research IMK-IFU
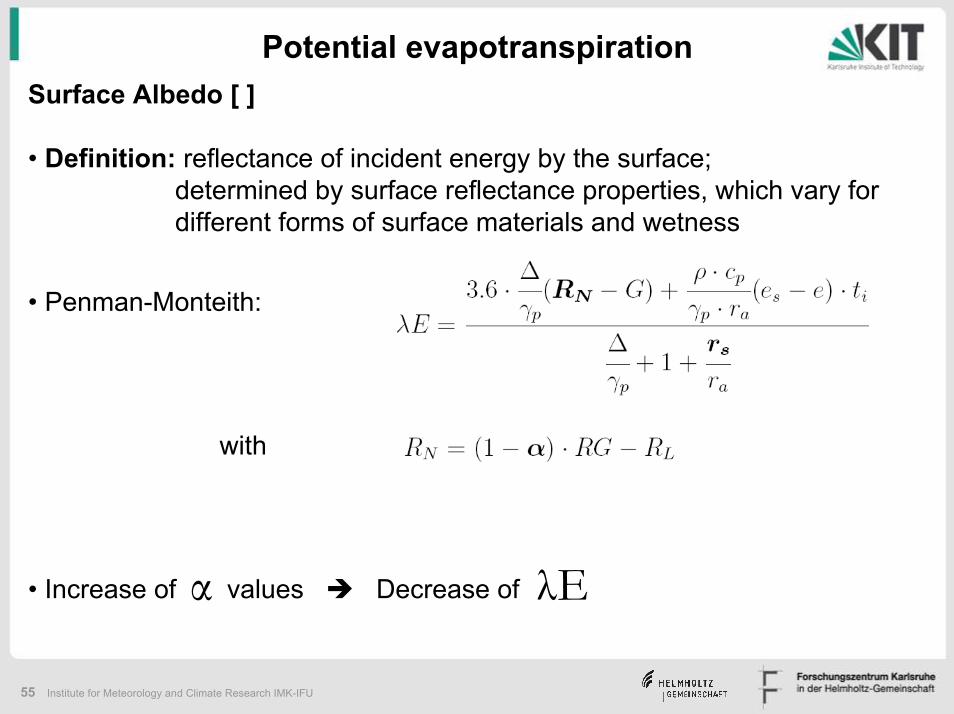
Potential evapotranspirationSurface Albedo [ ]
• Definition: reflectance of incident energy by the surface; determined by surface reflectance properties, which vary for different forms of surface materials and wetness
• Penman-Monteith:
with
• Increase of values Decrease ofα Eλ
56 Institute for Meteorology and Climate Research IMK-IFU
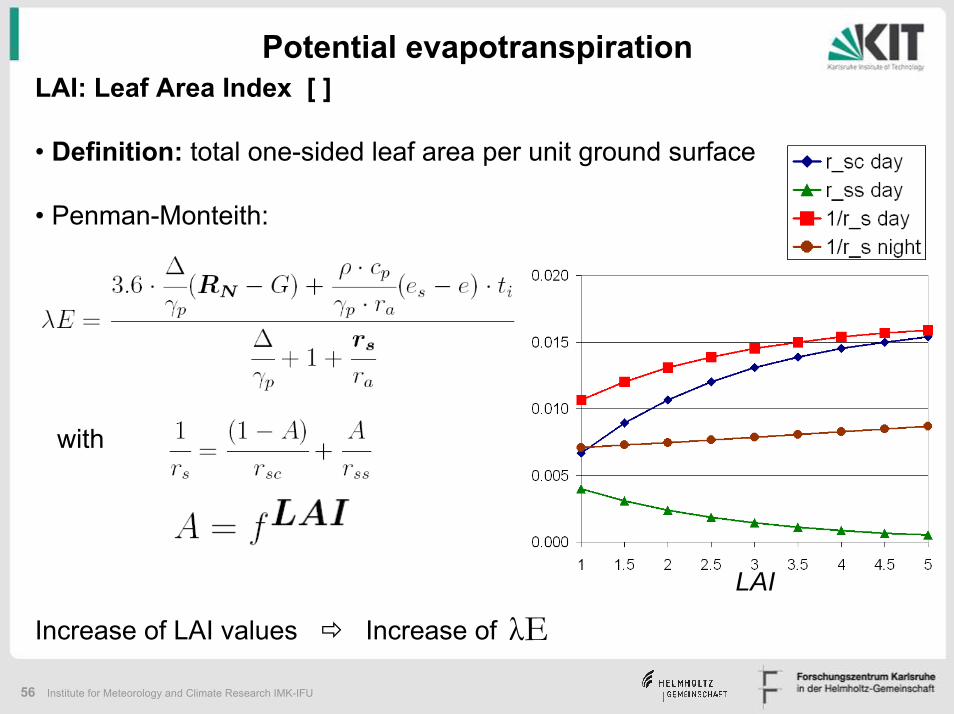
LAI: Leaf Area Index [ ]
• Definition: total one-sided leaf area per unit ground surface
• Penman-Monteith:
with
Increase of LAI values Increase of
Potential evapotranspiration
EλLAI
57 Institute for Meteorology and Climate Research IMK-IFU
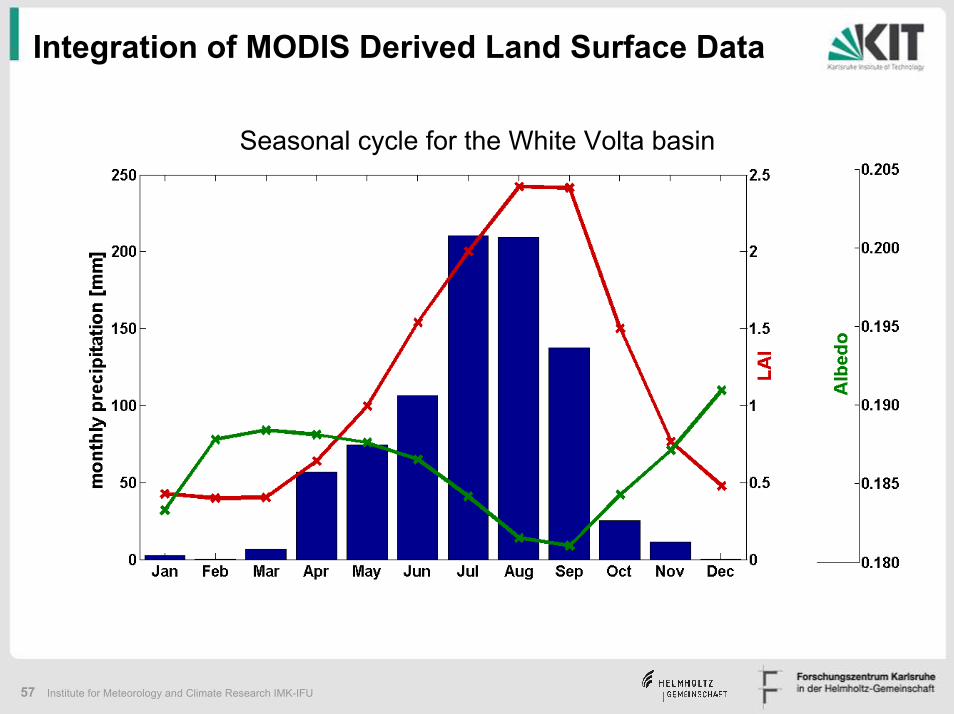
Integration of MODIS Derived Land Surface Data
Seasonal cycle for the White Volta basin
58 Institute for Meteorology and Climate Research IMK-IFU
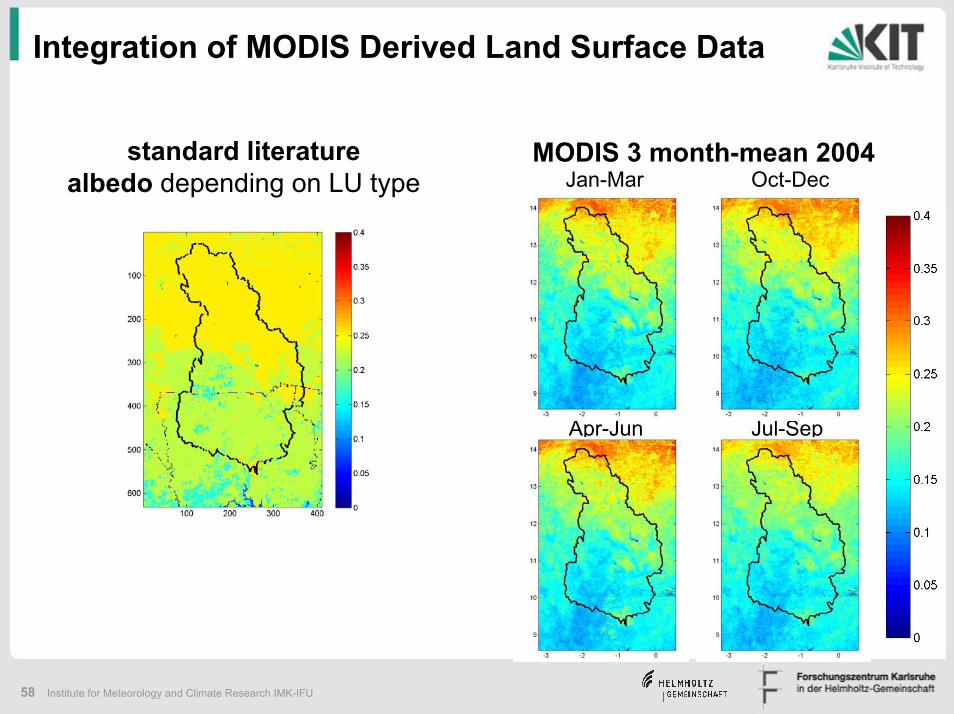
Integration of MODIS Derived Land Surface Data
standard literaturealbedo depending on LU type
MODIS 3 month-mean 2004 Jan-Mar Oct-Dec
Jul-SepApr-Jun
59 Institute for Meteorology and Climate Research IMK-IFU
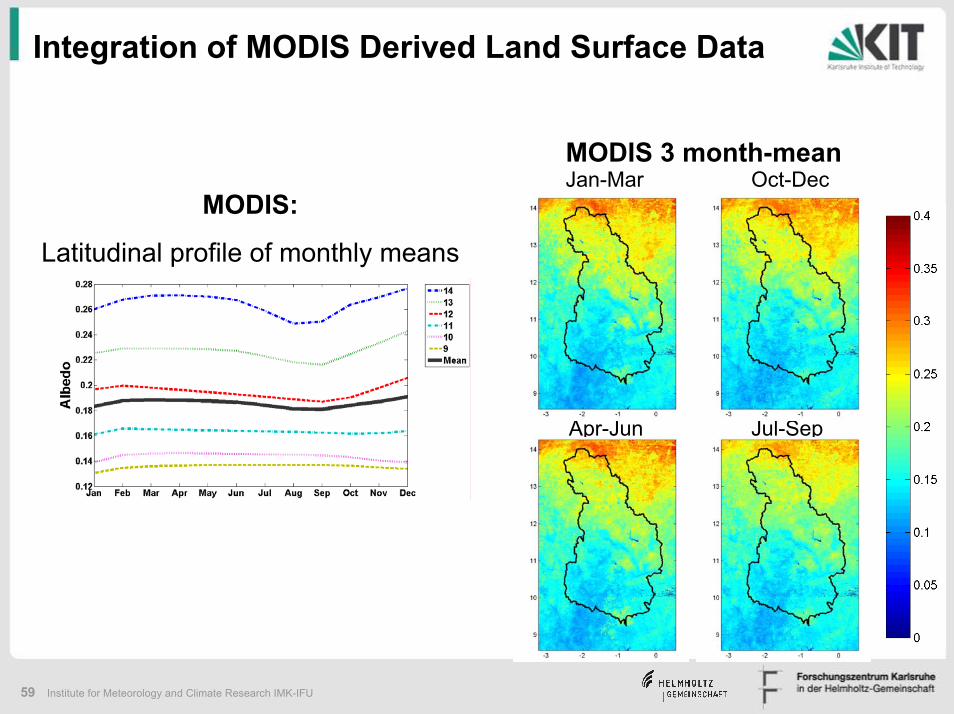
Integration of MODIS Derived Land Surface Data
MODIS 3 month-mean Jan-Mar Oct-Dec
Jul-SepApr-Jun
MODIS:
Latitudinal profile of monthly means
60 Institute for Meteorology and Climate Research IMK-IFU
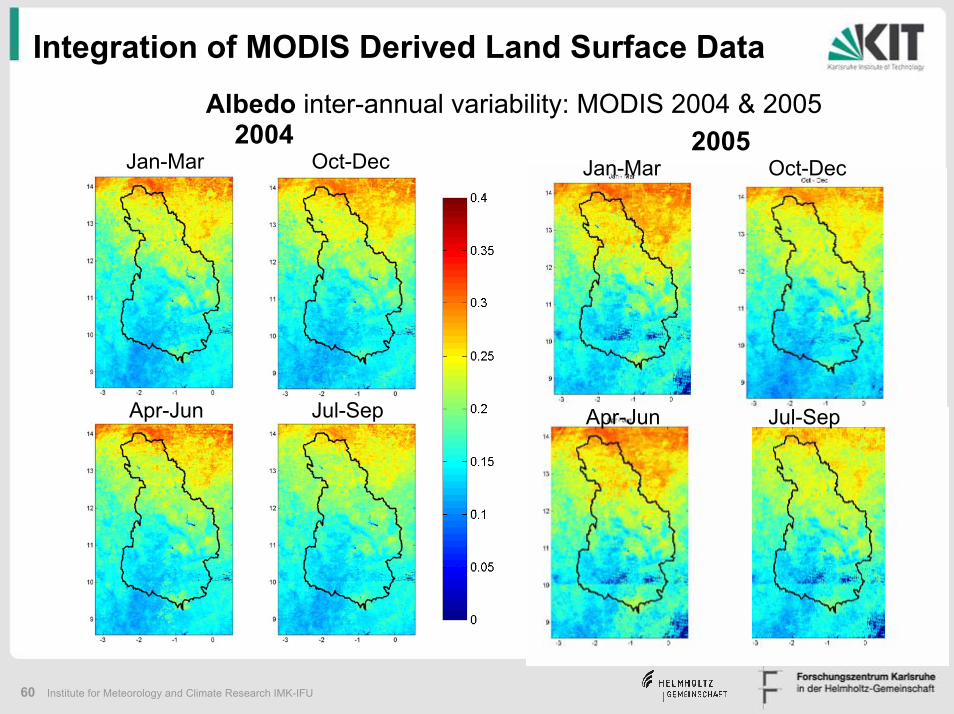
2004Jan-Mar Oct-Dec
Jul-SepApr-Jun
Albedo inter-annual variability: MODIS 2004 & 20052005
Jan-Mar Oct-Dec
Jul-SepApr-Jun
Integration of MODIS Derived Land Surface Data
61 Institute for Meteorology and Climate Research IMK-IFU
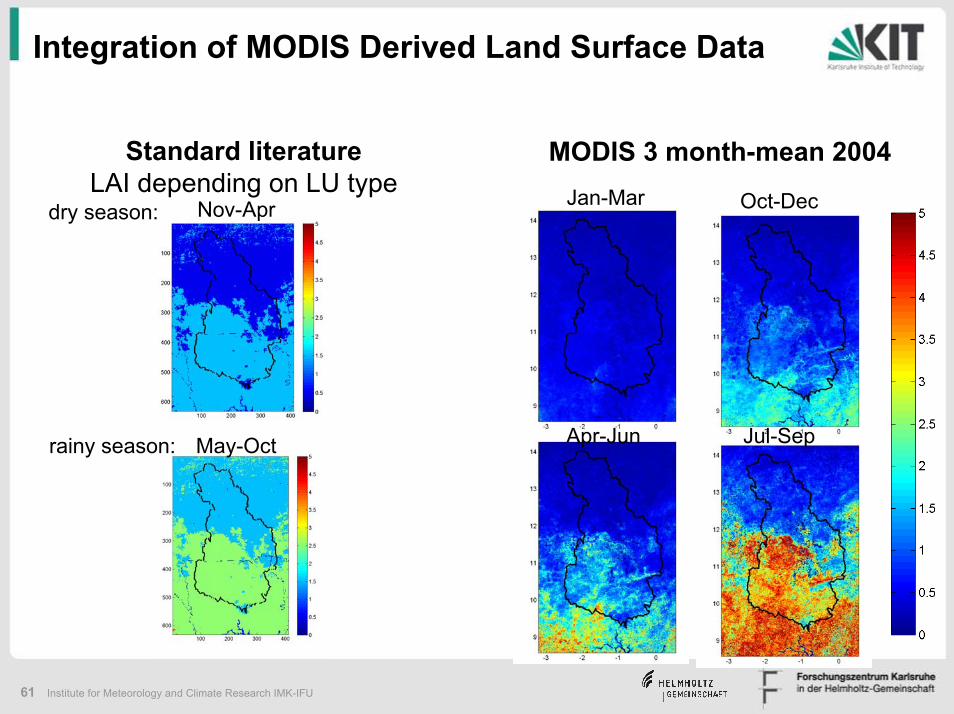
Integration of MODIS Derived Land Surface Data
Standard literatureLAI depending on LU type
MODIS 3 month-mean 2004 Jan-Mar Oct-Dec
Jul-SepApr-Jun
dry season:
rainy season:
Nov-Apr
May-Oct
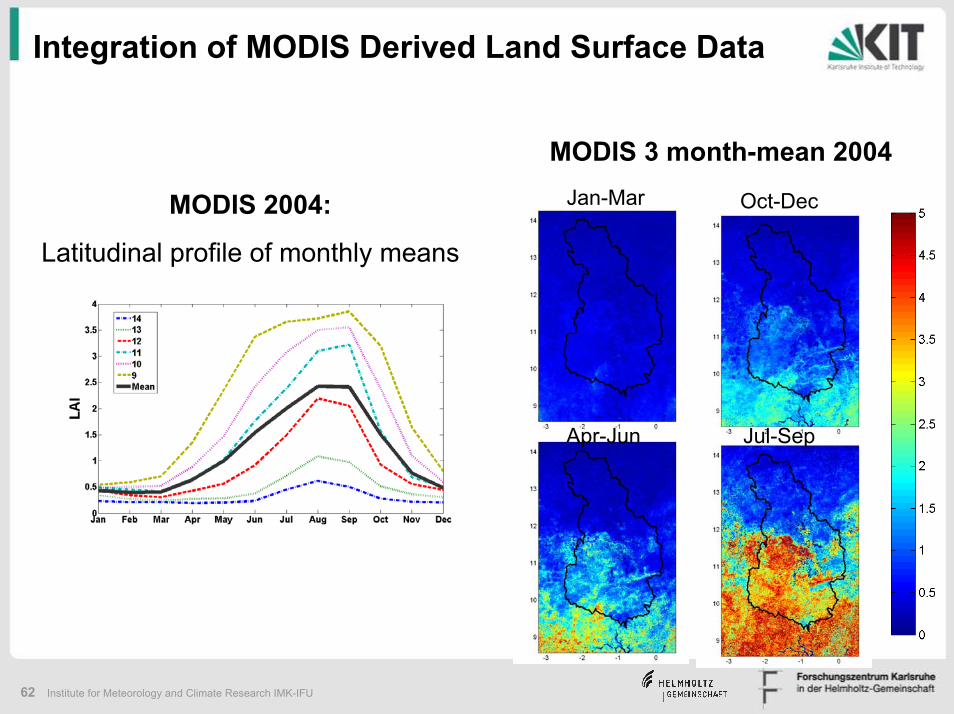
62 Institute for Meteorology and Climate Research IMK-IFU
Integration of MODIS Derived Land Surface Data
MODIS 3 month-mean 2004 Jan-Mar Oct-Dec
Jul-SepApr-Jun
MODIS 2004:
Latitudinal profile of monthly means
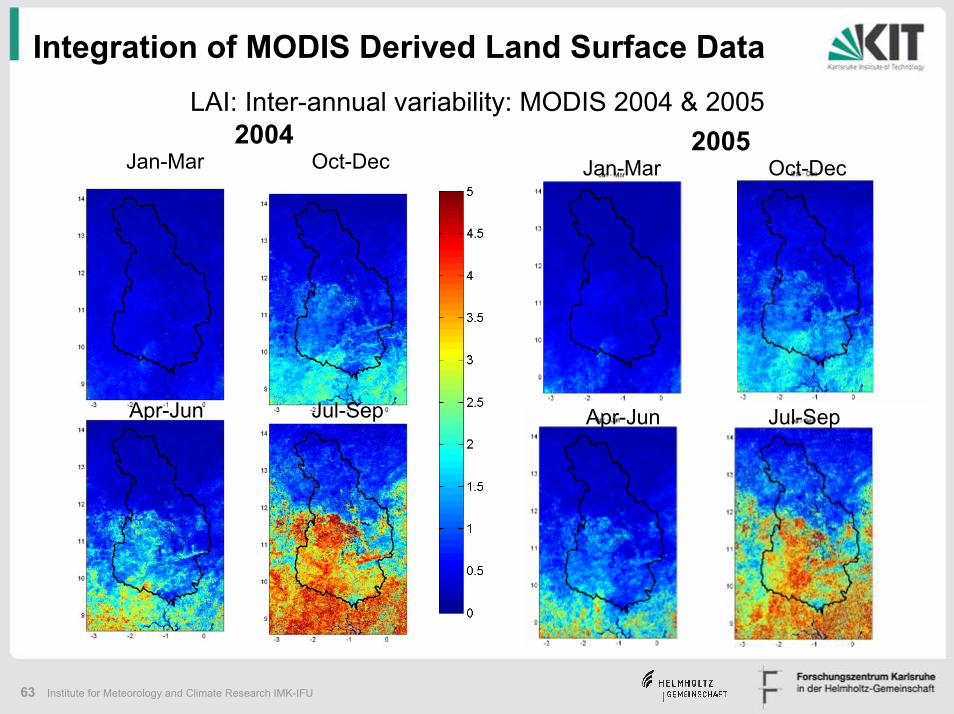
63 Institute for Meteorology and Climate Research IMK-IFU
2004Jan-Mar Oct-Dec
Jul-SepApr-Jun
LAI: Inter-annual variability: MODIS 2004 & 20052005
Jan-Mar Oct-Dec
Jul-SepApr-Jun
Integration of MODIS Derived Land Surface Data
64 Institute for Meteorology and Climate Research IMK-IFU
Impact of MODIS albedo and LAI on water balance estimations
a) time series of spatially aggregated variables
b) spatial distribution of annual sums

65 Institute for Meteorology and Climate Research IMK-IFU
Integration of MODIS Derived Land Surface Data
Eta [mm]2004:
ETp [mm]
Qtotal [mm]
legend: Control-RunMODIS Albedo MODIS LAI MODIS Albedo & LAI
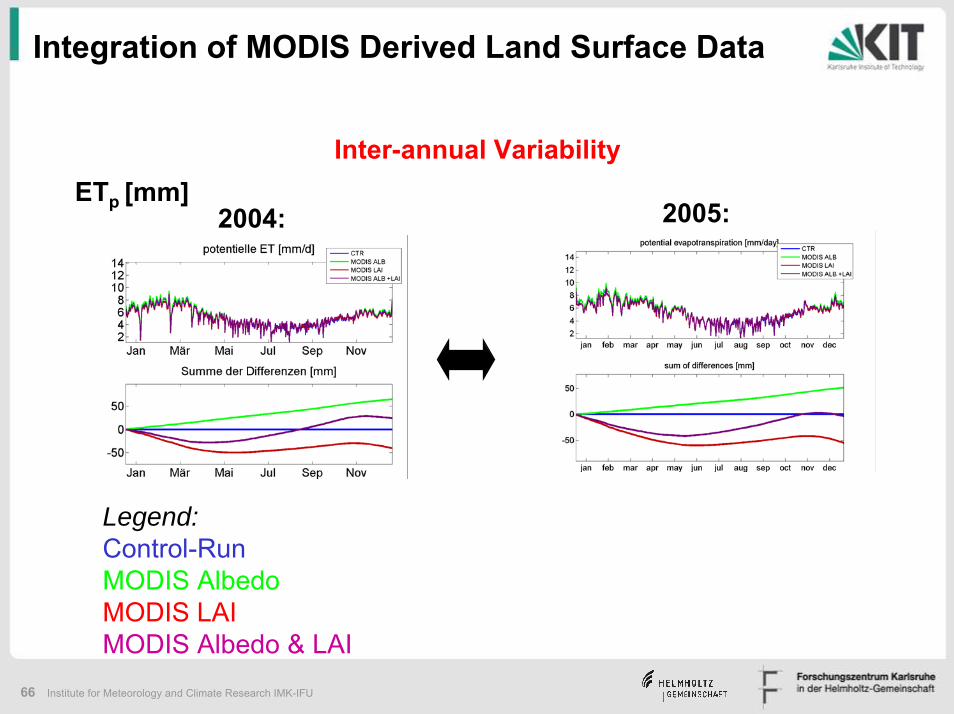
66 Institute for Meteorology and Climate Research IMK-IFU
Inter-annual VariabilityETp [mm]
2004: 2005:
Integration of MODIS Derived Land Surface Data
Legend: Control-RunMODIS Albedo MODIS LAI MODIS Albedo & LAI
67 Institute for Meteorology and Climate Research IMK-IFU
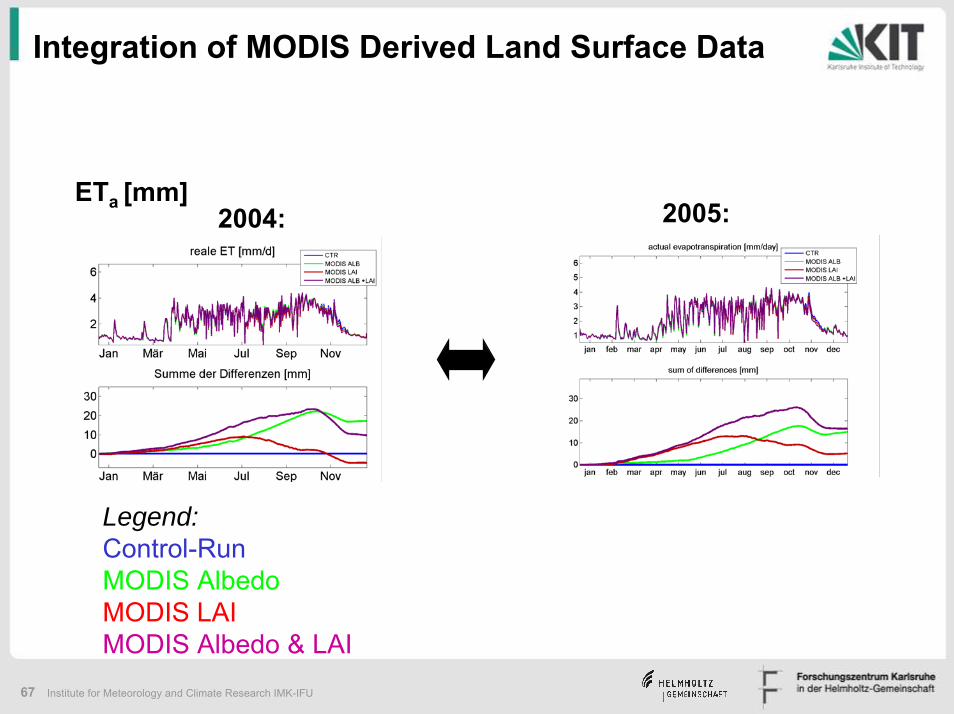
ETa [mm]2004: 2005:
Integration of MODIS Derived Land Surface Data
Legend: Control-RunMODIS Albedo MODIS LAI MODIS Albedo & LAI
68 Institute for Meteorology and Climate Research IMK-IFU
Integration of MODIS Derived Land Surface Data
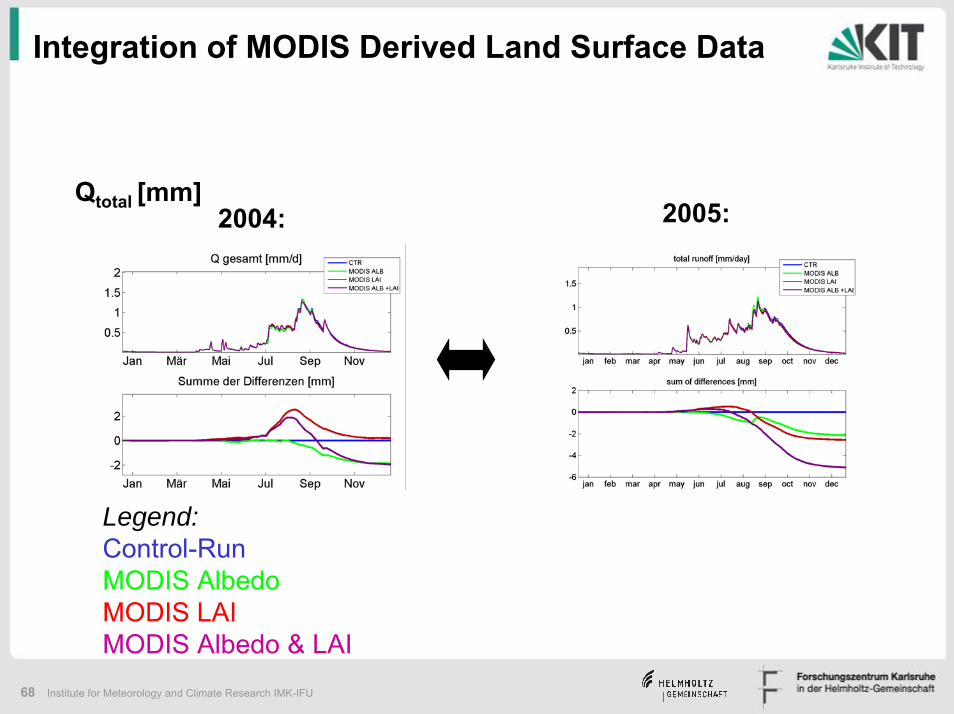
Qtotal [mm]2004: 2005:
Legend: Control-RunMODIS Albedo MODIS LAI MODIS Albedo & LAI
69 Institute for Meteorology and Climate Research IMK-IFU
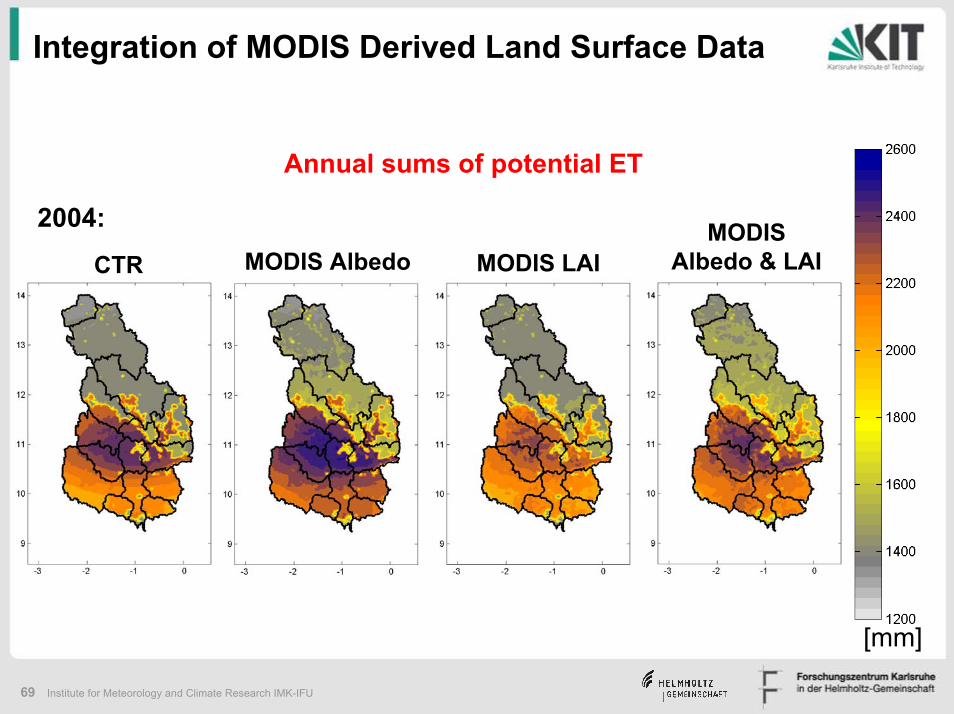
Integration of MODIS Derived Land Surface Data
Annual sums of potential ET
MODIS LAIMODIS
Albedo & LAIMODIS AlbedoCTR
2004:
[mm]
70 Institute for Meteorology and Climate Research IMK-IFU
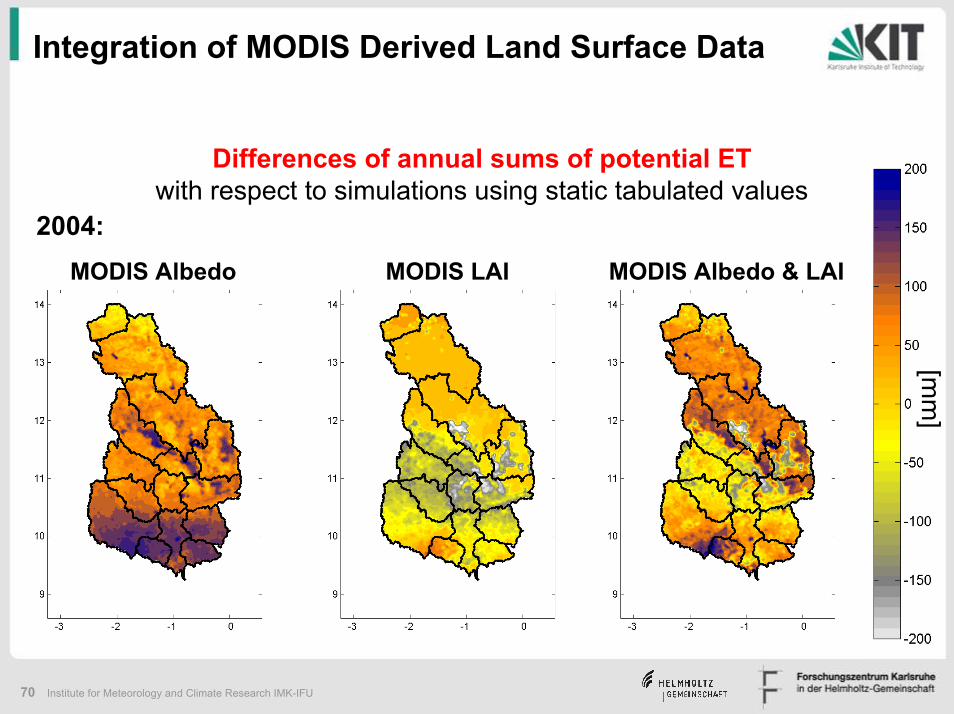
Integration of MODIS Derived Land Surface Data
MODIS Albedo MODIS LAI
Differences of annual sums of potential ETwith respect to simulations using static tabulated values
[mm
]
MODIS Albedo & LAI
2004:
71 Institute for Meteorology and Climate Research IMK-IFU
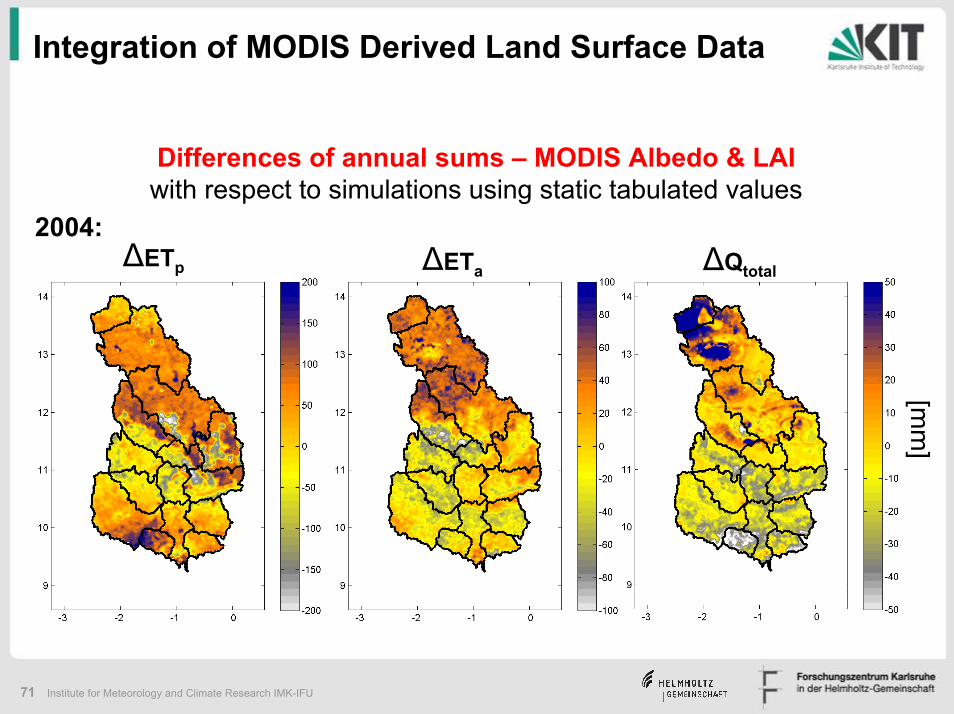
Integration of MODIS Derived Land Surface Data
Differences of annual sums – MODIS Albedo & LAIwith respect to simulations using static tabulated values
[mm
]
∆Qtotal∆ETa∆ETp
2004:
72 Institute for Meteorology and Climate Research IMK-IFU
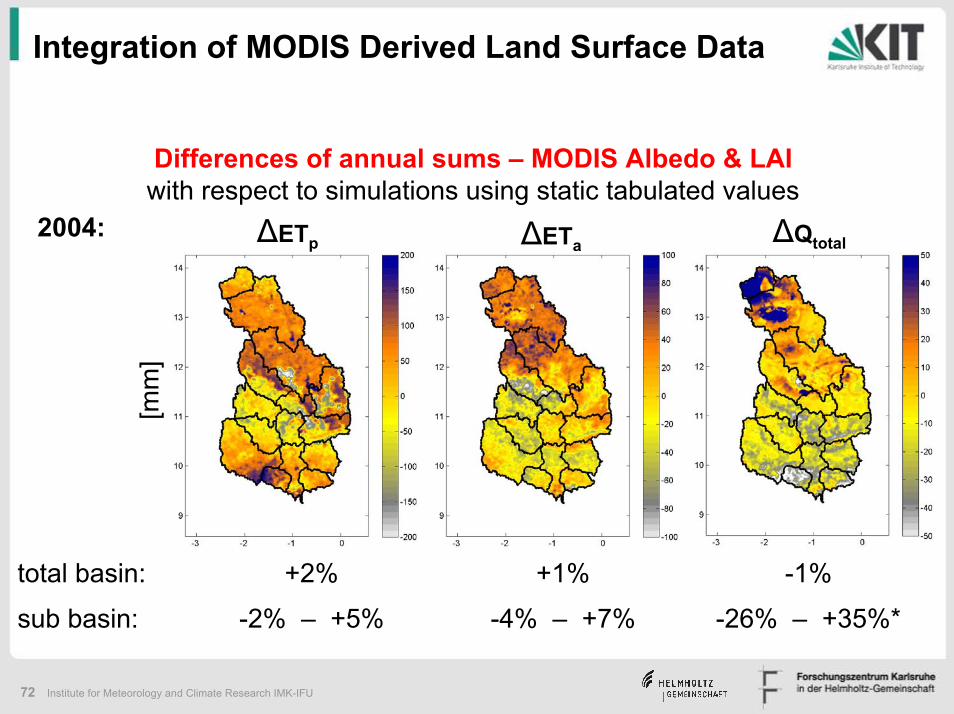
Integration of MODIS Derived Land Surface Data
∆ETa ∆Qtotal∆ETp
[mm
]Differences of annual sums – MODIS Albedo & LAI
with respect to simulations using static tabulated values2004:
total basin: +2% +1%
-2% – +5% -4% – +7%
-1%
sub basin: -26% – +35%*
73 Institute for Meteorology and Climate Research IMK-IFU
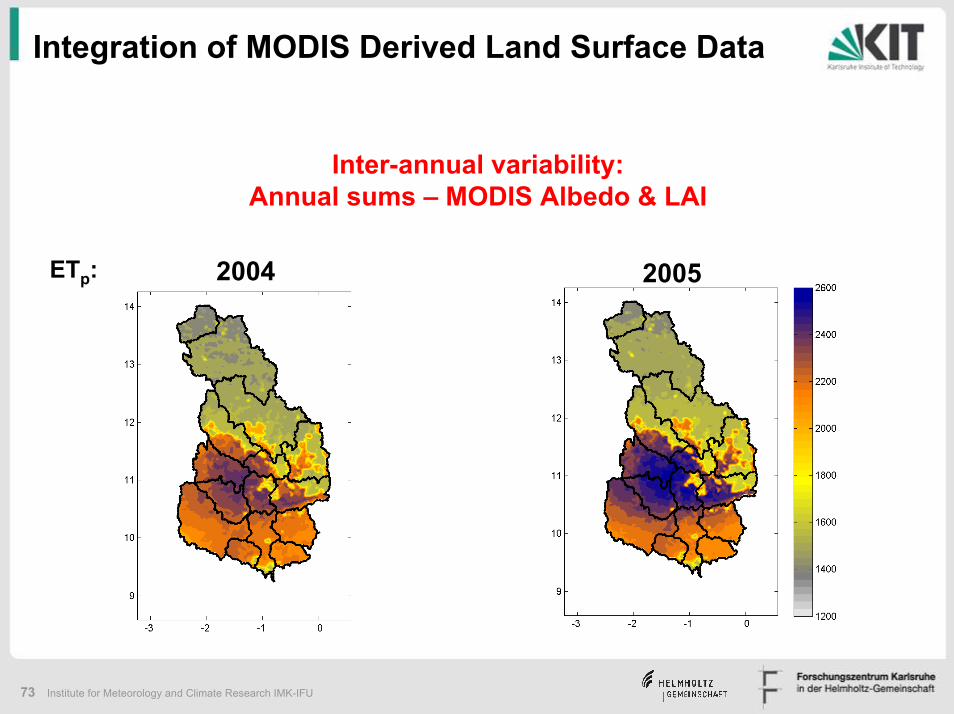
Integration of MODIS Derived Land Surface Data
Inter-annual variability: Annual sums – MODIS Albedo & LAI
ETp: 2004 2005
74 Institute for Meteorology and Climate Research IMK-IFU
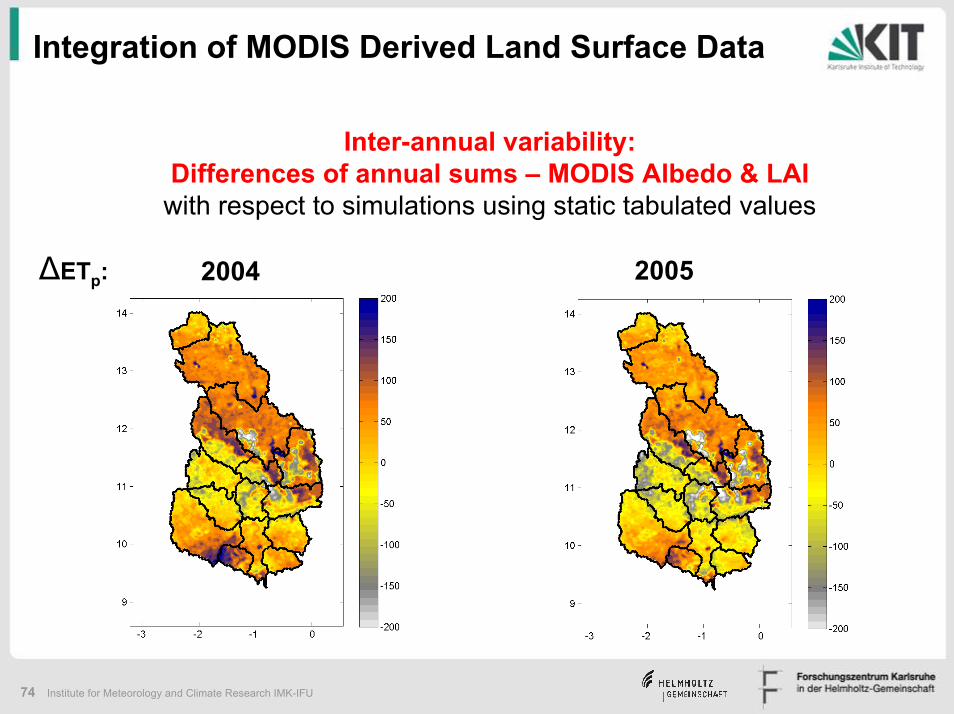
Integration of MODIS Derived Land Surface Data
Inter-annual variability: Differences of annual sums – MODIS Albedo & LAIwith respect to simulations using static tabulated values
∆ETp: 20052004
75 Institute for Meteorology and Climate Research IMK-IFU
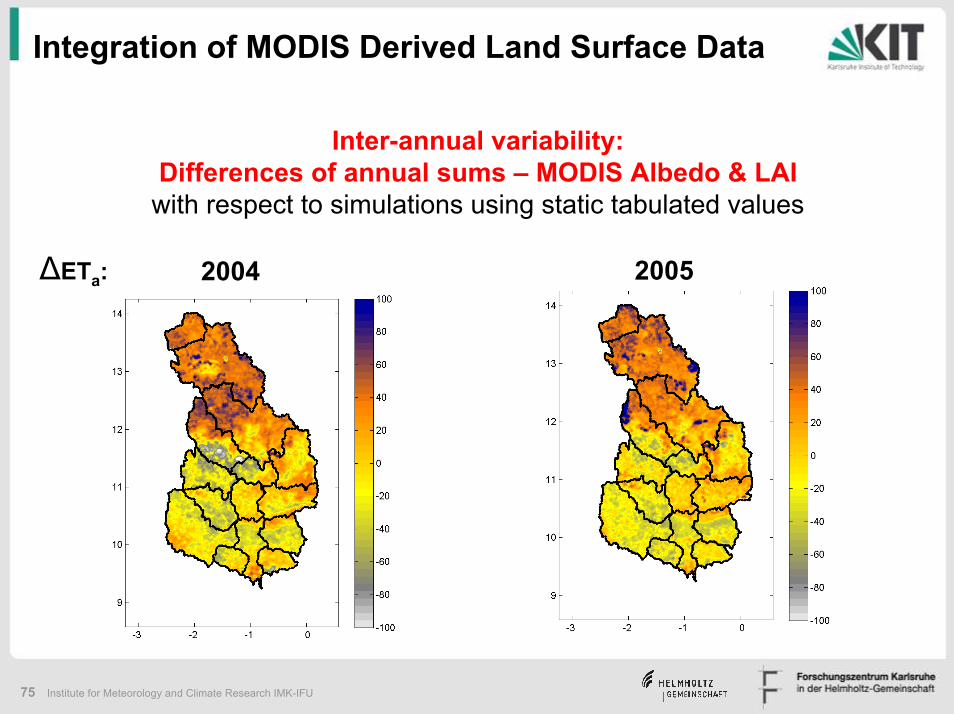
Integration of MODIS Derived Land Surface Data
Inter-annual variability:Differences of annual sums – MODIS Albedo & LAI
with respect to simulations using static tabulated values
∆ETa: 2004 2005
76 Institute for Meteorology and Climate Research IMK-IFU
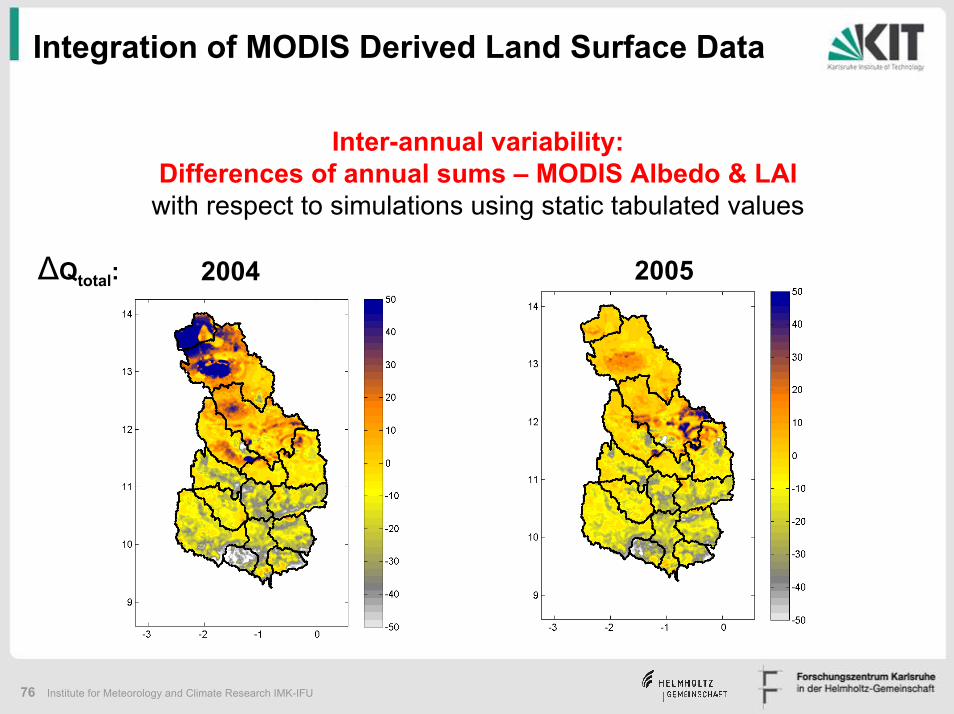
Integration of MODIS Derived Land Surface Data
Inter-annual variability:Differences of annual sums – MODIS Albedo & LAI
with respect to simulations using static tabulated values
∆Qtotal: 2004 2005
77 Institute for Meteorology and Climate Research IMK-IFU
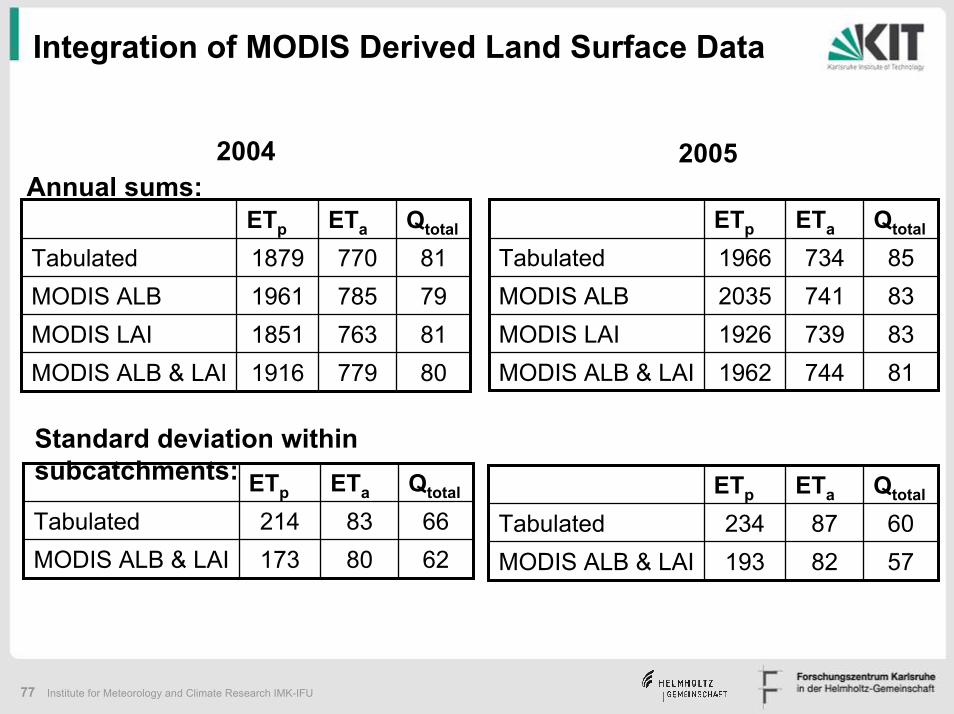
2004 2005
ETp ETa Qtotal
Tabulated 1879 770 81MODIS ALB 1961 785 79MODIS LAI 1851 763 81MODIS ALB & LAI 1916 779 80
ETp ETa Qtotal
Tabulated 1966 734 85MODIS ALB 2035 741 83MODIS LAI 1926 739 83MODIS ALB & LAI 1962 744 81
ETp ETa Qtotal
Tabulated 214 83 66MODIS ALB & LAI 173 80 62
ETp ETa Qtotal
Tabulated 234 87 60MODIS ALB & LAI 193 82 57
Annual sums:
Standard deviation within subcatchments:
Integration of MODIS Derived Land Surface Data
78 Institute for Meteorology and Climate Research IMK-IFU
Integration of MODIS Derived Land Surface Data
Summary
• Integration of MODIS albedo & LAI into a hydrological model
• Comparison MODIS albedo & LAI versus standard literature values - albedo: increased level of detail in spatial dimension - LAI: additional better representation of temporal development
• MODIS application allows inter-annual comparisons - further advantage: all data are based on same data source & time
• Impact of MODIS albedo & LAI on hydrological simulation results- minor on daily time series of spatially aggregated variables - clear on spatial distribution of water balance variables

79 Institute for Meteorology and Climate Research IMK-IFU
Thanks to Andreas Marx and Sven Wagner
andthank you for your attention
80 Institute for Meteorology and Climate Research IMK-IFU
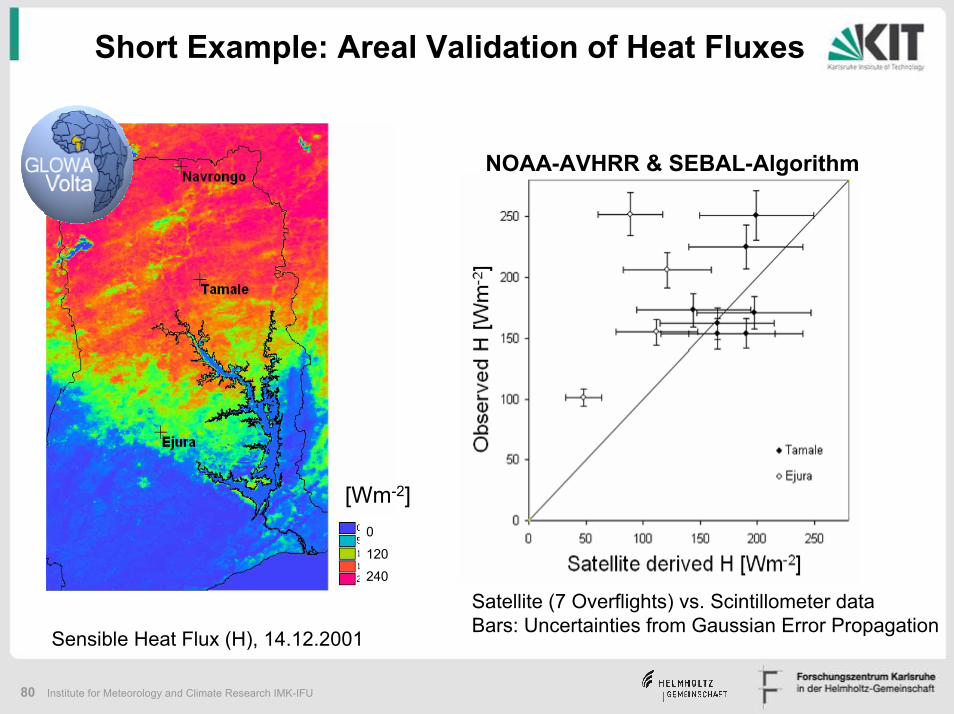
Short Example: Areal Validation of Heat Fluxes
0
120
240
[Wm-2]
NOAA-AVHRR & SEBAL-Algorithm
Satellite (7 Overflights) vs. Scintillometer dataBars: Uncertainties from Gaussian Error Propagation
Sensible Heat Flux (H), 14.12.2001
81 Institute for Meteorology and Climate Research IMK-IFU
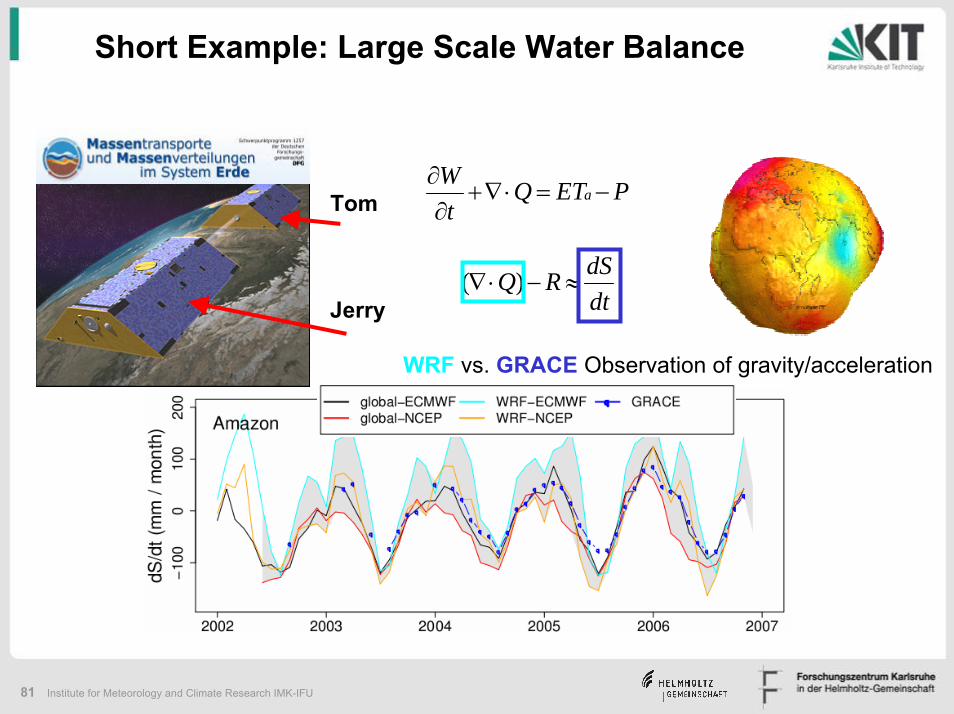
Short Example: Large Scale Water Balance
Tom
Jerry
PETQt
Wa −=⋅∇+
∂∂
dtdSRQ ≈−⋅∇ )(
WRF vs. GRACE Observation of gravity/acceleration
82 Institute for Meteorology and Climate Research IMK-IFU
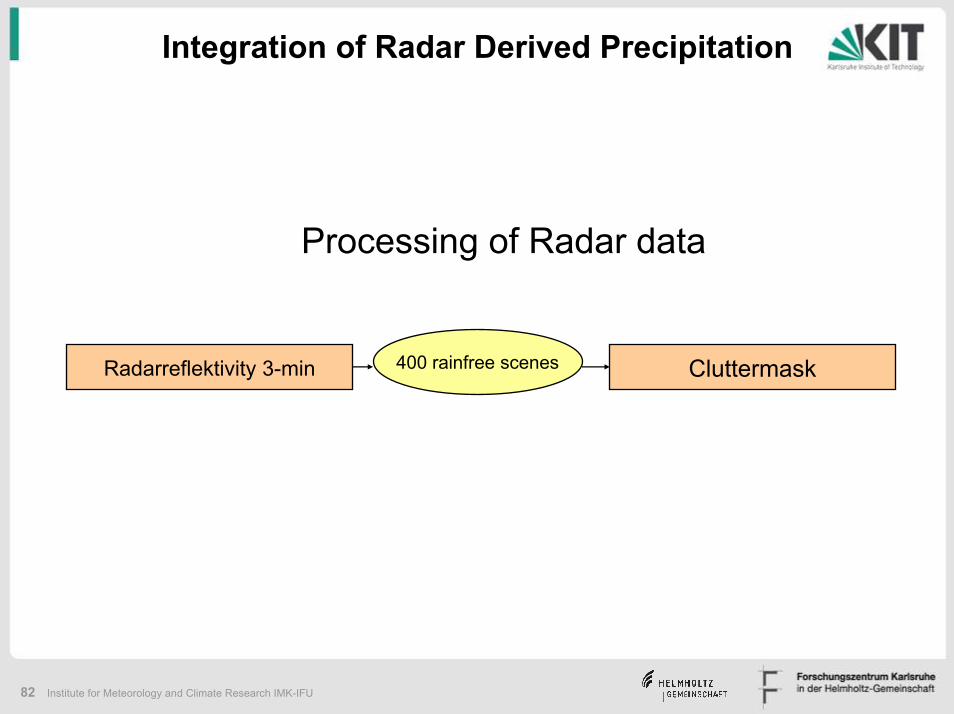
Integration of Radar Derived Precipitation
Processing of Radar data
Radarreflektivity 3-min Cluttermask400 rainfree scenes
83 Institute for Meteorology and Climate Research IMK-IFU
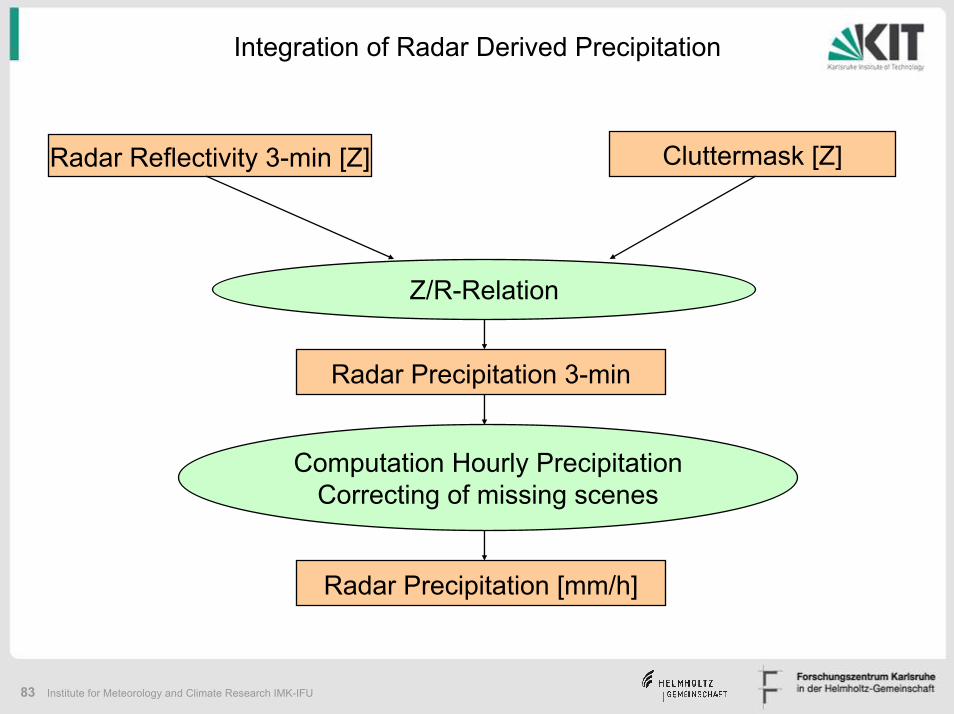
Integration of Radar Derived Precipitation
Radar Reflectivity 3-min [Z] Cluttermask [Z]
Radar Precipitation 3-min
Computation Hourly PrecipitationCorrecting of missing scenes
Z/R-Relation
Radar Precipitation [mm/h]
84 Institute for Meteorology and Climate Research IMK-IFU
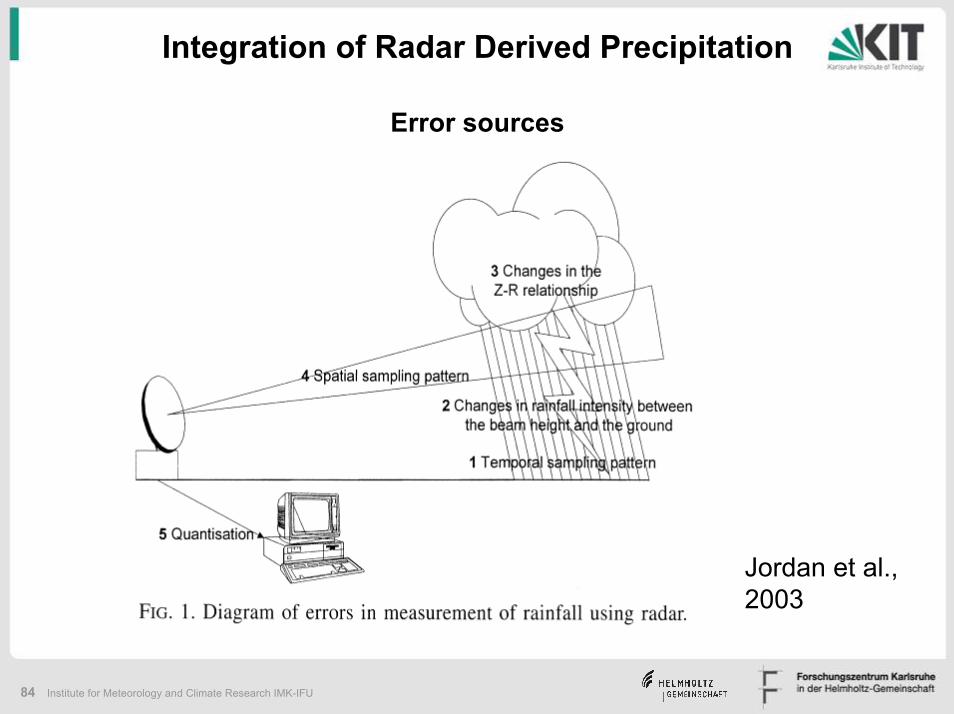
Integration of Radar Derived Precipitation
Error sources
Jordan et al., 2003
85 Institute for Meteorology and Climate Research IMK-IFU
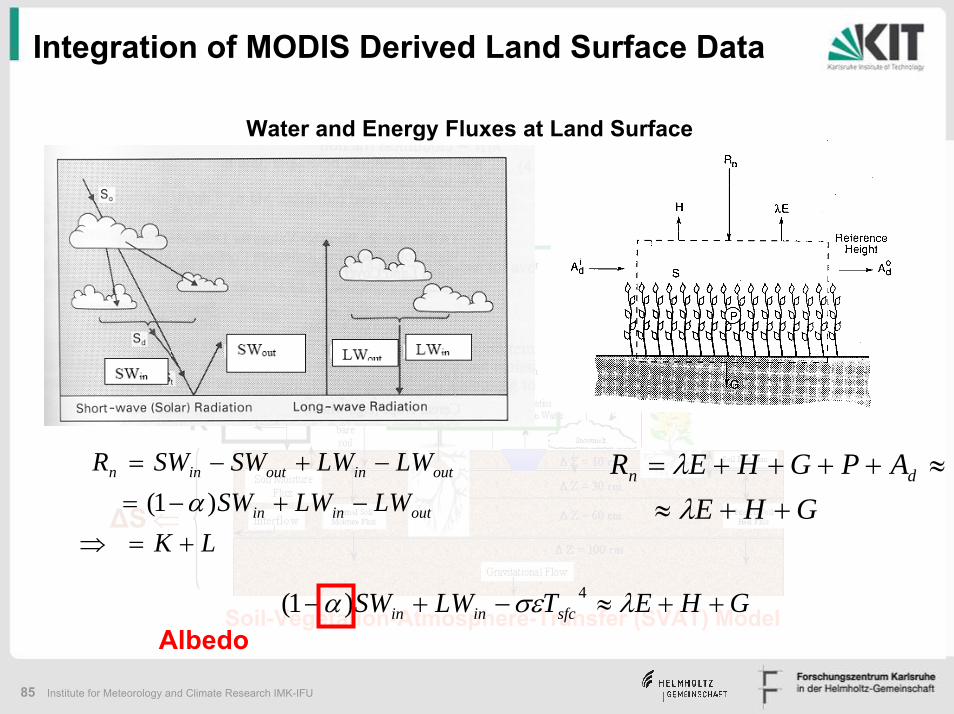
Integration of MODIS Derived Land Surface Data
Water and Energy Fluxes at Land Surface
Soil-Vegetation-Atmosphere-Transfer (SVAT) Model
P
ET
R
∆S ⇐LK
LWLWSWLWLWSWSWR
outinin
outinoutinn
+=⇒−+−=−+−=
)1( α GHEAPGHER dn
++≈≈++++=
λλ
GHETLWSW sfcinin ++≈−+− λσεα 4)1(Albedo