remote sensing and gis to predict the regional impacts of drought
TRANSCRIPT

Remote Sensing and GIS to Predict the Regional Impacts of Drought
Jay Angerer Blackland Research and Extension Center
Texas A&M AgriLife Research
SRM Annual Meeting February 2013

Overview Climate and remote sensing products are improving
capabilities for assessing drought impacts on rangelands
Remote sensing products can be used with simulation modeling to provide near real-time predictions of forage conditions.
Integration of remote sensing products and model outputs within a GIS framework provides capabilities for identifying anomalies and trends on a near real-time basis.

Challenges for Rangelands Because of the large land areas occupied by rangelands, characterization of the extent and intensity of drought poses many challenges.
Characterizing of forage biomass production over large landscapes is hard to do using conventional methods on a near real-time basis
Monitoring networks are generally sparse in rangeland areas
Large distances between rain gauges Data may not be appropriate for distant sites

Increased Availability of Climate and Remote Sensing Data
Climate Gauge/Station Interpolations Radar Derived Rainfall Satellite Derived Rainfall Temperature Data
Vegetation Proxies Normalized Difference Vegetation Index (NDVI) Enhanced Vegetation Index (EVI)
Interpolated Gauge Data
Unified Precipitation Database Optimal Interpolation of station data throughout continental US 0.25° resolution Produced daily Data period: 1948 to present Data available from:
http://www.cpc.ncep.noaa.gov/products/Global_Monsoons/American_Monsoons/NAMS_precip_monitoring.shtml
ftp://ftp.cpc.ncep.noaa.gov/precip/CPC_UNI_PRCP/GAUGE_CONUS/V1.0/ ftp://ftp.cpc.ncep.noaa.gov/precip/CPC_UNI_PRCP/GAUGE_CONUS/RT

Interpolated Gauge Data
http://www.cpc.ncep.noaa.gov/products/Global_Monsoons/American_Monsoons/NAMS_precip_monitoring.shtml ftp://ftp.cpc.ncep.noaa.gov/precip/CPC_UNI_PRCP/GAUGE_CONUS/V1.0/ . ftp://ftp.cpc.ncep.noaa.gov/precip/CPC_UNI_PRCP/GAUGE_CONUS/RT/

Radar Precipitation NEXRAD – Next Generation Weather Radar
Doppler radar Produced every 24-hours Multi-sensor version – gauge and satellite corrections 4 x 4 km resolution Continental US Availability: 2003 to present Download data from: http://water.weather.gov/precip/

NEXRAD Precipitation
http://water.weather.gov/precip/
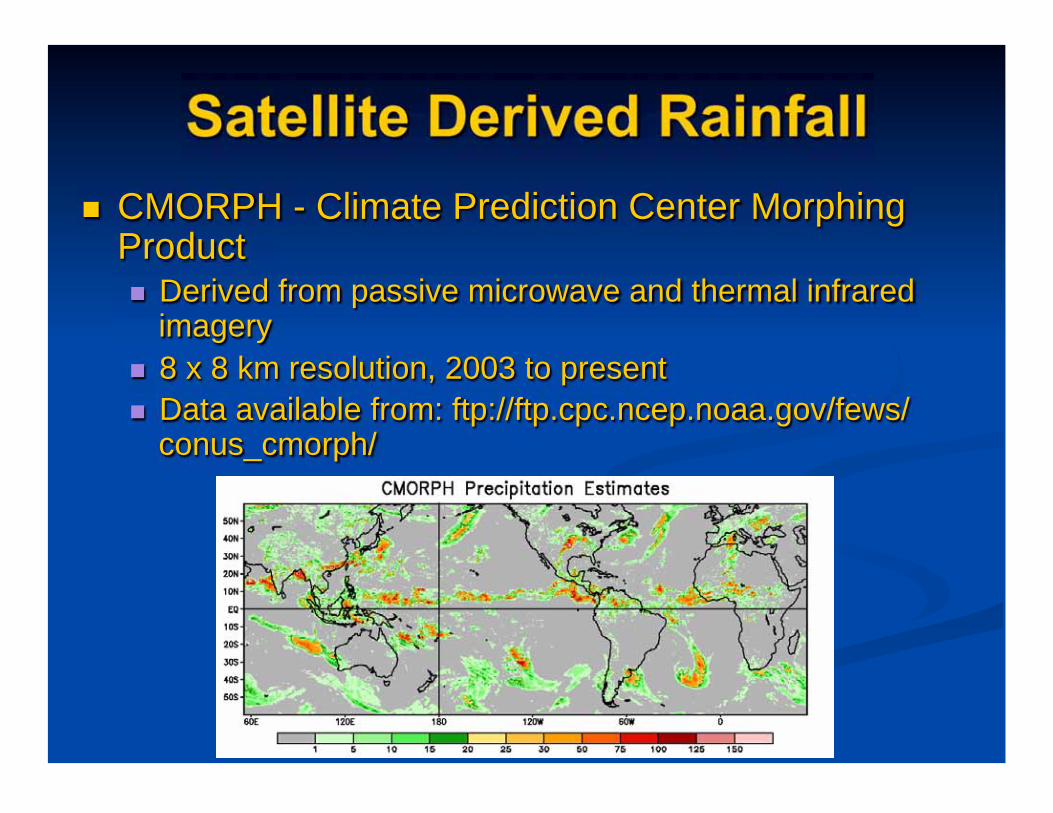
Satellite Derived Rainfall CMORPH - Climate Prediction Center Morphing Product
Derived from passive microwave and thermal infrared imagery 8 x 8 km resolution, 2003 to present Data available from: ftp://ftp.cpc.ncep.noaa.gov/fews/conus_cmorph/

Climate GIS Data Portal http://www.cpc.ncep.noaa.gov/products/GIS/GIS_DATA/
http://www.cpc.ncep.noaa.gov/products/GIS/GIS_DATA/

Vegetation Biomass Proxies
Vegetation Indices Normalized Difference Vegetation Index
AVHRR Data – 1 km resolution 1989 to present MODIS Data – 250 m, 500 m, & 1 km resolution, 2001 to present
Enhanced Vegetation Index Corrects for soil background and improves signal in heavily vegetated areas 250 m, 500 m, & 1 km resolution, 2001 to present

Vegetation Condition Index from AVHRR
From: http://www.star.nesdis.noaa.gov/smcd/emb/vci/VH/vh browseByCountry.php

Relative Greenness

Short and Long Term Forecasts
Improved forecasting provides capabilities for assessing risk in livestock decision making
Available for precipitation and temperature
Forecasts 7 days to more than a year
Can be helpful in comparing with analogous years

Short and Long-Range Forecast Maps
Graphics: http://www.cpc.ncep.noaa.gov/products/predictions/30day/
GIS files: http://www.cpc.ncep.noaa.gov/products/GIS/GIS_DATA/

Drought Early Warning for Livestock
Integration of remote sensing, GIS, and simulation modeling for drought early warning Simulation modeling provides means to translate RS data to livestock forage GIS provides capabilities for mapping and anomaly detection Integration provides framework for livestock early warning systems

PHYGROW Model Servers
Geostatistical and Forecasting Analysis
Near Real Time Climate Imagery (CMORPH precipitation and temperature)
NDVI Imagery (greenness)
Regional Maps
Integrating GIS, Remote Sensing and Simulation
Modeling for Early Warning
Individual Site Analysis
Site Characterization

Map Products for Early Warning: Deviation from Long Term Average
Severe Drought

Severe Drought Continues
Map Products for Early Warning: 60-Day Forecast Deviation

Individual Monitoring Site Early Warning Status - West Texas Ranch
July 31, 2011

Next Generation Livestock Early Warning Systems
Integrated Networks and Sensors
Improved forecasting
Incorporation of other relevant data streams Forage Quality Livestock prices and futures Feed and Hay prices

Conclusions Increased availability and higher resolution remote sensing data Provides opportunities for near real-time assessment of drought Accessible for risk management decision making
Integrating remote sensing data with simulation modeling and GIS provides framework for assessing forage anomalies and trends

Conclusions
Early warning system outputs, along with short and long-term forecasting information can improve risk management decision making.
Next generation early warning systems could incorporate other data streams and sensor networks to provide more holistic decision support for livestock managers on rangelands.

Questions or Comments?