remote lab activity - western interstate commission for...
TRANSCRIPT
Part 1 - Get a Lab Appointment and Install Software:
Set up an Account on the Scheduler (FIRST TIME USING NANSLO):Find the email from your instructor with the URL (link) to sign up at the scheduler.Set up your scheduling system account and schedule your lab appointment. NOTE: You cannot make an appointment until two weeks prior to the start date of this lab assignment. You can get your username and password from your email to schedule within this time frame.
Install the Citrix software: – go to http://receiver.citrix.com and click download > accept > run > install (FIRST TIME USING NANSLO).You only have to do this ONCE. Do NOT open it after installing. It will work automatically when you go to your lab. (more info at http://www.wiche.edu/info/nanslo/creative_science/Installing_Citrix_Receiver_Program.pdf)
Scheduling Additional Lab Appointments: Get your scheduler account username and password from your email.Go to the URL (link) given to you by your instructor and set up your appointment.(more info at http://www.wiche.edu/nanslo/creative-science-solutions/students-scheduling-labs)
Changing Your Scheduled Lab Appointment: Get your scheduler account username and password from your email. Go to http://scheduler.nanslo.org and select the “I am a student” button. Log in to go to the student dashboard and modify your appointment time. (more info at http://www.wiche.edu/nanslo/creative-science-solutions/students-scheduling-labs)
Part 2 – Before Lab Day:
Read your lab experiment background and procedure below, pages 1-16.
Submit your completed Pre-Lab 1 -5 Questions (pages 10-15) per your faculty’s instructions.
Watch the Microscope Control Panel Video Tutorial http://www.wiche.edu/nanslo/lab-tutorials#microscope
Part 3 – Lab Day
Log in to your lab session – 2 options:1)Retrieve your email from the scheduler with your appointment info or 2) Log in to the student dashboard and join your session by going to http://scheduler.nanslo.org
NOTE: You cannot log in to your session before the date and start time of your appointment. Use Internet Explorer or Firefox.
Click on the yellow button on the bottom of the screen and follow the instructions to talk to your lab partners and the lab tech.
Remote Lab ActivitySUBJECT SEMESTER: ____________
TITLE OF LAB: Mitosis and Meiosis
Lab format: This lab is a remote lab activity.
Relationship to theory (if appropriate): In this lab you will be examining the underlying processes that make up the cell cycle.
Instructions for Instructors: This protocol is written under an open source CC BY license. You may use the procedure as is or modify as necessary for your class. Be sure to let your students know if they should complete optional exercises in this lab procedure as lab technicians will not know if you want your students to complete optional exercise.
Instructions for Students: Read the complete laboratory procedure before coming to lab. Under the experimental sections, complete all pre-lab materials before logging on to the remote lab, complete data collection sections during your on-line period, and answer questions in analysis sections after your on-line period. Your instructor will let you know if you are required to complete any optional exercises in this lab.
Remote Resources: Primary - Microscope; Secondary - Mitosis and Meiosis Slide Set.
CONTENTS FOR THIS NANSLO LAB ACTIVITY:
Learning Objectives .............................................................................................. 2Background Information ....................................................................................... 2-7Equipment ............................................................................................................ 7Preparing for this NANSLO Lab Activity ................................................................ 8Experimental Procedure ....................................................................................... 9Exercise 1: Mitosis in Animal and Plant Cells ....................................................... 9-10Exercise 2: Calculate the Percentage of Time Spent in Each Stage of Mitosis ..... 10-12Exercise 3: Growth in the Onion Root ................................................................. 12-13Exercise 4: Stages of Meiosis ............................................................................... 13-14Exercise 5: Meiosis in humans (optional) ............................................................ 14-15Summary Questions: Mitosis and Meiosis Experiment ....................................... 15
3 | P a g e L a s t U p d a t e d A p r i l 2 5 , 2 0 1 4
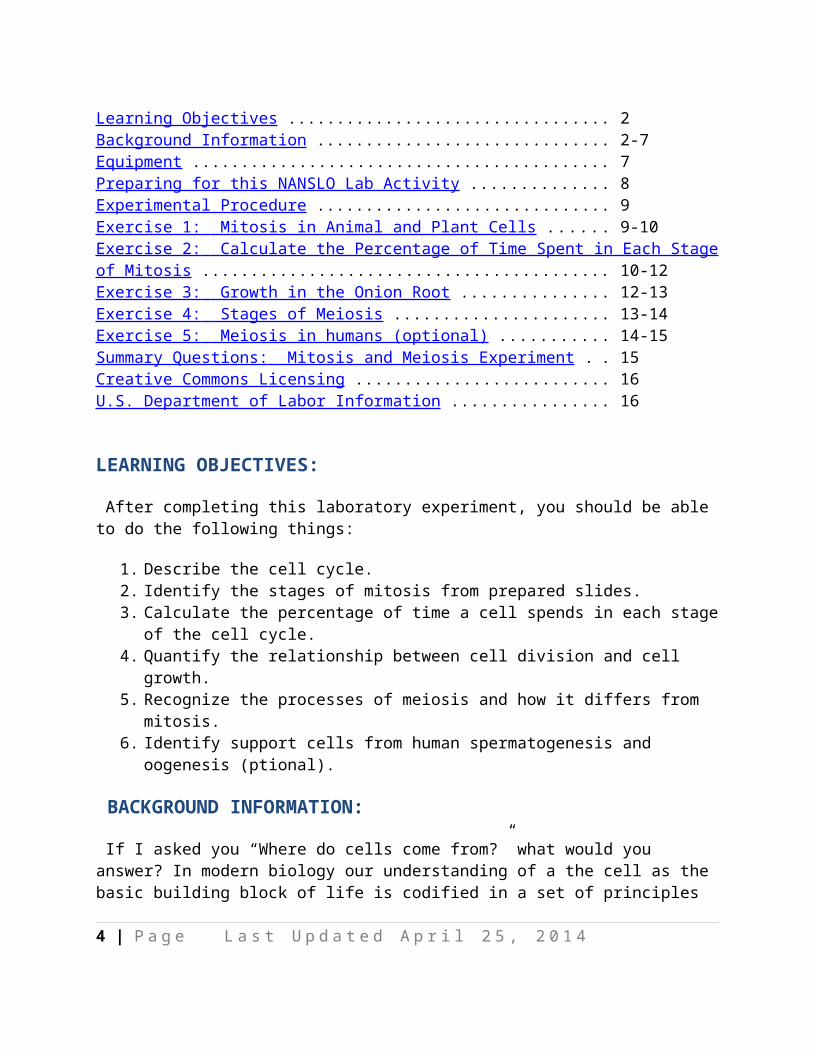
Creative Commons Licensing ................................................................................ 16U.S. Department of Labor Information ................................................................. 16
LEARNING OBJECTIVES:
After completing this laboratory experiment, you should be able to do the following things:
1. Describe the cell cycle.2. Identify the stages of mitosis from prepared slides.3. Calculate the percentage of time a cell spends in each stage of the cell cycle.4. Quantify the relationship between cell division and cell growth.5. Recognize the processes of meiosis and how it differs from mitosis.6. Identify support cells from human spermatogenesis and oogenesis (ptional).
BACKGROUND INFORMATION:
If I asked you “Where do cells come from?” what would you answer? In modern biology our understanding of a the cell as the basic building block of life is codified in a set of principles called the Cell Theory which was first codified by Schleiden and Schwann in 1838-39. The cell theory is second only to the theory of evolution by natural selection in understanding the relatedness of life. Cell Theory says the following:
1. All living organisms are composed of one or more cells.2. Cells are the basic building blocks of all life.3. All cells are descended from a preexisting cell.
While these may seem like relative simple points it took scientists several centuries to produce the cell theory.
The development of the cell theory directly follows the development of the microscope. The name “cell” was coined by Robert Hooke6 in 1665. While observing a piece of cork under his microscope he thought that the microscopic units that made up the cork looked like the rooms, or “cella” in Latin, that monks lived in. This was closely followed by the discovery of single celled organisms by Antoni van Leeuwenhoek3-5 in 1676. Leeuwenhoek discovered motile microscopic particles by examining scrapings from his teeth under his microscope. In 1838 Metthias Schleiden7 and Theodor Schwann8 presented evidence that all plants and animals are composed of cells. However, there were still some questions as to where cells came from, as Schleiden believed cells formed through a process of crystallization. This theory was simply a variant on the belief of Aristotle that life could come into existence by spontaneous generation.
4 | P a g e L a s t U p d a t e d A p r i l 2 5 , 2 0 1 4
It was not until the 1850s that a group of scientist was able to show that new cells were produced from preexisting cells9. However, most scientists believe the definitive test disproving spontaneous creation of microbial life was conducted by Louis Pasteur in 186210. In Pasteur’s experiment two flasks were each set-up with bacterial growing broth (a liquid that is conducive to the growth of bacteria) and sterilized. Both flasks were left open to the air but in such a way that dust could enter only flask 1 not flask 2. After a period of time bacteria growth was seen in only flask 1 and not in flask 2. This showed that dust (bacteria) had to be added to the broth in order for bacteria to grow.
In this lab we will be examining the mechanism underlying the third principle of the cell theory “that all cells are descended from preexisting cells”. There are two processes involving the production on new cells, the first process, mitosis, is used for growth and to replace old or dead cells. The second process, meiosis, is used to produce gametes (egg and sperm) cells that are used for sexual reproduction. An important point to keep in mind is that we name the type of cell cycle based on what is happening to the nucleus and genetic material.
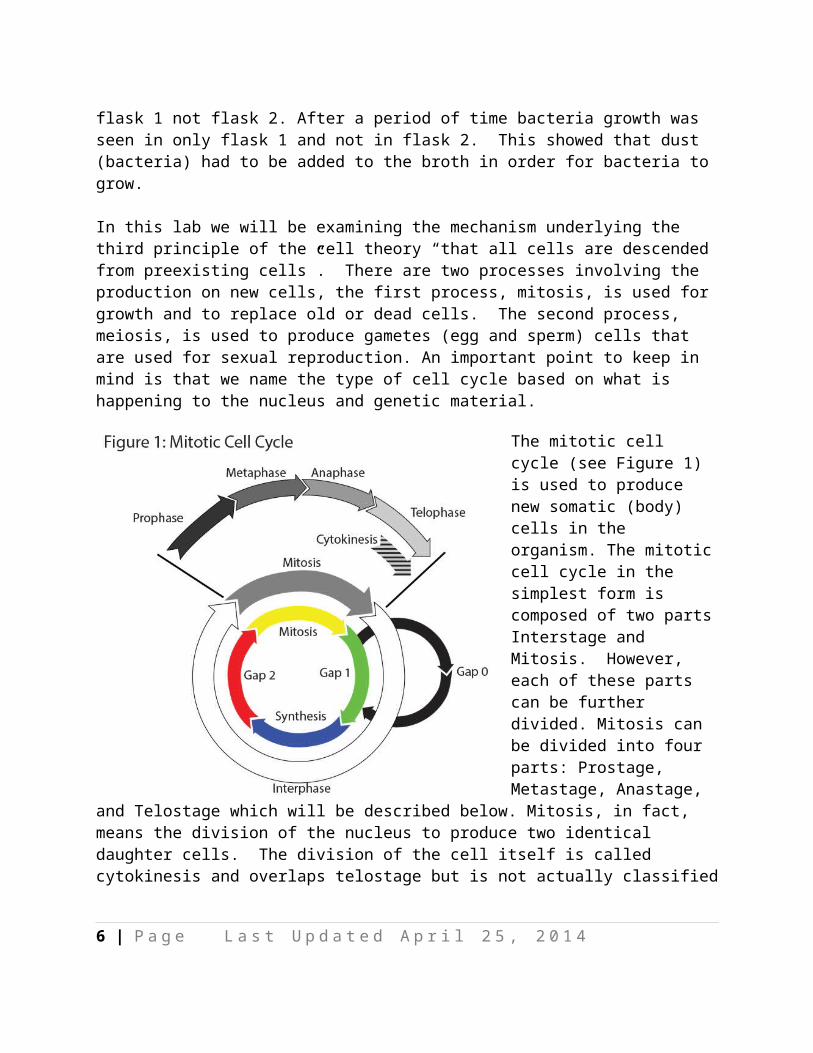
The mitotic cell cycle (see Figure 1) is used to produce new somatic (body) cells in the organism. The mitotic cell cycle in the simplest form is composed of two parts Interstage and Mitosis. However, each of these parts can be further divided. Mitosis can be divided into four parts: Prostage, Metastage, Anastage, and Telostage which will be described below. Mitosis, in fact, means the division of the nucleus to produce two identical daughter cells. The division of the cell itself is called cytokinesis and overlaps telostage but is not actually
classified as part of it. Interstage (the part of the cell cycle between actual divisions) is composed of three parts Gap1 (sometimes referred to as growth1) the cell grows and performs normal cellular functions, Synthesis (s stage) DNA is replicated, and Gap2 (sometimes referred to as growth2) is where the cellular organelles are replicated. There is one additional stage to the cell cycle Gap0. A cell that has stopped cycling (dividing) either temporarily or permanently has entered Gap0.
5 | P a g e L a s t U p d a t e d A p r i l 2 5 , 2 0 1 4
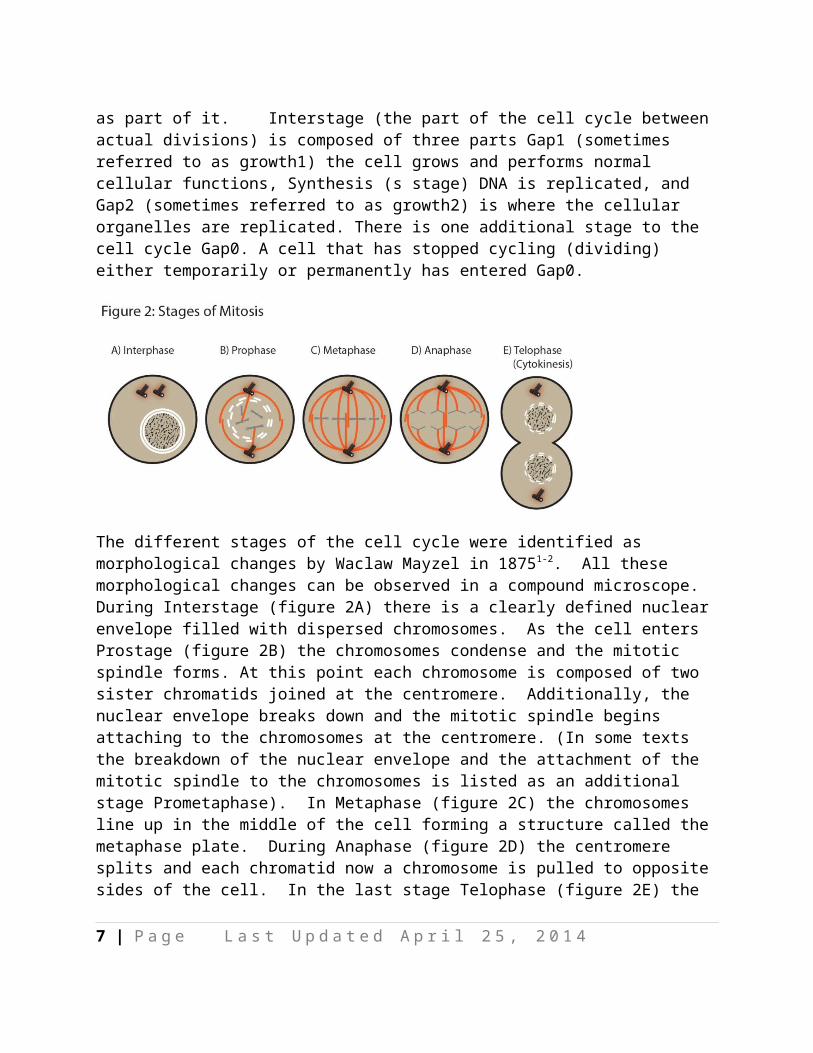
The different stages of the cell cycle were identified as morphological changes by Waclaw Mayzel in 18751-2. All these morphological changes can be observed in a compound microscope. During Interstage (figure 2A) there is a clearly defined nuclear envelope filled with dispersed chromosomes. As the cell enters Prostage (figure 2B) the chromosomes condense and the mitotic spindle forms. At this point each chromosome is composed of two sister chromatids joined at the centromere. Additionally, the nuclear envelope breaks down and the mitotic spindle begins attaching to the chromosomes at the centromere. (In some texts the breakdown of the nuclear envelope and the attachment of the mitotic spindle to the chromosomes is listed as an additional stage Prometaphase). In Metaphase (figure 2C) the chromosomes line up in the middle of the cell forming a structure called the metaphase plate. During Anaphase (figure 2D) the centromere splits and each chromatid now a chromosome is pulled to opposite sides of the cell. In the last stage Telophase (figure 2E) the chromosomes become less condensed, two new nuclei form and the mitotic spindle de polymerizes. This officially ends mitosis which as mentioned before is the replication and division of the nucleus. The cell cycle ends with cytokinesis, the division of the cytoplasm, which often overlaps late telophase.
The other type of cell cycle is called meiosis and is used in sexual reproduction to produce gametes (sperm and egg in most animals and plants). In plants and animals each organism contains two copies of each chromosome; this is called diploid. In order for sexual reproduction to occur properly the number of chromosomes need to be reduced by half; which is called haploid. If the chromosome number was not reduced by half then each new generation would have twice the number of chromosomes as the previous organism; which is called polyploidy. In many organisms a state of polyploidy causes biological defects.
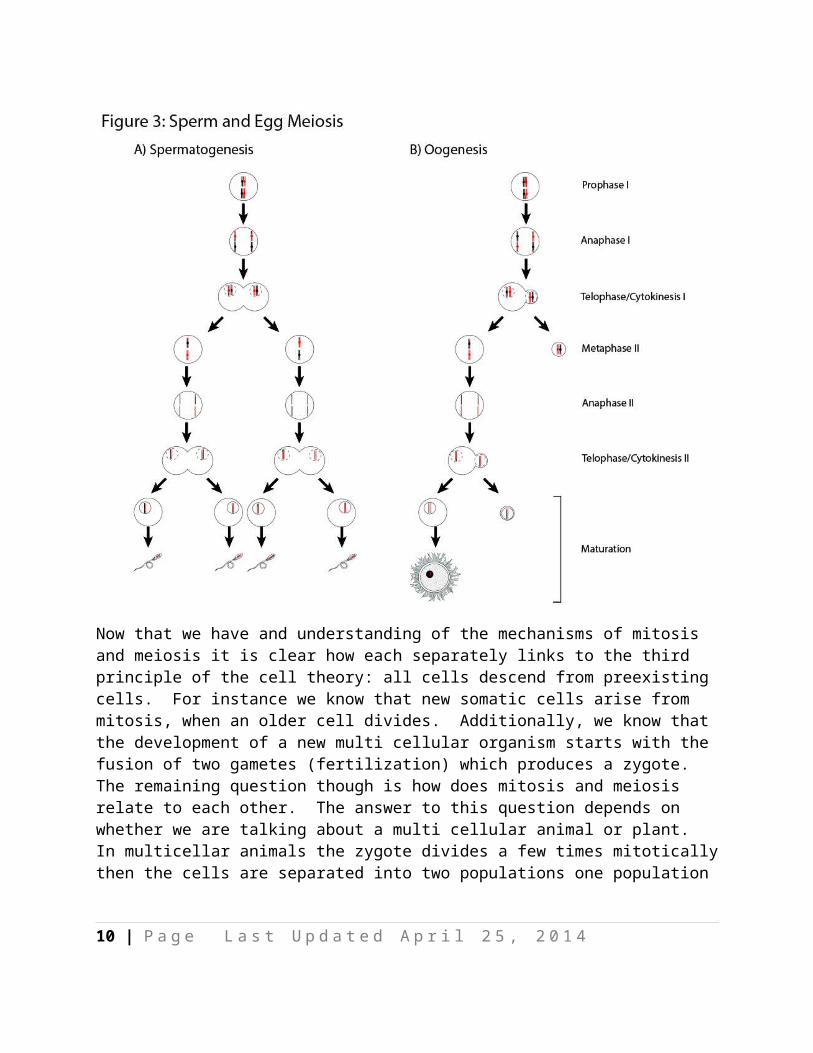
Mechanistically meiosis differs from mitosis in that two rounds of cell division occur, referred to as meiosis I and meiosis II, with only one round of DNA synthesis. Figure #3 shows the stages of meiosis were there are differences between the corresponding mitotic and meiotic stages. This produces 4 haploid cells; the number of mature gametes varies depending on whether the final
6 | P a g e L a s t U p d a t e d A p r i l 2 5 , 2 0 1 4
mature cell is a sperm cell or egg cell (Figure 3). In meiosis I S stage occurs as normal. The first difference between mitosis and meiosis I occurs in Prophase I, during Prophase I the homologous chromosomes pair up and exchange genetic material by crossover (Figure 3). This exchange of genetic material increases the genetic variation in the offspring. The next difference occurs in anaphase I, during anaphase I instead of the centromere dividing it stays connected and the homologous chromosomes are segregated to the opposite poles (Figure 3). During Cytokinesis I we see the first difference between spermatogenesis (sperm formation) and oogenesis (egg formation). During cytokinesis of the egg the cytoplasm divides unequally with one of the daughter cells getting most of the cytoplasm, the smaller cell is called a polar body (Figure 3B). The presperm cells undergo an equal cytokinesis (Figure 3A). The cells will then enter a second cell cycle, meiosis II, without replicating DNA. The length of interphase between meiosis I and meiosis II varies from nonexistent too years depending on the organism. In meiosis II during Anaphase II the kinetochore divides and the sister chromatids are pulled to opposite poles of the cell. Again the in oogenesis the cell undergoes unequal cytokinesis producing an oogonia and another polar body, while the sperm cells divide equally. This produces four haploid spermatocytes in the male line and one haploid oogonia and 2 or 3 haploid polar bodies in the female line. The spermatocytes and oogonia go on to mature in to sperm and egg cells, which will give rise to a new generation.
7 | P a g e L a s t U p d a t e d A p r i l 2 5 , 2 0 1 4
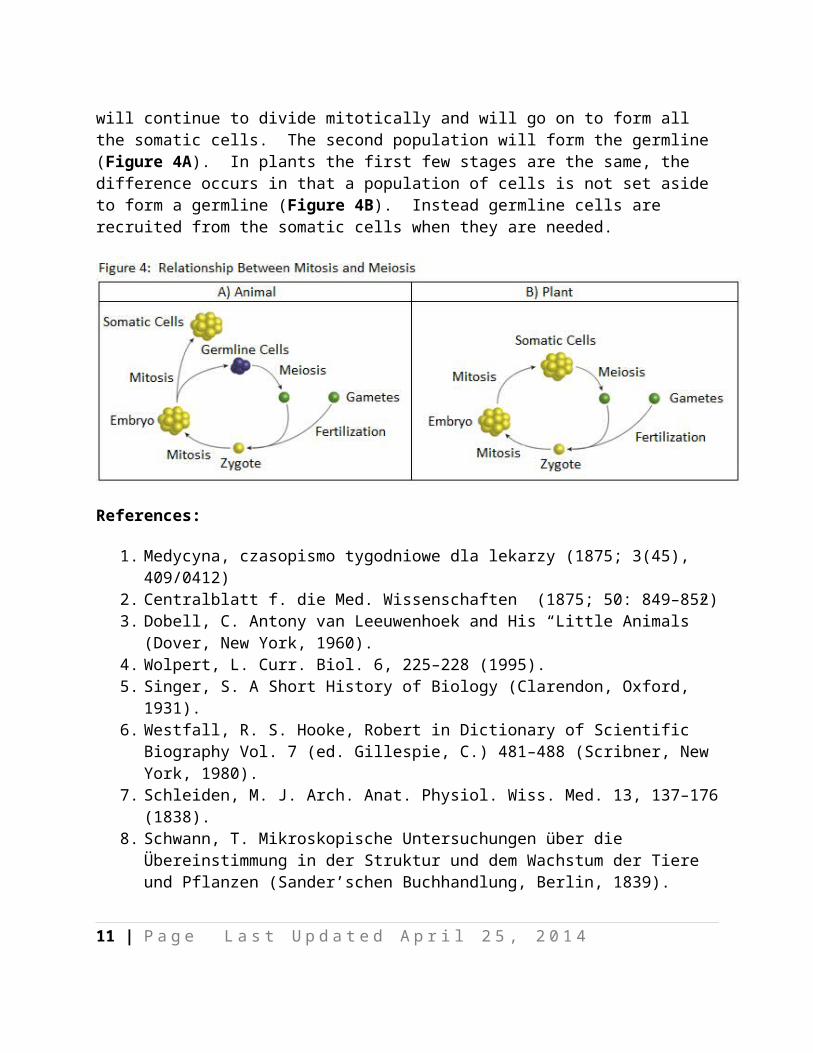
Now that we have and understanding of the mechanisms of mitosis and meiosis it is clear how each separately links to the third principle of the cell theory: all cells descend from preexisting cells. For instance we know that new somatic cells arise from mitosis, when an older cell divides. Additionally, we know that the development of a new multi cellular organism starts with the fusion of two gametes (fertilization) which produces a zygote. The remaining question though is how does mitosis and meiosis relate to each other. The answer to this question depends on whether we are talking about a multi cellular animal or plant. In multicellar animals the zygote divides a few times mitotically then the cells are separated into two populations one population will continue to divide mitotically and will go on to form all the somatic cells. The second population will form the germline (Figure 4A). In plants the first few stages are the same, the difference occurs in that a population of cells is not set aside to form a germline (Figure 4B). Instead germline cells are recruited from the somatic cells when they are needed.
8 | P a g e L a s t U p d a t e d A p r i l 2 5 , 2 0 1 4
References:
1. Medycyna, czasopismo tygodniowe dla lekarzy (1875; 3(45), 409/0412)2. Centralblatt f. die Med. Wissenschaften (1875; 50: 849–852)3. Dobell, C. Antony van Leeuwenhoek and His “Little Animals” (Dover, New York, 1960).4. Wolpert, L. Curr. Biol. 6, 225–228 (1995).5. Singer, S. A Short History of Biology (Clarendon, Oxford, 1931).6. Westfall, R. S. Hooke, Robert in Dictionary of Scientific Biography Vol. 7 (ed. Gillespie, C.)
481–488 (Scribner, New York, 1980).7. Schleiden, M. J. Arch. Anat. Physiol. Wiss. Med. 13, 137–176 (1838).8. Schwann, T. Mikroskopische Untersuchungen über die Übereinstimmung in der Struktur
und dem Wachstum der Tiere und Pflanzen (Sander’schen Buchhandlung, Berlin, 1839).9. Mayr, E. The Growth of the Biological Thought (Belknap, Cambridge, MA, 1982).10. Pasteur, L. A. Ann. Sci. Nat. (part. zool.) 16, 5–98 (1861).
EQUIPMENT:
Paper Pencil/pen Slides
o Onion Root Tipo Whitefish Blastulao Mammal Graafian Follicleso Human Testiso Ascaris lumbricoideso Grasshopper Testis
Computer (access to remote laboratory
9 | P a g e L a s t U p d a t e d A p r i l 2 5 , 2 0 1 4
10 | P a g e L a s t U p d a t e d A p r i l 2 5 , 2 0 1 4
PREPARING FOR THIS NANSLO LAB ACTIVITY:
Read and understand the information below before you proceed with the lab!
Scheduling an Appointment Using the NANSLO Scheduling System
Your instructor has reserved a block of time through the NANSLO Scheduling System for you to complete this activity. For more information on how to set up a time to access this NANSLO lab activity, see www.wiche.edu/nanslo/scheduling-software.
Students Accessing a NANSLO Lab Activity for the First Time
For those accessing a NANSLO laboratory for the first time, you may need to install software on your computer to access the NANSLO lab activity. Use this link for detailed instructions on steps to complete prior to accessing your assigned NANSLO lab activity – www.wiche.edu/nanslo/lab-tutorials.
Video Tutorial for RWSL: A short video demonstrating how to use the Remote Web-based Science Lab (RWSL) control panel for the air track can be viewed at http://www.wiche.edu/nanslo/lab-tutorials#microscope.
NOTE: Disregard the conference number in this video tutorial.
AS SOON AS YOU CONNECT TO THE RWSL CONTROL PANEL: Click on the yellow button at the bottom of the screen (you may need to scroll down to see it). Follow the directions on the pop up window to join the voice conference and talk to your group and the Lab Technician.
11 | P a g e L a s t U p d a t e d A p r i l 2 5 , 2 0 1 4
EXPERIMENTAL PROCEDURE:
Once you have logged on to the remote lab system, you will perform the following laboratory procedures. See Preparing for the Microscope NANSLO Lab Activity below.
EXERCISE 1: Mitosis in Animal and Plant Cells
PRE-LAB:
New cells are produced in animals and plants by the division of old cells. These new cells can be used for growth or to replace dead or damaged cells. As stated in the introduction, the cell cycle is divided into two parts the replication and division of the genetic material (mitosis) and the division of the cytoplasm (cytokinesis). In this experiment you will use prepared slides of an onion root tip and a whitefish blastula to identify the stages of mitosis.
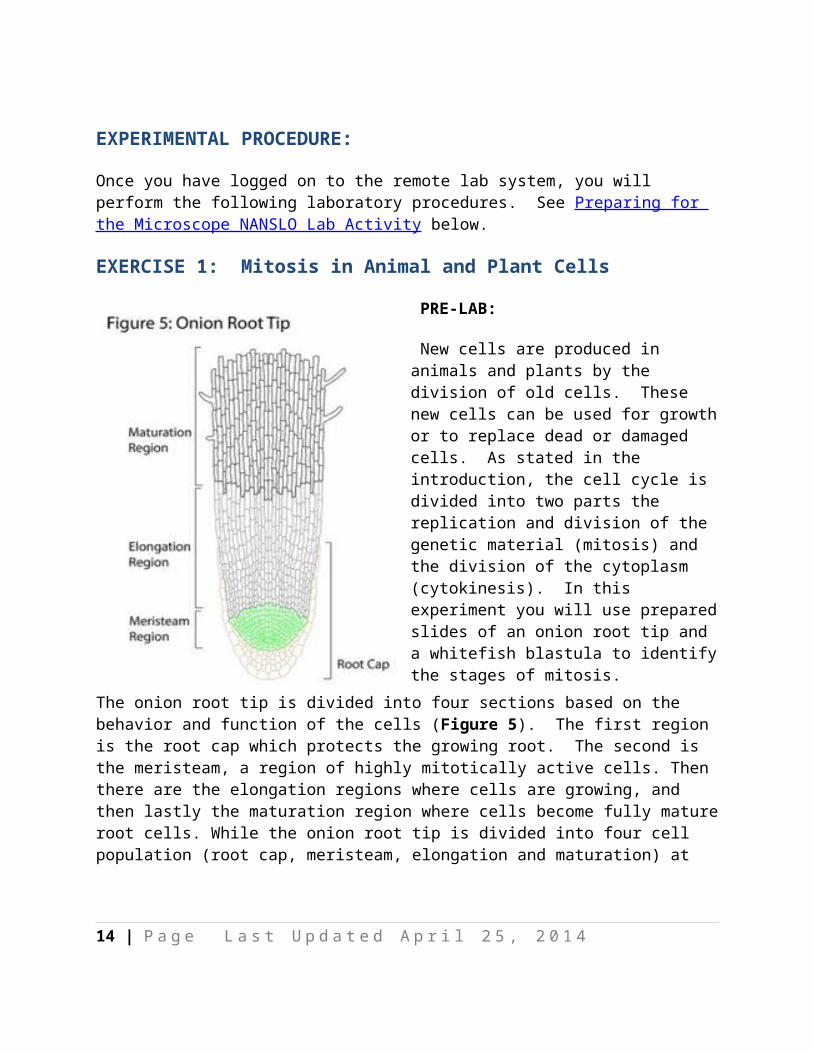
The onion root tip is divided into four sections based on the behavior and function of the cells (Figure 5). The first region is the root cap which protects the growing root. The second is the meristeam, a region of highly mitotically active cells. Then there are the elongation regions where cells are growing, and then
lastly the maturation region where cells become fully mature root cells. While the onion root tip is divided into four cell population (root cap, meristeam, elongation and maturation) at the developmental stage of development you are looking at, the cells in the white fish blastula are a uniform population.
PRE-LAB QUESTIONS:
1. Do you think you will see any differences between plant or animal cells? What differences do you think you will see?
2. Rewrite your answer to question one in the form of an If ... Then . . . hypotheses.
12 | P a g e L a s t U p d a t e d A p r i l 2 5 , 2 0 1 4
DATA COLLECTION:
3. Select the prepared slide of the whitefish blastula using the RWSL microscope controls.4. Locate the blastula. Then increase the magnification and working as a group identify a
cell in each stage of mitosis. Use the “capture image” feature on the RWSL microscope control panel to capture an image of each stage. (Each member of your group should use the microscope to identify at least one stage.)
5. Select the prepared slide of the onion root tip using the RWSL microscope controls.6. Locate the onion root tip. Then increase the magnification and working as a group
identify the stages of mitosis. Use the “capture image” feature on the RWSL control panel to capture an image of each stage. (Each member of your group should use the microscope to identify at least one stage.)
ANALYSIS:
7. Use the insert and textbox feature on your computer word processing program to label the plasma membrane, chromosomes, mitotic spindle, nuclear membrane, and centriole for each image as appropriate. (Place Images Below)
8. Think back to the pre-lab questions about differences in plant and animal cell mitosis. Were you prediction correct? What, if any, differences did you actually see?
9. If your predictions were correct, revise your hypotheses based on your new understanding of the differences between mitosis in plants and animals.
EXERCISE 2: Calculate the Percentage of Time Spent in Each State of Mitosis
PRE-LAB:
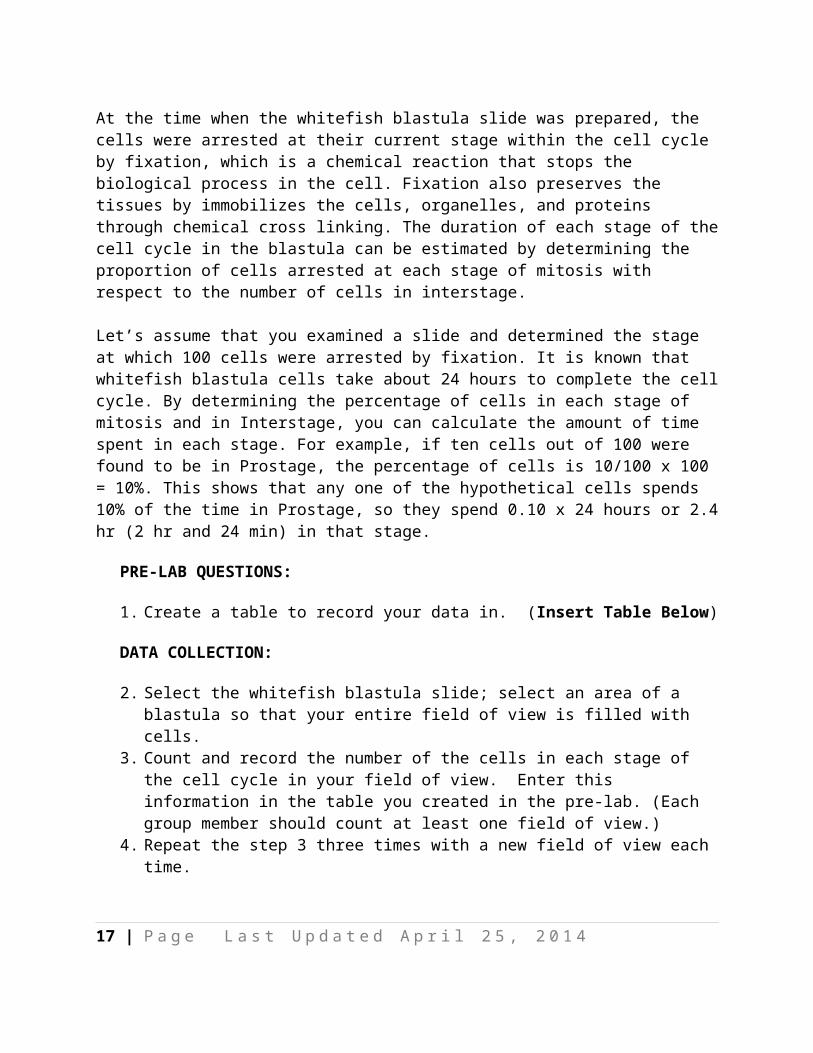
At the time when the whitefish blastula slide was prepared, the cells were arrested at their current stage within the cell cycle by fixation, which is a chemical reaction that stops the biological process in the cell. Fixation also preserves the tissues by immobilizes the cells, organelles, and proteins through chemical cross linking. The duration of each stage of the cell cycle in the blastula can be estimated by determining the proportion of cells arrested at each stage of mitosis with respect to the number of cells in interstage.
Let’s assume that you examined a slide and determined the stage at which 100 cells were arrested by fixation. It is known that whitefish blastula cells take about 24 hours to complete the cell cycle. By determining the percentage of cells in each stage of mitosis and in Interstage, you can calculate the amount of time spent in each stage. For example, if ten cells out of 100 were found to be in Prostage, the percentage of cells is 10/100 x 100 = 10%. This shows that
13 | P a g e L a s t U p d a t e d A p r i l 2 5 , 2 0 1 4
any one of the hypothetical cells spends 10% of the time in Prostage, so they spend 0.10 x 24 hours or 2.4 hr (2 hr and 24 min) in that stage.
PRE-LAB QUESTIONS:
1. Create a table to record your data in. (Insert Table Below)
DATA COLLECTION:
2. Select the whitefish blastula slide; select an area of a blastula so that your entire field of view is filled with cells.
3. Count and record the number of the cells in each stage of the cell cycle in your field of view. Enter this information in the table you created in the pre-lab. (Each group member should count at least one field of view.)
4. Repeat the step 3 three times with a new field of view each time.
ANALYSIS:
5. Calculate the percentage of time the cells spent in each stage of the cell cycle for each field of view independently. Create a new table to hold this information.
6. Now sum the numbers from all four data sets and use the totals to calculate the percentage of time the cells spent in each stage of the cell cycle. Place this data in the same table as the data from question 5. (Insert Table Below)
7. Compare the time the cells spent in each stage of the cell cycle from the summed data to that from the individual data. Do you notice any differences?
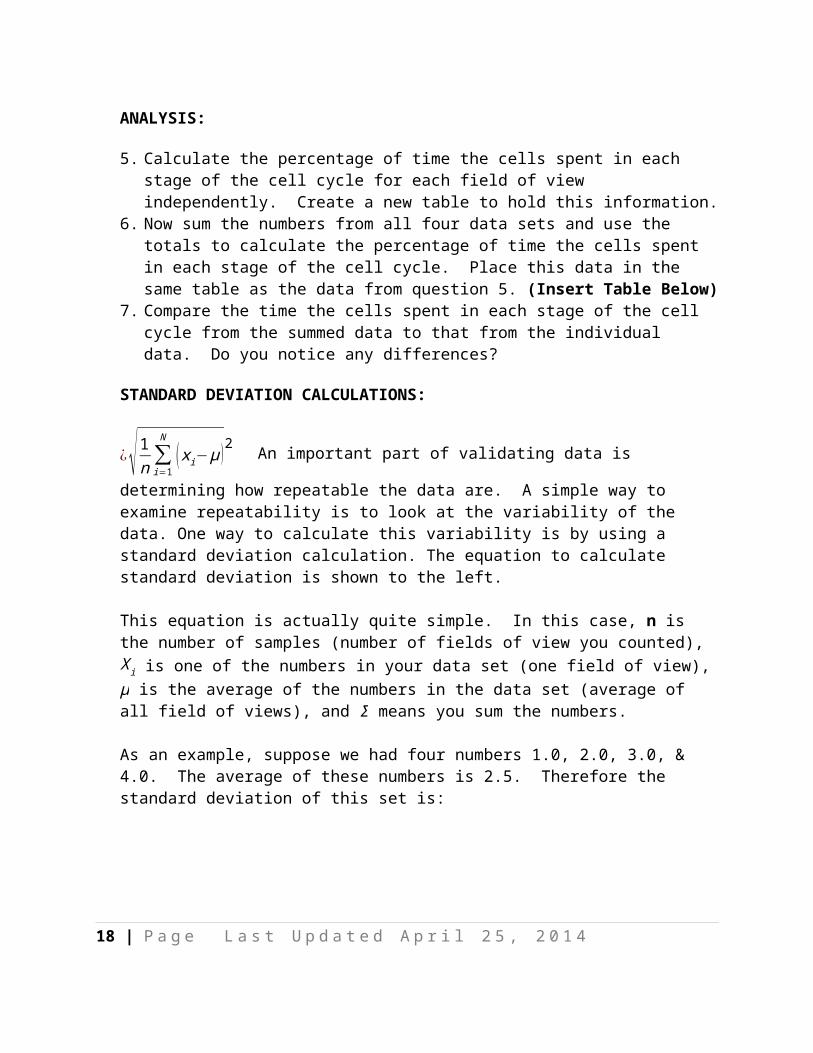
STANDARD DEVIATION CALCULATIONS:
¿√ 1n∑i=1N
(x i−μ )2 An important part of validating data is determining how repeatable the
data are. A simple way to examine repeatability is to look at the variability of the data. One way to calculate this variability is by using a standard deviation calculation. The equation to calculate standard deviation is shown to the left.
This equation is actually quite simple. In this case, n is the number of samples (number of fields of view you counted), X i is one of the numbers in your data set (one field of view), μ is the average of the numbers in the data set (average of all field of views), and Σ means you sum the numbers.
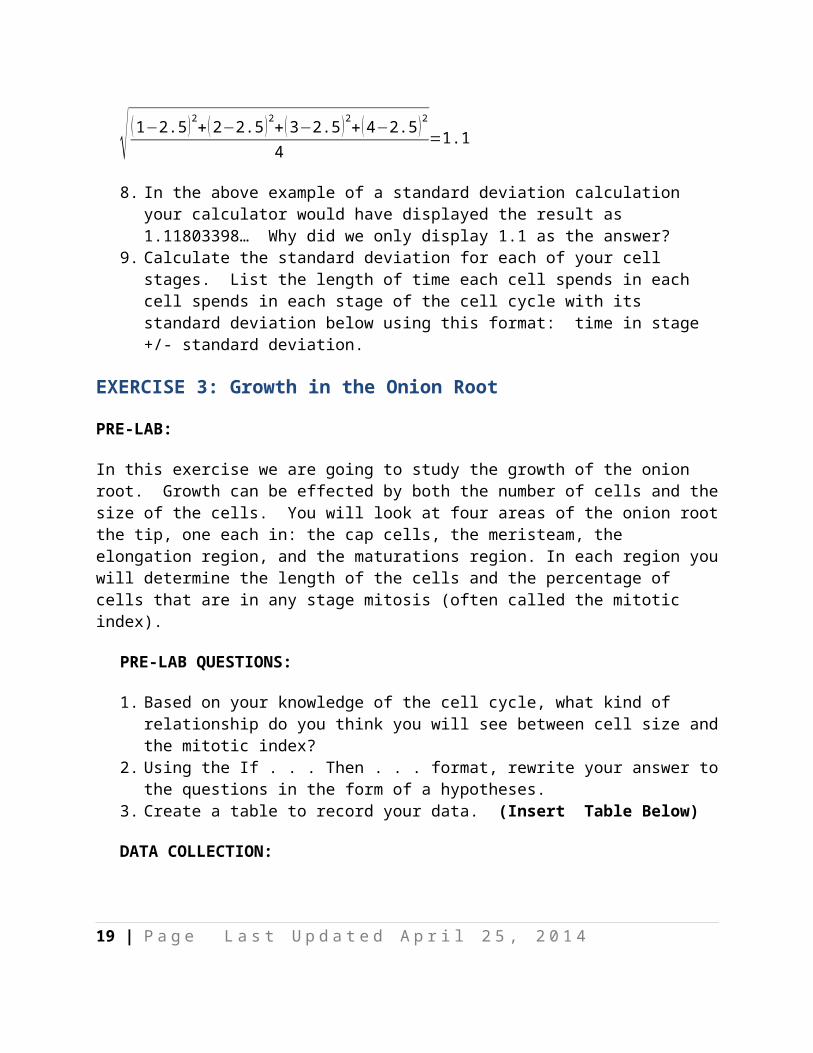
As an example, suppose we had four numbers 1.0, 2.0, 3.0, & 4.0. The average of these numbers is 2.5. Therefore the standard deviation of this set is:
14 | P a g e L a s t U p d a t e d A p r i l 2 5 , 2 0 1 4
√ (1−2.5 )2+(2−2.5 )2+(3−2.5 )2+(4−2.5 )2
4=1.1
8. In the above example of a standard deviation calculation your calculator would have displayed the result as 1.11803398… Why did we only display 1.1 as the answer?
9. Calculate the standard deviation for each of your cell stages. List the length of time each cell spends in each cell spends in each stage of the cell cycle with its standard deviation below using this format: time in stage +/- standard deviation.
EXERCISE 3: Growth in the Onion Root
PRE-LAB:
In this exercise we are going to study the growth of the onion root. Growth can be effected by both the number of cells and the size of the cells. You will look at four areas of the onion root the tip, one each in: the cap cells, the meristeam, the elongation region, and the maturations region. In each region you will determine the length of the cells and the percentage of cells that are in any stage mitosis (often called the mitotic index).
PRE-LAB QUESTIONS:
1. Based on your knowledge of the cell cycle, what kind of relationship do you think you will see between cell size and the mitotic index?
2. Using the If . . . Then . . . format, rewrite your answer to the questions in the form of a hypotheses.
3. Create a table to record your data. (Insert Table Below)
DATA COLLECTION:
4. Select the onion root tip slide using the RWSL microscope control. (Each member of the group should collect data from a region)
5. Position the microscope so that you are looking at the cap cells.6. Count all the cells in the field of view; count how many of them are in mitosis.7. Determine how long each cell is.8. Position your sample so that you are looking at the meristeam and repeat steps 4 and 5.9. Position your sample so that you are looking at the elongation region and repeat steps 4
and 5.
15 | P a g e L a s t U p d a t e d A p r i l 2 5 , 2 0 1 4
10. Position your sample so that you are looking at the maturation region and repeat steps 4 and 5.
ANALYSIS:
11. Calculate the mitotic index for each region. Modify your table form question one and enter the mitotic index in your new table.
12. Calculate the size of the cells for each region and record that in your table from question 11. (Insert Data Table)
13. How does your prediction of the relationship of the mitotic index to cell size correlate to the data you collected?
14. If needed, rewrite your hypothesis in light of the new data you collected. 15. Based on your observations, what stage of the cell cycle are the onion root cells that
were in the elongation region likely in?
EXERCISE 4: Stages of Meiosis
PRE-LAB:
Observing the different stages of meiosis is often difficult do to the structure of the organs in which meiosis and fertilization occur. One way scientist gets around this type of problem is through the use of model organisms. A model organism is an organism in which a particular biological process is easily observed or manipulated. Two examples of model organisms used in the study of meiosis are the grasshopper testis and the Ascaris lumbricoides ovary. The reason that these are good model organisms for the process of meiosis is that meiotic cells travel down the organ in a liner path. Later stages of meiosis are farther along in the organ than earlier. For example in a grasshopper testis it is often possible to observe all stages of both meiosis I and meiosis II. The ovary of the Ascaris lumbricoides (a nematode worm) is similarly arranged. However, in the case of the Ascaris lumbricoides ovary you can see the polar bodies produced during oogenesis as their life time is long enough that they are preserved in the fixed tissue. Additionally, fertilization also occurs in the ovary allowing for the observation of the pronuclei in early fertilization. In this lab we are going to use these two model organisms to observe the processes of meiosis and fertilization.
PRE-LAB QUESTIONS:
1. Why are we not using human ovaries and testis to observe meiosis and pronuclei?
DATA COLLECTION:
2. Select the grasshopper testis slide using the RWSL microscope control panel.
16 | P a g e L a s t U p d a t e d A p r i l 2 5 , 2 0 1 4
3. Use the "capture image" feature on the RWSL control panel to capture an image of the testis.
4. Select the Ascaris lumbricoides Female slide using the RWSL microscope control panel.5. Use the "capture image" feature on the RWSL control panel to capture an image of a
developing oocyte with a polar body attached.6. Use the "capture image" feature on the RWSL control panel to capture an image of a
fertilized egg with an egg and sperm pronuclei.
ANALYSIS:
7. Use the insert and textbox feature on your computer word processing program to label two cells in meiosis I and two cells in meiosis II. (Place Image Below)
8. Use the insert and textbox feature on your computer word processing program to label the oocyte, polar bodies, and egg and sperm pronuclei as appropriate in the two Ascaris lumbricoides pictures. (Place Image Below)
EXERCISE 5: Meiosis in Humans (optional)
PRE-LAB:
In humans meiosis occurs in special tissues in specialized organs, the ovary in females and the testes in males. The biological function of these organs is to isolate, protect, support, and deliver the gametes. Early in the process of development the cells that will become the gametes temporally exit the cell cycle and are segregated to a region of the embryo that will become the testes or ovaries. This process of segregation helps protect the DNA of germline cells from damage in two ways. The first is that these cells will undergo fewer rounds of division and therefore DNA synthesis then the other cells in the body. This is important because DNA synthesis is one of the most common ways DNA modification can occur. Second these cells live inside the structure of the testes or ovary and get some protection from the outside world. In this exercise we will observe the cells needed to support the development of the sperm and eggs in humans in this exercise. In addition to identifying fully developed sperm and eggs.
PRE-LAB QUESTIONS:
1. Do you think the appearance of the chromosomes will look different in the meiotic cell cycle stages than in the mitotic cell stages you observed earlier? Explain.
DATA COLLECTION:
2. Select the prepared slide of the Mammal Graafian Follicles using the RWSL microscope control.
17 | P a g e L a s t U p d a t e d A p r i l 2 5 , 2 0 1 4
3. Use the "capture image" feature on the RWSL microscope control panel to capture an image of the Mammal Graafin Follicles.
4. Select the prepared slide of the Human Testis using the RWSL microscope control. 5. Use the "cpature image" feature on the RWSL microscope control panel to capture an
image of the Human Testes.
ANALYSIS:
6. Use the insert and textbox features on your computer word processing program to label the primary follicle, primary oocyte, secondary follicle, and secondary oocyte. (Include Image Below)
7. Use the insert and textbox features on your computer word processing program to label seminiferous tubules and mature tailed sperm. (Include Image Below)
8. Was your prediction in question on correct? Explain.
SUMMARY QUESTIONS: Mitosis and Meiosis Experiment
1. Which is more similar to mitosis: meiosis I or meiosis II? Explain your answer.2. Can a haploid cell undergo meiosis? Can it divide by mitosis?3. Why do you expect the diploid number of chromosomes always to be an even number
and never an odd number?4. How does crossing over contribute to genetic variability? Does this have any
evolutionary significance?5. How does the cell decide which homologue goes to which pole during anaphase I? How
does this contribute to genetic variability?
18 | P a g e L a s t U p d a t e d A p r i l 2 5 , 2 0 1 4
For more information about NANSLO, visit www.wiche.edu/nanslo.
All material produced subject to:
Creative Commons Attribution 3.0 United States License 3
This product was funded by a grant awarded by the U.S. Department of Labor’s Employment and Training Administration. The product was created by the grantee and does not necessarily reflect the official position of the U.S. Department of Labor. The Department of Labor makes no guarantees, warranties, or assurances of any kind, express or implied, with respect to such information, including any information on linked sites and including, but not limited to, accuracy of the information or its completeness, timeliness, usefulness, adequacy, continued availability, or ownership.
19 | P a g e L a s t U p d a t e d A p r i l 2 5 , 2 0 1 4