remittances and natural disasters: ex-post response and contribution to ex-ante preparedness
TRANSCRIPT
Remittances and natural disasters: ex-post responseand contribution to ex-ante preparedness
Sanket Mohapatra • George Joseph • Dilip Ratha
Received: 6 August 2010 / Accepted: 14 October 2011 / Published online: 6 April 2012� Springer Science+Business Media B.V. 2012
Abstract Macro- and microeconomic evidence suggests a positive role of remittances in
preparing households against natural disasters and in coping with the loss afterward.
Analysis of cross-country macroeconomic data shows that remittances increase in the
aftermath of natural disasters in countries that have a larger number of migrants abroad.
Analysis of household survey data in Bangladesh shows that per capita consumption was
higher in remittance-receiving households than in others after the 1998 flood. Ethiopian
households that receive international remittances seem to rely more on cash reserves and
less on selling household assets or livestock to cope with drought. In Burkina Faso and
Ghana, international remittance-receiving households, especially those receiving remit-
tances from high-income developed countries, tend to have housing built of concrete rather
than mud and greater access to communication equipment, suggesting that they are better
prepared against natural disasters.
Keywords Natural disasters � Migration � Remittances � Poverty � Coping strategies �Insurance � Development finance
This paper—a joint product of the Global Facility for Disaster Reduction and Recovery (GFDRR) Unit,Sustainable Development Network Vice Presidency, and the Migration and Remittances Team of theDevelopment Prospects Group, Development Economics Vice Presidency—is part of a larger effort of theGFDRR unit to disseminate the findings a World Bank-UN Assessment of the Economics of Disaster RiskReduction titled ‘‘Natural Hazards, UnNatural Disasters’’. Thanks to Antonio C. David for his contributionto the macroeconomic analysis in the first part of the paper.
Readers should send their comments on this article to [email protected] within 3 months of publi-cationof this issue.
S. Mohapatra (&) � G. Joseph � D. RathaWorld Bank, 1818 H Street, NW, Washington, DC 20433, USAe-mail: [email protected]
123
Environ Dev Sustain (2012) 14:365–387DOI 10.1007/s10668-011-9330-8
1 Introduction
The literature suggests that migrant remittance flows increase in the aftermath of natural
disasters, macroeconomic or financial crises and act as a safety net for households that
have migrants abroad (World Bank 2006).1 While there is anecdotal evidence and a
number of case studies on this phenomenon, there is little empirical evaluation of the
relationship between remittances and natural disasters (see next section for literature
survey). In this paper, we examine three inter-related questions: (1) How do remittances
respond ex-post to natural disasters? (2) Do remittances help recipient households to
maintain consumption expenditure in the aftermath of disasters? (3) Are remittance-
receiving households ex-ante better prepared for disasters such as earthquakes and floods?
We use cross-country macroeconomic data to examine the ex-post response of migrant
remittances to natural disasters for a large sample of developing countries, income groups,
and geographical regions to examine the hypothesis that remittances respond in a coun-
tercyclical (compensatory) manner to natural disasters in the recipient economies.
This paper also relies on micro-level household survey data for several developing coun-
tries (Bangladesh, Burkina Faso, Ethiopia and Ghana) to understand how remittances sent by
migrants residing in high-income and developing countries contribute to ex-post disaster relief
for the affected households and to ex-ante preparedness against future natural disasters.
To briefly summarize the results based on the different hypotheses tested for the cross-
country data and the household surveys from four countries, we find the following. First,
remittances increase in response to natural disasters in countries that have a larger emigrant
stock as a share of the home country population. Second, in the period after a flood in
Bangladesh in 1998, per capita household consumption was higher for households that
receive remittances, even after controlling for the possibility that these households may be
self-selected. Third, international remittance-receiving households in Burkina Faso and
Ghana, especially those that receive remittances from high-income OECD countries, have
housing built of concrete rather than mud and have greater access to communications, which
can help in coping during natural disasters. Finally, Ethiopian households that receive
international remittances tend to rely more on their own cash reserves during shocks to food
security and less on selling productive assets such as household assets or livestock.
The rest of the paper is organized as follows. The next section reviews the literature on
natural disasters, migration, and remittances. Section 3 presents cross-country analysis on the
ex-post response of remittances to natural disasters. In Sect. 4, we explore using household
survey data to analyze ex-post responses and ex-ante preparedness. Section 4.1 considers how
remittances to Bangladesh helped households in maintaining consumption after a severe flood
(a rapid-onset but predictable disaster) in 1998. Section 4.2 considers for Burkina Faso and
Ghana whether remittance-receiving households are ex-ante better prepared for disasters such
as earthquakes and landslides. This section provides an analysis of how recipient households
often use remittances for investment in stronger housing and improving access to commu-
nication, which can help in reducing vulnerability to natural disasters.2 Section 4.3 explores
the coping strategies used by remittance-recipient and non-recipient households in Burkina
Faso with predictable and recurrent droughts. Section 5 concludes.
1 There are about 200 million international migrants. A large share of these international migrants or about156 million people are from developing countries (Ratha and Shaw 2007). Migrants from developingcountries sent home an estimated $305 billion in officially recorded remittances in 2008, with these flowslarger than official aid and foreign direct investment in many developing countries.2 Such income shocks may be factored in the inter-temporal consumption and remitting decisions.
366 S. Mohapatra et al.
123
2 Natural disasters, migration, and remittances: review of the literature
This section provides a review of the response of remittances to natural disasters drawing
on the macroeconomic literature and household-level studies. Anecdotal and case study
evidence seems to suggest that contrary to private international capital flows (which are
usually procyclical), remittance flows increase or remain stable after the onset of large
shocks such as natural disasters, macroeconomic or financial crises, and armed conflicts
(Clarke and Wallsten 2004; World Bank 2006; Weiss-Fagen and Bump 2005). Yang
(2007) provides cross-country evidence on the response of international flows to hurricanes
and concludes that for poorer countries, increased hurricane exposure is associated with
greater remittance flows. In addition, it is estimated that in the Caribbean, a 1% decrease in
real gross domestic product (GDP) is associated with a 3% increase in migrant remittances
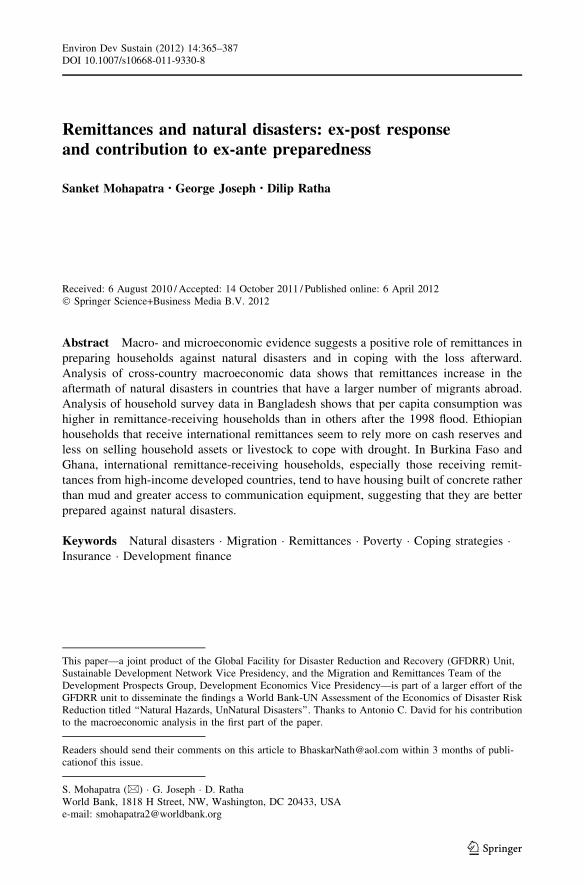
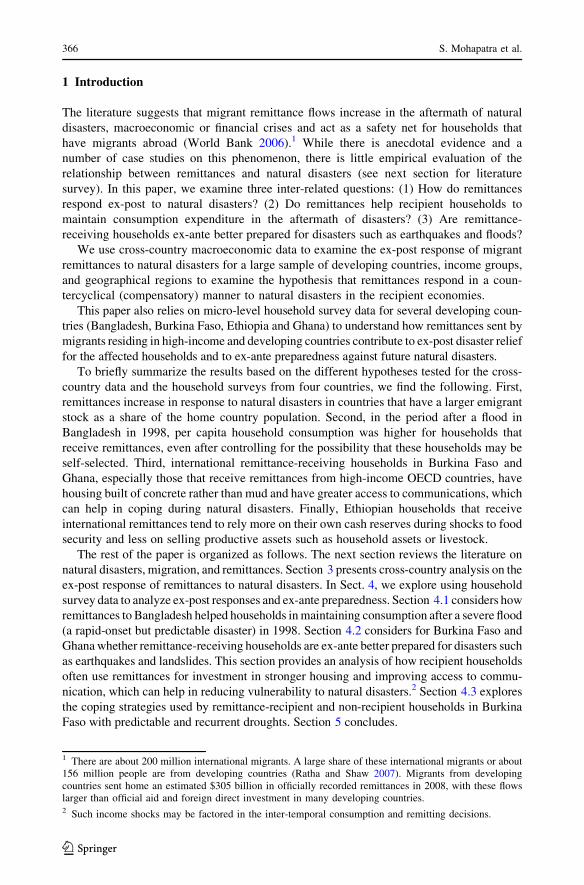
with a 2-year lag (Mishra 2005). Figures 1 and 2 provide certain instances of the response
of remittances to large natural disaster in selected countries. These indicate substantial
variation in the increase in remittances during and after natural disasters, with a substantial
increase in remittances after the disaster in about half of those countries.
Furthermore, there is an emerging consensus in the literature that migration and
remittances are part of an overall livelihood strategy by which households try to insure
against shocks in disaster prone regions. Migration flows increased in the aftermath of
disasters as in Jamaica in 1989 after hurricane Gilbert and in Central America in 1998 after
hurricane Mitch (Wisner 2003). In El Salvador, an agricultural shock increases the prob-
ability of migration of a household member to the United States by 24.3% (Halliday
2006).3 Increased migration can lead to an increase in remittance transfers to the house-
holds after disaster events, but with a lag (Attzs 2008), although Figs. 1 and 2 suggest that
it is not necessary that there would be an unambiguous increase in remittances in all
countries after natural disasters.4
Migrant remittances have an important consumption smoothing effect and can con-
tribute to financing household investment in concrete housing and communication
equipment to increase ex-ante preparedness and to mitigate the impact of disasters in
disaster prone areas. Several country studies using household survey data confirm the
consumption smoothing role played by remittances in recipient households (see Quartey
and Blankson 2004). Yang and Choi (2007) show for the Philippines that remittances help
to compensate for nearly 65% of the loss in income due to rainfall shocks.5
Evidence from small-scale surveys conducted after disasters suggests that migrant
remittances may have helped recipient households. A survey of households in four villages
in Pakistan after a devastating earthquake in 2005 reveals that migrant remittances were
important factors in disaster recovery and reconstruction (Suleri and Savage 2006). The
authors suggest quickly restoring banking and financial services to facilitate remittance
flows. Remittance-receiving households in the Aceh region of Indonesia were found to
have recovered faster from the 2004 Tsunami though because of immediate relief provided
3 However, Yang (2007) shows for El Salvador that idiosyncratic shocks to the household such as death of ahousehold member increase the likelihood of emigration, while covariate shocks such as earthquakes, wherethe entire population is affected, can even reduce emigration.4 Furthermore, if migration and remittance decisions are undertaken as a part of the overall coping strategyby households in disaster prone regions, we may not necessarily observe a marked increase in remittances inthe wake of slow onset disaster event such as drought since remittances are factored into the inter-temporalconsumption decisions and will not change much unless there is an idiosyncratic shock.5 However, it is possible that the loss of the most able household members who migrate may make itdifficult for the remaining household members to cope with shocks including natural disasters.
Remittances and natural disasters 367
123
by migrant remittances, although remittance transfers were adversely affected due to the
disruption of financial services and informal remittance transfer channels (Wu 2006).
In Gonavies, the largest city in Haiti, in-kind transfers from friends and relatives abroad,
especially in the United States, after the cyclone Jeane in 2004 played an important role in
relieving the immediate distress from the devastation caused by the cyclone (Fagan 2006).6
There was a 15% increase in remittances to Granada after hurricane Ivan in 2005, which
helped the households to recover from the disaster (Harvey and Savage 2007). Increased
remittances helped to smooth household consumption and compensate for the loss of assets
after an earthquake in El Salvador in 2001 (Halliday 2006).
There is increasing emphasis in the policy debates on measures that can reduce the ex-
ante vulnerability to natural disasters.7 In disaster-prone regions or countries, ex-ante
0
0.005
0.01
0.015
0.02
0.025
0.03
0.035
0.04
India 1992 Bangladesh1998
China 1999 Mexico 2005
Year before
Disaster year
Year after
Rem
ittan
ce a
s %
of G
DP
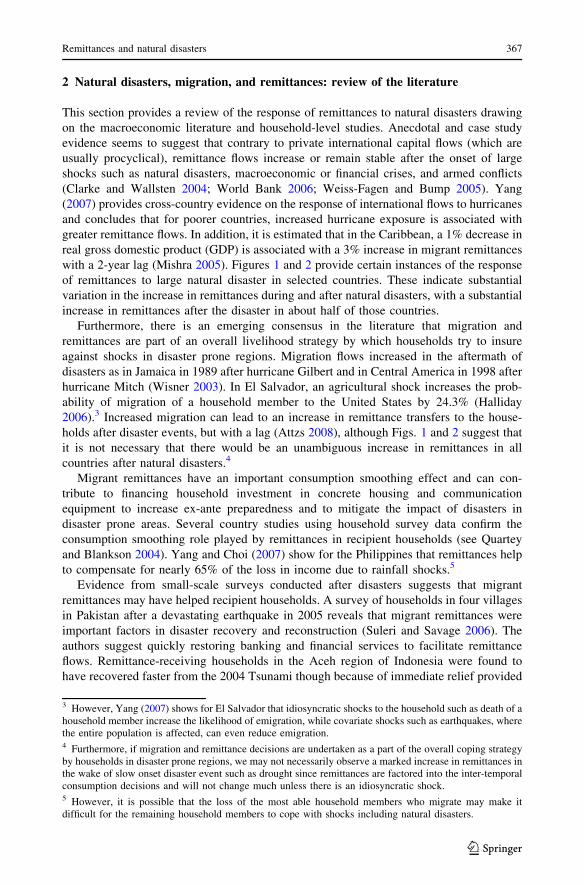
Fig. 1 Increase in remittances after large natural disasters (disaster costs in constant 2000 US dollars).Asterisk represents the years in which developing countries experienced the highest damages from naturaldisasters in constant 2000 US$. Estimated damages due to natural disasters were $9.4 billion in India in1992, $4.5 billion in Bangladesh in 1998, $10.4 billion in China in 1999, $6.9 billion in Mexico in 2005.Damages are in constant 2000 US dollars. Source: Authors’ calculations using International EmergencyDisasters Database (EM-DAT) and World Development Indicators (WDI), World Bank
-0.02
0.03
0.08
0.13
0.18
0.23
0.28
ElSalvador1986 Honduras1998 Guyana2004 Jamaica2004
Year before
Disaster year
Year after
Rem
ittan
ce a
s %
of G
DP
Fig. 2 Increase in remittances after large natural disasters (disaster costs as share of GDP). Asteriskrepresents the years in which developing countries experienced the high damages as a share of GDP fromnatural disasters. Damages due to natural disasters were 0.04% of GDP in El Salvador in 1986, 0.08% ofGDP in Honduras in 1998, 0.01% of GDP in Guyana in 2004 and 0.01% of GDP in Jamaica in 2004. Source:Authors’ calculations using International Emergency Disasters Database (EM-DAT) and World Develop-ment Indicators (WDI), World Bank
6 In-kind remittances, especially from domestic migrants, are important in many countries, but there is verylittle reliable data on these. The reported values of remittances from the household surveys include in-kindremittances to some extent.7 The Hyogo framework (www.unisdr.org/eng/hfa/hfa.htm) recognizes the importance of integratingdisaster concerns in the larger context of development and vulnerability reduction.
368 S. Mohapatra et al.
123
actions taken by households with migrants (community and the government) in preparation
for a possible disaster can substantially reduce the loss of human life and vulnerability in
the aftermath of the disaster. For example, programs to reduce the impact on livelihoods
have been introduced in countries such as Jamaica that face recurrent devastating
cyclones.8
However, although there is substantial evidence of how remittances sent by migrants
abroad contribute to ex-post responses, there is little evidence of how remittances can
facilitate ex-ante preparedness that reduces the extent of damages in the event of a natural
disaster.9 For example, remittances can contribute to disaster preparedness by households
by making resources available for investments in home improvements so as to increase
their disaster resilience. Collective remittance incomes and diaspora contributions can be
channelized to augment the efforts of the government and international organizations.
3 Macroeconomic evidence of the response of remittances to natural disasters
In this section, we empirically investigate the following question for a large sample of
developing countries and across income groups and geographical regions: Do remittances
respond in a countercyclical or compensatory manner to natural disasters in the recipient
economies?
The empirical exercise is undertaken primarily to understand whether remittances
respond to natural disaster events in home countries.
3.1 Data
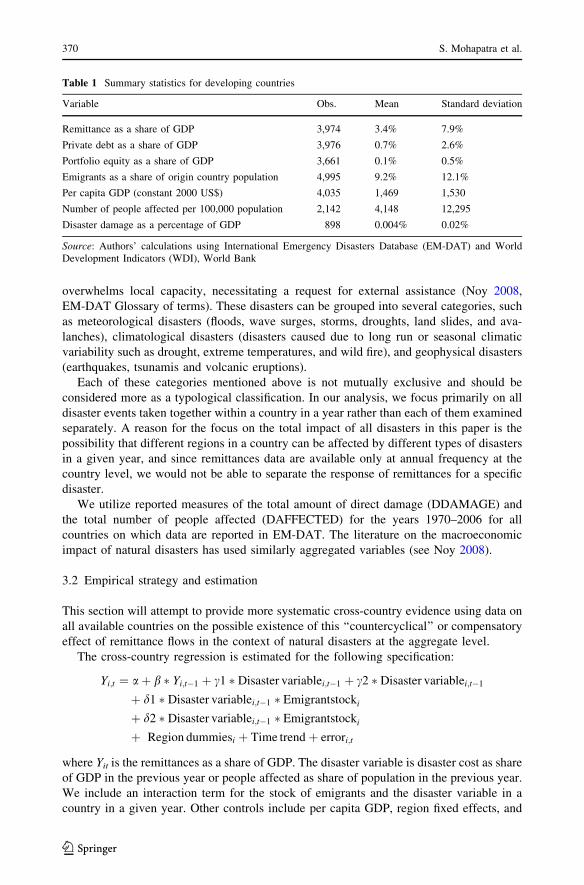
The outcome variables of interest are migrant remittances to a country i in a year t. The
econometric analysis is based on estimates of remittance flows to developing countries
from the World Bank’s World Development Indicators (WDI). Data on GDP per capita and
population come primarily from the same source. Summary statistics of the different flows
and other variables of interest are presented in Table 1.
Natural disaster data on the occurrence and effects of natural disasters are from Center
for Research on the Epidemiology of Diseases (CRED), International Emergency Disasters
Database (EM-DAT).10 CRED defines a disaster as a natural situation or event which
8 For example, these include green houses for horticulture that can be easily disassembled and reassembledbefore and after hurricanes (UN News Center ‘‘To Succeed, Disaster Management Strategies Must Target,Reduce Inequalities, Vulnerabilities Faced By Poor, UN Economic and Social Council told.’’ 16 July, 2008(http://www.un.org/News/Press/docs/2008/ecosoc6363.doc.htm)).9 There is some evidence from a related literature on household coping strategies that receiving additionalincome may reduce ex-ante vulnerability. Udry (1994) finds for a sample of rural households in northernNigeria that households facing increased weather variability deplete grain inventories at a slower rate tocope with the possibility of income shocks due to weather fluctuations. In a similar work, Paxson (1992)finds for a sample of rural farmers in Thailand that farm households experiencing rainfall shocks save asignificantly larger portion of transitory agricultural income in order smooth consumption from incomefluctuations. In another study, Rosenzweig and Wolpin (1993) show that farmers in India are more apt to sellbullocks when they experience income shocks.10 The Center for Research on the Epidemiology of Diseases (CRED) has collected and made publicallyavailable data on the occurrence and effects of natural disasters from 1900 to the present with a worldwidecoverage. The database is compiled from various sources, including UN agencies, non-governmentalorganizations, insurance companies, research institutions and press agencies. The EM-DAT data is publiclyavailable on CRED’s web site at: www.cred.be.
Remittances and natural disasters 369
123
overwhelms local capacity, necessitating a request for external assistance (Noy 2008,
EM-DAT Glossary of terms). These disasters can be grouped into several categories, such
as meteorological disasters (floods, wave surges, storms, droughts, land slides, and ava-
lanches), climatological disasters (disasters caused due to long run or seasonal climatic
variability such as drought, extreme temperatures, and wild fire), and geophysical disasters
(earthquakes, tsunamis and volcanic eruptions).
Each of these categories mentioned above is not mutually exclusive and should be
considered more as a typological classification. In our analysis, we focus primarily on all
disaster events taken together within a country in a year rather than each of them examined
separately. A reason for the focus on the total impact of all disasters in this paper is the
possibility that different regions in a country can be affected by different types of disasters
in a given year, and since remittances data are available only at annual frequency at the
country level, we would not be able to separate the response of remittances for a specific
disaster.
We utilize reported measures of the total amount of direct damage (DDAMAGE) and
the total number of people affected (DAFFECTED) for the years 1970–2006 for all
countries on which data are reported in EM-DAT. The literature on the macroeconomic
impact of natural disasters has used similarly aggregated variables (see Noy 2008).
3.2 Empirical strategy and estimation
This section will attempt to provide more systematic cross-country evidence using data on
all available countries on the possible existence of this ‘‘countercyclical’’ or compensatory
effect of remittance flows in the context of natural disasters at the aggregate level.
The cross-country regression is estimated for the following specification:
Yi;t ¼ aþ b � Yi;t�1 þ c1 � Disaster variablei;t�1 þ c2 � Disaster variablei;t�1
þ d1 � Disaster variablei;t�1 � Emigrantstocki
þ d2 � Disaster variablei;t�1 � Emigrantstocki
þ Region dummiesi þ Time trendþ errori;t
where Yit is the remittances as a share of GDP. The disaster variable is disaster cost as share
of GDP in the previous year or people affected as share of population in the previous year.
We include an interaction term for the stock of emigrants and the disaster variable in a
country in a given year. Other controls include per capita GDP, region fixed effects, and
Table 1 Summary statistics for developing countries
Variable Obs. Mean Standard deviation
Remittance as a share of GDP 3,974 3.4% 7.9%
Private debt as a share of GDP 3,976 0.7% 2.6%
Portfolio equity as a share of GDP 3,661 0.1% 0.5%
Emigrants as a share of origin country population 4,995 9.2% 12.1%
Per capita GDP (constant 2000 US$) 4,035 1,469 1,530
Number of people affected per 100,000 population 2,142 4,148 12,295
Disaster damage as a percentage of GDP 898 0.004% 0.02%
Source: Authors’ calculations using International Emergency Disasters Database (EM-DAT) and WorldDevelopment Indicators (WDI), World Bank
370 S. Mohapatra et al.
123
time trend. We introduce lagged remittances as an additional explanatory variable to
account for the observed persistence of remittance flows over time.
As in several previous studies (Yang 2007), we use cross-country (panel) fixed effects
regression. The fixed effects control for unobserved country-specific heterogeneity. Our
analysis differs from the previous works in that we have used a large subsample of
developing countries (129 countries) for which the data are available. Also this is one of
the first studies on the determinants of the remittance flows to explicitly introduce emigrant
stocks as a share of the home country population.
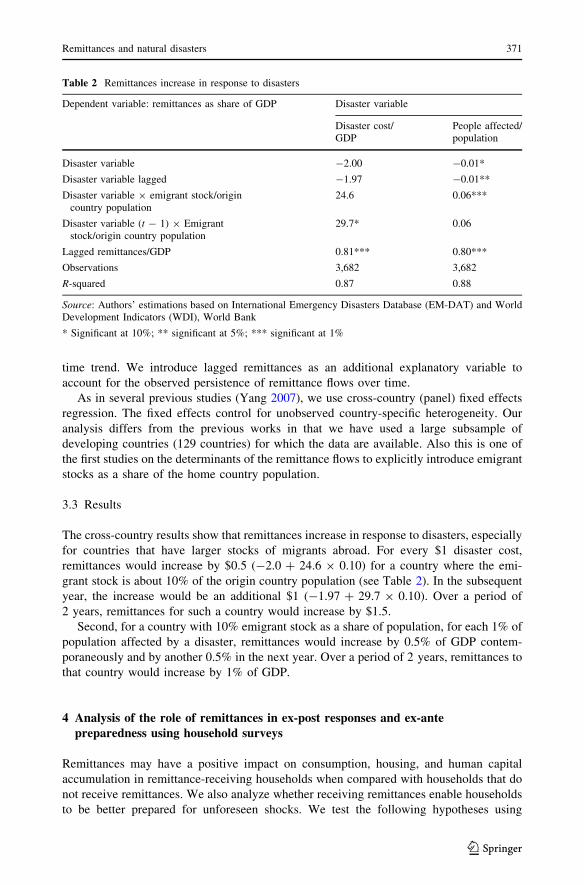
3.3 Results
The cross-country results show that remittances increase in response to disasters, especially
for countries that have larger stocks of migrants abroad. For every $1 disaster cost,
remittances would increase by $0.5 (-2.0 ? 24.6 9 0.10) for a country where the emi-
grant stock is about 10% of the origin country population (see Table 2). In the subsequent
year, the increase would be an additional $1 (-1.97 ? 29.7 9 0.10). Over a period of
2 years, remittances for such a country would increase by $1.5.
Second, for a country with 10% emigrant stock as a share of population, for each 1% of
population affected by a disaster, remittances would increase by 0.5% of GDP contem-
poraneously and by another 0.5% in the next year. Over a period of 2 years, remittances to
that country would increase by 1% of GDP.
4 Analysis of the role of remittances in ex-post responses and ex-antepreparedness using household surveys
Remittances may have a positive impact on consumption, housing, and human capital
accumulation in remittance-receiving households when compared with households that do
not receive remittances. We also analyze whether receiving remittances enable households
to be better prepared for unforeseen shocks. We test the following hypotheses using
Table 2 Remittances increase in response to disasters
Dependent variable: remittances as share of GDP Disaster variable
Disaster cost/GDP
People affected/population
Disaster variable -2.00 -0.01*
Disaster variable lagged -1.97 -0.01**
Disaster variable 9 emigrant stock/origincountry population
24.6 0.06***
Disaster variable (t - 1) 9 Emigrantstock/origin country population
29.7* 0.06
Lagged remittances/GDP 0.81*** 0.80***
Observations 3,682 3,682
R-squared 0.87 0.88
Source: Authors’ estimations based on International Emergency Disasters Database (EM-DAT) and WorldDevelopment Indicators (WDI), World Bank
* Significant at 10%; ** significant at 5%; *** significant at 1%
Remittances and natural disasters 371
123
household survey data: (1) remittances are positively associated with absolute levels of
household per capita consumption and (2) remittance-receiving households have concrete
houses and better access to communication that can reduce vulnerability to natural
disasters such as earthquakes and floods.
4.1 Data and methodology
We use household survey data for Burkina Faso (2003), Ghana (2005) and Bangladesh
(1998–1999), and Ethiopia (2004). In particular for Bangladesh, we have three rounds of
data collected on households after the devastating flood of July–September 1998. We use
the nationally representative Ghana Living Standards Survey (GLSS V) conducted in 2005,
the Burkina Faso Core Welfare Indicators Questionnaire Survey conducted in 2003, and
the Ethiopia Welfare Monitoring Survey in 2004.
To assess the long-term effects of remittances on current consumption, we first have to
deal with the issue of self-selection: many of the factors that determine remittance-
recipient status could determine the level of per capita household consumption. We use
propensity score matching techniques to construct a counter-factual group of households
that do not receive remittances, but are otherwise similar in observable characteristics to
that of the remittance-receiving households for Bangladesh, Ghana, and Burkina Faso
(Heckman et al. 1997, 1998). This procedure helps us to control for the endogeneity of
remittance-receiving status to a large extent on the basis of observable characteristics of the
households. The findings for Ethiopia on the differences in coping strategies for house-
holds that receive international remittances and other households are suggestive and do not
attempt to control for endogeneity.
In the regression analysis, we include factors that determine remittance-receiving status
as follows: (1) age of the household head; (2) educational attainment as shown by the
number of household members with primary, secondary and tertiary education; (3) phys-
ical capital such as land and other assets, (4) household’s maximum education attainment
or the highest number of years of education of any household member, (5) current area of
residence (urban or rural), (6) number of children below the age of 5, (7) number of adult
male members, and (8) regional dummies. In some specifications, we include additional
factors that determine per capita consumption such as whether the household receive
public assistance and more detailed asset variables.
4.2 Role of remittances in maintaining consumption after 1998 flood in Bangladesh
A devastating flood in Bangladesh in July–September 1998 covered more than two-thirds
of the country and caused 2 million metric tons of rice crop losses and threatened the
livelihoods of millions through food shortages (del Ninno et al. 2011). Three waves of
representative household surveys were conducted after a flood in 1998 in rural Bangladesh
in 7 flood affected regions (thanas) within 4 to 16 months after the flood by the Interna-
tional Food Policy Research Institute (IFPRI) to understand how households cope with the
flood (see del Ninno et al. 2011). The first round was conducted in November–December
1998, the second round in April–May 1999, and the third round was in November–
December 1999. These surveys provide information on the pre-flood asset holding and the
migration and remittance histories of households (see Table 3). The first round of the
survey contains information on various measures of the severity of flood at the village
level, such as the depth of water in the house, number of days water remained in the house,
372 S. Mohapatra et al.
123
number of days evacuated, cost of repair, and a flood index developed by IFPRI using the
above flood measures.
Of the 734 households that are available in all the three surveys, 493 were affected by
the 1998 flood. Using propensity score matching technique using the household charac-
teristics discussed in Sect. 4.2, we identified 469 households that are comparable in terms
of household characteristics and other determinants of remittance-receiving status. Among
these 469 households, around 118 or 25% of households receive remittances. The latter
group includes households that receive remittances either from within Bangladesh or from
other countries, since information on specific sources is not available from the surveys.
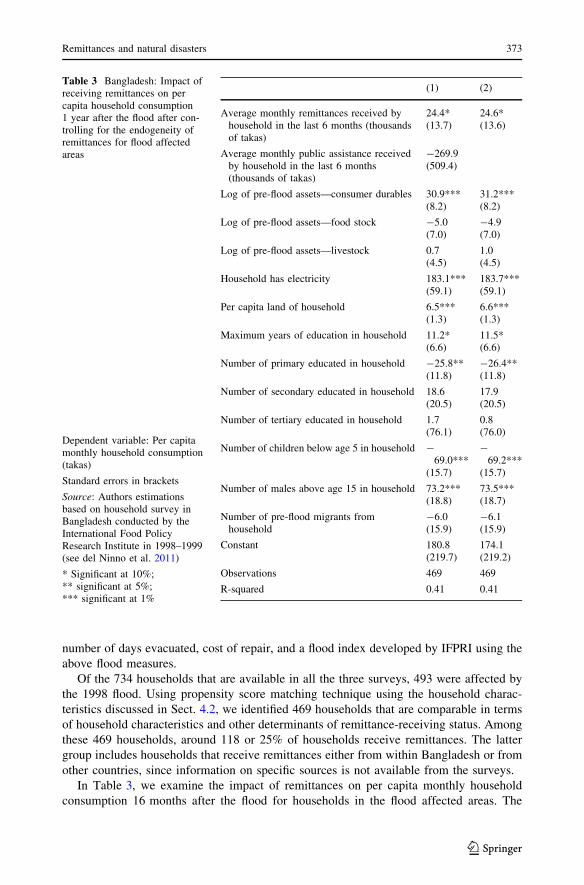
In Table 3, we examine the impact of remittances on per capita monthly household
consumption 16 months after the flood for households in the flood affected areas. The
Table 3 Bangladesh: Impact ofreceiving remittances on percapita household consumption1 year after the flood after con-trolling for the endogeneity ofremittances for flood affectedareas
Dependent variable: Per capitamonthly household consumption(takas)
Standard errors in brackets
Source: Authors estimationsbased on household survey inBangladesh conducted by theInternational Food PolicyResearch Institute in 1998–1999(see del Ninno et al. 2011)
* Significant at 10%;** significant at 5%;*** significant at 1%
(1) (2)
Average monthly remittances received byhousehold in the last 6 months (thousandsof takas)
24.4*(13.7)
24.6*(13.6)
Average monthly public assistance receivedby household in the last 6 months(thousands of takas)
-269.9(509.4)
Log of pre-flood assets—consumer durables 30.9***(8.2)
31.2***(8.2)
Log of pre-flood assets—food stock -5.0(7.0)
-4.9(7.0)
Log of pre-flood assets—livestock 0.7(4.5)
1.0(4.5)
Household has electricity 183.1***(59.1)
183.7***(59.1)
Per capita land of household 6.5***(1.3)
6.6***(1.3)
Maximum years of education in household 11.2*(6.6)
11.5*(6.6)
Number of primary educated in household -25.8**(11.8)
-26.4**(11.8)
Number of secondary educated in household 18.6(20.5)
17.9(20.5)
Number of tertiary educated in household 1.7(76.1)
0.8(76.0)
Number of children below age 5 in household -69.0***
(15.7)
-69.2***
(15.7)
Number of males above age 15 in household 73.2***(18.8)
73.5***(18.7)
Number of pre-flood migrants fromhousehold
-6.0(15.9)
-6.1(15.9)
Constant 180.8(219.7)
174.1(219.2)
Observations 469 469
R-squared 0.41 0.41
Remittances and natural disasters 373
123
analysis is performed on all households comparable to remittance-receiving households in
terms of observable characteristics. We find that remittances have a positive and significant
effect on per capita monthly household consumption. Since the average household size is
6.4, a thousand taka increase in remittances to the remittance-recipient households in the
6 months prior to the survey leads to about a 156 taka (=6.4 9 24.37) increase in monthly
household consumption expenditure of the average household (including those do not
receive remittances).11
4.3 Ex-ante preparedness of remittance-receiving households for disasters in Ghana
and Burkina Faso
In this section, we explore whether households in Ghana and Burkina Faso that receive
remittances ex-ante better prepared against natural disasters compared with other house-
holds. West Africa in general and the Sahel region in particular are characterized by some
of the most variable climates on the world, with the predominant disasters being droughts
(Brown and Crawford 2008) and floods (Armah et al. 2008). We use the latest available
Ghana Living Standard Survey (GLSS V) 2005, to estimate the impact of remittances on
ex-ante preparedness of households. Of the 8,687 households in the sample, 2,181
households (25%) receive domestic remittances, while 541 (6.5%) receive remittances
from OECD countries and 122 (1.5%) receive remittances from African countries (see
Table 6 in Appendix). Since we can identify the source of remittances, we can distinguish
the differential impact of remittances from relatively richer OECD countries and poorer
African countries on the receiving households. However, endogeneity of remittance-
receiving status needs to be controlled for in our analysis. As in the previous section, we
used propensity score matching to construct comparable households on the basis of
observable household characteristics.
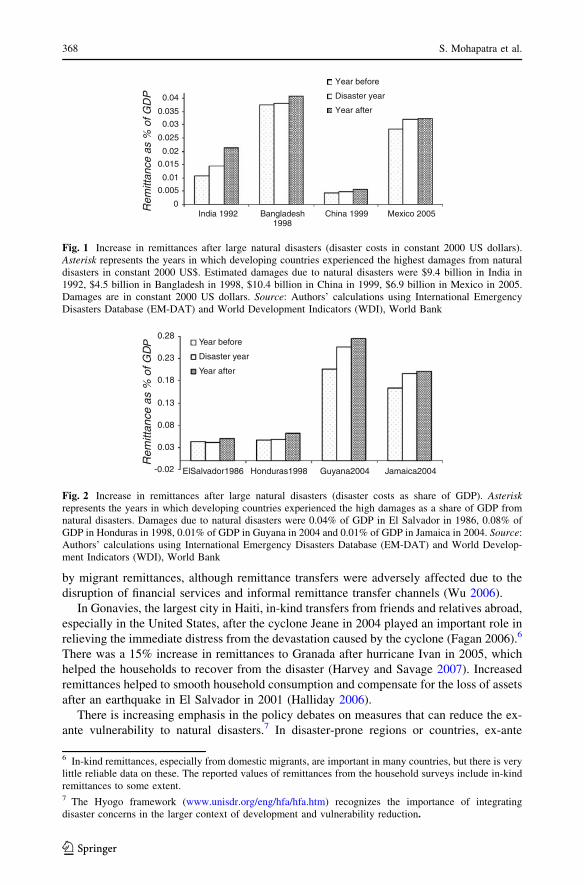
Materials used for the construction of the house potentially reveal how prepared
households are in the event of disasters such as flood, earthquakes, cyclones, and landslides.
Concrete houses are usually more disaster resilient, while houses made of mud and bricks
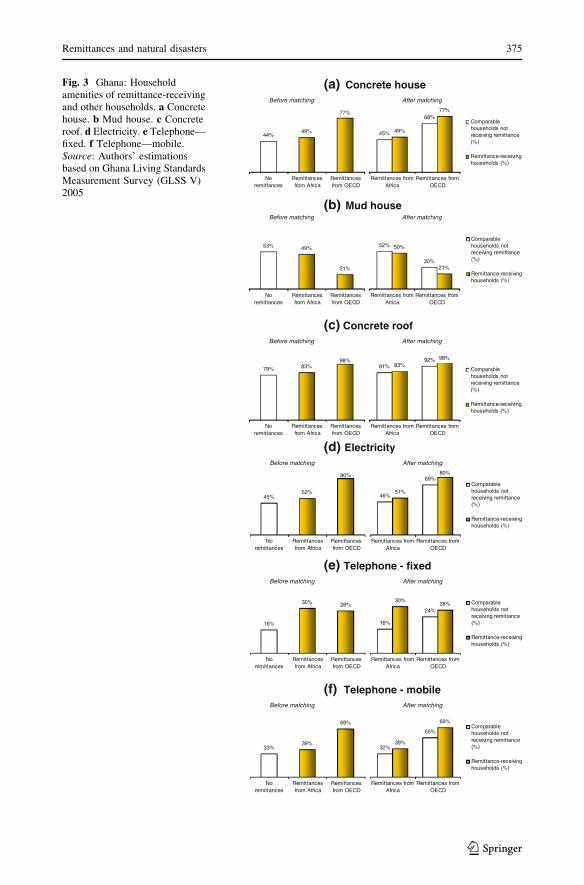
are more susceptible to destruction in the event of a disaster. Ghanaian households that
receive international remittances from OECD countries are more likely to have a concrete
house. Without controlling for endogeneity of the remittance-receiving decision, 44% of
Ghanaian households that do not receive remittances have a concrete house. 49% of
households that receive remittances from other African countries have a concrete house and
77% of households that receive remittances from OECD countries have a concrete house.
After controlling for endogeneity of remittance-receiving status, 77% of Ghanaian
households that receive remittances from OECD countries have a concrete house versus
68% of comparable households that do not receive remittances (see Fig. 3 and Table 7). Of
households that receive remittances from other African countries, 49% have a concrete
house versus 45.3% of comparable households that do not receive remittances.
As shown in Fig. 3, even after correcting for endogeneity of remittance-receiving status,
households that receive remittances from OECD countries and those that receive
remittances from other African countries have fewer mud houses. Similarly, remittance-
11 That would imply a marginal propensity of consumption of 62% out of additional remittances (since theestimated increase in consumption above is the average increase for the matched sample which includeshouseholds that don’t receive any remittances). This appears to be lower than the average propensity toconsume likely because of the use of remittances for reconstruction after the flood.
374 S. Mohapatra et al.
123
(a) Concrete houseBefore matching After matching
44%49%
77%
Noremittances
Remittancesfrom Africa
Remittancesfrom OECD
45%
68%
49%
77%
Remittances fromAfrica
Remittances fromOECD
Comparablehouseholds notreceiving remittance(%)
Remittance-receivinghouseholds (%)
(b) Mud houseBefore matching After matching
53% 49%
21%
Noremittances
Remittancesfrom Africa
Remittancesfrom OECD
52%
30%
50%
21%
Remittances fromAfrica
Remittances fromOECD
Comparablehouseholds notreceiving remittance(%)
Remittance-receivinghouseholds (%)
(c) Concrete roofBefore matching After matching
79% 83%98%
Noremittances
Remittancesfrom Africa
Remittancesfrom OECD
81%92%
83%98%
Remittances fromAfrica
Remittances fromOECD
Comparablehouseholds notreceiving remittance(%)
Remittance-receivinghouseholds (%)
(d) ElectricityBefore matching After matching
45%52%
80%
Noremittances
Remittancesfrom Africa
Remittancesfrom OECD
46%
69%
51%
80%
Remittances fromAfrica
Remittances fromOECD
Comparablehouseholds notreceiving remittance(%)
Remittance-receivinghouseholds (%)
(e) Telephone - fixedBefore matching After matching
16%
30% 28%
Noremittances
Remittancesfrom Africa
Remittancesfrom OECD
16%
24%
30%28%
Remittances fromAfrica
Remittances fromOECD
Comparablehouseholds notreceiving remittance(%)
Remittance-receivinghouseholds (%)
(f) Telephone - mobileBefore matching After matching
33%39%
69%
Noremittances
Remittancesfrom Africa
Remittancesfrom OECD
32%
55%
39%
69%
Remittances fromAfrica
Remittances fromOECD
Comparablehouseholds notreceiving remittance(%)
Remittance-receivinghouseholds (%)
Fig. 3 Ghana: Householdamenities of remittance-receivingand other households. a Concretehouse. b Mud house. c Concreteroof. d Electricity. e Telephone—fixed. f Telephone—mobile.Source: Authors’ estimationsbased on Ghana Living StandardsMeasurement Survey (GLSS V)2005
Remittances and natural disasters 375
123
receiving households have roof made of corrugated iron sheets, cement, concrete, asbestos,
slate, and roofing tiles rather than roofing material made of leaves.
Access to electricity and communication facilities such as fixed and mobile phones can
significantly improve information on possible disasters and anticipatory precautionary
measures. Ghanaian households that receive international remittances tend to have elec-
tricity. Without controlling for endogeneity of the remittance-receiving decision, 45% of
households that do not receive remittances have electricity. 52% of households that receive
remittances from other African countries have electricity and 80% of households that
receive remittances from OECD countries have electricity. After controlling for endoge-
neity of remittance-receiving status, 80% of households that receive remittances from
OECD countries have electricity versus 69% of comparable households that do not receive
remittances. Of households that receive remittances from other African countries, 51%
have electricity versus 46% of comparable households that do not receive remittances.
Similarly, after controlling for endogeneity of remittance-receiving status, 28% of
Ghanaian households that receive remittances from OECD countries have a fixed telephone
versus 24% of comparable households that do not receive remittances. Of households that
receive remittances from other African countries, 30% have a fixed telephone versus 16%
of comparable households that do not receive remittances. In the case of mobile phones,
after controlling for endogeneity of remittance-receiving status, 69% of households that
receive remittances from OECD countries have a mobile telephone versus 55% of com-
parable households that do not receive remittances. Of households that receive remittances
from other African countries, 39% have a mobile telephone versus 32% of comparable
households that do not receive remittances.
As shown in Table 8a, regression estimates on the matched Ghanaian households fur-
ther reveal that receiving remittances from OECD countries have a statistically significant
and positive impact on the ownership of better houses and communication amenities.
Similarly Table 8b shows that remittances from OECD have a negative and significant
impact on having low-quality houses and communication amenities. Remittances from
Africa enable households to have amenities such as electricity and fixed and mobile phones
as evident from the statistically significant coefficients of these variables in Table 9a. A
smaller amount of remittances received by households from migrants in Africa partly
explains why these households may not be able to make long-term investments in housing
(see Table 9a, b).
We use a nationally representative household survey for Burkina Faso, the Core Wel-
fare Indicators Questionnaire Survey, conducted in 2003 to examine the resilience of
houses to future disasters. This survey provides information on the sources of migrant
remittances. Of the 7,339 households in the sample, 13.7% receive remittances from Cote
d’Ivoire, the largest intra-African destination, while 2.2% of households receive remit-
tances from France, which is the most important destination of migrants outside Africa (see
Table 10). We used propensity score matching methods to construct a comparable sample
of households that do not receive remittances, but are otherwise similar in observable
characteristics to remittance-receiving households.
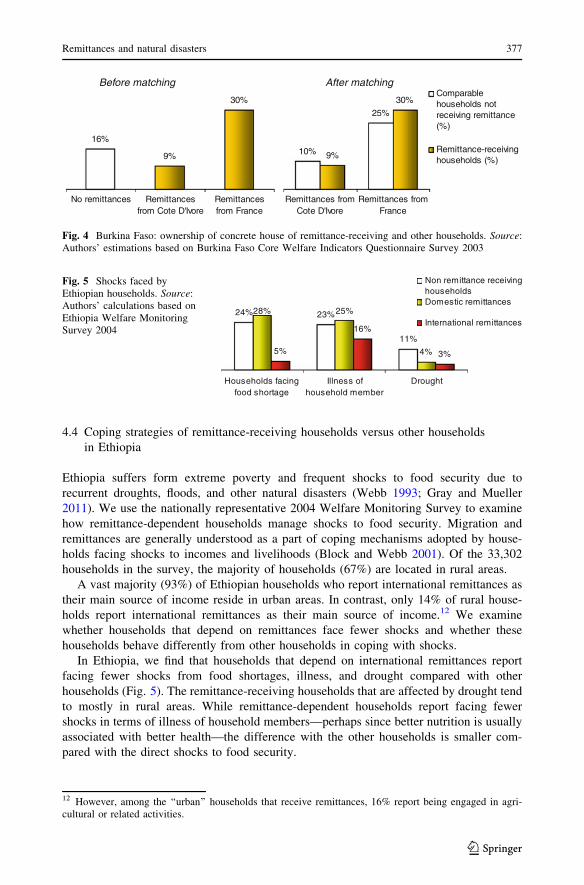
We find that after controlling for endogeneity, 30% of Burkinabe households receiving
remittances from France have concrete houses while 25% of comparable households that
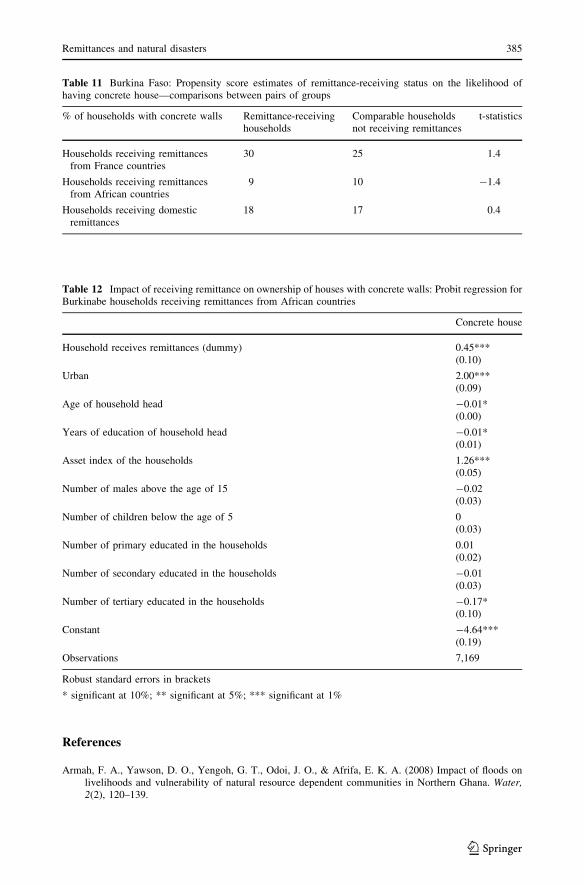
do not receiving remittances have concrete houses (see Fig. 4 and Tables 11 and 12).
Households receiving remittance from Cote D’Ivoire are significantly worse off than
households receiving remittances from France and are similar to Burkinabe households that
do not receive any remittances.
376 S. Mohapatra et al.
123
4.4 Coping strategies of remittance-receiving households versus other households
in Ethiopia
Ethiopia suffers form extreme poverty and frequent shocks to food security due to
recurrent droughts, floods, and other natural disasters (Webb 1993; Gray and Mueller
2011). We use the nationally representative 2004 Welfare Monitoring Survey to examine
how remittance-dependent households manage shocks to food security. Migration and
remittances are generally understood as a part of coping mechanisms adopted by house-
holds facing shocks to incomes and livelihoods (Block and Webb 2001). Of the 33,302
households in the survey, the majority of households (67%) are located in rural areas.
A vast majority (93%) of Ethiopian households who report international remittances as
their main source of income reside in urban areas. In contrast, only 14% of rural house-
holds report international remittances as their main source of income.12 We examine
whether households that depend on remittances face fewer shocks and whether these
households behave differently from other households in coping with shocks.
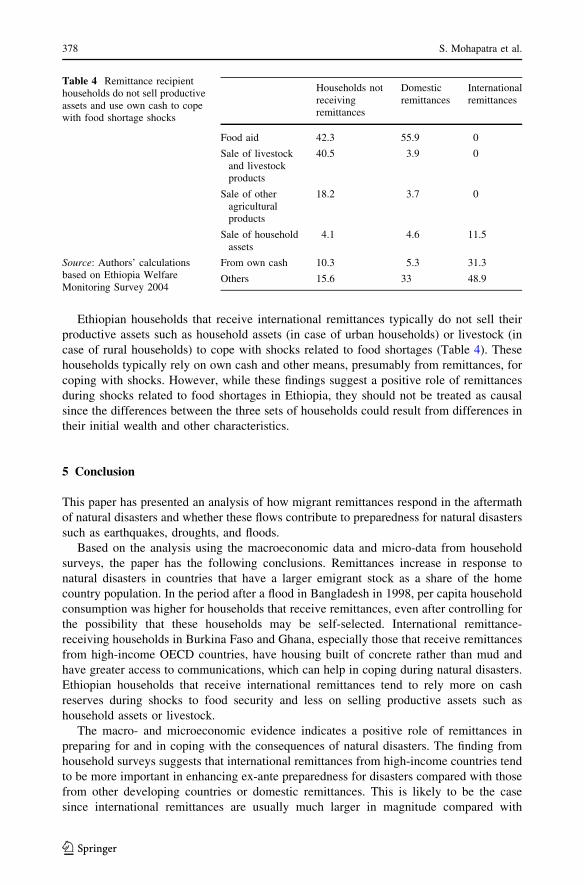
In Ethiopia, we find that households that depend on international remittances report
facing fewer shocks from food shortages, illness, and drought compared with other
households (Fig. 5). The remittance-receiving households that are affected by drought tend
to mostly in rural areas. While remittance-dependent households report facing fewer
shocks in terms of illness of household members—perhaps since better nutrition is usually
associated with better health—the difference with the other households is smaller com-
pared with the direct shocks to food security.
24% 23%
11%
28% 25%
4%5%
16%
3%
Households facingfood shortage
Illness ofhousehold member
Drought
Non remittance receivinghouseholds Domestic remittances
International remittances
Fig. 5 Shocks faced byEthiopian households. Source:Authors’ calculations based onEthiopia Welfare MonitoringSurvey 2004
Before matching After matching
16%
9%
30%
No remittances Remittancesfrom Cote D'Ivore
Remittancesfrom France
10%
25%
9%
30%
Remittances fromCote D'Ivore
Remittances fromFrance
Comparablehouseholds notreceiving remittance(%)
Remittance-receivinghouseholds (%)
Fig. 4 Burkina Faso: ownership of concrete house of remittance-receiving and other households. Source:Authors’ estimations based on Burkina Faso Core Welfare Indicators Questionnaire Survey 2003
12 However, among the ‘‘urban’’ households that receive remittances, 16% report being engaged in agri-cultural or related activities.
Remittances and natural disasters 377
123
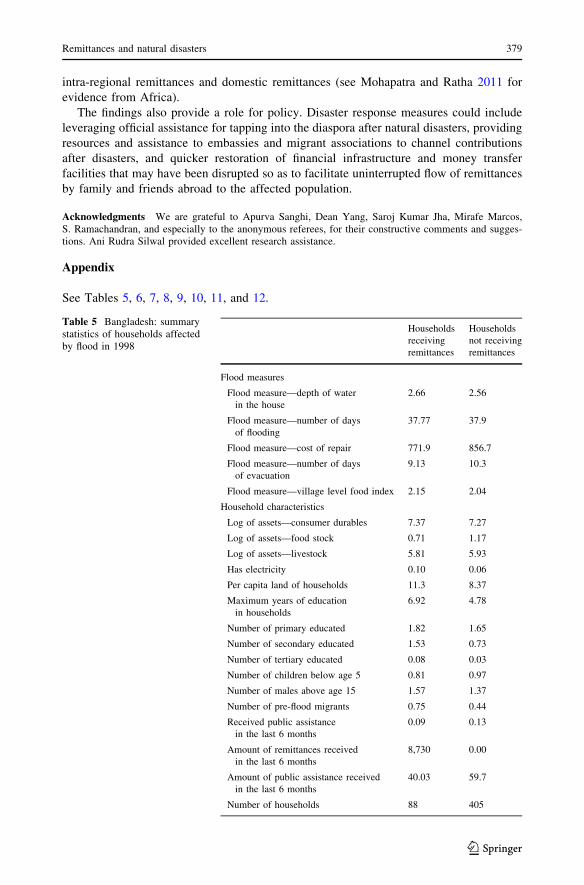
Ethiopian households that receive international remittances typically do not sell their
productive assets such as household assets (in case of urban households) or livestock (in
case of rural households) to cope with shocks related to food shortages (Table 4). These
households typically rely on own cash and other means, presumably from remittances, for
coping with shocks. However, while these findings suggest a positive role of remittances
during shocks related to food shortages in Ethiopia, they should not be treated as causal
since the differences between the three sets of households could result from differences in
their initial wealth and other characteristics.
5 Conclusion
This paper has presented an analysis of how migrant remittances respond in the aftermath
of natural disasters and whether these flows contribute to preparedness for natural disasters
such as earthquakes, droughts, and floods.
Based on the analysis using the macroeconomic data and micro-data from household
surveys, the paper has the following conclusions. Remittances increase in response to
natural disasters in countries that have a larger emigrant stock as a share of the home
country population. In the period after a flood in Bangladesh in 1998, per capita household
consumption was higher for households that receive remittances, even after controlling for
the possibility that these households may be self-selected. International remittance-
receiving households in Burkina Faso and Ghana, especially those that receive remittances
from high-income OECD countries, have housing built of concrete rather than mud and
have greater access to communications, which can help in coping during natural disasters.
Ethiopian households that receive international remittances tend to rely more on cash
reserves during shocks to food security and less on selling productive assets such as
household assets or livestock.
The macro- and microeconomic evidence indicates a positive role of remittances in
preparing for and in coping with the consequences of natural disasters. The finding from
household surveys suggests that international remittances from high-income countries tend
to be more important in enhancing ex-ante preparedness for disasters compared with those
from other developing countries or domestic remittances. This is likely to be the case
since international remittances are usually much larger in magnitude compared with
Table 4 Remittance recipienthouseholds do not sell productiveassets and use own cash to copewith food shortage shocks
Source: Authors’ calculationsbased on Ethiopia WelfareMonitoring Survey 2004
Households notreceivingremittances
Domesticremittances
Internationalremittances
Food aid 42.3 55.9 0
Sale of livestockand livestockproducts
40.5 3.9 0
Sale of otheragriculturalproducts
18.2 3.7 0
Sale of householdassets
4.1 4.6 11.5
From own cash 10.3 5.3 31.3
Others 15.6 33 48.9
378 S. Mohapatra et al.
123
intra-regional remittances and domestic remittances (see Mohapatra and Ratha 2011 for
evidence from Africa).
The findings also provide a role for policy. Disaster response measures could include
leveraging official assistance for tapping into the diaspora after natural disasters, providing
resources and assistance to embassies and migrant associations to channel contributions
after disasters, and quicker restoration of financial infrastructure and money transfer
facilities that may have been disrupted so as to facilitate uninterrupted flow of remittances
by family and friends abroad to the affected population.
Acknowledgments We are grateful to Apurva Sanghi, Dean Yang, Saroj Kumar Jha, Mirafe Marcos,S. Ramachandran, and especially to the anonymous referees, for their constructive comments and sugges-tions. Ani Rudra Silwal provided excellent research assistance.
Appendix
See Tables 5, 6, 7, 8, 9, 10, 11, and 12.
Table 5 Bangladesh: summarystatistics of households affectedby flood in 1998
Households
receiving
remittances
Households
not receiving
remittances
Flood measures
Flood measure—depth of water
in the house
2.66 2.56
Flood measure—number of days
of flooding
37.77 37.9
Flood measure—cost of repair 771.9 856.7
Flood measure—number of days
of evacuation
9.13 10.3
Flood measure—village level food index 2.15 2.04
Household characteristics
Log of assets—consumer durables 7.37 7.27
Log of assets—food stock 0.71 1.17
Log of assets—livestock 5.81 5.93
Has electricity 0.10 0.06
Per capita land of households 11.3 8.37
Maximum years of education
in households
6.92 4.78
Number of primary educated 1.82 1.65
Number of secondary educated 1.53 0.73
Number of tertiary educated 0.08 0.03
Number of children below age 5 0.81 0.97
Number of males above age 15 1.57 1.37
Number of pre-flood migrants 0.75 0.44
Received public assistance
in the last 6 months
0.09 0.13
Amount of remittances received
in the last 6 months
8,730 0.00
Amount of public assistance received
in the last 6 months
40.03 59.7
Number of households 88 405
Remittances and natural disasters 379
123
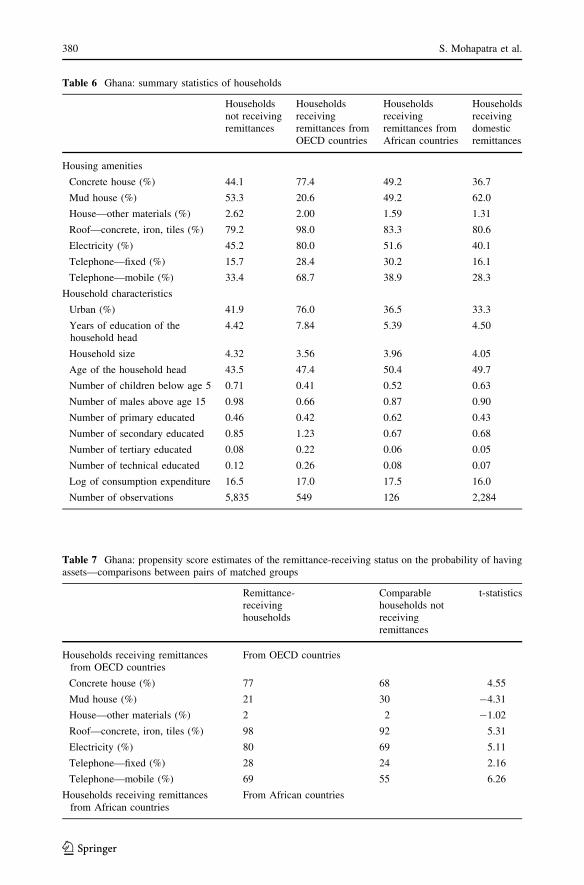
Table 6 Ghana: summary statistics of households
Householdsnot receivingremittances
Householdsreceivingremittances fromOECD countries
Householdsreceivingremittances fromAfrican countries
Householdsreceivingdomesticremittances
Housing amenities
Concrete house (%) 44.1 77.4 49.2 36.7
Mud house (%) 53.3 20.6 49.2 62.0
House—other materials (%) 2.62 2.00 1.59 1.31
Roof—concrete, iron, tiles (%) 79.2 98.0 83.3 80.6
Electricity (%) 45.2 80.0 51.6 40.1
Telephone—fixed (%) 15.7 28.4 30.2 16.1
Telephone—mobile (%) 33.4 68.7 38.9 28.3
Household characteristics
Urban (%) 41.9 76.0 36.5 33.3
Years of education of thehousehold head
4.42 7.84 5.39 4.50
Household size 4.32 3.56 3.96 4.05
Age of the household head 43.5 47.4 50.4 49.7
Number of children below age 5 0.71 0.41 0.52 0.63
Number of males above age 15 0.98 0.66 0.87 0.90
Number of primary educated 0.46 0.42 0.62 0.43
Number of secondary educated 0.85 1.23 0.67 0.68
Number of tertiary educated 0.08 0.22 0.06 0.05
Number of technical educated 0.12 0.26 0.08 0.07
Log of consumption expenditure 16.5 17.0 17.5 16.0
Number of observations 5,835 549 126 2,284
Table 7 Ghana: propensity score estimates of the remittance-receiving status on the probability of havingassets—comparisons between pairs of matched groups
Remittance-receivinghouseholds
Comparablehouseholds notreceivingremittances
t-statistics
Households receiving remittancesfrom OECD countries
From OECD countries
Concrete house (%) 77 68 4.55
Mud house (%) 21 30 -4.31
House—other materials (%) 2 2 -1.02
Roof—concrete, iron, tiles (%) 98 92 5.31
Electricity (%) 80 69 5.11
Telephone—fixed (%) 28 24 2.16
Telephone—mobile (%) 69 55 6.26
Households receiving remittancesfrom African countries
From African countries
380 S. Mohapatra et al.
123
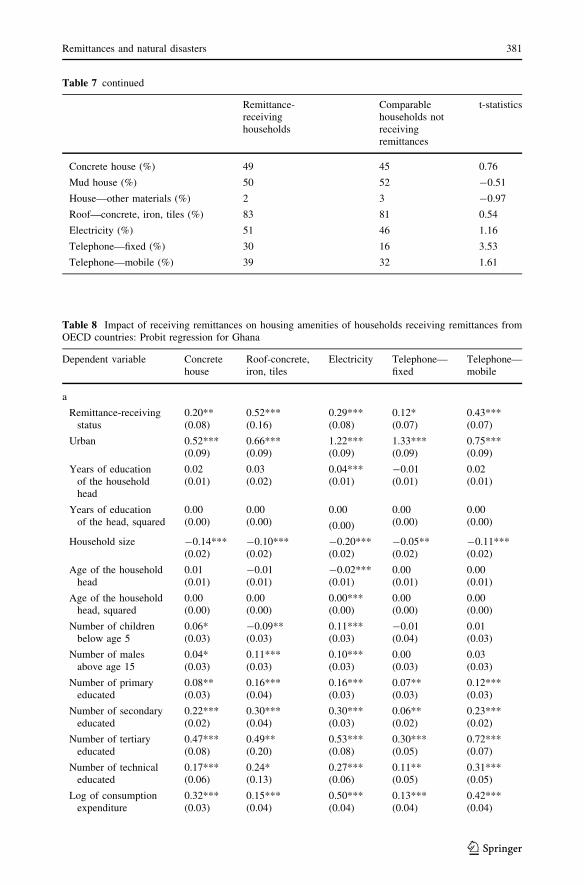
Table 8 Impact of receiving remittances on housing amenities of households receiving remittances fromOECD countries: Probit regression for Ghana
Dependent variable Concretehouse
Roof-concrete,iron, tiles
Electricity Telephone—fixed
Telephone—mobile
a
Remittance-receivingstatus
0.20**(0.08)
0.52***(0.16)
0.29***(0.08)
0.12*(0.07)
0.43***(0.07)
Urban 0.52***(0.09)
0.66***(0.09)
1.22***(0.09)
1.33***(0.09)
0.75***(0.09)
Years of educationof the householdhead
0.02(0.01)
0.03(0.02)
0.04***(0.01)
-0.01(0.01)
0.02(0.01)
Years of educationof the head, squared
0.00(0.00)
0.00(0.00)
0.00 0.00(0.00)
0.00(0.00)(0.00)
Household size -0.14***(0.02)
-0.10***(0.02)
-0.20***(0.02)
-0.05**(0.02)
-0.11***(0.02)
Age of the householdhead
0.01(0.01)
-0.01(0.01)
-0.02***(0.01)
0.00(0.01)
0.00(0.01)
Age of the householdhead, squared
0.00(0.00)
0.00(0.00)
0.00***(0.00)
0.00(0.00)
0.00(0.00)
Number of childrenbelow age 5
0.06*(0.03)
-0.09**(0.03)
0.11***(0.03)
-0.01(0.04)
0.01(0.03)
Number of malesabove age 15
0.04*(0.03)
0.11***(0.03)
0.10***(0.03)
0.00(0.03)
0.03(0.03)
Number of primaryeducated
0.08**(0.03)
0.16***(0.04)
0.16***(0.03)
0.07**(0.03)
0.12***(0.03)
Number of secondaryeducated
0.22***(0.02)
0.30***(0.04)
0.30***(0.03)
0.06**(0.02)
0.23***(0.02)
Number of tertiaryeducated
0.47***(0.08)
0.49**(0.20)
0.53***(0.08)
0.30***(0.05)
0.72***(0.07)
Number of technicaleducated
0.17***(0.06)
0.24*(0.13)
0.27***(0.06)
0.11**(0.05)
0.31***(0.05)
Log of consumptionexpenditure
0.32***(0.03)
0.15***(0.04)
0.50***(0.04)
0.13***(0.04)
0.42***(0.04)
Table 7 continued
Remittance-receivinghouseholds
Comparablehouseholds notreceivingremittances
t-statistics
Concrete house (%) 49 45 0.76
Mud house (%) 50 52 -0.51
House—other materials (%) 2 3 -0.97
Roof—concrete, iron, tiles (%) 83 81 0.54
Electricity (%) 51 46 1.16
Telephone—fixed (%) 30 16 3.53
Telephone—mobile (%) 39 32 1.61
Remittances and natural disasters 381
123
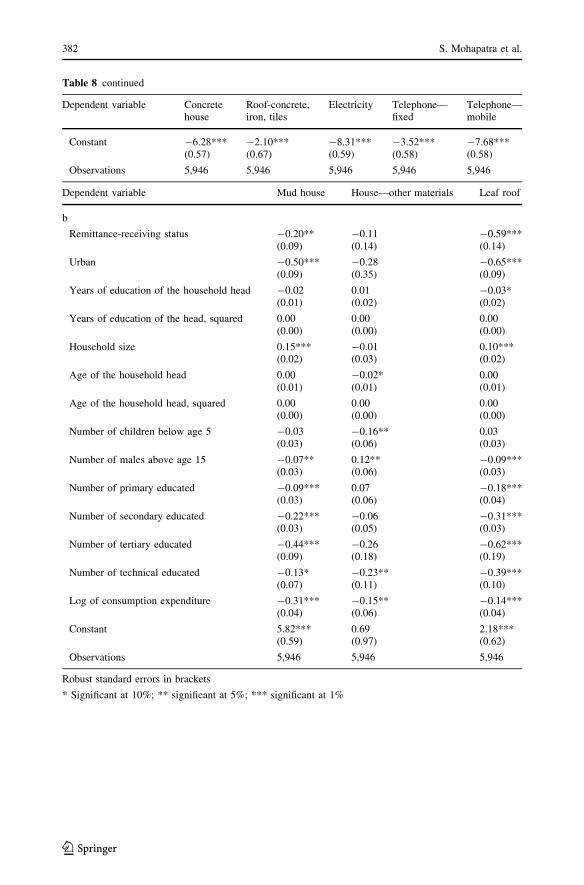
Table 8 continued
Dependent variable Concretehouse
Roof-concrete,iron, tiles
Electricity Telephone—fixed
Telephone—mobile
Constant -6.28***(0.57)
-2.10***(0.67)
-8.31***(0.59)
-3.52***(0.58)
-7.68***(0.58)
Observations 5,946 5,946 5,946 5,946 5,946
Dependent variable Mud house House—other materials Leaf roof
b
Remittance-receiving status -0.20**(0.09)
-0.11(0.14)
-0.59***(0.14)
Urban -0.50***(0.09)
-0.28(0.35)
-0.65***(0.09)
Years of education of the household head -0.02(0.01)
0.01(0.02)
-0.03*(0.02)
Years of education of the head, squared 0.00(0.00)
0.00(0.00)
0.00(0.00)
Household size 0.15***(0.02)
-0.01(0.03)
0.10***(0.02)
Age of the household head 0.00(0.01)
-0.02*(0.01)
0.00(0.01)
Age of the household head, squared 0.00(0.00)
0.00(0.00)
0.00(0.00)
Number of children below age 5 -0.03(0.03)
-0.16**(0.06)
0.03(0.03)
Number of males above age 15 -0.07**(0.03)
0.12**(0.06)
-0.09***(0.03)
Number of primary educated -0.09***(0.03)
0.07(0.06)
-0.18***(0.04)
Number of secondary educated -0.22***(0.03)
-0.06(0.05)
-0.31***(0.03)
Number of tertiary educated -0.44***(0.09)
-0.26(0.18)
-0.62***(0.19)
Number of technical educated -0.13*(0.07)
-0.23**(0.11)
-0.39***(0.10)
Log of consumption expenditure -0.31***(0.04)
-0.15**(0.06)
-0.14***(0.04)
Constant 5.82***(0.59)
0.69(0.97)
2.18***(0.62)
Observations 5,946 5,946 5,946
Robust standard errors in brackets
* Significant at 10%; ** significant at 5%; *** significant at 1%
382 S. Mohapatra et al.
123
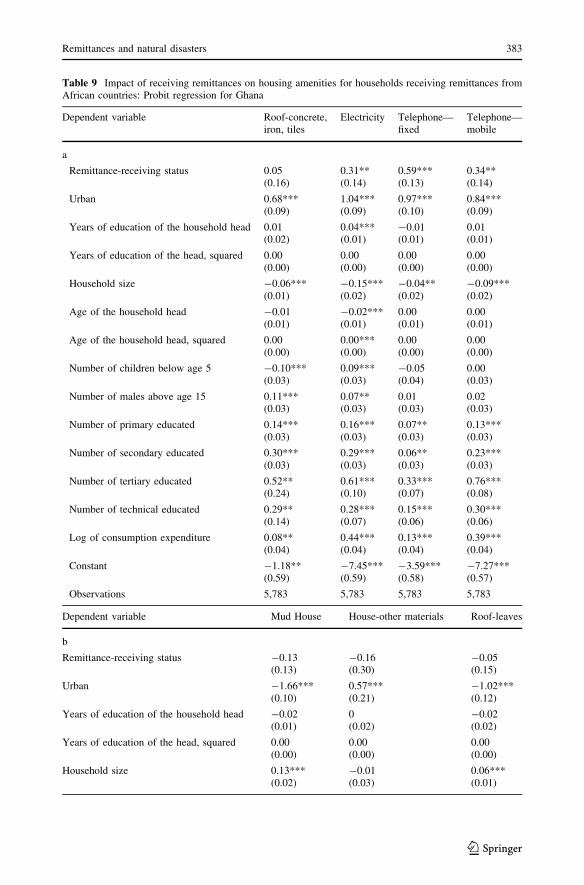
Table 9 Impact of receiving remittances on housing amenities for households receiving remittances fromAfrican countries: Probit regression for Ghana
Dependent variable Roof-concrete,iron, tiles
Electricity Telephone—fixed
Telephone—mobile
a
Remittance-receiving status 0.05(0.16)
0.31**(0.14)
0.59***(0.13)
0.34**(0.14)
Urban 0.68***(0.09)
1.04***(0.09)
0.97***(0.10)
0.84***(0.09)
Years of education of the household head 0.01(0.02)
0.04***(0.01)
-0.01(0.01)
0.01(0.01)
Years of education of the head, squared 0.00(0.00)
0.00(0.00)
0.00(0.00)
0.00(0.00)
Household size -0.06***(0.01)
-0.15***(0.02)
-0.04**(0.02)
-0.09***(0.02)
Age of the household head -0.01(0.01)
-0.02***(0.01)
0.00(0.01)
0.00(0.01)
Age of the household head, squared 0.00(0.00)
0.00***(0.00)
0.00(0.00)
0.00(0.00)
Number of children below age 5 -0.10***(0.03)
0.09***(0.03)
-0.05(0.04)
0.00(0.03)
Number of males above age 15 0.11***(0.03)
0.07**(0.03)
0.01(0.03)
0.02(0.03)
Number of primary educated 0.14***(0.03)
0.16***(0.03)
0.07**(0.03)
0.13***(0.03)
Number of secondary educated 0.30***(0.03)
0.29***(0.03)
0.06**(0.03)
0.23***(0.03)
Number of tertiary educated 0.52**(0.24)
0.61***(0.10)
0.33***(0.07)
0.76***(0.08)
Number of technical educated 0.29**(0.14)
0.28***(0.07)
0.15***(0.06)
0.30***(0.06)
Log of consumption expenditure 0.08**(0.04)
0.44***(0.04)
0.13***(0.04)
0.39***(0.04)
Constant -1.18**(0.59)
-7.45***(0.59)
-3.59***(0.58)
-7.27***(0.57)
Observations 5,783 5,783 5,783 5,783
Dependent variable Mud House House-other materials Roof-leaves
b
Remittance-receiving status -0.13(0.13)
-0.16(0.30)
-0.05(0.15)
Urban -1.66***(0.10)
0.57***(0.21)
-1.02***(0.12)
Years of education of the household head -0.02(0.01)
0(0.02)
-0.02(0.02)
Years of education of the head, squared 0.00(0.00)
0.00(0.00)
0.00(0.00)
Household size 0.13***(0.02)
-0.01(0.03)
0.06***(0.01)
Remittances and natural disasters 383
123
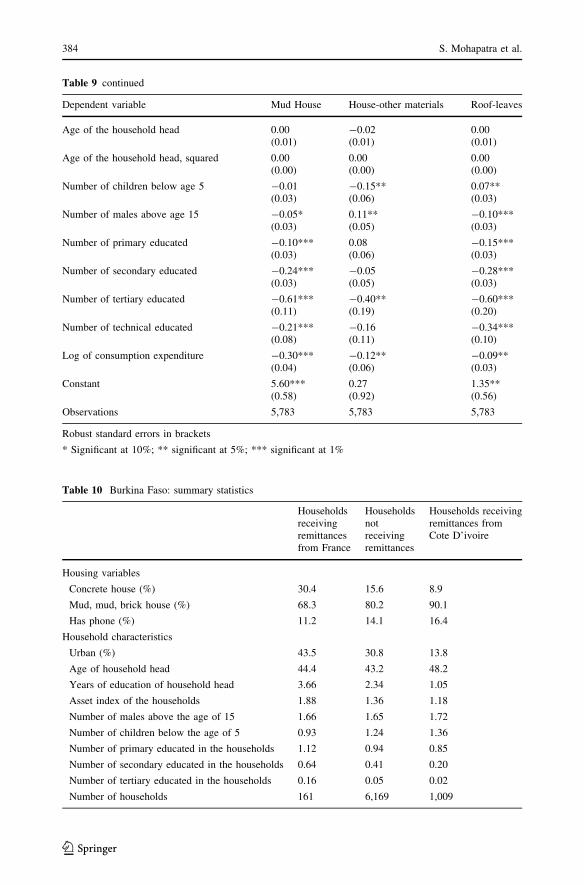
Table 10 Burkina Faso: summary statistics
Householdsreceivingremittancesfrom France
Householdsnotreceivingremittances
Households receivingremittances fromCote D’ivoire
Housing variables
Concrete house (%) 30.4 15.6 8.9
Mud, mud, brick house (%) 68.3 80.2 90.1
Has phone (%) 11.2 14.1 16.4
Household characteristics
Urban (%) 43.5 30.8 13.8
Age of household head 44.4 43.2 48.2
Years of education of household head 3.66 2.34 1.05
Asset index of the households 1.88 1.36 1.18
Number of males above the age of 15 1.66 1.65 1.72
Number of children below the age of 5 0.93 1.24 1.36
Number of primary educated in the households 1.12 0.94 0.85
Number of secondary educated in the households 0.64 0.41 0.20
Number of tertiary educated in the households 0.16 0.05 0.02
Number of households 161 6,169 1,009
Table 9 continued
Dependent variable Mud House House-other materials Roof-leaves
Age of the household head 0.00(0.01)
-0.02(0.01)
0.00(0.01)
Age of the household head, squared 0.00(0.00)
0.00(0.00)
0.00(0.00)
Number of children below age 5 -0.01(0.03)
-0.15**(0.06)
0.07**(0.03)
Number of males above age 15 -0.05*(0.03)
0.11**(0.05)
-0.10***(0.03)
Number of primary educated -0.10***(0.03)
0.08(0.06)
-0.15***(0.03)
Number of secondary educated -0.24***(0.03)
-0.05(0.05)
-0.28***(0.03)
Number of tertiary educated -0.61***(0.11)
-0.40**(0.19)
-0.60***(0.20)
Number of technical educated -0.21***(0.08)
-0.16(0.11)
-0.34***(0.10)
Log of consumption expenditure -0.30***(0.04)
-0.12**(0.06)
-0.09**(0.03)
Constant 5.60***(0.58)
0.27(0.92)
1.35**(0.56)
Observations 5,783 5,783 5,783
Robust standard errors in brackets
* Significant at 10%; ** significant at 5%; *** significant at 1%
384 S. Mohapatra et al.
123
References
Armah, F. A., Yawson, D. O., Yengoh, G. T., Odoi, J. O., & Afrifa, E. K. A. (2008) Impact of floods onlivelihoods and vulnerability of natural resource dependent communities in Northern Ghana. Water,2(2), 120–139.
Table 11 Burkina Faso: Propensity score estimates of remittance-receiving status on the likelihood ofhaving concrete house—comparisons between pairs of groups
% of households with concrete walls Remittance-receivinghouseholds
Comparable householdsnot receiving remittances
t-statistics
Households receiving remittancesfrom France countries
30 25 1.4
Households receiving remittancesfrom African countries
9 10 -1.4
Households receiving domesticremittances
18 17 0.4
Table 12 Impact of receiving remittance on ownership of houses with concrete walls: Probit regression forBurkinabe households receiving remittances from African countries
Concrete house
Household receives remittances (dummy) 0.45***(0.10)
Urban 2.00***(0.09)
Age of household head -0.01*(0.00)
Years of education of household head -0.01*(0.01)
Asset index of the households 1.26***(0.05)
Number of males above the age of 15 -0.02(0.03)
Number of children below the age of 5 0(0.03)
Number of primary educated in the households 0.01(0.02)
Number of secondary educated in the households -0.01(0.03)
Number of tertiary educated in the households -0.17*(0.10)
Constant -4.64***(0.19)
Observations 7,169
Robust standard errors in brackets
* significant at 10%; ** significant at 5%; *** significant at 1%
Remittances and natural disasters 385
123
Attzs, M. (2008). Natural disasters and remittances: Exploring the linkages between poverty, gender, anddisaster vulnerability in Caribbean SIDS. UNU-WIDER Research Paper No. 2008/61, United NationsUniversity, Helsinki Finland. Available at http://www.preventionweb.net/files/4169_rp200861.pdf.
Block, S., & Webb, P. (2001). The dynamics of livelihood diversification in post famine Ethiopia. FoodPolicy, 26.
Brown, O., & Crawford, A. (2008). Climate change: A new threat to stability in West Africa? Evidence fromGhana and Burkina Faso. African Security Review, 17(3) (Institute for Security Studies).
Clarke, G., & Wallsten, S. (2004). Do remittances protect household in developing countries againstshocks? Evidence from a natural disaster in Jamaica. Washington, DC: Mimeo, World Bank.
del Ninno, C., Dorosh, P. A., Smith, L. C., & Roy, D. K. (2011). The 1998 floods in Bangladesh: Disasterimpacts, household coping strategies, and response. Washington, DC: Research Report 122, Inter-national Food Policy Research Institute.
EM-DAT. (1993). The OFDA/CRED International Disaster Database, Universite Catholique de Louvain,Brussels, Belgium. Available at www.em-dat.net.
Gray, C., & Mueller, V. (2011). Drought and Population Mobility in Rural Ethiopia. World Development(forthcoming).
Halliday, T. (2006). Migration, risk, and liquidity constraints in El Salvador. Economic Development andCultural Change, 54(4), 893–925.
Harvey, P., & Savage, K. (2007). Remittances during crises: Implications for humanitarian response. HPGbriefing paper 26, Overseas Development Institute, London, UK. Available at http://www.odi.org.uk/hpg/papers/hpgbrief26.pdf.
Heckman, J., Ichimura, H., & Todd, P. (1997). Matching as an econometric evaluation estimator: Evidencefrom evaluating a job training program. Review of Economic Studies, 64(4).
Heckman, J., Ichimura, H., & Todd, P. (1998). Characterizing selection bias using experimental data.Econometrica, 66, September.
Mishra, P. (2005). Macroeconomic impact of remittances in the Caribbean. Washington, DC: InternationalMonetary Fund.
Mohapatra, S., & Ratha, D. (Ed.). (2011). Remittance markets in Africa. Washington DC: World BankPublications.
Noy, I. (2008). The macroeconomic consequences of disasters. Journal of Development Economics, 88(2),221–231.
Quartey, P., & Blankson, T. (2004). Do migrant remittances minimize the impact of macro-volatility on thepoor in Ghana. Report prepared for the Global Development Network, December, InternationalMonetary Fund.
Ratha, D., & Shaw, W. (2007). South-South migration and remittances. World Bank working paper no. 102.Washington DC: World Bank.
Rosenbaum, P., & Rubin, D. (1983). The central role of the propensity score in observational studies forcausal effects. Biometrika, 70, 41–55.
Rosenzweig, M., & Wolpin, K. (1993). Credit market constraints, consumption smoothing, and the accu-mulation of durable production assets in low-income countries: Investment in bullocks in India.Journal of Political Economy, 101(2).
Skidmore, M., & Toya, H. (2002). Do natural disasters promote long-run growth? Economic Inquiry, 40(4),664–687.
Suleri, A. Q., & Savage, K. (2006). Remittances in crisis: A case study of Pakistan. London, UK: OverseasDevelopment Institute. Available at http://www.odi.org.uk/hpg/papers/BGPaper_RemittancesPakistan.pdf.
Tol, R., & Leek, F. (1999). Economic analysis of natural disasters. In: T. Downing, A. Olsthoorn, & R. Tol(eds.), Climate change and risk (pp. 308–327). London: Routledge.
Udry, C. (1994). Risk and insurance in a rural credit market: An empirical investigation in northern Nigeria.Review of Economic Studies, 61(3), 495–526.
Webb, P. (1993). Coping with drought and food insecurity in Ethiopia. Disasters, 17(1), 33–47.Weiss-Fagan, P. (2006). Remittances in crisis: A haiti case study. London, UK; Overseas Development
Institute. Available at http://www.odi.org.uk/hpg/papers/BG_Haiti_remittances.pdf.Weiss-Fagen, P., & Bump, M. N. (2005). Remittances in conflict and crises: How remittances sustain
livelihoods in war, crises, and transitions to peace. New York, NY: The Security-Development NexusProgram Policy Paper, International Peace Academy.
Wisner, B. (2003). Sustainable suffering? Reflections on development and disaster vulnerability in the post-johannesburg world. Regional Development Dialogue, 24(1):135–148.
World Bank. (2006). Global economic prospects: Economic implications of remittances and migration.Washington, DC: World Bank.
386 S. Mohapatra et al.
123

Wu, T. (2006). The role of remittances in crisis. An Aceh research study. London, UK; Overseas Devel-opment Institute. Available at http://www.odi.org.uk/hpg/papers/BG_Remittances_Aceh.pdf.
Yang, D. (2007). Coping with disaster: The impact of hurricanes on international financial flows, 1970–2002. Ann-Harbor: Mimeo, Department of Economics, University of Michigan.
Yang, D., & Choi, H. (2007). Are remittances insurance? Evidence from rainfall shocks in the Philippines.World Bank Economic Review, 21(2), 219–248.
Remittances and natural disasters 387
123