reliability of stiffened structural panels: two examples€¦ · reliability of stiffened...
TRANSCRIPT
NASATechnical Memorandum 107687
.,,/V - 5_,7'
_O ATCOM
Technical Report 92-B-015
Reliability of Stiffened Structural Panels:
Two Examples
:_T I; t- =,: i :.T _)CTd_.,_L pA • Lb: T,';"
Y;,_t:'t_ % (h': ' ) _" r_
_'_+._-I_+_:!, "
W. Jefferson Stroud, D. Dale Davis, Jr., Lise D. Maring,
Thiagaraja Krishnamurthy, and Isaac Elishakoff
December 1992
N/ ANational Aeronautics and
Space Administration
Langley Research CenterHampton, Virginia 23665-5225
https://ntrs.nasa.gov/search.jsp?R=19930005294 2020-04-12T14:48:01+00:00Z

RELIABILITY OF STIFFENED STRUCTURAL PANELS:
TWO EXAMPLES
W. Jefferson StroudNASA Langley Research Center
Hampton, Virginia
D. Dale Davis, Jr.Aerostructures Directorate
U.S. ArmyNASA Langley Research Center
Hampton, Virginia
Lise D. MaringLockheed Engineering and
Sciences CompanyHampton, Virginia
Thiagaraja KrishnamurthyAnalytical Services andMaterials, Incorporated
Hampton, Virginia
Isaac Elishakoff
Florida Atlantic UniversityBoca Raton, Florida
ABSTRACT
The reliability of two graphite-epoxy stiffened panels that contain uncertainties isexamined. For one panel, the effect of an overall bow-type initial imperfection is studied.The size of the bow is assumed to be a random variable. The failure mode is buckling.The benefits of quality control are explored by using truncated distributions. For the otherpanel, the effect of uncertainties in a strain-based failure criterion is studied. Theallowable strains are assumed to be random variables. A geometrically nonlinear analysisis used to calculate a detailed strain distribution near an elliptical access hole in a wing
panel that was tested to failure. Calculated strains are used to predict failure. Results arecompared with the experimental failure load of the panel.
INTRODUCTION
Although a probabilistic analysis provides more information than the correspondingdeterministic analysis, a probabilistic analysis also requires more information, namely, thejoint probability densities of the random variables. In addition, a probabilistic analysisrequires substantially more computations than the corresponding deterministic analysis.For the most part, prior to the mid-1970's, the additional information provided by aprobabilistic structural analysis was not thought to be worth the additional effort andexpense. Now, however, there is substantial evidence that that position is changing.That evidence includes the increasing number of reliability-oriented specialty conferences,short courses, sponsored research, research papers, and technical books. There is alsoan increased interest in reliability-based design codes, such as codes for naval andcommercial ships and offshore structures.
One reason for the increased acceptance of probabilistic structural analysis is that thesolutions to many classes of deterministic problems are becoming routine; such solutionsare required in order to solve the corresponding probabilistic problem. Another reason isthat probabilistic computations are becoming easier and less expensive because usefulsoftware is being developed (e.g., SwRI, 1991 and Olesen, 1992), and adequatecomputers are readily available to most users. A third reason is that probabilisticmethods, and the information these methods provide, are becoming more widelyunderstood (e.g., Liu and Belytschko, 1989) and better appreciated (e.g., Chamis, 1986).
In aneffort to increasethat understandingandappreciation,thispaperexaminestheperformanceof two compositestiffenedpanelsfrom thepointof view of reliability,whichis the probability that the panelscancarry a specifiedload without failure. Failuremechanismsconsideredarebucklingandexcessivestrain. This paperfocuseson resultsanddoesnot addressmethods.
Two typesof exampleapplicationsareexamined. They aredistinguishedby therandomvariablesinvolvedin calculatingthe reliability. In one example,the randomvariableis thesizeof anoverallbow-typeinitial imperfectionin a panelwhichis designedassumingthatit is fiat. Thebow is in theshapeof a half-sinewavealongthe lengthofthepanel. Thereliability is calculatedfor severalprobabilitydensitydistributionsof thesizeof the initial imperfection. In the otherexample,the randomvariablesare theallowablestrains. In this case,a geometricallynonlinearanalysisis usedto calculatedetailedstrainsnearanelliptical accessholein a wing panelthat wastestedto failure.Using thesecalculatedstrains, the reliability of the panel is calculatedfor severalprobabilitydensitydislributionsof theallowablestrainsandfor severaldefinitionsof panelfailure,all of whicharebasedonexcessivestrainat theply level. Resultsarecomparedwith theexperimentalfailureloadof thepanel.
EFFECT OF BOW-TYPE INITIAL IMPERFECTION ON RELIABILITY
In this first example application, a square graphite-epoxy blade-stiffened panel isdesigned to carry combined in-plane compression and shear. The panel is designed as ifit had no initial imperfection - that is, as if it were perfectly fiat. Optimization techniquesare used to produce a minimum-weight design. The panel produced by the optimization isanalyzed assuming that it has an overall bow-type imperfection. Then the size of the bowis taken to be a random variable with several specified statistical distributions. The
reliability of the panel is calculated at various loads for each assumed distribution of thesize of the bow. The objectives are: (1) to establish the effect of a bow-type imperfectionon the reliability of stiffened panels and (2) to assess the sensitivity of the reliability toaccurate specification of bow statistics. For this first problem, all structural analysis andstructural design are carried out with the computer program PASCO (Anderson et al.,1980). Probabilistic calculations are carried out with simple, special-purpose computerprograms. This first example, which is part of a broader analytical study, is described indetail by Stroud et al. (1992).
Panel _onfiguration
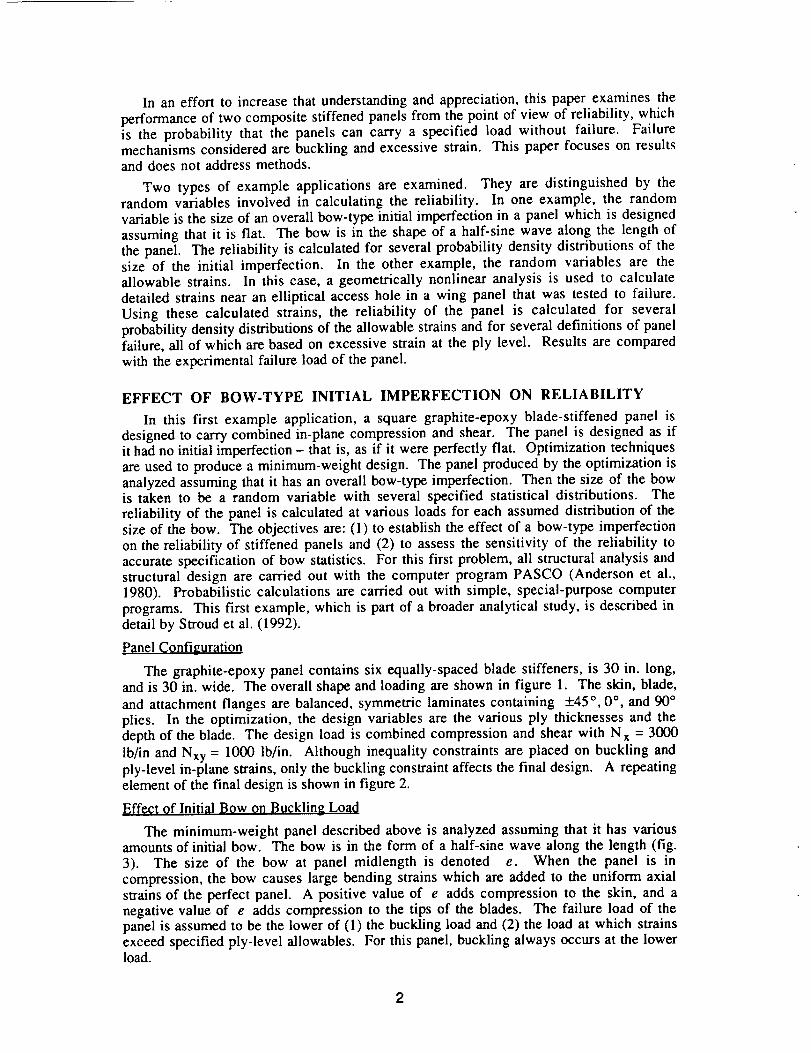
The graphite-epoxy panel contains six equally-spaced blade stiffeners, is 30 in. long,and is 30 in. wide. The overall shape and loading are shown in figure 1. The skin, blade,
and attachment flanges are balanced, symmetric laminates containing +45 °, 0 °, and 90 °plies. In the optimization, the design variables are the various ply thicknesses and thedepth of the blade. The design load is combined compression and shear with N x = 3000
lb/in and Nxy = 1000 lb/in. Although inequality constraints are placed on buckling andply-level in-plane strains, only the buckling constraint affects the final design. A repeatingelement of the final design is shown in figure 2.
Effect of Initial Bow on Buckling Load
The minimum-weight panel described above is analyzed assuming that it has variousamounts of initial bow. The bow is in the form of a half-sine wave along the length (fig.3). The size of the bow at panel midlength is denoted e. When the panel is in
compression, the bow causes large bending strains which are added to the uniform axialstrains of the perfect panel. A positive value of e adds compression to the skin, and anegative value of e adds compression to the tips of the blades. The failure load of thepanel is assumed to be the lower of (1) the buckling load and (2) the load at which strainsexceed specified ply-level allowables. For this panel, buckling always occurs at the lowerload.
2
Figure 1.
Figure 2.
Overall shape and loading for square, blade-stiffened panel designedherein. The panel is designed as if it were flat.
5.0 =11"5 "_L"_-- 1"0 -_" k
|I
0.105 ---_
!
l'0.150
1.45
_[Final design for square, blade-stiffened panel. One repeating elementis shown. Dimensions are in inches.
X
L _ _'__"_"'_,," Nx
NxI.-- I "-__jPositive bow shown
Figure 3. Stiffened panel with initial bow and applied loading.
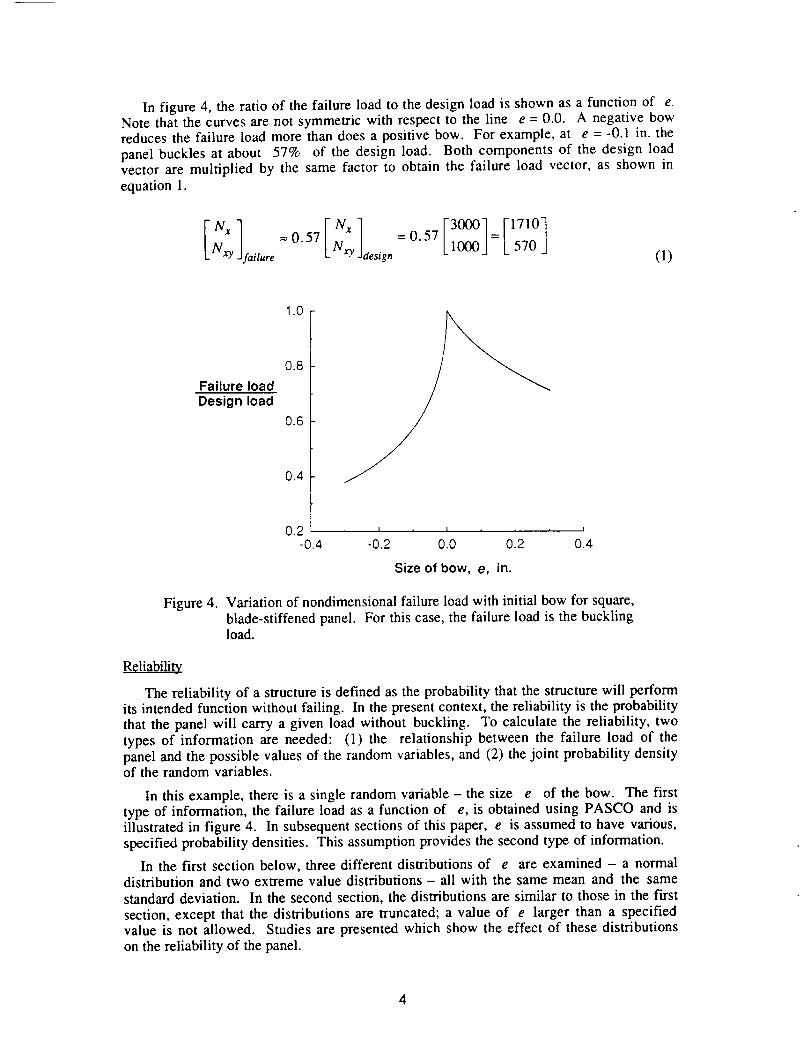
In figure4, theratioof thefailureloadto thedesignloadis shownasa functionof e.Note that the curves are not symmetric with respect to the line e = 0.0. A negative bowreduces the failure load more than does a positive bow. For example, at e = -0.1 in. the
panel buckles at about 57% of the design load. Both components of the design loadvector are multiplied by the same factor to obtain the failure load vector, as shown in
equation 1.
= 0.57 Nxy 1000 L 570 JNxy failure design (1)
Failure loadDesign load
1.0
0.8
0.6
0.4
0.2 J I I I I
-0.4 -0.2 0.0 0.2 0.4
Size of bow, e, in.
Figure 4. Variation of nondimensionai failure load with initial bow for square,blade-stiffened panel. For this case, the failure load is the bucklingload.
Reliability
The reliability of a structure is defined as the probability that the structure will performits intended function without failing. In the present context, the reliability is the probabilitythat the panel will carry a given load without buckling. To calculate the reliability, two
types of information are needed: (1) the relationship between the failure load of thepanel and the possible values of the random variables, and (2) the joint probability densityof the random variables.
In this example, there is a single random variable - the size e of the bow. The firsttype of information, the failure load as a function of e, is obtained using PASCO and isillustrated in figure 4. In subsequent sections of this paper, e is assumed to have various,
specified probability densities. This assumption provides the second type of information.
In the first section below, three different distributions of e are examined - a normaldistribution and two extreme value distributions - all with the same mean and the samestandard deviation. In the second section, the distributions are similar to those in the first
section, except that the distributions are truncated; a value of e larger than a specifiedvalue is not allowed. Studies are presented which show the effect of these distributions
on the reliability of the panel.
4
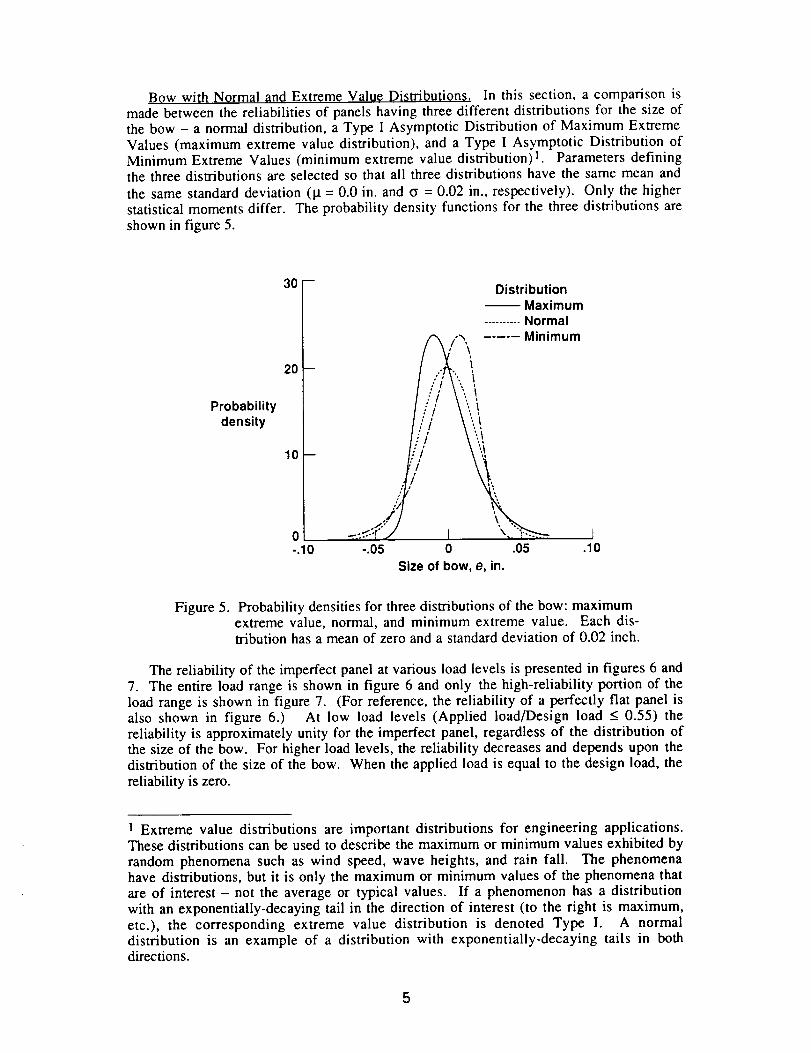
Bow with Normal and Extreme Val0e Distributions. In this section, a comparison ismade between the reliabilities of panels having three different distributions for the size ofthe bow - a normal distribution, a Type I Asymptotic Distribution of Maximum ExtremeValues (maximum extreme value distribution), and a Type I Asymptotic Distribution ofMinimum Extreme Values (minimum extreme value distribution) 1. Parameters definingthe three distributions are selected so that all three distributions have the same mean and
the same standard deviation (_t = 0.0 in. and t_ = 0.02 in., respectively). Only the higherstatistical moments differ. The probability density functions for the three distributions are
shown in figure 5.
Probabilitydensity
30--
20P
10--
0-.10
DistributionMaximum
.......... Normal
" /''_i"'i"'ii_..... Minimum
/':" \'\_ I-..-._:-rJ [-.05 0 .05 .10
Size of bow, e, in.
Figure 5. Probability densities for three distributions of the bow: maximumextreme value, normal, and minimum extreme value. Each dis-tribution has a mean of zero and a standard deviation of 0.02 inch.
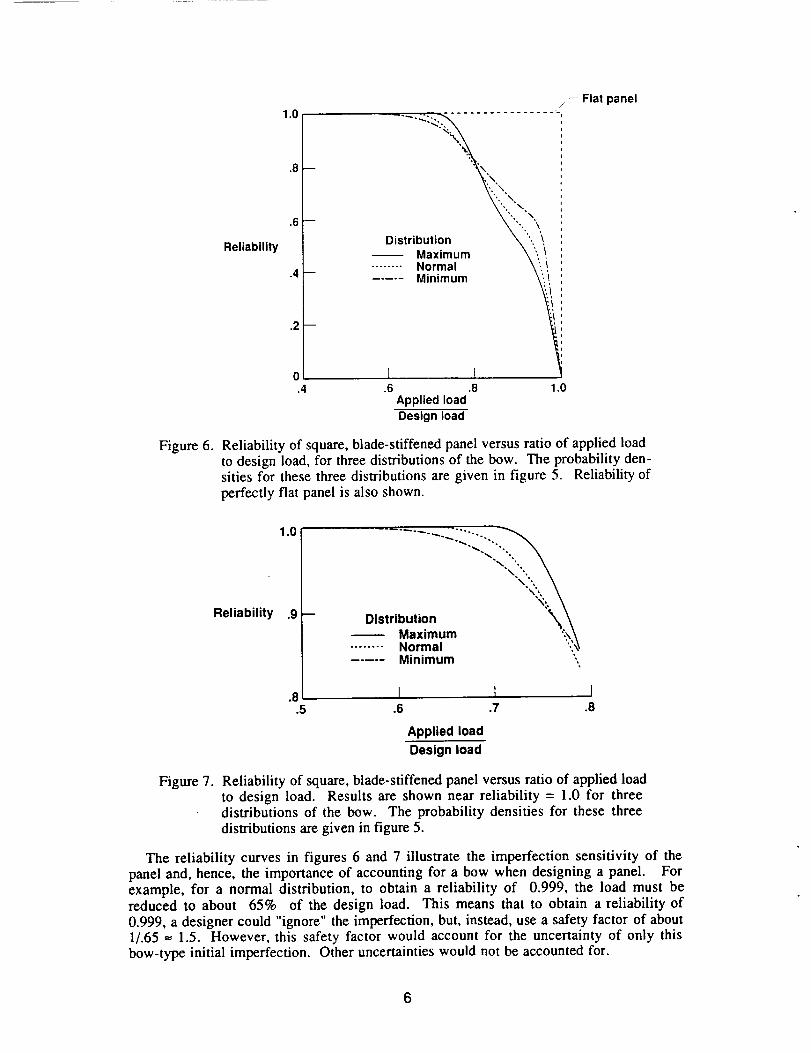
The reliability of the imperfect panel at various load levels is presented in figures 6 and7. The entire load range is shown in figure 6 and only the high-reliability portion of the
load range is shown in figure 7. (For reference, the reliability of a perfectly flat panel isalso shown in figure 6.) At low load levels (Applied load/Design load < 0.55) thereliability is approximately unity for the imperfect panel, regardless of the distribution ofthe size of the bow. For higher load levels, the reliability decreases and depends upon thedistribution of the size of the bow. When the applied load is equal to the design load, the
reliability is zero.
1 Extreme value distributions are important distributions for engineering applications.These distributions can be used to describe the maximum or minimum values exhibited by
random phenomena such as wind speed, wave heights, and rain fall. The phenomenahave distributions, but it is only the maximum or minimum values of the phenomena thatare of interest - not the average or typical values. If a phenomenon has a distributionwith an exponentially-decaying tail in the direction of interest (to the right is maximum,etc.), the corresponding extreme value distribution is denoted Type I. A normaldistribution is an example of a distribution with exponentially-decaying tails in bothdirections.
5
Reliability
1.0
.8 -
• 6 --
.4_
• 2 --
Distributi ',, '\
-- Maximum \",, !........ Normal \",,
Minimum _.
1 I.4 .6 .8
Applied load
Design load
-- Flat panel/
ii
I'
1.0
Figure 6. Reliability of square, blade-stiffened panel versus ratio of applied loadto design load, for three distributions of the bow. The probability den-
sities for these three distributions are given in figure 5. Reliability of
perfectly flat panel is also shown.
1.0
Reliability .9Distribution \'_"_'_
Maximum........ Normal "_
Minimum
.e I I I.5 .6 .7 .8
Applied load
Design load
Figure 7. Reliability of square, blade-stiffened panel versus ratio of applied load
to design load. Results are shown near reliability -- 1.0 for threedistributions of the bow. The probability densities for these three
distributions are given in figure 5.
The reliability curves in figures 6 and 7 illustrate the imperfection sensitivity of the
panel and, hence, the importance of accounting for a bow when designing a panel. For
example, for a normal distribution, to obtain a reliability of 0.999, the load must bereduced to about 65% of the design load. This means that to obtain a reliability of
0.999, a designer could "ignore" the imperfection, but, instead, use a safety factor of about
1/.65 = 1.5. However, this safety factor would account for the uncertainty of only this
bow-type initial imperfection. Other uncertainties would not be accounted for.
6
In addition, there are substantial differences between the curves, even though themeans and standard deviations of the imperfections are equal. These differencesdemonstrate that the reliability of an imperfect panel depends upon the details of theprobability density of the imperfection. The results can be interpreted in the following twoways.
First, suppose that there are three panel fabrication processes and that imperfectiondata collected on these three processes have the same mean and the same standarddeviation. The results indicate that, with this limited data, it would be inaccurate toassume that the three fabrication processes are equivalent. Since the distributions coulddiffer, one of the processes could produce panels that are considerably more (or less)reliable than the other two processes.
Second, suppose that there is only one fabrication process and that only the mean andthe standard deviation are known. To make calculations defining the performance of thepanels, it is necessary to assume the distribution of the imperfection - which means thatthe higher statistical moments are assumed. The results indicate that the calculations willbe very sensitive to the assumptions. Moreover, the common assumption of a normaldistribution can be either conservative or unconservative.
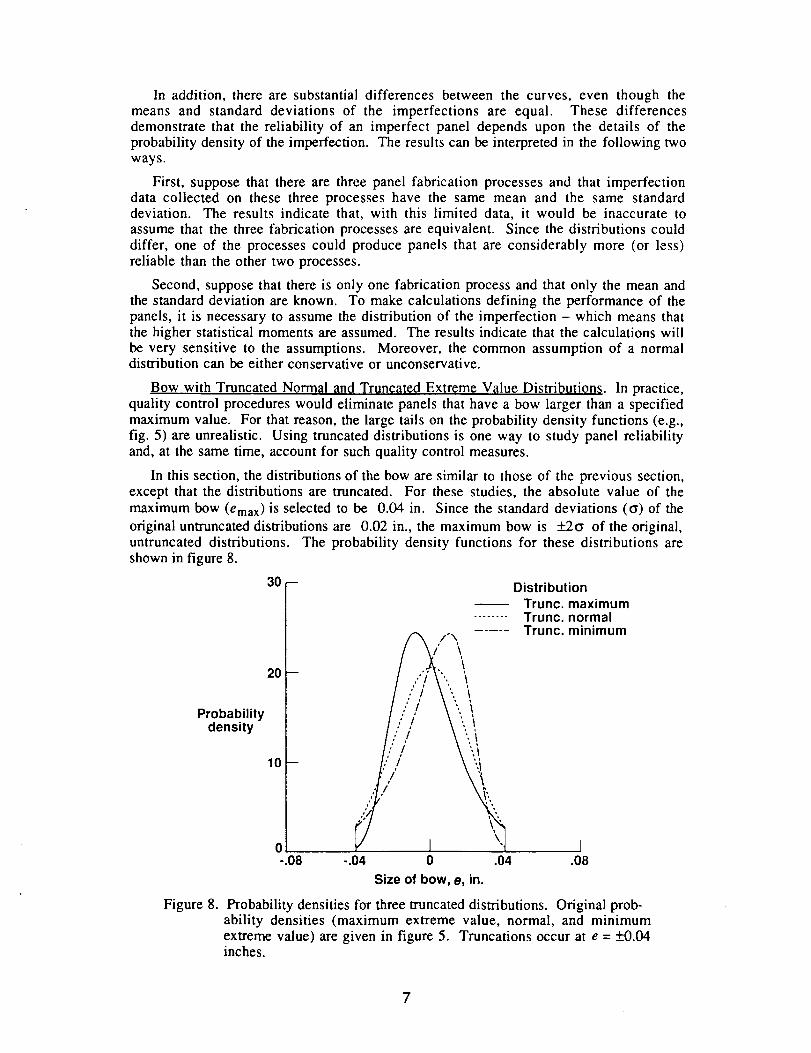
Bow with Truncated Normal and Truncated Extreme Value Distributions. In practice,quality control procedures would eliminate panels that have a bow larger than a specifiedmaximum value. For that reason, the large tails on the probability density functions (e.g.,fig. 5) are unrealistic. Using truncated distributions is one way to study panel reliabilityand, at the same time, account for such quality control measures.
In this section, the distributions of the bow are similar to those of the previous section,except that the distributions are truncated. For these studies, the absolute value of the
maximum bow (emax) is selected to be 0.04 in. Since the standard deviations (_) of the
original untruncated distributions are 0.02 in., the maximum bow is +_2_ of the original,untruncated distributions. The probability density functions for these distributions areshown in figure 8.
30--
20--
Probabilitydensity
10--
0-.08
DistributionTrunc. maximum
........ Trunc. normalTrunc. minimum
\
-i
I-.04 0 .04 .08
Size of bow, e, in.
Figure 8. Probability densities for three truncated distributions. Original prob-ability densities (maximum extreme value, normal, and minimumextreme value) are given in figure 5. Truncations occur at e = +0.04inches.
7
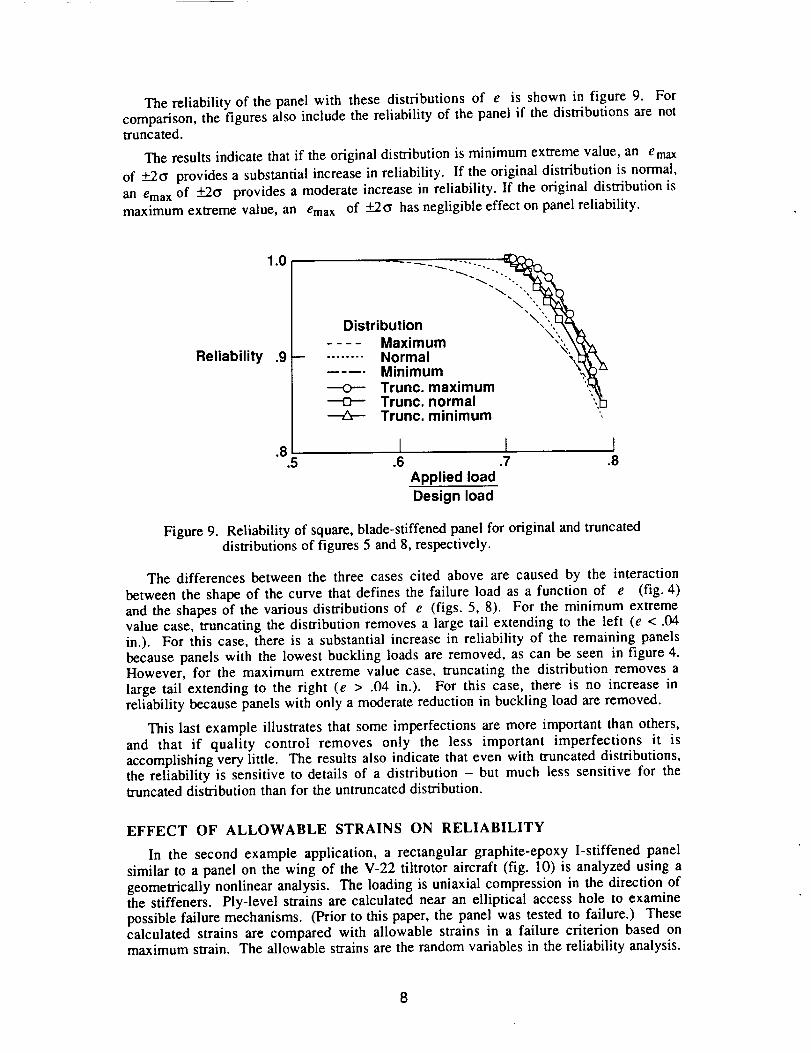
The reliability of the panel with these distributions of e is shown in figure 9. Forcomparison, the figures also include the reliability of the panel if the distributions are nottruncated.
The results indicate that if the original distribution is minimum extreme value, an emax
of +_2G provides a substantial increase in reliability. If the original distribution is normal,
an ema x of +__2t_ provides a moderate increase in reliability, If the original distribution is
maximum extreme value, an ema x of +_2_ has negligible effect on panel reliability.
Reliability
Distribution "\_i",_.
.... Maximum _;,':,_,.......... Normal '_
.... Minimum \,_Trunc. maximum ',,_Trunc. normal ',,_Trunc. minimum
( I.8 I.5 .6 .7 .8
Applied load
Design load
Figure 9. Reliability of square, blade-stiffened panel for original and truncateddistributions of figures 5 and 8, respectively.
The differences between the three cases cited above are caused by the interaction
between the shape of the curve that defines the failure load as a function of e (fig. 4)and the shapes of the various distributions of e (figs. 5, 8). For the minimum extremevalue case, truncating the distribution removes a large tail extending to the left (e < .04in.). For this case, there is a substantial increase in reliability of the remaining panelsbecause panels with the lowest buckling loads are removed, as can be seen in figure 4.However, for the maximum extreme value case, truncating the distribution removes alarge tail extending to the right (e > .04 in.). For this case, there is no increase inreliability because panels with only a moderate reduction in buckling load are removed.
This last example illustrates that some imperfections are more important than others,and that if quality control removes only the less important imperfections it isaccomplishing very little. The results also indicate that even with truncated distributions,the reliability is sensitive to details of a distribution - but much less sensitive for thetruncated distribution than for the untruncated distribution.
EFFECT OF ALLOWABLE STRAINS ON RELIABILITY
In the second example application, a rectangular graphite-epoxy I-stiffened panelsimilar to a panel on the wing of the V-22 tiltrotor aircraft (fig. 10) is analyzed using ageometrically nonlinear analysis. The loading is uniaxial compression in the direction ofthe stiffeners. Ply-level strains are calculated near an elliptical access hole to examinepossible failure mechanisms. (Prior to this paper, the panel was tested to failure.) Thesecalculated strains are compared with allowable strains in a failure criterion based onmaximum strain. The allowable strains are the random variables in the reliability analysis.
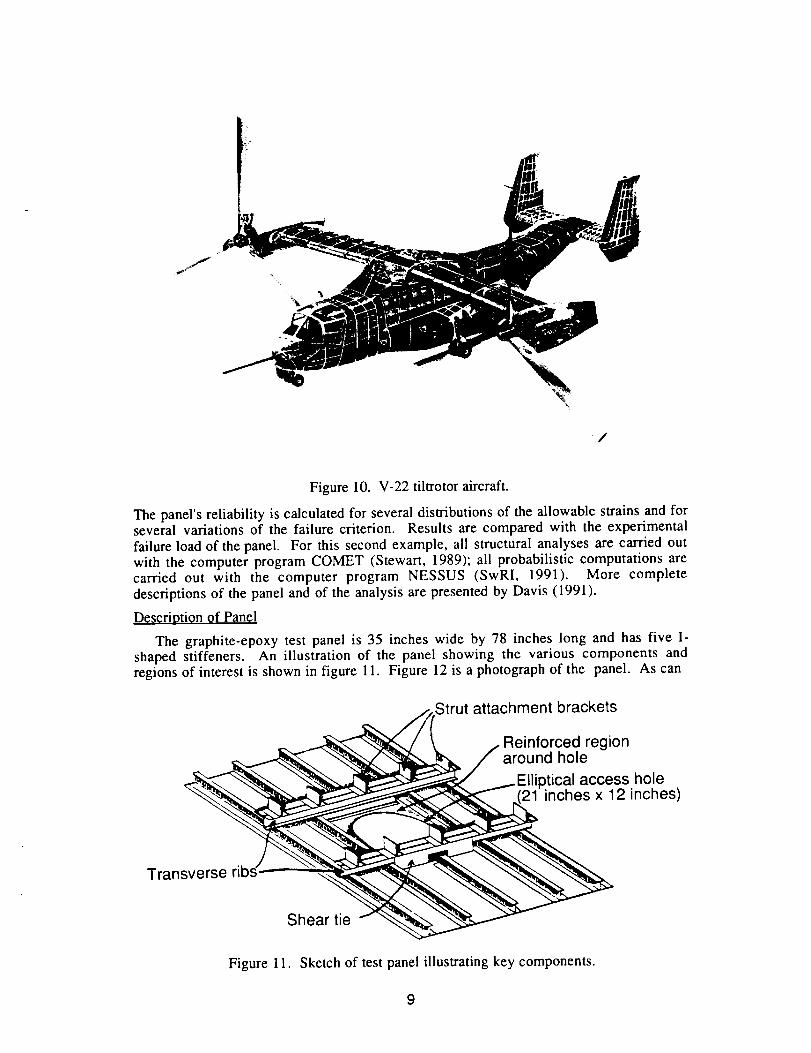
Figure10. V-22tiltrotoraircraft.
Thepanel'sreliability iscalculatedfor severaldistributionsof theallowablestrainsandforseveralvariationsof the failurecriterion. Resultsarecomparedwith the experimentalfailureloadof thepanel. For this secondexample,all structuralanalysesarecarriedoutwith thecomputerprogramCOMET(Stewart,1989);all probabilisticcomputationsarecarried out with the computerprogram NESSUS(SwRI, 1991). More completedescriptionsof thepanelandof theanalysisarepresentedby Davis(1991).
Do_¢ription of Panel
The graphite-epoxy test panel is 35 inches wide by 78 inches long and has five I-shaped stiffeners. An illustration of the panel showing the various components andregions of interest is shown in figure 11. Figure 12 is a photograph of the panel. As can
s_Strut attachment brackets
Reinforced regionaround hole
_._--__ __ Elliptical access hole
x 12 inches)
Transverse ribs_.
Figure 11. Sketch of test panel illustrating key components.
9
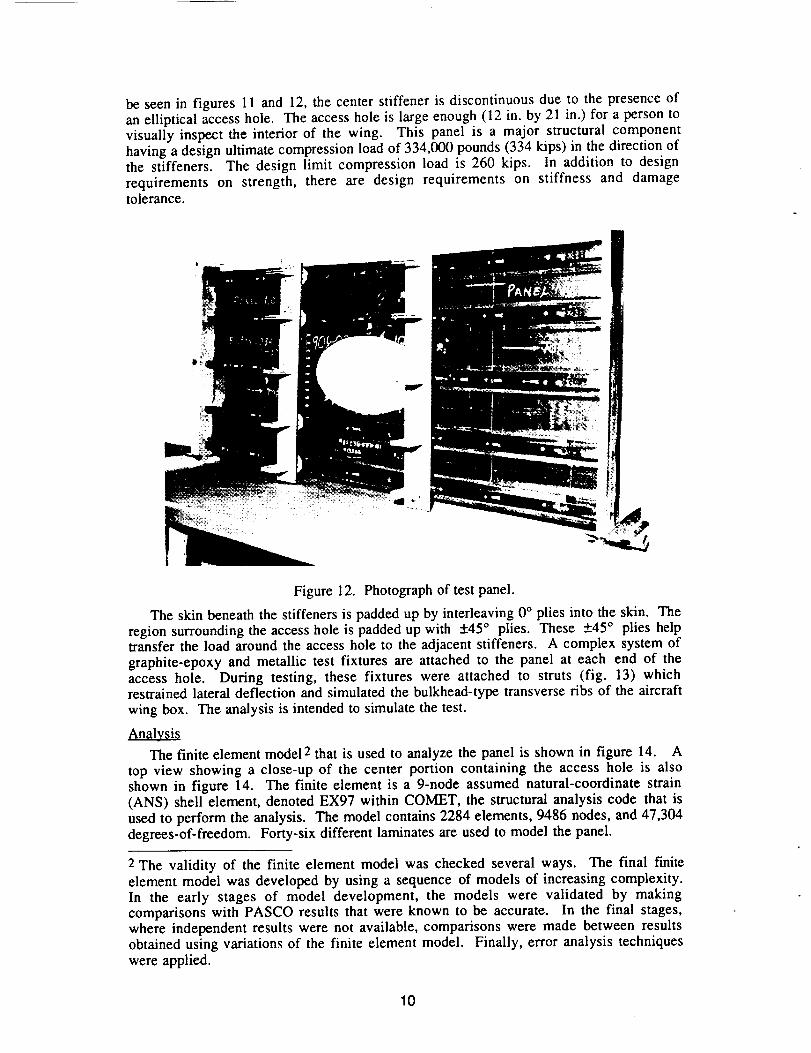
beseenin figures11and12,thecenterstiffeneris discontinuousdueto thepresenceofanellipticalaccesshole. Theaccessholeis largeenough(12 in. by21 in.) for apersontovisuallyinspectthe interiorof the wing. This panel is a major structuralcomponenthavingadesignultimatecompressionloadof 334,000pounds(334kips)in thedirectionofthe stiffeners. Thedesignlimit compressionloadis 260 kips. In additionto designrequirementson strength, there are design requirementson stiffness and damagetolerance.
Figure12. Photographof testpanel.Theskinbeneaththestiffenersis paddedupby interleaving0° pliesinto theskin. The
regionsurroundingtheaccessholeis paddedupwith +45 ° plies. These +45 ° plies helptransfer the load around the access hole to the adjacent stiffeners. A complex system of
graphite-epoxy and metallic test fixtures are attached to the panel at each end of theaccess hole. During testing, these fixtures were attached to struts (fig. 13) whichrestrained lateral deflection and simulated the bulkhead-type transverse ribs of the aircraft
wing box. The analysis is intended to simulate the test.
Analysis
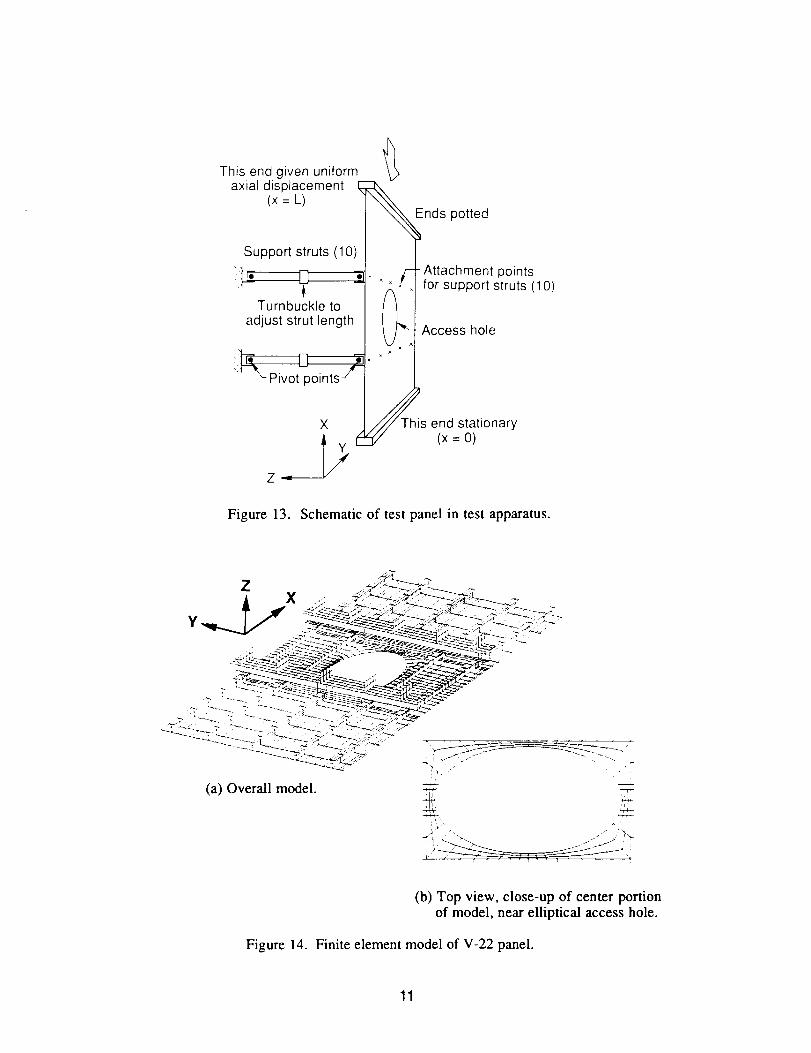
The finite element model 2 that is used to analyze the panel is shown in figure 14. A
top view showing a close-up of the center portion containing the access hole is alsoshown in figure 14. The finite element is a 9-node assumed natural-coordinate strain(ANS) shell element, denoted EX97 within COMET, the structural analysis code that is
used to perform the analysis. The model contains 2284 elements, 9486 nodes, and 47,304degrees-of-freedom. Forty-six different laminates are used to model the panel.
2 The validity of the finite element model was checked several ways. The final t-miteelement model was developed by using a sequence of models of increasing complexity.In the early stages of model development, the models were validated by makingcomparisons with PASCO results that were known to be accurate. In the final stages,where independent results were not available, comparisons were made between resultsobtained using variations of the finite element model. Finally, error analysis techniques
were applied.
10
This end given uniform
axial displacement(x= L) __
nds potted
Support struts (10)
Turnbuckle toadjust strut length
:l_Pivotpoints/
X
Attachment pointsfor support struts (10)
Access hole
is end stationary(x = o)
Figure 13. Schematic of test panel in test apparatus.
(b) Top view, close-up of center portionof model, near elliptical access hole.
Figure 14. Finite element model of V-22 panel.
11
To simulatetheeffectsof thesupportstrutsshownin figure 13,boundaryconditionsarespecifiedfor thenodesat themidpointof thetopof thestrut attachmentbrackets. Atthesetenpoints,displacementsin thez-directionandrotationsabouttheX-axisaresettozero,whilerotationsaboutthe Y-axisarefree (to simulatethe pinsthatattachthe strutsto the attachmentbrackets). Sinceboth endsof the panelarepotted, thus virtuallyclampingtheends,all degrees-of-freedomat x = 0 and x = L aresetto zero,exceptfor the displacementin the x-directionat x = L, whereuniform end-shorteningisspecifiedto simulatethecrossheadmotionof thetestingmachine.
A geometricallynonlinearanalysisis usedto calculatein-planestraincomponentsineachcompositeply of eachfiniteelement.Thesestrainsareusedin thefailureanalysis.
Analysis Results & Test Correlation
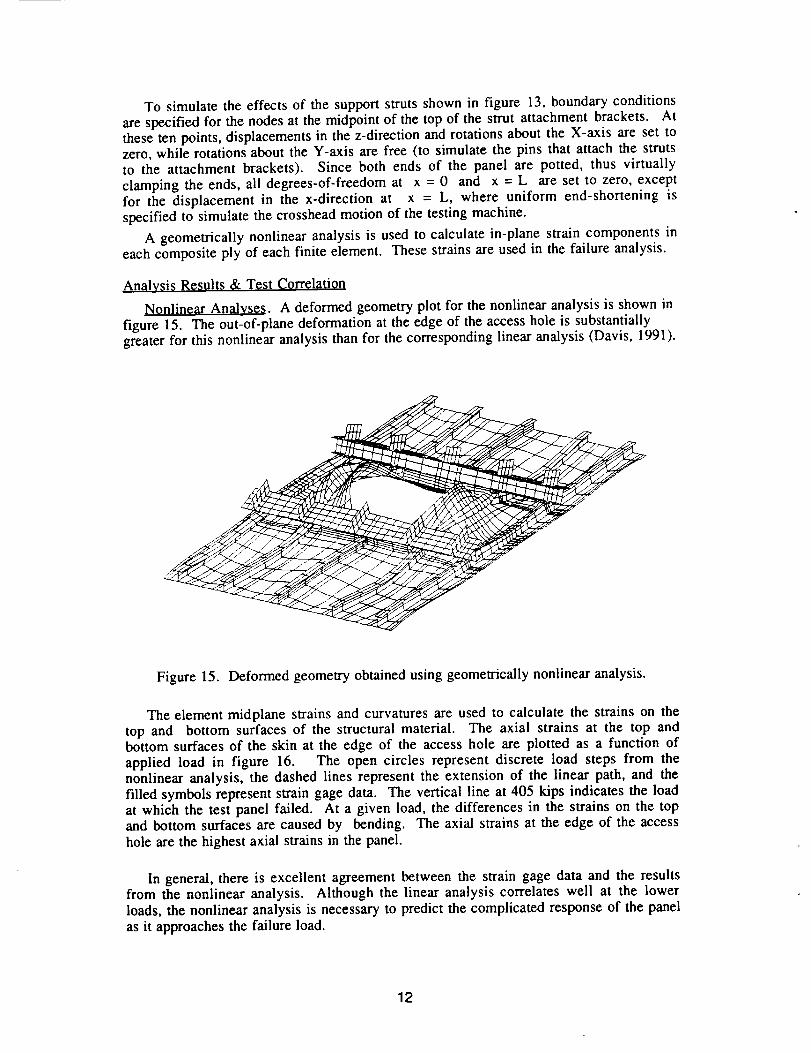
Nonlinear Analyses. A deformed geometry plot for the nonlinear analysis is shown in
figure 15. The out-of-plane deformation at the edge of the access hole is substantiallygreater for this nonlinear analysis than for the corresponding linear analysis (Davis, 1991).
Figure 15. Deformed geometry obtained using geometrically nonlinear analysis.
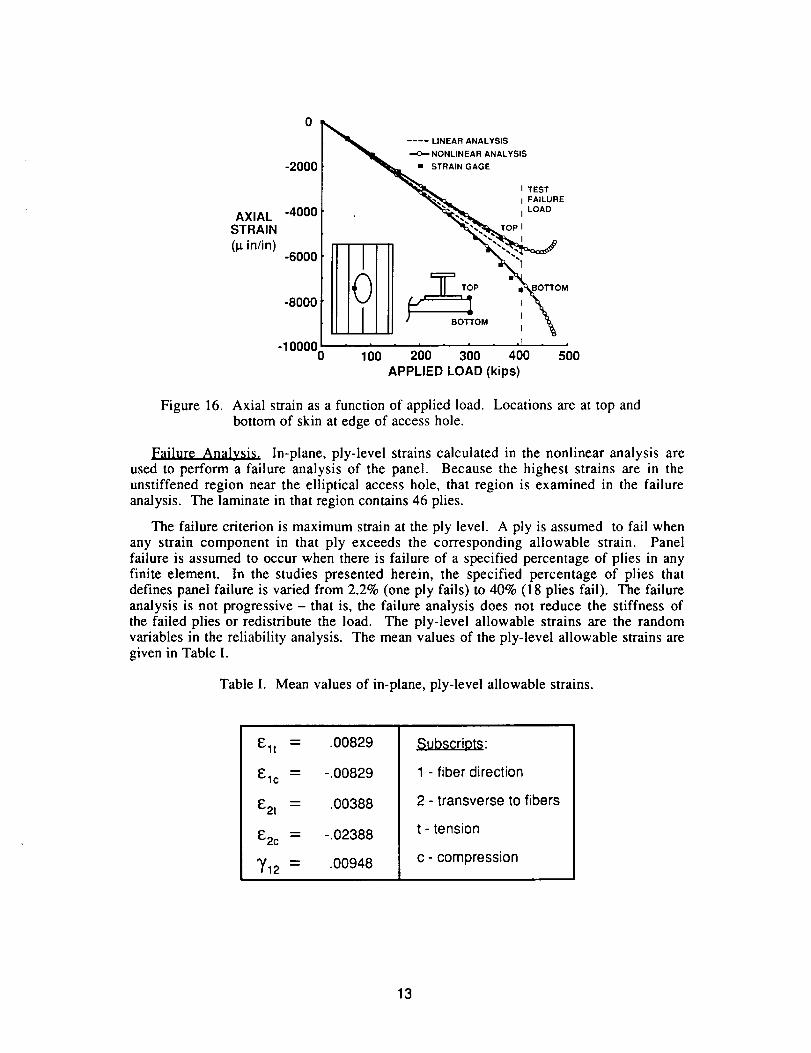
The element midplane strains and curvatures are used to calculate the strains on thetop and bottom surfaces of the structural material. The axial strains at the top andbottom surfaces of the skin at the edge of the access hole are plotted as a function of
applied load in figure 16. The open circles represent discrete load steps from thenonlinear analysis, the dashed lines represent the extension of the linear path, and the
filled symbols represent strain gage data. The vertical line at 405 kips indicates the loadat which the test panel failed. At a given load, the differences in the strains on the topand bottom surfaces are caused by bending. The axial strains at the edge of the accesshole are the highest axial strains in the panel.
In general, there is excellent agreement between the strain gage data and the resultsfrom the nonlinear analysis. Although the linear analysis correlates well at the lowerloads, the nonlinear analysis is necessary to predict the complicated response of the panel
as it approaches the failure load.
12
AXIALSTRAIN(p in/in)
0
-2000
-4000
-6000
-8000
-100000
--'" LINEAR ANALYSIS
NONLINEAR ANALYSIS
STRAIN GAGE
I TEST
I FAILURE
I LOAD
011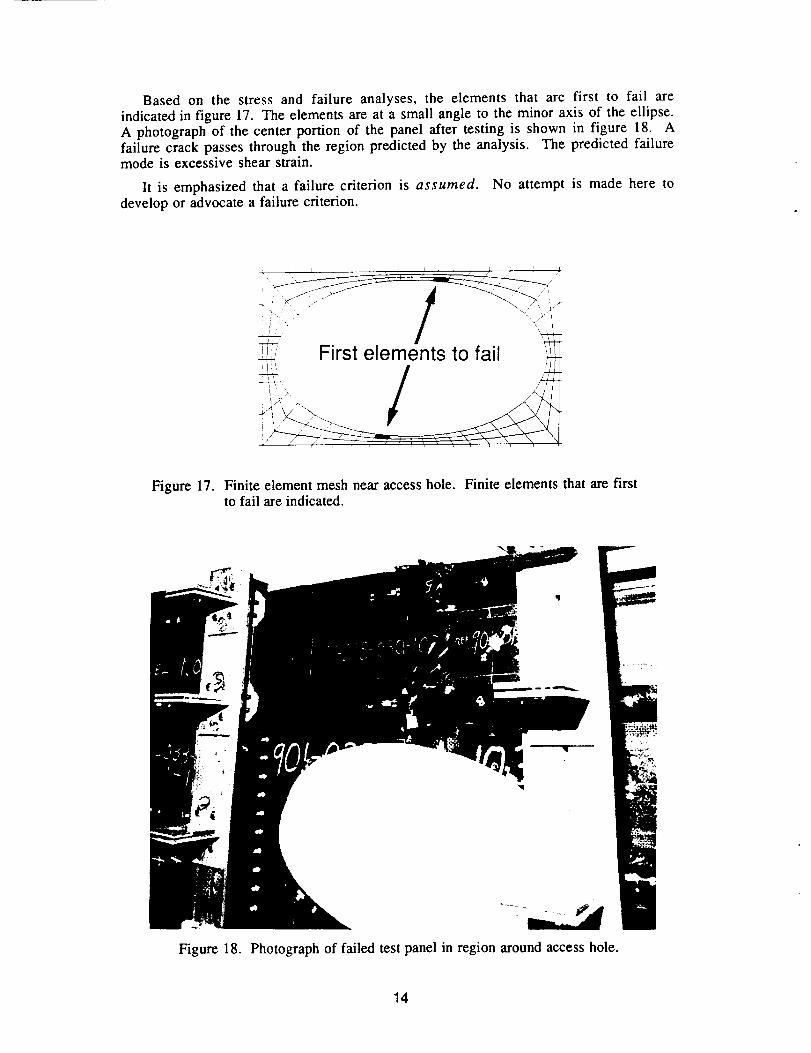
Based on the stress and failure analyses, the elements that are first to fail areindicated in figure 17. The elements are at a small angle to the minor axis of the ellipse.A photograph of the center portion of the panel after testing is shown in figure 18. Afailure crack passes through the region predicted by the analysis. The predicted failuremode is excessive shear strain.
It is emphasized that a failure criterion is assumed. No attempt is made here todevelop or advocate a failure criterion.
First elements to fail
,/,':/ /: ii
Figure 17. Finite element mesh near access hole. Finite elements that are firstto fail are indicated.
Figure 18. Photograph of failed test panel in region around access hole.
14
Reliability
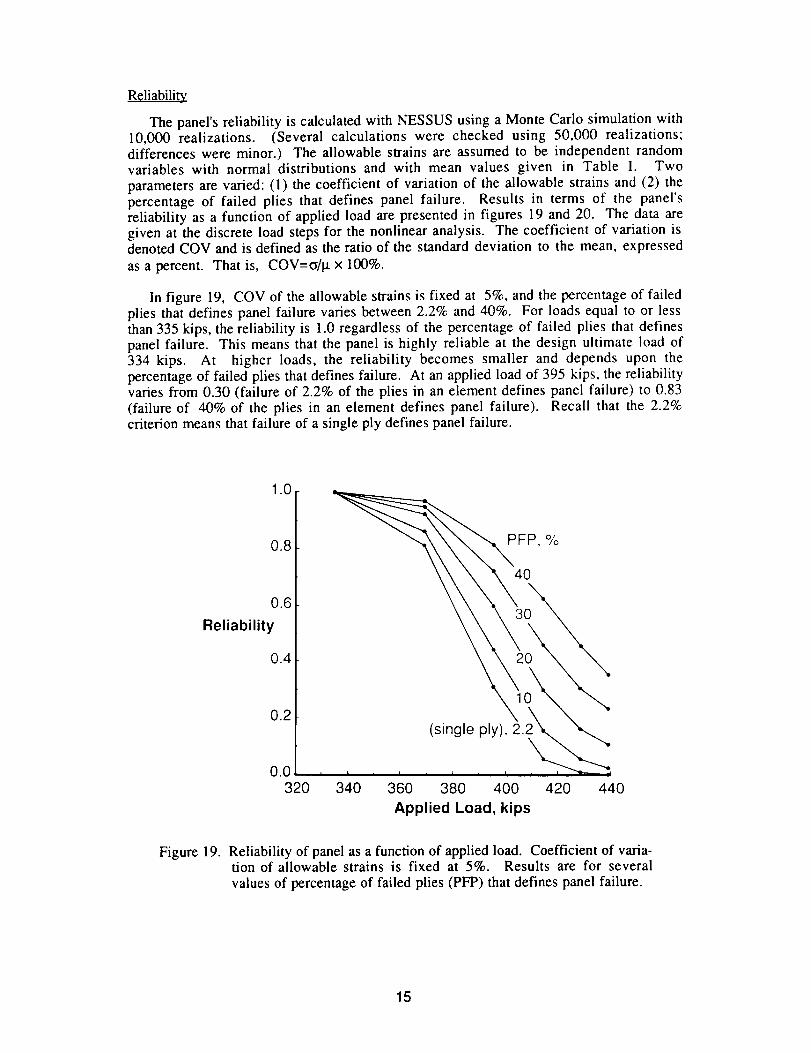
The panel's reliability is calculated with NESSUS using a Monte Carlo simulation with10,000 realizations. (Several calculations were checked using 50,000 realizations;differences were minor.) The allowable strains are assumed to be independent randomvariables with normal distributions and with mean values given in Table I. Two
parameters are varied: (1)the coefficient of variation of the allowable strains and (2) thepercentage of failed plies that defines panel failure. Results in terms of the panel'sreliability as a function of applied load are presented in figures 19 and 20. The data aregiven at the discrete load steps for the nonlinear analysis. The coefficient of variation isdenoted COV and is defined as the ratio of the standard deviation to the mean, expressed
as a percent. That is, COV=c_/I.t x 100%.
In figure 19, COV of the allowable strains is fixed at 5%, and the percentage of failedplies that defines panel failure varies between 2.2% and 40%. For loads equal to or lessthan 335 kips, the reliability is 1.0 regardless of the percentage of failed plies that definespanel failure. This means that the panel is highly reliable at the design ultimate load of334 kips. At higher loads, the reliability becomes smaller and depends upon thepercentage of failed plies that defines failure. At an applied load of 395 kips, the reliabilityvaries from 0.30 (failure of 2.2% of the plies in an element defines panel failure) to 0.83(failure of 40% of the plies in an element defines panel failure). Recall that the 2.2%criterion means that failure of a single ply defines panel failure.
1.0
0.8[ "__ PFP,%
40
3OReliability
0.4 2
0.2_0.0
320 340 360 380 400 420 440
Applied Load, kips
Figure 19. Reliability of panel as a function of applied load. Coefficient of varia-tion of allowable strains is fixed at 5%. Results are for several
values of percentage of failed plies (PFP) that defines panel failure.
15
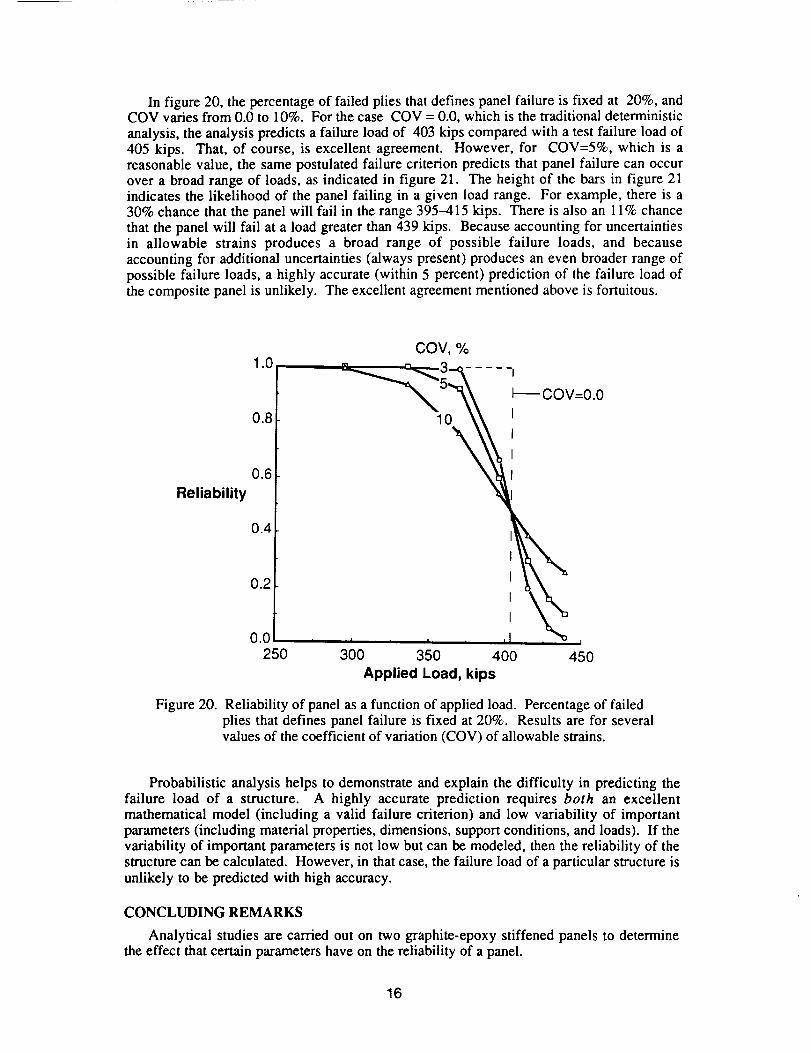
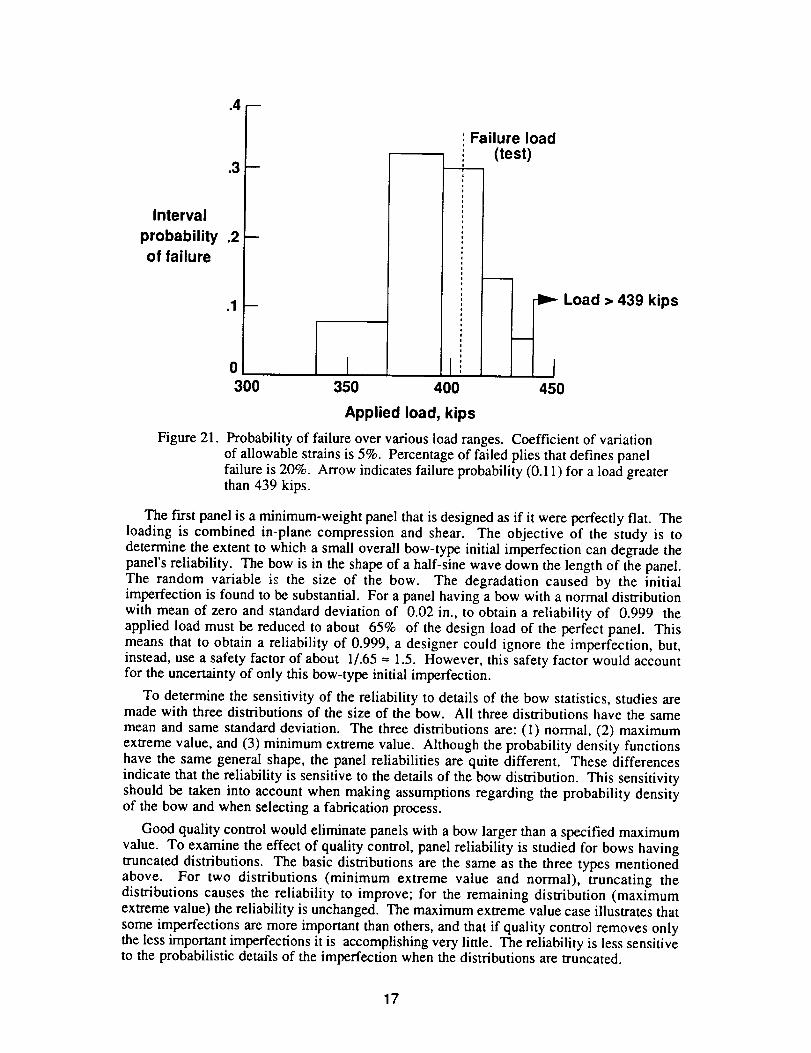
In figure20,thepercentageof failedpliesthatdefinespanelfailureis fixedat 20%,andCOVvariesfrom0.0to 10%.ForthecaseCOV= 0.0,whichis thetraditionaldeterministicanalysis,theanalysispredictsafailureloadof 403kipscomparedwithatestfailureloadof405kips. That,of course,is excellentagreement.However,for COV=5%,which is areasonablevalue,thesamepostulatedfailurecriterionpredictsthatpanelfailurecanoccurovera broadrangeof loads,asindicatedin figure21. Theheightof thebarsin figure21indicatesthelikelihoodof thepanelfailing in a givenloadrange. Forexample,thereis a30%chancethatthepanelwill fail in therange395-415kips. Thereisalsoan11%chancethatthepanelwill fail ata loadgreaterthan439kips. Becauseaccountingfor uncertaintiesin allowable strainsproducesa broadrange of possiblefailure loads, and becauseaccountingfor additionaluncertainties(alwayspresent)producesanevenbroaderrangeofpossiblefailureloads,a highlyaccurate(within5 percent)predictionof thefailureloadofthecompositepanelis unlikely.Theexcellentagreementmentionedaboveis fortuitous.
Reliability
1.0
0.8
0.6
0.4
0.2
0.0250
COV, %
3 ..... I
"'_1¢:_5_--_ - _---COV=0.0
lo \\ t
i I n I _ II I
300 350 400 450
Applied Load, kips
Figure 20. Reliability of panel as a function of applied load. Percentage of failedplies that defines panel failure is fixed at 20%. Results are for severalvalues of the coefficient of variation (COV) of allowable strains.
Probabilistic analysis helps to demonstrate and explain the difficulty in predicting thefailure load of a structure. A highly accurate prediction requires both an excellentmathematical model (including a valid failure criterion) and low variability of importantparameters (including material properties, dimensions, support conditions, and loads). If thevariability of important parameters is not low but can be modeled, then the reliability of thestructure can be calculated. However, in that case, the failure load of a particular structure isunlikely to be predicted with high accuracy.
CONCLUDING REMARKS
Analytical studies are carried out on two graphite-epoxy stiffened panels to determinethe effect that certain parameters have on the reliability of a panel.
16
.4--
Interval
probability
of failure
Failure load(test)
.3--i
i
.2- i,
t
i
.10 -- I IJ !,,,,:,,:I _1_ Load > 439 kips
300 350 400 450
Applied load, kips
Figure 21. Probability of failure over various load ranges. Coefficient of variationof allowable strains is 5%. Percentage of failed plies that defines panel
failure is 20%. Arrow indicates failure probability (0.11) for a load greaterthan 439 kips.
The lrtrst panel is a minimum-weight panel that is designed as if it were perfectly fiat. Theloading is combined in-plane compression and shear. The objective of the study is todetermine the extent to which a small overall bow-type initial imperfection can degrade thepanel's reliability. The bow is in the shape of a half-sine wave down the length of the panel.The random variable is the size of the bow. The degradation caused by the initialimperfection is found to be substantial. For a panel having a bow with a normal distributionwith mean of zero and standard deviation of 0.02 in., to obtain a reliability of 0.999 the
applied load must be reduced to about 65% of the design load of the perfect panel. Thismeans that to obtain a reliability of 0.999, a designer could ignore the imperfection, but,instead, use a safety factor of about 1/.65 ---1.5. However, this safety factor would accountfor the uncertainty of only this bow-type initial imperfection.
To determine the sensitivity of the reliability to details of the bow statistics, studies aremade with three distributions of the size of the bow. All three distributions have the samemean and same standard deviation. The three distributions are: (1) normal, (2) maximumextreme value, and (3) minimum extreme value. Although the probability density functionshave the same general shape, the panel reliabilities are quite different. These differences
indicate that the reliability is sensitive to the details of the bow distribution. This sensitivityshould be taken into account when making assumptions regarding the probability densityof the bow and when selecting a fabrication process.
Good quality control would eliminate panels with a bow larger than a specified maximum
value. To examine the effect of quality control, panel reliability is studied for bows havingtruncated distributions. The basic distributions are the same as the three types mentionedabove. For two distributions (minimum extreme value and normal), truncating thedistributions causes the reliability to improve; for the remaining distribution (maximumextreme value) the reliability is unchanged. The maximum extreme value case illustrates that
some imperfections are more important than others, and that if quality control removes onlythe less important imperfections it is accomplishing very little. The reliability is less sensitiveto the probabilistic details of the imperfection when the distributions are truncated.
17
The second panel is similar to a wing panel in the V-22 tiltrotor aircraft. The loading is in-plane uniaxial compression. In-plane strains are calculated using a geometrically nonlinearfinite element analysis. These strains are used to perform a failure analysis based onmaximum strain at the ply level. The random variables are the values of the allowablestrains. The objective of the study is to determine the extent to which uncertainties inallowable strains affect the panel's reliability. Results from the reliability analysis are
compared with the experimental failure load of the panel.
Using a deterministic approach and a postulated failure criterion, the predicted failureload and the experimental failure load are in close agreement (about 1% difference).However, the comparison becomes more realistic when the analysis accounts for areasonable variation in the allowable strains. With that variation, the same stress analysis
and failure criterion predict that failure could occur over a broad range of values of thecompressive load. The excellent test-analysis correlation obtained using the deterministicanalysis is fortuitous. A highly accurate prediction of failure requires both an excellentmathematical model (including a valid failure criterion) and low variability of important
parameters (including material properties, dimensions, support conditions, and loads).
This paper reinforces the need to account for uncertainties when carrying out structuralanalysis and design. Uncertainties cannot be eliminated, but they can be reduced byincreasing quality control. Ideally, a properly-posed optimization problem for structuraldesign should include the costs and benefits from various levels of quality control. Thestructure should be designed to minimize the total cost - including the cost of failure -while maintaining a prescribed reliability. Alternatively, the structure should be designed tomaximize reliability without exceeding a prescribed total cost.
ACKNOWLEDGMENTS
The authors wish to express their appreciation to Susan L. McCleary, LockheedEngineering & Sciences Co., who helped validate the finite element model for the secondexample, and to Bell Helicopter Textron - particularly to Robert V. Dompka - for providingtechnical data and photographs for the second example.
REFERENCES
Anderson, M. S.; Stroud, W. J.; Durling, B. J.; and Hennessy, K. W., 1980, "PASCO:Structural Panel Analysis and Sizing Code, Users Manual," NASA TM 80182.
Chamis, C. C., 1986, "Probabilistic Structural Analysis Methods for Space PropulsionSystem Components," Space System Technology Conference, San Diego, California, June 9-12, 1986, Technical Papers, AIAA, New York, pp. 133-144.
Davis, D. D., Jr., 1991, "Detailed Analysis and Test Correlation of a Stiffened CompositeWing Panel," NASA TM- 104154.
Liu, W. K.; and Belytschko, T. (Editors), 1989, Computational Mechanics ofProbabilistic and Reliability Analysis. Elmepress International, Lausanne, Switzerland.
Olesen, R, 1992, "PROBAN, General Purpose Probabilistic Analysis Program, User'sManual," Veritas Sesam Systems Report No. 92-7049, Veritas Sesam Systems (USA), Inc.,Houston, TX 77077
Stewart, C. B. (Compiler), 1989, "The Computational Structural Mechanics TestbedUser's Manual," NASA TM-100644.
Stroud, W. J., Krishnamurthy, T.; Sykes, N. P.; and Elishakoff, I., 1992, "Effect of Bow-type Initial Imperfection on the Reliability of Minimum-Weight Stiffened Structural Panels,"NASA TP-3263.
SwRI, 1991, "NESSUS Reference Manual, Version 1.0," Southwest Research Institute,San Antonio, TX 78228-0510.
18