relativistic band structure of gete, snte, pbte, pbse, and pbs · relativistic band structure of...
TRANSCRIPT
HAL Id: jpa-00213614https://hal.archives-ouvertes.fr/jpa-00213614
Submitted on 1 Jan 1968
HAL is a multi-disciplinary open accessarchive for the deposit and dissemination of sci-entific research documents, whether they are pub-lished or not. The documents may come fromteaching and research institutions in France orabroad, or from public or private research centers.
L’archive ouverte pluridisciplinaire HAL, estdestinée au dépôt et à la diffusion de documentsscientifiques de niveau recherche, publiés ou non,émanant des établissements d’enseignement et derecherche français ou étrangers, des laboratoirespublics ou privés.
RELATIVISTIC BAND STRUCTURE OF GeTe, SnTe,PbTe, PbSe, AND PbS
Frank Herman, Richard Kortum, Irene Ortenburger, John P. Van Dyke
To cite this version:Frank Herman, Richard Kortum, Irene Ortenburger, John P. Van Dyke. RELATIVISTIC BANDSTRUCTURE OF GeTe, SnTe, PbTe, PbSe, AND PbS. Journal de Physique Colloques, 1968, 29(C4), pp.C4-62-C4-77. <10.1051/jphyscol:1968410>. <jpa-00213614>
JOURNAL DE PHYSIQUE Colloque C 4, supplbment au no 11-12, Tome 29, Novembre-Dkembre 1968, page C 4 - 62
RELATIVISTIC BAND STRUCTURE OF GeTe, SnTe, PbTe, PbSe, AND PbS (*)
Frank HERMAN, Richard L. KORTUM, Irene B. ORTENBURGER and John P. VAN DYKE
Lockheed Palo Alto Research Laboratory, Palo Alto, California
R6sum6. - Les calculs relativistes de bandes par la methode des ondes planes orthogonaliskes ont ktk menks A bien aux points de symetrie simple dans la zone rkduite de Brillouin pour plusieurs composCs IV-VI. La structure de bande dans le reste de la zone a et6 deduite par interpolation. A notre connaissance, ce sont les premiers calculs de bandes pour Ies composb IV-V1 qui se basent au depart sur des principes relativistes (contrairement aux calculs non relativistes affines par des corrections relativistes et de couplage spin-orbite). Nos calculs conduisent A des modkles de bandes ayant une rkalitk physique, qui sont suffisamment prkcis pour tenir compte de la plupart des singu- laritks des spectres expkrimentaux de rkflectivitk. 11 est difficile #interpreter les spectres d'kectro- reflectivite sans ambigufte a l'aide de ces modeles de bande mais un certain nombre de recoupe- ments plausibles dans les spectres peuvent &re faits.
Des calculs des bandes d'energie et de spectre optique plus Claborks se poursuivent et seront publies ailleurs.
Abstract. - Relativistic OPW band calculations have been carried out at key points in the reduced zone for several IV-V1 compounds. The band structure in the remainder of the zone has been filled in with the aid of an interpolation scheme. To our knowledge, these are the first fully relativistic first-principles band calculations for IV-V1 compounds (in contrast to non-relativistic calculations supplemented by relativistic and spin-orbit coupling corrections). Our first-principles band calculations lead to physically realistic energy band models which are sufficiently accurate to account for most of the characteristic features of the experimental reflectivity spectra. It is difficult to interpret the electroreflectivity spectra unambiguously in terms of these band models but a number of plausible spectral assignments can be made. Refined energy band and optical spectrum calculations are in progress and will be reported elsewhere.
I. Introduction. - During the past 15 years, an enormous amount of experimental and theoretical effort has been devoted to the study of the energy band structure (and related properties) of the IV-V1 semi- conducting compounds, particularly PbS, PbSe, PbTe, SnTe, GeTe, and their alloys. As a result of this effort, we now know a great deal about the principal band edges (highest valence band maxima and lowest conduction band minima) of these materials. We also have a good qualitative idea of the overall form of the band structure throughout the reduced zone over an energy range of several eV. Recent summaries of the vast literature on the lead salts include those by Putley [l] and Prakash [2].
(*) The research reported in this paper was sponsored in part by the Lockheed Independent Research Fund ; in part by the Air Force Cambridge Research Laboratories, Ofice of Aeros- pace Research, under Contract No. AF 19 (628)-5750 ; and in part by the Aerospace Research Laboratories, Office of Aeros- pace Research, under Contract No. F 33615-67-C-1793.
Much of our theoretical understanding of the princi- pal band edges stems from the analyses of Dimmock and Wright [3] Cuff et al., [4], and Mitchell and Wallis [5]. Further insight into the nature of the band edges and information concerning the remainder of the band structure are provided by the first-principles APW band calculations of Johnson et al., [6], Conklin et al., [7], Ferreira, [g] and Rabii [9], and by the empi- rical pseudo-potential band calculations of Lin and Kleinman [10], Lin et al., [ I l l and Cohen et al. [12].
In spite of all the work that has already been done on the band structure of the IV-V1 compounds, our knowledge is still incomplete, and many important questions remain to be answered. Though it is generally believed that the symmetry classification of the princi- pal band edges in some of the IV-V1 compounds is known, the evidence in some cases is rather circumstan- tial, and it would be reassuring to have more definite experimental or theoretical evidence to clinch the matter. It would also be highly desirable to have more
Article published online by EDP Sciences and available at http://dx.doi.org/10.1051/jphyscol:1968410
RELATIVISTIC BAND STRUCTURE OF GeTe, SnTe, PbTe, PbSe AND PbS C 4 - 6 3
precise information about subsidiary valence and conduction band edges in the various IV-VS compounds as well as more accurate pictures of the overall band structures. In all of these domains, more precise infor- mation would put an end to current speculations and greatly accelerate progress in the correlation of expe- riment and theory.
With a view toward obtaining improved energy band pictures for the IV-VS compounds, we have carried out fully relativistic OPW energy band calculations for GeTe, SnTe, PbTe, PbSe, and PbS at a number of key points in the reduced zone, including T, X, L, and C (g 1/2 0). The band structure in the remainder of the zone was then mapped out with the aid of an interpolation scheme. The resulting energy band pic- tures appear to be more realistic than those given by earlier band calculations. In this paper we will outline our approach and report some of our results ; further results, including empirically-refined first-principles solutions, still more precise energy band pictures, and optical spectrum calculations will be presented in a subsequent publication 1131.
IS. Non-relativistic OPW energy band calculations. - For purposes of orientation, non-relativistic OPW band calculations were carried out for GeTe, SnTe, PbTe, PbSe, and PbS using 181 OPWs at the zone center and a similar number of OPWs at other points in the reduced zone. As in other recent OPW band calculations [14-211 the trial crystal potential was represented by a spatial superposition of overlapping atomic potentials. The calculations were first carried out using non-relativistic self-consistent neutral atom potentials based on the Slater free-electron exchange approximation ; the computations were then repeated using the Kohn-Sham version of this approximation. Representative results for both versions are listed in table I in the E (NREL) columns.
Although both exchange models give qualitatively similar band structures, the Slater mode1 leads to somewhat larger energy separations between valence and conduction bands in some regions. (This statement is also true for the relativistic calculations which will be discussed later.) In view of the exploratory nature of these non-relativistic calculations, we decided not to iterate the solutions so as to obtain self-consistent crystal potentials and energy band structures, as we have done for other semiconductors [14-161.
111. Relativistic OPW energy band calculations. - It has been recognized for some time that the neglect of relativistic [6,22] and spin-orbit coupling effects [23] can lead to serious errors in first-principles band cal-
culations, particularly for crystals composed of heavy atoms, such as lead and mercury compounds. However, even in crystals such as Ge, the relativistic (mass- velocity and Darwin) corrections [6, 221 are quite substantial : the relativistic correction for the direct band gap of Ge is just about as large as the direct band gap itself (0.8 eV) [20].
One way of taking relativistic and spin-orbit cou- pling effects into account (within the framework of non-relativistic band calculations) is by first-order perturbation theory. This is the approach used in the earlier APW band calculations for the lead salts, [6-91 and in our own earlier OPW band calculations for a variety of crystals [14-1 81.
A more rigorous and physically satisfying approach involves carrying through all the calculations within a relativistic framework [24, 251. Once the relativistic computer codes are developed, it is just as easy, and only slightly more expensive, to perform fully relati- vistic band calculations rather than non-relativistic band calculations supplemented by perturbation cor- rections. We have already studied over 25 different crystals using both approaches, and over 25 additional crystals (mostly composed of the lighter atoms) using the non-relativistic-perturbation approach only [20].
Our relativistic band calculations are based on Soven's relativistic formulation [25] of the OPW method, but our choice of crystal potential differs considerably from Soven's. In contrast to Soven - who was primarily interested in metallic crystals such as thallium - our relativistic trial potential is repre- sented by a spatial superposition of overlapping ato- mic potentials (just as in the non-relativistic case), and this crystal potential is used for core, valence, and conduction band states alike. In the present context, we use relativistic self-consistent atomic potentials of the Slater or Kohn-Sham free-electron exchange type 1261 rather than their non-relativistic counterparts, [27] as before. To insure the same high degree of conver- gence as in our non-relativistic calculations, the same number of OPWs is used now as before (e. g., 181 OPWs at the zone center).
We have rederived Soven's expression for the rela- tivistic OPW matrix elements and reduced all of these to forms involving radial integrals (Ref. [25] does not contain the fully reduced forms). In the Appendix, we outline the essential features of the relativistic OPW method, and then we write down the fully redu- ced expressions for the various matrix elements. The Appendix should be of particular interest to those planning first-principles or parametrically-simulated relativistic OPW band calculations.
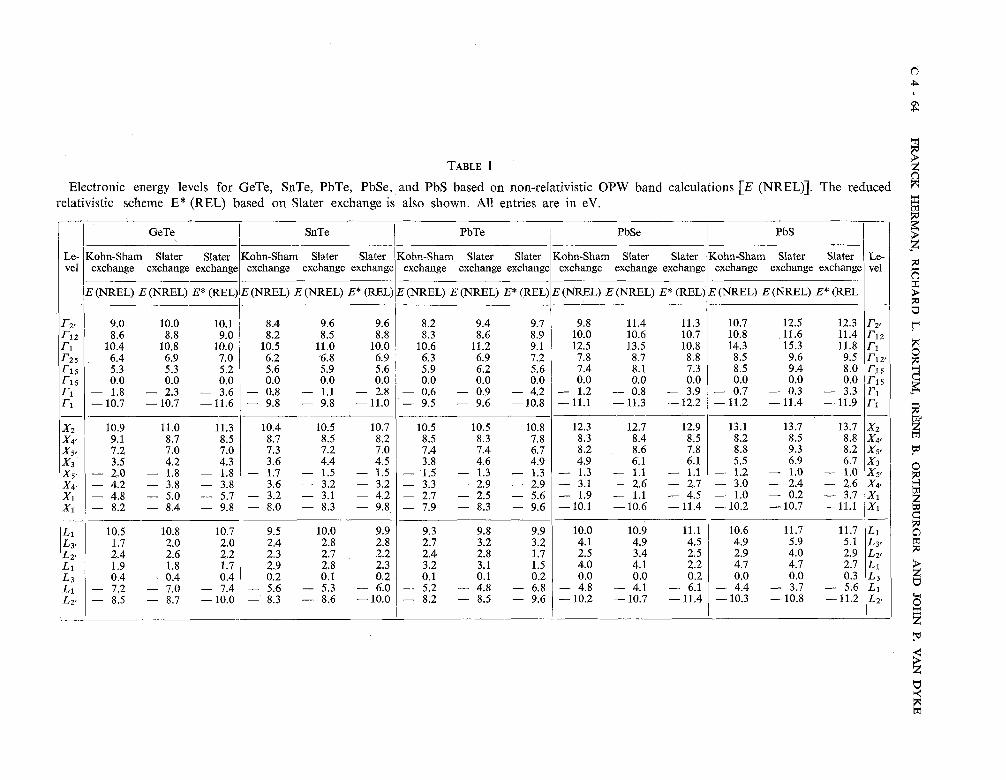
TABLE I
Electronic energy levels for GeTe, SnTe, PbTe, PbSe, and PbS based on non-relativistic OPW band calculations [E (NREL)]. The reduced relativistic scheme E* (REL) based on Slater exchange is also shown. All entries are in eV.
I I GeTe I SnTe I PbTe 1 PbSe I PbS I / l
Le- 1 vel Kohn-Sham Slater S a t e K o h n S h a t Slater Kohn-Sham Slater a t K O - h a t a t K - S S Slater 1 Le- 1 exchange exchange exchange exchange exchange exchange exchange exchange exchange exchange exchange exchange exchange exchange exchange vel l
RELATIVISTIC BAND STRUCTURE OF GeTe, SnTe, PbTe, PbSe AND PbS C 4 - 6 5
Now for a few words about our notation. It is convenient to use the symbol E (REL) to denote the full relativistic energy level scheme, as given by a rela- tivistic band calculation ; and the symbol E* (REL) to denote the closely related scheme in which spin-orbit split levels in E (REL) are represented by their weighted means. The ordinary non-relativistic energy level scheme E (NREL) and the reduced relativistic scheme E* (REL) are both expressed in single group notation, while the E (REL) scheme is expressed in double group notation [23]. Apart from exceptional cases where nearby levels in the E (REL) scheme are stron- gly coupled by the spin-orbit interaction, the passage from E (REL) to E* (REL) is straightforward.
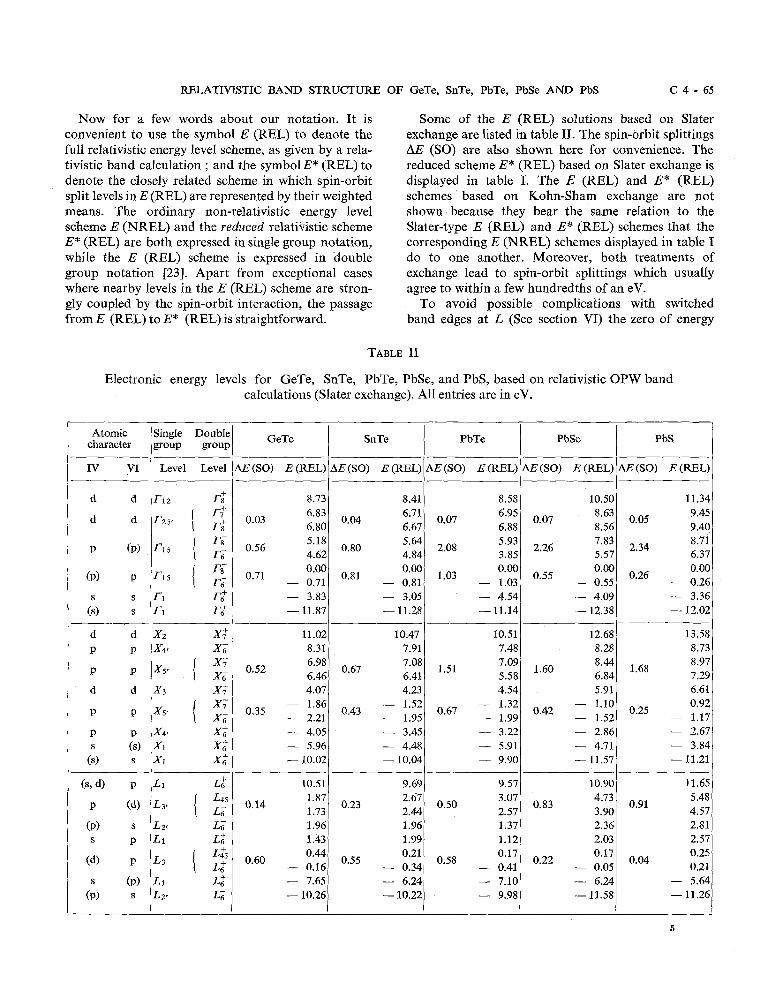
Some of the E (REL) solutions based on Slater exchange are listed in table 11. The spin-orbit splittings AE (SO) are also shown here for convenience. The reduced scheme E* (REL) based on Slater exchange is displayed in table I. The E (REL) and E* (REL) schemes based on Kohn-Sham exchange are not shown because they bear the same relation to the Slater-type E (REL) and E" (REL) schemes that the corresponding E (NREL) schemes displayed in table I do to one another. Moreover, both treatments of exchange lead to spin-orbit splittings which usually agree to within a few hundredths of an eV.
To avoid possible complications with switched band edges at L (See section VI) the zero of energy
Electronic energy levels for GeTe, SnTe, PbTe, PbSe, and PbS, based on relativistic OPW band calculations (Slater exchange). All entries are in eV.
Atomic Single Double GeTe character group group I SnTe I PbTe 1 PbSe I PbS I
p (d) /Lir { 21 0.14 1 . ~ ~ 1 1.73 0.23 2.671 2.44 0.50 2.57 3'07/ 0.83 4'73/ 3.90 0.91 4.57
I I V1 Level Level 1 AE (SO) E (REL) AE (SO) E (REL) r AE (SO) E (=L) AE (SO) E (REL) AE (SO) E (REL)
C 4 - 66 FRANCK HERMAN, RICHARD L. KORTUM, I ~ N E B. ORTENBURGER AND JOHN P. VAN DYKE
in tables I and I1 has been placed at the highest valence band level at the zone center. Since the zero of energy in table I occurs at a f ,, level, and in table I1 at a f g level, corresponding non-degenerate levels in these two tables are displaced from one another by 113 of the spin-orbit splitting of the T,, level.
IV. Relativistic corrections in retrospect. - Since we have analogous E (NREL), E (REL), and E* (REL) solutions at our disposal, we can define the relativistic corrections BE (REL) as follows : BE (REL) = E' (REL) -E (NREL). By comparing the relativistic corrections thus defined with the estimates given by perturbation theory [6-9, 271 we can determine how accurate these estimates really are. In the case of the lead salts, we find that the perturbation estimates are often in error by as much as 0.2 eV for interband ener- gies that are affected only moderately by the inclusion of relativistic effects, and by as much,as 0.4 eV for strongly affected interband energies. Considering that some of the relativistic corrections are as large as 3 eV for these materials, perturbation theory is seen to give reasonably good estimates. However, if one is striving for a mathematical accuracy approaching 0.1 eV, the perturbation approach is clearly deficient.
Part of the difficulty with the perturbation approach stems from the approximate nature of the relativistic correction terms that appear in first-order perturba- tion theory [6-9, 271. Another difficulty is that the perturbation approach neglects the change in self- consistent atomic potentials associated with the inclusion of relativistic terms 1281. In spite of these shortcomings, however, the perturbation approach usually gives reasonable results, not only for the rela- tivistic corrections AE (REL), but also for the spin- orbit spljttings AE (SO).
In any event, it is clear that relativistic and spin- orbit coupling effects must be taken into account if realistic energy band pictures are to be determined.
V. Preliminary energy band pictures for the IV-V1 compounds. - Although it is possible in principle to map out the band structure throughout the reduced zone by carrying out first-principles band calculations at a sufficiently large number of points, it is more economical (and nearly as satisfactory) to carry out such calculations only at a few key points, and then to extend the solutions into the remainder of the zone with the aid of a parametric interpolation scheme 118-201.
Using a modified pseudopotential interpolation scheme similar to that described in earlier publica-
tions 118-201 interpolated energy band pictures of the E* (REL) type have been obtained for GeTe SnTe, PbTe, PbSe, and PbS. These band pictures were adjusted (by least-squares) to the three highest valence and the three lowest conduction band levels of the E* (REL) type at f , X, L, and .Z ('/2 '/2 0). In some cases, additional E* (REL) levels at A (S 0 0) and W were also employed. This interpolation scheme, which is based on a local pseudopotential and a kinetic energy term containing an adjustable effective mass parameter, is able to reproduce the E* (REL) levels reasonably well over a 10 eV range extending roughly 5 eV below and 5 eV above the direct band gap at L. Beyond this range (and even on the fringes of this range), the interpolation scheme breaks down, failing to reproduce the first-principles E* (REL) levels with any degree of accuracy.
The interpolated band pictures (for the Slater-type solutions) were then improved in two ways. In the first place, we drew free-hand sketches of the energy bands in some of the regions where the interpolation scheme was defective. In the second place, the spin-orbit splitting was incorporated into the final pictures so that we would match the E (REL) levels at the points where these levels had been calculated from first principles. Of course, this involved estimating the spin-orbit splitting at intermediate points in the zone, but this is not too difficult to do if one is content with an accuracy of a few tenths of an eV.
The preliminary energy band pictures shown in figs. 1 through 5 are based on the first-principles E (REL) levels at key points in the zone, and on inter- polation and spin-orbit splitting estimates elsewhere in the zone. We believe that these pictures represent the first-principles E (REL) levels throughout the zone to within a few tenths of an eV over an energy range of about 10 eV.
In order to obtain more accurate renditions of our E (REL) solutions throughout the zone, it will be necessary to use a more sophisticated (possibly a non- local, energy-dependent) interpolation scheme which is valid over a wider energy range, and includes a simulated spin-orbit interaction term [29]. Such a scheme could be fitted directly to the E (REL) levels at key points in the zone, thus avoiding the interme- diate step of an adjustment to the reduced E* (REL) levels. Of course, we could also obtain first-principles E (REL) levels at a few additional points in the zone to improve the first-principles sample.
At this writing we have nearly completed the deve- lopment of an improved interpolation scheme of the type just described, but until this scheme becomes
RELATIVISTIC BAND STRUCTURE OF GeTe, SnTe, PbTe, PbSe AND PbS C 4 - 6 7
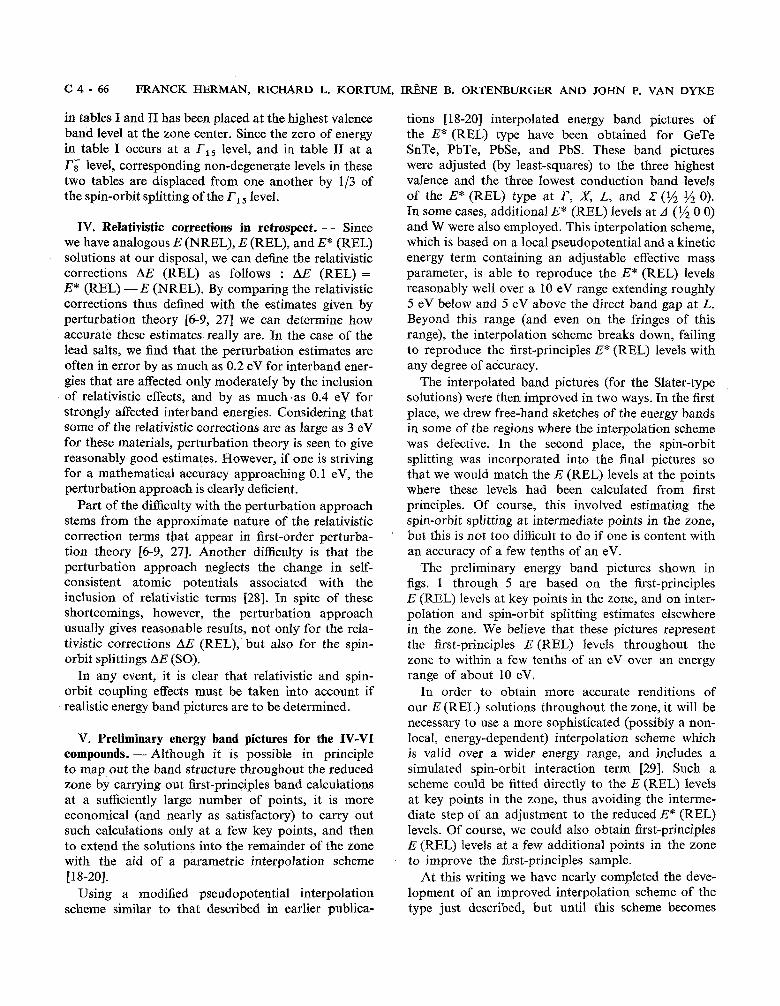
GERMANIUM TELLURIDE
FIG. 1. - Energy band structure of GeTe (Slater exchange).
operational, we will have to be content with the pre- liminary band pictures shown in figs. 1 through 5.
It is clear from these figures that the energy level schemes of GeTe, SnTe, PbTe, PbSe, and PbS have a great deal in common, though there are obviously systematic differences from crystal to crystal arising from chemical shifts, differences in lattice constant, and differences in the magnitude of the spin-orbit splitting. (Relativistic shifts are here included in the catch-all expression c( chemical shifts )).) But even allowing for these systematic differences, it is evident that over an energy range of about 20 eV, most of the valence and conduction band levels at key points in the zone occur in nearly the same general order.
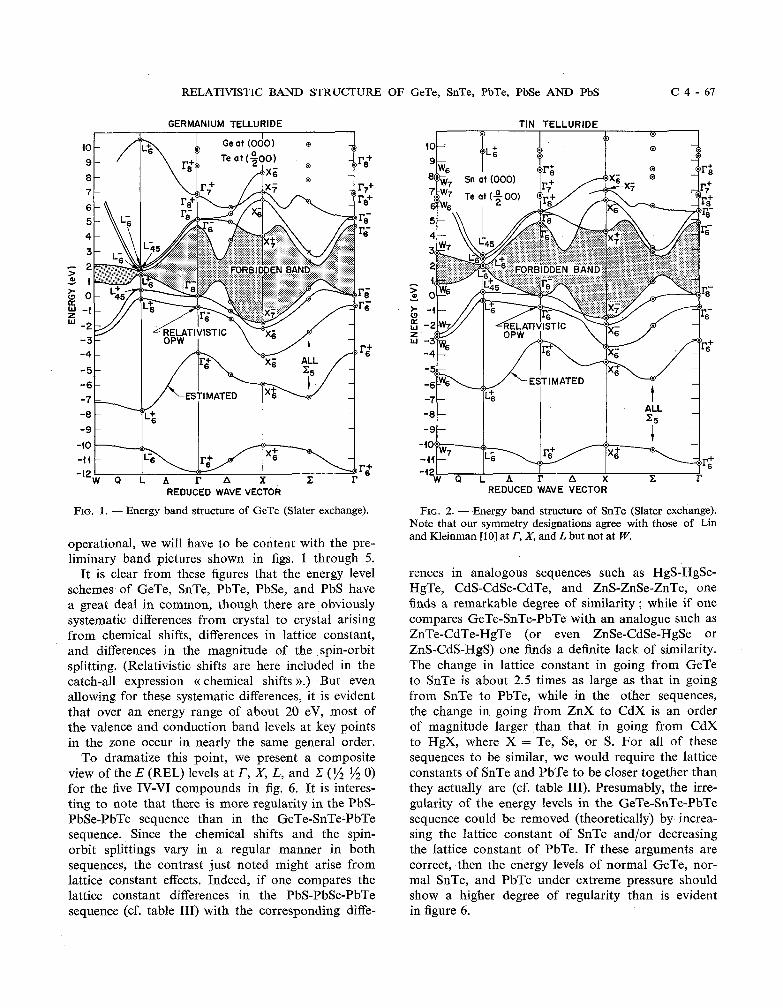
To dramatize this point, we present a composite view of the E (REL) levels at T, X, L, and .Z (S 1/2 0) for the five IV-V1 compounds in fig. 6. It is interes- ting to note that there is more regularity in the PbS- PbSe-PbTe sequence than in the GeTe-SnTe-PbTe sequence. Since the chemical shifts and the spin- orbit splittings vary in a regular manner in both sequences, the contrast just noted might arise from lattice constant effects. Indeed, if one compares the lattice constant differences in the PbS-PbSe-PbTe sequence (cf. table 111) with the corresponding diffe-
TIN TELLURIDE I P I e I
-40
REDUCED WAVE VECTOR
FIG. 2. - Energy band structure of SnTe (Slater exchange). Note that our symmetry designations agree with those of Lin and Kleinman [l01 at l', X, and L but not at W.
rences in analogous sequences such as HgS-HgSe- HgTe, CdS-CdSe-CdTe, and ZnS-ZnSe-ZnTe, one finds a remarkable degree of similarity ; while if one compares GeTe-SnTe-PbTe with an analogue such as ZnTe-CdTe-HgTe (or even ZnSe-CdSe-HgSe or ZnS-CdS-HgS) one finds a definite lack of similarity. The change in lattice constant in going from GeTe to SnTe is about 2.5 times as large as that in going from SnTe to PbTe, while in the other sequences, the change in going from ZnX to CdX is an order of magnitude larger than that in going from CdX to HgX, where X = Te, Se, or S. For all of these sequences to be similar, we would require the lattice constants of SnTe and PbTe to be closer together than they actually are (cf. table 111). Presumably, the irre- gularity of the energy levels in the GeTe-SnTe-PbTe sequence could be removed (theoretically) by increa- sing the lattice constant of SnTe and/or decreasing the lattice constant of PbTe. If these arguments are correct, then the energy levels of normal GeTe, nor- mal SnTe, and PbTe under extreme pressure should show a higher degree of regularity than is evident in figure 6.
C 4 - 68 FRANCK HERMAN, RICHARD L. KORTl
LEAD TELLURIDE 11 I I I I I
REDUCED WAVE VECTOR
FIG. 3. - Energy band structure of PbTe (Slater exchange).
LEAD SELENIDE
ESTIMATED
- i t
-1 2
Q L A r A X C r REDUCED WAVE VECTOR
FIG. 4. - Energy band structure of PbSe (Slater exchange).
IRENE B. ORTENBURGER AND JOHN P. VAN DYKE
LEAD SULFIDE
ALL - < =5 -
,.X t i -,F&
W Q L A r A X P r REDUCED WAVE VECTOR
FIG. 5. -Energy band structure of PbS (Slater exchange).
RELATIVISTIC BAND STRUCTURE OF GeTe, SnTe, PbTe, PbSe AND PbS C 4 - 6 9
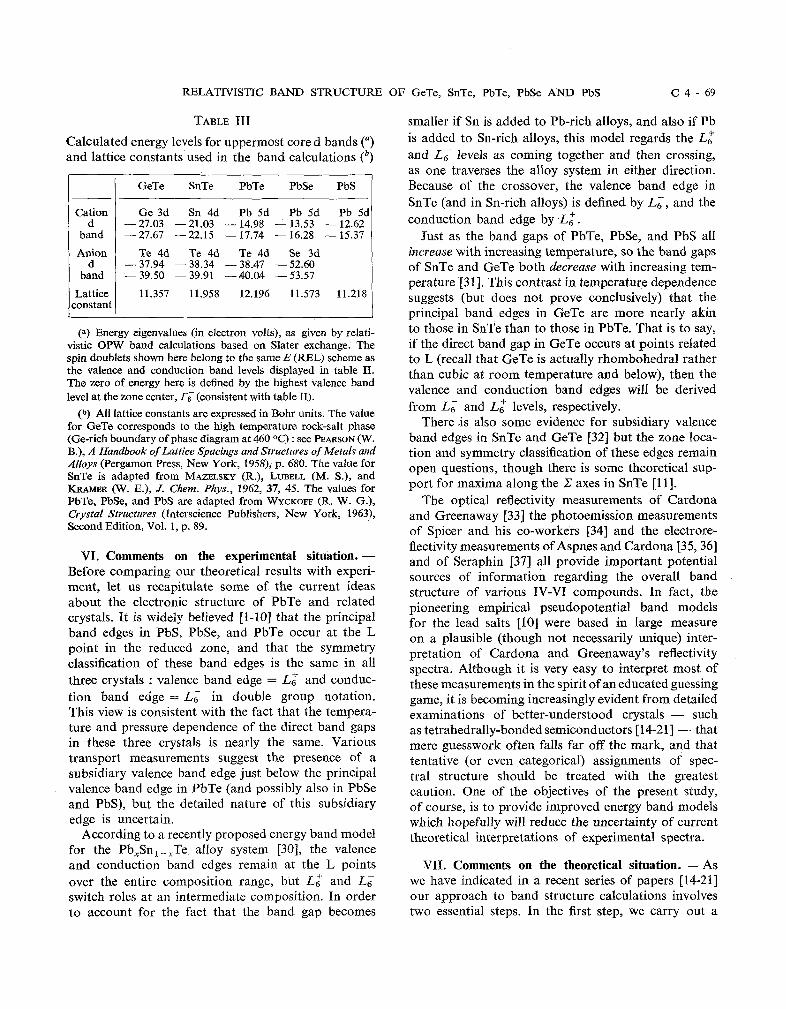
TABLE I11
Calculated energy levels for uppermost cored bands (") and lattice constants used in the band calculations (b )
Cation d
band
Anion d
band
Lattice constant
GeTe SnTe PbTe PbSe PbS
Ge 3d Sn 4d Pb 5d Pb 5d Pb 5d - 27.03 - 21.03 - 14.98 - 13.53 - 12.62 - 27.67 - 22.15 - 17.74 - 16.28 - 15.37
Te 4d Te 4d Te 4d Se 3d - 37.94 - 38.34 - 38.47 - 52.60 - 39.50 -39.91 -40.04 - 53.57
11.357 11.958 12.196 11.573 11.218
p) Energy eigenvalues (in electron volts), as given by relati- vistic OPW band calculations based on Slater exchange. The spin doublets shown here belong to the same E (REL) scheme as the valence and conduction band levels displayed in table 11. The zero of energy here is defined by the highest valence band level at the zone center, Tc (consistent with table 11).
(b) AI1 lattice constants are expressed in Bohr units. The value for GeTe corresponds to the high temperature rock-salt phase (Ge-rich boundary of phase diagram at 460 OC) : see PEARSON (W. B.), A Handbook of Lattice Spacings and Structures of Metals and Alloys (Pergamon Press, New York, 1958), p. 680. The value for SnTe is adapted from MAZELSKY (R.), LUBELL (M. S.), and KRAMER (W. E.), J. Chem. Phys., 1962, 37, 45. The values for PbTe, PbSe, and PbS are adapted from WYCKOFF (R. W. G.), Crystal Structures (Tnterscience Publishers, New York, 1963), Second Edition, Vol. 1, p. 89.
VI. Comments on the experimental situation. - Before comparing our theoretical results with experi- ment, let us recapitulate some of the current ideas about the electronic structure of PbTe and related crystals. It is widely believed [l-101 that the principal band edges in PbS, PbSe, and PbTe occur at the L point in the reduced zone, and that the symmetry classification of these band edges is the same in all three crystals : valence band edge = L: and conduc- tion band edge = L; in double group notation. This view is consistent with the fact that the tempera- ture and pressure dependence of the direct band gaps in these three crystals is nearly the same. Various transport measurements suggest the presence of a subsidiary valence band edge just below the principal valence band edge in PbTe (and possibly also in PbSe and PbS), but the detailed nature of this subsidiary edge is uncertain.
According to a recently proposed energy band model for the Pb,Sn,-,.Te alloy system [30], the valence and conduction band edges remain at the L points over the entire composition range, but L: and La switch roles at an intermediate composition. In order to account for the fact that the band gap becomes
smaller if Sn is added to Pb-rich alloys, and also if Pb is added to Sn-rich alloys, this model regards the L: and L; levels as coming together and then crossing, as one traverses the alloy system in either direction. Because of the crossover, the valence band edge in SnTe (and in Sn-rich alloys) is defined by L;, and the conduction band edge by L:.
Just as the band gaps of PbTe, PbSe, and PbS all increase with increasing temperature, so the band gaps of SnTe and GeTe both decrease with increasing tem- perature [31]. This contrast in temperature dependence suggests (but does not prove conclusively) that the principal band edges in GeTe are more nearly akin to those in SnTe than to those in PbTe. That is to say, if the direct band gap in GeTe occurs at points related to L (recall that GeTe is actually rhombohedral rather than cubic at room temperature and below), then the valence and conduction band edges will be derived from LT and L: levels, respectively.
There .is also some evidence for subsidiary valence band edges in SnTe and GeTe [32] but the zone loca- tion and symmetry classification of these edges remain open questions, though there is some theoretical sup- port for maxima along the ,Z axes in SnTe [l l].
The optical reflectivity measurements of Cardona and Greenaway [33] the photoemission measurements of Spicer and his co-workers [34] and the electrore- flectivity measurements of Aspnes and Cardona [35,36] and of Seraphin [37] all provide important potential sources of information regarding the overall band structure of various IV-V1 compounds. In fact, the pioneering empirical pseudopotential band models for the lead salts [l01 were based in large measure on a plausible (though not necessarily unique) inter- pretation of Cardona and Greenaway's reflectivity spectra. Although it is very easy to interpret most of these measurements in the spirit of an educated guessing game, it is becoming increasingly evident from detailed examinations of better-understood crystals - such as tetrahedrally-bonded semiconductors [14-211 - that mere guesswork often falls far off the mark, and that tentative (or even categorical) assignments of spec- tral structure should be treated with the greatest caution. One of the objectives of the present study, of course, is to provide improved energy band models which hopefully will reduce the uncertainty of current theoretical interpretations of experimental spectra.
VII. Comments on the theoretical situation. - As we have indicated in a recent series of papers [14-211 our approach to band structure calculations involves two essential steps. In the first step, we carry out a
first-principles band calculation and thereby obtain a provisional energy band picture. In the second step, we introduce an empirical correction which brings the theoretical band picture into exact (or close) agreement with the best established experimental features. In practice, this amounts to changing a few features of the trial crystal potential so that a corres- ponding number of interband energy separations are in accord with experiment. Treating this change in the trial crystal potential as a perturbation (which it normally is), we then recalculate the entire band structure, and thereby obtain a modified band picture which hopefully agrees better with experiment not only in the fitted regions, but in the unfitted regions as well.
In the case of tetrahedrally-bonded semiconducting compounds [17-211 we have usually been able to make substantial improvements in our first-principles solu- tions, where such improvements prove necessary, by using a three-parameter empirical correction scheme. TWO of these parameters are used to modify the effec- tive crystal potential in the cation and anion core regions, and the third to raise or lower the potential in the interstitial region relative to the core regions.
In order to make similar progress in the present study, it is necessary to know three or more interband energy separations (per crystal) with a high degree of certainty. Reviewing the experimental information included in table IV, we find that apart from the direct band gaps, there are hardly any other transi- tion energies that can be assigned to specific inter- band transitions (at precise positions in the zone) with an accuracy of the order of 0.1 eV. It shsuld be borne in mind that the reflectivity peaks are asso- ciated with interband transitions belonging to exten- sive regions of the reduced zone : such associations usually provide only a rough measure of the key interband transitiops which characterize these regions. Although the electroreflectivity (ER) peaks can usually be measured quite accurately, the identification of these peaks is often ambiguous.
As can be seen from table I, where the E (NREL) solutions for the Slater and Kohn-Sham exchange models are compared, the Kohn-Sham model usually leads to smaller energy separations between the valence and the conduction bands. Since both of these models are based on a variety of physical approxima- tions, we should not expect either model to lead to a band structure which agrees exactly with experi- ment. In fact, the difference between the Slater and Kohn-Sham solutions provides a realistic measure of the uncertainty in the calculated band structure
associated with the uncertainty in present-day treat- ments of exchange (and correlation) effects. Since we have found in earlier studies of 11-V1 compounds [18- 201 that the Slater model gives results in closer agree- ment with experiment than the Kohn-Sham model, we would be inclined to favor the Slater model in the present study of IV-V1 compounds. At the same time, we have found the Kohn-Sham model to be superior in some respects in applications to column IV semiconductors and 111-V compounds [20-211. Hence we cannot dismiss the Kohn-Sham model, especially in the case of GeTe and SnTe.
In practice, we find that the Slater solutions give a better account of the experimental situation for the IV-V1 compounds than the Kohn-Sham solutions do. It is for this reason that we have concentrated on the Slater solutions in table I1 and in figures l through 6.
In the next section, we will relate the first-principles E (REL) solutions to experiment. By doing so, we will be able to check the adequacy of these solutions and at the same time pave the way for subsequent empirical refinements [l 31.
VIII. Comparison between theory and experiment. - The Slater (and also the Kohn-Sham) E (REL) solu- tions place the principal valence and conduction band edges at L in all five crystals, in accord with experi- ment (at least for SnTe, PbTe, PbSe, and PbS ; the experimental situation in GeTe is uncertain). In the case of the lead salts, the Slater model leads to the correct ordering of L; and L: in the neighborhood of the band gap, as well as to remarkably accurate values for the band gaps themselves. Because the three conduction bands have moved down relative to the valence bands in the Kohn-Sham model, the orde- ring of L; and L: is incorrectly given by this model, and the band gap differs from experiment by several tenths of an eV.
In the case of SnTe, both exchange models place L: above L;, in accord with experiment [30] ; the experi- mental band gap, 0.2 eV [30-321 falls midway between the Slater and Kohn-Sham values (L: -L; = 0.03 and 0.46 eV, respectively).
In the present study, GeTe is assumed to have the rock-salt structure, and a lattice constant correspon- ding to an elevated temperature (cf. table 111). However, most of the experimental evidence refers to the rhombohedral form of GeTe 138) at room temperature and below [31, 321. In particular, the band gap of rhombohedral GeTe at room tempera- ture is about 0.1 eV [32]. Since the experimental band gap decreases with increasing temperature,
RELATIVISTIC BAND STRUCTURE OF GeTe, SnTe, PbTe, PbSe AND PbS C 4 - 7 1
we should compare our theoretical band gaps with a (( high temperature )) band gap of about 0 eV. Our Kohn-Sham band gap (L6 - L:) is 0.02 eV, while the corresponding Slater value is 0.30 eV. If the diffe- rence between the rhombohedral and rock-salt crys- tal structures makes no appreciable difference in the magnitude of the direct band gap, then the Kohn- Sham model is in better agreement with experiment than the Slater model. However, if the crystal struc- ture difference could change the band gap by a few tenths of an eV, both models must be considered within striking distance of experiment. (We plan to carry out relativistic OPW band calculations for rhombohedral GeTe using the room temperature lattice parameters [38] so that we can come closer to the actual experimental situation.)
The direct band gap at L (between bands 5 and 6) defines an M, critical point : the surfaces of constant energy separation are ellipsoidal in the vicinity of L. The well-defined valence band maxima and conduc- tion band minima along the A and C axes in figures 1 through 5 are not necessarily subsidiary band edges, since the valence band energy may increase (and the conduction band energy may decrease) as one moves away from these axes in one or more perpendicular direction. Our solutions suggest that the highest valence band maxima and the lowest conduction band minima along the A and C axes are more likely to be saddle points than absolute extrema. Moreover, the minimum energy separations along the A and C axes define M, and M, critical points, since the sur- faces of constant energy separation are hyperbolic in these neighborhoods. In the future, we will refer to these as the A and C saddle points.
ReJlectivity Spectra. Cardona and Greenaway [33] (hereafter CG) have measured the reflectivity spectra of GeTe, SnTe, PbTe, PbSe, PbS, and related materials. They have arranged corresponding reflectivity peaks and shoulders into families and labeled these E, to E,. The experimental results of CG are very useful because they contain many important clues regarding the overall band structure of these materials. In the fol- lowing discussion, we will offer an interpretation of these results which is based partly on the correla- tion with our theoretical energy level separations (cf. table IV), and partly on the outcome of some preli- minary optical spectrum calculations which we have carried out for SnTe (see also Lin et al. [l11 for an analysis of the reflectivity spectrum of SnTe).
It is by now widely recognized that reflectivity peaks are associated with electronic transitions bet- ween pairs of bands which remain nearly parallel
to one another over a significant fraction of the reduced zbne. In simple cases it is convenient to discuss these regions of nearly constant energy sepa- ration in terms of related critical points ; in more complex cases such a discussion may not be particu- larly illuminating. In the present application, it is important to bear in mind that large regions of nearly constant energy separation may be associated with C and A saddle points, as well as with such symmetry points as r, X, L, and W.
As an illustration, let us consider band 5 -+ band 6 transitions in SnTe. Although it is not evident from figure 2, the interband separation is nearly constant in a region which starts at the C saddle point and extends in the general direction of L, and in another region which starts at the A saddle point and extends in the direction of the A axis.
The E, structure (absorption shoulder in SnTe; weak reflectivity peak in PbTe, PbSe, and PbS) appears to arise primarily from band 5 -+ band 6 transitions in a region close to the X saddle point which extends toward L. In the lead salts, we would also expect significant contributions from band 5 + band 7 transitions in a region close to L which extends toward C (cf. table IV). In GeTe, the absorption threshold at about 0.6 eV (as measured in transmis- sion by Aspnes and Cardona [36]) may be associated with band 5 + band 7 and band 5 + band 8 transi- tions in the neighborhood of the L points, or even with band 5 + band 6 transitions in the vicinity of the Z saddle point. In any event, the observed absorp- tion threshold should lie slightly above the related minimum band gap, because of the high carrier concen- tration (Burstein effect).
The E, structure (main reflectivity peak) appears to arise from various types of transitions. In SnTe, PbTe, PbSe, and PbS, the principal contributions appear to come from band 5 -+ band 6 transitions in the vicinity of the A saddle point, and from band 4 + band 6 and band 5 -t band 7 transitions in the neighborhood of the X saddle point. In GeTe, band 3 + bands 7 and 8 transitions near L may play a role in addition to those just mentioned (cf. table IV).
The E, structure (shoulder or weak reflectivity peak) also appears to arise from more than one type of transition. In SnTe, PbTe, PbSe, and PbS, the principal contribution appears to come from band 4 + band 7 transitions near the X saddle point; in some of these materials there may also be signi- ficant contributions from bands 3 and 4 + band 6 transitions near the A saddle point, and even from bands 3 and 4 -+ band 8 transitions near L. In GeTe,
C 4 - 72 FRANCK HERMAN, RICHARD L. KORTUM, I R ~ N E B. ORTENBURGER AND JOHN P. VAN DYKE
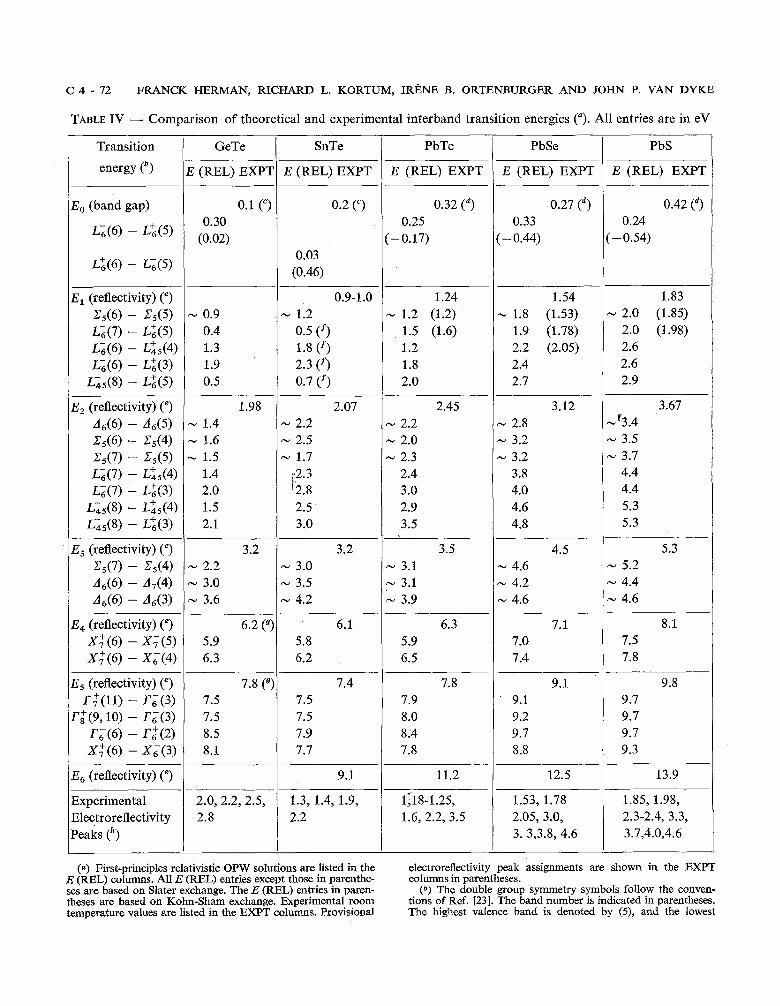
TABLE IV - Comparison of theoretical and experimental interband transition energies ("). All entries are in eV
1 Transition 1 GeTe I SnTe I PbTe 1 PbSe I PbS
E (REL) EXPT E (REL) EXPT
0.27 (d) 0.42 (d) 0.33 0.24
(- 0.44) (-0.54)
0.9-1.0 - 0.9 - 1.2 0.4 0.5 (f) 1.3 1.8 (f) 1.9 2.3 (f) 0.5 0.7 (f)
E, (reflectivity) V) - C5(5)
La71 - L;,@) - L+,5(4) L a ) - L231
L;;5(8) - G(5)
E, (reflectivity) (?
A,@) - - Zs(4) - C5(5)
Ld7) - Lf,5(4) La7) - LX3)
Lis(8) - Lf45(4) - L231
E, (reflectivity) ( e )
C5(7) - E5(4) A,@) - AA4) A6(6) - 46(3)
E, (reflectivity) (") X:@) -
- X,(4)
E, (reflectivity) (") ~ ; ( I I ) - r i ( 3 )
r:(9,10) - r i ( 3 ) Ti(6) -
- Xi(3)
E, (reflectivity) (?
Experimental Electroreflectivity Peaks ( h )
(a) First-principles relativistic OPW solutions are listed in the electroreflectivity peak assignments are shown in the EXPT E (REL) columns. All E (REL) entries except those in parenthe- columns in parentheses. ses are based on Slater exchange. The E (REL) entries in paren- (b ) The double group symmetry symbols follow the conven- theses are based on Kohn-Sham exchange. Experimental room tions of Ref. [23]. The band number is indicated in parentheses. temperature values are listed in the EXPT columns. Provisional The highest valence band is denoted by (5), and the lowest
RELATIVISTIC BAND STRUCTURE OF GeTe, SnTe, PbTe, PbSe AND PbS C 4 - 7 3
the A-type transitions are probably more important than the Z- and L-type transitions.
In examining Cardona and Greenaway's E,, E, and E, values for the IV-V1 compounds, Prakash [2] noted that these values are approximately in the ratio of 1 : 2 : 3 in most cases, but could not see any particular significance to the exactness of this ratio. In our view, the rough 1 : 2 : 3 ratio for E,, E, and E, in SnTe, PbTe, PbSe and PbS arises from the follo- wing two considerations : first, the interband sepa- rations between bands 4 and 5, 5 and 6, and 6 and 7 are nearly equal in the vicinity of the Z saddle points in these materials ; and second, interband transitions in this vicinity play an important role in establishing the E,, E, and^, reflectivity peaks, as noted in the preceding-three paragraphs.
The E, structure (weak reflectivity peak) appears to arise from bands 4 and 5 + band 6 transitions near X and along adjoining part of the A axis. Going by the correlation between theory and experiment (cf. table IV), we would place the 6.2 rather than the 5.4 eV peak in GeTe in the E, family.
The E, structure (weak reflectivity peak) appears to arise from several types of interband transitions, including band 3 -+ bands 9, 10 and 11 and band 2 + band 6 near the center of the zone, and band 3 + band 6 near the X points. The correlation bet- ween theory and experiment (cf. table IV) suggests that in GeTe, the 7.8 rather than the 6.2 eV peak belongs to the E, family.
We have not reached any definite conclusions regarding the origin of the E, structure (weak peaks at higher energies). However, the rise in reflectivity above 15 eV in the lead salts can be attributed to transitions form filled d bands to various conduction bands, as suggested by CG. (This suggestion is consis- tent with the location of the cation d bands, as can be seen from table 111.)
ElectroreJZectivity Spectra. If we take the position that electroreflectivity (ER) peaks are associated with
conduction band by (6). The C and A transitions refer to the saddle point transitions along the C and A axes. The theoretical E (REL) values for the C and A transitions are uncertain by about 0.1 to 0.2 eV (in some cases) because they were obtained hv interoolation. rather than bv direct calculation. - 2
(c) ~kferences [31] and [32].+ SCANLON (W. W.). J. Phys. Chem. Solids, 1959, 8,423, and
a l i i ~ e f s . [ l ] and [2]. (e) Reference [33]. Note that we are comparing our theoretical
results with reflectivity spectra, rather than with e z spectra, which are more closely related to the band structure. It should be borne in mind that corresponding reflectivity and E Z peaks may be displaced from one another by a few tenths of an eV, and, moreover, that the critical point transitions listed may lie a few
critical-point transitions, we are faced with the per- plexing problem of having to relate the rich ER spectra of the IV-V1 compounds, as measured by Aspnes and Cardona [35, 361 (see also Seraphin [37]), to the even richer assortment of critical-point transitions that our band calculations reveal at T, X, L, and W, along the C and A axes, and at more general points in the zone. If there is really an ER peak (including satellite struc- ture) associated with each of the critical-point transi- tions, where are the missing ER peaks ?
It is possible to, associate many of the experimental ER peaks with the more obvious and familiar critical- point transitions, but it is quite difficult to establish the uniqueness of these associations, at least within the framework of available experimental and theoretical information.
To the extent that our own band calculations appro- ximate the experimental situation, provisional assign- ments of some ER peaks can be made. These assign- ments are shown in parentheses in the EXPT columns of table IV. The E,-type ER peaks in PbTe (1 .l8 to 1.25 eV), PbSe (1.53 eV), and PbS (1.85 eV) are tentatively identified with Z5(6) - Z5(5), that is to say, with band 5 + band 6 transitions at the C saddle point. The next set of ER peaks [1.6 eV in PbTe; 1.78 eV in PbSe ; and 1.98 eV in PbS] are tentatively identified with Lz(7) - ~6+(5). While some of these assignments are identical to those made previously by Aspnes and Cardona [35] (who based their analysis on the pioneering pseudopotential band calculations of Lin and Kleinman [10]), we depart from Aspnes and Cardona in some important particulars. For exam- ple, we do not regard the 1.53 and 1.78 eV ER peaks in PbSe, or the 1.85 and 1.98 eV ER peaks in PbS, as a doublet associated with the spin-orbit split L, valence band levels.
In the case of PbS, our calculations show that the L, spin-orbit splitting is 0.04 eV (cf. table 11), while the experimental separation is considerably larger (0.13 eV). In the case of PbSe, our calculated L, spin-orbit
tenths of an eV above or below the corresponding EZ peaks. To call attention to these possible energy displacements, we have placed related theoretical and experimental values in different rows (These remarks do not apply to Eo.)
(f) Because of the switchover of L: and L; in SnTe, the E (REL) entries for SnTe in this section have been keyed to the band indices rather than to the symmetry symbols.
For complete consistency of notation, the reader should interchange the symbols L: and L; associated with bands 5 and 6 in SnTe. (These remarks do not apply to Eo.)
(g ) InRef. [33], the 6.2 and 7.8 evreflectivity peaks in GeTe are associated with E5 andE6 rather than with E4 and Es, as here.
(h ) References [35] and [36].
C 4 - 74 FRANCK HERMAN, RICHARD L. KORTUM, IRENE B. ORTENBURGER AND JOHN P. VAN DYKE
splitting (0.22 eV) is within striking distance of the experimental separation (0.25 eV), but our calculated transition energies (2.19 and 2.41 eV) are considerably larger than the experimental ER peaks energies (1.53 and 1.78 eV). If our interpretation is correct, the members of apparent spin-orbit split doublets in PbSe and PbS are actually associated with critical point transitions of nearly equal energy at different points in the zone (Z saddle point and L).
The critical point transitions associated with the main reflectivity peak (E,) in table IV may account for such ER peaks as the following : 2.0 and 2.2 eV in GeTe ; 1.9 and 2.2 eV in SnTe ; 2.2 eV in PbTe ; 3.0 and 3.3 eV in PbSe ; and 3.7 and 4.0 eV in PbS. These tentative assignments provide improved estimates of key critical point transition energies. More incisive interpretations of experimental reflectivity and electroreflectivity spec- tra await the completion of refined energy band and optical spectrum calculations now in progress [13].
IX. Concluding remarks. - To recapitulate, pro- visional energy band pictures have been obtained for GeTe, SnTe, PbTe, PbSe, and PbS by carrying out relativistic OPW band calculations at key points in the reduced zone, and then mapping out the band struc- ture in the remainder of the zone with the aid of an interpolation scheme. These first-principles energy band calculations lead to physically realistic band models which are sufficiently accurate to account for most of the characteristic features of the experimental reflec- tivity spectra. It is difficult to interpret the electrore- flectivity spectra unambiguously, but a number of plausible spectral assignments can be made. By compa- ring our provisional band pictures with the experimen- tal evidence, improved estimates have been obtained for some key interband transition energies. These estimates are currently being used in refined energy band and optical spectrum calculations [13]. It is anticipated that these refined calculations will provide more incisive interpretations of reflectivity and elec- troreflectivity spectra, as well as more precise informa- tion about the effective masses and other band edge parameters.
X. Acknowledgment. - The authors wish to thank Dr. Edmund C. Burke for his encouragement ; Professor Marvin L. Cohen, Dr. Kermit F. Cuff, Professor Walter A. Harrison, and Professor William Paul for many stimulating discussions ; and Dr. David E. Aspnes, Professor Manuel Cardona, Profes- sor Marvin L. Cohen, and Dr. Leo Esaki for sending copies of their papers in advance of publication.
Appendix
RELATIVISTIC OPW METHOD
The OPW matrix elements. - The OPW formalism can be directly extended to the use of relativistic wave functions [25]. We must use the 4-component solutions of the Dirac equation for both the plane waves and the atomic core states. We will assume a Slater-type exchange approximation. In Rydberg units the Dirac crystal Hamiltonian is
where g and B are 4 x 4 matrices [39], a is the fine structure constant, and V(r) is a superposition of atomic potentials centered on lattice sites R = d + f :
Let I p, s > be a plane wave spinor with wave vector p, reduced wave vector k, energy
and spin S. Let I a, k > be a tight-binding combi- nation of non-overlapping relativistic core wave functions characterized by a = {n, I, j, m, f), energy E,, and reduced wave vector k. Then the inner product of these two vectors is the orthogonality coefficient
An orthogonalized plane wave is just the plane wave minus the projection of all core states :
core
I P, k, S = I P, S > - a Aa(p, S) I a, k > .
One can immediately write down the expressions for the Hamiltonian and overlap matrix elements between two OPW's under the assumption that the core states are eigenfunctions of the crystal Hamiltonian
< p', k, S' ( H ( p, k, S > =
core
= p', S' I H l p, S > - A%(pl, S') Aa(p, S) E, a
< p', k, S' I J I p, k, s > =
core
= 6,,,, 6,,,, - C A%(P', S') S) . a
RELATIVISTIC BAND STRUCTURE OF GeTe, SnTe, PbTe, PbSe AND PbS C 4 - 7 5
Evaluation of the orthogonality coefficients. - The 2 dFn1j.f (r) + F . (r) evaluation of the orthogonality coefficients is straight- ! [E - - - vf(r)] ~ . ~ ~ ( r ) = - --
2 a2 dr n l ~ f r forward but tedious. In our notation, a plane wave spinor with wave vector p and spin s is a positive 2 energy solution of the Dirac equation with zero poten- dGnljf(r) + K
l j - Vf(r)] Fnljf(r) = --
tial 2 dr r
I p , s > =-- I u'"'(p) exp(2 nip • r) ~ ' 1 2
The orthogonality coefficient is
Aa(p, S) = < a, k l p7 S >
u'"'(p) = - 1 N 3 C exp(2 nik. d) X ~ 3 / 2 52112
A core band wave function is a superposition of Dirac- Slater-type atomic wave functions, ideally calculated in the crystal potential spherically averaged around the atomic site in question
1 N 3 I a, k > = ----- exp(2 nik.d) $,(r - d - f) . N3I2 d
The atomic wave function is of the form
for j = 1 + 112
for j = l - 1 1 2 , l # 0 .
G and F are the large and small components of the radial wave function and satisfy
X j $:(r - d - f) ~'"'(p) exp(2 nip-r) dr .
A simple change of variables gives
The integral is evaluated by expanding the plane wave in spherical harmonics and Bessel functions, using orthogonality to carry out the angular integra- tion, and recursion relations among the spherical harmonics to collect the terms. With the following definition for the radial integrals
the orthogonality coefficients take on a form very similar to the non relativistic case
1 Anljmf(p, +) = -- exp(2 nip-f) 4 nil X A 112
for j = 1 + 112
C 4 - 76 FRANCK HERMAN, RICHARD L. KORTUM, IRENE B. ORTENBURGER AND JOHN P. VAN DYKE
of identities among the spherical harmonics such as
The only difference comes from the projection of 1 the spin of the plane wave on the spin of the atomic X r(, PI[COS p)] - wave function.
The next step is to carry out the sums over m in the When all the terms have been collected the resulting Hamiltonian matrix element. This is done with the use expression for the Hamiltonian matrix element is
4 n core core
- a,,,, 7 C ex~[2 n i ~ ~ C') '11 E ( (1 + 1) pI[cos 801: d] C [E., 1 ++l C., I + +/(P) C., r + t f ( ~ / ) ~ 1
core
+ 1pI[cos 6(pt, P)] 1 I-+, c.1 ,-+,(P) C., I-, (P')] ]
4 n core
+ exp[2 ni(p - pf).f] 1 P;[cos 8(p1, p)] f 1
core
X E [Enll+tfCnit++fCu) Cnl1++f(~I) - E~IL-+~C~II-+~(P)C~~I-+~(P')I n l
where dPl(cos 8)
Pl(cos 6) denotes d cos 8 .
The overlap matrix element is similar, except it has no terms involving V(pl - p), and the energies are all replaced by 1. V(pl - p) is the Fourier transform of the full crystal potential and comes from the plane wave - plane wave part of the matrix element. The valence and conduction energy levels are the eigenva- lues of the matrix equation.
Note added in proof. - In this paper we have been concerned primarily with the overall band structure of the IV-V1 compounds, rather than with the detailed shape of the valence and conduction band edges. In view of the difficulties that many workers have encountered in attempting to determine the
exact nature of the principal and subsidiary band edges in these materials, it might not be out of place for us to make the following observations :
(a) As can be seen from figs. 1 through 5, there are apparent valence band maxima and conduction band minima along the A and C axes. As already mentioned on p. 71, these maxima and minima are not necessarily absolute extrema. In SnTe, for example, these maxima and minima actually define saddle points. Accordingly, the A and E maxima and minima are not necessarily subsidiary band edges in the same sense that the [l001 conduction band minima in GaAs are, for example. This possibility should be borne in mind in analyzing optical and electronic transport data.
(b) In some of the IV-V1 compounds, the A and C saddle points may lie only a few tenths of an eV
RELATIVISTIC BAND STRUCTURE OF GeTe, SnTe, PbTe, PbSe AND PbS C 4 - 7 7
below or above the principal valence and conduction band edges a t L. Since there will be ridges in the valence band between the A and saddle points on the one hand, and the L point on the other, the surfaces of constant energy will change from a simple ellipsoidal shape to a highly fluted or warped shape as one moves away from the L point. (Similar remarks can be made for the conduction band.) In order to account for some of the transport measurements, it may be necessary to treat the valence and conduction band edges in termes of constant energy surfaces which are ellipsoidal in the immediate vicinity of L, but which rapidly assume a warped form as one moves away from L.
References
[l] PUTLEY (E. H.), in Materials Used in Semiconductor Devices, edited by C. A. Hogarth (Interscience Publishers, New York, 1965), p. 71.
121 PRAKASH (V.), Division of Engineering and Applied Physics, Harvard University, Technical Report No HP-13, June 1967 (unpublished).
E31 DIMMOCK (J. 0.) and WRIGHT (G. B.), Phys. Rev., 1964, 135, A 821.
[4] CUFF (K. F.), ELLETT (M. R.), KUGLIN (C. D.) and WILLIAMS (L. R.), Proceedings of the International Conference on the Physics of Semiconductors, Paris, 1964 (Dunod, Paris, 1964), p. 677.
151 MITCHELL (D. L.) and WALLIS (R. F.), Phys. Rev., 1966, 151, 581.
161 JOHNSON (L. E.), CONKLN (J. B.), Jr., and PRATT (G. W.), Jr., Phys. Rev. Letters, 1963, 11, 538.
[7] CONKLIN (J. B.), Jr., JOHNSON (L. E.) and PRATT (G. W.), Jr., Phys. Rev., 1965, 137, A 1282.
[g] FERREIRA (L. G.), Phys. Rev., 1965, 137, A 1601. [g] RABII (S.), Phys. Rev., 1968, 167, 801 ; 173, 918.
El01 LIN (P. J.) and KLEINMAN (L.), Phys. Rev., 1966, 142, 478.
[l11 LIN (P. J.), SASLOW (W.) and COHEN (M. L.), Solid State Communications, 1967, 5, 893.
E121 COHEN (M. L.), TUNG (Y.) and ALLEN (P. B.), this volume (Session C2).
I131 HERMAN (F.) and VAN DYKE (3. P.), to be published. 1141 HERMAN (F.), KORTUM (R. L.), KUGLIN (C. D.)
and SHORT (R. A.), in Quantum Theory of Atoms, Molecules, and the Solid State, edited by P. 0. Lowdin (Academic Press, New York, 1966), p. 381.
1151 HERMAN (F.), KORTUM (R. L.), KUGLIN (C. D.) and SHORT (R. A.), J. Phys. SOC. Japan, 1966, 21, 7. (Kyoto Conference Supplement.)
1361 HERMAN (F.), KORTUM (R. L.) and KUGLIN (C. D.), Intern. J. Quantum Chemistry, 1967, l S, 533. (Sanibel Island Symposium Issue.)
1171 SHAY (J. L.), SPICER (W. E.) and HERMAN (F.), Phys. Rev. Letters, 1966, 18, 649.
1181 HERMAN (F.), KORTUM (R. L.), KUGLIN (C. D.) and SHAY (J. L.), in If- VI Semiconducting Com- pounds, 1967 International Conference, edited by D. G. Thomas (W. A. Benjamin, Inc., New York, 1967), p. 503.
[l91 HERMAN (F.), KORTUM (R. L.), KUGLIN (C. D.) and VAN DYKE (J. P.), in Energy Bands in Metals and Alloys, edited by J. T. Waber and L. H. Bennett (Gordon and Breach, New York, 1968), p. 19.
L201 HERMAN (F.), KORTUM (R. L.), KUGLIN (C. D.) and VAN DYKE (J. P.), in Methods in Compu- tational Physics, edited by B. Alder, S. Fernbach and M. Rotenberp. (Academic Press. New York, 1968), Vol. 8, 193: '
[21] HERMAN (F.) and SPICER (W. E.), Phys. Rev., 1968, 174. [October 16 issue.]
[22] HERMAN (F.), KUGLIN (C. D.), CUFF (K. F.) and KORTUM (R. L.), Phys. Rev. Letters, 1963, 11, 541.
[23] ELLIOTT (R. J.), Phys. Rev., 1954, 96, 266, 280. 1241 L o u c ~ s (T. L.), Augmented Plane Wave Method
(W. A. Benjamin, Inc., New York, 1967). 1251 SOVEN (P.), Phys Rev., 1965, 137, A 1706. [26] LIBERMAN (D.), WABER (J. T.) and CROMER (D. T.),
Phys. Rev., 1965, 137, A 27. 1271 HERMAN (F.) and SKILLMAN (S.), Atomic Structure
Calculations (Prentice-Hall, Inc., Englewood Cliffs New Jersey, 1963).
[28] BOYD (R. G.), LARSON (A. C.) and WABER (J. T.), Phys. Rev., 1963, 129, 1629. See also Ref. 26.
[29] ANIMALU (A. 0. E.), Phil. Mug., 1966, 13, 53 ; G. Weisz, Phys. Rev., 1966, 149, 504 ; SARAVIA (L. R.) and BRUST (D.), Phys. Rev., to bepublished.
1303 DIMMOCK (J. O.), MELNGAILIS (l.) and STRAUSS (A. J.), Phys. Rev. Letters, 1966, 16, 1193.
[31] ESAKI (L.), J. Phys. Soc. Japan, 1966,21, 589. [Kyoto Conference Supplement.]
[32] Tsu (R.), HOWARD (W. E.) and ESAKI (L.), Phys. Res., 1968, 172, 779.
[33] CARDONA (M.) and GREENAWAY (D. L.), Phys. Rev., 1964, 133, A 1685.
[34] SPICER (W. E.) and LAPEYRE (G. J.), Phys. Rev., 1965,139, A 565 ; B. H. Sacks and SPICER (W. E.), Bull. Amer. Phys. Soc., 1965, 10, 598.
1351 ASPNES (D. E.) and CARDONA (M.), Phys. Rev., 1968, 173, 714 (PbS, PbSe, PbTe).
[36] ASPNES (D. E.) and CARDONA (M.), Bull. Amer. Phys. Soc., 1968, 13, 27 (GeTe, SnTe).
[37] SERAPHIN (B. O.), this volume (Session B 2). [38] GOLDAK (J.), BARRETT (C. S.), INNES (D.) and You-
DELIS (W.), J. Chem. Phys., 1966, 44, 3323; see also COHEN (M. H.), FALICOV (L. M.) and GOLIN (S.), IBM Journal of Research and Deve- lopment, 1964, 8, 215.
[39] ROSE (M. E.), Relativistic Electron Theory (John Wiley and Sons, Inc., New York, 1961).