relative humidity and temperature pattern book - … · relative humidity and temperature pattern...
TRANSCRIPT
Museums & Galleries Commission
Relative Humidity and
Temperature Pattern Book
A guide to understanding and using data on the museum environment

The Museums & Galleries Commission (MGC) is the national advisory body for museums in the United Kingdom. It promotes the interests of all museums and galleries and undertakes strategic work to raise museum standards. The MGC provides expert and impartial advice to museums and others and advises the Government on museum policy. Through its work the MGC aims to encourage as many people as possible to visit and enjoy the nation's museums and galleries. Find out more about the MGC by visiting our website at www.museums.gov.uk.
Copies of this publication can be provided in alternative formats upon request. Please contact MGC Publications on 020 7233 4200 for further information. © Museums & Galleries Commission 16 Queen Anne's Gate London SW1H 9AA First published in 2000 ISBN 0 948630 88 4 Printed by James Stewart

Relative Humidity and Temperature Pattern Book
A guide to understanding and using data on the museum environment May Cassar and Jeremy Hutchings


3
Contents
Introduction
4
Chapter 1 RH and Temperature Monitoring Equipment in Museums
5
Chapter 2 How to Improve Equipment Reliability and Data Quality
10
Chapter 3 Examples of Different Ways of Presenting Data
13
Chapter 4 How to Standardise Data Gathering
17
Chapter 5 Influences That Can Affect the Readings
19
Chapter 6 Graphical Representation of Different Environmental Conditions
20
Chapter 7 Using the Psychrometric Chart to Help Interpret Data
27
Chapter 8 Examples of Good Data Recording
32
Chapter 9 Examples of Poor Data Recording
36
Conclusion 39 Further Reading 40

4
Introduction In order to manage the environment, we should begin by trying to understand how objects respond to ambient relative humidity (RH) and temperature changes. Collections respond in various ways and at different speeds to the amount of moisture and heat in the air Very damp conditions encourage mould and fungal growth. Absorption of moisture by objects made of plant or animal material (organic) makes them swell. As conditions dry out, this has the opposite effect, causing shrinkage. Organic objects may be made up of a combination of different materials, each of which will respond to moisture in a different way. The dimensional changes in different materials cause internal stresses, leading to cracking and failure of joints. Fragile objects with a layered structure, such as ivory or veneered furniture, behave in two ways: they can expand and contract at different rates lengthwise and widthwise. This has the same effect as if the object was made of different materials. Objects that are metallic or mineral in nature react in different ways to changes in RH and temperature. Excessive RH causes corrosion such as rust in iron, pyrite disease in fossils, or leaching in glass, which causes droplets to form on the surface. Museums must record changes in the environment within their buildings in order to gauge the level of environmental stress to which objects are subjected. This requires monitoring equipment capable of recording relative humidity and temperature over time. RH and temperature monitoring equipment is designed to respond to environmental changes in a similar way to the materials from which objects are made. The fact that a recording thermohygrograph registers RH changes through expansion and contraction of human hair, and temperature changes through the response of a bimetallic strip, is no accident. The result is that we are not only interested in the absolute values of data that are recorded. We are also interested in the rate or speed of change that occurs, and because
different materials, whether objects or monitoring devices, respond to changes over time, we sometimes detect a slight hysteresis, or time delay between cause and effect - between a change in conditions and the response of the material to the change. The aim of these Guidelines is to help museums make the most of the environmental data they collect. Without understanding the information contained in the data, monitoring becomes a pointless task that does not benefit the collection. If fresh data is not analysed, its usefulness – like fresh food which becomes stale - decreases with time.
5
Chapter 1
RH and Temperature Monitoring Equipment in Museums The selection of RH and temperature monitoring equipment in museums is always a compromise. The main constraints are money, availability of equipment and staff time. Additionally, for datalogging equipment, ease of wiring or telemetric signal reception is of practical importance. Before buying equipment, those responsible for monitoring should have a clear idea of how many or how few instruments are required to give a typical profile of the environment in the area of interest. The area could be a store, a gallery or both, plus another instrument for monitoring external conditions. How much staff time can be dedicated to monitoring and any future plans for physical changes in the museum must also be considered. It is advisable to write an environmental monitoring plan. This should include what data is needed and why, where to locate the monitoring equipment, what training is required in order to make full use of the equipment and an outline budget. Different types of monitoring equipment can be grouped into categories, depending on the means (chemical, mechanical or electronic) by which a reading is registered. Monitoring is carried out in different ways under each of these categories. A chemical reaction resulting from the interaction of cobalt salt with ambient humidity, for example in an indicating card, produces a colour change in the salt. Mechanically driven equipment consists of mutually dependent moving parts working together in response to external change, such as fluctuating RH or temperature. Electronic equipment is driven by the movement of electrons in a semiconductor, for example the circuit in a sensor which reacts to changes in ambient RH and temperature conditions. A range of equipment of varying ease of use, quality and price is usually available in each category.
The following tables summarise the type of equipment, calibration methods and typical uses of equipment by museums

6
Categories of equipment
Spot Readings� Recorded Data�
Chemical:
Humidity indicator cards
Mechanical: Dial thermohygrometers Thermohygrographs (drum or disc): clockwork, motorised
Whirling hygrometers
Aspirated hygrometers
Thermometer (standard, maximum and minimum)
Electronic: Thermohygrometer with digital display Datalogger: standalone, hardwired, telemetric
Note: 1. Spot readings require a note to be made of the reading, even though equipment may be registering a reading continuously. 2. Recorded data are plotted independent of human action, but they need to be collected periodically and interpreted.
Calibration methods available to museums • Dewpoint meter • Saturated salt solutions in a humidity chamber • Whirling and/or aspirated hygrometer
Strengths and weaknesses of both calibration methods
Equipment Strengths Weaknesses
Dewpoint meter
Accurate Gives absolute measurements
Difficult to use Gives a reading which requires interpretation Cannot be used near objects Expensive
Saturated salt solutions in a humidity chamber
Accurate Difficult to use Salts may 'creep' Can contaminate objects and instruments Only capable of specific RH values within confined spaces
Whirling and/or aspirated hygrometer
Accuracy depends on precision of user Whirling can take getting used to! Aspirated hygrometer is costly Both only provide spot readings

7
Typical museum use of monitoring equipment
Type Use
Aspirated hygrometers Spot checks of rooms Calibration of mechanical thermohygrographs
Datalogger (electronic, hard-wired) Fixed continuous monitoring of rooms and cases from a central point
Datalogger (electronic, standalone) Continuous monitoring of rooms and cases
Datalogger (electronic, telemetric) Flexible wireless monitoring of rooms and cases from a central point
Humidity indicator cards Chemical indication of humidity within microclimates in small cases, boxes or cabinets
Thermohygrometer (dial) Continuous unrecorded readings within rooms and cases
Thermohygrometer (electronic with digital display) Spot readings within rooms and cases Checking of mechanical thermohygrographs, but it needs to be in calibration itself At the cheaper end of the range, tend not to be very accurate
Mechanical thermohygrographs Continuous directly recorded monitoring of rooms
Thermometer (maximum/minimum) Spot readings and maximum and minimum readings of temperature
Thermometer (standard) Spot readings of temperature
Whirling hygrometers Spot checks of rooms Calibration of mechanical thermohygrographs

8
Strengths and weaknesses of each type of equipment
Equipment Strengths Weaknesses
Aspirated hygrometers Medium cost Reliable results Accurate Mains/battery/clockwork drives available
Difficult to read Easily damaged Contains mercury Large and heavy Requires regular servicing Requires distilled water Gives spot readings only
Dataloggers (electronic, hard-wired) Medium cost Can keep calibration well Can be used to measure closed environments Permanently connected to a computer
Installation of wiring can be difficult and disruptive System may be inflexible
Dataloggers (electronic, standalone) Low to medium cost Keeps calibration well Can be used to measure closed environments Can be easily moved around
Requires connection to a computer to download data
Dataloggers (electronic, telemetric) Keeps calibration well Can be used to measure closed environments Continuously downloading data Sensors can be easily moved around
Additional cost of transmitter and receiver Suffers from radio signal loss Additional electronic components to fail
Humidity indicator cards Very cheap Can be read through the wall of a polyethylene box
Limited to a number of ranges Deteriorate with age, fail to give correct readings Difficult to interpret

9
Thermohygrometer (dial) Easily read
Low cost Can be used to measure closed environments
Moves out of calibration easily Only provides spot readings May be visually obtrusive Slow response time
Thermohygrometers (electronic with digital display)
Easy to read Can be read from a distance Can keep calibration well Can be used to measure closed environments Quick response time
May be visually obtrusive Only provides spot readings
Mechanical thermohygrographs Medium cost Easy to interpret Can be read instantly Easy to calibrate
Can go out of calibration Pens may leak or dry out Suffers from vibration and knocks Charts which have rotated more than once can be difficult to read Slow response time
Thermometer (maximum/minimum) Low cost Easy to read Records maximum and minimum temperature
Easily broken Contains mercury
Thermometer (standard) Low cost Easy to read
Easily broken Contains mercury Only capable of spot readings
Whirling hygrometers Low cost Accurate (depending on the operator)
Difficult to read Easily broken Contains mercury Requires physical effort Results can be unreliable Requires distilled water Gives spot readings only

10
Chapter 2
How to Improve Equipment Reliability and Data Quality
Selecting equipment for reliability
Factors directly affecting equipment reliability are:
• Lack of calibration • Pens colliding or failing to cross • Clocks not wound up or spent batteries left unchanged • Charts not being replaced and endlessly rotating • Electronic sensors being moved from a cold to a warm environment
causing condensation to form and sensor to malfunction • Human failing
Reasons for environmental monitoring in museums include:
• Finding out if an area or a case has a suitable environment for specific materials
• Investigating the source of an environmental problem • Establishing whether the building is in sound condition • Monitoring the effectiveness of a control system • Operating control equipment (e.g. humidistats, blinds) • Providing evidence that the museum's conditions are suitable in order
to borrow objects for exhibitions • Providing information to funders on conditions in the museum
It is important to recognise the factors that will influence equipment reliability and data quality, and to take steps to control them. First of all, we must select appropriate equipment for the type of monitoring task ahead. We must therefore have a clear understanding of what we want the equipment to do, how much time we are prepared to give to monitoring and data interpretation and what we can afford. These steps will also help us use any inherited equipment to its full capacity and to recognise any limitations it might have from the point of view of the monitoring task we wish to set up. Next we can control the reliability of the equipment and the quality of the data by understanding it and operating it correctly, following the manufacturers' instructions. Many instruments, particularly mechanical equipment, have a non-linear response. This limits their accuracy to between 25% and 75% RH. Non-linearity is not necessarily a problem with electronic equipment.

11
• Clocks that have stopped or with spent batteries failing to record readings over time. They will only provide maximum and minimum readings from the time they cease to operate.
• Charts that are allowed to rotate a number of times, providing traces that are difficult to read. They cannot be correlated to past events.
• Clocks not keeping good time, making it hard to interpret if set to the longest (90-day) recording cycles.
Even simple devices are not immune to inaccuracies. Whirling hygrometers will be affected by local air movement and heat sources, ill-fitting or contaminated wicks, the operator's fitness to 'whirl' the instrument and body moisture such as sweat.
Selecting equipment for data quality
Factors which affect data quality are:
• Patchy coverage of the previous year's monitoring • Inexplicable events: sun shining on equipment, visitors touching or
breathing on equipment • Unlabelled data • Relying on spot checks rather than continuously recorded data • Using averages rather than minimum and maximum readings
All equipment should undergo a full service annually. Any equipment that is regularly subjected to RH in excess of 80% could itself suffer from corrosion, thus causing components to malfunction. Equipment that is subjected to a dusty or dirty environment will also fail to give accurate readings over time. Equipment that is not checked regularly for accuracy will give readings that drift. This will give a false record of the average as well as maximum and minimum conditions. The accuracy of instruments that use electronic sensors also tends to drift with time. Instruments that are not calibrated regularly, for example no less frequently than every six months, cannot be relied upon to provide accurate readings. Electronic dataloggers that communicate using radio signals (telemetrically) can suffer from radio interference or failure to receive command signals. Electronic dataloggers collect large volumes of data, so care must be taken when using computer software to analyse data, as it can compensate automatically for data which is missing because of interrupted signals. Any device that relies on the physical changes in materials in response to ambient humidity, such as the hair in dial hygrometers or recording thermohygrographs, will be slow to respond to changes in RH and will be sensitive to vibration. The greater the speed and range of relative humidity and temperature fluctuations, the less accurate and reliable mechanical instruments such as thermohygrometers and thermohygrographs become. Under these conditions these instruments should be checked visually for correct operation at least once a week, and their calibration checked on a monthly basis. Among the points to note on the thermohygrographs are: • Pens on arms that collide or fail to cross, giving inaccurate readings
as the pens move up and down together and because the pens have to jump over the chart's retaining strip.
12
The aim of every long-term monitoring programme should be to use the best affordable equipment in order to measure, record and interpret data, and, if necessary, to modify the climate as required for collection care. Environmental monitoring is usually a compromise between what RH and temperature can realistically be monitored and what ideally should be monitored. Given the wide range of available equipment, choosing the most suitable equipment may well be daunting. This can be made less so if the earlier table on the strengths and weaknesses of each type of equipment is used as a guide. Following this, the factors that affect reliability and data quality will need to be assessed. The following charts give an indication of the kind of problems that could greatly reduce the value of collected data. It is worth spending some time putting in place measures to reduce these problems. One important safeguard is training. Staff should be able to recognise signs that environmental monitoring and control equipment is not operating and to be able to take steps to rectify faults promptly. The use of a monitoring system independent of the environmental control system is invaluable, notably because it will help to highlight malfunctions that may otherwise go unnoticed. Independent monitoring may have purposes other than diagnosing faults in a system. Monitoring may help to identify and profile the environment and thus highlight its strengths and weaknesses. Once this is achieved, monitoring may continue as an activity which demonstrates good practice in collection care.
Finally, when collecting and analysing environmental data, you should always be aware of both its quality and limitations. Any fault in the environmental monitoring equipment or any event that affects the environmental conditions should be noted, either in a separate diary or on the data sheet itself. Equally important, is that the information extracted from the data should not be more detailed than that which the data is capable of supporting. In simple terms, if the monitoring equipment is accurate to only ±5%, then analysis within a 10% band could be meaningless.

13
Chapter 3
How to Improve Equipment Reliability and Data Quality Environmental data can be collected and presented in a variety of ways. The important points to remember are the ease with which data can be understood at a glance and the ease with which detailed interpretation can be carried out. Each method does have its strengths and weaknesses. This section provides examples of the more common ways of presenting data and a brief critique of each method.
List of numbers (raw data) These consist of RH and temperature data that are manually recorded or computer-generated and listed as a table. Strength: • Easy to calculate average and mean conditions, if the
plots are frequent enough. Otherwise, spot readings averaged in this way may be incorrect.
Weaknesses: • Spot readings often plotted at too long an interval
between individual readings • Does not give an accurate indication of conditions • Difficult to establish a trend • Difficult to interpret quickly

14
Hand-plotted graphs These consist of RH and temperature data that is manually recorded and plotted against time in the form of a graph. Strengths: • Easier to interpret than tables • The act of plotting involves a simple form of analysis and
interpretation Weaknesses: • Spot readings often not plotted at frequent enough intervals • Graphs can be poorly plotted • Errors in transferring numbers from tables to graphs can occur • If plotted directly, and not from a table, any errors cannot be
checked at a later date
Drum thermohygrograph charts Readings are plotted directly onto chart as the drum rotates. The X and Y axis are straight lines when the chart is laid flat. Strengths: • Easy to interpret at a glance • Can be examined any time while recording • Continuous recording • Commonly used and understood
Weaknesses: • Can be difficult to analyse data, other than the occurrence of
out-of-range conditions • Charts are too long to store in A4-sized files • Pens give too faint a line • Charts deteriorate if not properly stored
15
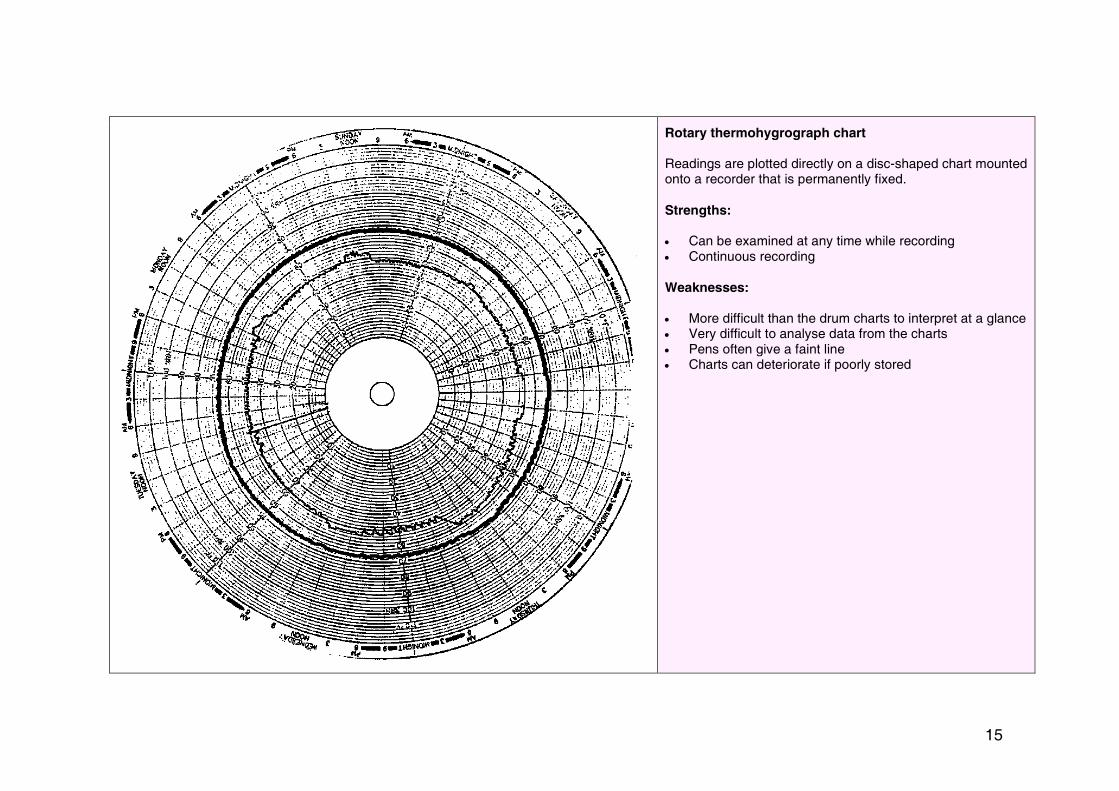
Rotary thermohygrograph chart Readings are plotted directly on a disc-shaped chart mounted onto a recorder that is permanently fixed.
Strengths: • Can be examined at any time while recording • Continuous recording Weaknesses: • More difficult than the drum charts to interpret at a glance • Very difficult to analyse data from the charts • Pens often give a faint line • Charts can deteriorate if poorly stored

16
`
Computer-generated graphs Graphs created by using dedicated software associated with datalogging systems. Strengths: • Graphs can be easily manipulated • Graphs can be superimposed for comparison • Graphs can be joined for trend examination • Maximum, minimum and mean conditions can be easily
calculated • Versatile: graphs can be expanded to enable details to
be examined • Data does not deteriorate unless drive crashes or disc is
corrupted Weaknesses: • Require computer literacy to operate • Limited to quality of computer programme • Loss of information if memory is corrupted • Graphs can be manipulated to give misleading
interpretation of conditions • Difficult to standardise time intervals between systems
17
Chapter 4
How to Standardise Data Gathering The previous section demonstrated that RH and temperature data can be more easily and quickly understood when the information is plotted as graphs instead of a long list of numbers. All thermohygrographs and datalogger computer programmes plot graphs automatically. • Thermohygrograph charts are normally fixed to 1-day, 7-day, 30-day
and 90-day intervals depending on the setting of the mechanism of the equipment. Standardisation to make data comparison easier is built into thermohygrograph charts.
• Computer-generated graphs, on the other hand, can be expanded or contracted to cover any interval or range of readings. When the computer software is allowed to choose its own scale automatically, the intervals are often expressed as fractions of days or hours. This should be corrected to read whole days or hours, as whole numbers are easier to understand.
Too much versatility can make interpreting RH and temperature changes difficult, particularly if different dataloggers or data from different years are compared. When the graphical scale is expanded or contracted too much, it distorts the readings thereby making it difficult to obtain a clear overview of environmental trends. Conditions can also be made to look better or worse by changing the scale, which can lead to a misunderstanding of the conditions which exist. The following checklist should help in setting up thermohygrographs or manipulating computer-generated graphs correctly.

18
Checklist to help set up thermohygrographs and computer-generated graphs • Start the recorder on the correct day
• Give the graph a title e.g, Gallery One RH and Temperature for June 1998
• Name the units of measurement e.g. percentage RH and degrees Celsius
• Label lines and axis e.g. RH and temperature
• Indicate the location where data has been recorded and it necessary the date and time
• Decide on the scale of each and ensure that it is used consistently for all graphs
• Always ensure scales are represented by whole numbers which are easy to interpret such as 1.00, 2.00, 5.00, 10.00
• Use a standard range such as 7-day or 30-day
• If monitoring for a period of time, stick to the same time axis scale e.g 7-day 10 day, etc.
• Always print comparative data using the same scale
• Never reduce the original chart size when photocopying
• Try to plot the graph as large as possible within the printed page
• Deride on upper and lower warning limits and upper and lower action limits
• Always draw line to mark these limits using straight lines across the graph
• Mark these limits in different line types e.g. continuous, dashed etc. to prevent confusion if the graphs are photocopied. This also applies to RH and temperature curves
• Record average conditions as a legend on the side of the graph
• Do not represent more than three different, parameters on the same graphs e.g, RH temperature and CO2
• Write on the graph any special events, accidents and breakdowns which appear as blips on the chart for future reference
• Record the serial number of the equipment in the legend or title to help identify equipment if a fault is detected at a later date
• Initial any charts or tables so that the operator can be identified in the future

19
Chapter 5
Influences That Can Affect the Readings
Apart from factors relating to the inherent reliability of equipment which was discussed in an earlier section, there are other influences that can affect the data we collect. These are generally the location of equipment in the area to be monitored, conditions which represent extreme rather than typical environments and the use of and activities within the area being monitored. It is important that these influences are borne in mind when setting up monitoring equipment in order to improve the chance of collecting representative readings. Opposite is a list of common problems that can inadvertently affect the quality of the data:
• Location of equipment not representative of the location of objects • Equipment that is easily accessible for data retrieval may mean that it
is not tamper-proof • Location of equipment in a room with external walls • Location of equipment in or near work that produces dust and
vibration • Doors that are routinely propped open when they should be shut • Windows, roof-lights which can be and are open • Presence of large glazed areas that can cause a room to overheat • Sunlight that falls across the equipment • Equipment located in draughty conditions • No record being kept of the previous day's weather • Temperature changes between daytime and night-time • Servicing and maintenance of RH and temperature control equipment
during the monitoring period • Overcrowding a problem • Wet cleaning of floors and other surfaces • Room hired or used for events such as concerts and receptions

20
Chapter 6
Graphical Representation of Different Environmental Conditions Relative humidity and temperature graphs are a record of the conditions experienced in the environment around objects whether on display, in storage or in any other use. These graphs often form typical traces that will be familiar to everyone routinely involved with monitoring and data analysis. It is inevitable that conditions will sometimes stray from what is expected. This is a good reason for ongoing monitoring, which is essential for good practice in collection care. On these occasions, even an experienced operator can be baffled by the cause of an unusual or unfamiliar departure from what is considered a normal trace. While the information contained in the earlier section should help eliminate the more easily controllable causes of environmental changes, the following graphs are intended to illustrate and explain some of the more unusual ones. Used as a pattern book of samples, these graphs should help everyone trying to work out the likely cause of the conditions the monitoring equipment has recorded. They could be used as the start of a process of elimination of possible causes, thus helping to focus on what might be the actual cause of the unacceptable conditions.

21
External conditions compared to internal conditions These two charts show how the building and its environmental control system, notably heating and dehumidification, can moderate the external environment. The RH and temperature extremes have been narrowed, although the temperature is more stable than RH something which is easier to achieve. RH stability could be improved by checking the operation and maintenance of the equipment providing humidity control and, if the problem persists, checking whether any building fabric improvements such as a reduction in air infiltration or improvements in insulation are necessary. Dataloggers were used to produce this data.
Air conditioning working as it should Air conditioning is controlling relative humidity in the gallery at 50% and temperature at 20°C. Normal influences such as air infiltration and occupancy means that the air conditioning plant has been sized correctly and is working hard to achieve stability. The control band appears to have been set correctly (i.e. not too narrowly) since no overshooting or undershooting of the defined band has occurred. A thermohygrograph has been used to monitor conditions.

22
Air conditioning unable to cope with drying out of building Construction or refurbishment work often has associated 'wet work' which needs time to dry before occupation. Water vapour is released and the moisture content of the air - its absolute humidity - increases. If objects are introduced too quickly into a space, damage can occur. The chart shows that the control sensors are maintaining conditions within the set design limits, i.e. ± 5%. However there is still an underlying cause of instability: is drying the cause? Further analysis is needed. By plotting .absolute humidity (AH) and comparing it to RH, if both rise and fall together, the cause of instability can be attributed to excess moist NIP. Modern software plots this graph automatically. This is discussed in more detail in Chapter 7. Dataloggers were used to monitor conditions.
Blip or plant closed down due to maintenance Often environmental control is entirely dependent on equipment to maintain appropriate conditions. Without a building which has a buffering capability or supplementary portable equipment, the environment changes rapidly when the control system is shut down. The chart shows that this occurred between May 14th- 17th. This rapid change can place stress on objects that can lead to damage. A computerised system was used to monitor conditions.
23
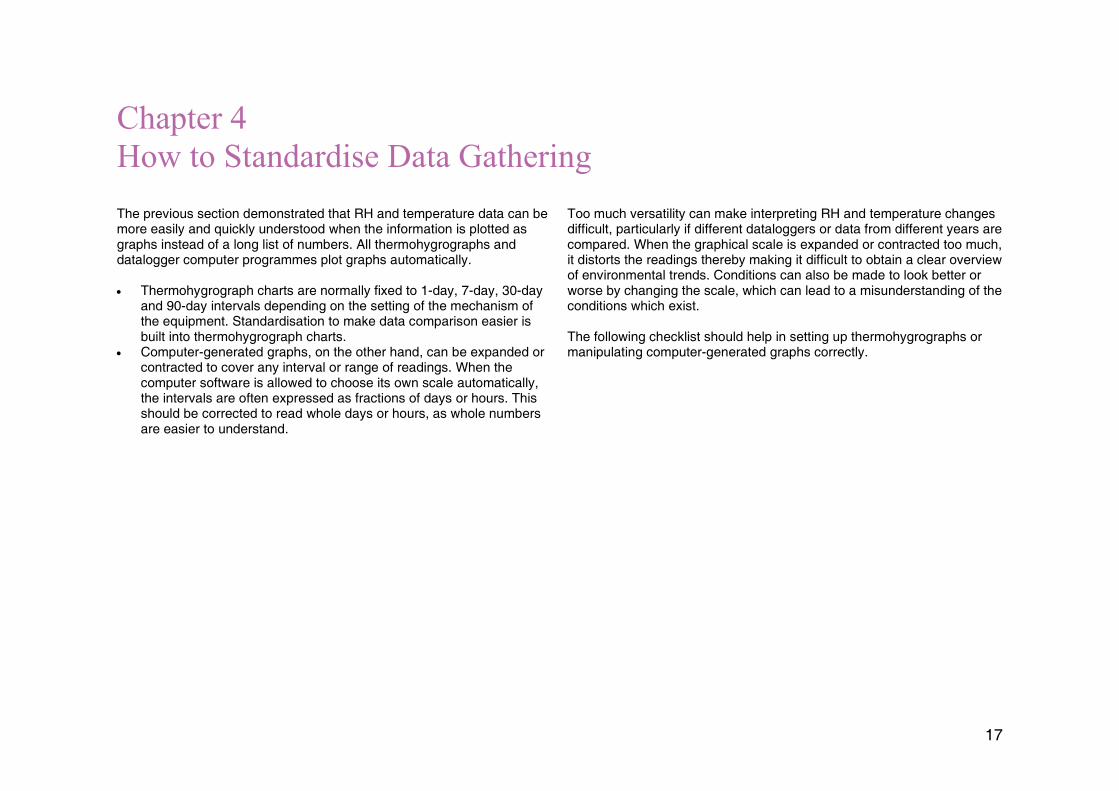
Gallery closed for a period of time Gallery closure can have one of two effects. If the environmental control systems are switched off and the building has a high air infiltration rate and/or low insulation, the internal environment will rapidly change to track external fluctuations. If the gallery is well sealed and well insulated then there will be a slow change in the internal environment until conditions similar to the external average are reached. This graph shows a typical example of heating being switched off over Christmas followed by a steep drop in temperature (where it reads 'Christmas closing 16/12/96' on the graph). It should be noted that the sharp drop in temperature had little impact on RH. In this situation it is worth checking whether humidification equipment was also turned down over Christmas. A reduction in absolute humidity would explain the little impact that turning down the temperature had on RH. A datalogger was used to produce this data.
Gallery daily opening and closing The influx of visitors and the opening and closing of doors during opening hours can have a detrimental effect on the environment within a controlled space. This graph shows how an environment which is stable overnight between 18.00 and 10.00 when the gallery is closed, is disrupted during the day through normal usage. A computerised system was used to monitor conditions.

24
Effect of heat gains: from windows Direct sunlight through unprotected windows can have a dramatic effect on a gallery's environment. The graph shows a sharp peak in temperature and a corresponding drop in humidity caused by radiant heat from sunlight Note the slight time delay effect which is characteristic of this equipment Localised heating and high light exposure is extremely damaging to all museum objects. A thermohygrograph was used in this instance.
Effect of DX system or of a system which has not been properly set up The main impact of temperature fluctuations on museum objects is their effect on relative humidity. Cooling and dehumidification by a direct expansion (DX) coil is done by switching between the 'on' and 'off' position, without overcooling trimmed by the reheat coil. This is standard practice for this type of equipment but it generates a 'sawtooth' graph. It is also possible that the temperature control set points have been set too close together A datalogger was used to produce this graph.
25
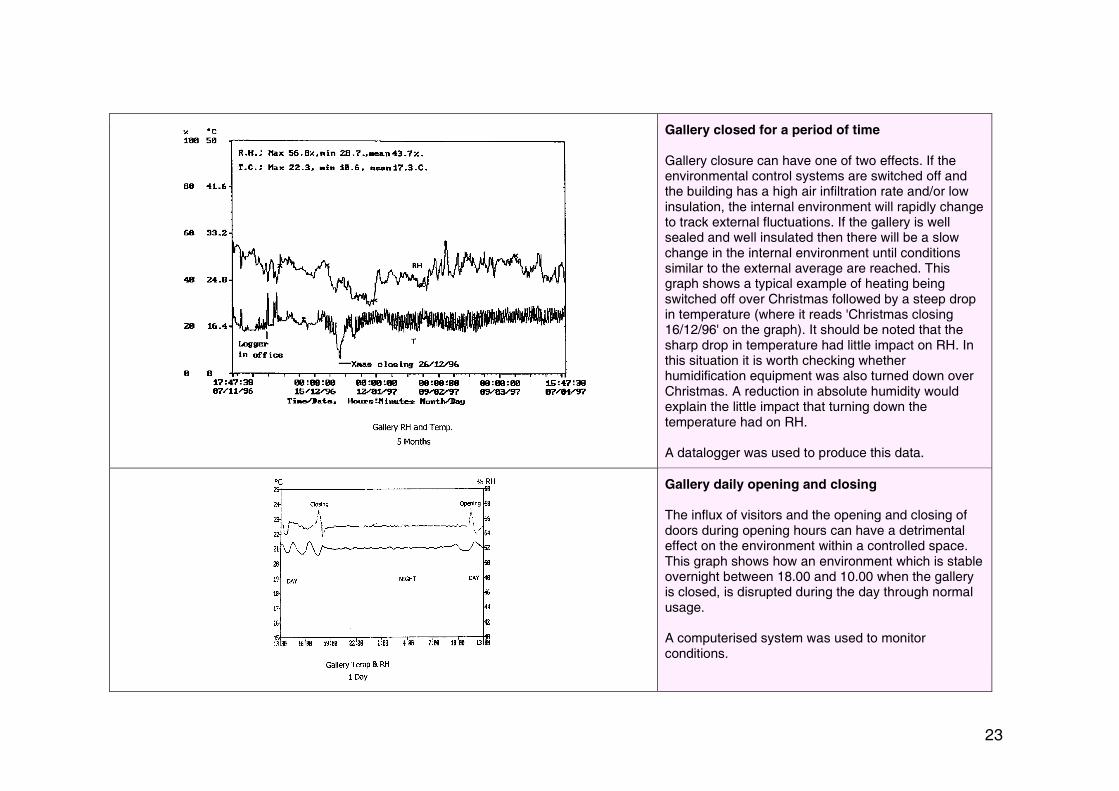
Effect of moisture gains: overcrowded rooms due to an event Overcrowding in galleries can have a rapid and extreme effect on the environment, causing a rise in both RH and temperature. Other contributory factors may be the use of flowers and the serving of food and drink. This example shows a notable RH increase of over 20% and a less significant increase in temperature during a gallery opening reception. The graph shows that although the reception lasted a few hours, RH had not returned to its previous value until well into the following day. A computerised system was used to monitor conditions.
Effect of moisture gains: wet cleaning The sudden introduction of water from cleaning of gallery floors can have a dramatic but short-lived effect on the internal environment. This example shows a dramatic rise in RH from 55% to over 70%, which lasts for about half a day. This may be sufficient time to cause damage to delicate objects such as ivory or wood veneers. It is always advisable to look broadly at what might cause a sudden change. Failure of equipment to perform may not always be to blame. Unlike the previous graph, wet cleaning is not normally linked to a corresponding rise in temperature as there is usually no heat input A thermohygrograph was used to produce this graph.
26
Use of portable humidifiers/dehumidifiers
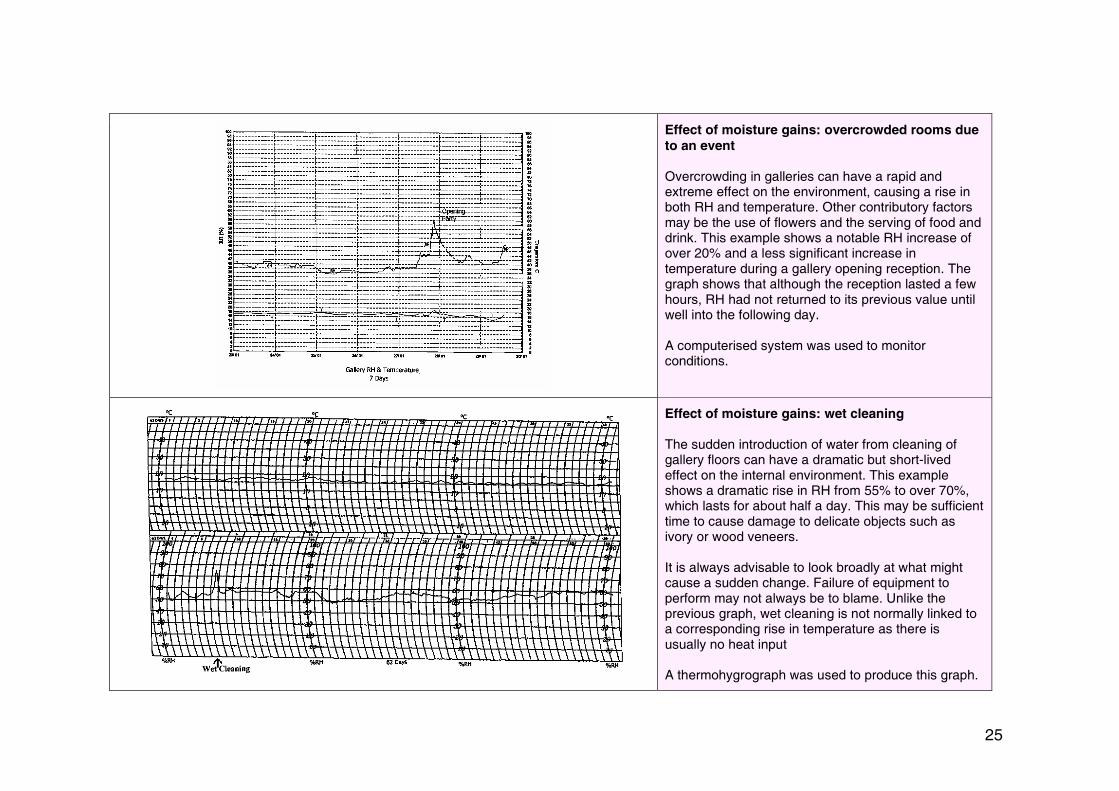
The use of portable humidifiers and dehumidifiers that are independently set to operate together can cause the environment within an enclosed space to fluctuate rapidly over a narrow range. This example shows an RH that is being controlled between 52% and 58%.The rapid swings are caused by a small time delay in the control circuitry of each device. Rapid environmental fluctuations of this scale and frequency are not thought to be damaging to museum objects but can wear out the controllers in the equipment.
Microclimates compared to ambient conditions
Where ambient conditions within a gallery are uncontrolled and fluctuate in excess of acceptable limits, museum objects can be protected within cases using a buffer material to create a microclimate. This example shows the RH within two showcases (vitrines, on the graph) compared to fluctuating RH in the gallery. Since RH in vitrine 1 in particular follows to some degree room RH, every attempt should be made to stabilise room conditions or to seal the case better.

27
Chapter 7
Using the Psychrometric Chart to Help Interpret Data The psychrometric chart is a tool that combines a set of graphs onto a single chart. It plots the relationships between dry bulb temperature, air pressure and absolute humidity, or sometimes vapour pressure, to enable relative humidity curves to be defined.
Different points on the psychrometric chart represent the environmental conditions that will prevail if the same combination of relative humidity and temperature are found to exist through monitoring. So in highlighting these points on the psychrometric chart we will see that the lower left-hand corner of the chart (1) represents cold and dry conditions because both absolute humidity and temperature must be low for these conditions to exist, On the other hand, hot and dry conditions are found at the lower right hand corner of the chart (2), because while absolute humidity is low, the temperature (read along the bottom axis) has increased. If we want to locale the point where hot and humid conditions are represented, we would have to look at the top right-hand corner of the chart (3) where both absolute humidity and temperature and high. Cold and humid conditions are represented in the upper left-hand corner of the chart (4) where absolute humidity is high but temperature is low.
By plotting a summary of the collected data onto a psychrometric chart, we can achieve a number of results: • A comparison between external and internal conditions; • A clearer idea of the difference between existing internal conditions and the conditions we would like to achieve; • An idea of the measures that will be needed to achieve the desired conditions. What follows is a step-by-step guide on how to transfer information from monitored data onto a psychrometric chart for analysis.

28
• Analyse the internal monitoring data weekly for a continuous 12-month period.
• Mark the maximum and minimum RH and temperature readings on the weekly charts, as discussed earlier. This enables a quick and regular check of how far conditions have strayed from the average.
• Obtain a clean copy of a psychrometric chart. The Chartered Institution of Building Services Engineers (see address at the back) sells pads of psychrometric charts. You do not need to be an engineer to buy them!
• Plot on the psychrometric chart the monthly average external weather data for a 12 month period of the area local to the museum. External conditions should ideally also have been monitored by the museum.
• If this data is not available external data can be obtained from the Meteorological Office's publication Climatological Memorandum 103. August 1976, which contains numerous tables. The key information you require is date/time, dry bulb temperature readings (January to December) and yearly average, together with relative humidity January to December) and yearly average. You will know that you have plotted the information correctly when the 12 points are joined up to form the shape of a thin lozenge.

29
• Next, plot on the same psychrometric chart the actual maximum and minimum internal RH and temperature reading for one representative week. You should end up with four points each representing: minimum RH at minimum temperature, maximum RH at minimum temperature, minimum RH at maximum temperature and maximum RH at maximum temperature. Join these points up following the curves and lines of the psychrometric chart.

30
• You should have by now decided on the (acceptable minimum/maximum RH and temperature bands you would like to achieve. Plot these in the same way as you have just plotted the actual maximum and minimum internal RH and temperature readings on the same psychrometric chart.
• You should be able to see at a glance the difference between the actual conditions you have and what is acceptable. You should also be able to compare both to external conditions and to begin to decide what measures need to be taken to improve conditions.

31
• The psychrometric chart can also be used to decide on the measures needed to improve environmental conditions.
Typically, desirable conditions are often found in the centre of the psychrometric chart between 18°C and 24°C and 40% to 60%RH. If the actual conditions fall anywhere else, the following measures can be taken to move conditions away from the extremes. If conditions are either both cold and dry or cold and humid, healing (1) can be provided to improve conditions. If conditions are dry, humidification (2) can be used. If conditions are either hot and dry, or hot and humid, cooling (3) may be desirable. And if conditions are either hot and humid, or cold and humid, dehumidification (4) may be necessary. Note that some equipment or plant may combine several of these functions. For example, cooling the air may also dehumidify it and local dehumidification may also result in localised heating of the air.
These examples show how the psychrometric chart can be used as a tool which links environmental monitoring and control. They demonstrate that environmental monitoring has a serious purpose. Although these examples are simple, the underlying principles are the same, even if in reality the situation may be more complex. The psychrometric chart illustrates how temperature is related to relative humidity and air moisture content and that in a space in which air moisture remains constant, RH rises as temperature falls and vice-versa. Thus according to the psychrometric chart, RH can be controlled in four basic ways: by adjusting the temperature, by heating, by cooling and by altering the air moisture content through humidification or dehumidification.
Advanced data analysis Data analysis may vary depending on the problem we are addressing. It may be useful at times to interpret data in terms of absolute humidity or vapour pressure instead of just relative humidity This can be done either by using other parameters on the psychrometric chart; alternatively several software packages distributed with dataloggers for analysing data include options to plot absolute humidity or vapour pressure as well as RH. These parameters are particularly useful when trying to establish the cause of instability. As we have seen, RH instability may be caused by temperature instability or by changes in the moisture generated within a space. If the absolute humidity or vapour pressure is rising and falling with RH, then the cause of RH instability can be attributed to excess moisture, for example, the fabric drying after construction or floors drying after wet cleaning.

32
Chapter 8
Examples of Good Data Recording Recording data using a piece of equipment is only the beginning of a monitoring programme. The data must be annotated and supported by other information if it is to be interpreted correctly. Apart from marking up basic information on the charts themselves, information gathered from collection condition surveys and building maintenance records may also be used to help interpret the raw data. Information from the service engineer on the operation of any sophisticated control equipment should also be used. Good data recording includes:
Using limit values to arrive at acceptable RH and temperature bands Two pairs of limits should be set. The first should represent the band of acceptable control, denoted by an upper and lower warning limit. This will help to define the length of time that conditions are outside the acceptable band, should this occur The second pair represents an extreme band denoting upper and lower action limits, to which a response is required if they are exceeded.

33
Using limits to highlight the difference between maximum and minimum values Marking the acceptable limits and the maximum and minimum conditions on the graph shows at a glance the RH and temperature ranges by highlighting their highest and lowest points.
Marking the centre (i.e. the middle or data average) to give the typical value Marking the average indicates the midpoint about which the environment fluctuates. This is important for two reasons: one that the position of the midpoint will indicate whether the average is too high or too low, and the other is that the difference between the midpoint and the maximum and minimum point can be assessed. If the midpoint corresponds with the set midpoint of the control equipment, this confirms that the equipment is working properly. However, the equipment may still be going out of range at the maximum and minimum points. This information allows the hand settings of the equipment to be adjusted.

34
Marking the difference or the shift between the average and maximum and minimum points By drawing a horizontal line across the chart to indicate the average conditions, it is then possible to draw a vertical line from both the lowest and the highest point of RH and temperature. This enables both the frequency and the amplitude of the peak or trough to be assessed compared to the midpoint.
Relating RH and temperature readings to time on the chart Relating the readings to real time will allow the influence of events such as switching on heating, receptions etc. to be noted more clearly on the chart. Nevertheless, it is important to be aware that when using thermohygrographs, there will be a time lag between RH and temperature readings. The pens need to be able to pass each other smoothly without colliding.

35
Recording any irregular events such as the effect of an empty humidifier when a gallery is closed Recording unusual events to explain extreme fluctuations helps interpretation in the future. Recording events over a period of time allows the significance of occasional activities, which can have an unusual effect on the environment, to be assessed.

36
Chapter 9
Examples of Poor Data Recording Interpretation is made difficult by poor or incomplete data recording. This includes failure to write down events or incidents that may have an effect on the environment soon after they occur. These events include some of the examples listed in earlier sections such as equipment failure, wet cleaning, unusually high occupancy etc. Unless events are recorded promptly, it will be very difficult to remember what might have caused a particular blip. A note must be written as close to the occurrence of the incident as possible. The following are examples of poorly recorded data:
No indication of causes of RH fluctuations While it is fairly clear that a rapid rise and fall of RH conditions in the adjacent graph is due to equipment malfunction, nevertheless for a complete record and for future reference, a note should be written on the chart or in a secure diary. Future analysis by anyone other than whoever originally collected the data will have limited value if the graph is not annotated with the cause of the unusual fluctuations.
Chart not annotated Unlabelled charts are as inaccessible as an untitled file. It is impossible to work out easily what they contain. Without information on the location of the monitoring equipment and the band of environmental control expected in any particular location, future analysis becomes difficult. Graphs are made meaningless because only conjecture is possible without these points of reference.

37
Charts which endlessly rotate Charts which endlessly rotate show a lack of good monitoring practice and, as a result, say something about how poorly the museum is managed. In practical terms, they make it difficult to interpret the data and to relate the information to real time. Nevertheless, if this situation does occur, the chart should not be discarded because, while it is impossible to analyse it in detail, it will reveal general trends within the monitored space.
Pens colliding or sticking If pens on thermohygrographs collide or stick during environmental monitoring, they will give erroneous readings. Pens that collide will either clip the upper or lower readings, and thus the full extent of the maxima and minima is not recorded. Pens that stick will travel together and it is not possible to tell whether either RH or temperature reading is correct.
Poor choice of scale Choosing the wrong scale, either on the time axis or the RH and temperature axis, makes the graph difficult to interpret. Generally, data is represented too densely and too tightly on the chart As a rule of thumb, both axes should be broad enough so that data over a 24 hour period can be easily analysed and for the temperature curve to be clearly separated from the RH curve.

38
Measurements taken too infrequently Spot readings that measure fluctuating conditions must be taken frequently This will help avoid guesswork of what might be occurring between readings when hand-plotting graphs. In this chart, readings have been taken at irregular intervals, with some gaps lasting several days. When plotting the graph, an assumption was made that the line between each reading (and therefore the conditions which this line represents) is a straight one. This is not necessarily the case: RH may have risen or fallen. The greater the gap between readings, the more likely it is that conditions between readings will not be linear In varying conditions, a reading once a day is the minimum for a graph of this kind to be meaningful. However infrequently a spot reading is taken, if it always measures the required RH this may be sufficient to demonstrate that conditions are under control.
Untidy charts with too much annotation Too much unnecessary or repetitive information can actually hinder rather than help interpretation. If several charts are linked together to establish a trend, a single reading of maximum and minimum conditions should be sufficient to highlight the existing band of fluctuations over that period.

39
Conclusion Here are a few basic guidelines which can help to set the monitored data in context: • Start by recording over a short period of time. Be prepared to carry
out numerous investigations at the beginning, as many problems may be highlighted for the first time.
• When starting to monitor a space for the first time, set your acceptable limits fairly wide to begin with. If conditions improve or are stabilised by simple adjustments to equipment, the acceptable limits can be drawn tighter
• Establish good working relations with technical and maintenance support staff, but remember that it is a management decision on how quickly plans for physical improvements are acted upon.
• It is important to incorporate the need for action into the museum's management plan. Build everyone's confidence and support by dealing with simple problems first, before tackling the more complex ones.

40
Further Reading Appelbaum B, Guide to environmental protection of collections, Sound View Press, 1991. Cassar M, Environmental Management: Guidelines for museums and galleries, Routledge, 1995. Committee of Area Museum Councils, Creating an environmental diary, Museum Fact Sheet. Meteorological Office, Climatological memorandum 103, Averages and Frequency Distributions of Humidity for Great Britain and Northern Ireland 1961-70, August 1976 (The Meteorological Office, London Road, Bracknell, Berkshire). Michalski S, Relative humidity: A discussion of correct/incorrect values, ICOM Committee for Conservation 10th Triennial Meeting, Washington DC, USA 22-27, August 1993.
Pragnell R, Recording humidity: no need to lose your hair, Environmental Engineering, September 1990. Scottish Museums Council, Museums & Galleries Commission and Committee of Area Museum Councils, Developing a museum environmental management programme, Museum Basics 3 Training Package, 1997. The Chartered Institution of Building Services Engineers, Psychrometric chart for dry-bulb temperatures -10°C to 60°C, based on the Psychrometric Tables in the CIBSE Guide, Sections C1/2 (CIBSE, Delta House, 222 Balham High Road, London SW12 9BS). Thomson G, The Museum Environment, Second edition, Butterworths 1986.