relationships among inflation, interest rates, and...
TRANSCRIPT
Relationships among Inflation,Interest Rates, and Exchange Rates
Relationships among Inflation,Interest Rates, and Exchange Rates
88ChapterChapter
18.J. Gaspar: Adapted from Jeff Madura, International Financial Management
International Finance Theories (cont)
• Purchasing Power Parity (PPP): At equilibrium, the future spot rate of a foreign currency will differ (in %) from the current spot rate by an amount that equals (in %) the inflation differential between the home and foreign countries.
• International Fisher Effect (IFE): At equilibrium, the future spot rate of a foreign currency will differ (in %) from the current spot rate by an amount that equals (in %) the nominal interest rate differential between the home and foreign countries
28.
Chapter Objectives
To explain Purchasing Power Parity (PPP) and International Fisher Effect (IFE) theories, and their implications on exchange rate changes; and
To compare and show linkage between PPP, IFE, and Interest Rate Parity (IRP) theories.
38.
Purchasing Power Parity (PPP)
• When a country’s inflation rate rises relative to that of another country, decreased exports and increased imports depress the high-inflation country’s currency because of worsening trade and current account balances.
• Purchasing Power Parity (PPP) theory attempts to quantify this inflation – exchange rate relationship.
48.
Interpretations of PPP
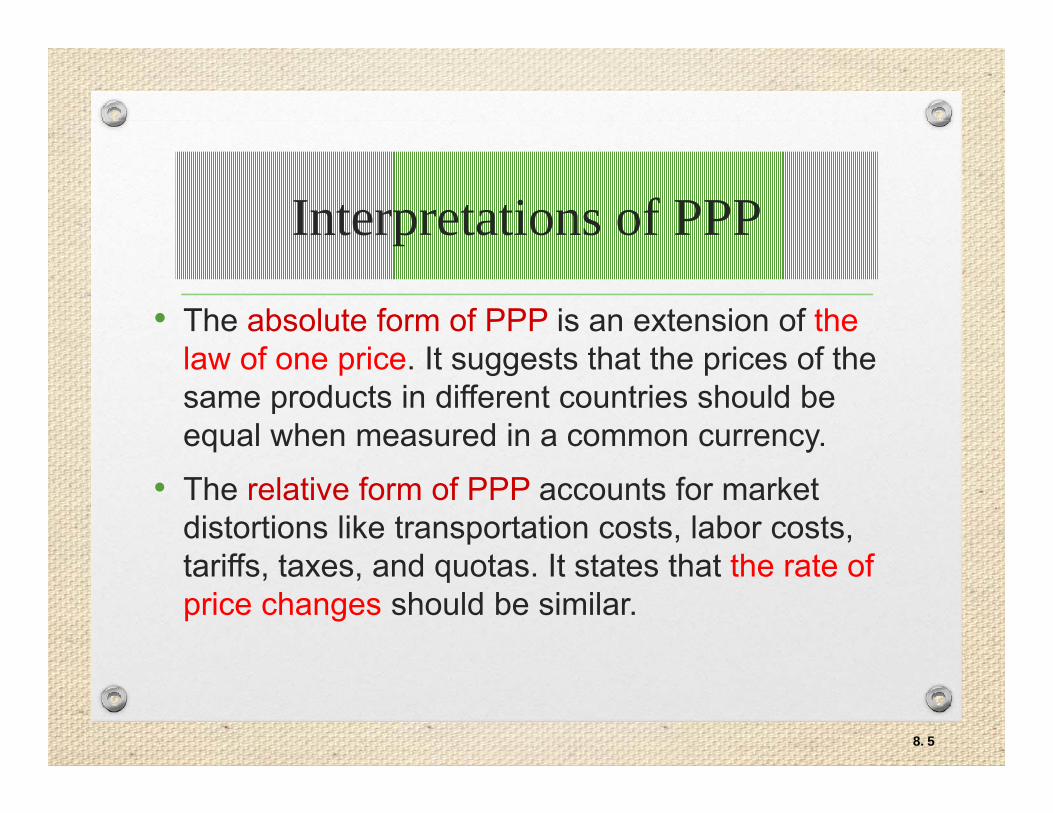
• The absolute form of PPP is an extension of the law of one price. It suggests that the prices of the same products in different countries should be equal when measured in a common currency.
• The relative form of PPP accounts for market distortions like transportation costs, labor costs, tariffs, taxes, and quotas. It states that the rate of price changes should be similar.
58.
Rationale behind PPP Theory
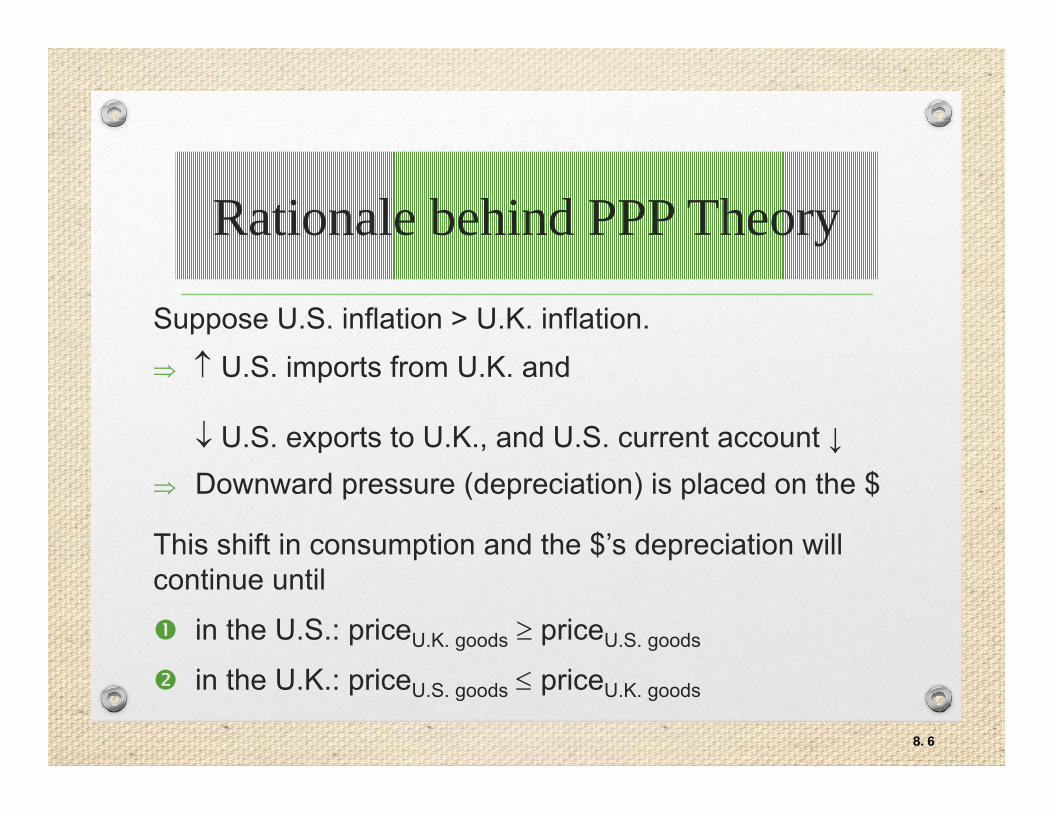
Suppose U.S. inflation > U.K. inflation. U.S. imports from U.K. and
U.S. exports to U.K., and U.S. current account ↓ Downward pressure (depreciation) is placed on the $
This shift in consumption and the $’s depreciation will continue until
in the U.S.: priceU.K. goods priceU.S. goods
in the U.K.: priceU.S. goods priceU.K. goods
68.
Derivation of PPP
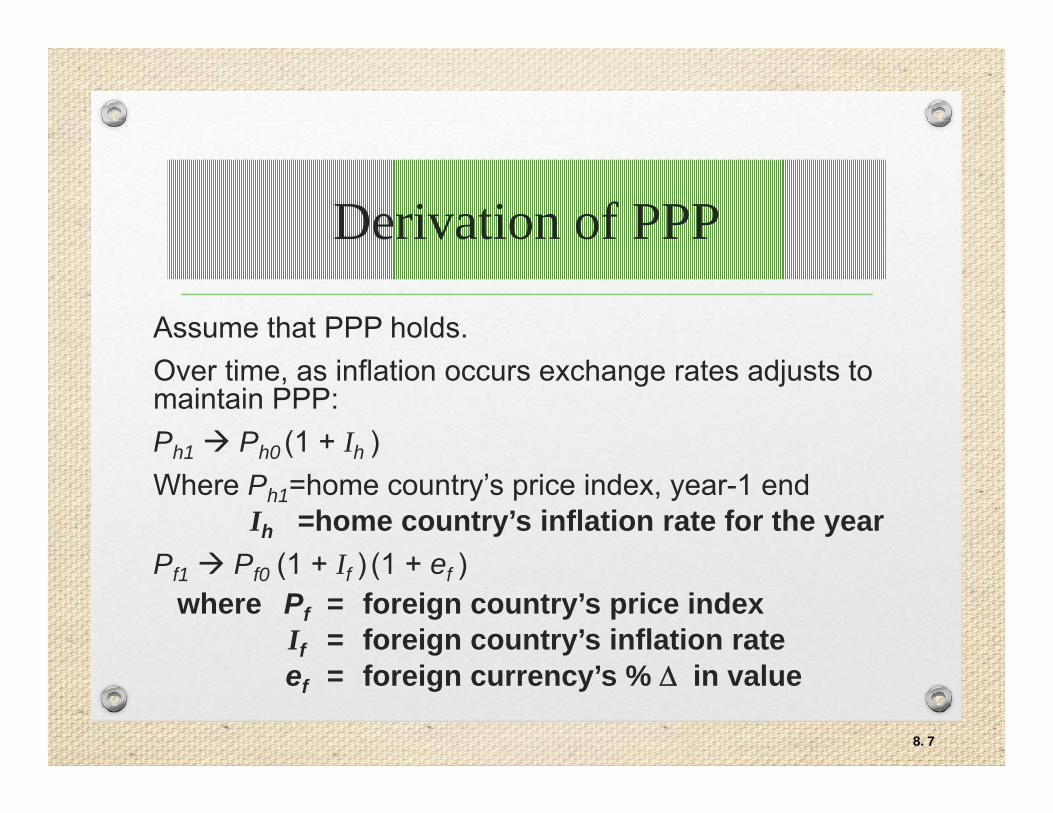
Assume that PPP holds. Over time, as inflation occurs exchange rates adjusts to maintain PPP:Ph1 Ph0 (1 + Ih )Where Ph1=home country’s price index, year-1 end
Ih =home country’s inflation rate for the yearPf1 Pf0 (1 + If ) (1 + ef )
where Pf = foreign country’s price indexIf = foreign country’s inflation rateef = foreign currency’s % in value
78.
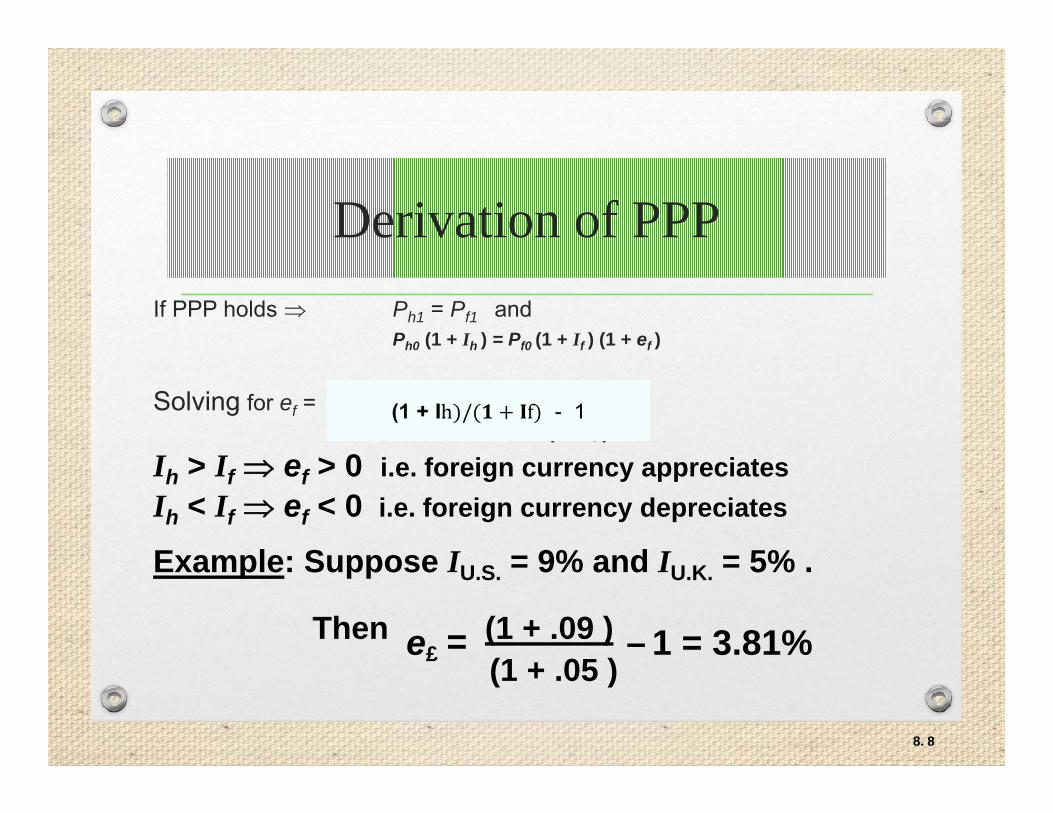
Derivation of PPPIf PPP holds Ph1 = Pf1 and
Ph0 (1 + Ih ) = Pf0 (1 + If ) (1 + ef )
Solving for ef = ef = (1 + Ih ) – 1(1 + If )
Ih > If ef > 0 i.e. foreign currency appreciatesIh < If ef < 0 i.e. foreign currency depreciates
Example: Suppose IU.S. = 9% and IU.K. = 5% .
Then e£ = (1 + .09 ) – 1 = 3.81%(1 + .05 )
88.
Simplified PPP Relationship
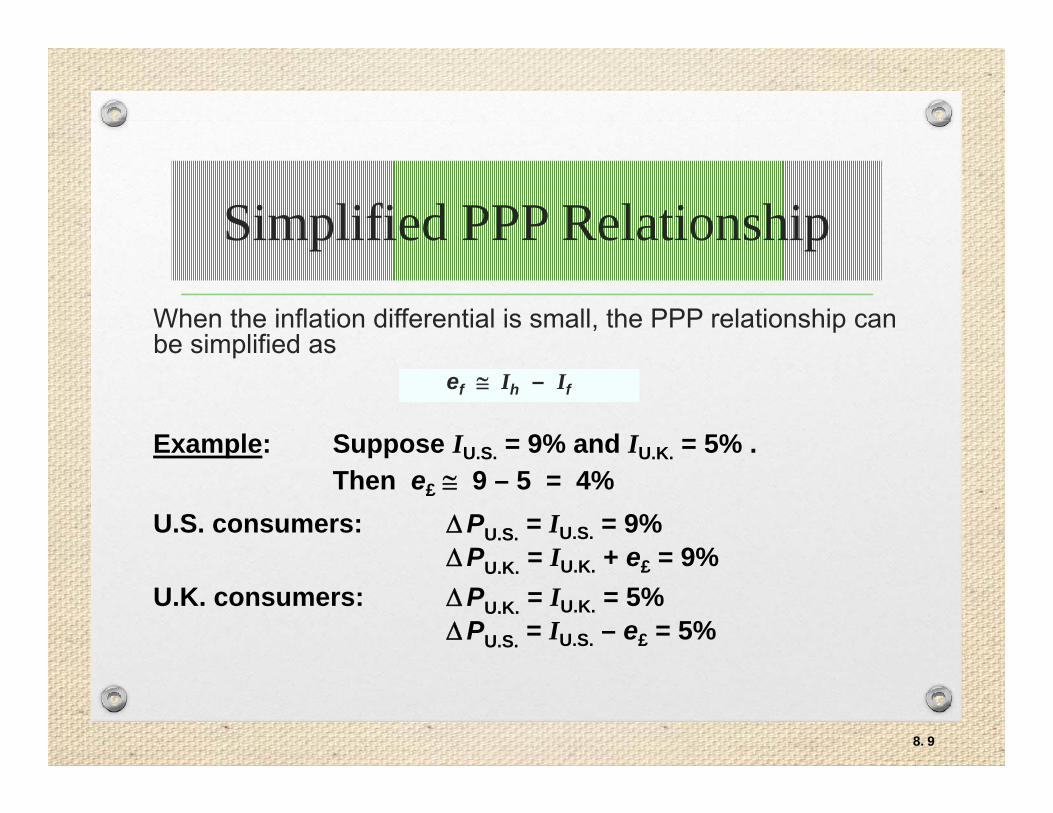
When the inflation differential is small, the PPP relationship can be simplified as
ef Ih – If
Example: Suppose IU.S. = 9% and IU.K. = 5% . Then e£ 9 – 5 = 4%
U.S. consumers: PU.S. = IU.S. = 9%PU.K. = IU.K. + e£ = 9%
U.K. consumers: PU.K. = IU.K. = 5%PU.S. = IU.S. – e£ = 5%
98.
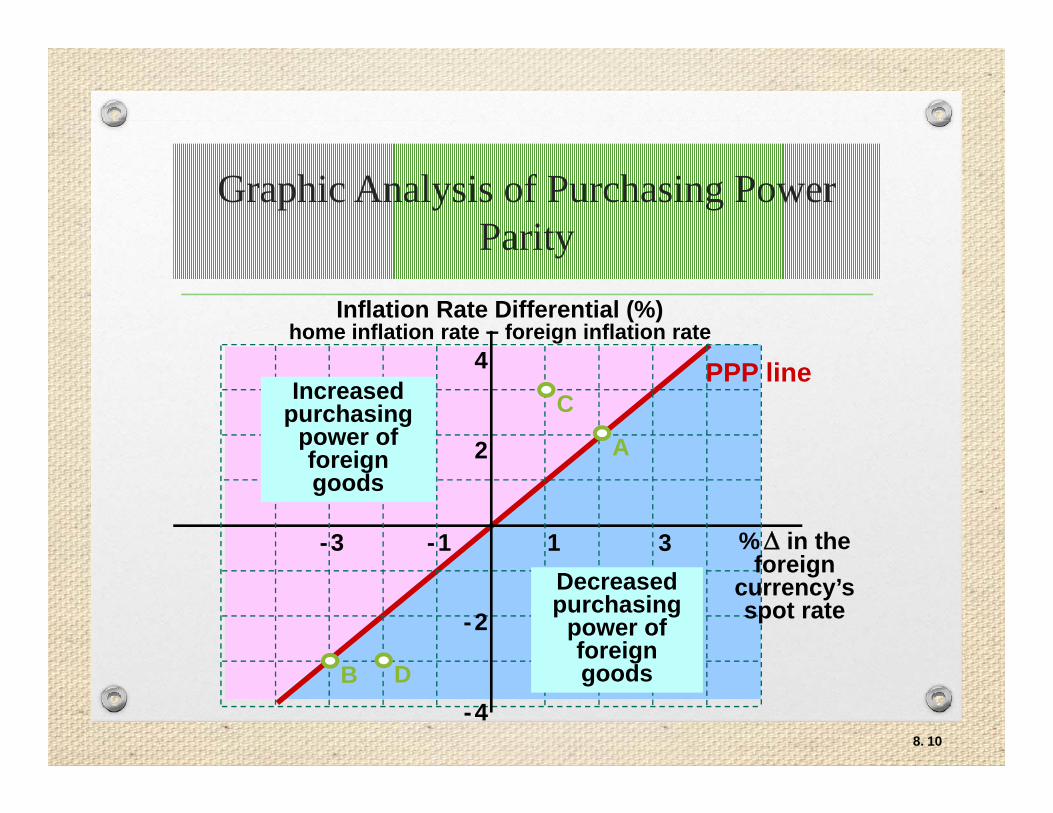
Graphic Analysis of Purchasing Power Parity
PPP line
Inflation Rate Differential (%)home inflation rate – foreign inflation rate
% in the foreign
currency’s spot rate-2
-4
2
4
1 3-1-3
Increased purchasing
power of foreign goods
Decreased purchasing
power of foreign goods
A
B
C
D
108.
Testing the PPP Theory
Conceptual Test
• Plot actual inflation differentials and spot exchange rate changes for two or more countries on a graph.
• If the points deviate significantly from the PPP line over time, then PPP does not hold.
118.
Testing the PPP Theory
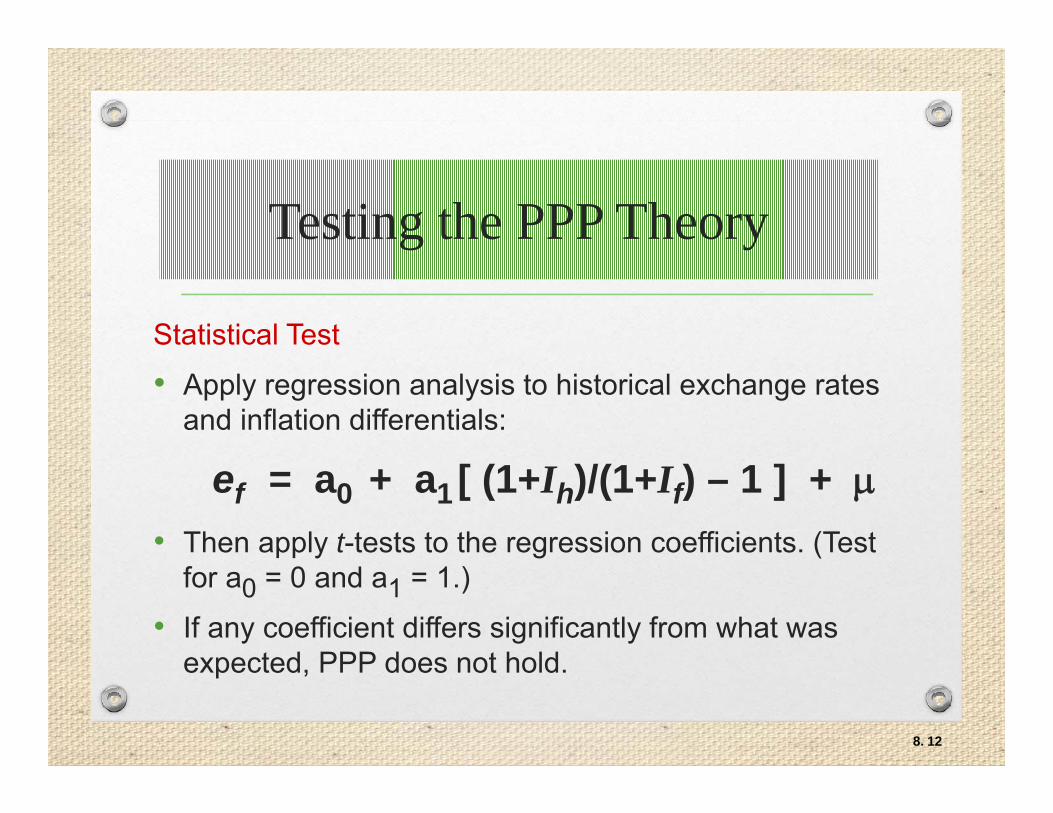
Statistical Test
• Apply regression analysis to historical exchange rates and inflation differentials:
ef = a0 + a1 [ (1+Ih)/(1+If) – 1 ] + • Then apply t-tests to the regression coefficients. (Test
for a0 = 0 and a1 = 1.)
• If any coefficient differs significantly from what was expected, PPP does not hold.
128.
Testing the PPP Theory
• Empirical studies indicate that the relationship between inflation differentials and exchange rates is not perfect even in the long run.
• However, the use of inflation differentials to forecast long-run movements in exchange rates is supported.
A limitation in the tests is that the choice of the base period will affect the result.
138.
Why PPP Does Not Occur
PPP does not occur consistently due to:
confounding effects• Exchange rates are also affected by differences in
inflation, interest rates, income levels, government controls and expectations of future rates.
a lack of substitutes for some traded goods
148.
PPP in the Long Run
• PPP can be tested by assessing a “real” exchange rate over time (e.g., crawling pegs).
• The real exchange rate is the actual exchange rate adjusted for inflationary effects in the two countries of concern.
• If the real exchange rate follows a random walk, it cannot be viewed as being a constant in the long run. Then PPP does not hold.
158.
The Big Mac Index
The Big Mac Index was invented by The Economist in 1986 as a lighthearted guide to whether currencies are at their “correct” level. It is based on the theory of purchasing-power parity (PPP), the notion that in the long run exchange rates should move towards the rate that would equalize the prices of an identical basket of goods and services (in this case, a burger) in any two countries. For example, the average price of a Big Mac in America in January 2015 was $4.79; in China it was only $2.77 at market exchange rates. So the "raw" Big Mac index says that the yuan was undervalued by 42% at that time. http://www.economist.com/content/big-mac-index
168.
International Fisher Effect (IFE)
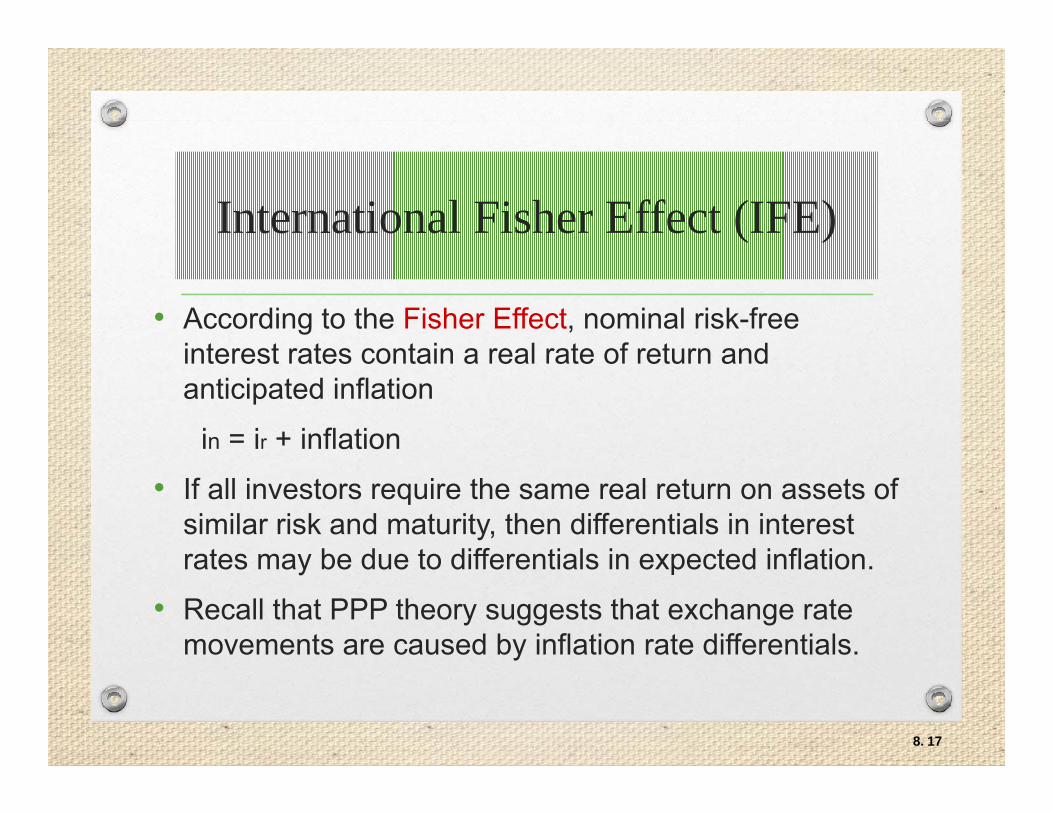
• According to the Fisher Effect, nominal risk-free interest rates contain a real rate of return and anticipated inflation
in = ir + inflation
• If all investors require the same real return on assets of similar risk and maturity, then differentials in interest rates may be due to differentials in expected inflation.
• Recall that PPP theory suggests that exchange rate movements are caused by inflation rate differentials.
178.
International Fisher Effect (IFE)
• The International Fisher Effect (IFE) theory suggests that currencies with higher interest rates will depreciate because the higher nominal rates reflect higher expected inflation.
• Hence, investors hoping to capitalize on a higher foreign interest rate should earn a return no higher than what they would have earned domestically.
188.
International Fisher Effect (IFE)
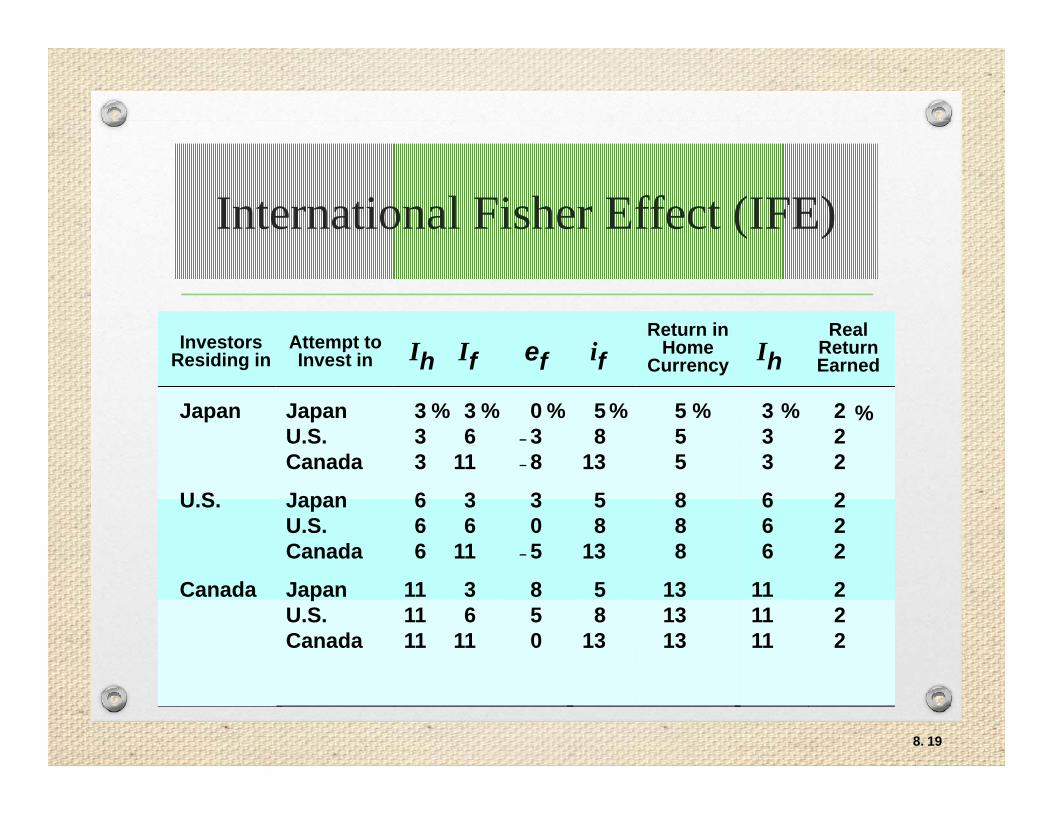
InvestorsResiding in
Japan
U.S.
Canada
JapanU.S.Canada
JapanU.S.Canada
JapanU.S.Canada
Attempt toInvest in Ih
333
666
111111
%
If
36
11
36
11
36
11
%
ef
0– 3– 8
30
– 5
850
%
if
58
13
58
13
58
13
%
Return inHome
Currency
555
888
131313
%
Ih
333
666
111111
%
RealReturnEarned
222
222
222
%
198.
Derivation of the IFE
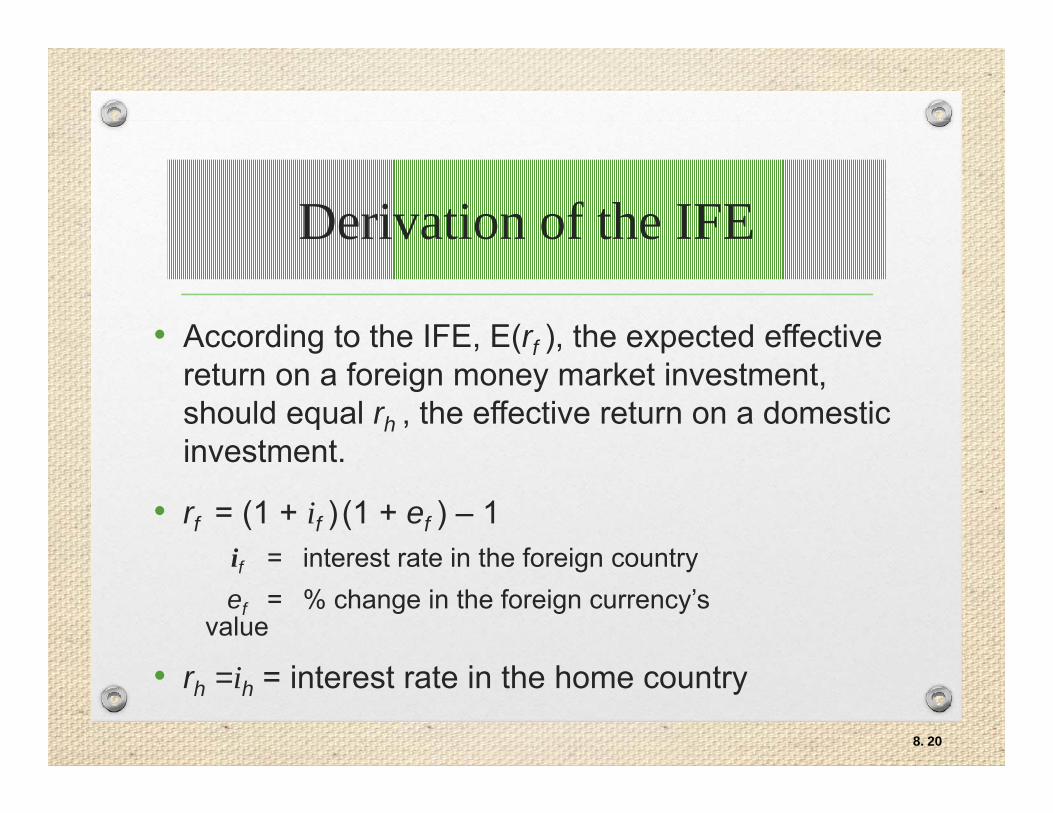
• According to the IFE, E(rf ), the expected effective return on a foreign money market investment, should equal rh , the effective return on a domestic investment.
• rf = (1 + if ) (1 + ef ) – 1if = interest rate in the foreign countryef = % change in the foreign currency’s
value
• rh =ih = interest rate in the home country
208.
Derivation of the IFE
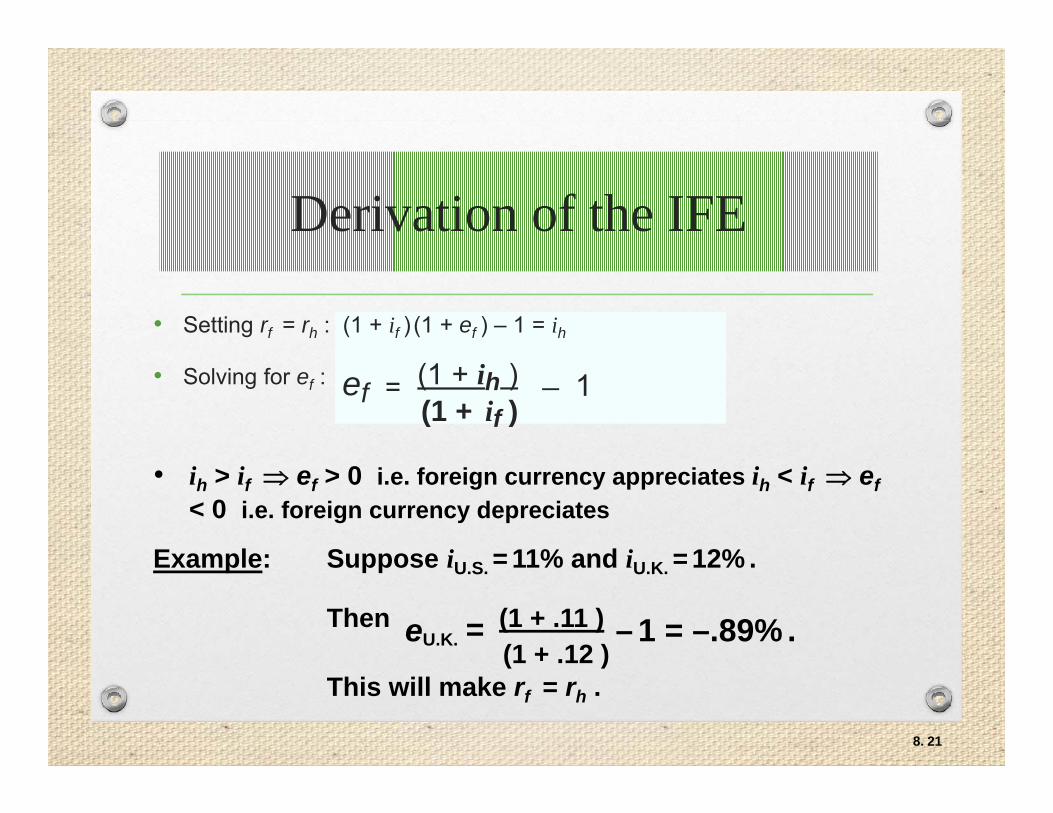
• Setting rf = rh : (1 + if ) (1 + ef ) – 1 = ih
• Solving for ef : ef = (1 + ih ) _ 1(1 + if )
• ih > if ef > 0 i.e. foreign currency appreciates ih < if ef< 0 i.e. foreign currency depreciates
Example: Suppose iU.S. = 11% and iU.K. = 12% .
Then eU.K. = (1 + .11 ) – 1 = –.89% .(1 + .12 )
This will make rf = rh .
218.
Derivation of the IFE
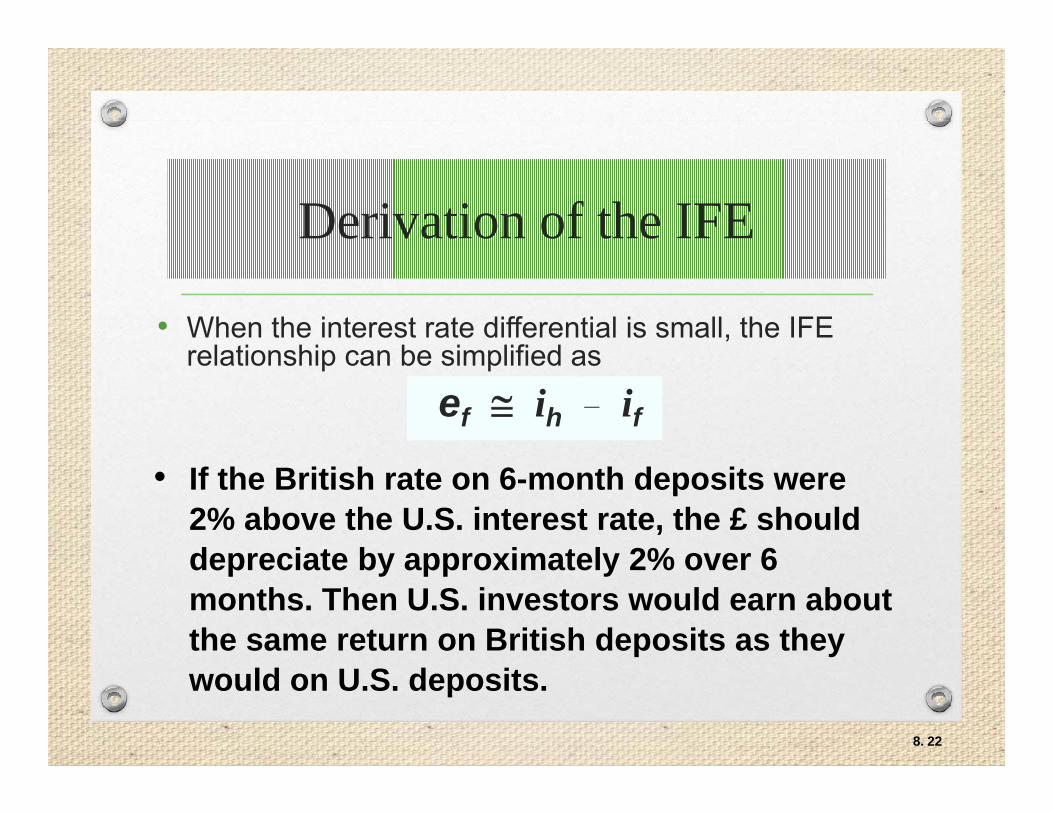
• When the interest rate differential is small, the IFE relationship can be simplified as
ef ih _ if• If the British rate on 6-month deposits were
2% above the U.S. interest rate, the £ should depreciate by approximately 2% over 6 months. Then U.S. investors would earn about the same return on British deposits as they would on U.S. deposits.
228.
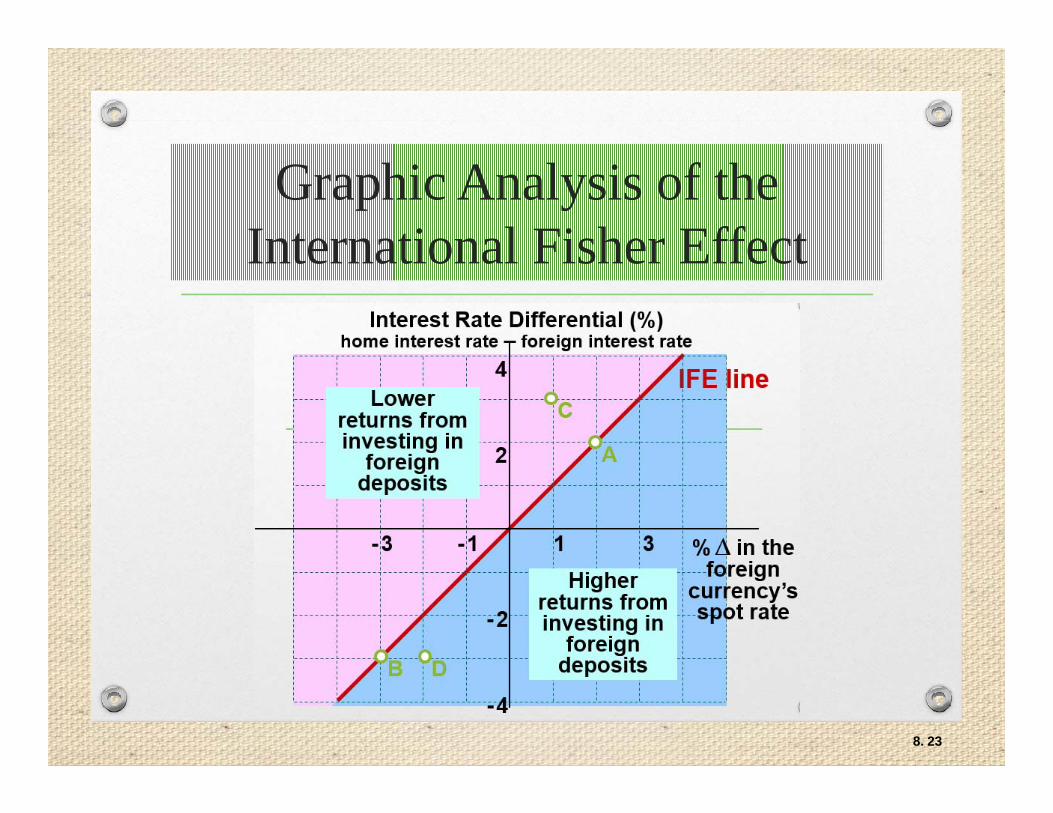
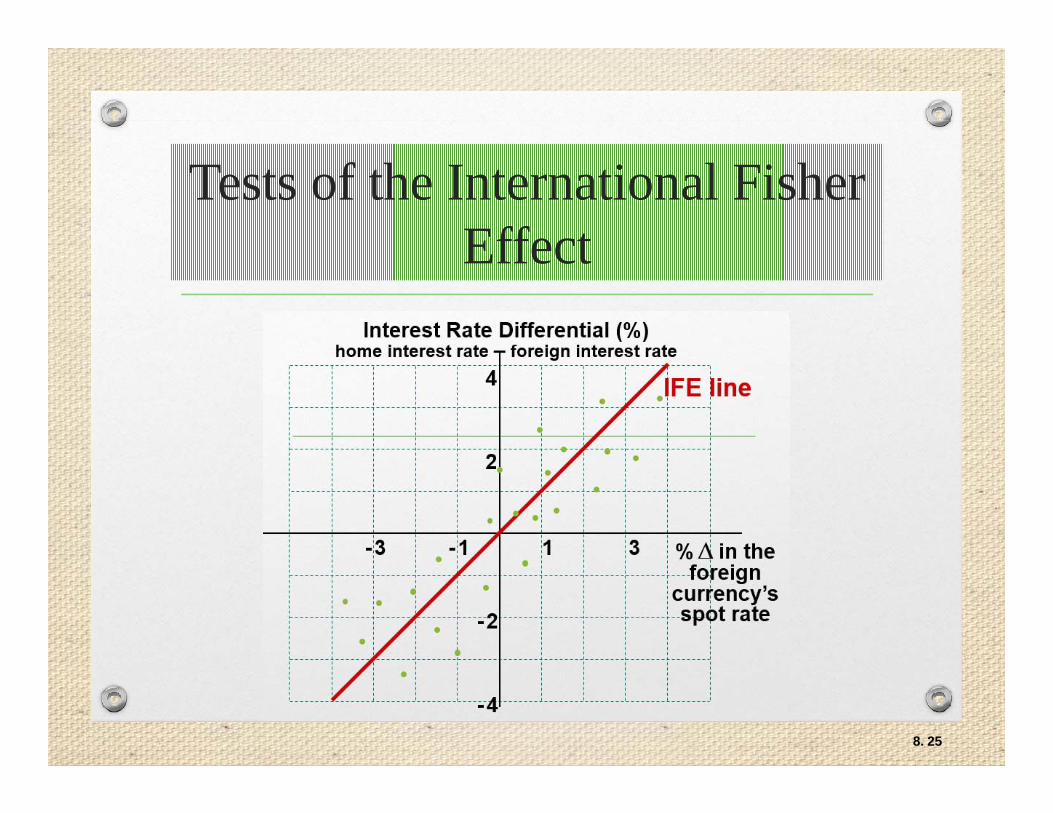
Graphic Analysis of the International Fisher Effect
238.
Tests of the IFE
• If actual interest rates and exchange rate changes are plotted over time on a graph, we can see whether the points are evenly scattered on both sides of the IFE line.
• Empirical studies indicate that the IFE theory holds during some time frames. However, there is also evidence that it does not hold consistently.
248.
Tests of the International Fisher Effect
258.
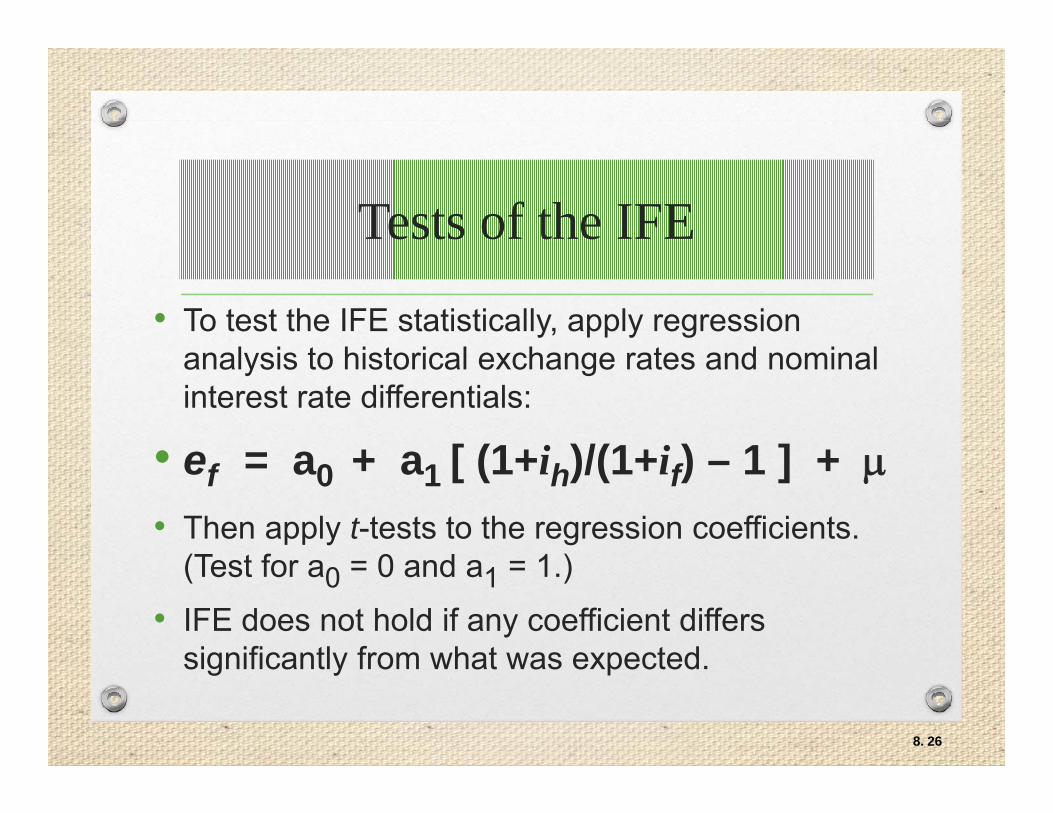
Tests of the IFE
• To test the IFE statistically, apply regression analysis to historical exchange rates and nominal interest rate differentials:
• ef = a0 + a1 [ (1+ih)/(1+if) – 1 ] + • Then apply t-tests to the regression coefficients.
(Test for a0 = 0 and a1 = 1.)
• IFE does not hold if any coefficient differs significantly from what was expected.
268.
Why the IFE Does Not Occur
• Since the IFE is based on PPP, it will not hold when PPP does not hold.
• In particular, if there are factors other than inflation that affect exchange rates, exchange rates may not adjust in accordance with the inflation differential.
278.
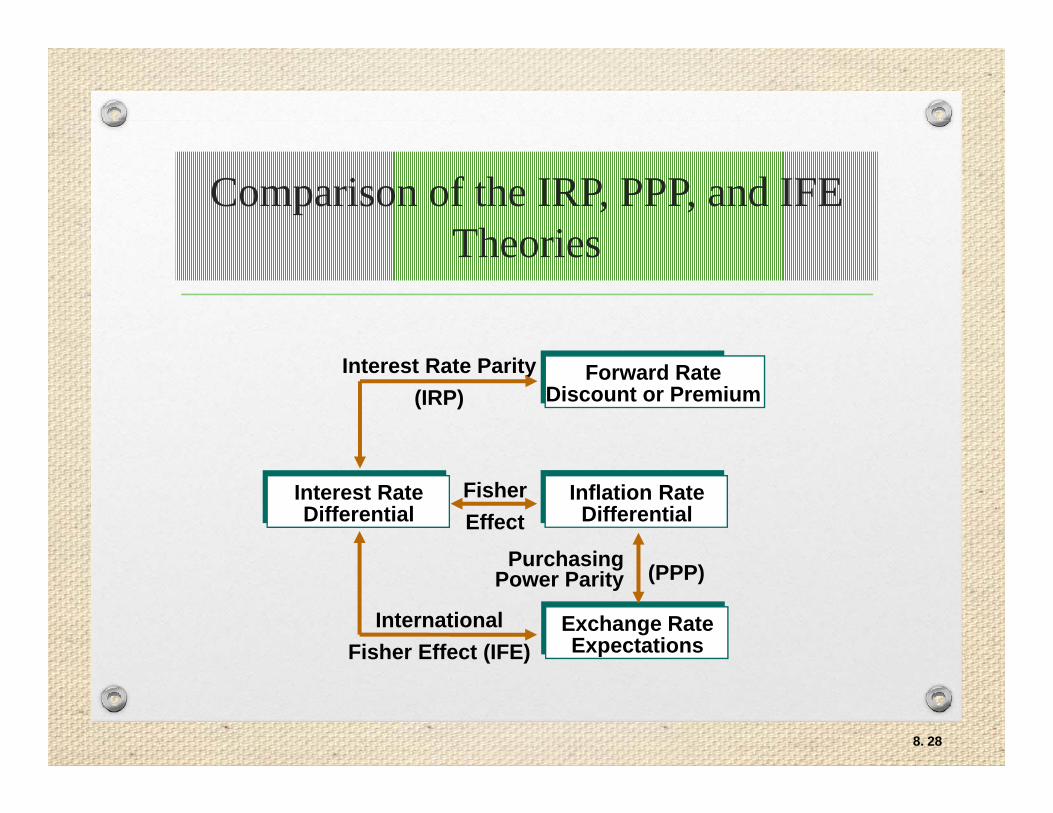
Comparison of the IRP, PPP, and IFE Theories
Exchange RateExpectations
Inflation RateDifferential
Forward RateDiscount or Premium
Interest RateDifferential
PurchasingPower Parity (PPP)
Interest Rate Parity(IRP)
FisherEffect
InternationalFisher Effect (IFE)
288.
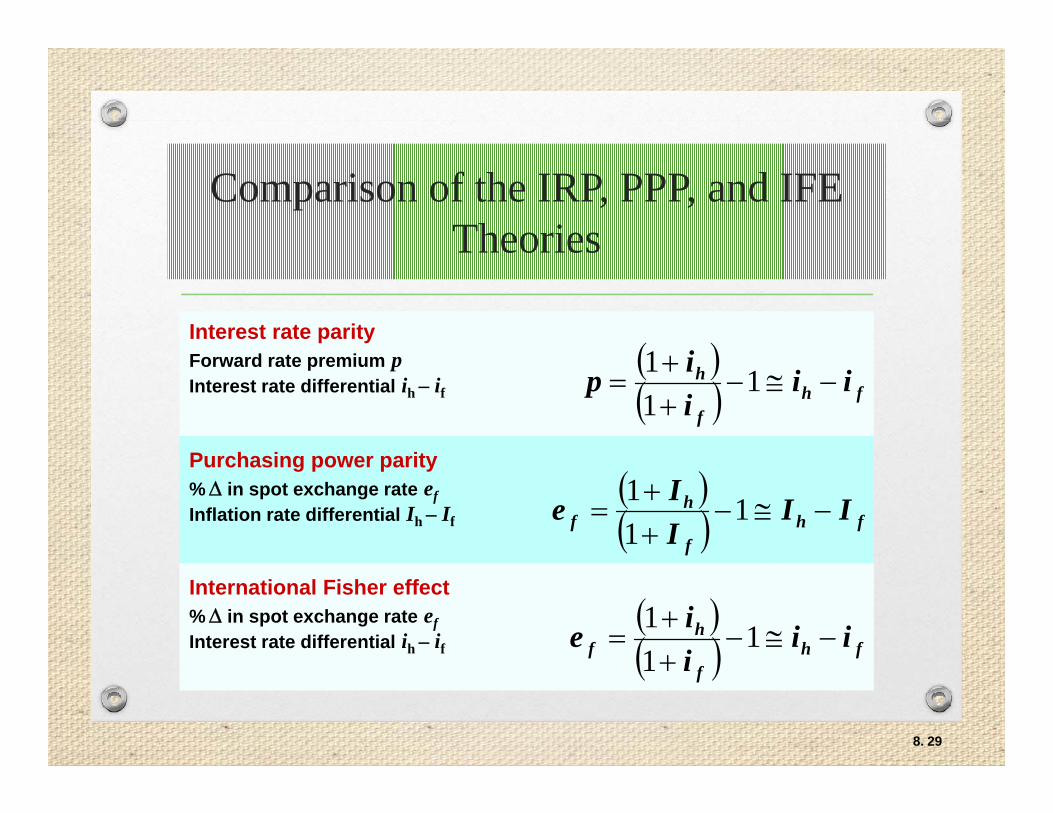
Comparison of the IRP, PPP, and IFE Theories
Interest rate parityForward rate premium pInterest rate differential ih – if
fh
f
h iiiip
111
Purchasing power parity% in spot exchange rate efInflation rate differential Ih – If
fh
f
hf II
IIe
111
International Fisher effect% in spot exchange rate efInterest rate differential ih – if
fh
f
hf ii
iie
111
298.