relationship of soil physical & chemical properties with aggregate stability in rice-wheat soil
TRANSCRIPT

October, 17, 2007 1

2
Relationship of Soil Physical & Chemical Properties with Aggregate Stability in Rice-Wheat Soil
SALEEM ULLAH
Reg No#10-US-AGR-186
Roll No # BAGF10E027

SUPERVISIOR
Dr S.M Shahzad

4
Land Resources Research institute (LRRI), established in 1982, focuses on producing more food and fiber on less land using fewer inputs while protecting the environment.
Introduction To LAND RESOURCES RESEARCH INSTITUTENARC
NATIONAL AGRICULTURAL REASERCH CENTRE ISLAMABAD established in 1981.

Internship Report Presentation
Work completed at Soil Physics Research Laboratory
LAND RESOURCES RESEARCH INSTITUTENATIONAL AGRICULTURAL REASERCH CENTRE ISLAMABAD
“Relationship of Soil Physical & Chemical Properties with
Aggregate Stability in Rice-Wheat Soil”

Introduction To Project
“Relationship of Soil Physical & Chemical Properties with Aggregate Stability in Rice-Wheat Soil”

Soil aggregates are groups of soil particles that bind to each other more
strongly than to adjacent particles.
The aggregation is strongly affected by physic-chemical
characters of any given soil.
Therefore present study was undertaken to evaluate the
relationship between physic- chemical properties of rice- wheat
soil and soil aggregation parameters.

Aggregate stability depend upon soil type……..
Less aggregate stability in poor soil and more aggregate
stability in good soil.
Aggregate stability depend upon disruptive forces…..
For example Rain fall, Tillage practice etc.

MATERIALS AND METHODS
Soil Sample Description
Soil Physics Research Program, LRRI, NARC had collected soil
samples from the rice-wheat area district Gujranwala and
Sheikhupura after harvesting rice during 2011-2012.
The samples had been air dried, prepared and passed
through 2mm sieve.
The prepared samples had been stored in Soil Physics
Laboratory.
The surface soil samples (0-12cm) differing in physic-chemical
character were used in the study reported here.

10
Soil Reaction (pH)
The pH was measured in 1:2 soil to water ratio as described by (Ryan 2001)
as under:
Apparatus:
pH meter
Plastic cups, Beakers
Distilled water

For pH measurement
10g air dry soil having particle size <2mm was taken into 40 ml glass
beaker and 20 ml of distilled water was added using a graduated
dispenser.
It was mixed well with glass rod and allowed to stand for 30 minutes.
Soil Reaction (pH)

pH Meter Calibration
Before pH measurement,
pH meter was calibrated and standardized with buffer two solutions.
The buffer solution of pH 7.0 and pH 9.2
For calibration, the electrode was dipped in buffer solution of pH 7.0 and reading on
meter display was adjusted to exactly 7.0 by rotating pH meter knob. Then pH
electrode was removed from the buffer solution, washed with distilled water and dry
with tissue paper then pH electrode was dipped into second buffer solution of pH
9.2, when stable reading on pH meter display appeared, it was adjusted to 9.2 by
rotating pH meter knob. After adjustment the electrode was removed from the
buffer solution and calibration process was repeated 3-4 times to ensure exact
calibration.

After 1 hour the suspension
was stirred and electrode of pH
meter was dipped 3cm deep into
the suspension and reading was
recorded after 30 seconds.
After taking the reading the
combined electrode was removed
from the suspension and rinsed
with distilled water and dried
with tissue paper thoroughly.
Recording of the Reading

Electrical ConductivityThe EC was measured in 1:2 soil to water ratio as described by (Ryan 2001) detailed as under:
For EC measurement 10g air dry soil having particle size <2mm was taken into 40 ml glass beaker and 20 ml of distilled water was added using a graduated dispensator.
The contents were mixed well with glass rod and allowed to stand for 30 minutes.
Apparatus: Conductivity meterPlastic cups, BeakersStandard Potassium Chloride (KCl) Solution (0.01N)Distilled water

For calibration, a portion of the standard KCl solution was taken in the plastic cup and electrode of conductivity meter was dipped in it. The instrument was turned on and allowed to settle in the standard solution for few minutes.
Calibration knob was rotated till reading on meter display was achieved 1.413 mS/cm.
After adjustment the conductivity electrode was removed from the solution and calibration process was repeated 3-4 times to ensure exact calibration.
Once calibration was complete, the conductivity meter was ready for use.
EC Meter Calibration

Soil Organic Matter
The soil organic carbon was determined according to Nelson and Sommers(1982) as described by Ryan etal (2001) as under
Reagents:Potassium Dichromate Solution (K2Cr2O7) 1.0 N
Concentrated Sulphuric Acid (H2SO4)
Orthophosphoric Acid (H3PO3)
Ferrous Ammonium Sulphate solution [(NH4)2 SO4. FeSO4.6H2O]
Diphenylamine indicator (C6H6)2NH

Procedure: 2g air dry soil having particle size <2mm was taken into 500 ml flask and 10 ml of 1.N Potassium di Chromate solution was added using a 10 ml pipet and mixed well.
Then 20 ml concentrated Sulfuric Acid (H2SO4) was added by using a
dispenser and allowed to stand for 30 minutes. After this about 200 ml of distilled water was added.
Then20 ml concentrated Orthophosphoric acid was added by using a 25 ml glass cylinder and mixture was allowed to cool. Then 10-15 drops of Diphenylamine indicator were added.
The color of mixture appeared violet-blue. The contents were titrated against 0.5 M Ferrous Ammonium Sulfate solution taken in a burette until color changed to bluish green..
A duplicate set of blank samples was also run in parallel.

O.M (%) =(ml for blank – ml for sample)
Weight of Sample
X0.069X 0.5
Where
•0.069Correction Factor
•0.5 Molarity of Ferrous Sulphate solution
The soil organic matter was calculated as under:

Soil CaCO3
Three gram of prepared soil was taken into 500 ml reaction flask and 20 ml of distilled water was added.
Then 7 ml of 4 M HCl was taken in a reaction vial. Reaction vial was carefully shifted into the reaction flask taking care no HCl in the vial should spill out.
Then the reaction flask was connected to the Calcimeter in such a way that it attained completely air tight.
CaCO3 was determined by calcimeter method.

The reaction vessel was tilted gently until HCl in the vial leaked out and reacted with vessel contents.
The carbon dioxide (CO2) produced inside the vessel developed pressure and pushed the water column in Calcimeter upward.
The water column reading in the Calcimeter before and after the chemical reaction were recorded to or work out in rise the water column due to CO2 determine produced.
A calibration curve of known concentration of CaCo3 was drown to calculate the CaCo3 contents in the unknown sample.

Particle Size Distribution
Particle size distribution of <2 mm fractions was measured by the hydrometer method as described by Gee and Bauder (1986).
The hydrometer method measures the particle size on the differential settling velocities within a cylinder.
The procedure consists of two parts i.e dispersion of sample and sedimentation.

(1) Dispersion
40 g of soil was taken in plastic beaker.
60mL dispersion solution of sodium hexametaphosphate were added.
Volume was made to 200mL by adding distilled water.
The samples were left overnight and next day samples were transferred
to dispersion cup.
Sufficient distilled water was added in the dispersion cup.
The dispersion was carried out by mechanical shaker for 3 minutes.

(2) Sedimentation
The contents of cup were transferred to 1000ml
cylinder and volume was made up to 1000 ml.
The samples were stirred with the help of plunger.
Time recoding on stop watch was started immediately
when stirring was stopped.
The hydrometer was also inserted into the cylinder to
record first hydrometer reading after 40 seconds of
stirring.
After 40 seconds 1st hydrometer reading was taken
and temperature was also noted.
The second reading was taken after 2 hours and then
correction factor was applied according to the Stock’s
law.

Calculations
Corrections for Temperature and density:
If temperature of the sample was higher than 20 ° C, 0.36 units were added to every hydrometer reading of sample and 0.36 unit were subtracted for every 1° C below 20° C.
CHR= H ±[(T ±20)*0.36]
WhereCHR= Corrected hydrometer readingH= Observed hydrometer reading

WhereCHR1 is corrected Hydrometer reading 1, (taken after 40 seconds)
CHRb is corrected hydrometer reading for blank
OD soil wt = Oven dry weight of soil used
% Silt+ clay = x 100
The silt+clay in the suspension was calculated using the formula

Similarly clay in the suspension was calculated by
Clay (%) = x 100
Where
CHR2 is corrected Hydrometer reading 2, (taken after 2 hours)
CHRb is corrected hydrometer reading for blank
The individual quantities of silt and sand were worked out from the above data as under
Silt (%) = (silt+clay) – claySand (%) = 100- (silt+clay)
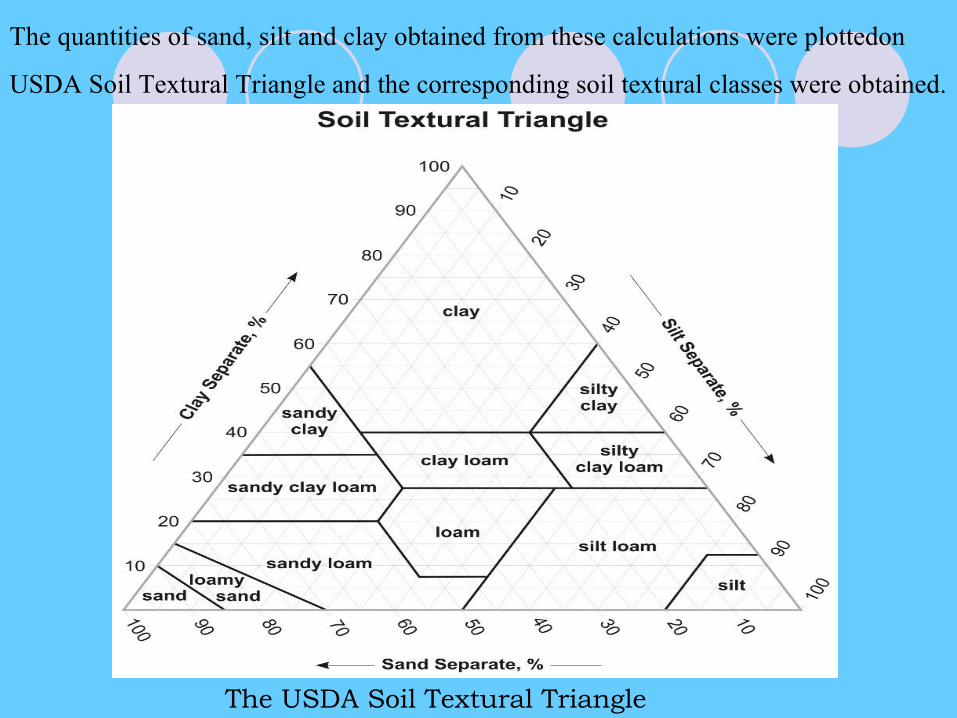
The quantities of sand, silt and clay obtained from these calculations were plottedon
USDA Soil Textural Triangle and the corresponding soil textural classes were obtained.
The USDA Soil Textural Triangle

Sodium (Na) and Potassium (K)
Sodium and potassium concentration was determine in 1:2 ratio of soil
water solution by Flame Photometer method (Ryan 2001).
The determination in two steps i.e soil extraction and concentration
measurements on flame photometer
Apparatus and reagents:Extraction flasksReciprocating shakerWhatman 42 Filter paperStoring bottleTest tubeFlame photometerBurrettsReagents:Lithium chloride (LiCl) 200ppm

Soil Extraction 10g air dry soil particle size <2mm was
taken into 250 ml conical flask and 20 ml
of distilled water was added using a
graduated dispenser and were shaken
samples for 30 minutes on mechanical
shaker.
After shaking sample were filter through
filter paper Whatman No.42 and the clear
filtrate was received in the bottle.

30
Concentration measurement:
One ml of extract was taken into a test tube and 4 ml of distilled water was added.
Then 5 ml of Lithium chloride (LiCl2) was added and stirred on vortex mixture.
Flame photometer was operated according to the instruction provided for equipment.
A series of standard was run ranging from 0 to 10 ppm for Na+/K separately and
standard curve was drawn.
The prepared soil extract was run in the flame photometer accordingly and Na/K
concentration was back calculated from the standard curve (soil extract)
Na was Calculate by
Na=Absorbance value x Dilution x Dilution factor

31
Calcium and Magnesium (Ca+Mg)
Ca and Mg in the extract was determined by titration method according to
Richards (1954).
The 2 ml from extract was taken by pipette and put into the china dish.
Then 10 drops of buffer indicator and 2-3 drops of Ericrome black-T and
titrate against with 0.01 N EDTA then titrate until the color changes from red
to blue .
The dark blue color was end point and note the end point.
Calculation:
Ca+Mg (me/l)= x 100

Sodium Absorption Ratio (SAR)
SAR was calculated by following equation
SAR =
Na, K and Ca,+ Mg are in meq/l

Mean Weight Diameter
The method of Kemper (1986) was used to determine mean weight diameter.
A nest of four sieves (1.00, 0.50,0.25 and 0.125mm) was used for MWD determinations. 40 g of <2.0 mm air-dried soils were put in the topmost of a nest of four sieves of 1.00, 0.50,,0.25 and 0.125 mm mesh size and pre-soaked for 30 min in deionized water.
The nest of sieves and its contents were manually oscillated vertically in tank of water for 4 minutes using 4-5 cm amplitude at the rate of 30 times per minutes.
After sieving, the soil aggregate materials retained on each sieve were transferred into beakers, dried in the oven at 105◦C until steady weight was achieved.
The percentage ratio of the aggregates in each sieve represents the water-stable aggregates (WSA) of size classes: >1.00,1.00–0.50, 0.50–0.25 and <0.125 mm.
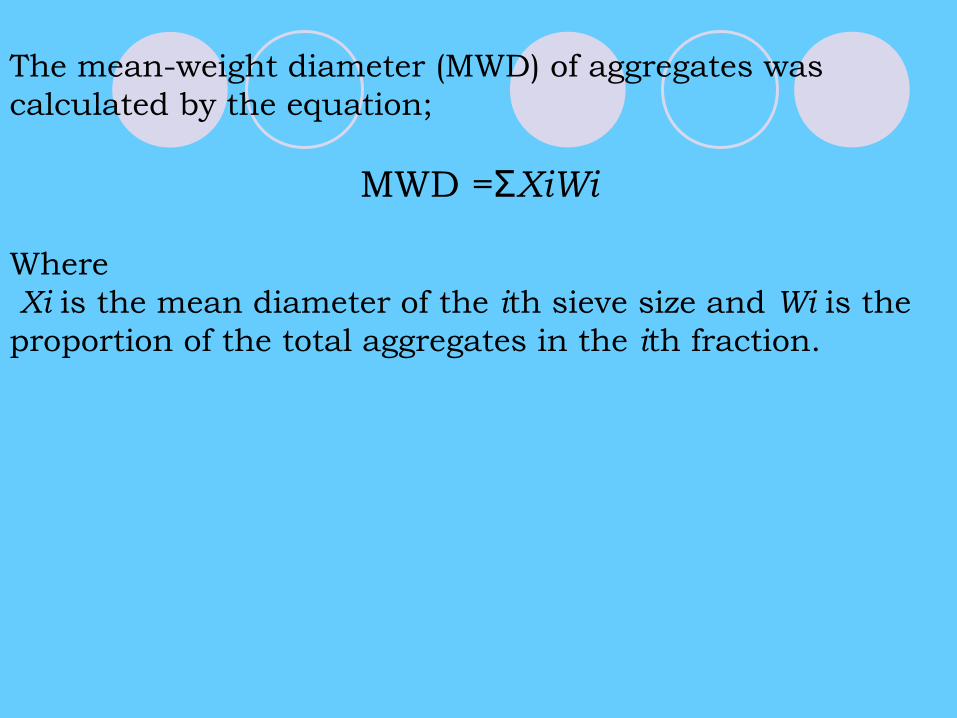
The mean-weight diameter (MWD) of aggregates was calculated by the equation;
MWD =ƩXiWi
Where Xi is the mean diameter of the ith sieve size and Wi is the proportion of the total aggregates in the ith fraction.

35
Table 1. Minimum, maximum, mean and coefficient of variation in measured parameter of 15 examined Soil
pH(1:2)
EC(1:2)d Sm-1
OM(%)
Lime(%)
SAR MWD(mm)
WSA(%)
Sand(%)
Silt(%)
Clay(%)
Minimum
7.39 0.088 0.16 0.00 0.61 0.106 6.82 12.10 16.00 20.00
Maximum
9.46 0.77 1.08 11.25 9.57 0.800 22.56 64.00 59.80 38.10
Mean 8.15 0.321 0.64 3.20 3.71 0.426 16.59 35.54 37.38 27.08
CV (%)
7.10 58.24 39.89 115.7 76.51 50.60 29.27 43.32 34.17 24.29

Table 2. Linear Correlation Coefficient between structure stability indicator and soil characteristics
pH(1:2)
EC(1:2)
OM(%)
MWD(mm)
WSA(%)
SAR Lime(%)
Clay(%)
Ec (1:2)
0.4370.103 ns
_ _ _ _ _ _ _
OM (%) 0.06460.009**
0.0100.972ns
_ _ _ _ _ _
MWD -0.7380.002**
-0.1030.714ns
0.9490.000**
_ _ _ _ _
WSA (%)
-0.5790.024**
-0.0140.961ns
0.5310.042*
0.5790.024*
_ _ _ _

Conti…….Table 2.Linear Correlation Coefficient between structure stability indicator and soil characteristics
pH(1:2)
EC(1:2)
OM(%)
MWD(mm)
WSA(%)
SAR Lime(%)
Clay(%)
SAR 0.0250.928ns
-0.475*0.073
0.1270.651ns
0.1730.537ns
-0.2430.384ns
_ _ _
Lime 0.688**0.005
0.798**0.000
-0.2820.308ns
-0.3580.190ns
-0.2080.458ns
-0.446*0.096
_ _
Clay 0.0129*0.646
0.0260.927ns
0.3930.148ns
0.465*0.080
0.4190.120ns
0.0340.905ns
0.1970.481ns
_
Silt -0.561**0.030
0.4110.128ns
0.732**0.002
0.692**0.004
0.4330.107ns
-0.2080.457ns
-0.0070.979ns
0.1820.517ns
Sand 0.05210.047ns
-0.3520.198ns
-0.755**0.001
-0.733**0.001
-0.538*0.039
0.1580.573ns
-0.0780.782ns
-0.578*0.024
** =P-value Significant at 5 % Probability level
*= P-value Significant at 10% Probability levelns = non-significant

Relationship between organic matter and mean weight diameter

Relationship between organic matter and Water stable aggregates
October, 17, 2007 39

Relationship between sand and mean weight diameter
October, 17, 2007 40

Relationship between organic matter and Sodium Adsorption Ratio

CONCLUSION
Soil aggregate stability is an important property of soil since it affects sustainability and crop production.
Based upon the results it can be concluded that stability
parameters are strongly related to soil organic matter status of soil as well as soil texture.
Maintaining of high organic matter levels is essential to improve higher aggregation.
