relationship between temperature and apparent shape of pristine
TRANSCRIPT

Atmos. Meas. Tech., 9, 3739–3754, 2016www.atmos-meas-tech.net/9/3739/2016/doi:10.5194/amt-9-3739-2016© Author(s) 2016. CC Attribution 3.0 License.
Relationship between temperature and apparent shape of pristineice crystals derived from polarimetric cloud radar observationsduring the ACCEPT campaignAlexander Myagkov1,a, Patric Seifert1, Ulla Wandinger1, Johannes Bühl1, and Ronny Engelmann1
1Leibniz Institute for Tropospheric Research (TROPOS), Permoserstr. 15, 04318, Leipzig, GermanyaRadiometer Physics GmbH (RPG), Werner-von-Siemens-Str. 4, 53340 Meckenheim, Germany
Correspondence to: Alexander Myagkov ([email protected])
Received: 24 November 2015 – Published in Atmos. Meas. Tech. Discuss.: 15 January 2016Revised: 5 June 2016 – Accepted: 15 June 2016 – Published: 12 August 2016
Abstract. This paper presents first quantitative estimationsof apparent ice particle shape at the top of liquid-toppedclouds. Analyzed ice particles were formed under mixed-phase conditions in the presence of supercooled water andin the temperature range from − 20 to −3 ◦C. The estima-tion is based on polarizability ratios of ice particles measuredby a Ka-band cloud radar MIRA-35 with hybrid polarimetricconfiguration. Polarizability ratio is a function of the geomet-rical axis ratio and the dielectric properties of the observedhydrometeors. For this study, 22 cases observed during theACCEPT (Analysis of the Composition of Clouds with Ex-tended Polarization Techniques) field campaign were used.Polarizability ratios retrieved for cloud layers with the cloud-top temperatures of ∼−5, ∼−8, ∼−15, and ∼−20 ◦Cwere 1.6, 0.9, 0.6, and 0.9, respectively. Such values corre-spond to prolate, quasi-isotropic, oblate, and quasi-isotropicparticles, respectively. Data from a free-fall chamber wereused for the comparison. A good agreement of detected ap-parent shapes with well-known shape–temperature depen-dencies observed in laboratories was found. Polarizability ra-tios used for the analysis were estimated for areas locatedclose to the cloud top, where aggregation and riming pro-cesses do not strongly affect ice particles. We concludedthat, in microwave scattering models, ice particles detectedin these areas can be assumed to have pristine shapes. It wasalso found that even slight variations of ambient conditionsat the cloud top with temperatures warmer than∼−5 ◦C canlead to rapid changes of ice crystal shape.
1 Introduction
Mixed-phase clouds are a crucial component of the Earth’sclimate system. Their long-lasting nature impacts the radia-tive budget and the thermodynamic structure of the atmo-sphere (Sun and Shine, 1995) and microphysical processesoccurring in mixed-phase clouds are the main source of pre-cipitation (Mülmenstädt et al., 2015).
Ground-based remote sensing has shown a large potentialfor improving the understanding of the life cycle of mixed-phase clouds (Hogan et al., 2003; Ansmann et al., 2009; DeBoer et al., 2009; Delanoë and Hogan, 2010; Kanitz et al.,2011; Westbrook and Illingworth, 2013). Even though micro-physical retrieval techniques based on ground-based remoteobservations are a valuable source of information for the in-vestigation of mixed-phase clouds, further developments arerequired in order to increase the accuracy of these retrievals.From the remote-sensing perspective, mixed-phase cloudswith a single supercooled liquid layer at the top and ice vir-gae below are of special interest (Wang et al., 2004; Smithet al., 2009). Below we denote such clouds as single-layerclouds. Single-layer clouds have less complex microphysicaland dynamical properties (Fleishauer et al., 2002; Ansmannet al., 2009; Zhang et al., 2012) compared to convective cloudsystems where more than 25 different transfer processes maytake place (Seifert and Beheng, 2006; Tao and Moncrieff,2009). Thus, studying ice formation in single-layer cloudsis key to obtaining a comprehensive picture of the formationof pristine ice crystals under ambient conditions.
Long-term polarimetric lidar observations showed that themajority of ice crystals in mixed-phase clouds are formed
Published by Copernicus Publications on behalf of the European Geosciences Union.

3740 A. Myagkov et al.: Shape–temperature relationship of pristine ice crystals
heterogeneously within a supercooled liquid layer (De Boeret al., 2011). Westbrook and Illingworth (2011) reportedthat about 95 % of ice particles at temperatures warmer than−20 ◦C originated from liquid-water particles. Thus, ambientconditions at the top of single-layer clouds play a crucial rolein the formation of ice particles. Microphysical properties ofpristine ice crystals under controlled ambient conditions havebeen intensively investigated in laboratories. In situ measure-ments in free-fall chambers provide information about mass,size, shape, apparent density, and fall velocity of ice crystalsat different stages of their development (Fukuta, 1969; Taka-hashi et al., 1991; Fukuta and Takahashi, 1999; Takahashi,2014). Such studies provide extremely accurate informationthat can be used for the interpretation of remote observationsand validation of retrieval techniques.
Important, yet barely explored, parameters are the shapeand apparent density of an ice crystal population. Estimatesof ice mass, area, or number concentration require accurateknowledge of particle shape (Westbrook and Heymsfield,2011; Delanoë et al., 2014). Radar polarimetry is knownto be a powerful tool for the classification of microphysicalproperties of hydrometeors such as ice crystals under ambi-ent conditions. In recent publications of Bühl et al. (2016)and Oue et al. (2015), vertically pointed cloud radars withlinear depolarization ratio (LDR) mode were used for quali-tative discrimination between columnar-shaped ice particlesand those of other types. In LDR mode a radar transmits ahorizontally polarized wave and receives horizontal (copo-larized) and vertical (cross-polarized) components of the re-turned signal. LDR is calculated as a ratio of the power inthe cross-polarized channel over the power in the copolar-ized channel. Quantitative shape estimations in LDR modeare limited by the strong dependence of polarimetric ob-servations on canting angles of cloud particles (Matrosovet al., 2001). Melnikov and Straka (2013) proposed an al-gorithm for the estimation of shape and orientation of par-ticles based on differential reflectivity ZDR and correlationcoefficient ρHV from a polarimetric weather radar with hy-brid mode. This mode employs a simultaneous transmissionof horizontally and vertically polarized components of theelectromagnetic wave and simultaneous reception of signalsin the horizontal and vertical channels. ZDR is calculated as aratio of the power received in the horizontal channel over thepower received in the vertical channel. ρHV is the correlationbetween the complex amplitudes of the received pulse se-quences in the horizontal and vertical receiving channel. Thedifferential reflectivity and the correlation coefficient are sen-sitive to shape, orientation, and dielectric properties of scat-terers (Straka et al., 2000). For the estimation, the authorsapproximated scattering properties of columnar-shaped andplate-like ice particles by prolate and oblate spheroids, re-spectively. Dielectric properties of ice particles depend onapparent ice density (Oguchi, 1983), which characterizes theratio of ice and air within the approximating spheroidal parti-cle. Observational weather radars are often operating nearly
horizontally (at low elevation angles of the antenna). The au-thors claimed that under such conditions prolate and oblateparticles can have similar polarimetric signatures and cannotbe reliably distinguished. As a result the method proposed byMelnikov and Straka (2013) is only applicable for data withvalues of ZDR higher than 4 dB. Such ZDR can be only in-duced by strongly oblate particles, which, therefore, can beundoubtedly separated from prolate particles. In contrast toweather radars, cloud radars are often operated in modes withscanning in azimuth and elevation directions (Kollias et al.,2014; Lamer et al., 2014; Ewald et al., 2015). Matrosov et al.(2012) showed observational evidence that elevation depen-dencies of polarimetric variables can be efficiently used todiscriminate between different types of ice particles.
In a previous study, Myagkov et al. (2016) combined thetwo mentioned approaches of Melnikov and Straka (2013)and Matrosov et al. (2012) into an algorithm for a quantita-tive characterization of shapes and orientations of ice parti-cles based on polarimetric observations from a newly devel-oped 35 GHz cloud radar with hybrid polarimetric configura-tion. This mode is widely used in polarimetric weather radarsbut is rarely implemented in cloud radars. The used cloudradar allowed for a calculation of the differential reflectivityand the correlation coefficients separately for every compo-nent of a Doppler spectrum (spectral line). Such informationcan be used for a characterization of particles moving withdifferent velocities. Note that within this study we only usepolarimetric variables calculated for the spectral line with themaximum amplitude (spectrum peak).
In the case of a monostatic radar, polarimetric scatter-ing properties of scatterers are often described by a 2× 2backscattering matrix. Elements of the backscattering ma-trix are scattering coefficients relating incident and scat-tered electric fields with certain polarizations. In the caseof Rayleigh scattering, i.e., when geometrical dimensions ofa particle are much smaller than the wavelength, the coeffi-cients of the backscattering matrix are functions of polariz-abilities of the particle along its axes. Values of polarizabili-ties depend on sizes along corresponding axes and dielectricproperties of the scatterer (Bringi and Chandrasekar, 2001).A spheroid is usually described by two polarizabilities alongthe major and minor axes. Thus, the ratio of polarizabili-ties can be used as the indicator for the scatterer shape. InMyagkov et al. (2016) we showed how polarimetric variablesmeasured by a cloud radar can be related to polarizability ra-tios and orientations of cloud particles.
Ice particles of different types have distinct polarimetricscattering signatures that are utilized in the retrieval. Thesedifferences get more pronounced when they are obtained fordifferent elevation angles of the radar antenna. For instance,differences in modeled polarimetric variables for oblate, pro-late, and spherical solid ice particles are shown in Fig. 1.Spherical particles (green curve in Fig. 1) have an axis ra-tio of 1. Thus, differential reflectivity and correlation coef-ficient are unity (in linear scale) for all elevation angles. For
Atmos. Meas. Tech., 9, 3739–3754, 2016 www.atmos-meas-tech.net/9/3739/2016/

A. Myagkov et al.: Shape–temperature relationship of pristine ice crystals 3741
40 60 80 100 120 140
0
1
2
3
4
5
6
7
Elevation angle [deg]
Diff
eren
tial r
efle
ctiv
ity [d
B]
Oblate ρe≈ 0.3Prolate ρe≈ 2.3Spherical ρe= 1
40 60 80 100 120 1400.86
0.88
0.9
0.92
0.94
0.96
0.98
1
1.02
1.04
Elevation angle [deg]
Cor
rela
tion
coef
ficie
nt
OblateProlateSpherical
( (a)
(b)
Figure 1. Elevation dependencies of modeled (a) ZDR and (b) ρHVfor strongly oblate (axis ratio � 1), strongly prolate (axis ratio �1), and spherical (axis ratio of 1) solid ice particles (apparent icedensity is 0.916 g cm−3). Polarizability ratios ρe of each particletype are given in the legend. Particles are assumed to be orientednearly horizontally with the degree of orientation ρa of 0.99. Thefigure is based on look-up tables given in Myagkov et al. (2016).
oblate particles with near-horizontal alignment (blue curve inFig. 1), differential reflectivity and correlation coefficient are1 at an elevation of 90◦. For elevations differing from 90◦,differential reflectivity increases strongly due to the higherscattering at horizontal polarization. Nevertheless, the corre-lation coefficient remains close to unity because the cantingangles of the horizontally aligned oblate particles do not varystrongly. For the prolate particles (red curve in Fig. 1) ori-ented nearly horizontally, differential reflectivity also tendsto be higher at lower elevation angles. However, the uniformdistribution of the prolate particles in the horizontal planecauses a strong elevation dependence of the correlation coef-ficient.
The algorithm contains two steps. First, using elevationdependencies of ZDR and ρHV ice particles are classified aseither oblate or prolate. Second, at a certain altitude polar-izability ratio ρe and degree of orientation ρa are estimatedfrom ZDR and ρHV for every elevation angle in the range
0.01 0.1 1 10 100
0.4
0.6
0.8
1.0
1.2
1.4
1.6
1.8
2.0
2.20.916 g cm–3
0.8 g cm3
0.6 g cm3
0.4 g cm3
0.2 g cm3
Axis ratio
Pol
ariz
abili
ty r
atio
ρe
–
–
–
–
–
Figure 2. Dependencies of polarizability ratio ρe on axis ratio of aspheroid for different apparent densities of ice. The figure is adoptedfrom Myagkov et al. (2016).
from 30 to 60◦. Note that 90◦ elevation corresponds to thezenith direction. For every altitude mean and standard devia-tion of ρe and ρa are calculated.
As it was mentioned above, the polarizability ratio ρe de-pends on shapes and dielectric properties of scatterers. Thedependence of ρe on geometrical axis ratio of ice particlesand their apparent ice density are illustrated in Fig. 2. The de-gree of orientation ρa characterizes the width of the cantingangle distribution. It is assumed that the mean orientation ofice particles is horizontal. It should be noted that within thisstudy polarizability ratio is used as the indicator for particleshape. Only for known dielectric properties, which dependmainly on the apparent ice density, can the polarizability ra-tio be converted into a geometrical axis ratio. The algorithmwas applied to a complex cloud system observed during theACCEPT (Analysis of the Composition of Clouds with Ex-tended Polarization Techniques) field campaign in Cabauw,the Netherlands. Even though the results of the retrieval donot contradict other studies, the additional validation of theretrieved parameters would be of benefit. Note that in thispaper we only analyze polarizability ratios ρe.
During the ACCEPT campaign the performance of thehybrid-mode cloud radar was evaluated, but in situ obser-vations were not available. Nevertheless, a number of ac-tive and passive remote sensors that were deployed duringthe campaign can be used for the determination of ambi-ent conditions under which ice crystals were formed. Withinthis study, we use such information to indirectly validate theretrieval presented in Myagkov et al. (2016) by comparingthe obtained microphysical properties of ice crystals withthose grown in a wind tunnel under laboratory conditionsand present an analysis of 22 case studies from the ACCEPTcampaign.
The paper is organized as follows. Section 2 describes theinstruments used for this study and the data set. Five casestudies are presented in detail in Sect. 3. The results of the
www.atmos-meas-tech.net/9/3739/2016/ Atmos. Meas. Tech., 9, 3739–3754, 2016

3742 A. Myagkov et al.: Shape–temperature relationship of pristine ice crystals
Table 1. The list of used instruments.
Instrument Main specifications Measurements Reference
Cloud radar MIRA-35 Frequency: 35.5 GHzConfiguration: LDRPointing: zenithTemporal resolution: 1 sRange resolution: 30 m
Equivalent radar reflectivityfactor, LDR, mean Doppler ve-locity, Doppler width, completespectra
Görsdorf et al. (2015)
Cloud radar MIRA-35 Frequency: 35.17 GHzConfiguration: hybridPointing: scanningTemporal resolution: 1 sRange resolution: 30 m
Equivalent radar reflectivityfactor, mean Doppler veloc-ity, Doppler width, completespectra, differential reflec-tivity, correlation coefficient,differential phase shift
Myagkov et al. (2016)
Multiwavelength Raman lidar PollyXT Wavelengths: 355, 532, 1064 nmPointing: 5◦ off-zenithTemporal resolution: 30 sRange resolution: 7.5 m
Backscatter coefficient at threewavelengths, volume depolar-ization ratio at 532 nm
Engelmann et al. (2016)
Microwave radiometer HATPRO Bands: 22–31 GHz,51–58 GHzTemporal resolution: 1 s
Brightness temperatures, tem-perature profile, liquid-waterpath
Rose et al. (2005)
Radiosonde Vaisala RS92 Variable resolution Temperature, pressure, relativehumidity, wind
Suortti et al. (2008)
analysis of the 22 cases and their comparison with laboratorystudies are presented in Sect. 4. Summary and conclusion aregiven in Sect. 5.
2 Instrumentation and data set
The ACCEPT measurement campaign was initiated by theLeibniz Institute for Tropospheric Research (TROPOS),Leipzig, Germany, the Technical University of Delft, theNetherlands, and METEK GmbH, Elmshorn, Germany,within the ITaRS (Initial Training for atmospheric RemoteSensing) project. The major goal of the campaign was toevaluate the polarimetric capabilities of a newly developedpolarimetric cloud radar of type MIRA-35 and to estimatethe potential of its implementation into existing observationalstations. The cloud radar had the hybrid polarimetric configu-ration. A detailed description can be found in Myagkov et al.(2016). In the following, we denote this radar as the hybrid-mode MIRA-35.
The campaign took place from 7 October to 17 Novem-ber 2014 at the Cabauw Experimental Site for Atmo-spheric Research (CESAR), located in the Netherlands(51.971◦ N, 4.927◦ E). The CESAR observatory operated byRoyal Netherlands Meteorological Institute (KNMI) is wellequipped with a broad range of atmospheric remote-sensinginstruments. In addition to the instruments available at CE-SAR and the hybrid-mode MIRA-35, which was rented fromMETEK GmbH, the main instruments of the Leipzig Aerosoland Cloud Remote Observations System (LACROS; Bühlet al., 2013) were brought to Cabauw. In Table 1 the instru-ments that were used for this particular study are presented.
As mentioned before, the shape retrieval of Myagkovet al. (2016) requires information about the elevation de-pendencies of the polarimetric variables differential reflec-tivity ZDR and correlation coefficient ρHV. Therefore, weinstalled the hybrid-mode MIRA-35 into the scanning unitof the LACROS container. An implemented scanning cycletook 15 min and included two elevation (range–height indi-cator, RHI) scans from 30 to 150◦. The elevation scans wereperformed perpendicular in azimuthal direction with 0.5◦ s−1
angular velocity. For an accurate determination of the polari-metric variables it is required to correct for antenna couplingeffects. Within every scanning cycle the radar was pointedvertically for several minutes. This allowed us to use occa-sional light rain events for calibration of polarimetric vari-ables as explained in Myagkov et al. (2015, 2016).
During the campaign a second cloud radar MIRA-35 wasoperated as well. The radar is owned by TROPOS and has theconventional linear depolarization configuration. Hereafterthis radar is denoted as LDR-mode MIRA-35. The radar wasunmounted from the scanning unit of the LACROS containerand installed into a trailer without scanning unit and, thus,was pointed vertically. In order to avoid interference betweenthe two cloud radars, their operation frequencies were set todiffer by approximately 300 MHz (35.17 vs. 35.5 GHz forhybrid-mode and LDR-mode MIRA-35, respectively). Ad-ditionally, the trailer was placed about 30 m away from theLACROS container to avoid any near-field interference. Inthis study, we use data from LDR-mode MIRA-35 to esti-mate the temporal and spatial dimensions of the observedcloud systems. Moment data from LDR-mode MIRA-35
Atmos. Meas. Tech., 9, 3739–3754, 2016 www.atmos-meas-tech.net/9/3739/2016/

A. Myagkov et al.: Shape–temperature relationship of pristine ice crystals 3743
are available at http://lacros.rsd.tropos.de/cloudnet/cloudnet.php.
When both liquid-water droplets and ice crystals arepresent in a volume, cloud radar alone can hardly detect theliquid-water signatures. It is, however, well known that po-larimetric lidars are powerful tools for the detection of su-percooled liquid particles within mixed-phase clouds (Schot-land et al., 1971; Seifert et al., 2010). We employed themultiwavelength Raman lidar PollyXT for this purpose (Al-thausen et al., 2009; Engelmann et al., 2016). The lidar wasset up near the Cabauw meteorological tower, which is lo-cated about 300 m north from the measurement site wheremost of the other instruments were operated. In order to avoidspecular reflection from horizontally aligned planar surfacesof ice crystals the laser beam of PollyXT was pointed to 5◦
off-zenith (85◦ elevation). The container with the lidar wasoriented in such a way that the beam was above the radar siteat about 4 km height.
Temperature is the main parameter controlling the effi-ciency of heterogeneous nucleation of ice crystals (DeMottet al., 2015) and it is lowest at cloud top. Therefore, in thisstudy cloud-top temperature is used as the reference parame-ter when crystal properties are investigated. In order to re-trieve the temperature at the cloud tops, we used, in or-der of priority, either locally launched radiosondes, the mi-crowave radiometer HATPRO, or assimilated meteorologi-cal data sets. Radiosondes of type Vaisala RS-92 were occa-sionally launched on-site. When no local radiosonde infor-mation was available, radiosonde data from the 00:00 UTClaunch at De Bilt (WMO code: 06260; 20 km northeast ofCESAR site) were used in case the cloud was observedaround 00:00 UTC. When no recent radiosonde ascent wasavailable, temperature data of HATPRO were used in non-precipitating conditions. Data from HATPRO are availableat http://lacros.rsd.tropos.de/cloudnet/cloudnet.php. Finally,for precipitating cases, when the operation of the microwaveradiometer is hampered, we used temperature profiles fromthe GDAS1 data set (NOAA, 2016, available at: http://ready.arl.noaa.gov/gdas1.php) provided by the Global Data Assim-ilation System (GDAS; Kanamitsu, 1989) operated by the USNational Center for Environmental Prediction (NCEP).
For the analysis we have manually chosen 22 cases of mid-level mixed-phase clouds meeting the following criteria.
1. The hybrid-mode MIRA-35 was operating and the mea-sured signal-to-noise ratio (SNR) was high enough toretrieve calibrated polarimetric variables according toMyagkov et al. (2016). The exact value of the thresh-old in SNR depends on polarization properties of thescatterers and the polarization decoupling of the usedantenna. For particles that did not produce depolariza-tion, the applied threshold in SNR was about 30 dB.Data with SNR lower than the corresponding thresholdwere not considered for the following analysis.
2. The investigated cloud layer did not experience seedingfrom upper clouds.
3. The calibrated polarimetric variables were available formore than 50 % of data points in elevation dimensionwithin a half-scan of the hybrid-mode MIRA-35. Thisis a basic criterion for the horizontal homogeneity ofthe analyzed cloud layer. Note that the cloud spatial ho-mogeneity is not a major assumption of the retrieval al-gorithm. Instead, it is assumed that ice particles presentat the same altitude (same ambient conditions) have thesame shape, even when the cloud is not spatially homo-geneous (Myagkov et al., 2016).
4. Cloud-top temperatures were in the range from ≈−20to ≈−0 ◦C. Ice crystals formed at such temperaturesunder water saturation conditions have a clear primaryshape (Bailey and Hallett, 2009). At lower temperaturesice particles can have a variety of shapes at a certaintemperature (Bailey and Hallett, 2004), which can sig-nificantly influence the shape retrieval.
5. For non-precipitating cases lidar data should be avail-able.
6. At temperatures above −5 ◦C the presence of ice crys-tals should be confirmed. For cases without liquid pre-cipitation ice virgae produce strong volume depolariza-tion (> 0.2) of the lidar signal. For precipitating casesa melting layer is an indicator of ice presence. Whennone of the two checks were positive, the layer was ex-cluded from further analysis.
The used cases are listed in the Supplement. In the idealcase, analyzed cloud layers should not produce precipitationto permit the usage of lidar and radiometer data. Neverthe-less, most of the clouds with cloud-top temperatures warmerthan −5 ◦C that fulfilled the requirements 1 and 2 producedprecipitation.
3 Examples of the shape retrieval
In this section we show five examples of the shape estima-tion retrieval of Myagkov et al. (2016) based on elevationscans of differential reflectivity and correlation coefficient.As case studies we chose mixed-phase clouds with differentcloud-top temperatures that were observed during the AC-CEPT campaign. Several types of formed ice crystals wereclearly identified by the hybrid-mode MIRA-35. The fifthcase study indicates that slight variations of cloud-top alti-tude can lead to changes from oblate to prolate shape.
3.1 Case 1
Figure 3a and b represent height–time cross sections of theequivalent radar reflectivity Ze and LDR measured by LDR-mdoe MIRA-35. These parameters were calculated using the
www.atmos-meas-tech.net/9/3739/2016/ Atmos. Meas. Tech., 9, 3739–3754, 2016

3744 A. Myagkov et al.: Shape–temperature relationship of pristine ice crystals
Time [UTC]
Hei
ght [
km]
15:00 15:10 15:20 15:30 15:40 15:50 16:000
2
4
6
8
10
−35
−30
−25
−20
−15
−10
−5
0
Time [UTC]
Hei
ght [
km]
15:00 15:10 15:20 15:30 15:40 15:50 16:000
2
4
6
8
10
−60
−40
−20
0
20
Time [UTC]
Hei
ght [
km]
15:00 15:10 15:20 15:30 15:40 15:50 16:000
2
4
6
8
10
−7
−6
−5
−4
−3
−2
Time [UTC]
Hei
ght [
km]
15:00 15:10 15:20 15:30 15:40 15:50 16:000
2
4
6
8
10
0
0.1
0.2
0.3
0.4
0.5
0.6
Range [km]
Hei
ght [
km]
−10 −8 −6 −4 −2 0 2 4 6 8 100
1
2
3
4
5
6
0.95
0.96
0.97
0.98
0.99
1
Range [km]
Hei
ght [
km]
−10 −8 −6 −4 −2 0 2 4 6 8 100
1
2
3
4
5
6
0
1
2
3
4
(a) Equivalent radar reflectivity [dBZ] (b) Radar linear depolarization ratio [dB]
(c) Attenuated backscatter coefficient, 1064 nm [log(sr m )]-1 -1 (d) Volume linear depolarization ratio, 532 nm
(e) Differential reflectivity, 15:16–15:20 UTC [dB]
(f) Correlation coefficient, 15:16–15:20 UTC
0.45 0.55 0.65 0.754.5
4.6
4.7
4.8
4.9
5
5.1
5.2
Hei
ght [
km]
Polarizability ratio
(g) Left half-scan (h) Right half-scan
4.5
4.6
4.7
4.8
4.9
5
5.1
5.2
Hei
ght [
km]
Polarizability ratio−14 −13 −12 −11 −10 −9
Temperature [˚C]
(i) MWR HATPRO, 15:16 UTC
4.5
4.6
4.7
4.8
4.9
5
5.1
5.2
Hei
ght [
km]
(j) Photo from TARA camera
0.45 0.55 0.65 0.75
Figure 3. Case study of ice crystal shapes observed with hybrid-mode MIRA-35 on 12 October 2014 at Cabauw, the Netherlands. Shown aretime–height cross sections of the following parameters: (a) equivalent radar reflectivity Ze from LDR MIRA-35; (b) radar linear depolariza-tion ratio from LDR-mode MIRA-35; (c) attenuated backscatter coefficient at 1064 nm from Polly-XT; and (d) volume linear depolarizationratio at 532 nm from PollyXT. Range–height cross sections of (e) differential reflectivity ZDR and (f) correlation coefficient ρHV measuredby hybrid MIRA-35. (g, h) Vertical profiles of polarizability ratio for the left and right half-scans. (i) Vertical temperature profile from themicrowave radiometer HATPRO. (j) Photo taken by a web camera installed at the CESAR site. The red rectangle shows the analyzed cloudlayer and the time period corresponding to a full elevation scan of hybrid-mode MIRA-35. Ze and LDR were calculated from total powersin the co- and cross-channels. ZDR and ρHV were obtained for the spectral peaks. Note that ZDR and ρHV are not corrected for the antennacoupling here to make figures more illustrative. Red horizontal lines in (g, h, i) represents the cloud top. Vertical profiles in (g) and (h)indicated by red lines correspond to mean values of polarizability ratio. Horizontal blue bars in (g) and (h) denote 2 standard deviations ofpolarizability ratio.
Atmos. Meas. Tech., 9, 3739–3754, 2016 www.atmos-meas-tech.net/9/3739/2016/

A. Myagkov et al.: Shape–temperature relationship of pristine ice crystals 3745
total powers of the received signals in the co- and cross-polarized channels. A cloud system observed on 12 October2014 at 15:00–16:00 UTC is depicted. The radar observeda cloud layer with the top at around 5.2 km height. From15:32 UTC the cloud layer was influenced by a higher-levelcloud with a top height at 6 km. For the analysis we thuschose the time period 15:16–15:20 UTC when the high-levelcloud did not cause any seeding effects to the lower layer.Within the chosen period the SNR was high enough to ap-ply the shape retrieval algorithm. In contrast, ice develop-ment in this period was not as intensive as the one starting at15:20 UTC, which is confirmed by about 10 dB lower valuesof Ze. Figure 3b shows that in the cloud layer ice particlesdid not produce depolarization. Observed values of LDR arevery close to the minimum observable LDR of −31 dB. InFig. 3c and d the attenuated backscatter coefficient and thevolume linear depolarization ratio measured by PollyXT arepresented, respectively. A single liquid layer indicated by in-creased values of the backscatter coefficient can be clearlyseen at the top of the cloud layer. Low values of volume de-polarization ratio within the liquid layer are caused by thespherical shape of supercooled water drops. It is noticeablethat values of volume depolarization ratio were also low inthe ice virga. The reason for this behavior is unclear, con-sidering that PollyXT is pointed 5◦ off-zenith to prevent theinfluence of specular reflection at planar planes of horizon-tally aligned crystals. It may thus be a distinct microphysicalfeature of the ice crystals formed at the given temperature.
A photograph of the analyzed cloud layer is shown inFig. 3j. It can be seen that the cloud is spatially homoge-neous. Figure 3e and f depict the differential reflectivity ZDRand the correlation coefficient ρHV measured by the hybrid-mode MIRA-35, which were calculated for the spectrumpeaks. Note that we plot the RHI scans of ZDR and ρHV un-corrected for the polarization coupling to make figures moreillustrative. After the correction the amount of data points ismuch lower. Nevertheless, for the shape retrieval algorithmshown below we use the corrected values. Strong elevationdependencies can be seen in ZDR and ρHV. At 90◦ elevation,the differential reflectivity is almost 0 whereas it reaches val-ues of 3 dB at lower elevations. The correlation coefficienthas values close to 1 in zenith direction, while its values atlower elevations reach 0.98.
Using the corrected values of ZDR and ρHV we re-trieved polarizability ratios separately for the left andright half-scans. For the antenna coupling correction weused vertical measurements of rain on 12 October 2014,19:00–20:00 UTC. Results of the retrievals are given inFig. 3g and h. The value of the polarizability ratio close tothe cloud top is of special interest because there ice particlesshould be least influenced by processes such as aggregationand riming, which would lead to a deviation of the crystalshape from its pristine state. Unfortunately, often the SNR atthe cloud top is too low to apply the retrieval. The retrievedvalues of the polarizability ratio closest to the cloud top is
0.62±0.09, which corresponds to oblate spheroids. The dis-tance from the cloud top is about 150 m. Figure 3i representsa temperature profile retrieved from the microwave radiome-ter HATPRO. It can be seen that at the cloud top, where icecrystals are formed, the temperature was around −14.9 ◦C.
3.2 Case 2
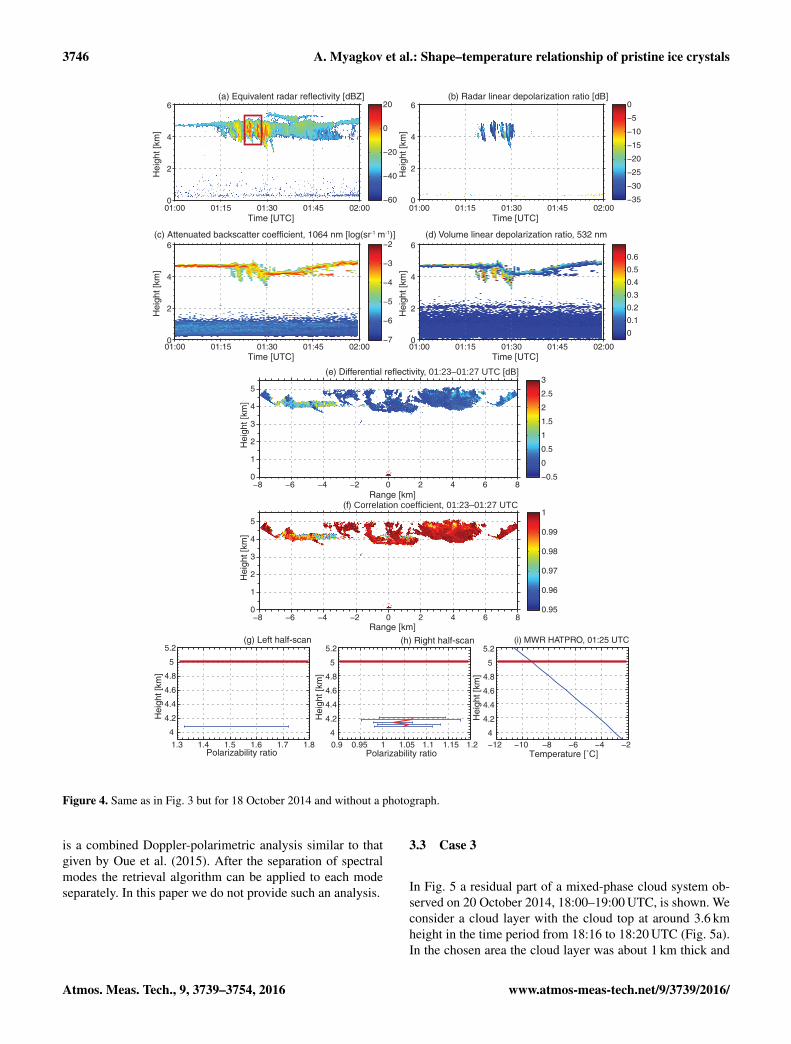
An analysis of a mid-level mixed-phase cloud observed on18 October 2014 at 01:00–02:00 UTC is given in Fig. 4. Thetime period chosen for the retrieval is 01:23–01:27 UTC. Thecloud top estimated from equivalent radar reflectivity mea-sured by LDR-mode MIRA-35 (Fig. 4a) was at a heightof around 5 km. The thickness of the cloud layer exceeded1.2 km. Reflectivity values reached values as high as 10 dBZthat indicate the presence of large ice particles. LDR valuesregistered by LDR-mode MIRA-35 for the analyzed periodwere mostly low even though areas with increased LDR (upto −17 dB) can be seen occasionally at 4–4.5 km height. Atthe top of the cloud a liquid layer characterized by high at-tenuated backscatter coefficients and low volume depolariza-tion ratios (Fig. 4c and d, respectively) is visible. It should benoted that in the second half of the analyzed period the lidaralso detected an internal liquid layer at 4.5 km height. In con-trast to case 1, where low volume depolarization ratios wereobserved with PollyXT, the ice virgae observed in case 2 pro-duced volume depolarization ratios exceeding 0.5.
Elevation scans of the differential reflectivity and the cor-relation coefficient depicted in Fig. 4e and f, respectively,show that the cloud was spatially inhomogeneous. Within theright half-scan only slight angular changes in ZDR and ρHVare visible. In the left half-scan high ZDR and low ρHV val-ues were observed at lower elevations at 4.5 km height, wherethe lidar detected the internal liquid layer. For the correctionof the polarization coupling we used vertical measurementsin a short precipitation event on 18 October 2014, 02:30–02:50 UTC. The results of the shape retrieval are shown inFig. 4g and h. It can be seen that due to the spatial inho-mogeneity the calculated polarizability ratios are availableonly for a limited number of range bins. Nevertheless, theresults show that in the left half-scan prolate particles char-acterized by the polarizability ratio of 1.52± 0.2 were de-tected. In the right half-scan the polarizability ratios closestto the cloud top were 1.07± 0.1. Such values correspond toparticles with quasi-spherical shapes and/or low apparent icedensity. Below we denote such particles as quasi-isotropicas they do not change the polarization of the scattered wavesignificantly. The distances from the liquid layers where pro-late and quasi-isotropic particles formed were about 0.4 and0.8 km, respectively. Figure 4i shows that temperatures atliquid-layer heights were−6.1 and−9.3 ◦C, respectively. Wepoint out that the coexistence of different types of particlescan lead to misclassification of prolate and oblate particles.The spectral peaks at different elevations can be dominatedby different particles. One of the ways to avoid this influence
www.atmos-meas-tech.net/9/3739/2016/ Atmos. Meas. Tech., 9, 3739–3754, 2016
3746 A. Myagkov et al.: Shape–temperature relationship of pristine ice crystals
Time [UTC]
Hei
ght [
km]
−35
−30
−25
−20
−15
−10
−5
0
Time [UTC]
Hei
ght [
km]
−60
−40
−20
0
20
Time [UTC]
Hei
ght [
km]
−7
−6
−5
−4
−3
−2
Time [UTC]
Hei
ght [
km]
0
0.1
0.2
0.3
0.4
0.5
0.6
Range [km]
Hei
ght [
km]
Range [km]
Hei
ght [
km]
(a) Equivalent radar reflectivity [dBZ] (b) Radar linear depolarization ratio [dB]
(c) Attenuated backscatter coefficient, 1064 nm [log(sr-1 m-1)] (d) Volume linear depolarization ratio, 532 nm
(e) Differential reflectivity, 01:23–01:27 UTC [dB]
(f) Correlation coefficient, 01:23–01:27 UTC
Hei
ght [
km]
Polarizability ratio
(g) Left half-scan (h) Right half-scan
Hei
ght [
km]
Polarizability ratio Temperature [˚C]
(i) MWR HATPRO, 01:25 UTC
Hei
ght [
km]
01:00 01:15 01:30 01:45 02:000
2
4
6
01:00 01:15 01:30 01:45 02:000
2
4
6
01:00 01:15 01:30 01:45 02:000
2
4
6
01:00 01:15 01:30 01:45 02:000
2
4
6
−8 −6 −4 −2 0 2 4 6 80
1
2
3
4
5
−0.5
0
0.5
1
1.5
2
2.5
3
−8 −6 −4 −2 0 2 4 6 80
1
2
3
4
5
0.95
0.96
0.97
0.98
0.99
1
1.3 1.4 1.5 1.6 1.7 1.8
4
4.2
4.4
4.6
4.8
5
5.2
0.9 0.95 1 1.05 1.1 1.15 1.24
4.2
4.4
4.6
4.8
5
5.2
−12 −10 −8 −6 −4 −24
4.2
4.4
4.6
4.8
5
5.2
Figure 4. Same as in Fig. 3 but for 18 October 2014 and without a photograph.
is a combined Doppler-polarimetric analysis similar to thatgiven by Oue et al. (2015). After the separation of spectralmodes the retrieval algorithm can be applied to each modeseparately. In this paper we do not provide such an analysis.
3.3 Case 3
In Fig. 5 a residual part of a mixed-phase cloud system ob-served on 20 October 2014, 18:00–19:00 UTC, is shown. Weconsider a cloud layer with the cloud top at around 3.6 kmheight in the time period from 18:16 to 18:20 UTC (Fig. 5a).In the chosen area the cloud layer was about 1 km thick and
Atmos. Meas. Tech., 9, 3739–3754, 2016 www.atmos-meas-tech.net/9/3739/2016/

A. Myagkov et al.: Shape–temperature relationship of pristine ice crystals 3747
Time [UTC]
Hei
ght [
km]
−35
−30
−25
−20
−15
−10
−5
0
Time [UTC]
Hei
ght [
km]
−60
−40
−20
0
20
Time [UTC]
Hei
ght [
km]
−7
−6
−5
−4
−3
−2
Time [UTC]
Hei
ght [
km]
0
0.1
0.2
0.3
0.4
0.5
0.6
Range [km]
Hei
ght [
km]
Range [km]
Hei
ght [
km]
(a) Equivalent radar reflectivity [dBZ] (b) Radar linear depolarization ratio [dB]
(c) Attenuated backscatter coefficient, 1064 nm [log(sr-1 m-1)] (d) Volume linear depolarization ratio, 532 nm
(e) Differential reflectivity, 18:16–18:20 UTC [dB]
(f) Correlation coefficient, 18:16–18:20 UTC
Hei
ght [
km]
Polarizability ratio
(g) Left half-scan (h) Right half-scan
Hei
ght [
km]
Polarizability ratio Temperature [˚C]
(i) MWR HATPRO 18:20 UTC
Hei
ght [
km]
−6 −4 −2 0 2 4 60
1
2
3
0.9
0.92
0.94
0.96
0.98
1
−6 −4 −2 0 2 4 60
1
2
3
0
1
2
3
4
5
18:00 18:15 18:30 18:45 19:000
1
2
3
4
5
18:00 18:15 18:30 18:45 19:000
1
2
3
4
5
18:00 18:15 18:30 18:45 19:000
1
2
3
4
5
18:00 18:15 18:30 18:45 19:000
1
2
3
4
5
1.4 1.5 1.6 1.72.5
3
3.5
4
1.4 1.5 1.6 1.7 1.82.5
3
3.5
4
−8 −6 −4 -2 02.5
3
3.5
4
Figure 5. Same as in Fig. 3 but for 20 October 2014 and without a photograph.
the radar reflectivity reached −10 dBZ. The cloud layer didnot experience seeding from the higher cloud layer. High val-ues of LDR (Fig. 5b) that reached up to−15 dB indicated thepresence of strongly non-spherical scatterers. In Fig. 5c and denhanced values of the attenuated backscatter coefficient andlow volume depolarization ratios at the top of the cloud layerindicated the presence of a single supercooled liquid layer.
The average volume depolarization ratio in the ice virga was∼ 0.3.
Figure 5e and f show that the cloud layer was spatially ho-mogeneous. Strong angular dependencies in ZDR and ρHVcan be clearly seen. Changes in differential reflectivity wereup to 2 and 4 dB within the left and right half-scans, respec-tively. It is noticeable that the correlation coefficient ρHV
www.atmos-meas-tech.net/9/3739/2016/ Atmos. Meas. Tech., 9, 3739–3754, 2016

3748 A. Myagkov et al.: Shape–temperature relationship of pristine ice crystals
Time [UTC]
Hei
ght [
km]
−35
−30
−25
−20
−15
−10
−5
0
Time [UTC]
Hei
ght [
km]
−60
−40
−20
0
20
Time [UTC]
Hei
ght [
km]
−7
−6
−5
−4
−3
−2
Time [UTC]
Hei
ght [
km]
0
0.1
0.2
0.3
0.4
0.5
0.6
Range [km]
Hei
ght [
km]
Range [km]
Hei
ght [
km]
(a) Equivalent radar reflectivity [dBZ] (b) Radar linear depolarization ratio [dB]
(c) Attenuated backscatter coefficient, 1064 nm [log(sr-1 m-1)] (d) Volume linear depolarization ratio, 532 nm
(e) Differential reflectivity, 02:53–02:57 UTC [dB]
Hei
ght [
km]
Polarizability ratio
(g) Left half-scan (h) Right half-scan
Hei
ght [
km]
Polarizability ratio Temperature [˚C]
(i) Radiosonde De Bilt, 00:00 UTC
Hei
ght [
km]
02:00 02:15 02:30 02:45 03:000
2
4
6
02:00 02:15 02:30 02:45 03:000
2
4
6
02:00 02:15 02:30 02:45 03:000
2
4
6
02:00 02:15 02:30 02:45 03:000
2
4
6
−8 −6 −4 −2 0 2 4 6 8−0.5
0
0.5
1
1.5
2
2.5
3
−8 −6 −4 −2 0 2 4 6 80.95
0.96
0.97
0.98
0.99
1
0
1
2
3
4
5
6
0
1
2
3
4
5
6
0.8 0.9 1 1.1 1.2 1.3
3.5
4
4.5
5
5.5
−20 −18 −16 −14 −12 −10 −8 −60.8 0.9 1 1.1 1.2
3.5
4
4.5
5
5.5
3.5
4
4.5
5
5.5
(f) Correlation coefficient, 02:53–02:57 UTC
Figure 6. Same as in Fig. 3 but for 10 November 2014 and without a photograph.
had its minimum in zenith-pointing direction and approachedhigher values at lower elevations. We showed an example inMyagkov et al. (2016) that such signatures are specific forprolate particles. For the polarization coupling correction weused vertical observations in a light rain event on 21 October2014, 08:00–09:00 UTC. The results of the shape retrievalare depicted in Fig. 5g and h. Retrieved polarizability ratios
are slightly higher in the right half-scan, which is caused bythe observed increased values of ZDR. The polarizability ra-tios closest to the cloud top are 1.5±0.16. The distance fromthe cloud top is about 240 m. A temperature profile retrievedfrom the microwave radiometer HATPRO indicated that thetemperature at the cloud top was −6.1 ◦C (see Fig. 5i).
Atmos. Meas. Tech., 9, 3739–3754, 2016 www.atmos-meas-tech.net/9/3739/2016/

A. Myagkov et al.: Shape–temperature relationship of pristine ice crystals 3749
3.4 Case 4
A complex mixed-phase cloud system observed on10 November 2014, 02:00–03:00 UTC, is presented in Fig. 6.A cloud layer with the cloud top at around 5 km height in thetime period 02:53–02:57 UTC is considered for the analysis.The cloud layer was more than 2 km thick. The equivalentradar reflectivity at the cloud top did not exceed −10 dBZ,while it reached values up to 10 dBZ towards the cloud bot-tom (Fig. 6a). LDR values measured by LDR-mode MIRA-35 were about −30 dB (Fig. 6b). In Fig. 6c it can be seenthat the laser beam often could not penetrate through thewhole cloud layer because of strong attenuation. Neverthe-less, some indications of liquid water at the cloud top arepresent. For example, two areas at 5.4 km height character-ized by the low volume depolarization ratio can be identified(see Fig. 6d). There is also a thick internal liquid layer atabout 4 km height visible in Fig. 6d, which is specified bythe increased attenuated backscatter coefficient and the lowvolume depolarization ratio.
Figure 6e and f show almost no angular dependencies ofZDR and ρHV. Some slight changes are visible at 4 km heightwhere the lidar detected the internal liquid layer. For the cor-rection of the antenna coupling we used observations duringa short precipitation event on 1 November 2014 at 17:00–18:00 UTC. The retrieved polarizability ratios were close to1, characterizing quasi-isotropic particles. The retrieved pro-files indicated rapid changes of the polarizability ratio from0.92 to 1.05, e.g., from a height of 4.5 to 4.8 km in the lefthalf-scan. Such changes result from misclassification of pro-late and oblate particles which is caused by a variability inZDR and ρHV due to measurement noise and/or differencesin scattering properties of ice populations. Biases in polari-metric variables caused by the polarization coupling also leadto an inaccurate classification. Without the polarization cou-pling correction given by Myagkov et al. (2015) the misclas-sification for the used radar would occur in the range of polar-izability ratios from 0.8 to 1.2. For the following analysis wechose the polarizability ratio of 0.92± 0.08 observed 450 mbelow the cloud top. The temperature measured at 5.5 kmheight by the radiosonde launched at midnight from De Biltwas about −20 ◦C.
3.5 Case 5
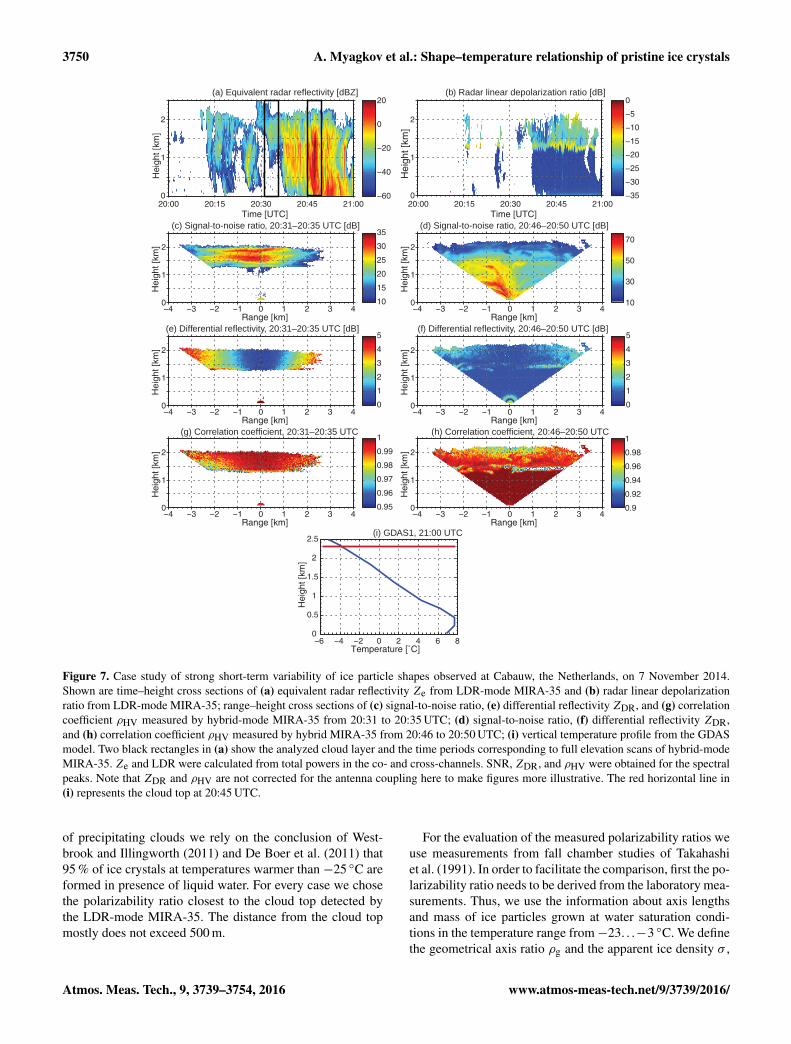
Figure 7 depicts a precipitating cloud system with the cloudtop located at around 2.3 km height, which was observedon 7 November 2014, 20:00–21:00 UTC. The SNR in thiscase was not high enough to retrieve polarizability ratios, al-though elevation dependencies of the measured polarimetricvariables allow us to classify the general shape of the ob-served ice particles. We analyzed two scans performed by thehybrid-mode MIRA-35 which correspond to the time periodsshown in Fig. 7a enframed by black rectangles. The time gapbetween these periods is 11 min. It can be seen that values
of Ze in the first period do not exceed −15 dBZ. Ice forma-tion was not intensive enough to produce precipitation reach-ing the ground. Corresponding ice particles caused low depo-larization, which is indicated by low LDR values of around−30 dB shown in Fig. 7b. In contrast, ice formation in thesecond time period was much more intensive.Ze values closeto the top of the cloud were around−20 dBZ, while those ob-served 1 km below the cloud top exceeded 10 dBZ. Ice parti-cles were large enough to produce liquid precipitation at theground with 10 dBZ equivalent radar reflectivity. Ice parti-cles in the second period were characterized by LDR valuesof up to −15 dB. The melting layer with LDR of −12 dB isclearly seen at around 1.4 km height.
In Fig. 7c and d, range–height cross sections of SNR forthe first and second time period are given, respectively. Inboth cases SNR are of the same order of magnitude. Eleva-tion scans of differential reflectivity shown in Fig. 7e and fyield ZDR values close to 0 dB in the zenith-pointing direc-tion, while at lower elevations ZDR reached 4 and 2 dB, re-spectively. For both cases ZDR had less pronounced angu-lar dependence at 1.5 km height. This effect can be causedby aggregation as particles become more spherical and/orless dense. Angular dependencies of ρHV at the cloud topsshow a different behavior. In Fig. 7g ρHV has the highestvalue in the zenith-pointing direction and slightly decreasesat lower elevations. For the second time period ρHV has itsminimum value of about 0.93 at vertical-pointing directionand increases up to 0.98 at lower elevations. Observed eleva-tion dependencies at the cloud tops indicate the presence ofoblate and prolate particles for the first and the second timeperiods, respectively. Unfortunately, we do not have continu-ous temperature profiles from the microwave radiometer forthis case because of precipitation. Temporal resolution of theGDAS model is 3 h and can therefore not be used to capturetemperature variations within 15 min. The temperature pro-file given in Fig. 7i shows a cloud-top temperature of −4 ◦Cat 2.3 km height at 21:00 UTC. In Fig. 7a it can be seen thatcloud-top altitudes for the analyzed time periods differ byabout 200 m. Also, vertical variations of LDR (Fig. 7b) indi-cate changes of the 0 ◦C isotherm. Thus, temperatures at thetop could be different by few degrees which can cause crucialdifferences in the ice particle shape. We want to emphasizethat such strong indications of the presence of oblate parti-cles at such warm temperatures were observed twice duringthe whole field campaign. In both cases the existence of theseparticles was registered for no longer than about 5 min.
4 Comparison with laboratory studies
The analysis shown in Sect. 3 was applied to 22 cases.The number of cases corresponding to cloud-top temperatureranges from −7 to −3, −13 to −7, −17 to −13, and −25 to−17 ◦C are 9, 2, 9, and 2, respectively. Most of the analyzedclouds had a liquid layer at the top which was identified us-ing the polarimetric measurements from the lidar. In the case
www.atmos-meas-tech.net/9/3739/2016/ Atmos. Meas. Tech., 9, 3739–3754, 2016
3750 A. Myagkov et al.: Shape–temperature relationship of pristine ice crystals
Range [km]
Hei
ght [
km]
−4 −3 −2 −1 0 1 2 3 40
1
2
10
15
20
25
30
35
10
30
50
70
−6 −4 −2 0 2 4 6 80
0.5
1
1.5
2
2.5
Hei
ght [
km]
20:00 20:15 20:30 20:45 21:000
1
2
Time [UTC]
Hei
ght [
km]
−60
−40
−20
0
20(a) Equivalent radar reflectivity [dBZ]
20:00 20:15 20:30 20:45 21:000
1
2
Time [UTC]
Hei
ght [
km]
−35
−30
−25
−20
−15
−10
−5
0(b) Radar linear depolarization ratio [dB]
(c) Signal-to-noise ratio, 20:31–20:35 UTC [dB]
Range [km]
Hei
ght [
km]
−4 −3 −2 −1 0 1 2 3 40
1
2
0
1
2
3
4
5(e) Differential reflectivity, 20:31–20:35 UTC [dB]
Range [km]
Hei
ght [
km]
−4 −3 −2 −1 0 1 2 3 40
1
2
0.95
0.96
0.97
0.98
0.99
1(g) Correlation coefficient, 20:31–20:35 UTC
Range [km]
Hei
ght [
km]
−4 −3 −2 −1 0 1 2 3 40
1
2
(d) Signal-to-noise ratio, 20:46–20:50 UTC [dB]
Range [km]
Hei
ght [
km]
−4 −3 −2 −1 0 1 2 3 40
1
2
0
1
2
3
4
5(f) Differential reflectivity, 20:46–20:50 UTC [dB]
Range [km]
Hei
ght [
km]
−4 −3 −2 −1 0 1 2 3 40
1
2
0.9
0.92
0.94
0.96
0.98
1(h) Correlation coefficient, 20:46–20:50 UTC
(i) GDAS1, 21:00 UTC
Temperature [˚C]
Figure 7. Case study of strong short-term variability of ice particle shapes observed at Cabauw, the Netherlands, on 7 November 2014.Shown are time–height cross sections of (a) equivalent radar reflectivity Ze from LDR-mode MIRA-35 and (b) radar linear depolarizationratio from LDR-mode MIRA-35; range–height cross sections of (c) signal-to-noise ratio, (e) differential reflectivity ZDR, and (g) correlationcoefficient ρHV measured by hybrid-mode MIRA-35 from 20:31 to 20:35 UTC; (d) signal-to-noise ratio, (f) differential reflectivity ZDR,and (h) correlation coefficient ρHV measured by hybrid MIRA-35 from 20:46 to 20:50 UTC; (i) vertical temperature profile from the GDASmodel. Two black rectangles in (a) show the analyzed cloud layer and the time periods corresponding to full elevation scans of hybrid-modeMIRA-35. Ze and LDR were calculated from total powers in the co- and cross-channels. SNR, ZDR, and ρHV were obtained for the spectralpeaks. Note that ZDR and ρHV are not corrected for the antenna coupling here to make figures more illustrative. The red horizontal line in(i) represents the cloud top at 20:45 UTC.
of precipitating clouds we rely on the conclusion of West-brook and Illingworth (2011) and De Boer et al. (2011) that95 % of ice crystals at temperatures warmer than −25 ◦C areformed in presence of liquid water. For every case we chosethe polarizability ratio closest to the cloud top detected bythe LDR-mode MIRA-35. The distance from the cloud topmostly does not exceed 500 m.
For the evaluation of the measured polarizability ratios weuse measurements from fall chamber studies of Takahashiet al. (1991). In order to facilitate the comparison, first the po-larizability ratio needs to be derived from the laboratory mea-surements. Thus, we use the information about axis lengthsand mass of ice particles grown at water saturation condi-tions in the temperature range from−23. . .−3 ◦C. We definethe geometrical axis ratio ρg and the apparent ice density σ ,
Atmos. Meas. Tech., 9, 3739–3754, 2016 www.atmos-meas-tech.net/9/3739/2016/
A. Myagkov et al.: Shape–temperature relationship of pristine ice crystals 3751
−25−20−15−10−5010-3
10-2
10-1
100
101
102
Geo
met
rical
axi
s ra
tio ρ
g
0.3
0.4
0.5
0.6
0.7
0.8
0.9
Temperature [˚C]
App
aren
t den
sity
of i
ce [g
cm
-3]
Figure 8. Temperature dependence of geometrical axis ratio for par-ticles grown in the free-fall cloud chamber (Takahashi et al., 1991).Apparent density is color-coded. Note that ρg > 1 corresponds toprolate particles and ρg < 1 corresponds to oblate particles. Numer-ical data were provided by Prof. Takahashi, Hokkaido University ofEducation, Sapporo, Japan.
respectively, of an ice particle as follows:
ρg =c
a, (1)
σ =8m
3√
3a2c, (2)
wherem is the mass of the ice particle and a and c are the axislengths of the ice particle. Note that a < c for a prolate par-ticle, while a > c for an oblate particle. According to Taka-hashi and Fukuta (1988), the apparent ice density in Eq. (2)is calculated by considering the ice particle as a hexagonalprism.
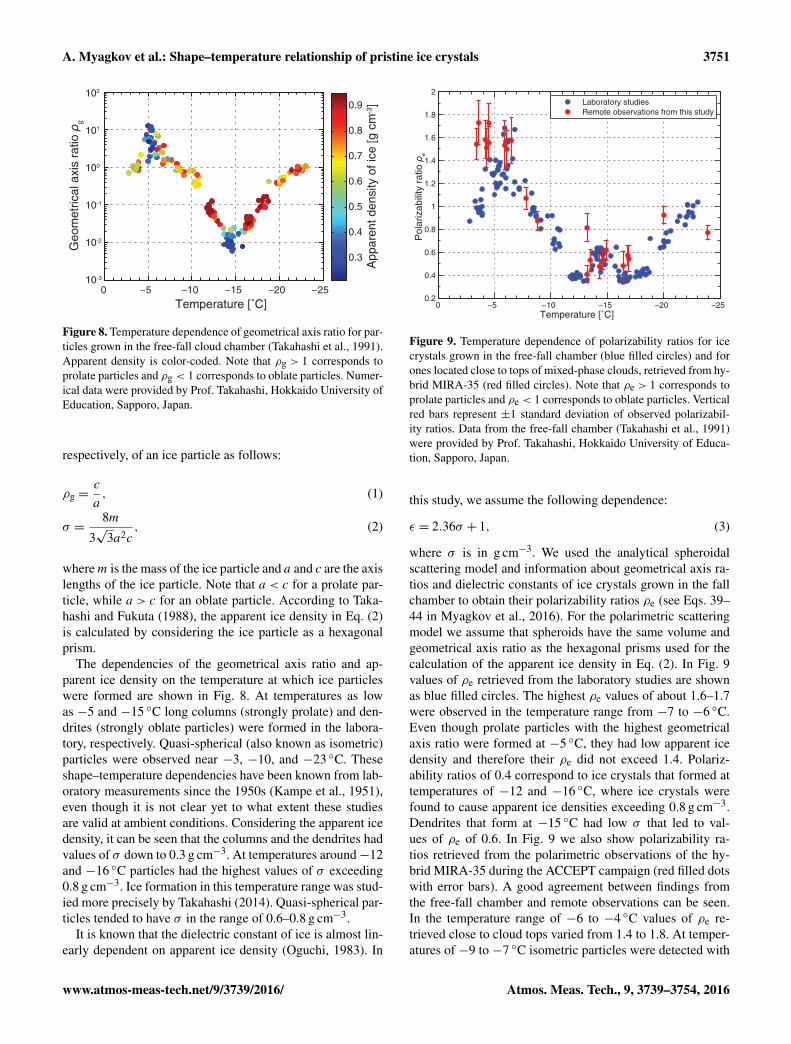
The dependencies of the geometrical axis ratio and ap-parent ice density on the temperature at which ice particleswere formed are shown in Fig. 8. At temperatures as lowas −5 and −15 ◦C long columns (strongly prolate) and den-drites (strongly oblate particles) were formed in the labora-tory, respectively. Quasi-spherical (also known as isometric)particles were observed near −3, −10, and −23 ◦C. Theseshape–temperature dependencies have been known from lab-oratory measurements since the 1950s (Kampe et al., 1951),even though it is not clear yet to what extent these studiesare valid at ambient conditions. Considering the apparent icedensity, it can be seen that the columns and the dendrites hadvalues of σ down to 0.3 g cm−3. At temperatures around−12and −16 ◦C particles had the highest values of σ exceeding0.8 g cm−3. Ice formation in this temperature range was stud-ied more precisely by Takahashi (2014). Quasi-spherical par-ticles tended to have σ in the range of 0.6–0.8 g cm−3.
It is known that the dielectric constant of ice is almost lin-early dependent on apparent ice density (Oguchi, 1983). In
Temperature [˚C]
Pol
ariz
abili
ty r
atio
ρe
−25−20−15−10−500.2
0.4
0.6
0.8
1
1.2
1.4
1.6
1.8
2
Laboratory studiesRemote observations from this study
Figure 9. Temperature dependence of polarizability ratios for icecrystals grown in the free-fall chamber (blue filled circles) and forones located close to tops of mixed-phase clouds, retrieved from hy-brid MIRA-35 (red filled circles). Note that ρe > 1 corresponds toprolate particles and ρe < 1 corresponds to oblate particles. Verticalred bars represent ±1 standard deviation of observed polarizabil-ity ratios. Data from the free-fall chamber (Takahashi et al., 1991)were provided by Prof. Takahashi, Hokkaido University of Educa-tion, Sapporo, Japan.
this study, we assume the following dependence:
ε = 2.36σ + 1, (3)
where σ is in g cm−3. We used the analytical spheroidalscattering model and information about geometrical axis ra-tios and dielectric constants of ice crystals grown in the fallchamber to obtain their polarizability ratios ρe (see Eqs. 39–44 in Myagkov et al., 2016). For the polarimetric scatteringmodel we assume that spheroids have the same volume andgeometrical axis ratio as the hexagonal prisms used for thecalculation of the apparent ice density in Eq. (2). In Fig. 9values of ρe retrieved from the laboratory studies are shownas blue filled circles. The highest ρe values of about 1.6–1.7were observed in the temperature range from −7 to −6 ◦C.Even though prolate particles with the highest geometricalaxis ratio were formed at −5 ◦C, they had low apparent icedensity and therefore their ρe did not exceed 1.4. Polariz-ability ratios of 0.4 correspond to ice crystals that formed attemperatures of −12 and −16 ◦C, where ice crystals werefound to cause apparent ice densities exceeding 0.8 g cm−3.Dendrites that form at −15 ◦C had low σ that led to val-ues of ρe of 0.6. In Fig. 9 we also show polarizability ra-tios retrieved from the polarimetric observations of the hy-brid MIRA-35 during the ACCEPT campaign (red filled dotswith error bars). A good agreement between findings fromthe free-fall chamber and remote observations can be seen.In the temperature range of −6 to −4 ◦C values of ρe re-trieved close to cloud tops varied from 1.4 to 1.8. At temper-atures of −9 to −7 ◦C isometric particles were detected with
www.atmos-meas-tech.net/9/3739/2016/ Atmos. Meas. Tech., 9, 3739–3754, 2016
3752 A. Myagkov et al.: Shape–temperature relationship of pristine ice crystals
ρe of 0.8–1.2. In the temperature range of −17 to −13 ◦Cobserved oblate particles mostly had ρe of 0.4–0.6. At tem-peratures from −25 to −20 ◦C ice crystals had ρe of 0.8–1.At the same time differences in measured and calculated po-larizability ratios can be seen in Fig. 9 at temperatures of −4to −3 ◦C. Such differences can be caused by uncertainties intemperature values from the GDAS1 data set. Even thoughthe number of cases available from 6 weeks of measurementsis quite low, we show that ice particles formed close to thetop of mid-level mixed-phase clouds at temperatures warmerthan∼−25 ◦C in general have a similar dependence of shapeand apparent ice density on ambient temperature as the onesgrown in the free-fall chamber.
5 Summary and outlook
Polarimetric cloud radars have a great potential for the pro-vision of valuable information about ice crystal microphys-ical properties based on remote sensing. Within this studyit was demonstrated that the scanning capabilities of moderncloud radars allow for the classification and quantitative char-acterization of ice particle shape. For this purpose a 35 GHzcloud radar MIRA-35 with hybrid polarimetric configurationwas deployed during the ACCEPT measurement campaign inCabauw, the Netherlands, in October and November of 2014.The radar provided elevation dependencies of the differentialreflectivity and the correlation coefficient which were usedto estimate the polarizability ratios of ice crystals approxi-mated by spheroids. The polarizability ratio thus depends onthe geometrical axis ratio and the apparent ice density. Theradar was collocated with a vast number of active and pas-sive remote sensors providing continuous information aboutcloud geometry, ambient conditions, and the presence of su-percooled liquid layers. The combined analysis of the avail-able data allowed us to derive temperature-dependent po-larizability ratios of ice crystals in the cloud-top region ofmixed-phase cloud layers. During the ACCEPT campaignin situ observations were not available. Therefore, we useddata about ice crystals grown in a free-fall cloud chamber tovalidate our retrieval indirectly. The measurements availablefrom laboratory studies include accurate information aboutaxis lengths and mass of ice crystals grown at water satura-tion conditions. We utilized these parameters to calculate po-larizability ratios from the laboratory measurements. A com-parison of polarizability ratios of ice crystals investigated inthe cloud chamber and the ones observed close to the cloudtops showed a good agreement. At temperatures in the rangeof−6 to−4 ◦C columnar-shaped particles with ρe of 1.2–1.7and 1.4–1.8 were found in laboratory studies and remote ob-servations, respectively. Isometric particles occurred at tem-peratures near −8 and −20 ◦C. Oblate particles investigatedin the temperature range of−17 to−13 ◦C had ρe of 0.4–0.6both in the chamber studies and remote observations.
From the present study, we can conclude that ice particleslocated close to tops of mixed-phase clouds are not signif-
icantly influenced by aggregation and/or riming and can beconsidered as pristine in scattering models in the microwaveregion. In addition, the evaluation showed that also the ap-parent density of pristine ice crystals that formed at watersaturation conditions is comparable to the laboratory mea-surements. This information is of special value to modelingstudies; the findings of this study are a confirmation of thevalidity of laboratory studies regarding the properties of pris-tine ice crystals at ambient conditions.
During the ACCEPT campaign only 22 well-defined casesvalid for the analysis were found. Thus, many more polari-metric observations are required to collect a data set that canbe used for further analysis. Nevertheless, our findings showthat the agreement between laboratory studies and field ob-servations of freshly formed, mostly pristine ice crystals isjustified in general. In future studies special attention shouldbe paid to the analysis of spectral polarimetric variables, asthis can help to separate different populations of ice crystalswithin a cloud and, for example, reduce classification errors.The analysis of polarimetric variables can be also success-fully used for the investigation of large ice particles suchas aggregates and graupel. A Ka-band polarimetric cloudradar provides a large set of variables that still have to beinterpreted for the case of large ice particles. Potentially,a combination of polarimetric, Doppler, and multi-frequencyanalysis may yield even more information about differenttypes of ice particles. For instance, advances of combinedDoppler measurements and polarimetry are shown in Bühlet al. (2016) and Oue et al. (2015). First, however, capabil-ities of all mentioned approaches should be further investi-gated.
6 Data availability
Access to the moment data of the LDR-mode MIRA-35and HATPRO can be obtained via http://lacros.rsd.tropos.de/cloudnet/cloudnet.php. Data of PollyXT can be accessedvia http://polly.tropos.de. The GDAS1 data set is availableat http://ready.arl.noaa.gov/gdas1.php. To get access to theraw data sets, including the data of the hybrid-mode MIRA-35, please contact Patric Seifert ([email protected]) atTROPOS. We will gladly provide the requested data usedin this study. Please note that the full dataset contains about12 TB of data.
The Supplement related to this article is available onlineat doi:10.5194/amt-9-3739-2016-supplement.
Acknowledgements. The research leading to these results hasreceived funding from the European Union Seventh FrameworkProgramme (FP7/2007–2013): People, ITN Marie Curie Actions
Atmos. Meas. Tech., 9, 3739–3754, 2016 www.atmos-meas-tech.net/9/3739/2016/

A. Myagkov et al.: Shape–temperature relationship of pristine ice crystals 3753
Programme (2012–2016), in the frame of ITaRS under grant agree-ment 289923. The ACCEPT campaign was partly funded from theEuropean Union Seventh Framework Programme (FP7/2007–2013)under grant agreement no. 262254. Authors want to acknowledgeMETEK GmbH, particularly Matthias Bauer-Pfundstein andAlexander Partus, for assistance in maintaining cloud radars duringthe ACCEPT campaign. We also highly appreciate T. Takahashi,Hokkaido University of Education, Sapporo, Japan, for providingthe data from the free-fall cloud chamber. The authors also wouldlike to acknowledge the logistic support received from KNMI andTU Delft.
Edited by: P. ErikssonReviewed by: two anonymous referees
References
Althausen, D., Engelmann, R., Baars, H., Heese, B., Ansmann, A.,Müller, D., and Komppula, M.: Portable Raman lidar Pol-lyXT for automated profiling of aerosol backscatter, extinc-tion, and depolarization, J. Atmos. Ocean. Tech., 26, 2366,doi:10.1175/2009JTECHA1304.1, 2009.
Ansmann, A., Tesche, M., Seifert, P., Althausen, D., Engelmann, R.,Fruntke, J., Wandinger, U., Mattis, I., and Müller, D.: Evolu-tion of the ice phase in tropical altocumulus: SAMUM lidarobservations over Cape Verde, J. Geophys. Res., 114, D17208,doi:10.1029/2008JD011659, 2009.
Bailey, M. and Hallett, J.: Growth rates and habits of ice crystalsbetween −20 ◦C and −70 ◦C, J. Atmos. Sci., 61, 514–544,doi:10.1175/1520-0469(2004)061<0514:GRAHOI>2.0.CO;2,2004.
Bailey, M. P. and Hallett, J.: A comprehensive habit diagramfor atmospheric ice crystals: confirmation from the laboratory,AIRS II, and other field studies, J. Atmos. Sci., 66, 2888,doi:10.1175/2009JAS2883.1, 2009.
Bringi, V. N. and Chandrasekar, V.: Polarimetric Doppler WeatherRadar, Cambridge University Press, Cambridge, UK, 662 pp.,2001.
Bühl, J., Seifert, P., Wandinger, U., Baars, H., Kanitz, T., Schmidt,J., Myagkov, A., Engelmann, R., Skupin, A., Heese, B., Kle-pel, A., Althausen, D., and Ansmann, A.: LACROS: the LeipzigAerosol and Cloud Remote Observations System, Society ofPhoto-Optical Instrumentation Engineers (SPIE) Conference Se-ries, 8890, 889002, doi:10.1117/12.2030911, 2013.
Bühl, J., Seifert, P., Myagkov, A., and Ansmann, A.: Measuring ice-and liquid-water properties in mixed-phase cloud layers at theLeipzig Cloudnet station, Atmos. Chem. Phys., in press, 2016.
De Boer, G., Eloranta, E. W., and Shupe, M. D.: Arctic mixed-phasestratiform cloud properties from multiple years of surface-basedmeasurements at two high-latitude locations, J. Atmos. Sci., 66,2874, doi:10.1175/2009JAS3029.1, 2009.
De Boer, G., Morrison, H., Shupe, M. D., and Hildner, R.: Evi-dence of liquid dependent ice nucleation in high-latitude strati-form clouds from surface remote sensors, Geophys. Res. Lett.,38, L01803, doi:10.1029/2010GL046016, 2011.
Delanoë, J. and Hogan, R. J.: Combined CloudSat-CALIPSO-MODIS retrievals of the properties of ice clouds, J. Geophys.Res., 115, D00H29, doi:10.1029/2009JD012346, 2010.
Delanoë, J. M. E., Heymsfield, A. J., Protat, A., Bansemer, A., andHogan, R. J.: Normalized particle size distribution for remotesensing application, J. Geophys. Res.-Atmos., 119, 4204–4227,doi:10.1002/2013JD020700, 2014.
DeMott, P. J., Prenni, A. J., McMeeking, G. R., Sullivan, R. C.,Petters, M. D., Tobo, Y., Niemand, M., Möhler, O., Snider, J.R., Wang, Z., and Kreidenweis, S. M.: Integrating laboratory andfield data to quantify the immersion freezing ice nucleation activ-ity of mineral dust particles, Atmos. Chem. Phys., 15, 393–409,doi:10.5194/acp-15-393-2015, 2015.
Engelmann, R., Kanitz, T., Baars, H., Heese, B., Althausen, D.,Skupin, A., Wandinger, U., Komppula, M., Stachlewska, I. S.,Amiridis, V., Marinou, E., Mattis, I., Linné, H., and Ansmann,A.: The automated multiwavelength Raman polarization andwater-vapor lidar PollyXT: the neXT generation, Atmos. Meas.Tech., 9, 1767–1784, doi:10.5194/amt-9-1767-2016, 2016.
Ewald, F., Winkler, C., and Zinner, T.: Reconstruction of cloud ge-ometry using a scanning cloud radar, Atmos. Meas. Tech., 8,2491–2508, doi:10.5194/amt-8-2491-2015, 2015.
Fleishauer, R. P., Larson, V. E., and Vonder Haar, T. H.:Observed microphysical structure of midlevel, mixed-phaseclouds, J. Atmos. Sci., 59, 1779–1804, doi:10.1175/1520-0469(2002)059<1779:OMSOMM>2.0.CO;2, 2002.
Fukuta, N.: Experimental studies on the growth of small icecrystals, J. Atmos. Sci., 26, 522–531, doi:10.1175/1520-0469(1969)026<0522:ESOTGO>2.0.CO;2, 1969.
Fukuta, N. and Takahashi, T.: The growth of atmospheric ice crys-tals: a summary of findings in vertical supercooled cloud tun-nel studies, J. Atmos. Sci., 56, 1963–1979, doi10.1175/1520-0469(1999)056<1963:TGOAIC>2.0.CO;2, 1999.
Görsdorf, U., Lehmann, V., Bauer-Pfundstein, M., Peters, G.,Vavriv, D., Vinogradov, V., and Volkov, V.: A 35 GHz polarimet-ric Doppler radar for long term observations of cloud parameters– description of system and data processing, J. Atmos. Ocean.Tech., 32, 675–690, doi:10.1175/JTECH-D-14-00066.1, 2015.
Hogan, R. J., Francis, P. N., Flentje, H., Illingworth, A. J.,Quante, M., and Pelon, J.: Characteristics of mixed-phase clouds.I: Lidar, radar and aircraft observations from CLARE’98, Q. J.Roy. Meteor. Soc., 129, 2089–2116, doi:10.1256/rj.01.208, 2003.
Kampe, H. J., Weickmann, H. K., and Kelly, J. J.: The influenceof temperature on the shape of ice crystals growing at wa-ter saturation, J. Atmos. Sci., 8, 168–174, doi:10.1175/1520-0469(1951)008<0168:TIOTOT>2.0.CO;2, 1951.
Kanamitsu, M.: Description of the NMC global data assimi-lation and forecast system, Weather Forecast., 4, 335–342,doi:10.1175/1520-0434(1989)004<0335:DOTNGD>2.0.CO;2,1989.
Kanitz, T., Seifert, P., Ansmann, A., Engelmann, R., Althausen, D.,Casiccia, C., and Rohwer, E. G.: Contrasting the impactof aerosols at northern and southern midlatitudes on het-erogeneous ice formation, Geophys. Res. Lett., 38, L17802,doi:10.1029/2011GL048532, 2011.
Kollias, P., Bharadwaj, N., Widener, K., Jo, I., and Johnson, K.:Scanning ARM cloud radars. Part I: Operational sampling strate-gies, J. Atmos. Ocean. Tech., 31, 569–582, doi:10.1175/JTECH-D-13-00044.1, 2014.
LACROS: Data of PollyXT, available at: http://polly.tropos.de, lastaccess: 1 August 2016.
www.atmos-meas-tech.net/9/3739/2016/ Atmos. Meas. Tech., 9, 3739–3754, 2016
3754 A. Myagkov et al.: Shape–temperature relationship of pristine ice crystals
Lamer, K., Tatarevic, A., Jo, I., and Kollias, P.: Evaluation of grid-ded scanning ARM cloud radar reflectivity observations and ver-tical doppler velocity retrievals, Atmos. Meas. Tech., 7, 1089–1103, doi:10.5194/amt-7-1089-2014, 2014.
Matrosov, S. Y., Reinking, R. F., Kropfli, R. A., Martner, B. E.,and Bartram, B. W.: On the use of radar depolarization ra-tios for estimating shapes of ice hydrometeors in winterclouds, J. Appl. Meteorol., 40, 479–490, doi:10.1175/1520-0450(2001)040<0479:OTUORD>2.0.CO;2, 2001.
Matrosov, S. Y., Mace, G. G., Marchand, R., Shupe, M. D., Hal-lar, A. G., and McCubbin, I. B.: Observations of ice crystal habitswith a scanning polarimetric W-band radar at slant linear de-polarization ratio mode, J. Atmos. Ocean. Tech., 29, 989–1008,doi:10.1175/JTECH-D-11-00131.1, 2012.
Melnikov, V. and Straka, J. M.: Axis ratios and flutter angles ofcloud ice particles: retrievals from radar data, J. Atmos. Ocean.Tech., 30, 1691–1703, doi:10.1175/JTECH-D-12-00212.1, 2013.
Mülmenstädt, J., Sourdeval, O., Delanoë, J., and Quaas, J.: Fre-quency of occurrence of rain from liquid-, mixed-, and ice-phaseclouds derived from A-Train satellite retrievals, Geophys. Res.Lett., 42, 6502–6509, doi:10.1002/2015GL064604, 2015.
Myagkov, A., Seifert, P., Wandinger, U., Bauer-Pfundstein, M., andMatrosov, S. Y.: Effects of antenna patterns on cloud radar polari-metric measurements, J. Atmos. Ocean. Tech., 32, 1813–1828,doi:10.1175/JTECH-D-15-0045.1, 2015.
Myagkov, A., Seifert, P., Bauer-Pfundstein, M., and Wandinger,U.: Cloud radar with hybrid mode towards estimation of shapeand orientation of ice crystals, Atmos. Meas. Tech., 9, 469–489,doi:10.5194/amt-9-469-2016, 2016.
NOAA: GDAS1 data set, available at: http://ready.arl.noaa.gov/gdas1.php, last access: 1 August 2016.
Oguchi, T.: Electromagnetic wave propagation and scattering inrain and other hydrometeors, IEEE Proceedings, 71, 1029–1078,1983.
Oue, M., Kumjian, M. R., Lu, Y., Verlinde, J., Aydin, K., and Cloth-iaux, E. E.: Linear depolarization ratios of columnar ice crystalsin a deep precipitating system over the Arctic observed by zenith-pointing Ka-band Doppler radar, J. Appl. Meteorol. Clim., 54,1060–1068, doi:10.1175/JAMC-D-15-0012.1, 2015.
Rose, T., Crewell, S., Löhnert, U., and Simmer, C.: A net-work suitable microwave radiometer for operational monitor-ing of the cloudy atmosphere, Atmos. Res., 75, 183–200,doi:10.1016/j.atmosres.2004.12.005, 2005.
Schotland, R. M., Sassen, K., and Stone, R.: Observationsby lidar of linear depolarization ratios for hydromete-ors, J. Appl. Meteorol., 10, 1011–1017, doi:10.1175/1520-0450(1971)010<1011:OBLOLD>2.0.CO;2, 1971.
Seifert, A. and Beheng, K. D.: A two-moment cloud microphysicsparameterization for mixed-phase clouds. Part 1: Model descrip-tion, Meteorol. Atmos. Phys., 92, 45–66, doi:10.1007/s00703-005-0112-4, 2006.
Seifert, P., Ansmann, A., Mattis, I., Wandinger, U., Tesche, M., En-gelmann, R., Müller, D., Pérez, C., and Haustein, K.: Saharandust and heterogeneous ice formation: eleven years of cloud ob-servations at a central European EARLINET site, J. Geophys.Res., 115, D20201, doi:10.1029/2009JD013222, 2010.
Smith, A. J., Larson, V. E., Niu, J., Kankiewicz, J. A., andCarey, L. D.: Processes that generate and deplete liquid water
and snow in thin midlevel mixed-phase clouds, J. Geophys. Res.,114, D12203, doi:10.1029/2008JD011531, 2009.
Straka, J. M., Zrni, D. S., and Ryzhkov, A. V.: Bulk hydrometeorclassification and quantification using polarimetric radar data:synthesis of relations, J. Appl. Meteorol., 39, 1341–1372,doi:10.1175/1520-0450(2000)039<1341:BHCAQU>2.0.CO;2,2000.
Sun, Z. and Shine, K. P.: Parameterization of ice cloud radia-tive properties and its application to the potential climaticimportance of mixed-phase clouds, J. Climate, 8, 1874–1888,doi:10.1175/1520-0442(1995)008<1874:POICRP>2.0.CO;2,1995.
Suortti, T. M., Kats, A., Kivi, R., Kämpfer, N., Leiterer, U.,Miloshevich, L. M., Neuber, R., Paukkunen, A., Rup-pert, P., Vömel, H., and Yushkov, V.: Tropospheric com-parisons of vaisala radiosondes and balloon-borne frost-point and Lyman-α hygrometers during the LAUTLOS-WAVVAP experiment, J. Atmos. Ocean. Tech., 25, 149–166,doi:10.1175/2007JTECHA887.1, 2008.
Takahashi, T.: Influence of liquid water content and temperature onthe form and growth of branched planar snow crystals in a cloud,J. Atmos. Sci., 71, 4127–4142, doi:10.1175/JAS-D-14-0043.1,2014.
Takahashi, T. and Fukuta, N.: Supercooled cloud tunnel studies onthe growth of snow crystals between −4 ◦C and −20 ◦C, J. Me-teorol. Soc. Jpn., 66, 841–855, 1988.
Takahashi, T., Endoh, T., Wakahama, G., and Fukuta, N.: Vapordiffusional growth of free-falling snow crystals between −3 and−23 ◦C, J. Meteorol. Soc. Jpn., 69, 15–30, 1991.
Tao, W.-K. and Moncrieff, M. W.: Multiscale cloud system model-ing, Rev. Geophys., 47, RG4002, doi:10.1029/2008RG000276,2009.
Tropos: Moment data of the LDR-mode MIRA-35 and of HAT-PRO, available at: http://lacros.rsd.tropos.de/cloudnet/cloudnet.php, last access: 1 August 2016.
Wang, Z., Sassen, K., Whiteman, D. N., and Demoz, B. B.:Studying altocumulus with ice virga using ground-based activeand passive remote sensors, J. Appl. Meteorol., 43, 449–460,doi:10.1175/1520-0450(2004)043<0449:SAWIVU>2.0.CO;2,2004.
Westbrook, C. D. and Heymsfield, A. J.: Ice crystals growingfrom vapor in supercooled clouds between−2.5 ◦C and−22 ◦C:testing current parameterization methods using laboratory data,J. Atmos. Sci., 68, 2416–2429, doi:10.1175/JAS-D-11-017.1,2011.
Westbrook, C. D. and Illingworth, A. J.: Evidence that ice formsprimarily in supercooled liquid clouds at temperatures −27 ◦C,Geophys. Res. Lett., 38, L14808, doi:10.1029/2011GL048021,2011.
Westbrook, C. D. and Illingworth, A. J.: The formation of ice in along-lived supercooled layer cloud, Q. J. Roy. Meteor. Soc., 139,2209–2221, doi:10.1002/qj.2096, 2013.
Zhang, D., Wang, Z., Heymsfield, A., Fan, J., Liu, D., and Zhao, M.:Quantifying the impact of dust on heterogeneous ice generationin midlevel supercooled stratiform clouds, Geophys. Res. Lett.,39, L18805, doi:10.1029/2012GL052831, 2012.
Atmos. Meas. Tech., 9, 3739–3754, 2016 www.atmos-meas-tech.net/9/3739/2016/