relationship between basic skills success and … · transfer level courses broken out by degree of...
TRANSCRIPT

Relationship Between Basic Skills Success and Performance
in Transfer Level Courses
Preliminary Results(May 25, 2010)
Gregory M. StoupDirector of Planning & Research
Cañada College

Research Framework
1. Objective: Examine the performance of students in transfer level courses broken out by degree of basic skills remediation.
2. Approach: Select a set of introductory transfer level courses having sufficient sample sizes of students in each basic skills category examined over the study period (2000/01 – 2008/09).
3. Research Goal: Determine if performance in the transfer course cohort is a function of the placement level of basic skills remediation.
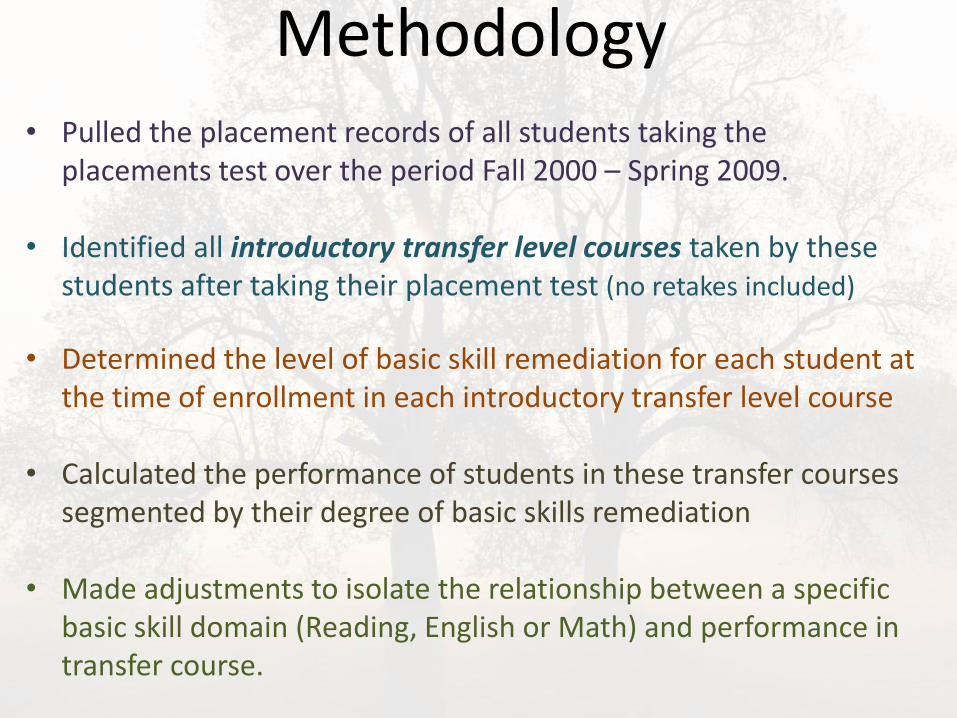
Methodology• Pulled the placement records of all students taking the
placements test over the period Fall 2000 – Spring 2009.
• Identified all introductory transfer level courses taken by these students after taking their placement test (no retakes included)
• Determined the level of basic skill remediation for each student at the time of enrollment in each introductory transfer level course
• Calculated the performance of students in these transfer courses segmented by their degree of basic skills remediation
• Made adjustments to isolate the relationship between a specific basic skill domain (Reading, English or Math) and performance in transfer course.
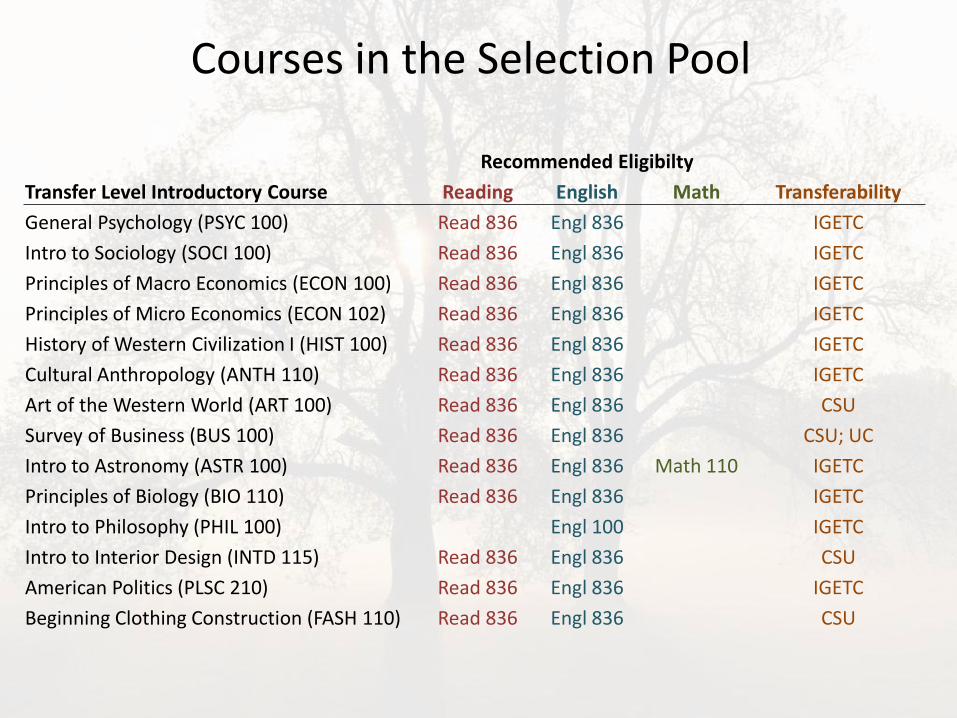
Courses in the Selection Pool
Recommended Eligibilty
Transfer Level Introductory Course Reading English Math Transferability
General Psychology (PSYC 100) Read 836 Engl 836 IGETC
Intro to Sociology (SOCI 100) Read 836 Engl 836 IGETC
Principles of Macro Economics (ECON 100) Read 836 Engl 836 IGETC
Principles of Micro Economics (ECON 102) Read 836 Engl 836 IGETC
History of Western Civilization I (HIST 100) Read 836 Engl 836 IGETC
Cultural Anthropology (ANTH 110) Read 836 Engl 836 IGETC
Art of the Western World (ART 100) Read 836 Engl 836 CSU
Survey of Business (BUS 100) Read 836 Engl 836 CSU; UC
Intro to Astronomy (ASTR 100) Read 836 Engl 836 Math 110 IGETC
Principles of Biology (BIO 110) Read 836 Engl 836 IGETC
Intro to Philosophy (PHIL 100) Engl 100 IGETC
Intro to Interior Design (INTD 115) Read 836 Engl 836 CSU
American Politics (PLSC 210) Read 836 Engl 836 IGETC
Beginning Clothing Construction (FASH 110) Read 836 Engl 836 CSU

Group Placement 2000/01 2004/05 2008/09
MATH
Pre-Algebra 37.8% 36.1% 41.5%
Elem Algebra 37.1% 34.3% 32.1%
Intermediate Algebra 14.6% 15.9% 13.9%
Transfer Level Math 10.5% 13.7% 12.6%
READING
Developmental Reading 49.1% 45.4% 47.5%
Acad Reading Strategies 25.2% 28.4% 29.2%
No Reading Required 25.7% 26.1% 23.3%
ENGLISH
Basic Composition 49.7% 48.2% 48.3%
Writing Development 31.7% 32.1% 32.8%
Transfer Level English 18.5% 19.8% 19.0%
Placement of Canada Students
Placement patterns have remained fairly stable over the decade.

Basic Skills Math Sequence

Profile of our Mathematics Course Sequence
INTERMEDIATE ALGEBRATRANSFER
LEVEL MATHPRE
ALGEBRAELEMENTARY ALGEBRA
Algebra Curriculum Sequence
Course Pass % = 55% Course Pass % = 55% Course Pass % = 50% Course Pass % = 75%
Placement Patterns (2006/07 – 2008/09)
Pre-Algebra
39%
Elem Algebra
34%
Interm Algebra
15%
Transfer Level12%

44.9%
56.8%
70.1%
84.1%
0%
10%
20%
30%
40%
50%
60%
70%
80%
90%
100%
Placed into but Did not complete Pre-Algebra
After Passing Pre-Algebra After Passing Elementary Algebra
After Passing Intermediary Algebra
Success Rates of students in Selected Transfer Courses* as they completed each step in the Basic Skills Algebra Sequence
(Summer 2000 – Spring 2009)
Average College Success Rate in Transfer Courses = 75.2%
Performance in Transfer Courses based on the degree of Math remediation
INTERMEDIATE ALGEBRA
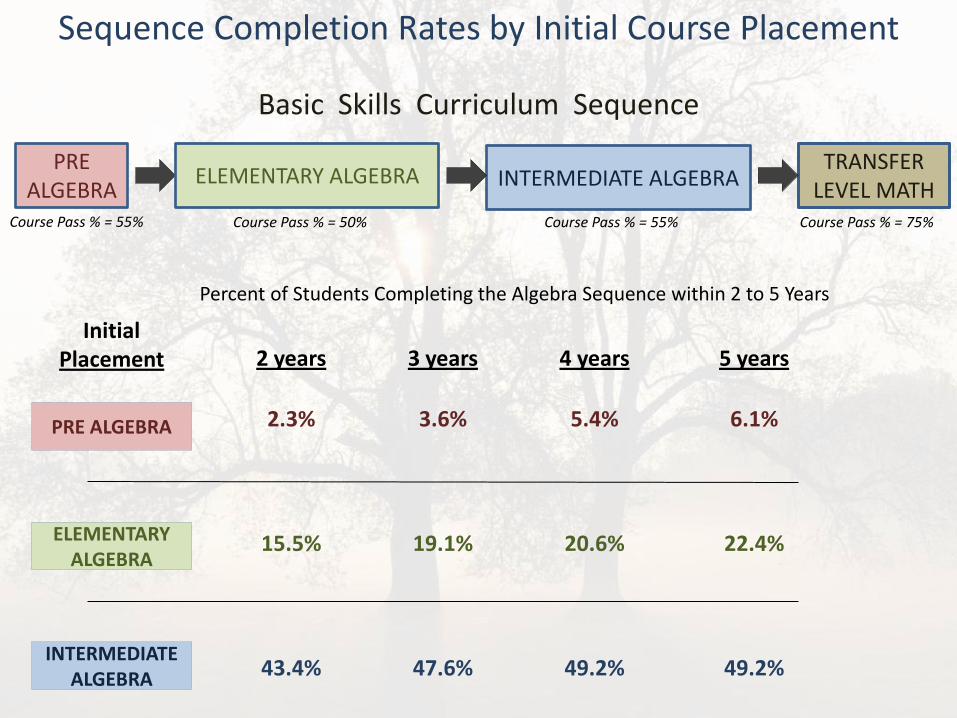
Sequence Completion Rates by Initial Course Placement
TRANSFER LEVEL MATH
PRE ALGEBRA
ELEMENTARY ALGEBRA
INTERMEDIATE ALGEBRA
Initial Placement 3 years
3.6%
19.1%
47.6%
4 years
5.4%
20.6%
49.2%
5 years
6.1%
22.4%
49.2%
PRE ALGEBRA
ELEMENTARY ALGEBRA
2 years
2.3%
15.5%
43.4%
Percent of Students Completing the Algebra Sequence within 2 to 5 Years
Basic Skills Curriculum Sequence
Course Pass % = 55% Course Pass % = 55% Course Pass % = 50% Course Pass % = 75%
Basic Skills Reading & English
Sequences
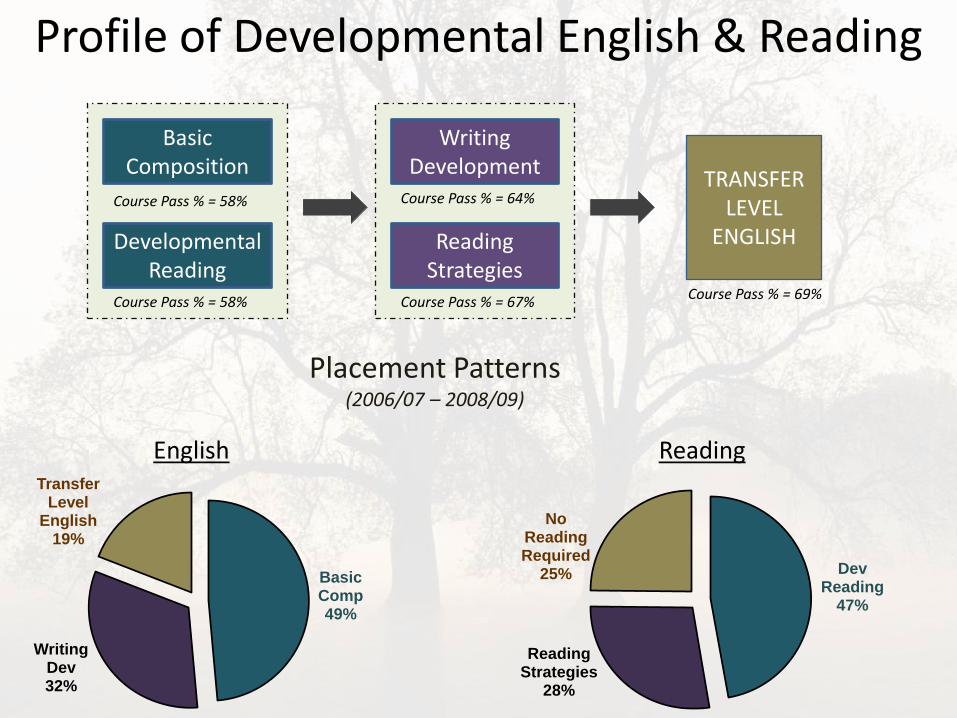
Profile of Developmental English & Reading
TRANSFER LEVEL
ENGLISH
Basic Composition
Developmental Reading
Writing Development
Reading Strategies
Dev Reading
47%
Reading Strategies
28%
No Reading Required
25%Basic Comp49%
Writing Dev32%
Transfer Level
English19%
ReadingEnglish
Placement Patterns (2006/07 – 2008/09)
Course Pass % = 58%
Course Pass % = 58%
Course Pass % = 64%
Course Pass % = 69% Course Pass % = 67%
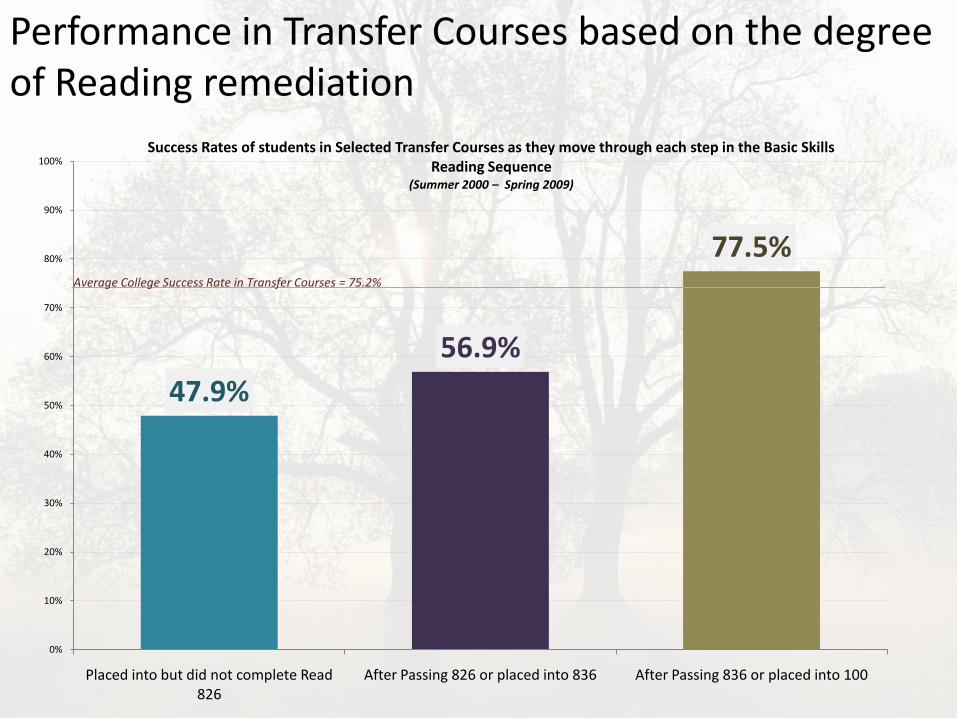
47.9%
56.9%
77.5%
0%
10%
20%
30%
40%
50%
60%
70%
80%
90%
100%
Placed into but did not complete Read 826
After Passing 826 or placed into 836 After Passing 836 or placed into 100
Success Rates of students in Selected Transfer Courses as they move through each step in the Basic Skills Reading Sequence
(Summer 2000 – Spring 2009)
Average College Success Rate in Transfer Courses = 75.2%
Performance in Transfer Courses based on the degree of Reading remediation

52.5%
64.7%
75.8%
0%
10%
20%
30%
40%
50%
60%
70%
80%
90%
100%
Placed into but did not complete English 826
After Passing 826 or placed into 836 After Passing 836 or placed into 100
Success Rates of students in Selected Transfer Courses* as they move through each step in the Basic Skills English Sequence
(Summer 2000– Spring 2009)
Average College Success Rate in Transfer Courses = 75.2%
Performance in Transfer Courses based on the degree of English remediation

Profile of Developmental English & Reading
TRANSFER LEVEL
ENGLISH
Basic Composition
Developmental Reading
Writing Development
Reading Strategies
Course Pass % = 58%
Course Pass % = 58%
Course Pass % = 64%
Course Pass % = 69% Course Pass % = 67%
ENGL 826
Initial Placement 3 years
23.9%
24.8%
4 years
27.2%
29.9%
5 years
27.7%
30.1%
2 years
20.3%
22.1%
Percent of Students Completing the Basic Skills Sequence within 2 to 5 Years
READ 826
Performance in Transfer Level Course as a
function of degree of remediation in Math
and Reading

39.5%
76.6%
0%
10%
20%
30%
40%
50%
60%
70%
80%
90%
100%
Placed; not passed Placed; passed
Economics
Success rates of students in select transfer level courses (Summer 2000 – Spring 2009)
37.5%
73.4%
0%
10%
20%
30%
40%
50%
60%
70%
80%
90%
100%
Placed; not passed Placed; passed
Psychology
Placed into Pre-Algebra & Did Not Pass the Course Placed into Transfer Level math or Completed the BS Algebra Sequence
N = 182
N = 216
37.1%
83.3%
0%
10%
20%
30%
40%
50%
60%
70%
80%
90%
100%
Placed; not passed Placed; passed
Sociology
N = 149
45.5%
82.4%
0%
10%
20%
30%
40%
50%
60%
70%
80%
90%
100%
Placed; not passed Placed; passed
Philosophy
N = 151
+ 35.9%
+ 37.1%
+ 46.2%
+ 36.9%

48.6%
75.6%
0%
10%
20%
30%
40%
50%
60%
70%
80%
90%
100%
Placed; not passed Placed; passed
Sociology
Success rates of students in select transfer level courses (Summer 2000 – Spring 2009)
55.2%
77.4%
0%
10%
20%
30%
40%
50%
60%
70%
80%
90%
100%
Placed; not passed Placed; passed
Psychology
Placed into Reading 826 & Did Not Pass the Course
N = 315
N = 88
N = 281
N = 184
50.1%64.9%
0%
10%
20%
30%
40%
50%
60%
70%
80%
90%
100%
Placed; not passed Placed; passed
Economics
49.1%
74.9%
0%
10%
20%
30%
40%
50%
60%
70%
80%
90%
100%
Placed; not passed Placed; passed
Philosophy
Placed into Transfer Level Reading or Completed the Basic Skills Reading Sequence
+ 22.2%
+ 14.8%
+ 27.0%
+ 25.8%

Now for the kicker!
Just when you thought you had it all figured
out…

61.5%
86.6%
0%
10%
20%
30%
40%
50%
60%
70%
80%
90%
100%
Placed; not passed Placed; passed
Yoga
Placed into Pre-Algebra & Did Not Pass the Course
Placed into Transfer Level math or Completed the BS Algebra Sequence
N = 115
+ 25.1%
Placed into Reading 826 & Did Not Pass the Course
Placed into Transfer Level Reading or Completed the Basic Skills Reading Sequence
N = 121
65.1%
84.9%
0%
10%
20%
30%
40%
50%
60%
70%
80%
90%
100%
Placed; not passed Placed; passed
Yoga
+ 19.8%
Question to consider: what are the most valuable skills being developed in our remedial programs?
Success rates of students taking Yoga(Summer 2000 – Spring 2009)

At this risk of overloading you with
information…
We’ve just looked at student achievement as defined by
success rates
Recall the evidence we collected that indicated a Mastery Effect in basic skill sequence completion

INTERMEDIATE ALGEBRA
Sequence Completion Rates by Initial Course Placement
TRANSFER LEVEL MATH
Received an “A” in Pre-Algebra*
Initial Placement 3 years
13.8%
1.7%
4 years
15.3%
2.5%
5 years
17.8%
2.5%
PRE ALGEBRA
ELEMENTARY ALGEBRA
Mastery is key! Preliminary findings suggest that students receiving an A grade in Pre-Algebra are 8 or 9 times more likely to complete the algebra sequence.
2 years
8.8%
0.8%
Percent of Students Successfully Completing the Algebra Sequence within 2 to 5 Years
Cañada Curriculum Sequence
Did not Receive an “A” in Pre-
Algebra
Important Finding: For students receiving an A in Pre-Algebra there is no disproportional impact by ethnicity in algebra sequence completion.
* Math 811 is a self-paced course. Cohort is restricted students receiving an A grade and completing the course in one semester (3.0 units).

What are the two measures most widely used by CCCs to assess progress?
• Success Rate• Retention Rate
Consider the multitude of changes over this period:
- faculty/staff turnover- program successes/failures- changing student demographics - budget contractions/expansion- leadership turnover
and yet these performance metrics remained relatively stable.

Looking solely at success rates can mask important features of student performance.
Fall 2009Fall 2008
Success Rate: 74%
Success Rate: 73%
Success Rate = (A,B,C)/(A,B,C,D,F)
How similar are the learning environments of these two classrooms?
Research tells us that the English sequence completion rate for this group is likely to be much higher.
Evidence from a course on Writing Development (ENGL 836)

Likewise, two courses with identical retention rates can be very different classrooms and foreshadow different futures for students.
Retention Rate: 75%
Retention Rate: 75%
There are ten fewer students in the classroom during the period between
the two midterms
Fall 2008 Spring 2009
Retention Rate = (A,B,C,D,F) / (A,B,C,D,F,W)
Research tells us that those withdrawing from this class are more likely to pass a retake of the course.
Evidence from a course on Intermediate Algebra (MATH 110)

Okay, that’s a lot to digest
Lets Discuss