relating standardized visual perception measures to ... · relating standardized visual perception...
TRANSCRIPT
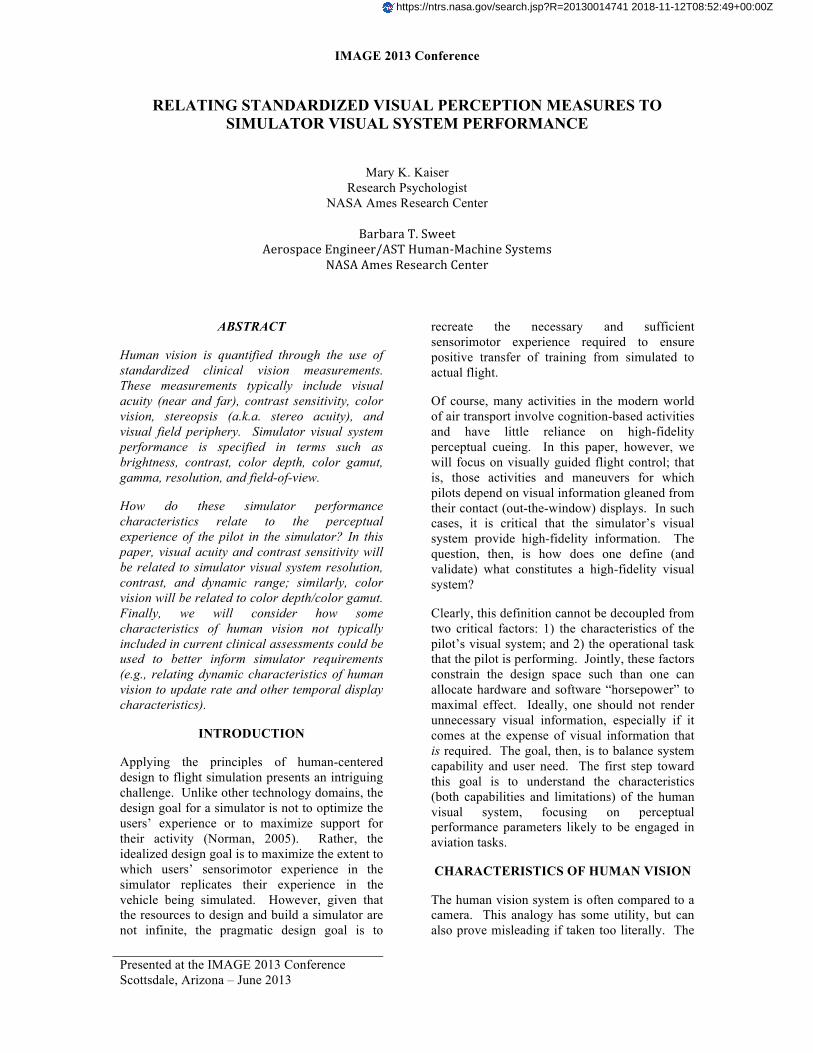
IMAGE 2013 Conference
Presented at the IMAGE 2013 Conference Scottsdale, Arizona – June 2013
RELATING STANDARDIZED VISUAL PERCEPTION MEASURES TO SIMULATOR VISUAL SYSTEM PERFORMANCE
Mary K. Kaiser Research Psychologist
NASA Ames Research Center
Barbara T. Sweet Aerospace Engineer/AST Human-‐Machine Systems
NASA Ames Research Center
ABSTRACT
Human vision is quantified through the use of standardized clinical vision measurements. These measurements typically include visual acuity (near and far), contrast sensitivity, color vision, stereopsis (a.k.a. stereo acuity), and visual field periphery. Simulator visual system performance is specified in terms such as brightness, contrast, color depth, color gamut, gamma, resolution, and field-of-view.
How do these simulator performance characteristics relate to the perceptual experience of the pilot in the simulator? In this paper, visual acuity and contrast sensitivity will be related to simulator visual system resolution, contrast, and dynamic range; similarly, color vision will be related to color depth/color gamut. Finally, we will consider how some characteristics of human vision not typically included in current clinical assessments could be used to better inform simulator requirements (e.g., relating dynamic characteristics of human vision to update rate and other temporal display characteristics).
INTRODUCTION
Applying the principles of human-centered design to flight simulation presents an intriguing challenge. Unlike other technology domains, the design goal for a simulator is not to optimize the users’ experience or to maximize support for their activity (Norman, 2005). Rather, the idealized design goal is to maximize the extent to which users’ sensorimotor experience in the simulator replicates their experience in the vehicle being simulated. However, given that the resources to design and build a simulator are not infinite, the pragmatic design goal is to
recreate the necessary and sufficient sensorimotor experience required to ensure positive transfer of training from simulated to actual flight.
Of course, many activities in the modern world of air transport involve cognition-based activities and have little reliance on high-fidelity perceptual cueing. In this paper, however, we will focus on visually guided flight control; that is, those activities and maneuvers for which pilots depend on visual information gleaned from their contact (out-the-window) displays. In such cases, it is critical that the simulator’s visual system provide high-fidelity information. The question, then, is how does one define (and validate) what constitutes a high-fidelity visual system?
Clearly, this definition cannot be decoupled from two critical factors: 1) the characteristics of the pilot’s visual system; and 2) the operational task that the pilot is performing. Jointly, these factors constrain the design space such than one can allocate hardware and software “horsepower” to maximal effect. Ideally, one should not render unnecessary visual information, especially if it comes at the expense of visual information that is required. The goal, then, is to balance system capability and user need. The first step toward this goal is to understand the characteristics (both capabilities and limitations) of the human visual system, focusing on perceptual performance parameters likely to be engaged in aviation tasks.
CHARACTERISTICS OF HUMAN VISION
The human vision system is often compared to a camera. This analogy has some utility, but can also prove misleading if taken too literally. The
https://ntrs.nasa.gov/search.jsp?R=20130014741 2018-11-12T08:52:49+00:00Z
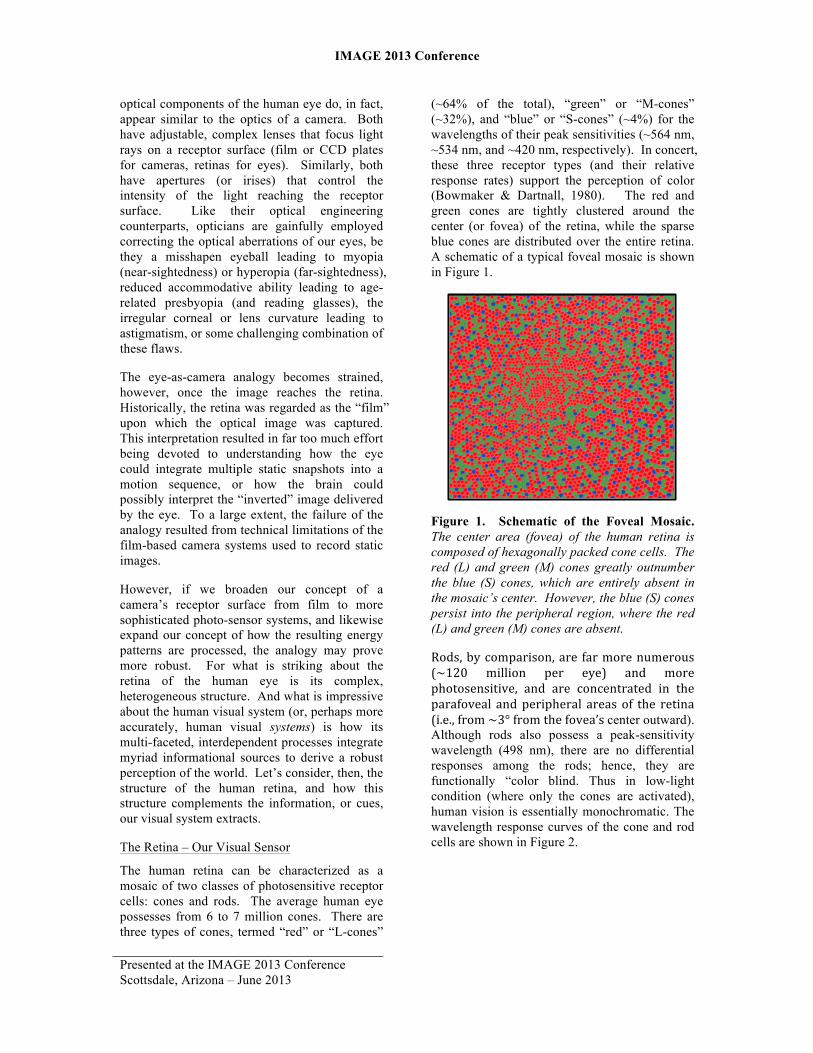
IMAGE 2013 Conference
Presented at the IMAGE 2013 Conference Scottsdale, Arizona – June 2013
optical components of the human eye do, in fact, appear similar to the optics of a camera. Both have adjustable, complex lenses that focus light rays on a receptor surface (film or CCD plates for cameras, retinas for eyes). Similarly, both have apertures (or irises) that control the intensity of the light reaching the receptor surface. Like their optical engineering counterparts, opticians are gainfully employed correcting the optical aberrations of our eyes, be they a misshapen eyeball leading to myopia (near-sightedness) or hyperopia (far-sightedness), reduced accommodative ability leading to age-related presbyopia (and reading glasses), the irregular corneal or lens curvature leading to astigmatism, or some challenging combination of these flaws.
The eye-as-camera analogy becomes strained, however, once the image reaches the retina. Historically, the retina was regarded as the “film” upon which the optical image was captured. This interpretation resulted in far too much effort being devoted to understanding how the eye could integrate multiple static snapshots into a motion sequence, or how the brain could possibly interpret the “inverted” image delivered by the eye. To a large extent, the failure of the analogy resulted from technical limitations of the film-based camera systems used to record static images.
However, if we broaden our concept of a camera’s receptor surface from film to more sophisticated photo-sensor systems, and likewise expand our concept of how the resulting energy patterns are processed, the analogy may prove more robust. For what is striking about the retina of the human eye is its complex, heterogeneous structure. And what is impressive about the human visual system (or, perhaps more accurately, human visual systems) is how its multi-faceted, interdependent processes integrate myriad informational sources to derive a robust perception of the world. Let’s consider, then, the structure of the human retina, and how this structure complements the information, or cues, our visual system extracts.
The Retina – Our Visual Sensor
The human retina can be characterized as a mosaic of two classes of photosensitive receptor cells: cones and rods. The average human eye possesses from 6 to 7 million cones. There are three types of cones, termed “red” or “L-cones”
(~64% of the total), “green” or “M-cones” (~32%), and “blue” or “S-cones” (~4%) for the wavelengths of their peak sensitivities (~564 nm, ~534 nm, and ~420 nm, respectively). In concert, these three receptor types (and their relative response rates) support the perception of color (Bowmaker & Dartnall, 1980). The red and green cones are tightly clustered around the center (or fovea) of the retina, while the sparse blue cones are distributed over the entire retina. A schematic of a typical foveal mosaic is shown in Figure 1.
Figure 1. Schematic of the Foveal Mosaic. The center area (fovea) of the human retina is composed of hexagonally packed cone cells. The red (L) and green (M) cones greatly outnumber the blue (S) cones, which are entirely absent in the mosaic’s center. However, the blue (S) cones persist into the peripheral region, where the red (L) and green (M) cones are absent.
Rods, by comparison, are far more numerous (~120 million per eye) and more photosensitive, and are concentrated in the parafoveal and peripheral areas of the retina (i.e., from ~3° from the fovea’s center outward). Although rods also possess a peak-sensitivity wavelength (498 nm), there are no differential responses among the rods; hence, they are functionally “color blind. Thus in low-light condition (where only the cones are activated), human vision is essentially monochromatic. The wavelength response curves of the cone and rod cells are shown in Figure 2.
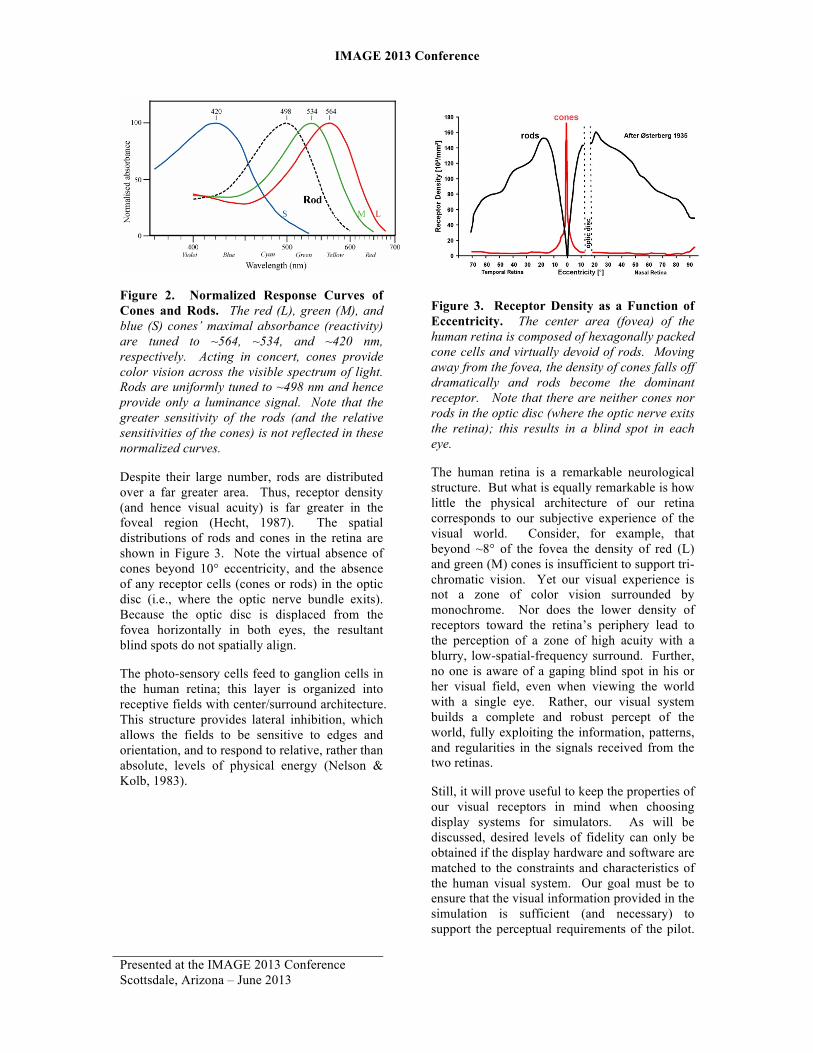
IMAGE 2013 Conference
Presented at the IMAGE 2013 Conference Scottsdale, Arizona – June 2013
Figure 2. Normalized Response Curves of Cones and Rods. The red (L), green (M), and blue (S) cones’ maximal absorbance (reactivity) are tuned to ~564, ~534, and ~420 nm, respectively. Acting in concert, cones provide color vision across the visible spectrum of light. Rods are uniformly tuned to ~498 nm and hence provide only a luminance signal. Note that the greater sensitivity of the rods (and the relative sensitivities of the cones) is not reflected in these normalized curves.
Despite their large number, rods are distributed over a far greater area. Thus, receptor density (and hence visual acuity) is far greater in the foveal region (Hecht, 1987). The spatial distributions of rods and cones in the retina are shown in Figure 3. Note the virtual absence of cones beyond 10° eccentricity, and the absence of any receptor cells (cones or rods) in the optic disc (i.e., where the optic nerve bundle exits). Because the optic disc is displaced from the fovea horizontally in both eyes, the resultant blind spots do not spatially align.
The photo-sensory cells feed to ganglion cells in the human retina; this layer is organized into receptive fields with center/surround architecture. This structure provides lateral inhibition, which allows the fields to be sensitive to edges and orientation, and to respond to relative, rather than absolute, levels of physical energy (Nelson & Kolb, 1983).
Figure 3. Receptor Density as a Function of Eccentricity. The center area (fovea) of the human retina is composed of hexagonally packed cone cells and virtually devoid of rods. Moving away from the fovea, the density of cones falls off dramatically and rods become the dominant receptor. Note that there are neither cones nor rods in the optic disc (where the optic nerve exits the retina); this results in a blind spot in each eye.
The human retina is a remarkable neurological structure. But what is equally remarkable is how little the physical architecture of our retina corresponds to our subjective experience of the visual world. Consider, for example, that beyond ~8° of the fovea the density of red (L) and green (M) cones is insufficient to support tri-chromatic vision. Yet our visual experience is not a zone of color vision surrounded by monochrome. Nor does the lower density of receptors toward the retina’s periphery lead to the perception of a zone of high acuity with a blurry, low-spatial-frequency surround. Further, no one is aware of a gaping blind spot in his or her visual field, even when viewing the world with a single eye. Rather, our visual system builds a complete and robust percept of the world, fully exploiting the information, patterns, and regularities in the signals received from the two retinas.
Still, it will prove useful to keep the properties of our visual receptors in mind when choosing display systems for simulators. As will be discussed, desired levels of fidelity can only be obtained if the display hardware and software are matched to the constraints and characteristics of the human visual system. Our goal must be to ensure that the visual information provided in the simulation is sufficient (and necessary) to support the perceptual requirements of the pilot.
IMAGE 2013 Conference
Presented at the IMAGE 2013 Conference Scottsdale, Arizona – June 2013
To this end, we will present a brief taxonomy of the visual cues typically used by pilots in closed-loop control tasks.
Visual Cues – The Information Derived from the Sensory Stream
As suggested above, the human visual system is actually a “system of systems.” And while our visual perception of the world appears integrated and seamless, it is actually the product of two separate streams of neurological processing in the central nervous system. The magnocellular (magno) pathway originates in the large ganglion cells with large receptive field, and is not sensitive to color. The magno system is highly sensitive to motion, and thus provides information regarding orientation and movement (both of objects and oneself); hence, it is sometimes referred to as the “where” system.
In contrast, the parvocellular (parvo) pathway originates in small ganglion cells with small receptive fields. This system is sensitive to color and fine detail. Hence, the parvo system is primarily responsible for form perception and object recognition, and is therefore referred to as the “what” system.
Roughly speaking, the parvo system is dominant in foveal vision, while the peripheral fields inform the magno system (Callaway, 2005). While the integration of information from these pathways is seamless in healthy individuals, striking dysfunctions of the systems can be observed in people suffering from brain injuries or diseases (e.g., Silva, Faria, Regateiro, Forjaz, Januario, Freire, & Castelo-Branco, 2005).
Clearly, piloting an aircraft places high demands on both the magno and parvo systems. Pilots are expected to read runway and taxiway signage, identify the color of Precision Approach Path Indicator (PAPI) lights and oncoming aircraft lights, and “read” sky and terrain features – all of which depend on the parvo pathway. At the same time, pilots must maintain attitude awareness, and monitor the motion of own craft and surrounding traffic, making judgments of distances and closure rates – all of which weigh heavily on the magno pathway.
While it is tempting to parse the pilot’s visual information (and the tasks they support) into “static” cues (which informs the parvo system) and “motion-based” cues (which informs the
magno system), it is also important to recognize that the human visual system is incredibly opportunistic, and will exploit whatever cues are available to complete an operational task. Thus, a pilot with deficient color vision may leverage relative brightness to interpret PAPI light patterns. Moreover, a pilot making a distance judgment can draw on a variety of static depth cues (e.g., relative size, texture gradient, stereopsis) as well as a number of motion-based depth cues (e.g., relative velocity, expansion rate). Our own research has demonstrated that the visual cues that an operator uses to perform a control task (and their relative weightings) vary as a function of information quality and task demands (Sweet & Kaiser, 2006).
In the next section, we will consider how human vision characteristics relate to simulator visual system capabilities and specifications.
RELATING HUMAN VISION TO SIMULATOR VISUAL SYSTEMS
Effective visual system design can only be accomplished by leveraging simulator resources against the visual characteristics and operational needs of the human pilot. In short, the goal is to create a visual system architecture that delivers the appropriate level of visual fidelity required. Although this goal is simple in principle, in practice difficulties arise as required fidelity levels vary as a function of task, and as satisfying the requirement of one aspect of rendering compromises the fidelity of another. As noted above, humans utilize a combination of the available visual information, and the resultant perception that emerges from the brain’s neural processing, to inform their judgments and movements. However, human vision is typically quantified by clinical measurements of individual parameters. We will consider these measures (visual acuity, contrast sensitivity, color vision, stereopsis, and motion perception), and how they relate to simulator specifications (resolution, contrast, color gamut, update rate, temporal measures). Then, we will discuss the difficulties of developing an effective simulator visual system design given the competing, sometimes conflicting, goals for the use of a given visual system.
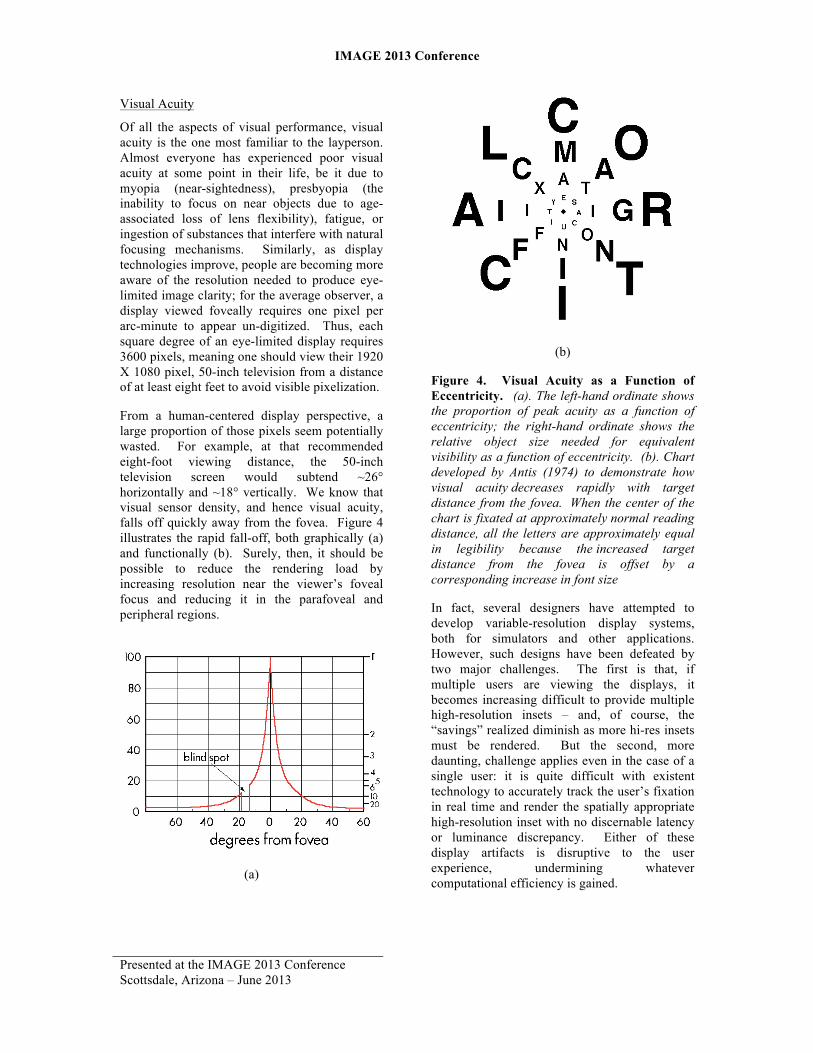
IMAGE 2013 Conference
Presented at the IMAGE 2013 Conference Scottsdale, Arizona – June 2013
Visual Acuity
Of all the aspects of visual performance, visual acuity is the one most familiar to the layperson. Almost everyone has experienced poor visual acuity at some point in their life, be it due to myopia (near-sightedness), presbyopia (the inability to focus on near objects due to age-associated loss of lens flexibility), fatigue, or ingestion of substances that interfere with natural focusing mechanisms. Similarly, as display technologies improve, people are becoming more aware of the resolution needed to produce eye-limited image clarity; for the average observer, a display viewed foveally requires one pixel per arc-minute to appear un-digitized. Thus, each square degree of an eye-limited display requires 3600 pixels, meaning one should view their 1920 X 1080 pixel, 50-inch television from a distance of at least eight feet to avoid visible pixelization.
From a human-centered display perspective, a large proportion of those pixels seem potentially wasted. For example, at that recommended eight-foot viewing distance, the 50-inch television screen would subtend ~26° horizontally and ~18° vertically. We know that visual sensor density, and hence visual acuity, falls off quickly away from the fovea. Figure 4 illustrates the rapid fall-off, both graphically (a) and functionally (b). Surely, then, it should be possible to reduce the rendering load by increasing resolution near the viewer’s foveal focus and reducing it in the parafoveal and peripheral regions.
(a)
(b)
Figure 4. Visual Acuity as a Function of Eccentricity. (a). The left-hand ordinate shows the proportion of peak acuity as a function of eccentricity; the right-hand ordinate shows the relative object size needed for equivalent visibility as a function of eccentricity. (b). Chart developed by Antis (1974) to demonstrate how visual acuity decreases rapidly with target distance from the fovea. When the center of the chart is fixated at approximately normal reading distance, all the letters are approximately equal in legibility because the increased target distance from the fovea is offset by a corresponding increase in font size
In fact, several designers have attempted to develop variable-resolution display systems, both for simulators and other applications. However, such designs have been defeated by two major challenges. The first is that, if multiple users are viewing the displays, it becomes increasing difficult to provide multiple high-resolution insets – and, of course, the “savings” realized diminish as more hi-res insets must be rendered. But the second, more daunting, challenge applies even in the case of a single user: it is quite difficult with existent technology to accurately track the user’s fixation in real time and render the spatially appropriate high-resolution inset with no discernable latency or luminance discrepancy. Either of these display artifacts is disruptive to the user experience, undermining whatever computational efficiency is gained.
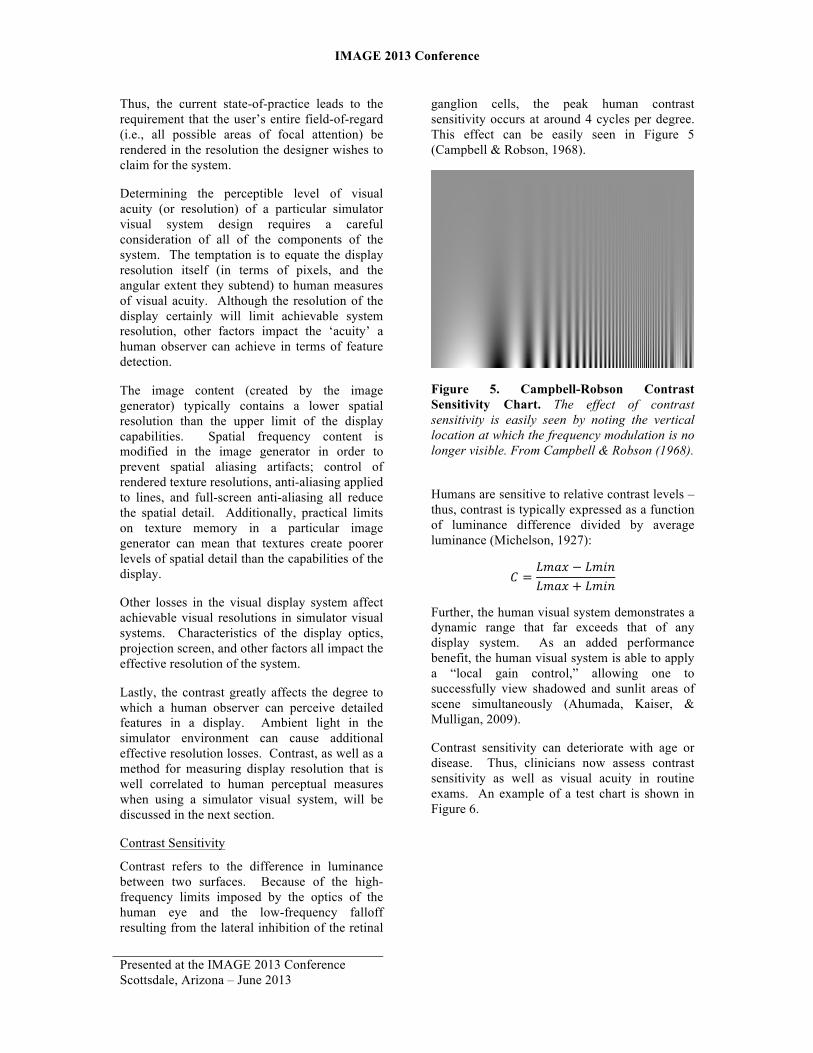
IMAGE 2013 Conference
Presented at the IMAGE 2013 Conference Scottsdale, Arizona – June 2013
Thus, the current state-of-practice leads to the requirement that the user’s entire field-of-regard (i.e., all possible areas of focal attention) be rendered in the resolution the designer wishes to claim for the system.
Determining the perceptible level of visual acuity (or resolution) of a particular simulator visual system design requires a careful consideration of all of the components of the system. The temptation is to equate the display resolution itself (in terms of pixels, and the angular extent they subtend) to human measures of visual acuity. Although the resolution of the display certainly will limit achievable system resolution, other factors impact the ‘acuity’ a human observer can achieve in terms of feature detection.
The image content (created by the image generator) typically contains a lower spatial resolution than the upper limit of the display capabilities. Spatial frequency content is modified in the image generator in order to prevent spatial aliasing artifacts; control of rendered texture resolutions, anti-aliasing applied to lines, and full-screen anti-aliasing all reduce the spatial detail. Additionally, practical limits on texture memory in a particular image generator can mean that textures create poorer levels of spatial detail than the capabilities of the display.
Other losses in the visual display system affect achievable visual resolutions in simulator visual systems. Characteristics of the display optics, projection screen, and other factors all impact the effective resolution of the system.
Lastly, the contrast greatly affects the degree to which a human observer can perceive detailed features in a display. Ambient light in the simulator environment can cause additional effective resolution losses. Contrast, as well as a method for measuring display resolution that is well correlated to human perceptual measures when using a simulator visual system, will be discussed in the next section.
Contrast Sensitivity
Contrast refers to the difference in luminance between two surfaces. Because of the high-frequency limits imposed by the optics of the human eye and the low-frequency falloff resulting from the lateral inhibition of the retinal
ganglion cells, the peak human contrast sensitivity occurs at around 4 cycles per degree. This effect can be easily seen in Figure 5 (Campbell & Robson, 1968).
Figure 5. Campbell-Robson Contrast Sensitivity Chart. The effect of contrast sensitivity is easily seen by noting the vertical location at which the frequency modulation is no longer visible. From Campbell & Robson (1968).
Humans are sensitive to relative contrast levels – thus, contrast is typically expressed as a function of luminance difference divided by average luminance (Michelson, 1927):
𝐶 =𝐿𝑚𝑎𝑥 − 𝐿𝑚𝑖𝑛𝐿𝑚𝑎𝑥 + 𝐿𝑚𝑖𝑛
Further, the human visual system demonstrates a dynamic range that far exceeds that of any display system. As an added performance benefit, the human visual system is able to apply a “local gain control,” allowing one to successfully view shadowed and sunlit areas of scene simultaneously (Ahumada, Kaiser, & Mulligan, 2009).
Contrast sensitivity can deteriorate with age or disease. Thus, clinicians now assess contrast sensitivity as well as visual acuity in routine exams. An example of a test chart is shown in Figure 6.
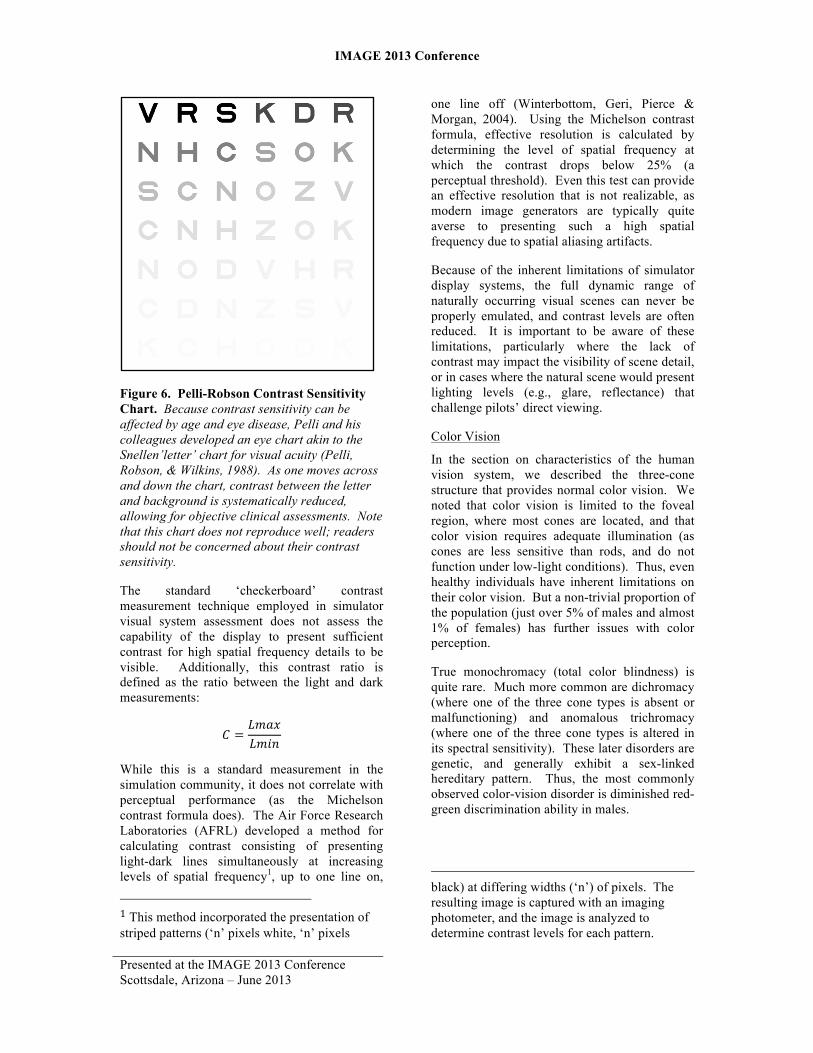
IMAGE 2013 Conference
Presented at the IMAGE 2013 Conference Scottsdale, Arizona – June 2013
Figure 6. Pelli-Robson Contrast Sensitivity Chart. Because contrast sensitivity can be affected by age and eye disease, Pelli and his colleagues developed an eye chart akin to the Snellen’letter’ chart for visual acuity (Pelli, Robson, & Wilkins, 1988). As one moves across and down the chart, contrast between the letter and background is systematically reduced, allowing for objective clinical assessments. Note that this chart does not reproduce well; readers should not be concerned about their contrast sensitivity.
The standard ‘checkerboard’ contrast measurement technique employed in simulator visual system assessment does not assess the capability of the display to present sufficient contrast for high spatial frequency details to be visible. Additionally, this contrast ratio is defined as the ratio between the light and dark measurements:
𝐶 =𝐿𝑚𝑎𝑥𝐿𝑚𝑖𝑛
While this is a standard measurement in the simulation community, it does not correlate with perceptual performance (as the Michelson contrast formula does). The Air Force Research Laboratories (AFRL) developed a method for calculating contrast consisting of presenting light-dark lines simultaneously at increasing levels of spatial frequency1, up to one line on,
1 This method incorporated the presentation of striped patterns (‘n’ pixels white, ‘n’ pixels
one line off (Winterbottom, Geri, Pierce & Morgan, 2004). Using the Michelson contrast formula, effective resolution is calculated by determining the level of spatial frequency at which the contrast drops below 25% (a perceptual threshold). Even this test can provide an effective resolution that is not realizable, as modern image generators are typically quite averse to presenting such a high spatial frequency due to spatial aliasing artifacts.
Because of the inherent limitations of simulator display systems, the full dynamic range of naturally occurring visual scenes can never be properly emulated, and contrast levels are often reduced. It is important to be aware of these limitations, particularly where the lack of contrast may impact the visibility of scene detail, or in cases where the natural scene would present lighting levels (e.g., glare, reflectance) that challenge pilots’ direct viewing.
Color Vision
In the section on characteristics of the human vision system, we described the three-cone structure that provides normal color vision. We noted that color vision is limited to the foveal region, where most cones are located, and that color vision requires adequate illumination (as cones are less sensitive than rods, and do not function under low-light conditions). Thus, even healthy individuals have inherent limitations on their color vision. But a non-trivial proportion of the population (just over 5% of males and almost 1% of females) has further issues with color perception.
True monochromacy (total color blindness) is quite rare. Much more common are dichromacy (where one of the three cone types is absent or malfunctioning) and anomalous trichromacy (where one of the three cone types is altered in its spectral sensitivity). These later disorders are genetic, and generally exhibit a sex-linked hereditary pattern. Thus, the most commonly observed color-vision disorder is diminished red-green discrimination ability in males.
black) at differing widths (‘n’) of pixels. The resulting image is captured with an imaging photometer, and the image is analyzed to determine contrast levels for each pattern.
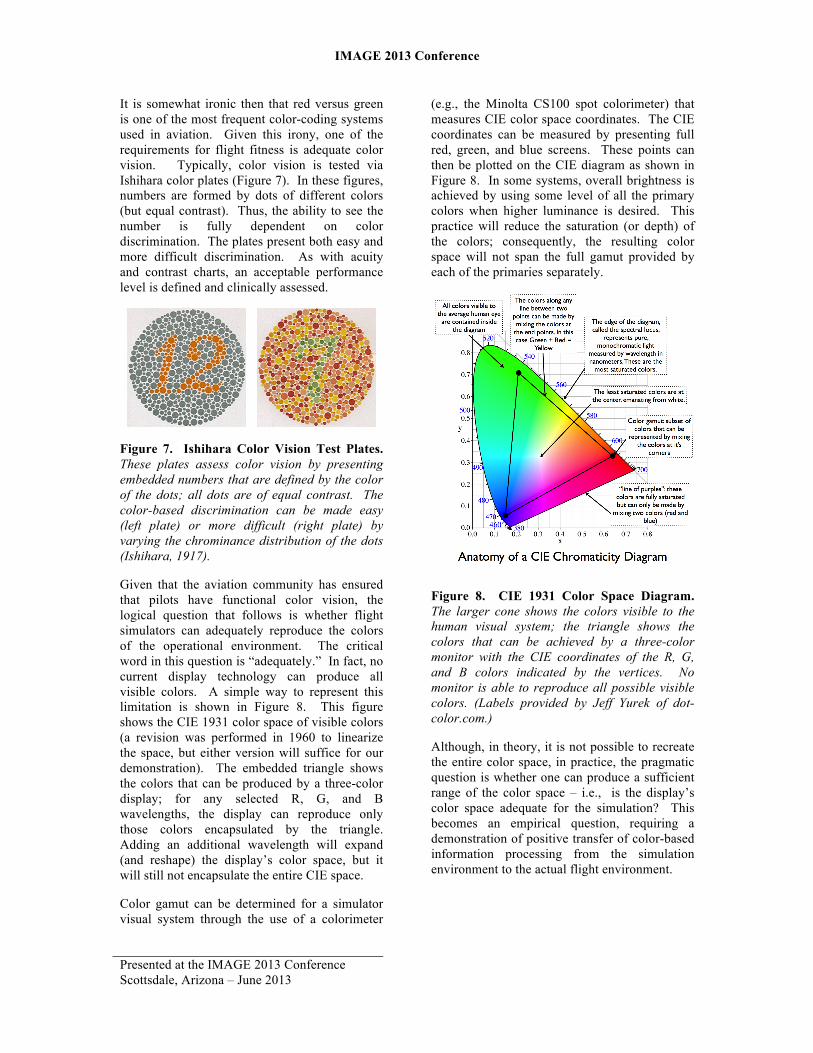
IMAGE 2013 Conference
Presented at the IMAGE 2013 Conference Scottsdale, Arizona – June 2013
It is somewhat ironic then that red versus green is one of the most frequent color-coding systems used in aviation. Given this irony, one of the requirements for flight fitness is adequate color vision. Typically, color vision is tested via Ishihara color plates (Figure 7). In these figures, numbers are formed by dots of different colors (but equal contrast). Thus, the ability to see the number is fully dependent on color discrimination. The plates present both easy and more difficult discrimination. As with acuity and contrast charts, an acceptable performance level is defined and clinically assessed.
Figure 7. Ishihara Color Vision Test Plates. These plates assess color vision by presenting embedded numbers that are defined by the color of the dots; all dots are of equal contrast. The color-based discrimination can be made easy (left plate) or more difficult (right plate) by varying the chrominance distribution of the dots (Ishihara, 1917).
Given that the aviation community has ensured that pilots have functional color vision, the logical question that follows is whether flight simulators can adequately reproduce the colors of the operational environment. The critical word in this question is “adequately.” In fact, no current display technology can produce all visible colors. A simple way to represent this limitation is shown in Figure 8. This figure shows the CIE 1931 color space of visible colors (a revision was performed in 1960 to linearize the space, but either version will suffice for our demonstration). The embedded triangle shows the colors that can be produced by a three-color display; for any selected R, G, and B wavelengths, the display can reproduce only those colors encapsulated by the triangle. Adding an additional wavelength will expand (and reshape) the display’s color space, but it will still not encapsulate the entire CIE space.
Color gamut can be determined for a simulator visual system through the use of a colorimeter
(e.g., the Minolta CS100 spot colorimeter) that measures CIE color space coordinates. The CIE coordinates can be measured by presenting full red, green, and blue screens. These points can then be plotted on the CIE diagram as shown in Figure 8. In some systems, overall brightness is achieved by using some level of all the primary colors when higher luminance is desired. This practice will reduce the saturation (or depth) of the colors; consequently, the resulting color space will not span the full gamut provided by each of the primaries separately.
Figure 8. CIE 1931 Color Space Diagram. The larger cone shows the colors visible to the human visual system; the triangle shows the colors that can be achieved by a three-color monitor with the CIE coordinates of the R, G, and B colors indicated by the vertices. No monitor is able to reproduce all possible visible colors. (Labels provided by Jeff Yurek of dot-color.com.)
Although, in theory, it is not possible to recreate the entire color space, in practice, the pragmatic question is whether one can produce a sufficient range of the color space – i.e., is the display’s color space adequate for the simulation? This becomes an empirical question, requiring a demonstration of positive transfer of color-based information processing from the simulation environment to the actual flight environment.
IMAGE 2013 Conference
Presented at the IMAGE 2013 Conference Scottsdale, Arizona – June 2013
Stereopsis
Stereopsis, the ability to recover depth from the retinal disparities in the left and right eye, is sometimes referred to as 3-D vision. This is a misnomer because, as explained earlier, there are numerous additional cues (both static and motion-based) that specify the three-dimensional structure of the visual world. Subjectively, the visual world does not collapse into a 2-D plane when one closes one eye; many people navigate through the environment with only one eye (as do animals with no overlap between their left and right eyes’ fields-of-view).
Further, not all people (even those with two healthy, functional eyes) exhibit functional stereopsis. Approximately 5% of the population (primarily males) lack stereopsis, and even more have poor stereo acuity. Even individuals with excellent stereopsis cannot exploit retinal disparities when the objects lie beyond a certain distance; observers with superior stereopsis still require ~0.1 arcmin of disparity2 between the retinal images to make a reliable depth judgment.
Specific implementations of stereo displays nearly always have some trade-off factor of two involved. Stereo achieved via passive polarizing lenses require two projectors. The use of active shuttering lenses requires increased update rates to achieve acceptable update rates to each eye individually. Helmet-mounted displays, which already have two separate visual image sources, require a graphics processor capable of creating the two images at an acceptable update rate and often do not have full overlap, reducing the immediate field-of-view in which stereo cues are available.
Multiple factors need to be considered to successfully implement a stereo display; convergence/accommodation must be sufficiently correlated to prevent discomfort when using the display. Specific characteristics of the temporal sampling also impact the achievable levels of stereoacuity, and can contribute to artifacts that provide inaccurate depth cueing.
Although it is a common belief that most visually guided flight involves the perception of
2 The Air Force requirement for its pilots is 25 arcsec of stereo acuity.
objects beyond the limits of functional stereopsis, there is evidence that stereopsis is a usable cue at significant distances. Davis, Johnson, Stepanek, and Fogarty (2008) suggest a functional limit of 200 m. Palmisano, Gillam, Govan, Allison, & Harris (2010) performed experiments that demonstrated stereopsis to be useful at depths up to 160 m.
Clearly, stereopsis is potentially an effective (and important) cue for many types of aviation operations. This was recently demonstrated in a study investigating the use of stereo displays, head tracking, and display type (collimated and real-image) for an aerial refueling boom operator (Lloyd & Nigus, 2012). Stereopsis was shown to significantly improve boom operator performance (the nozzle/receptacle are 20 m from the operator).
The display requirements providing binocular disparities of 25 arcsec would seem to be prohibitive – but fortunately, it does not translate directly into display resolution. Lloyd (2012) determined that with the use of spatial antialiasing, observers were capable of discriminating stereo disparities as low as 3-10 arcsec with an angular pitch of 0.48 arcmin/pixel.
We would suggest that the utility of stereo displays in simulators depends both on the task the pilot is performing (e.g., mid-air refueling) and on the capabilities of the display system. Lloyd (2012) provides an excellent discussion of these trade-offs. We will return to the issue of whether or not to employ stereo displays when we consider the inherent conflicts that result from attempting to satisfy competing demands for visual cues.
Motion Vision and Temporal Sampling Effects
As is the case with movies, television, and other computer-generated animation, visual motion on simulator displays is actually produced by a rapid sequence of still images. Technicians in all these fields have long sought to define the necessary and sufficient rate of image presentation for their media. The emphasis on “necessary” is due to the cost and difficulty of passing film through a camera and projector (movies), electrically capturing (and transmitting) high-resolution camera images in real time (television), or rendering 3-D world models (CG animation); the emphasis on “sufficient” because audiences will not tolerate
IMAGE 2013 Conference
Presented at the IMAGE 2013 Conference Scottsdale, Arizona – June 2013
annoying motion artifacts and pilots may not learn appropriate motion-based cues if motion quality is inadequate.
Because of technological limitations, designers have employed a wide variety of tricks and hacks to improve visual motion quality. These have included the following: interlacing (i.e., rendering even-number screen lines on one refresh, odd-numbered on the next); decoupling display update rate and refresh rate (e.g., projecting a movie at 24 frames per second but shuttering each frame twice or thrice); and introducing motion-blur into each rendered frame to minimize aliasing (cameras naturally capture motion blur; George Lucas introduced the technique of Go-Motion, wherein objects are moved during stop-motion filming to create motion blur).
Temporal sampling artifacts that are sometimes evident in flight simulation applications are motion-induced blur (Sweet & Hebert, 2007) and spatio-temporal aliasing (Sweet, Stone, Liston, & Hebert, 2008). Motion-induced blur is an interaction between the lengthy illumination times of fixed-matrix displays (e.g. LCD, LCoS) and the observer’s eye movements. It can be mitigated by ‘shuttering’ the image (blanking for a fraction of the frame time) and/or by increasing update rate (Sweet & Kato, 2012). Several methods have been employed to effectively reduce the illumination time; mechanical shutters, LCD shutters, and direct light attenuation are all methods used to reduce motion-induced blur. While effective at reducing blur, these methods come at the cost of decreasing overall brightness. Increasing update rate improves blur while maintaining brightness, but requires a display capable of refreshing with new content at that rate3, and places an increased demand on the image generator.
Spatio-temporal aliasing is an artifact that is not commonly seen in television or movies. Natural camera blur in the image capture (or, intentionally created blur in sophisticated computer generated features [e.g. Pixar, Dreamworks]) eliminate this artifact. Only increasing the update rate can reduce the saliency 3 Although 120, 240, and even 480 Hz update rate televisions are available on the market, they present images interpolated from lower-rate content.
of this artifact. Unlike motion-induced blur, the direct effect of this artifact on flight operations is not as easily quantified, but it has the capacity of reducing the perception of visual motion as well as creating portions of the display which appear ‘jerky’ or even doubled. Watson, Ahumada & Farrell (1986) applied models of human vision that predict when this artifact starts to become visible; there is a potential to apply this and other model-based approaches to determine quantitative rather than qualitative assessments of the impact of this artifact.
Interestingly, little attention has been paid to individual differences in motion vision and other dynamic aspects of visual perception. For example, in addition to the amount of disparity needed to support stereopsis, there is also variability in the time it takes individuals to fuse stereo pairs. Similarly, people vary in how well they can judge relative velocities, closure rates, and rotation rates. Although one might logically suppose that these perceptual sensitivities could impact pilot performance and James Gibson suggested such screening for pilots during World War II (Gibson, 1950), there has been little systematic investigation of whether these aspects’ sensitivities have operational significance.
Optimizing Simulator Visual Performance – Serving Multiple Masters
As the discerning reader may have surmised, it is indeed difficult to design a visual display system that optimally supports all aspects of human visual perception. The object edge softened to minimize motion aliasing compromises visual acuity; the stereo pairs needed to support stereopsis may reduce spatial and temporal resolution (e.g., in a shuttered stereo display) or brightness and contrast (e.g., in a polarized stereo display).
There is a natural tendency to judge the quality of a simulator’s visual system by the appearance of a static image. We are impressed when a scene is rendered with sharp, vivid detail. But those exact same high-spatial-frequency, high-contrast edges can produce a nightmare of motion aliasing once the scene is set into motion. Video gamers refer to this as the lure of the screen grab. The truly gifted designer must balance the image rendering characteristics to match the temporal sampling rate.
IMAGE 2013 Conference
Presented at the IMAGE 2013 Conference Scottsdale, Arizona – June 2013
Thus, as we suggested earlier, it may not be appropriate to think in terms of an optimal simulator visual system design. Rather, systems must be optimized relative to the visual requirements of the operational task, and the visual capabilities (and limitations) of the user. Pilots present a fairly homogeneous population of users. Unless granted a special dispensation, pilots will have binocular vision with normal acuity, contrast sensitivity, color vision, and stereopsis. Thus, most of the tailoring of the simulation displays will be driven by operational task demands. Still, some caution should be taken when designing for a “normal” user.
WHAT IS “NORMAL” VISION?
In terms of visual perception, the aviation community (especially the military wing) is like Lake Wobegon – almost everyone is above average, at least on the parameters tested. So whereas the Air Force requires pilot candidates to have 20/20 acuity, many demonstrate 20/15 or even 20/10. This preponderance of eagle-eyed pilots may place additional design consideration on simulator visual systems.
Consider, for example, if one wishes to design an eye-limited simulator display. The standard industry metric of 1 pixel/arcmin would likely prove inadequate. True, such a display would likely be eye-limited for the majority of the pilots, but a sizeable minority (i.e., those 20/10 guys and gals) could perceive the pixelization. This would then result in the two groups of pilots having qualitatively different display experiences (i.e., pixelated versus unpixelated). It is possible that the nature of the training experience (and certainly its fidelity) would vary between the two groups, which in turn could lead to differences in transfer of training and operational efficacy.
This argument can be applied to other aspects of visual performance (e.g., contrast sensitivity, color vision), with the same take-away message: it is necessary to “overdesign” a system (i.e., exceed industry standards) if one wishes to ensure that even the outliers of the population will experience the system as desired. Of course, this rule applies even when the average member of a population is, well, average. But the undesirable artifacts are exacerbated when dealing with a population with better-than-average visual performance.
A second challenge in designing simulator visual system is determining whether a pilot’s failure to utilize an appropriate visual cue is due to visual sensitivity or perceptual learning. This difference can be subtle, and perhaps best appreciated with examples from other domains. A senior radiologist can inspect an x-ray and “see” a tumor that a new intern cannot. Is this because the more experienced doctor has superior visual acuity or contrast sensitivity? Most likely not. Rather, it is likely the case that his or her perceptual system has become attuned to subtle features and/or patterns that the junior doctor has yet to learn. Similarly, an expert can literally taste flavors in a wine that completely elude the first author (and somewhat elude the second author). Yet the first author might demonstrate greater taste differentiation for chocolates than the wine connoisseur – it’s not a matter of sensory sensitivity, it’s a matter of perceptual learning, of acquiring an educated palate.
If a simulator is “tuned” with the judgment of a highly experienced pilot, a visual cue that is more subtle on the display than in the natural world may be deemed sufficient. But that same cue may elude the less experienced pilot. Thus, if subjective ratings are used in system evaluation, it is critical to ensure that visual cue salience is not artificially dependent on the users’ perceptual learning.
CONCLUSIONS
The design of flight simulator visual systems can benefit from the input of a multidisciplinary team whose members can contribute expertise in three domains: the capabilities and limitations of display technologies; the characteristics of the human visual system; and the visual demands of operational flight tasks. Rather than seek the holy grail of a single optimized design for all flight simulator visual systems, a more realistic goal is to understand that designs must be responsive to the specific visual demands of the flight regime being simulated. Further, the resultant design will need to compromise optimized performance on any single visual aspect in order to balance the competing requirements of all the necessary visual cues.
IMAGE 2013 Conference
Presented at the IMAGE 2013 Conference Scottsdale, Arizona – June 2013
REFERENCES
Ahumada, A. J., Kaiser, M. K., and Mulligan, J. B. (2009). The dynamic range of visual imagery in space. Proceedings of SPIE, Volume 7240.
Anstis, S. (1974). A chart demonstrating variation in acuity with retinal position, Vision Research, 14 , 589-592.
Bowmaker, J. K. and Dartnall, H. J. A. (1980). Visual pigments of rods and cones in a human retina. Journal of Physiology, 298, 501-511.
Callaway, E. M. (2005). Structure and function of parallel pathways in the primate early visual system. Journal of Physiology, 566, 13-19.
Campbell, F. W. and Robson, J. G. (1968). Campbell-Robson contrast sensitivity chart: application of Fourier analysis to the modulation response of the eye. Journal of the Optical Society of America A, 54:581A.
Davis, J. R., Johnson, R., and Stepanek, J., and Fogarty, J. (2008). Fundamentals of Aerospace Medicine: Fourth Edition, Philadelphia: Lippincott, Williams and Wilkins. pp. 355.
Gibson, J. J. (1950). Perception of the visual world. Boston: Houghton Mifflin.
Hecht, E. (1987). Optics, 2nd edition. New York: Addison Wesley.
Ishihara, S. (1917). Tests for color-blindness. Handaya, Tokyo: Hongo Harukicho.
Lloyd, C. J. (2012). Effects of spatial resolution and antialiasing on stereoacuity and comfort. Proceeding of the AIAA Modeling and Simulation Technologies Conference, Minneapolis, MN.
Lloyd, C. J. and Nigus, S. G. (2012). Effect of stereopsis, collimation and head tracking on air refueling boom operator performance. Proceedings of the IMAGE 2012 Conference, Scottsdale, AZ.
Michelson, A. (1927). Studies in Optics. University of Chicago Press.
Nelson, R. and Kolb, H. (1983). Synaptic patterns and responses of bipolar and ganglion
cells in the cat retina. Vision Research, 23, 1183-1195.
Norman, D. (2005). Human-centered design considered harmful. Interactions, 12(4), 14-19.
Osterberg, G. (1935). Topography of the layer of rods and cones in the human retina. Acta Ophthal.(suppl.) 6, 1-103.
Palmisano, S., Gillam, B., Govan, D. G., Allison, R. S., and Harris, J. M. (2010). Stereoscopic perception of real depths at large distances. Journal of Vision, 10(6):19, 1-16.
Pelli, D. G., Robson, J. G., & Wilkins, A. J. (1988). The design of a new letter chart for measuring contrast sensitivity. Clinical Vision Sciences, 2(3):187-199.
Silva, M. F., Faria, P., Regateiro, F. S., Forjaz, V., Januario, C., Freire, A., and Castelo-Branco, M. (2005). Independent patterns of damage within magno-, parvo- and koniocellular pathways in Parkinson’s disease. Brain, 128, 2260-2271.
Sweet, B. T. and Hebert, T. M. (2007). The impact of motion-‐induced blur on out-‐the-‐window visual system performance”. Proceedings of the IMAGE 2007 Conference, Scottsdale, AZ.
Sweet, B. T. and Kaiser, M. K. (2006). Integration of size and binocular disparity visual cues in manual depth-control tasks. AIAA Paper 63520, Keystone, CO.
Sweet, B. T. and Kato, K. J. (2012). 120 Hz: the new 60 for flight simulation?. Proceedings of the IMAGE 2012 Conference. Scottsdale, AZ.
Sweet, B. T., Stone, L. S., Liston, D. B. , and Hebert, T. M. (2008). Effects of spatio-‐temporal aliasing on out-‐the-‐window visual systems. Proceedings of the IMAGE 2008 Conference, Louisville, MO.
Watson, A. B., Ahumada Jr., A. J., & Farrell, J. (1986). Window of visibility: Psychophysical theory of fidelity in time-sampled visual motion displays. Journal of the Optical Society of America A, 3(3), 300-307. Winterbottom, M. D., Geri, G. A., Pierce, B. J., & Morgan, B. (2004). An Integrated Procedure
IMAGE 2013 Conference
Presented at the IMAGE 2013 Conference Scottsdale, Arizona – June 2013
for Measuring the Spatial and Temporal Resolution of Visual Displays. Interservice/Industry Training, Simulation, and Education Conference, Orlando, FL.
AUTHOR BIOGRAPHIES
Dr. Mary K. Kaiser is a research psychologist in the Human Systems Integration Division at NASA Ames Research Center. She received her Ph.D. in psychology from the University of Virginia, and was a postdoctoral fellow at the University of Michigan in applied experimental psychology before joining Ames in 1985. The author of over sixty articles and chapters on perceptual psychology and human factors and a Fellow of the Association for Psychological Science, Dr. Kaiser also served as an associate editor of the Journal of Experimental Psychology: Human Perception and Performance for over a decade, and is currently Project Scientist for NASA’s Space Human Factors Engineering Project. She also holds one patent and has a second patent pending for innovative display technologies. Dr. Barbara Sweet is a Human-Machine Aerospace Technologist in the Human Systems Integration Division at NASA Ames Research Center. She received B.S. and M.S. degrees in Aeronautical and Astronautical Engineering from Purdue University in Indiana in 1982 and 1986, respectively. In 1999, Dr. Sweet received a Ph.D. in Aeronautics and Astronautics from Stanford University, for the development of models of human control behavior that account for perspective scene viewing. Since joining NASA in 1984, she has worked in helicopter handling-qualities research, research simulation facility development and management, and human-factors research. Dr. Sweet is a pilot, with commercial ratings in both airplanes and helicopters, and formerly worked as a flight instructor and instrument flight instructor in airplanes.