relating freshwater organic matter fluorescence to organic carbon removal efficiency in drinking...
TRANSCRIPT
S C I E N C E O F T H E T O T A L E N V I R O N M E N T 4 0 7 ( 2 0 0 9 ) 1 7 6 5 – 1 7 7 4
ava i l ab l e a t www.sc i enced i r ec t . com
www.e l sev i e r. com/ loca te / sc i to tenv
Relating freshwater organic matter fluorescence to organiccarbon removal efficiency in drinking water treatment
Magdalena Bierozaa, Andy Bakerb, John Bridgemana,⁎aSchool of Civil Engineering, University of Birmingham, Edgbaston, Birmingham, B15 2TT, UKbSchool of Geography, Earth and Environmental Sciences, University of Birmingham, Edgbaston, Birmingham, B15 2TT, UK
A R T I C L E D A T A
⁎ Corresponding author. Tel.: +44 121 414 514E-mail address: [email protected] (
0048-9697/$ – see front matter © 2008 Elsevidoi:10.1016/j.scitotenv.2008.11.013
A B S T R A C T
Article history:Received 3 August 2008Received in revised form21 October 2008Accepted 9 November 2008Available online 10 December 2008
Monthly raw and clarified water samples were obtained for 16 UK surface water treatmentworks. The fluorescence excitation–emission matrix (EEM) technique was used for theassessment of total organic carbon (TOC) removal and organicmatter (OM) characterisation.The impact of algae presence in water on TOC removal, and its relationship withfluorescence, was analysed. Fluorescence peak C intensity was found to be a sensitiveand reliable measure of OM content. Fluorescence peak C emission wavelength and peak Tintensity (reflecting the degree of hydrophobicity and the microbial fraction, respectively)were found to characterize the OM; the impact of both on TOC removal efficiency wasapparent. OM fluorescence properties were shown to predict TOC removal, and identifyspatial and temporal variations. Previous work indicates that the trihalomethane (THM)concentration of treated water can be predicted from the raw water TOC concentration. Thesimplicity, sensitivity, speed of analysis and low cost, combined with potential forincorporation into on-line monitoring systems, mean that fluorescence spectroscopyoffers a robust analytical technique to be used in conjunction with, or in place of, otherapproaches to OM characterisation and THM formation prediction.
© 2008 Elsevier B.V. All rights reserved.
Keywords:Total organic carbon removalTrihalomethanesFluorescenceOrganic matter
1. Introduction
Organic matter (OM) is a complex mixture of heterogeneouschemical fractions. In drinking water treatment, the use ofchlorine as a disinfectant for waters containing natural organicmatter (NOM) results in the formation of carcinogenic,mutagenicandtoxiccompounds,whichposeapotential threat toconsumersof drinking water supplies (Rook, 1974; Krasner et al., 1989). Theoccurrence of halogenated species in drinking water postchlorination was first reported by Rook (1974) and Bellar et al.(1974). During the chlorination process, chlorine is consumedthrough multiple and complex reactions which give rise toundesirable reaction by-products. These harmful disinfectionby-products (DBPs) include several chemical compounds, includ-ing trihalomethanes (THMs: chloroform CHCl3, dichlorobromo-methane CHCl2Br, dibromochloromethane CHBr2Cl, bromoform
5; fax: +44 121 414 3675.J. Bridgeman).
er B.V. All rights reserved
CHCr3), haloacetic acids (HAAs) and haloacetonitriles (HANs)(Rook, 1974; Krasner et al., 1989; Nikolaou et al., 1999), andpotential DBP formation mechanisms have been elucidated bymany authors (e.g. Rook, 1974; Kavanaugh et al., 1980; EngerholmandAmy, 1983; Carlson andHardy, 1998). Previouswork indicatesthat the THM concentration of treated water can be predictedfrom the rawwater TOC concentration (see, for example, Stevenset al., 1976; Singer andChang, 1989; Singer, 1994; Chen et al., 2008)and the water industry routinely uses off-line and, more latterly,on-line TOC measurements to assess process performance andTHM formation potential.
Whilst TOC is routinely measured, the results obtained are oflimited valuewith regard to the character and composition of theOMpresent. However, although the structure and functionality ofOM are not completely understood (Mopper and Schultz, 1993;Thacker et al., 2005), OMdisplays specific fluorescenceproperties.
.
1766 S C I E N C E O F T H E T O T A L E N V I R O N M E N T 4 0 7 ( 2 0 0 9 ) 1 7 6 5 – 1 7 7 4
A review of the use of fluorescence spectrophotometry in waterscience can be found in Hudson et al. (2007); however, the keypoints are discussed briefly below.
When excited by UV and visible light, OM fluoresces andthe characteristics and intensity of the fluorescence variesdepending on the fluorophores present. The composition ofaquatic OM can be visualised as a pattern of fluorescencepeaks within an excitation–emission matrix (EEM). Fluores-cence peaks can be attributed to both natural fluorescence(humic- and fulvic-like), defined as peaks A and C (Coble, 1996)and amino acid-like organicmatter (tryptophan- and tyrosine-like fluorescence, defined as peaks T and B) at shorteremission wavelengths (Coble, 1996; Stedmon et al., 2003).Peak C fluorescence intensity has been shown to exhibit ageneral correlation with TOC (Smart et al., 1976, Vodacek et al.,1995, Ferrari et al., 1996), although the relationship can beweak if there are significant variations in the amount ofcarbon-specific fluorescence (Cumberland and Baker, 2007).Wu et al. (2003) found a significant correlation between thefulvic-like (peak C) fluorescence emission wavelength and thehyrophobicity, with higher emission for greater degree ofhydrophobicity. McKnight et al. (2001) found a strong linearrelationship between aromaticity and fluorescence, and con-cluded that microbially-derived fulvic acids have loweraromaticites and greater fluorescence indices (fluorescenceindex defined as the ratio of the emission intensity at awavelength of 450 nm to that at 500 nm, obtained with anexcitation of 370 nm). Stewart and Wetzel (1980) showed thatlarger molecular weight aquatic organic fractions had agreater absorbance but lower peak C fluorescence thansmaller molecular weight fractions. Similar findings werereported by Belzile and Guo (2006). Peak T intensity (trypto-phan-like fluorescence with maximum located at excitation280 nm and emission 350 nm) is indicative of the amino acid-like fraction content and the presence of anthropogenic OMinputs. It is also known to correlate with BOD (Reynolds andAhmad, 1997; Ahmad and Reynolds, 1999; Reynolds, 2002). Therelationship between biological activity of aquatic planktonand peak T fluorescence intensity for different dissolvedorganic matter (DOM) has been observed (e.g. Mopper andSchultz, 1993; Ferrari and Mingazzini, 1995). More recently,Cammack et al. (2004) reported that the highest algaemetabolism rates corresponded to tryptophan-like fluores-cence intensities. However, they also observed correlationswith other fluorescence regions (fulvic and humic-like).Additionally, the impact of algae-derived organic matter onTHMs formation during treatment was investigated by Para-lkar and Edzwald (1996) and Wildrig et al. (1996).
Therefore, the additional data available from fluorescencespectroscopy in real time is potentially of great process andcommercial value to the water industry. This study investi-gates the use of fluorescence spectroscopy to provide a rapidassessment of TOC character and removal and hence a usefulprocess assessment and optimisation tool at water treatmentworks. The study evaluates the use of peak C fluorescenceintensity reduction between freshwater (raw) and partially-treated waters as a measure of organic matter removal, andanalyses the relationship between freshwater organic matterfluorescence properties, algae numbers and TOC removal,including analyses on both seasonal and site specific data
from 16 surface water treatment works. The work focuses onthe generation and analysis of additional data which are notavailable from the more routine TOC analyses undertaken bythe water industry, and assesses the use of fluorescencespectroscopy as a complementary or replacement perfor-mance indicator.
2. Materials and methods
2.1. Sample sites
Fluorescence spectroscopy analysis was carried out onsamples of raw and clarified water from 16 surface watertreatment works (WTW), collected monthly between August2006 and August 2007. The treatment works are located in theMidlands region in central UK and are owned and operated bySevern Trent Water Ltd. The works' performance did notundergo any significant changes over the study period asillustrated by only minor variations in treatment parameters(coagulant dose, clarification pH, final water chlorine residualand final water pH; see Supplementary Table 1). Thetreatment works extract surface water from a wide range ofdifferent sources with different factors influencing raw waterquality (e.g. variation in recharge, land cover patterns,anthropogenic impacts on catchments and water sources).Therefore, the sample sites represent different organic matterproperties, indicative of the prevailing environmentalconditions.
Table 1 summarizes the sites that are included in this studywith a description of organic matter character; specifically theland use type, mean TOC values and range of organicproperties. The typical land use was calculated on the basisof the Corine Land Cover 2000 dataset obtained from theEuropean Environment Agency (Corine Land Cover, 2007). Thepredominant type of catchment land use is arable land (up to65% of the catchment for site 6 and 9) and pasture (the highestpercentage value of 76% for site 16).
2.2. Analytical methods
Each month, water samples were collected from the 16 WTWover a period of two days; the samples being stored cool and inthe dark until analysis, which was between three and sevendays from collection. Storage test experiments were under-taken to demonstrate that degradation of water samples wasinsignificant for these storage conditions (typical variation,including both increase and decrease in peak C fluorescenceintensity was 4.4% and for the peak T intensity 5.3%; typicalchange in TOC was less than 5%).
Organic matter fluorescence was measured using a CaryEclipse Fluorescence Spectrophotometer (Varian, Surrey, UK),by scanning excitation wavelengths from 200 to 400 nm in5 nm steps, and detecting the emitted fluorescence in 2 nmsteps between 280 and 500 nm. Excitation and emission slitwidths were set to 5 nm and photomultiplier tube voltage to725v. Manufacturer provided instrument correction factorswere used. In order to confirm the consistency of measure-ment conditions, scans of a sealed cell containing deionised
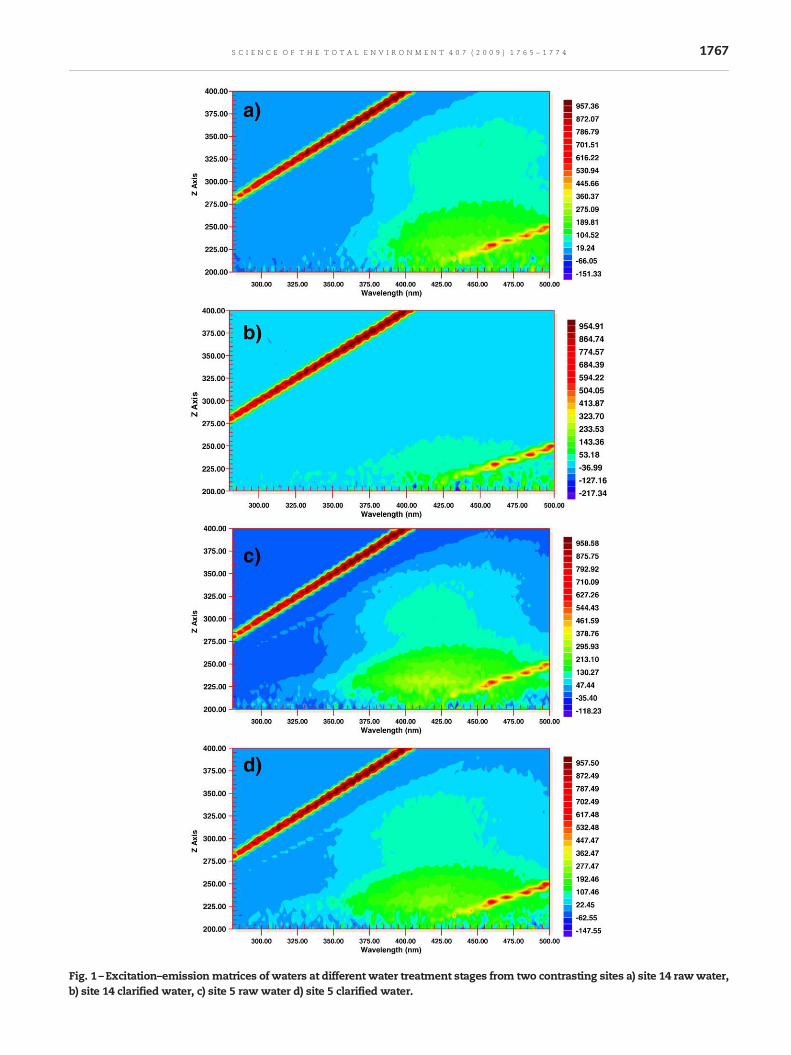
Fig. 1 –Excitation–emissionmatrices of waters at different water treatment stages from two contrasting sites a) site 14 rawwater,b) site 14 clarified water, c) site 5 raw water d) site 5 clarified water.
1767S C I E N C E O F T H E T O T A L E N V I R O N M E N T 4 0 7 ( 2 0 0 9 ) 1 7 6 5 – 1 7 7 4
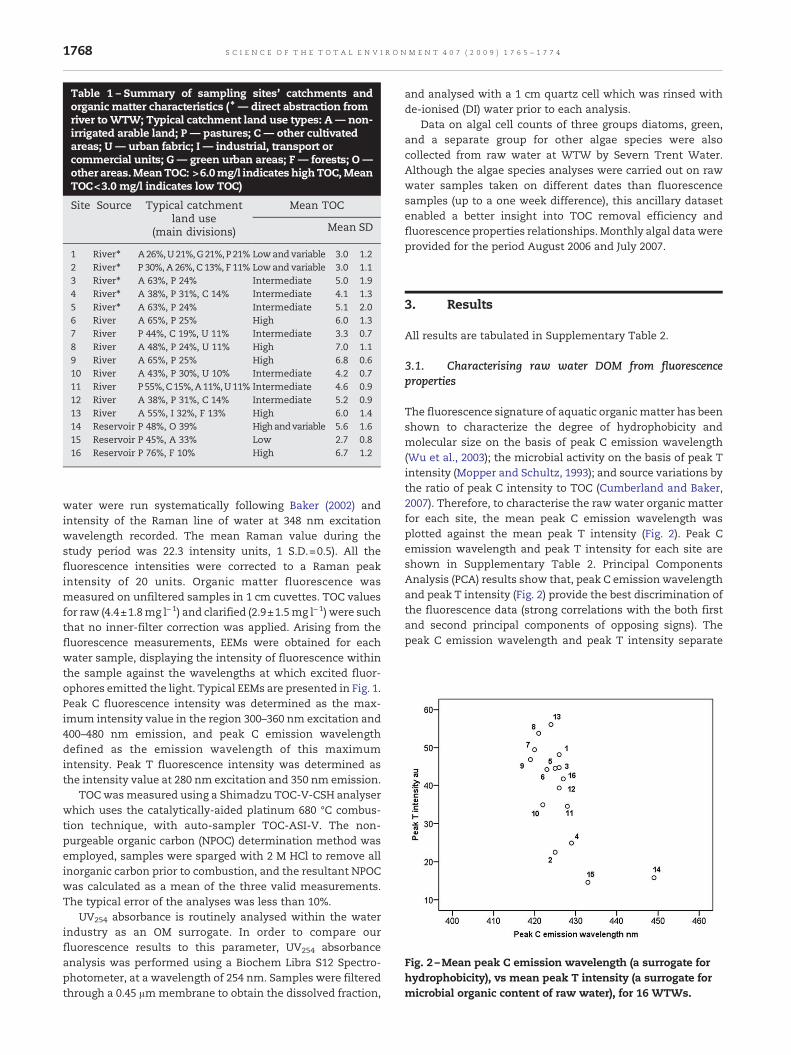
Fig. 2 –Mean peak C emission wavelength (a surrogate forhydrophobicity), vs mean peak T intensity (a surrogate formicrobial organic content of raw water), for 16 WTWs.
Table 1 – Summary of sampling sites' catchments andorganic matter characteristics (* — direct abstraction fromriver toWTW; Typical catchment land use types: A— non-irrigated arable land; P — pastures; C — other cultivatedareas; U — urban fabric; I — industrial, transport orcommercial units; G — green urban areas; F — forests; O —other areas.MeanTOC: >6.0mg/l indicates highTOC,MeanTOC<3.0 mg/l indicates low TOC)
Site Source Typical catchmentland use
(main divisions)
Mean TOC
Mean SD
1 River* A26%,U21%,G21%,P21% Lowand variable 3.0 1.22 River* P 30%, A 26%, C 13%, F 11% Lowand variable 3.0 1.13 River* A 63%, P 24% Intermediate 5.0 1.94 River* A 38%, P 31%, C 14% Intermediate 4.1 1.35 River* A 63%, P 24% Intermediate 5.1 2.06 River A 65%, P 25% High 6.0 1.37 River P 44%, C 19%, U 11% Intermediate 3.3 0.78 River A 48%, P 24%, U 11% High 7.0 1.19 River A 65%, P 25% High 6.8 0.610 River A 43%, P 30%, U 10% Intermediate 4.2 0.711 River P55%,C15%,A11%,U11% Intermediate 4.6 0.912 River A 38%, P 31%, C 14% Intermediate 5.2 0.913 River A 55%, I 32%, F 13% High 6.0 1.414 Reservoir P 48%, O 39% Highandvariable 5.6 1.615 Reservoir P 45%, A 33% Low 2.7 0.816 Reservoir P 76%, F 10% High 6.7 1.2
1768 S C I E N C E O F T H E T O T A L E N V I R O N M E N T 4 0 7 ( 2 0 0 9 ) 1 7 6 5 – 1 7 7 4
water were run systematically following Baker (2002) andintensity of the Raman line of water at 348 nm excitationwavelength recorded. The mean Raman value during thestudy period was 22.3 intensity units, 1 S.D.=0.5). All thefluorescence intensities were corrected to a Raman peakintensity of 20 units. Organic matter fluorescence wasmeasured on unfiltered samples in 1 cm cuvettes. TOC valuesfor raw (4.4±1.8mg l−1) and clarified (2.9±1.5mg l−1) were suchthat no inner-filter correction was applied. Arising from thefluorescence measurements, EEMs were obtained for eachwater sample, displaying the intensity of fluorescence withinthe sample against the wavelengths at which excited fluor-ophores emitted the light. Typical EEMs are presented in Fig. 1.Peak C fluorescence intensity was determined as the max-imum intensity value in the region 300–360 nm excitation and400–480 nm emission, and peak C emission wavelengthdefined as the emission wavelength of this maximumintensity. Peak T fluorescence intensity was determined asthe intensity value at 280 nm excitation and 350 nm emission.
TOC wasmeasured using a Shimadzu TOC-V-CSH analyserwhich uses the catalytically-aided platinum 680 °C combus-tion technique, with auto-sampler TOC-ASI-V. The non-purgeable organic carbon (NPOC) determination method wasemployed, samples were sparged with 2 M HCl to remove allinorganic carbon prior to combustion, and the resultant NPOCwas calculated as a mean of the three valid measurements.The typical error of the analyses was less than 10%.
UV254 absorbance is routinely analysed within the waterindustry as an OM surrogate. In order to compare ourfluorescence results to this parameter, UV254 absorbanceanalysis was performed using a Biochem Libra S12 Spectro-photometer, at a wavelength of 254 nm. Samples were filteredthrough a 0.45 µm membrane to obtain the dissolved fraction,
and analysed with a 1 cm quartz cell which was rinsed withde-ionised (DI) water prior to each analysis.
Data on algal cell counts of three groups diatoms, green,and a separate group for other algae species were alsocollected from raw water at WTW by Severn Trent Water.Although the algae species analyses were carried out on rawwater samples taken on different dates than fluorescencesamples (up to a one week difference), this ancillary datasetenabled a better insight into TOC removal efficiency andfluorescence properties relationships. Monthly algal datawereprovided for the period August 2006 and July 2007.
3. Results
All results are tabulated in Supplementary Table 2.
3.1. Characterising raw water DOM from fluorescenceproperties
The fluorescence signature of aquatic organicmatter has beenshown to characterize the degree of hydrophobicity andmolecular size on the basis of peak C emission wavelength(Wu et al., 2003); the microbial activity on the basis of peak Tintensity (Mopper and Schultz, 1993); and source variations bythe ratio of peak C intensity to TOC (Cumberland and Baker,2007). Therefore, to characterise the raw water organic matterfor each site, the mean peak C emission wavelength wasplotted against the mean peak T intensity (Fig. 2). Peak Cemission wavelength and peak T intensity for each site areshown in Supplementary Table 2. Principal ComponentsAnalysis (PCA) results show that, peak C emission wavelengthand peak T intensity (Fig. 2) provide the best discrimination ofthe fluorescence data (strong correlations with the both firstand second principal components of opposing signs). Thepeak C emission wavelength and peak T intensity separate
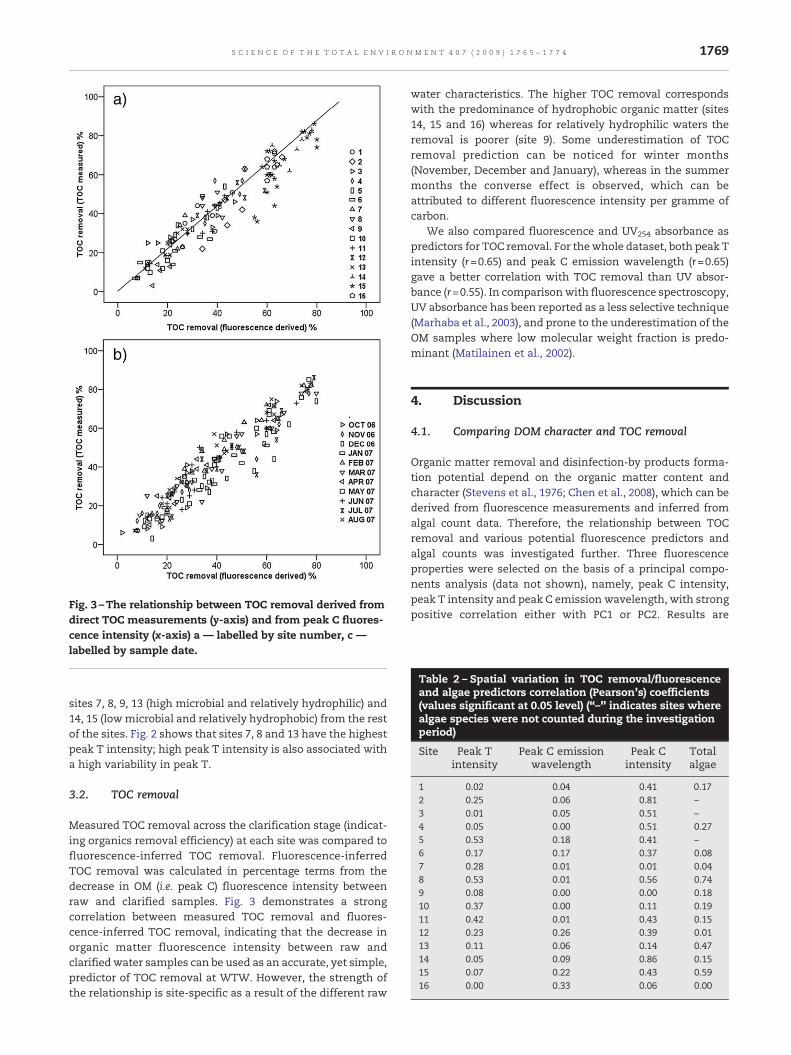
Fig. 3 –The relationship between TOC removal derived fromdirect TOC measurements (y-axis) and from peak C fluores-cence intensity (x-axis) a — labelled by site number, c —labelled by sample date.
Table 2 – Spatial variation in TOC removal/fluorescenceand algae predictors correlation (Pearson's) coefficients(values significant at 0.05 level) (“–” indicates sites wherealgae species were not counted during the investigationperiod)
Site Peak Tintensity
Peak C emissionwavelength
Peak Cintensity
Totalalgae
1 0.02 0.04 0.41 0.172 0.25 0.06 0.81 –3 0.01 0.05 0.51 –4 0.05 0.00 0.51 0.275 0.53 0.18 0.41 –6 0.17 0.17 0.37 0.087 0.28 0.01 0.01 0.048 0.53 0.01 0.56 0.749 0.08 0.00 0.00 0.1810 0.37 0.00 0.11 0.1911 0.42 0.01 0.43 0.1512 0.23 0.26 0.39 0.0113 0.11 0.06 0.14 0.4714 0.05 0.09 0.86 0.1515 0.07 0.22 0.43 0.5916 0.00 0.33 0.06 0.00
1769S C I E N C E O F T H E T O T A L E N V I R O N M E N T 4 0 7 ( 2 0 0 9 ) 1 7 6 5 – 1 7 7 4
sites 7, 8, 9, 13 (high microbial and relatively hydrophilic) and14, 15 (lowmicrobial and relatively hydrophobic) from the restof the sites. Fig. 2 shows that sites 7, 8 and 13 have the highestpeak T intensity; high peak T intensity is also associated witha high variability in peak T.
3.2. TOC removal
Measured TOC removal across the clarification stage (indicat-ing organics removal efficiency) at each site was compared tofluorescence-inferred TOC removal. Fluorescence-inferredTOC removal was calculated in percentage terms from thedecrease in OM (i.e. peak C) fluorescence intensity betweenraw and clarified samples. Fig. 3 demonstrates a strongcorrelation between measured TOC removal and fluores-cence-inferred TOC removal, indicating that the decrease inorganic matter fluorescence intensity between raw andclarified water samples can be used as an accurate, yet simple,predictor of TOC removal at WTW. However, the strength ofthe relationship is site-specific as a result of the different raw
water characteristics. The higher TOC removal correspondswith the predominance of hydrophobic organic matter (sites14, 15 and 16) whereas for relatively hydrophilic waters theremoval is poorer (site 9). Some underestimation of TOCremoval prediction can be noticed for winter months(November, December and January), whereas in the summermonths the converse effect is observed, which can beattributed to different fluorescence intensity per gramme ofcarbon.
We also compared fluorescence and UV254 absorbance aspredictors for TOC removal. For thewhole dataset, both peak Tintensity (r=0.65) and peak C emission wavelength (r=0.65)gave a better correlation with TOC removal than UV absor-bance (r=0.55). In comparisonwith fluorescence spectroscopy,UV absorbance has been reported as a less selective technique(Marhaba et al., 2003), and prone to the underestimation of theOM samples where low molecular weight fraction is predo-minant (Matilainen et al., 2002).
4. Discussion
4.1. Comparing DOM character and TOC removal
Organic matter removal and disinfection-by products forma-tion potential depend on the organic matter content andcharacter (Stevens et al., 1976; Chen et al., 2008), which can bederived from fluorescence measurements and inferred fromalgal count data. Therefore, the relationship between TOCremoval and various potential fluorescence predictors andalgal counts was investigated further. Three fluorescenceproperties were selected on the basis of a principal compo-nents analysis (data not shown), namely, peak C intensity,peak T intensity and peak C emission wavelength, with strongpositive correlation either with PC1 or PC2. Results are
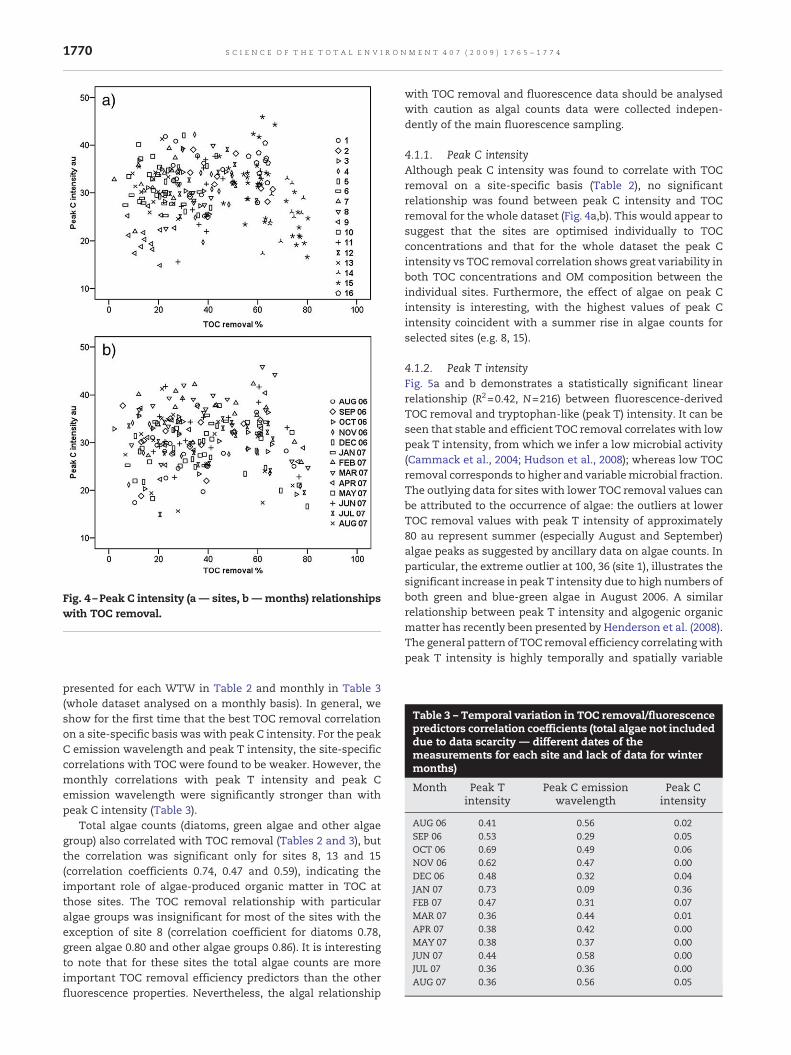
Table 3 – Temporal variation in TOC removal/fluorescencepredictors correlation coefficients (total algae not includeddue to data scarcity — different dates of themeasurements for each site and lack of data for wintermonths)
Month Peak Tintensity
Peak C emissionwavelength
Peak Cintensity
AUG 06 0.41 0.56 0.02SEP 06 0.53 0.29 0.05OCT 06 0.69 0.49 0.06NOV 06 0.62 0.47 0.00DEC 06 0.48 0.32 0.04JAN 07 0.73 0.09 0.36FEB 07 0.47 0.31 0.07MAR 07 0.36 0.44 0.01APR 07 0.38 0.42 0.00MAY 07 0.38 0.37 0.00JUN 07 0.44 0.58 0.00JUL 07 0.36 0.36 0.00AUG 07 0.36 0.56 0.05
Fig. 4 –Peak C intensity (a — sites, b — months) relationshipswith TOC removal.
1770 S C I E N C E O F T H E T O T A L E N V I R O N M E N T 4 0 7 ( 2 0 0 9 ) 1 7 6 5 – 1 7 7 4
presented for each WTW in Table 2 and monthly in Table 3(whole dataset analysed on a monthly basis). In general, weshow for the first time that the best TOC removal correlationon a site-specific basis was with peak C intensity. For the peakC emission wavelength and peak T intensity, the site-specificcorrelations with TOC were found to be weaker. However, themonthly correlations with peak T intensity and peak Cemission wavelength were significantly stronger than withpeak C intensity (Table 3).
Total algae counts (diatoms, green algae and other algaegroup) also correlated with TOC removal (Tables 2 and 3), butthe correlation was significant only for sites 8, 13 and 15(correlation coefficients 0.74, 0.47 and 0.59), indicating theimportant role of algae-produced organic matter in TOC atthose sites. The TOC removal relationship with particularalgae groups was insignificant for most of the sites with theexception of site 8 (correlation coefficient for diatoms 0.78,green algae 0.80 and other algae groups 0.86). It is interestingto note that for these sites the total algae counts are moreimportant TOC removal efficiency predictors than the otherfluorescence properties. Nevertheless, the algal relationship
with TOC removal and fluorescence data should be analysedwith caution as algal counts data were collected indepen-dently of the main fluorescence sampling.
4.1.1. Peak C intensityAlthough peak C intensity was found to correlate with TOCremoval on a site-specific basis (Table 2), no significantrelationship was found between peak C intensity and TOCremoval for the whole dataset (Fig. 4a,b). This would appear tosuggest that the sites are optimised individually to TOCconcentrations and that for the whole dataset the peak Cintensity vs TOC removal correlation shows great variability inboth TOC concentrations and OM composition between theindividual sites. Furthermore, the effect of algae on peak Cintensity is interesting, with the highest values of peak Cintensity coincident with a summer rise in algae counts forselected sites (e.g. 8, 15).
4.1.2. Peak T intensityFig. 5a and b demonstrates a statistically significant linearrelationship (R2=0.42, N=216) between fluorescence-derivedTOC removal and tryptophan-like (peak T) intensity. It can beseen that stable and efficient TOC removal correlates with lowpeak T intensity, from which we infer a low microbial activity(Cammack et al., 2004; Hudson et al., 2008); whereas low TOCremoval corresponds to higher and variablemicrobial fraction.The outlying data for sites with lower TOC removal values canbe attributed to the occurrence of algae: the outliers at lowerTOC removal values with peak T intensity of approximately80 au represent summer (especially August and September)algae peaks as suggested by ancillary data on algae counts. Inparticular, the extreme outlier at 100, 36 (site 1), illustrates thesignificant increase in peak T intensity due to high numbers ofboth green and blue-green algae in August 2006. A similarrelationship between peak T intensity and algogenic organicmatter has recently been presented by Henderson et al. (2008).The general pattern of TOC removal efficiency correlatingwithpeak T intensity is highly temporally and spatially variable
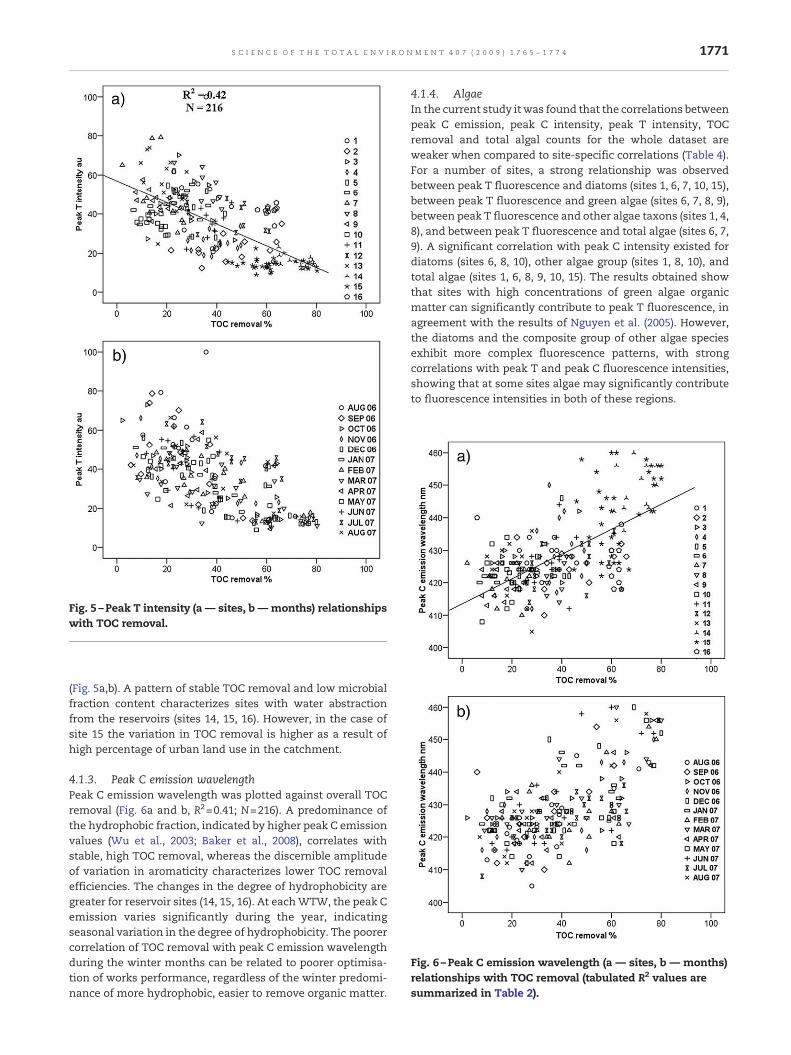
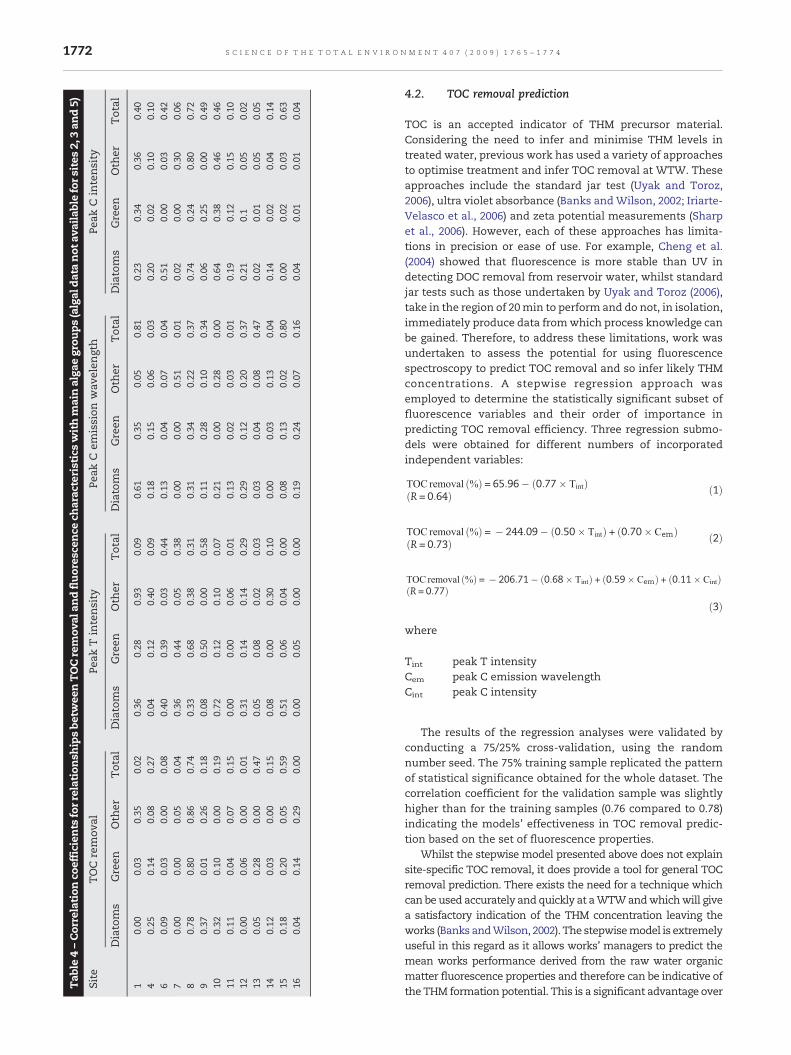
Fig. 6 –Peak C emission wavelength (a — sites, b — months)relationships with TOC removal (tabulated R2 values aresummarized in Table 2).
Fig. 5 –Peak T intensity (a — sites, b — months) relationshipswith TOC removal.
1771S C I E N C E O F T H E T O T A L E N V I R O N M E N T 4 0 7 ( 2 0 0 9 ) 1 7 6 5 – 1 7 7 4
(Fig. 5a,b). A pattern of stable TOC removal and low microbialfraction content characterizes sites with water abstractionfrom the reservoirs (sites 14, 15, 16). However, in the case ofsite 15 the variation in TOC removal is higher as a result ofhigh percentage of urban land use in the catchment.
4.1.3. Peak C emission wavelengthPeak C emission wavelength was plotted against overall TOCremoval (Fig. 6a and b, R2=0.41; N=216). A predominance ofthe hydrophobic fraction, indicated by higher peak C emissionvalues (Wu et al., 2003; Baker et al., 2008), correlates withstable, high TOC removal, whereas the discernible amplitudeof variation in aromaticity characterizes lower TOC removalefficiencies. The changes in the degree of hydrophobicity aregreater for reservoir sites (14, 15, 16). At eachWTW, the peak Cemission varies significantly during the year, indicatingseasonal variation in the degree of hydrophobicity. The poorercorrelation of TOC removal with peak C emission wavelengthduring the winter months can be related to poorer optimisa-tion of works performance, regardless of the winter predomi-nance of more hydrophobic, easier to remove organic matter.
4.1.4. AlgaeIn the current study it was found that the correlations betweenpeak C emission, peak C intensity, peak T intensity, TOCremoval and total algal counts for the whole dataset areweaker when compared to site-specific correlations (Table 4).For a number of sites, a strong relationship was observedbetween peak T fluorescence and diatoms (sites 1, 6, 7, 10, 15),between peak T fluorescence and green algae (sites 6, 7, 8, 9),between peak T fluorescence and other algae taxons (sites 1, 4,8), and between peak T fluorescence and total algae (sites 6, 7,9). A significant correlation with peak C intensity existed fordiatoms (sites 6, 8, 10), other algae group (sites 1, 8, 10), andtotal algae (sites 1, 6, 8, 9, 10, 15). The results obtained showthat sites with high concentrations of green algae organicmatter can significantly contribute to peak T fluorescence, inagreement with the results of Nguyen et al. (2005). However,the diatoms and the composite group of other algae speciesexhibit more complex fluorescence patterns, with strongcorrelations with peak T and peak C fluorescence intensities,showing that at some sites algae may significantly contributeto fluorescence intensities in both of these regions.
Tab
le4–Cor
relation
coefficien
tsforr
elationsh
ipsbe
twee
nTOCrem
oval
andfluor
esce
nce
charac
teristicswithm
ainalga
egrou
ps(algal
data
not
availablefors
ites
2,3an
d5)
Site
TOC
rem
oval
Peak
Tintensity
Peak
Cem
ission
wav
elen
gth
Peak
Cintensity
Diatoms
Green
Oth
erTotal
Diatom
sGreen
Oth
erTotal
Diatom
sGreen
Oth
erTotal
Diatom
sGreen
Oth
erTotal
10.00
0.03
0.35
0.02
0.36
0.28
0.93
0.09
0.61
0.35
0.05
0.81
0.23
0.34
0.36
0.40
40.25
0.14
0.08
0.27
0.04
0.12
0.40
0.09
0.18
0.15
0.06
0.03
0.20
0.02
0.10
0.10
60.09
0.03
0.00
0.08
0.40
0.39
0.03
0.44
0.13
0.04
0.07
0.04
0.51
0.00
0.03
0.42
70.00
0.00
0.05
0.04
0.36
0.44
0.05
0.38
0.00
0.00
0.51
0.01
0.02
0.00
0.30
0.06
80.78
0.80
0.86
0.74
0.33
0.68
0.38
0.31
0.31
0.34
0.22
0.37
0.74
0.24
0.80
0.72
90.37
0.01
0.26
0.18
0.08
0.50
0.00
0.58
0.11
0.28
0.10
0.34
0.06
0.25
0.00
0.49
100.32
0.10
0.00
0.19
0.72
0.12
0.10
0.07
0.21
0.00
0.28
0.00
0.64
0.38
0.46
0.46
110.11
0.04
0.07
0.15
0.00
0.00
0.06
0.01
0.13
0.02
0.03
0.01
0.19
0.12
0.15
0.10
120.00
0.06
0.00
0.01
0.31
0.14
0.14
0.29
0.29
0.12
0.20
0.37
0.21
0.1
0.05
0.02
130.05
0.28
0.00
0.47
0.05
0.08
0.02
0.03
0.03
0.04
0.08
0.47
0.02
0.01
0.05
0.05
140.12
0.03
0.00
0.15
0.08
0.00
0.30
0.10
0.00
0.03
0.13
0.04
0.14
0.02
0.04
0.14
150.18
0.20
0.05
0.59
0.51
0.06
0.04
0.00
0.08
0.13
0.02
0.80
0.00
0.02
0.03
0.63
160.04
0.14
0.29
0.00
0.00
0.05
0.00
0.00
0.19
0.24
0.07
0.16
0.04
0.01
0.01
0.04
1772 S C I E N C E O F T H E T O T A L E N V I R O N M E N T 4 0 7 ( 2 0 0 9 ) 1 7 6 5 – 1 7 7 4
4.2. TOC removal prediction
TOC is an accepted indicator of THM precursor material.Considering the need to infer and minimise THM levels intreated water, previous work has used a variety of approachesto optimise treatment and infer TOC removal at WTW. Theseapproaches include the standard jar test (Uyak and Toroz,2006), ultra violet absorbance (Banks andWilson, 2002; Iriarte-Velasco et al., 2006) and zeta potential measurements (Sharpet al., 2006). However, each of these approaches has limita-tions in precision or ease of use. For example, Cheng et al.(2004) showed that fluorescence is more stable than UV indetecting DOC removal from reservoir water, whilst standardjar tests such as those undertaken by Uyak and Toroz (2006),take in the region of 20min to perform and do not, in isolation,immediately produce data fromwhich process knowledge canbe gained. Therefore, to address these limitations, work wasundertaken to assess the potential for using fluorescencespectroscopy to predict TOC removal and so infer likely THMconcentrations. A stepwise regression approach wasemployed to determine the statistically significant subset offluorescence variables and their order of importance inpredicting TOC removal efficiency. Three regression submo-dels were obtained for different numbers of incorporatedindependent variables:
TOC removal kð Þ = 65:96� ð0:77� TintÞR = 0:64ð Þ ð1Þ
TOC removal kð Þ = � 244:09� ð0:50� TintÞ + ð0:70� CemÞR = 0:73ð Þ ð2Þ
TOC removal kð Þ = � 206:71� ð0:68� TintÞ + ð0:59� CemÞ + ð0:11� CintÞR = 0:77ð Þ
ð3Þ
where
Tint peak T intensityCem peak C emission wavelengthCint peak C intensity
The results of the regression analyses were validated byconducting a 75/25% cross-validation, using the randomnumber seed. The 75% training sample replicated the patternof statistical significance obtained for the whole dataset. Thecorrelation coefficient for the validation sample was slightlyhigher than for the training samples (0.76 compared to 0.78)indicating the models' effectiveness in TOC removal predic-tion based on the set of fluorescence properties.
Whilst the stepwise model presented above does not explainsite-specific TOC removal, it does provide a tool for general TOCremoval prediction. There exists the need for a technique whichcan be used accurately and quickly at aWTWandwhichwill givea satisfactory indication of the THM concentration leaving theworks (Banks andWilson, 2002). The stepwisemodel is extremelyuseful in this regard as it allows works' managers to predict themean works performance derived from the raw water organicmatter fluorescence properties and therefore can be indicative ofthe THM formation potential. This is a significant advantage over
1773S C I E N C E O F T H E T O T A L E N V I R O N M E N T 4 0 7 ( 2 0 0 9 ) 1 7 6 5 – 1 7 7 4
othermethodswhich rely on lengthier,more complex analysis oftreated or partially-treated water.
5. Conclusions
1. The successful application of fluorescence spectroscopy todetermine TOC removal at WTW has been presented.
2. For the 12 months of fluorescence data based on raw andclarified water properties from 16 surfaceWTWs located inthe West Midlands region of the UK, the correlationbetween directly measured TOC removal and fluores-cence-derived TOC removal was significantly high (correla-tion coefficient value of R2=0.90), indicating a strong linear,first-order relationship between the variables.
3. The results show thatmeasurement of fluorescence peak Cintensity might be utilized for THM formation prediction,as the fluorescence property (peak C fluorescence inten-sity) correlates with the total amount of organic precursors.
4. Using the entire 12 month dataset, a stepwise regressionmodel demonstrated that freshwater OM peak T intensity,peak C emission wavelength and peak C intensity can beused in combination to predict TOC removal (r=0.77).
5. It was apparent that the correlation coefficients betweenpeak T intensity and peak C emission wavelength and TOCremoval are less significant for the site-specific correla-tions than for the full dataset.
6. For several sites a significant contribution of different algaespecies to peak C and peak T fluorescence was found.
7. The simplicity, sensitivity, speed of analysis and low cost,combined with potential for incorporation into on-linemonitoring systems mean that fluorescence spectroscopyoffers a robust analytical technique to be used in conjunc-tion with, or in place of, other approaches to OMcharacterisation and THM formation prediction.
5. Notation
BOD biochemical oxygen demandCem peak C emission wavelength (nm)Cint peak C fluorescence intensity (au)DBPs disinfection by-productsDOC dissolved organic carbonDOM dissolved organic matterEEM excitation–emission matrixHAAs haloacetic acidsHANs haloacetonitrilesNOM natural organic matterNPOC non-purgable organic carbonOM organic matterPCA principal components analysisPC1 first principal componentPC2 second principal componentTint peak T fluorescence intensity (au)THM trihalomethanesTOC total organic carbon
UV254 ultraviolet absorbance at 254 nmWTW water treatment works
Acknowledgements
The authors are grateful for the financial and logistical supportprovided by Severn Trent Water Ltd and the University ofBirmingham. The authors also acknowledge the laboratorysupport provided by Dr. Ian Boomer and Mr. Andy Moss.
Appendix A. Supplementary data
Supplementary data associated with this article can be found,in the online version, at doi:10.1016/j.scitotenv.2008.11.013.
R E F E R E N C E S
Ahmad SR, Reynolds DM. Monitoring of water quality usingfluorescence technique: Prospect of on-line process control.Water Res 1999;33(9):2069–74.
Baker A. Fluorescence excitation–emission matrix characterizationof river waters impacted by a tissue mill effluent. Environ SciTechnol 2002;36(7):1377–82.
Baker A, Tipping E, Thacker SA, Gondar D. Relating dissolvedorganic matter fluorescence and functional properties.Chemosphere 2008;73(11):1765–72.
Banks J, Wilson D. Low-cost solutions for trihalomethanecompliance. J CIWEM 2002;16(4):264–9.
Bellar TA, Lichtenberg JJ, Kroner RC. The occurrence oforganohalides in chlorinated drinking waters. J Am WaterWorks Assoc 1974;66(11):703–6.
Belzile C, Guo L. Optical properties of low molecular weight andcolloidal organic matter: Application of the ultrafiltrationpermeation model to DOM absorption and fluorescence. MarChem 2006;98:183–96.
CammackWKL, Kalff J, Prairie YT, Smith EM. Fluorescent dissolvedorganic matter in lakes: Relationship with heterotrophicmetabolism. Limnol Oceanogr 2004;49(6):2034–45.
Carlson M, Hardy D. Controlling DBPs with monochloramine. J AmWater Works Assoc 1998;90(2):95-106.
Chen C, Zhang XJ, Zhu LX, He WJ, Han HD. Disinfectionby-products and their precursors in a water treatment plant inNorth China: Seasonal changes and fraction analysis. Sci TotalEnviron 2008;397(1–3):140–7.
Cheng WP, Chi FH, Yu RF. Evaluating the efficiency of coagulationin the removal of dissolved organic carbon from reservoirwater using fluorescence and ultraviolet photometry. EnvironMonit Assess 2004;98:421–31.
Coble PG. Characterization of marine and terrestrial DOM inseawater using excitation–emission spectroscopy. Mar Chem1996;51:325–46.
Corine Land Cover 2000 (CLC2000) 100 m, version 9/2007, 2007,European Environmental Agency http://www.eea.europa.eu,Copenhagen.
Cumberland SA, Baker A. The freshwater dissolved organic matterfluorescence–total organic carbon relationship. Hydrol Process2007;21(16):2093–9.
Engerholm BA, Amy GL. A predictive model for chloroformformation from humic acid. J Am Water Works Assoc 1983;75(8):418–23.
1774 S C I E N C E O F T H E T O T A L E N V I R O N M E N T 4 0 7 ( 2 0 0 9 ) 1 7 6 5 – 1 7 7 4
Ferrari GM, Mingazzini M. Synchronous fluorescence spectra ofdissolved organic matter (DOM) of algal origin in marinecoastal waters. Mar Ecol Prog Ser 1995;155:305–15.
Ferrari GM, Dowell MD, Grossi S, Traga C. Relationship betweenthe optical properties of chromophoric dissolved organicmatter and total concentration of dissolved organic carbon inthe southern Baltic Sea region. Mar Chem 1996;55:299–316.
Henderson RK, Baker A, Parsons SA, Jefferson B. Characterisationof algogenic organic matter extracted from cyanobacteria,green algae and diatoms. Water Res 2008;42:3435–45.
Hudson NJ, Baker A, Reynolds D. Fluorescence analysis of dissolvedorganicmatter in natural, waste and pollutedwaters— a review.Rivers Res 2007;23:631–49.
Hudson NJ, Baker A, Ward D, Brunsdon C, Reynolds D,Carliell-Marquet C, et al. Fluorescence spectrometry as asurrogate for the BOD5 test in water quality assessment: anexample from South West England. Sci Total Environ 2008,doi:10.1016/j.scitotenv.2007.10.054.
Iriarte-Velasco U, Alvarez-Uriarte JI, Gonzalez-Velasco JR.Monitoring trihalomethanes in water by differential ultravioletspectroscopy. Environ Chem Lett 2006;4(4):243–7.
Kavanaugh MC, Trussell AR, Cromer J, Rhodes R. An empiricalkinetic model of trihalomethane formation: Applications tomeet the proposed THM standard. J Am Water Works Assoc1980;72(10):578–82.
Krasner SW, McGuire MJ, Jacangelo JG, Patania NL, Regan KM,Aieta EM. The occurrence of disinfection by-products in USdrinking water. J Am Water Works Assoc 1989;91(8):41–53.
Marhaba TF, Bengraine K, Pu Y, Arago J. Spectral fluorescencesignatures and partial least squares regression: model topredict dissolved organic carbon in water. J Hazard Mater 2003;B97:83–97.
Matilainen A, Vieno N, Tuhkanen T. Efficiency of the activatedcarbon filtration in the natural organic matter removal.Environ Int 2002;32(3):324–31.
McKnight DM, Boyer EW, Westerhoff PK, Doran PT, Kulbe T,Andersen DT. Spectrofluorometric characterization ofdissolved organic matter for indication of precursor organicmaterial and aromaticity. Limnol Oceanogr 2001;46(1):38–48.
Mopper K, Schultz CA. Fluorescence as a possible tool for studyingthe nature and water column distribution of DOC components.Mar Chem 1993;41(1–3):229–38.
Nguyen M-L, Westerhoff P, Baker L, Hu Q, Esparza-Soto M,Sommerfirld M. Characteristics and reactivity ofalgae-produced dissolved organic carbon. J Environ Eng2005;131(11):1574–82.
Nikolaou AD, Kostopolou MN, Lekkas TD. Organic by-products ofdrinking water chlorination. Global Nest 1999;1(3):143–56.
Paralkar A, Edzwald JK. Effect of ozone on EOM and coagulation.J Am Water Works Assoc 1996;88(4):143–54.
Reynolds DM. The differentiation of biodegradable andnon-biodegradable dissolved organic matter in wastewatersusing fluorescence spectroscopy. J Chem Technol Biotechnol2002;77:965–72.
Reynolds DM. Ahmad SR. Rapid and direct determination ofwastewater BOD values using a fluorescence technique. WaterRes 1997;31(8):2012–8.
Rook JJ. Formation of haloforms during chlorination of naturalwaters. Water Treat Exam 1974;23(2):234–43.
Sharp EL, Parsons SA, Jefferson B. Coagulation of NOM: linkingcharacter to treatment. Water Sci Technol 2006;53(7):67–76.
Singer PC. Control of disinfection byproducts from drinking water.J Environ Eng 1994;120(4):727–44.
Singer PC, Chang SD. Correlations between trihalomethanes andtotal organic halides formed during water treatment. J AmWater Works Assoc 1989;81(8):61–5.
Smart PL, Finlayson BL, Rylands WD, Ball CM. The relation offluorescence to dissolved organic carbon in surface waters.Water Resour Res 1976;10:805–11.
Stedmon CS, Markager S, Bro R. Tracing dissolved organic matterin aquatic environments using a new approach to fluorescencespectroscopy. Mar Chem 2003;82:239–54.
Stevens AA, Slocum CJ, Seeger DR, Robeck GG. Chlorination oforganics in drinking water. J Am Water Works Assoc 1976;68(11):615–20.
Stewart AJ, Wetzel RG. Fluorescence: absorbance ratios — amolecular-weight tracer of dissolved organic matter. LimnolOceanogr 1980;25(3):559–64.
Thacker SA, Tipping E, Baker A, Gondar D. Development andapplication of functional assays for freshwater dissolvedorganic matter. Water Res 2005;39:4559–73.
Uyak V, Toroz I. Modelling the formation of chlorinationby-products during enhanced coagulation. Environ MonitAssess 2006;121(1–3):503–17.
Vodacek A, Hoge FE, Swift RN, Yungel JK, Peltzer ET, BloughNV. Theuse of in-situ and airborne fluorescence measurements todetermine BTV absorption-coefficients and DOC concentrationsin surface waters. Limnol Oceanogr 1995;40:411–5.
Wildrig DL, Gray KA, McAuliffe KS. Removal of algal-derivedorganic material by preozonation and coagulation: Monitoringchanges in organic quality by pyrolysis-GC-MS. Water Res1996;30(11):2621–32.
Wu FC, Evans RD, Dillon PJ. Separation and characterization ofNOM by high-performance liquid chromatography and on-linethree-dimensional excitation emission matrix fluorescencedetection. Environ Sci Technol 2003;37(16):3687–93.